inaugural drilling campaign delivers a 10% increase …...2019/03/07 · superior lake resources...
TRANSCRIPT

Superior Lake Resources Limited
ACN 139 522 553
T: +61 8 6143 6740
F: +61 8 9388 8824
Page 1
ASX Announcement
ASX: SUP
7th March 2019
superiorlake.com.au
Inaugural drilling campaign delivers a 10% increase to the size of the mineral resource at Superior Lake
Highlights
• JORC resource (2012) at Superior Lake Zinc Project increases by 10% to 2.35 Mt @ 17.7 % Zn, 0.9%
Cu, 0.38 g/t Au and 34 g/t Ag (Table 1 below).
• The increase followed the Company’s inaugural drilling campaign, the first at Superior Lake in over
20 years.
• 88% of the resource is classified in the Indicated category
• Average zinc grade remains at 17.7%
• The increased resource has potential to improve the Project economics and extend the mine life
when the Definitive Feasibility Study is released by mid-2019.
• Exploration activities are ongoing at site with a high-powered ground Transient Electromagnetic
program underway with results due in the coming weeks.
Superior Lake Resources Limited (ASX: SUP) (the “Company”) is pleased to announce an increase in the
Mineral Resource at the Superior Lake Project (“Superior Lake” or the “Project”) to 2.35 Mt at 17.7 %Zn, 0.9%
Cu. This represents an increase of approximately 10 % to the size of the resource compared to that
previously reported on 3 July 2018. The additional resource has potential to increase the mine life when
the Definitive Feasibility Study (“DFS”) is completed by mid-2019.
In addition to the resource upgrade, a down the hole Transient Electromagnetics (“TEM”) program at Pick
Lake was completed. As Pick Lake is a known deposit, this was simply a “test case” to confirm EM as a
successful exploration tool in detecting and defining similar mineralisation at the Project. The results were
positive as Pick Lake was clearly identified. This has increased the Company’s confidence that
electromagnetics is the correct exploration technique to be used to identify new anomalies at Superior
Lake. The Company is currently completing a high-powered ground TEM geophysics program across a
3km by 3km area, with results expected in the coming weeks.
The Assessment and Reporting Criteria in accordance with the 2012 Edition of the ‘Australasian Code for
Reporting of Exploration Results, Mineral Resources and Ore Reserves’ (“JORC Code 2012”) is presented in
Appendix 2.
Table 1: Superior Lake Mineral Resource at 3% Zn cut-off grade
Classification Tonnage (Mt) Zn% Cu% Au g/t Ag g/t
Indicated 2.07 18.0 0.9 0.38 34
Inferred 0.28 16.2 1.0 0.31 37
Total 2.35 17.7 0.9 0.38 34
For
per
sona
l use
onl
y

Page 2
Superior Lake Chief Executive Officer David Woodall said:
The aim of the first drill program at Superior Lake in more than 20 years, was to confirm the continuity of
mineralisation through Mid Pick as this area was previously outside of the JORC resource. This program was
successful as the drill results were in line with expectations, and led to the resource at Superior Lake
increasing by 10% to 2.35 Mt @ 17.7 % Zn, 0.9% Cu, 0.38 g/t Au and 34 g/t Ag.
The additional 200,000 tonnes should further optimise the Project’s economics in the upcoming DFS, as Mid
Pick was previously not included in the mine plan. However, this area was adjacent to the planed Pick
decline and therefore should be easily accessed without the requirement for changes to mine
development, resulting in improved economics whilst also increasing the mine life. The Restart Study
assumed a throughput of 1,000tpd1, which we expect will remain unchanged.
In addition to the resource upgrade, a DHTEM program was undertaken at Pick Lake. Typically this
technique is used to identify anomalies to be tested with drilling in the future. In this case however, the
Company used DHTEM on Pick Lake, a known mineralised deposit essentially as a test case, to determine
if electromagnetics could identify the deposit. Pleasingly the results came back positive as Pick Lake was
clearly identified. This has significantly increased our confident that EM will not only be a major part of but
essential to our exploration strategy going forward to identify new potential targets.
We are now currently completing a high-powered ground TEM geophysics program across the Project area
and we look forward to updating the market on these results in the coming weeks.
Finally, as we continue to advance the Project towards a development decision later this year, numerous
major global financial institutions, private equity firms and potential offtake partners are showing strong
interest in the Project. The Company plans to commence a competitive project finance process in the
near term.”
1 See ASX announcement “Outstanding study confirms Superior Lake as low-cost project” dated 10 October 2018. The Company
confirms that it is not aware of any new information or data that materially affects the information in that announcement (save for
the inclusion of the additional 200,000 tonnes), and that all material assumptions and technical parameters underpinning the
production targets and forecast financial information based on production targets in that announcement continue to apply and
have not materially changed. As stated above, the inclusion of the 200,000 tonnes will not materially affect the throughput set out in
the Restart Study.
For
per
sona
l use
onl
y

Page 3
Figure 1: Long Section – Pick Lake2
Resource upgrade – Pick Lake Deposit
The Superior Lake Zinc Project is located around 200 kilometers east of Thunder Bay in the province of
Ontario in Canada. The Project covers an area of 175km2 and consists of two deposits – Winston Lake and
Pick Lake.
A Restart Study completed in October 2018, outlined an operation at Superior Lake that would produce
46,000tpa of contained zinc metal with All in Sustaining Operating Costs (“AISC”) of US$0.51 / lb (see
Footnote 1, page 2). The Company is currently working towards the release of a DFS in mid-2019, with the
Pick Lake deposit expected to provide the majority of ore for the operation.
2The exploration results from drill holes UP-0182, UP-0178, UP-002 and UP-006 were previously reported in an ASX announcement dated 3 July 2018. The Company confirms that it is not aware of any new information or data that materially affects the information in that announcement.
For
per
sona
l use
onl
y

Page 4
Pick Lake is a high-grade zinc deposit that extends over a downdip distance of 1,200m. The deposit has
historically been defined in three sub areas – Upper Pick, Mid Pick and Lower Pick. Whilst the Upper and
Lower Pick areas have been intensively drilled from underground, Mid-Pick required additional drilling to
define a defined resource.
The Company therefore completed a 1,750m drilling program to confirm the continuity and grade at Mid
Pick, compared to other areas of the deposit. This was the first drill program at the Project in more than 20
years.
Image 2: Drilling at Pick Lake
The results from the program were in line with expectations as it confirmed high-grade zinc mineralisation
through the Mid Pick area. Intersections included3 the following.
o PL-18-01 1.56m @ 20.12% Zn and 0.80% Cu
o PL-18-01A-W1 1.0m @ 4.78% Zn and 0.18% Cu
o PL-18-01A-W2 dislodged wedge resulting in lost hole
o PL-18-01A-W3 3.7m @ 5.95% Zn and 0.28% Cu, inclusive of 1.0m 15.95% Zn and 0.58% Cu
The increase in the Superior Lake resource represented 10% of its Exploration Target, which, given the
relatively small scale of this inaugural drilling program is encouraging. The
Exploration Target is conceptual in nature. Other than as reported, there has been insufficient 3 Drill hole information is available in Appendix 1.
For
per
sona
l use
onl
y

Page 5
exploration to estimate a Mineral Resource and it is uncertain if further exploration will result in the
estimation of a Mineral Resource.4
The Superior Lake resource estimate, as at 6th March 2019, is shown in Table 2 is classified in accordance
with Canadian Institute of Mining, Metallurgy and Petroleum and JORC 2012.
Table 2: Superior Lake Mineral Resource at 3% Zn cut-off grade
Classification Tonnage (Mt) Zn% Cu% Au g/t Ag g/t
Pick Lake
Indicated 1.78 19.2 0.9 0.30 36
Inferred 0.27 16.4 1.0 0.30 38
Total – Pick Lake 2.05 18.8 0.9 0.30 36
Winston Lake
Indicated 0.29 10.4 0.7 0.90 18
Inferred 0.01 8.9 0.6 0.50 12
Total – Winston Lake 0.30 10.4 0.7 0.88 18
Superior Lake
Indicated 2.07 18.0 0.9 0.38 34
Inferred 0.28 16.2 1.0 0.31 37
Total – Superior Lake 2.35 17.7 0.9 0.38 34
4 See ASX announcement “Significant brownfields exploration target at Superior Lake” dated 26 September 2018. The initial brownfields exploration Target was determined to be between 2.1 to 5.2 million tonnes at a grade ranging between 13.3% to 15.4% Zn for its Superior Lake Project. The Company confirms that it is not aware of any new information or data that materially affects the information in that announcement. The Exploration Target is based on the current geological understanding of the mineralised geometry, subsurface geochemistry provided an extensive historic drill hole database and detailed underground mapping provided by historic mining activity coupled with understanding of the host stratigraphic sequence. The Company intends to test the Exploration Target, based on the outcomes of further geophysical surveys and potentially with drilling. These activities are expected to extend over approximately 18 months from 26 September 2018. The Exploration Target is based largely on extensions of the reported classified resource into areas that have not been drill-tested in the past. These areas cover the strike and plunge continuations of the defined classified resources within host rocks that are the same as those that host the resources. Grade ranges have been either estimated or assigned from the classified resource using either a 3% Zn cut off for the lower bound grade and 6% Zn cut off for the upper bound grade. A classification is not applicable for an Exploration Target.
For
per
sona
l use
onl
y

Page 6
Mineral Resource Description and Methodology
The Superior Lake Zinc Project consists of two deposits, Pick Lake and Winston Lake, and is located
approximately 200 kilometres east of the city of Thunder Bay Ontario, Canada. This is the highest-grade zinc
project in Canada. The Project was mined for a decade (3Mt of ore mined) before closing in 1999, due to
a sustained period of a low zinc price.
Geology and Geological Interpretation
Winston Lake and Pick Lake are recognised as Noranda-style VMS deposits which are characterised by the
presence of the zinc-copper (+/- gold, +/- galena, +/- tetrahedrite) mineralisation composed of sphalerite-
chalcopyrite-pyrrhotite-pyrite which can be surrounded by pyrite-pyrrhotite halo with minor sphalerite,
tetrahedrite and galena. Confidence in the model is high as the mineralisation of the deposits essentially
occurred as a single massive sulphide seam distributed along the VMS horizon. The mineralisation and the
host rock stratigraphy can be delineated between the drill holes.
Geological interpretation and the updated resource model are based on the drill holes data completed
during the mid-Pick drilling program and historical drilling (approximately 1787 drill holes) as well as digitised
underground drive maps and cross sections. The interpretation of the mineralisation was confirmed by
drilling between the Upper and Lower Pick resources and DHTEM that proved the continuity and the grade
of the mid-Pick Resource.
Sampling and Sub-Sampling Techniques
The mineralisation was defined by intervals logged as massive and semi-massive sulphides within the Pick
clotted rhyolite or tuff units and within Winston the rhyolites, tuffs and chert units. The assay values for zinc
were compared to these intervals and found to correlate well. The zinc percent assay values were used to
select intersections where no logging information was present. The interpretation of continuity was based
on ore drive level plans that showed mapping information for the sulphide horizon.
A nominal cut-off grade of 1% Zn was used to define the mineralised intervals which were used to construct
a vein model. Edge boundaries were applied from ore drive extents and long-section mine plans that
indicated the conductor boundary position from geophysical surveys.
Data from these logs were entered into an Excel spreadsheet, subjected to QAQC and manual error
correction and then uploaded into an Access database. Subsequent loading errors in 3D mining software
were then corrected. The consistency of the assay data from the very high density of historic sampling
suggests that industry-standard QAQC procedures were adopted at the time. The dataset is considered to
be acceptable for use in Mineral Resource estimation by the Competent Person.
Drilling Techniques
Diamond drillholes were used to sample the mineralisation at Pick and Winston was based on 1603 holes
drill from both underground and surface. Detailed drill logs were recovered from archives in Schrieber,
Ontario. The distances between drillholes intersecting the mineralisation are commonly from 10–30m (at
the Winston Lake deposit to 20–40m at the Pick Lake deposit which is sufficient for a confident delineation
of the mineralised bodies. The interpretation of the VMS bodies was confirmed by mapping and sampling
of the underground developments which are also used for constraining VMS mineralised bodies in 3D.
Sample Analysis Method
Samples were composited to 1m lengths using a best fit algorithm. Statistical continuity analysis of the
samples was carried out using Istatis® geostatistical software to produce variograms for each element. The
block models were constructed using parent cell sizes of 20mE by 20mN by 1mRL with sub-cell sizes of 0.5mE
by 0.5mN by 0.5mRL for Pick and 1mE by 1mN by 1mRL for Winston. The composite data was unflattened
For
per
sona
l use
onl
y

Page 7
and two pass estimation of grades was carried out in unfolded space using Ordinary Kriging or Simple
Kriging.
Criteria Used for Classification and Estimation Methodology
The mineralised domains have demonstrated sufficient confidence in both geological and grade
continuity to support the definition of Mineral Resources. The nominal drill spacing of 20 to 30m, together
with geological mapping and sampling from ore development, alimak raises and stoping is considered to
be sufficient to assign an Indicated Mineral Resource classification to the majority of the Mineral Resource.
Material classified as Inferred Mineral Resources is located on the margins of the Indicated Mineral
Resources and the extents of the mineralisation, where sampling and control on the domain geometry are
less confident. The input data is comprehensive in its coverage of the deposits and does not favour or
misrepresent the in-situ mineralisation. Refer to the sub-heading “Estimation and modelling techniques” in
Section 3 of Table 1 Reporting for the use of extrapolation.
Discussion of Modifying Factors
Superior Lake is progressing with the longhole mining method with pastefill that is expected to be included
in the DFS. Metallurgical testwork is currently being undertaken to quantify recoveries of zinc, copper and
precious metals from Superior Lake. Pursuant to the DFS, the preparation of which is currently under way,
work in relation to other modifying factors is being carried out and will be reported in the DFS.
About the Company
Superior Lake Resources Limited is focused on the redevelopment of the Superior Lake Project in North
Western Ontario, Canada. The Project contains a JORC resource of 2.35 Mt at 17.7 % Zn, 0.9 % Cu, 0.38 g/t
Au and 34g/t Ag. A Restart Study completed in 2018, forecast the Project to produce approximately
46,000tpa Zn, with forecasted AISC of US$0.51 / lb (see Footnote 1, page 2. The Company is currently
working towards the release of a DFS, which is expected by mid-2019.
Table 3: Superior Lake Mineral Resource at 3% Zn cut-off grade
Classification Tonnage (Mt) Zn% Cu% Au g/t Ag g/t
Indicated 2.07 18.0 0.9 0.38 34
Inferred 0.28 16.2 1.0 0.31 37
Total 2.35 17.7 0.9 0.38 34
To learn more about the Company, please visit www.superiorlake.com.au, or contact:
David Woodall Chief Executive Officer +61 8 6143 6740
For
per
sona
l use
onl
y
Page 8
Competent Person Statement
Exploration Results
The information contained in this announcement that relates to the exploration target and exploration
results is based on, and fairly reflects, information compiled by Mr. Alfred Gillman, an independent
consultant to Superior Lake Resources Limited, employed by Odessa Resources. Mr. Alfred Gillman is a
Fellow and Chartered Professional of the Australian Institute of Mining and Metallurgy and was engaged
as a consultant to Superior Lake in relation to the JORC (2012) resource. Mr. Gillman has sufficient
experience which is relevant to the style of mineralisation and type of deposit under consideration and
to the activity which he is undertaking to qualify as a Competent Person as defined in the 2012 Edition
of the ‘Australasian Code for Reporting of Exploration Results, Mineral Resources and Ore Reserves’. Mr.
Gillman consents to the inclusion in this announcement of the matters based on his information in the
form and context in which it appears.
Mineral Resources
The information contained in this announcement that relates to the exploration results and mineral
resource estimates is based on, and fairly reflects, information compiled by Dr Marat Abzalov, an
independent consultant for MASSA Geoservices. Dr Marat Abzalov is a Fellow of the Australian Institute
of Mining and Metallurgy and was engaged as a consultant to Superior Lake Resources to complete the
JORC (2012) resource. Dr Abzalov has sufficient experience which is relevant to the style of mineralisation
and type of deposit under consideration and to the activity which he is undertaking to qualify as a
Competent Person as defined in the 2012 Edition of the ‘Australasian Code of Reporting of Exploration
Results, Mineral Resourced and Ore Reserves’. Dr Abzalov consents to the inclusion in this announcement
of the matters based on his information in the form and context in which it appears. Dr Abzalov holds
securities in Superior Lake Resources Limited.
For
per
sona
l use
onl
y

Superior Lake Resources Limited
ACN 139 522 553
T: +61 8 6143 6740
F: +61 8 9388 8824
Page 9
Appendix 1
Drillhole information
Hole ID Easting Northing RL Length
(m)
Azimuth Dip
(collar)
Dip
(interval)
From
(m)
To (m) Interval
(m)
Zn% Cu% Au g/t Ag g/t
PL-18-01
471530 542064 10422 879 290 -86.7 -75.75 836.25 851.56 5.31 7.31 0.46
incl 839.50 840.00 0.50 3.83% 1.17
incl 840.00 841.06 1.06 27.8 0.629
incl 848.84 849.19 0.35 25.2 0.18
PL-18-01A-W1 471469 5424088 9839.6 265.6 298 -77 -57.1 224.60 225.60 1.00 4.78 0.18
234.38 235.24 0.86 4.36 0.39
PL-18-01A-W2 Hole Lost – Wedge Dislodged
PL-18-01A-W3 471486 5424080 9983.7 375.6 293 -78 -56.7 353.37 357.07 3.70 5.95 0.28
incl 353.37 354.37 1.00 15.95 0.58
For
per
sona
l use
onl
y

1
Appendix 2. JORC (2012) TABLE 1 Checklist of Assessment and
Reporting Criteria
Section 1 Sampling Techniques and Data Criteria Explanation Commentary
Sampling Techniques
Nature and quality
of sampling (e.g.
cut channels,
random chips, or
specific specialised
industry standard
measurement
tools appropriate
to the minerals
under
investigation, such
as down hole
gamma sondes, or
handheld XRF
instruments, etc).
These examples
should not be
taken as limiting
the broad
meaning of
sampling.
• Sampling of the Pick Lake and
Winston Lake deposits has been
carried out using diamond drilling
that was carried out during the
period of mining operations from
1988 to January 1999. Verification
of the sampled intervals was made
by Superior Lake Resources in 2018.
In 2019 additional 3 diamond core
drillholes were drilled.
• There is a total of 1810 surface and
underground drillholes in the
database compiled by the Superior
Lake Resources, including 247
drillholes drilled at Pick Lake, 1,508
drillholes drilled at Winston Lake
and 55 exploration drillholes (Fig.
A1.1).
• Historic sampling was typically
carried out using half cut core.
• Historic core for two holes was
accessed at the Ontario Ministry of
For
per
sona
l use
onl
y

2
Criteria Explanation Commentary
Northern Development and Mines
(NMDM) in Thunder Bay. This core
comprised half core samples over
continuous lengths of typical
Winston Lake mineralisation. This
core was resampled using quarter
core sampling for QAQC analyses in
order to compare historic assays
with modern assays.
• Sampling of the core is considered
to be to industry standards for this
type of deposit.
Fig.A1.1: Map of the project area showing distribution of the drill holes.
Red – Pick Lake deposit data, light blue – Winston Lake deposit data,
dark blue – exploration drill holes
Aspects of the
determination of
mineralisation
that are Material
to the Public
Report.
• The determination of mineralisation has been by a combination of geological observations (logging and
mapping) in conjunction with assay results from the surface and underground database.
• Information from mine level plans and cross-sections along with reports and studies was used to compile a 3D
geological model (wireframes) of the VMS system at Pick and Winston. This was used as the framework for the
mineralisation models.
Drilling techniques
Drill type (e.g.
core, reverse
circulation, open-
hole hammer,
rotary air blast,
auger, Bangka,
sonic, etc) and
details (e.g. core
diameter, triple or
• All drilling completed at both Pick Lake and Winston Lake was diamond drilling which has been drilled from
both surface or underground. The resource is defined by a total of 215,397.7m of drilling in 1,755 holes.
• Pick Lake: No. and total metres surface holes 45 holes for 32,531m
• Pick Lake: No. and total metres underground holes 202 holes for 28,990m
• Winston: No. and total metres surface holes 57 holes for 9,307.7m
• Winston: No. and total metres underground holes 1,451 holes for 144,768.6m
• Core size recorded as either BQ, TT46, LTK46, AW34, or AQTK.
For
per
sona
l use
onl
y

3
Criteria Explanation Commentary
standard tube,
depth of diamond
tails, face-
sampling bit or
other type,
whether core is
oriented and if so,
by what method,
etc).
Core Size Diameter
(mm)
BQ 36.5
TT46 35.3
LTK46 35.6
AW34 33.5
AQTK 30.5 •
Drill Sample Recovery
Method of
recording and
assessing core and
chip sample
recoveries and
results assessed.
Measures taken to
maximise sample
recovery and
ensure
representative
nature of the
samples.
Whether a
relationship exists
between sample
recovery and
grade and
whether sample
• Inspection of core at the Ministry of Northern Development and Mines (MNDM) in Thunder Bay and at the
core shack on site showed high core recoveries estimated at >98%.
• No selective core losses have been reported in the drill logs and not observed when drill core was
examined at the MNDM core storage facilities.
For
per
sona
l use
onl
y

4
Criteria Explanation Commentary
bias may have
occurred due to
preferential
loss/gain of
fine/coarse
material.
Logging
Whether core and
chip samples have
been geologically
and geotechnically
logged to a level
of detail to
support
appropriate
Mineral Resource
estimation, mining
studies and
metallurgical
studies.
Detailed drill logs were recovered from archives in Schrieber, Ontario. Data from these logs were entered into an
Excel spreadsheet, subjected to QAQC and manual error correction and then uploaded into an Access database.
Subsequent loading errors in 3D mining software were then corrected. The dataset is considered to be acceptable
for use in Mineral Resource estimation by the Competent Person.
Example of Historic Data Header Sheet:
Example of Historic Data Assay Sheet:
Logging Whether core and
chip samples have
Detailed drill logs were recovered from archives in Schrieber, Ontario. Data from these logs were entered into an
Excel spreadsheet, subjected to QAQC and manual error correction and then uploaded into an Access database.
For
per
sona
l use
onl
y

5
Criteria Explanation Commentary
been geologically
and geotechnically
logged to a level
of detail to
support
appropriate
Mineral Resource
estimation, mining
studies and
metallurgical
studies.
Subsequent loading errors in 3D mining software were then corrected. The dataset is considered to be acceptable
for use in Mineral Resource estimation by the Competent Person.
Example of Historic Data Header Sheet:
Example of Historic Data Assay Sheet:
Whether logging
is qualitative or
quantitative in
nature. Core (or
costean, channel,
etc) photography.
Drill core has been geologically logged to a high standard and includes lithology descriptions, texture,
structure, alteration, sulphide percentages, colour, and grainsize.
For
per
sona
l use
onl
y

6
Criteria Explanation Commentary
Example of Historic Data Geological Log Sheet:
The total length
and percentage
of the relevant
intersections
logged.
100% of the core has been geologically logged.
Sub-sampling techniques and
sample preparation
If core, whether
cut or sawn and
whether quarter,
half or all core
taken.
Sub-sampling protocols of the historic data are not available.
Recent analysis of the duplicate samples has confirmed a good repeatability of the historic assays, confirming that historic data are lacking of biases (Fig.A1.3)
Good repeatability of the historic data expressed as insignificant scatter of the data points around the first
bisect (1:1 line) on the diagram (Fig.A1.3) confirms that sub-sampling protocols were appropriate for this style
of mineralisation.
If non-core,
whether riffled,
tube sampled,
rotary split, etc
and whether
All sampling was carried with diamond core
For
per
sona
l use
onl
y

7
Criteria Explanation Commentary
sampled wet or
dry.
For all sample
types, the nature,
quality and
appropriateness
of the sample
preparation
technique.
All sample preparation, related to the historic data, was made in the two external laboratories: Swastika Laboratories (Swastika, Ontario) and Metric Lab (Thunder Bay, Ontario) that have followed standard procedures of the Canadian mining industry standards developed for the base metal mineralisation.
Quality control
procedures
adopted for all
sub-sampling
stages to
maximise
representivity of
samples.
• The archive data does not contain QAQC information, however, the good consistency of the assay data of historic sampling suggests that standard QAQC procedures were adopted in the past assuring quality of the samples.
• Standard quality control procedures used by the Canadian analytical laboratories includes assessment of quality of the comminution. This is made by test screening of the selected samples and estimating the percentage of material passed through the screen assuring that this is matching to the established protocol.
These procedures were used during the recent drilling by Superior Lake and it is assumed that similar
procedures were used through the course of the Project. Good repeatability of the historic data expressed as
insignificant scatter of the data points around the first bisect (1:1 line) on the diagram (Fig.A1.3) confirms that
sub-sampling protocols were appropriate for this style of mineralisation.
Measures taken
to ensure that
the sampling is
representative of
the in-situ
material
collected,
including for
• The use of diamond core drillholes is considered to provide representative samples of the in-situ mineralisation, particularly the true thickness (sampling was done to geological boundaries).
Significant part of the samples was collected using underground drilling that provides optimal intersections
with mineralisation, commonly close to 90o For
per
sona
l use
onl
y

8
Criteria Explanation Commentary
instance results
for field
duplicate/second-
half sampling.
Quality of assay data and
laboratory tests
The nature,
quality and
appropriateness
of the assaying
and laboratory
procedures used
and whether the
technique is
considered
partial or total.
Two external laboratories used historically: Swastika Laboratories (Swastika, Ontario) and Metric Lab (Thunder Bay, Ontario). It is assumed that the quality of assays is compliant with the standards of Canadian industry at the time when Pick Lake and Winston Lake deposits were explored and mined. Appropriateness of the assaying and laboratory procedures that was historically used can be inferred from the fact of successful mining of these deposits and no reconciliation issues were identified in the archive documentation. Good repeatability of the historic data expressed as insignificant scatter of the data points around the first bisect (1:1 line) on the diagram (Fig.A1.3) confirms that sub-sampling protocols were appropriate for this style of mineralisation. A total of 64 samples were used which is representative.
For geophysical
tools,
spectrometers,
handheld XRF
instruments, etc,
the parameters
used in
determining the
analysis including
instrument make
and model,
reading times,
calibrations
factors applied
Down-hole EM (DHEM) survey has been undertaken by Superior Lake in 2019 that has confirmed continuity of
the Zn-Cu mineralisation between Upper and Lower Pick domains (Fig. A1.2).
The survey details are as follows:
Digital receiver: DigiAtlantis, s/n 130 Tx synchronization: GPS Integration time: 4 cycles of 128 stacks Start of integration: 90 μs from end of turn off Number of gates: 36, geometrically spaced Additional delay: 0 μs Power line filter: 60 Hz
Transmitter: TerraScope, PRO5U, s/n 8NF Power supply: Voltmaster 13000 long run generator
For
per
sona
l use
onl
y

9
Criteria Explanation Commentary
and their
derivation, etc.
Maximal output: 18 kW or 38 A or 400 V Transmitted signal: bipolar wave, 50% duty cycle Repetition rate: 1 Hz (T/4 = 250 ms)
The DigiAtlantis probe was synchronized with the TerraScope transmitter using a EMIT Transmitter Controller with GPS timing.
The transmitter energized a loop measuring roughly 1200m x 1500m.
Readings taken at 10m intervals down-hole from 30m to EOH.
Data were modelled using the program Maxwell distributed by Electromagnetic Imaging Technology which implements a variant of the current ribbon approximation for the EM response of a plate-like conductor devised by Lamontagne et al (1998).
Lamontagne, Y., Macnae, J., Polzer, B., 1998. Multiple conductor modelling using program Multiloop. 58th Ann. Mtg. of Soc. Exploration Geophysics, Expanded Abstracts.
For
per
sona
l use
onl
y

10
Criteria Explanation Commentary
Fig. A1.2: The conductive plates (blue polygons) which have been identified by the DHEM survey undertaken
by Superior Lake Resources with an aim to confirm continuity of VMS mineralisation between Upper Pick and
Lower Pick domains
Nature of quality
control
procedures
adopted (eg
standards,
blanks,
duplicates,
external
laboratory
checks) and
whether
acceptable levels
• The archive data does not contain QAQC information, however, the good consistency of the assay data of historic sampling suggests that standard QAQC procedures were adopted in the past assuring quality of the samples.
• Recent analysis of the duplicate samples has confirmed a good repeatability of the historic assays, confirming that historic data are lacking of biases (Fig.A1.3)
• Good repeatability of the historic data expressed as insignificant scatter of the data points around the first bisect (1:1 line) on the diagram (Fig.A1.3) confirms that sub-sampling protocols were appropriate for this style of mineralisation.
For
per
sona
l use
onl
y

11
Criteria Explanation Commentary
of accuracy (ie
lack of bias) and
precision have
been established.
Fig.A1.3: Duplicate samples analysis confirming the validity of the historic data
Verification of sampling and
assaying
The verification
of significant
intersections by
either
independent or
alternative
company
personnel.
Superior Lake submitted 64 drill core samples from historic drilling to ALS Canada Ltd Laboratories
(preparation done at Thunder Bay, analysis done in Vancouver) as an independent check in June 2018.
Samples were quarter core, crushed to 70% passing 2mm, and pulverised to 85% passing <75um. Analysis for
Zn and Cu were carried out using Inductively Coupled Plasma- Atomic Emission Spectroscopy (ICP-AES), Au by
30gram Fire Assay with an Atomic Absorption Spectroscopy finish, Ag was by Aqua Regia with an AAS finish.
For
per
sona
l use
onl
y

12
Criteria Explanation Commentary
• During data verification, no indication was found of anything in the exploration work, or analytical data that could have negatively affected the reliability of the assay results reported.
Documentation
of primary data,
data entry
procedures, data
verification, data
storage (physical
and electronic)
protocols.
During the past exploration campaigns, the drillholes has been logged into the paper forms which have been
obtained by Superior Lake resources and digitised in to the database. Initially data from these logs were
entered into an Excel spreadsheet, subjected to QAQC and manual error correction and then uploaded into an
Access database. Subsequent loading errors in 3D mining software were then corrected. The dataset is
considered to be acceptable for use in Mineral Resource estimation by the Competent Person.
Discuss any
adjustment to
assay data.
No adjustment to assay data has been made. For
per
sona
l use
onl
y

13
Criteria Explanation Commentary
Location of data points
Accuracy and
quality of surveys
used to locate
drill holes (collar
and down-hole
surveys),
trenches, mine
workings and
other locations
used in Mineral
Resource
estimation.
• The method for surveying historical surface drillhole collars is not known but it is assumed that the Mine
Surveyors were responsible for the underground drilling. The downhole survey methods used are
Eastman single shot and multishot, Tropari, acid etch and gyro survey at nominal 30m intervals. Superior
Lake is in the process of compiling all hard copy drillhole data.
Drillhole locations have been validated against mine workings and plans.
Specification of
the grid system
used
• Historical mining and exploration activities were carried out in local mine grids. The Winston local mine
grid is oriented approximately -20 degrees to UTM grid north and the Pick local mine is oriented at -60
degrees to UTM grid north.
The information had been transformed from local grid co-ordinates into UTM NAD83 Zone 16 grid via a two-
point transformation.
Quality and
adequacy of
topographic
control
A topographic surface was generated from SRTM data and has had the surface drill collar location points
added in to provide local control.
Data spacing and distribution
Data spacing for
reporting of
Exploration
Results.
• Pick Lake has been drilled from surface approximately at 100 - 200m centres.
Underground drilling at both Pick Lake and Winston Lake has been drilled on a much tighter grid,
approximately at 40m centres at the Pick Lake and 20m at the Winston Lake, and down to less than 10m in
places.
For
per
sona
l use
onl
y

14
Criteria Explanation Commentary
Whether the data
spacing and
distribution is
sufficient to
establish the
degree of
geological and
grade continuity
appropriate for
the Mineral
Resource and Ore
Reserve
estimation
procedure(s) and
classifications
applied.
• Drillholes spacing, which are distributed approximately as a random stratified grids of 40x40m at the Pick
Lake and 20x20m at the Winston Lake allow to accurately establish continuity of mineralisation and
estimate the grade distribution. These grids are appropriate for Mineral Resource estimation.
The production history and information available from the mining operations forms part of the confidence
criteria used to classify the Mineral Resource.
Whether sample
compositing has
been applied.
• Samples have been taken based on geological intervals, with a nominal maximum length of 1 metre.
Physical compositing of the samples not used
Orientation of data in relation
to geological structure
Whether the
orientation of
sampling
achieves
unbiased
sampling of
possible
structures and
the extent to
• Based on 3D model reviewed the intersection angles in general are close to perpendicular and
appropriate for Resource estimation. Some of the drillhole have low intersection angles due to the
location of the drill sites, but these are still considered to be representative.
• The new drillholes, drilled by Superior Lake Resources in 2019 have been completed using wedging
equipment allowing to orientate drillholes in order to obtain an optimal intersection with the drill target.
Location of the drilled hole was surveyed every day after, approximately 50 m of advancing and this has
allowed to closely monitor deviations of the drillholes and correct it using the wedges. For
per
sona
l use
onl
y

15
Criteria Explanation Commentary
which this is
known,
considering the
deposit type.
• Downhole surveying was made using Gyro camera, which is optimal for surveying in the rocks, containing
ferro-magnetic minerals
If the relationship
between the
drilling
orientation and
the orientation of
key mineralised
structures is
considered to
have introduced
a sampling bias,
this should be
assessed and
reported if
material.
• As drillholes were generally drilled perpendicular to the strike of mineralisation, there has not been any
sampling bias introduced based on the current understanding of the structural orientations and the dip
and strike of mineralisation.
Sample Security
The measures
taken to ensure
sample security.
As was standard practice on the mining projects and the operating mines, it is assumed that Inmet Mining
organised delivery of samples directly to assay laboratories and other previous explorers followed industry
guidelines current at the time.
Audits or reviews The results of any
audits or reviews
of sampling
techniques and
data.
2013. Rémi Verschelden validated the analytical data of the grab samples using the values in the ALS Chemex and SGS Canada certificates of analysis. The validation consisted of verifying all grab sample results for Au, Cu, and Zn as reported by Silvore Fox in 2012 from the property. No errors were noted during the validation. 2019. Superior Lake has reviewed and validated historic data, that included re-assaying of mineralised intervals. In total, 64 samples have been collected and assayed that confirm validity of the historic data F
or p
erso
nal u
se o
nly

16
Criteria Explanation Commentary
During data verification, no indication was found of anything in the exploration work, or analytical data that could have
negatively affected the reliability of the assay results reported.
Section 2 Reporting of Exploration Results
Criteria Explanation Commentary
Mineral tenement and land tenure
status
Type, reference
name/number, location
and ownership including
agreements or material
issues with third parties
such as joint ventures,
partnerships, overriding
royalties, native title
interests, historical sites,
wilderness or national
park and environmental
settings.
The Pick Lake Project comprises 297 claim units (each claim unit is 400mx400m or 16Ha in area) totalling
47.5km2. The claims are made up of a number of claims acquired in August 2016 and claims recently
staked and registered in October 2017. The total of all claim areas is >17,000Ha.
Superior is the legal and beneficial owner of 70% of the issue capital of Ophiolite Holdings Pty Ltd (ACN 617
182 966) (Ophiolite). Ophiolite is a proprietary exploration company and is the legal and beneficial owner
of the zinc and copper prospective “Pick Lake Project”, located in Ontario. Please see ASX announcement
dated 6 December 2017.
Superior Lake currently has an option over the Winston Lake project claims. These claims are owned by
FQM. For further details please refer to ASX announcement dated 21st February 2018.
The security of the tenure
held at the time of
reporting along with any
known impediments to
obtaining a licence to
operate in the area.
The claims are in good standing.
For
per
sona
l use
onl
y

17
Criteria Explanation Commentary
Exploration done by other parties
Acknowledgment and
appraisal of exploration
by other parties.
The Pick Lake deposit was discovered in 1983 and the Winston Lake deposit was discovered in 1982. The
Pick Lake and Winston Lake project areas have been the subject of a variety of exploration campaigns,
main exploration and development stages are listed in the table:
Details of the past exploration can be found in report filed on SEDAR:
Independent Technical Report on the Pick Lake Property, Pays Plat Lake and Rope Lake Area, Ontario,
Canada, dated June 19, 2013 prepared by Bruno Turcotte, MSc, P. Geo and Remi Verschelden, BSc, P. Geo
(filed June 21, 2013 on SEDAR). This report can be accessed via the url: http://www.sedar.com under the
company name “Silvore Fox”.
Geology
Deposit type, geological
setting and style of
mineralisation
Pick Lake
The Pick Lake deposit and all nearby prospects are examples of metamorphosed volcanogenic massive sulphide (VMS) deposits, that form in collisional oceanic tectonic environments in areas of localized rifting. The Pick Lake deposit belongs to the bimodal mafic volcanic sub-type, also known as Canadian-shield or Noranda-type VMS deposits. The deposits of this sub-type are characterised by dominating of the mafic volcanics with the felsic volcanic rocks constituting less then 25% of the sequence. A significant
For
per
sona
l use
onl
y

18
Criteria Explanation Commentary
characteristic of this deposit type is the tendency of the deposits to occur in clusters or “camps” either along a single stratigraphic horizon or stacked within the volcanic sequence. The deposits tend to form stratiform massive sulphide lenses with or without discordant feeder pipes cutting across the underlying stratigraphy. The massive sulphide lens may be displaced from the feeder pipe, which represents the hydrothermal vent onto the ancient sea floor.
The Pick Lake deposit occurs at the extreme western edge of the Winston-Big Duck Lake sequence of
volcanic rocks, approximately 35 metres above a granitic contact. Aeromagnetics within the Project area
depicts a distinctive V shaped sequence of magnetic and non-magnetic units converging to a northern “V”
apex and appears remarkably similar to the aeromagnetic character of the older Archean Warriedar Fold
Belt in Western Australia which hosts the Golden Grove VMS deposits.
The Pick Lake deposit occurs as a large sheet like zone of massive sulphides within a series of bedded
pyroclastic rocks. Hydrothermal alteration exists in both footwall and hangingwall rocks resulting in varying
assemblages of quartz, cordierite, biotite, anthophyllite, garnet, chlorite and sericite with minor
disseminated sulphides. The hydrothermal alteration zone appears to be spatially related to the Winston
Lake deposit; recent structural mapping provides evidence that Pick Lake and Winston Lake can be hosted
within the same stratigraphic horizon.
The Anderson showing, located near the southeast shore of Winston Lake, appears to be the surface
expression of the Pick Lake deposit. This is a rusty pyritic weakly altered series of bimodal volcanics.
Massive sulphides of the Pick Lake deposit occur from approximately 300m to 1200m vertically and over a
strike length averaging 250 metres. The lower portion of the deposit appears to increase in strike length to
approximately 500 metres. The deposit strikes at 20 degrees and dips to the east at 50 degrees. The
thickness of the deposit is generally between 2 and 4m, however, locally it is up to 14 metres.
Sulphide mineralisation is generally very consistent, composed of a fine-grained mixture of sphalerite (50-
80%) and pyrrhotite (5-35%) with minor chalcopyrite (0-5%) and pyrite (0-3%). Commonly contained within
the sulphides is 5-10% of quartz inclusions, that are represented by the rounded grains up to 3cm in size
(Fig. A2.1a) and, less commonly, by veins, cutting the massive sulphide mineralisation (Fig.A2.1b).
For
per
sona
l use
onl
y

19
Criteria Explanation Commentary
Mineralisation also contains inclusions of the host volcanic rocks (1-3%) which are commonly intensely
foliated and altered to chlorite-biotite schists (Fig. A2.1a). Random orientation of the foliated inclusions
indicate that deformation and displacement of the sulphide mass has continued after main peak of
metamorphism. Intensity of foliation fabrics increases toward the contact of the massive sulphides (Fig.
A2.1c), which are typically sharp (Fig.A2.1d).
(a) (b)
(c) (d)
Fig. A2.1: Sulphide mineralisation of the Pick Lake deposit
Winston Lake
The Winston Lake deposit lies at the top of the Winston Lake sequence within cherty exhalite and altered
felsic-to-intermediate laminated ash tuff. In places, gabbro forms the hanging wall for the deposit. The
For
per
sona
l use
onl
y

20
Criteria Explanation Commentary
footwall consists of altered mafic flow rocks and felsic-to-intermediate volcaniclastic rocks which are
underlain by altered quartz and feldspar porphyritic rhyolite and feldspar pyritic basalt with intercalated
sulphide-rich, bedded, tuffaceous rocks which, in turn, are underlain by the "Main" quartz fledspar
porphyry which is intruded by gabbro and pyroxenite.
Hydrothermal alteration, confined to the Winston Lake sequence, and later metamorphism of altered rock
have resulted in assemblages of cordierite, anthophyllite, biotite, garnet, sillimanite, staurolite, muscovite
and quartz coincident with an increase in iron, magnesium, and potassium and a decrease in sodium and
calcium. Zinc content is directly proportional to the intensity of alteration.
High copper values occur at the flanks and top of the alteration "pipe" with the core of the pipe containing
relatively depleted copper values. The most common forms of ore are finely banded sphalerite and
pyrrhotite and massive-to-coarsely banded sphalerite and pyrrhotite with minor pyrite and chalcopyrite
and up to 45% of sub-angular mafic and felsic fragments averaging 3cm in diameter.
The north-striking and 50 degrees eastwardly dipping deposit has a strike length of 750m and width of
350m. It has an average true thickness of 6m and is open to depth.
Drill hole Information
A summary of all
information material to
the understanding of the
exploration results
including a tabulation of
the following information
for all Material drill
holes:
easting and northing of
the drill hole collar
elevation or RL (Reduced
Resource definition database contains 1810 surface and underground drillholes.
These includes 23 new drillholes that were added to the database after maiden resources were estimated
and announced in 2018 (ASX 2018_07_03_SUP). The new data includes 3 drill holes drilled in 2019 by
Superior Lake Resources (ASX announcement 7 March 2019) and 20 historic holes that were digitised from
the archives (Fig. A2.2)
For
per
sona
l use
onl
y

21
Criteria Explanation Commentary
Level – elevation above
sea level in metres) of the
drill hole collar dip and
azimuth of the hole down
hole length and
interception depth hole
length.
Fig. A2.2: Longsection of the Pick Lake deposit showing distribution of the drillholes
Details of the new drillholes added to the database in 2019 are presented in the Appendix 1. Other holes
have been presented to ASX in 2018 when maiden resources were reported (ASX 2018_07_03_SUP).
Data aggregation methods
In reporting Exploration
Results, weighting
averaging techniques,
maximum and/or
minimum grade
truncations (eg cutting of
high grades) and cut-off
grades are usually
Material and should be
stated
• Intercept grades are length weighted.
No cut-off grades have been used.
For
per
sona
l use
onl
y

22
Criteria Explanation Commentary
Relationship between
mineralisation widths and
intercept lengths
These relationships are
particularly important in
the reporting of
Exploration Results.
If the geometry of the
mineralisation with
respect to the drill hole
angle is known, its nature
should be reported.
If it is not known and only
the down hole lengths
are reported, there
should be a clear
statement to this effect
(e.g. ‘down hole length,
true width not known’).
• Historical mining at Pick Lake and Winston Lake report mineralisation widths at Pick Lake to
average of 2 to 4m and at Winston Lake to average 7m, which is concur with the 3D Resource
model of the deposits.
Diagrams
• Refer to body of announcement for figures. Generalised geological map of the project area is
shown below.
For
per
sona
l use
onl
y

23
Criteria Explanation Commentary
•
Balanced reporting
Where comprehensive
reporting of all
Exploration Results is not
practicable,
representative reporting
of both low and high
grades and/or widths
should be practiced to
avoid misleading
reporting of Exploration
Results.
• Assay results for significant intercepts sourced from Inmet Mining Corp figures have been
tabulated in Appendix 1.
For
per
sona
l use
onl
y

24
Criteria Explanation Commentary
Other substantive exploration
data
Other exploration data, if
meaningful and material,
should be reported
including (but not limited
to): geological
observations; geophysical
survey results;
geochemical survey
results; bulk samples –
size and method of
treatment; metallurgical
test results; bulk density,
groundwater,
geotechnical and rock
characteristics; potential
deleterious or
contaminating
substances.
Exploration activities carried out by other parties include surface geochemistry, drilling, surface geology
mapping, VTEM, structural mapping.
• Continuity of mineralisation was studied and confirmed by DHEM survey that were described in
the Section 1 of the JORC Table.
Further work
The nature and scale of
planned further work
(e.g. tests for lateral
extensions or depth
extensions or large-scale
step-out drilling).
The following work is planned for the Pick Lake and Winston Lake Projects:
• To complete compilation of all drillhole hardcopy data into a drillhole database
• To complete scanning and digitising of underground drive geology mapping
• DGPS pick-up of all existing surface drillhole collars.
• Downhole survey measurements of existing surface drillholes (if possible)
• FLEM survey with an objective to identify the massive sulphide targets to the depth of 1000m (currently in progress)
• Preparation of the mine plans using the updated resource model For
per
sona
l use
onl
y

25
Criteria Explanation Commentary
Geochemical exploration in the eastern tenements, that currently are lacking of systematic exploration
and known targets was not drilled
For
per
sona
l use
onl
y

26
Section 3 - Estimation and Reporting of Mineral Resources
Criteria Explanation Commentary
Database integrity Measures taken to ensure that data has not been corrupted by, for example, transcription or keying errors, between its initial collection and its use for Mineral Resource estimation purposes.
• Superior Lake has compiled and validated Access database of drilling information, together with scanned images of interpreted level plans, sections, maps and other production related plans used in the preparation of the Mineral Resource estimate.
• Drill holes data were digitised from the mine plans and cross-sections entry from hardcopy logs into Excel. All data in Excel was then checked against the original hardcopy logs including collar information, downhole surveying, geology logging and assays. Any errors detected in the Excel files was corrected.
• Intervals not sampled were assigned a zero-grade value.
• Drillholes were uploaded to 3D mining software packages for error detection and on and on-screen inspection and validation.
Data validation procedures used.
• Data were loaded into 3D mining software packages and validation checks for location, downhole surveys, intervals and integrity were made. The data was also checked against plans, cross sections and long sections to detect any errors in data entry for both locations and downhole data.
Site visits Comment on any site visits undertaken by the Competent Person and the outcome of those visits.
• Dr. M.Abzalov, the Competent Person (Resources) of the project has reviewed the historic data and the drill core of
the holes that were available at the drillcore storage facilities of the Ontario Ministry of Northern Development and
Mines in Thunder Bay, Ontario.
• In February 2019 Dr. M.Abzalov has visited the project during drilling carried by Superior Lake and has reviewed the
field procedures, with emphasis on drill holes logs and documentation quality, and also analysed the obtained drill
core.
• All field procedures observed were found satisfactory and complaint with the industry standards.
For
per
sona
l use
onl
y

27
Criteria Explanation Commentary
If no site visits have been undertaken indicate why this is the case.
• Site visit has been undertaken.
Geological interpretation
Confidence in (or conversely, the uncertainty of) the geological interpretation of the mineral deposit.
Pick-Winston Lakes camp VMS deposits, are a Noranda-style of the VMS-type deposits which are characterised by presence of the zinc - copper sulphide minerals core composed of sphalerite-chalcopyrite-pyrrhotite-pyrite (+/- gold, +/- galena, +/- tetrahedrite) which can be surrounded by pyrite-pyrrhotite halo with minor sphalerite, tetrahedrite and galena. The zoned distribution of the sulphide minerals is coupled with alteration patterns developed in the host rocks, with Mg-chlorite distributed at the core of the alteration pipe under the Cu-Zn deposit surrounded by sericite-quartz outer halo. Rocks at the vicinity to mineralisation appear a pervasive Na and to less extent Ca depletion, whereas Mg-rich core is also depleted in SiO2. Mineralisation of the studied deposits is essentially occurring as single massive sulphides seam distributed along the VMS horizon. A VMS type model was used as a basis for constraining the mineralisation using the Leapfrog methodology. The geological characteristics of the VMS type mineralisation are well understood and applied for delineating the mineralised bodies at the project. This implies that base-metal sulphide precipitates from volcanic exhalates on a sea floor or at a shallow depth close to the floor and forming the beds and lenses of massive and semi-massive sulphide mineralisation. Confidence in the model is high because the mineralisation of the studied deposits is essentially occurring as single massive sulphides seam distributed along the VMS horizon. The mineralisation and the host rocks stratigraphy can be delineated between the drill holes. The distances between drillholes intersecting the mineralisation are commonly from 10-30m (at the Winston Lake deposit to 20-40m at the Pick Lake deposit which is sufficient for a confident delineation of the mineralised bodies. The interpretation of the VMS bodies was confirmed by mapping and sampling of the underground developments which are also used for constraining VMS mineralised bodies in 3D.
• The different interpretations can be suggested for extension of the mineralised bodies where they are not
terminated by the barren drill holes
For
per
sona
l use
onl
y

28
Criteria Explanation Commentary
Nature of the data used and of any assumptions made.
Geological interpretation and the resource model are based on the drillholes data (1810 drill holes) and underground developments
The effect, if any, of alternative interpretations on Mineral Resource estimation.
Not applicable. Mineral Resource domains are defined and constrained in 3D by the drillholes and the underground mapping/sampling data which has allowed to generate a robust geological interpretation of the mineralised bodies. The close distances between the drillholes intersecting the VMS strata and reasonably simple geometry of the mineralised bodies does not leave too much rooms for alternative geological interpretations. The differences can be related to the distances of extrapolation of the drillhole grades to the peripheral parts of the VMS bodies. In the current estimation this was approximately 75m with a minimum of 4 samples available for averaging the extrapolated grade.
The use of geology in guiding and controlling Mineral Resource estimation.
The Pick mineralisation was defined by intervals logged as massive and semi-massive sulphides within the Pick clotted rhyolite or tuff units. The assay values for zinc were compared to these intervals and found to correlate well. The zinc percent assay values were used to select intersections where no logging information was present. The interpretation of continuity was based on ore drive level plans that showed mapping information for the sulphide horizon. A nominal cut-off grade of 1% Zn was used to define the mineralised intervals which were used to construct a vein model. Edge boundaries were applied from ore drive extents and long-section mine plans that indicated the conductor boundary position from geophysical surveys.
The factors affecting continuity both of grade and geology.
Mineralisation of the studied deposits occur essentially as single massive sulphides seams (Pick Lake and Winston) distributed along the VMS horizon which controls the continuity of geology. This zoning, in particular zoned distribution of the Cu-rich and Zn-rich mineralisation, is observed at the studied deposits. Thickness and grade decreases to the peripheral parts of the VMS seams.
Dimensions The extent and variability of the Mineral Resource expressed as length (along strike or otherwise), plan width, and depth below surface to the upper and
The project includes two deposits, Pick Lake and Winston. Location and dimensions of the mineralisation is shown on the longitudinal sections (Figures A3.1 and A3.2). The diagrams also contain the drillhole intersections
For
per
sona
l use
onl
y

29
Criteria Explanation Commentary
lower limits of the Mineral Resource.
Fig.A3.1 Longitudinal section of the Winston Lake deposit
For
per
sona
l use
onl
y

30
Criteria Explanation Commentary
Fig.A3.2 Longitudinal section of the Pick Lake deposit
Estimation and modelling techniques
The nature and appropriateness of the estimation technique(s) applied and key assumptions, including
Estimation of the mineralisation grade was made using Ordinary Kriging (OK) technique that was applied to Zn, Cu, Au and Ag.
Mined area
Mined area
Geological interpretation of the VMS body
1250m Below Surface
400m along strike(estimated along the Azi 355)
o 100 m
South NorthPick Lake deposit(longsection)
Indicated Resource
Inferred Resource
Exploration Target
Zn%
For
per
sona
l use
onl
y

31
Criteria Explanation Commentary
treatment of extreme grade values, domaining, interpolation parameters and maximum distance of extrapolation from data points. If a computer assisted estimation method was chosen include a description of computer software and parameters used.
Estimation procedure included several steps: Mineralisation was interpreted and constrained using 3D wireframes. This was made by external consultants (Optiro group) who used the Leapfrog® program for developing the wireframes of the mineralised bodies. Wireframes were imported into Micromine® where the blank block model was created. In order to assure the good fit of the block model to the wireframes the following sub-cells were used:
• Pick Lake deposit 0.5x0.5x0.5m (this is sub-cell size)
• Winston lake deposit: 1 x 1 x 1m (this is sub-cell size)
For
per
sona
l use
onl
y

32
Criteria Explanation Commentary
Drillholes data have been obtained from the central database stored on the Superior Lake’s server. The database was monitored by a database administrator. The drillholes samples have been marked by assigning the codes corresponding to the wireframe that includes that sample. Samples located outside of the wireframes have not been coded. At the Pick Lake 6 wireframes present, referred as 10 (main body), 11, 12, 13, 14, 33. At the Winston Lake only one wireframe, referred as 21. The drillhole samples have been coded accordingly to the wireframes: 10, 11, 12, 13, 14, 33 and 21. The code was written in the field denoted as SUBZONE (drill holes assay file). Because the sample lengths were different the samples have been composited to 1m composites. Compositing was made using optimal compositing algorithm of Datamine ®. In order to accurately reproduce in the resource model, the internal zoning of the VMS mineralisation the estimation was facilitated applying the unfolding techniques to the block model and drillholes. The central line flattening algorithm of Micromine® was used for this purpose. After flattening, the data have been transferred to Isatis® where the metal grades have been estimated into the block of 20(X) x 20(Y) x 1(Z)m. Coordinates were in the unfolded space. Two passes of estimation were used: Pick Lake 1st pass: search radii 60x60x2 Min samples 4 Max samples 16 (no declustering used) 2nd pass: search radii 60x60x4m Min samples 1
For
per
sona
l use
onl
y
33
Criteria Explanation Commentary
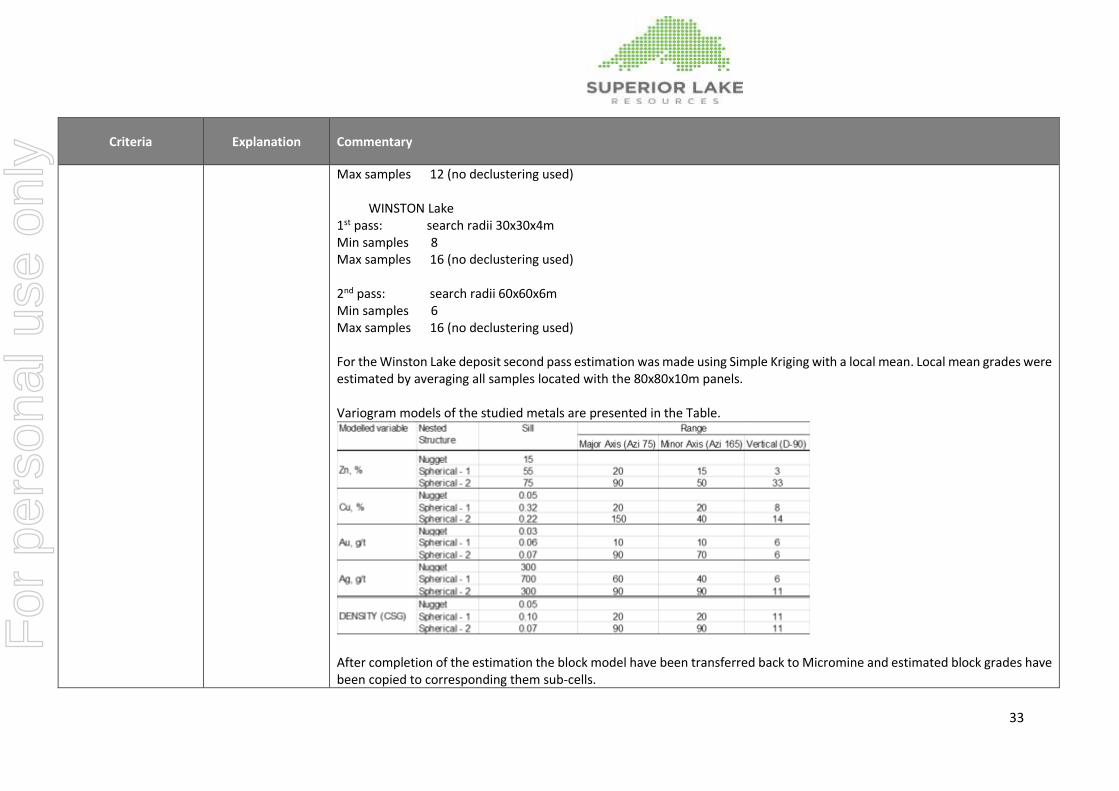
Max samples 12 (no declustering used) WINSTON Lake 1st pass: search radii 30x30x4m Min samples 8 Max samples 16 (no declustering used) 2nd pass: search radii 60x60x6m Min samples 6 Max samples 16 (no declustering used) For the Winston Lake deposit second pass estimation was made using Simple Kriging with a local mean. Local mean grades were estimated by averaging all samples located with the 80x80x10m panels. Variogram models of the studied metals are presented in the Table.
After completion of the estimation the block model have been transferred back to Micromine and estimated block grades have been copied to corresponding them sub-cells.
For
per
sona
l use
onl
y

34
Criteria Explanation Commentary
The availability of check estimates, previous estimates and/or mine production records and whether the Mineral Resource estimate takes appropriate account of such data.
Previous estimate of the Pick resources made in 2018 was 1.84 Mt @ 18.8%Zn The 2019 estimate is 2.06 Mt @ 18.3 % Zn The increase of the resources is related to additional drillholes that has allowed to extend the resources and as a result of this, Lower and Upper Pick domains have joined into a single stratiform massive sulphide body.
The assumptions made regarding recovery of by-products.
The main metals are Zn and Cu. Mineralisation also contains Au and Ag which are by-products. All four metals were estimated into the block model. Cu, Au and Ag grades are reported within the Zn resource ie., the associated minerals are not reported as separate domains. It is likely that silver will have a similar recovery to that of the copper. This assumption is made because of strong correlation between these metals indicating that silver is likely present as a mixture of chalcopyrite which is the main copper mineral at this project. Historical Recoveries or by-products during the 11 years of processing in the concentrator at the site were: Copper 77 % Gold 32 % Silver 36 %
Estimation of deleterious elements or other non-grade variables of economic significance (e.g.
Deleterious elements were not analysed and were not used in the current estimation. From production records and environmental monitoring of water discharge the concentrates were known to not host deleterious material, and after 30 years there is no record or indication of heavy metal impacts to the environment from water discharge. F
or p
erso
nal u
se o
nly

35
Criteria Explanation Commentary
sulphur for acid mine drainage characterisation).
In the case of block model interpolation, the block size in relation to the average sample spacing and the search employed.
The distances between drillholes intersecting the mineralisation are commonly from 10-30m (at the Winston Lake deposit to 20-40m at the Pick Lake deposit which is sufficient for a confident delineation of the mineralised bodies. The parent blocks were 20x20x1m which is in a good accordance with the drilling grids.
At the peripheral parts of the Pick Lake deposit the drill spacing is broader, however, usually not farther then 60-80m therefore the chosen blocks size (20x20x1) is also complaint with the drill spacings in these areas.
Any assumptions behind modelling of selective mining units.
The mining methods used at this project include mechanised AVOCA and Alimak stoping. Neither of these methods are planned to be used, with the adoption of a sublevel longhole stoping method with introduced paste fill being proposed on the resumption of operations. It is assumed that mining selectivity will be approximately in the range of 10x10x1 to 20x20x1m. The used block size for estimation resources was 20x20x1m, which corresponds to assumed size of the SMU blocks
Any assumptions about correlation between variables.
Fig. A3.3: Ag vs Cu diagram, Pick Lake deposit drill hole data
For
per
sona
l use
onl
y

36
Criteria Explanation Commentary
Cu and Ag appear a strong correlation (Fig.A3.3), with coefficient of correlation (rho) equal to 0.87. Between other metals correlation is insignificant or lacking
Description of how the geological interpretation was used to control the resource estimates.
VMS type model was used as a basis for constraining the mineralisation using the LeapFrog methodology. According to this model the base-metal sulphides precipitate from volcanic exhalates on a sea floor and form the planar beds and lenses of massive sulphide mineralisation. This interpretation was implemented as 3D wireframes of the VMS seams that were created using Leapfrog software
Discussion of basis for using or not using grade cutting or capping.
High grade cut-off was applied to all metals. The cut off values, determined at approximately 2% on the probability curve, were as follows: Zn - 38% Cu - 2.4% Au - 0.7 g/t Ag - 95 g/t These values were applied as a lower cut off if the estimated block was located at the distance of 30m and larger from the data point.
The process of validation, the checking process used, the comparison of model data to drill hole data, and use of reconciliation data if available.
Estimation was validated by plotting the block grades vs corresponding them sample grades. The data have been grouped into 40m panels drawn across the VMS bodies.
For
per
sona
l use
onl
y

37
Criteria Explanation Commentary
Fig. A3.4. Swath plot comparing block model and sample grades, Pick Lake deposit The diagram (Fig. A3.4) show that model properly honours the drillhole data and accurately reproduces the local variability of the grade The model was also visually expected and compared with the drillholes data. Review of the model by cross-sections has shown that model accurately reproduces layering and zoning of the VMS seam (Fig. A3.5)
For
per
sona
l use
onl
y

38
Criteria Explanation Commentary
Fig. A3.5 Cross-section through the Pick Lake resource block model. Drill holes are shown for the reference
Moisture Whether the tonnages are estimated on a dry basis or with natural moisture,
Tonnage is estimated using the dry bulk density (DBD). Moisture was not determined and was not used F
or p
erso
nal u
se o
nly

39
Criteria Explanation Commentary
and the method of determination of the moisture content.
Cut-off parameters The basis of the adopted cut-off grade(s) or quality parameters applied.
A nominal grade of 1% Zn was used to interpret continuity for mineralisation domains. There is a sharp boundary contact with unmineralised host rock and there is no halo mineralisation
Mining factors or assumptions
Assumptions made regarding possible mining methods, minimum mining dimensions and internal (or, if applicable, external) mining dilution. It is always necessary as part of the process of determining reasonable prospects for eventual economic extraction to consider potential mining methods, but the assumptions made
Winston Lake and Pick Lake deposits have been mined using mechanised underground mining with the AVOCA mining method predominately used at Winston (Fig. A3.6) and Alimak initially at the upper Pick area. The use of Alimak was adopted above the 615 m level as no development was in place at the time of stoping and given the low price of zinc a decision was made to reduce ramp access costs. Historical mining used a minimum mining width of 2m (horizontal thickness) based on the designed development on ore of 4m x 4m. Superior will evaluate a sublevel longhole stoping with paste fill. Instead of using unconsolidated waste fill, the mining method will use cemented paste fill better controlling the hanging wall radius of the stopes and crucially the time to fill.
For
per
sona
l use
onl
y

40
Criteria Explanation Commentary
regarding mining methods and parameters when estimating Mineral Resources may not always be rigorous. Where this is the case, this should be reported with an explanation of the basis of the mining assumptions made .
Fig. A3.6: Underground drives at the Winston Lake deposit
Metallurgical factors or assumptions
The basis for assumptions or predictions regarding metallurgical amenability. It is
Past production was successful and has demonstrated that mineralisation is amenable for processing using conventional flotation technologies and the valuable metals are recovered as the sulphide concentrate. The concentrator process combined crushing, grinding, flotation and dewatering to produce two separate high-grade concentrates, zinc and copper (Fig. A3.7). The ore was hoisted via a vertical shaft into a fine ore bin and processed at a rate of
For
per
sona
l use
onl
y

41
Criteria Explanation Commentary
always necessary as part of the process of determining reasonable prospects for eventual economic extraction to consider potential metallurgical methods, but the assumptions regarding metallurgical treatment processes and parameters made when reporting Mineral Resources may not always be rigorous. Where this is the case, this should be reported with an explanation of the basis of the metallurgical assumptions made.
1,000 tpd. Concentrates were produced at 250 to 350 tpd where the concentrate were trucked to a rail siding in the town of Schrieber and loaded onto rail cars for shipment to smelters.
Historical Recoveries during the 11 years of processing in the concentrator at the site were: Zinc 93 % Copper 77 % Gold 32 % Silver 36 % Fig.A3.7: Flow-chart diagram of the processing technologies used at the Winston mine
For
per
sona
l use
onl
y

42
Criteria Explanation Commentary
Environmental factors or assumptions
Assumptions made regarding possible waste and process residue disposal options. It is always necessary as part of the process of determining reasonable prospects for eventual economic extraction to consider the potential environmental impacts of the mining and processing operation. While at this stage the determination of potential environmental impacts, particularly for a greenfields project, may not always be well advanced, the status of early consideration of these potential
The Winston Lake - Pick Lake project is free of environmental liabilities. The environmental considerations are limited to the site rehabilitation, including the stockpile area, sedimentation basins, and building foundations. Restoration works have been completed except for the building foundations. Monitoring of the water quality from the mine started at mine closure and will be required for a period of 10 years The CP has been advised there are no impediments to recommencement of mining activities.
For
per
sona
l use
onl
y

43
Criteria Explanation Commentary
environmental impacts should be reported. Where these aspects have not been considered this should be reported with an explanation of the environmental assumptions made.
Bulk density Whether assumed or determined. If assumed, the basis for the assumptions. If determined, the method used, whether wet or dry, the frequency of the measurements, the nature, size and representativeness of the samples.
654 samples have measured SG and 714 samples have CSG (calculated SG) where: CSG = (((100-S%)*2.7+R%*5+( R%*(Po%+0.001)/(Py%+0.001))*4.6) +Cu%/0.3*4.1+Zn%/0.6*3.9)/100 S% =Sulphide % calc, R%= re-Py%
The bulk density for bulk material must have been measured by methods that adequately account
The Superior Lake Ltd geological team believes that the techniques used for measuring the rock density are compliant with the Canadian mining industry practices. The measured values have been confirmed by the mine production. Estimated (CSG) densities well correlates with measured densities (SG) (Fig. A3.8) and they are suitable for resource estimation. F
or p
erso
nal u
se o
nly

44
Criteria Explanation Commentary
for void spaces (vugs, porosity, etc), moisture and differences between rock and alteration zones within the deposit.
Fig. A3.8: Calculated density (CSG) vs measured density (SG)
Discuss assumptions for bulk density estimates used in the evaluation process of the different materials.
The density values have been estimated into the block model using ordinary kriging. This has allowed to obtain the more accurate local estimates of the densities, in particular in the high-grade areas
Classification The basis for the classification of the Mineral Resources
The blocks were classified as Indicated Resource if the block is located at the distance in the unfolded space approximately 40(X) x 40(Y)m from the nearest drillhole (Fig. A3.9).
y = 0.9267x + 0.2762R² = 0.7533
2.5
3
3.5
4
4.5
5
5.5
2.5 3 3.5 4 4.5 5 5.5
Cal
cula
ted
Measured
Pick-Winston SG/CSG Comparison
For
per
sona
l use
onl
y

45
Criteria Explanation Commentary
into varying confidence categories.
Other blocks, that were estimated by the pass-2 of kriging (Pick Lake: search radii 60x60x4m and minimum 1 samples) (Winston lake: search radii 60x60x6m and minimum 6 samples) and located outside of the 40x40m area were classified as Inferred.
Fig. A3.9: Longsection of the Pick Lake deposit showing distribution of the Indicated and Inferred resources
Whether appropriate account has been taken of all relevant factors (ie relative confidence
All relevant data and factors were taken into account for this resource estimation. This includes
• A good understanding of geology and the style of mineralisation;
• Geophysical data which is in accordance with the geological interpretation confirming continuity of mineralisation
• Geostatistically estimated grade and geology
• Geostatistically estimated (using conditional simulation) level of grade uncertainty and based on this, using an optimal drill spacings for classification of mineralisation as indicated resources
For
per
sona
l use
onl
y

46
Criteria Explanation Commentary
in tonnage/grade estimations, reliability of input data, confidence in continuity of geology and metal values, quality, quantity and distribution of the data).
Audits or reviews The results of any audits or reviews of Mineral Resource estimates.
An alternate resource estimation was completed in 2018 by independent consultant Mr Alfred Gillman, who used an inverse squared distance estimation methodology. The results are consistent with the reported tonnes and grade and support the 2019 Mineral Resource estimate.
Where appropriate a statement of the relative accuracy and confidence level in the Mineral Resource estimate using an approach or procedure deemed appropriate by the Competent Person. For example, the application of statistical or geostatistical procedures to
Confidence in this Mineral Resource estimate was assessed using conditional simulation technique (SGS method) applied to the data of the central part of the Lower Pick domain, which was prepared for production by developing the underground drives. The distribution of the drillhole in this area is approximately 35 x 35m grid. A 2D model was constructed for estimation uncertainty in estimated metal accumulations, GT-Zn m%. (GT denotes the product of Zn grade by horizontal thickness of the intersection). Two estimation errors were deduced from the SGS model, the global error for entire Lower Pick domain and local estimate. The latter was obtained for 50m panels drawn through the entire strike length of the Lower Pick domain (Fig. 10). These 50m panels correspond to approximately 1 year of the mine production, therefore the estimated error corresponds to uncertainty in the estimated annual production. Results of the SGS method are as follows: Average GT-Zn of the Lower Pick domain is estimated with an error +/- 7.7% (at 0.95 CL)
For
per
sona
l use
onl
y

47
Criteria Explanation Commentary
quantify the relative accuracy of the resource within stated confidence limits, or, if such an approach is not deemed appropriate, a qualitative discussion of the factors that could affect the relative accuracy and confidence of the estimate.
Average GT-Zn of the 50m panels (annual production) are estimated with an average error +/-14.6% (range 11.1 – 20.4%). These results were a basis for choosing a drill grid of approximately 30-40 x 30-40m grid as criteria for classification mineralisation as Indicated resource
The statement should specify whether it relates to global or local estimates, and, if local, state the relevant tonnages, which should be relevant to technical and economic evaluation. Documentation should include assumptions made
The obtained GT-Zn uncertainty relates to global and local estimates. Global estimate includes the central area of the Lower Pick domain that was essentially prepared for production (Fig. A3.10). Local estimates is made by 50m through the Lower Pick domain (Fig.A3.10). The panels represent approximately 1 year of the mine production.
For
per
sona
l use
onl
y

48
Criteria Explanation Commentary
and the procedures used.
Fig. A3.10: Longsection of the Lower Pick domain area showing errors in estimated GT-Zn m% values. Dots demote the drill hole intersections
These statements of relative accuracy and confidence of the estimate should be compared with production data, where available.
Not applicable – production data not yet available.
For
per
sona
l use
onl
y