ina group and ina - industrija nafte, d.d. 2018 ina... · ina - industrija nafte, d.d. content page...
TRANSCRIPT
INA GROUP and
INA - INDUSTRIJA NAFTE, d.d.
Consolidated and separate
Financial Statements for the year ended
31 December 2018
Together with Independent Auditors' Report
INA - INDUSTRIJA NAFTE, d.d.
Content
Page
Responsibility for the Financial Statements 1
Independent Auditors' Report 2
INA Group Consolidated Statement of Profit or Loss 8
INA Group Consolidated Statement of Other Comprehensive Income 9
INA, d.d. Separate Statement of Profit or Loss 10
INA, d.d. Separate Statement of Other Comprehensive Income 11
INA Group Consolidated Statement of Financial Position 12
INA, d.d. Separate Statement of Financial Position 14
INA Group Consolidated Statement of Changes in Equity 16
INA, d.d. Separate Statement of Changes in Equity 17
INA Group Consolidated Statement of Cash Flows 18
INA, d.d. Separate Statement of Cash Flows 20
Notes to Financial Statements 22
2
Ernst & Young d.o.o. Radnička cesta 50 10 000 Zagreb Hrvatska / Croatia MBS: 080435407 OIB: 58960122779 PDV br. / VAT no.: HR58960122779
Tel: +385 1 5800 800 Fax: +385 1 5800 888 www.ey.com/hr
Banka / Bank: Erste & Steiermärkische Bank d.d. Jadranski trg 3A, 51000 Rijeka, Hrvatska / Croatia IBAN: HR3324020061100280716 SWIFT: ESBCHR22
Independent auditor’s report
To the Shareholders of INA – Industrija Nafte, d.d.
Report on the audit of the separate and consolidated financial statements
Opinion
We have audited the separate financial statements of INA – Industrija Nafte, d.d. (“the Company”), and
consolidated financial statements of INA – Industrija Nafte, d.d. and it’s subsidiaries (together “the Group”), which comprise the separate and consolidated statement of financial position as at 31 December 2018, the
separate and consolidated statement of profit or loss and the separate and consolidated statement of other
comprehensive income, the separate and consolidated statement of changes in equity and the separate and
consolidated statement of cash flows for the year then ended, and notes to the separate and consolidated
financial statements, including a summary of significant accounting policies.
In our opinion, the accompanying separate and consolidated financial statements give a true and fair view of
the separate and consolidated financial position of the Company and Group as at 31 December 2018 and of
its separate and consolidated financial performance and its separate and consolidated cash flows for the year
then ended in accordance with International Financial Reporting Standards as adopted by EU (“IFRS as
adopted by EU”).
Basis for opinion
We conducted our audit in accordance with International Standards on Auditing (ISAs). Our responsibilities
under those standards are further described in the Auditor’s responsibilities for the audit of the separate and
consolidated financial statements section of our report.
We are independent of the Company and Group in accordance with the International Ethics Standards Board
for Accountants’ Code of Ethics for Professional Accountants (IESBA Code), and we have fulfilled our other
ethical responsibilities in accordance with these requirements and the IESBA Code.
We believe that the audit evidence we have obtained is sufficient and appropriate to provide a basis for our
opinion.
Key audit matters
Key audit matters are those matters that, in our professional judgment, were of most significance in our audit
of the separate and consolidated financial statements of the current period. These matters were addressed
in the context of our audit of the separate and consolidated financial statements as a whole, and in forming
our opinion thereon, and we do not provide a separate opinion on these matters. For each matter below, our
description of how our audit addressed the matter is provided in that context.
We have fulfilled the responsibilities described in the Auditor’s responsibilities for the audit of the separate
and consolidated financial statements section of our report, including in relation to these matters.
Accordingly, our audit included the performance of procedures designed to respond to our assessment of the
risks of material misstatement of the separate and consolidated financial statements. The results of our audit
procedures, including the procedures performed to address the matters below, provide the basis for our audit
opinion on the accompanying separate and consolidated financial statements.
3
Key Audit Matter How we addressed Key Audit Matter
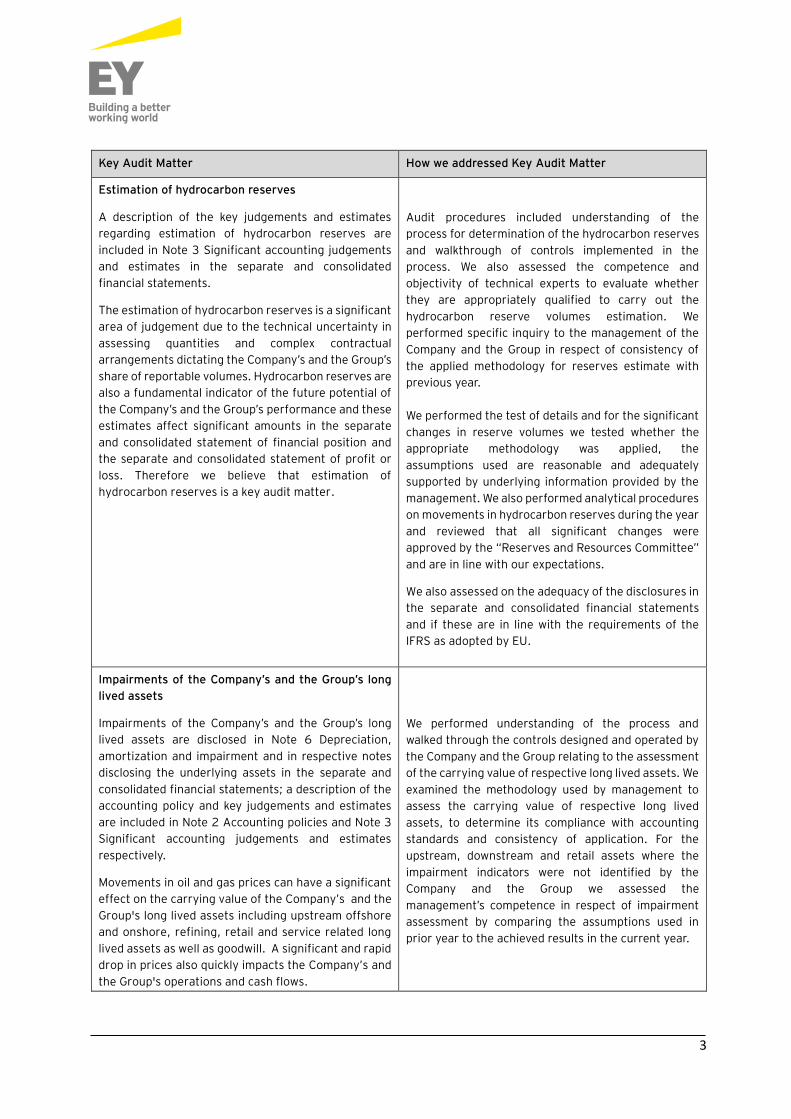
Estimation of hydrocarbon reserves
A description of the key judgements and estimates regarding estimation of hydrocarbon reserves are included in Note 3 Significant accounting judgements and estimates in the separate and consolidated financial statements.
The estimation of hydrocarbon reserves is a significant
area of judgement due to the technical uncertainty in assessing quantities and complex contractual arrangements dictating the Company’s and the Group’s share of reportable volumes. Hydrocarbon reserves are also a fundamental indicator of the future potential of the Company’s and the Group’s performance and these
estimates affect significant amounts in the separate
and consolidated statement of financial position and
the separate and consolidated statement of profit or
loss. Therefore we believe that estimation of
hydrocarbon reserves is a key audit matter.
Audit procedures included understanding of the process for determination of the hydrocarbon reserves and walkthrough of controls implemented in the process. We also assessed the competence and objectivity of technical experts to evaluate whether they are appropriately qualified to carry out the hydrocarbon reserve volumes estimation. We performed specific inquiry to the management of the Company and the Group in respect of consistency of the applied methodology for reserves estimate with previous year.
We performed the test of details and for the significant changes in reserve volumes we tested whether the appropriate methodology was applied, the assumptions used are reasonable and adequately supported by underlying information provided by the management. We also performed analytical procedures on movements in hydrocarbon reserves during the year and reviewed that all significant changes were approved by the “Reserves and Resources Committee” and are in line with our expectations.
We also assessed on the adequacy of the disclosures in
the separate and consolidated financial statements
and if these are in line with the requirements of the
IFRS as adopted by EU.
Impairments of the Company’s and the Group’s long lived assets
Impairments of the Company’s and the Group’s long lived assets are disclosed in Note 6 Depreciation, amortization and impairment and in respective notes disclosing the underlying assets in the separate and consolidated financial statements; a description of the accounting policy and key judgements and estimates are included in Note 2 Accounting policies and Note 3 Significant accounting judgements and estimates respectively.
Movements in oil and gas prices can have a significant
effect on the carrying value of the Company’s and the
Group's long lived assets including upstream offshore
and onshore, refining, retail and service related long
lived assets as well as goodwill. A significant and rapid
drop in prices also quickly impacts the Company’s and
the Group's operations and cash flows.
We performed understanding of the process and walked through the controls designed and operated by the Company and the Group relating to the assessment of the carrying value of respective long lived assets. We examined the methodology used by management to assess the carrying value of respective long lived assets, to determine its compliance with accounting standards and consistency of application. For the upstream, downstream and retail assets where the impairment indicators were not identified by the Company and the Group we assessed the management’s competence in respect of impairment assessment by comparing the assumptions used in prior year to the achieved results in the current year.
4
Key Audit Matter How we addressed Key Audit Matter
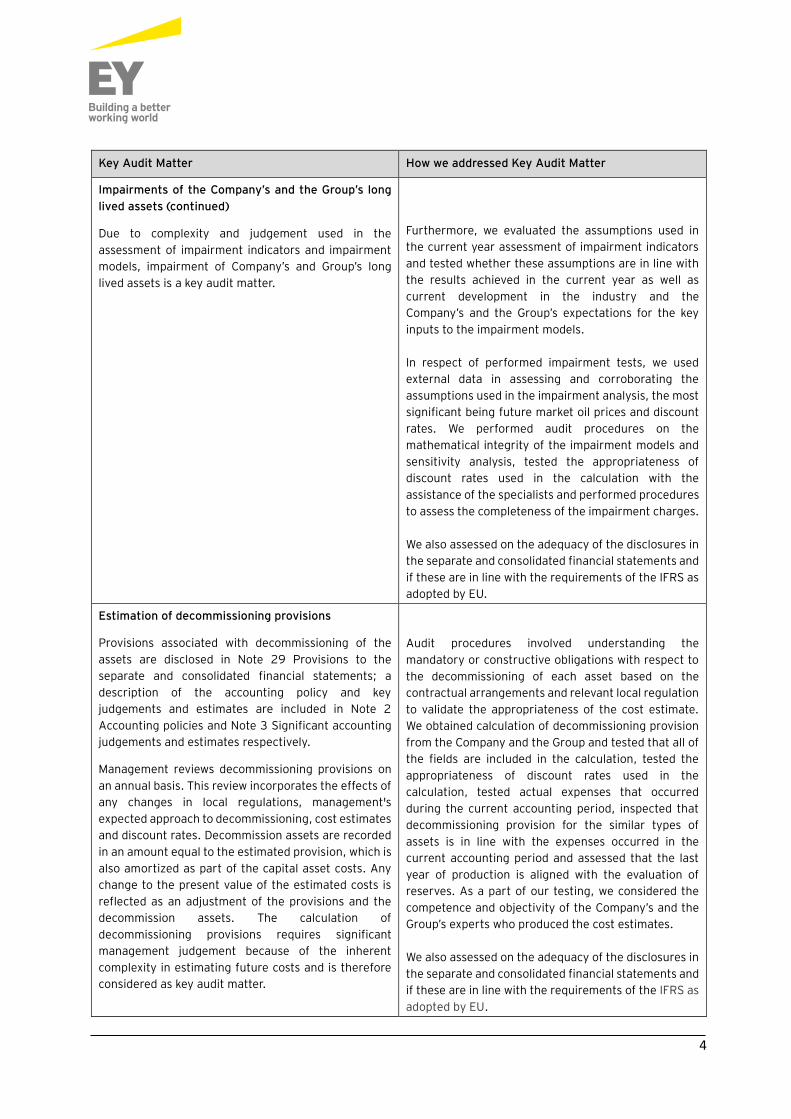
Impairments of the Company’s and the Group’s long lived assets (continued)
Due to complexity and judgement used in the assessment of impairment indicators and impairment models, impairment of Company’s and Group’s long lived assets is a key audit matter.
Furthermore, we evaluated the assumptions used in the current year assessment of impairment indicators and tested whether these assumptions are in line with the results achieved in the current year as well as current development in the industry and the Company’s and the Group’s expectations for the key inputs to the impairment models.
In respect of performed impairment tests, we used external data in assessing and corroborating the assumptions used in the impairment analysis, the most significant being future market oil prices and discount rates. We performed audit procedures on the mathematical integrity of the impairment models and sensitivity analysis, tested the appropriateness of discount rates used in the calculation with the assistance of the specialists and performed procedures to assess the completeness of the impairment charges.
We also assessed on the adequacy of the disclosures in the separate and consolidated financial statements and if these are in line with the requirements of the IFRS as adopted by EU.
Estimation of decommissioning provisions
Provisions associated with decommissioning of the assets are disclosed in Note 29 Provisions to the separate and consolidated financial statements; a description of the accounting policy and key judgements and estimates are included in Note 2 Accounting policies and Note 3 Significant accounting judgements and estimates respectively.
Management reviews decommissioning provisions on an annual basis. This review incorporates the effects of any changes in local regulations, management's expected approach to decommissioning, cost estimates and discount rates. Decommission assets are recorded in an amount equal to the estimated provision, which is also amortized as part of the capital asset costs. Any change to the present value of the estimated costs is reflected as an adjustment of the provisions and the decommission assets. The calculation of decommissioning provisions requires significant management judgement because of the inherent complexity in estimating future costs and is therefore considered as key audit matter.
Audit procedures involved understanding the mandatory or constructive obligations with respect to the decommissioning of each asset based on the contractual arrangements and relevant local regulation to validate the appropriateness of the cost estimate. We obtained calculation of decommissioning provision from the Company and the Group and tested that all of the fields are included in the calculation, tested the appropriateness of discount rates used in the calculation, tested actual expenses that occurred during the current accounting period, inspected that decommissioning provision for the similar types of assets is in line with the expenses occurred in the current accounting period and assessed that the last year of production is aligned with the evaluation of reserves. As a part of our testing, we considered the competence and objectivity of the Company’s and the Group’s experts who produced the cost estimates.
We also assessed on the adequacy of the disclosures in the separate and consolidated financial statements and if these are in line with the requirements of the IFRS as
adopted by EU.
5
Other information included in the Company’s and the Group’s Annual Report for year 2018
Management is responsible for the other information. Other information consists of the information included
in the Annual Report which includes the Management report, Corporate Governance Statement and Report
on payments to governments, other than the separate and consolidated financial statements and our
auditor’s report thereon. The Company’s and the Group’s 2018 Annual Report is expected to be made
available to us after the date of this auditor’s report.
Our opinion on the separate and consolidated financial statements does not cover the Other information and
we will not express any form of assurance conclusion thereon.
In connection with our audit of the separate and consolidated financial statements, our responsibility is to
read the other information when it becomes available and, in doing so, consider whether the other
information is materially inconsistent with the separate and consolidated financial statements or our
knowledge obtained in the audit or otherwise appears to be materially misstated.
Responsibilities of management and Audit Committee for the separate and consolidated financial
statements
Management is responsible for the preparation and fair presentation of the separate and consolidated
financial statements in accordance with IFRSs as adopted by EU, and for such internal control as management
determines is necessary to enable the preparation of the separate and consolidated financial statements that
are free from material misstatement, whether due to fraud or error.
In preparing the separate and consolidated financial statements, management is responsible for assessing
the Company’s and the Group’s ability to continue as a going concern, disclosing, as applicable, matters
related to going concern and using the going concern basis of accounting unless management either intends
to liquidate the Company and the Group or to cease operations, or has no realistic alternative but to do so.
Audit Committee is responsible for overseeing the Company’s and the Group’s financial reporting process.
Auditor’s responsibilities for the audit of the separate and consolidated financial statements
Our objectives are to obtain reasonable assurance about whether the separate and consolidated financial
statements as a whole are free from material misstatement, whether due to fraud or error, and to issue an
auditor’s report that includes our opinion. Reasonable assurance is a high level of assurance, but is not a
guarantee that an audit conducted in accordance with ISAs will always detect a material misstatement when
it exists. Misstatements can arise from fraud or error and are considered material if, individually or in the
aggregate, they could reasonably be expected to influence the economic decisions of users taken on the basis
of these separate and consolidated financial statements.
As part of an audit in accordance with ISAs, we exercise professional judgment and maintain professional
skepticism throughout the audit. We also:
Identify and assess the risks of material misstatement of the separate and consolidated financial
statements, whether due to fraud or error, design and perform audit procedures responsive to those
risks, and obtain audit evidence that is sufficient and appropriate to provide a basis for our opinion.
The risk of not detecting a material misstatement resulting from fraud is higher than for one resulting
6
from error, as fraud may involve collusion, forgery, intentional omissions, misrepresentations, or
the override of internal control.
Obtain an understanding of internal control relevant to the audit in order to design audit procedures
that are appropriate in the circumstances, but not for the purpose of expressing an opinion on the
effectiveness of the Company’s and the Group’s internal control.
Evaluate the appropriateness of accounting policies used and the reasonableness of accounting
estimates and related disclosures made by management.
Conclude on the appropriateness of management’s use of the going concern basis of accounting and,
based on the audit evidence obtained, whether a material uncertainty exists related to events or
conditions that may cast significant doubt on the Company’s and the Group’s ability to continue as a
going concern. If we conclude that a material uncertainty exists, we are required to draw attention
in our auditor’s report to the related disclosures in the separate and consolidated financial
statements or, if such disclosures are inadequate, to modify our opinion. Our conclusions are based
on the audit evidence obtained up to the date of our auditor’s report. However, future events or
conditions may cause the Company and the Group to cease to continue as a going concern.
Evaluate the overall presentation, structure and content of the separate and consolidated financial
statements, including the disclosures, and whether the separate and consolidated financial
statements represent the underlying transactions and events in a manner that achieves fair
presentation.
Obtain sufficient appropriate audit evidence regarding the financial information of the entities or
business activities within the Group to express an opinion on the consolidated financial statements.
We are responsible for the direction, supervision and performance of the group audit. We remain
solely responsible for our audit opinion.
We communicate with Audit Committee regarding, among other matters, the planned scope and timing of
the audit and significant audit findings, including any significant deficiencies in internal control that we
identify during our audit.
We also provide Audit Committee with a statement that we have complied with relevant ethical requirements
regarding independence, and to communicate with them all relationships and other matters that may
reasonably be thought to bear on our independence, and where applicable, related safeguards.
From the matters communicated with Audit Committee, we determine those matters that were of most
significance in the audit of the separate and consolidated financial statements of the current period and are
therefore the key audit matters. We describe these matters in our auditor’s report unless law or regulation precludes public disclosure about the matter or when, in extremely rare circumstances, we determine that a
matter should not be communicated in our report because the adverse consequences of doing so would
reasonably be expected to outweigh the public interest benefits of such communication.
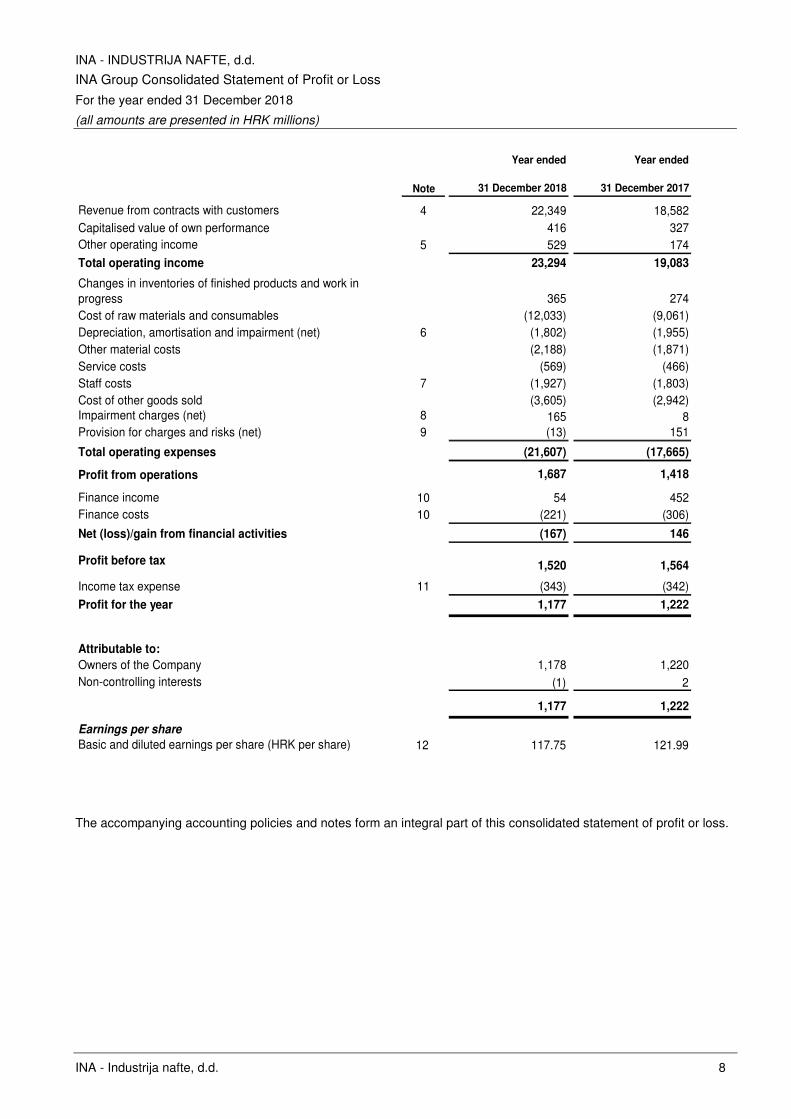
INA - INDUSTRIJA NAFTE, d.d.
INA Group Consolidated Statement of Profit or Loss
For the year ended 31 December 2018
(all amounts are presented in HRK millions)
INA - Industrija nafte, d.d. 8
Year ended Year ended
Note 31 December 2018 31 December 2017
Revenue from contracts with customers 4 22,349 18,582 Capitalised value of own performance 416 327Other operating income 5 529 174
Total operating income 23,294 19,083
Changes in inventories of finished products and work in progress 365 274Cost of raw materials and consumables (12,033) (9,061)Depreciation, amortisation and impairment (net) 6 (1,802) (1,955)Other material costs (2,188) (1,871)Service costs (569) (466)Staff costs 7 (1,927) (1,803)Cost of other goods sold (3,605) (2,942)Impairment charges (net) 8 165 8Provision for charges and risks (net) 9 (13) 151
Total operating expenses (21,607) (17,665)
Profit from operations 1,687 1,418
Finance income 10 54 452Finance costs 10 (221) (306)
Net (loss)/gain from financial activities (167) 146
Profit before tax 1,520 1,564
Income tax expense 11 (343) (342)
Profit for the year 1,177 1,222
Attributable to:
Owners of the Company 1,178 1,220Non-controlling interests (1) 2
1,177 1,222
Earnings per share
Basic and diluted earnings per share (HRK per share) 12 117.75 121.99
The accompanying accounting policies and notes form an integral part of this consolidated statement of profit or loss.
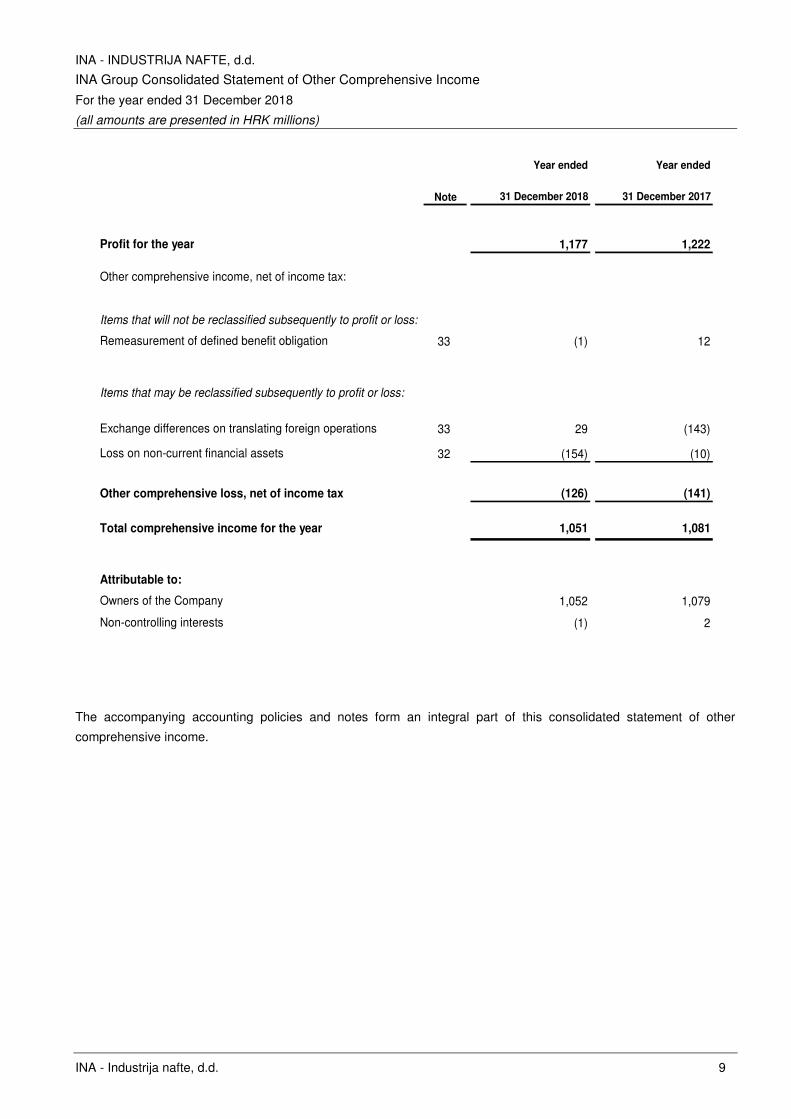
INA - INDUSTRIJA NAFTE, d.d.
INA Group Consolidated Statement of Other Comprehensive Income
For the year ended 31 December 2018
(all amounts are presented in HRK millions)
INA - Industrija nafte, d.d. 9
Year ended Year ended
Note 31 December 2018 31 December 2017
Profit for the year 1,177 1,222
Other comprehensive income, net of income tax:
Items that will not be reclassified subsequently to profit or loss:
Remeasurement of defined benefit obligation 33 (1) 12
Items that may be reclassified subsequently to profit or loss:
Exchange differences on translating foreign operations 33 29 (143)
Loss on non-current financial assets 32 (154) (10)
Other comprehensive loss, net of income tax (126) (141)
Total comprehensive income for the year 1,051 1,081
Attributable to:
Owners of the Company 1,052 1,079
Non-controlling interests (1) 2
The accompanying accounting policies and notes form an integral part of this consolidated statement of other
comprehensive income.
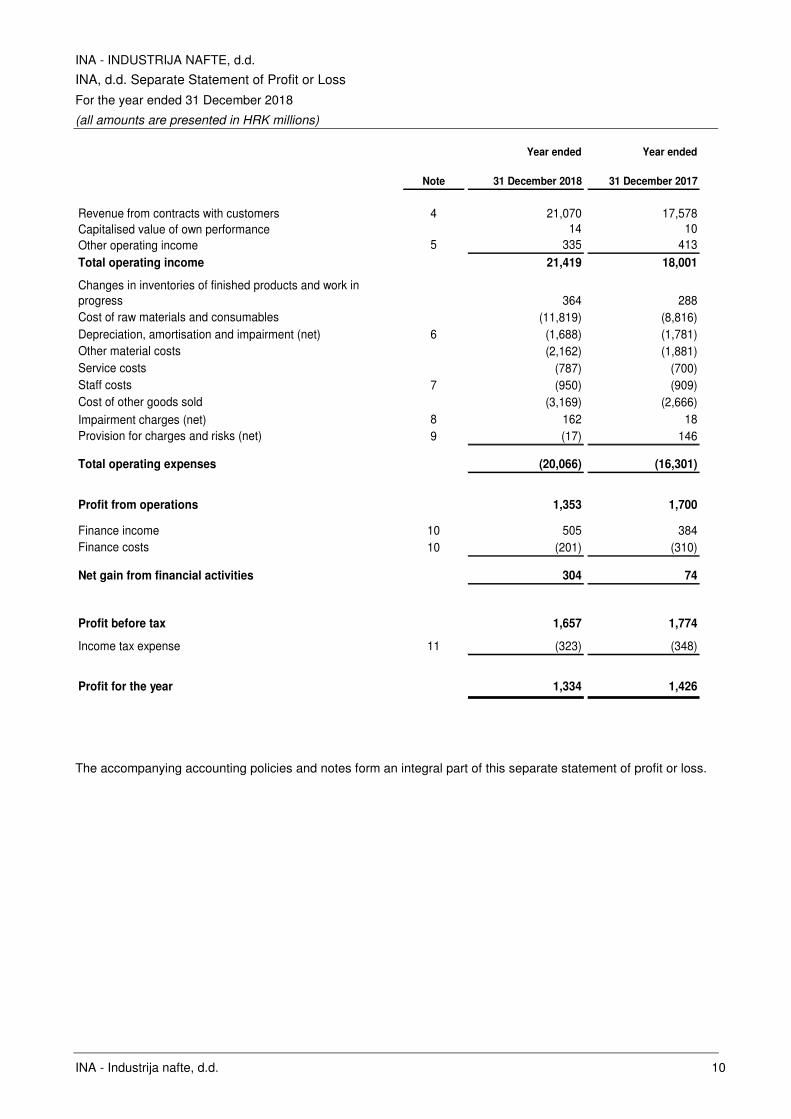
INA - INDUSTRIJA NAFTE, d.d.
INA, d.d. Separate Statement of Profit or Loss
For the year ended 31 December 2018
(all amounts are presented in HRK millions)
INA - Industrija nafte, d.d. 10
Year ended Year ended
Note 31 December 2018 31 December 2017
Revenue from contracts with customers 4 21,070 17,578 Capitalised value of own performance 14 10Other operating income 5 335 413
Total operating income 21,419 18,001
Changes in inventories of finished products and work in progress 364 288Cost of raw materials and consumables (11,819) (8,816)Depreciation, amortisation and impairment (net) 6 (1,688) (1,781)Other material costs (2,162) (1,881)Service costs (787) (700)Staff costs 7 (950) (909)Cost of other goods sold (3,169) (2,666)Impairment charges (net) 8 162 18Provision for charges and risks (net) 9 (17) 146
Total operating expenses (20,066) (16,301)
Profit from operations 1,353 1,700
Finance income 10 505 384Finance costs 10 (201) (310)
Net gain from financial activities 304 74
Profit before tax 1,657 1,774
Income tax expense 11 (323) (348)
Profit for the year 1,334 1,426
The accompanying accounting policies and notes form an integral part of this separate statement of profit or loss.
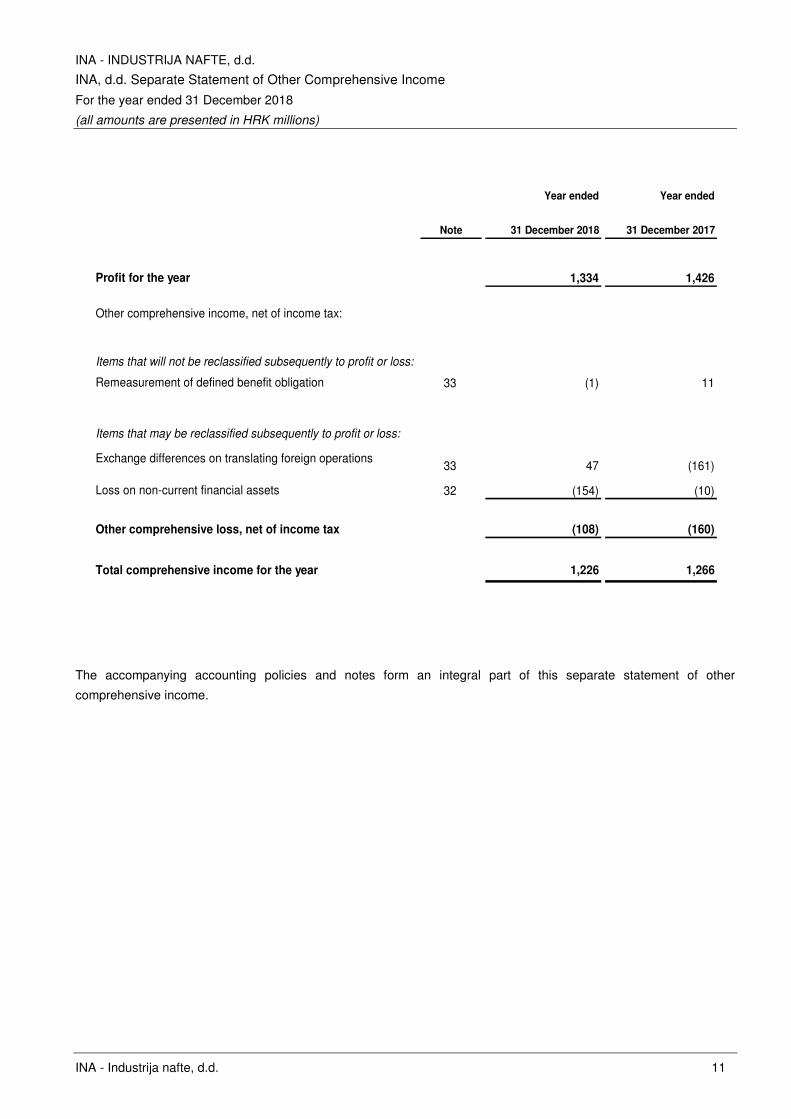
INA - INDUSTRIJA NAFTE, d.d.
INA, d.d. Separate Statement of Other Comprehensive Income
For the year ended 31 December 2018
(all amounts are presented in HRK millions)
INA - Industrija nafte, d.d. 11
Year ended Year ended
Note 31 December 2018 31 December 2017
Profit for the year 1,334 1,426
Other comprehensive income, net of income tax:
Items that will not be reclassified subsequently to profit or loss:
Remeasurement of defined benefit obligation 33 (1) 11
Items that may be reclassified subsequently to profit or loss:
Exchange differences on translating foreign operations33 47 (161)
Loss on non-current financial assets 32 (154) (10)
Other comprehensive loss, net of income tax (108) (160)
Total comprehensive income for the year 1,226 1,266
The accompanying accounting policies and notes form an integral part of this separate statement of other
comprehensive income.
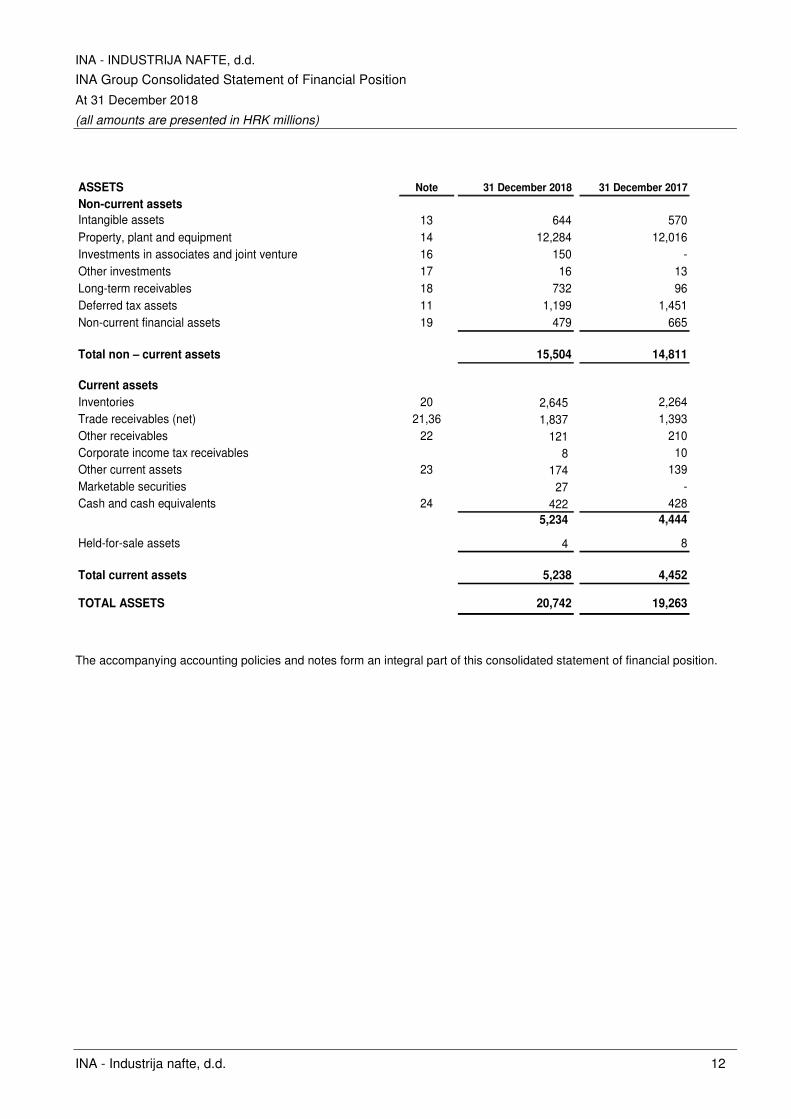
INA - INDUSTRIJA NAFTE, d.d.
INA Group Consolidated Statement of Financial Position
At 31 December 2018
(all amounts are presented in HRK millions)
INA - Industrija nafte, d.d. 12
ASSETS Note 31 December 2018 31 December 2017
Non-current assets
Intangible assets 13 644 570 Property, plant and equipment 14 12,284 12,016 Investments in associates and joint venture 16 150 -Other investments 17 16 13 Long-term receivables 18 732 96 Deferred tax assets 11 1,199 1,451 Non-current financial assets 19 479 665
Total non – current assets 15,504 14,811
Current assets
Inventories 20 2,645 2,264 Trade receivables (net) 21,36 1,837 1,393 Other receivables 22 121 210 Corporate income tax receivables 8 10 Other current assets 23 174 139 Marketable securities 27 -Cash and cash equivalents 24 422 428
5,234 4,444
Held-for-sale assets 4 8
Total current assets 5,238 4,452
TOTAL ASSETS 20,742 19,263
The accompanying accounting policies and notes form an integral part of this consolidated statement of financial position.
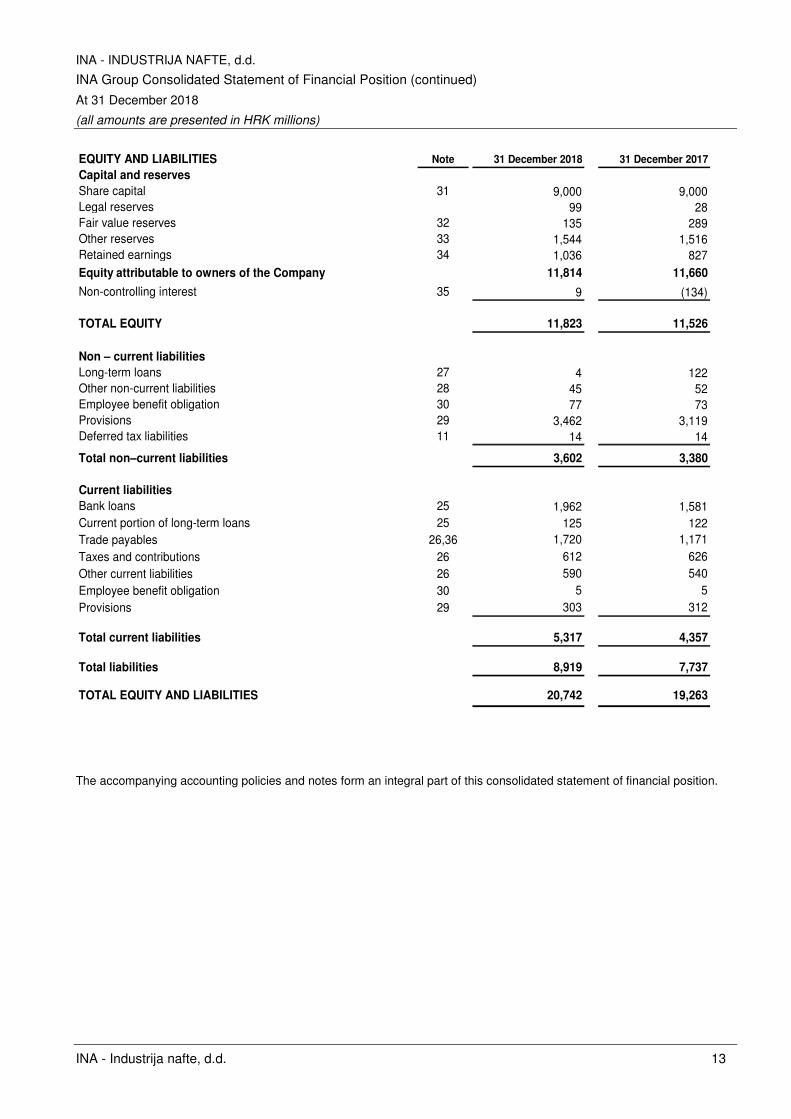
INA - INDUSTRIJA NAFTE, d.d.
INA Group Consolidated Statement of Financial Position (continued)
At 31 December 2018
(all amounts are presented in HRK millions)
INA - Industrija nafte, d.d. 13
EQUITY AND LIABILITIES Note 31 December 2018 31 December 2017
Capital and reserves
Share capital 31 9,000 9,000Legal reserves 99 28Fair value reserves 32 135 289Other reserves 33 1,544 1,516Retained earnings 34 1,036 827Equity attributable to owners of the Company 11,814 11,660
Non-controlling interest 35 9 (134)
TOTAL EQUITY 11,823 11,526
Non – current liabilities
Long-term loans 27 4 122Other non-current liabilities 28 45 52Employee benefit obligation 30 77 73Provisions 29 3,462 3,119Deferred tax liabilities 11 14 14
Total non–current liabilities 3,602 3,380
Current liabilities
Bank loans 25 1,962 1,581Current portion of long-term loans 25 125 122Trade payables 26,36 1,720 1,171Taxes and contributions 26 612 626Other current liabilities 26 590 540Employee benefit obligation 30 5 5Provisions 29 303 312
Total current liabilities 5,317 4,357
Total liabilities 8,919 7,737
TOTAL EQUITY AND LIABILITIES 20,742 19,263
The accompanying accounting policies and notes form an integral part of this consolidated statement of financial position.
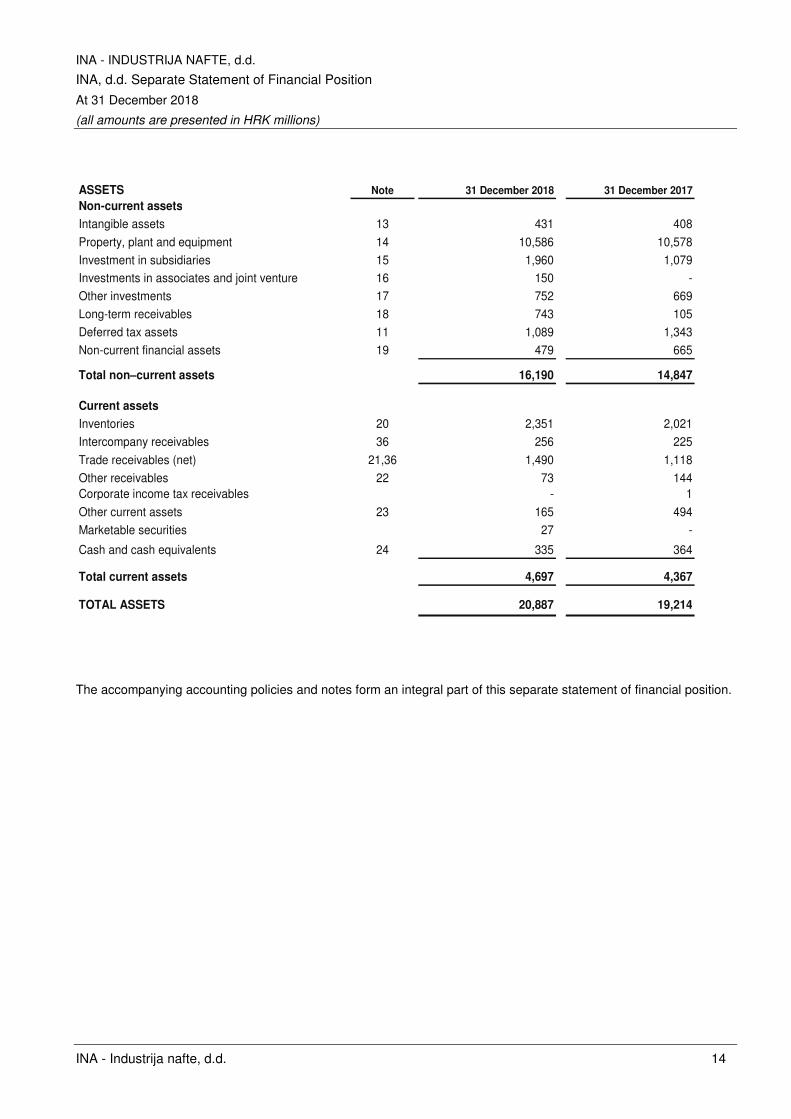
INA - INDUSTRIJA NAFTE, d.d.
INA, d.d. Separate Statement of Financial Position
At 31 December 2018
(all amounts are presented in HRK millions)
INA - Industrija nafte, d.d. 14
ASSETS Note 31 December 2018 31 December 2017
Non-current assets
Intangible assets 13 431 408
Property, plant and equipment 14 10,586 10,578
Investment in subsidiaries 15 1,960 1,079
Investments in associates and joint venture 16 150 -
Other investments 17 752 669
Long-term receivables 18 743 105
Deferred tax assets 11 1,089 1,343
Non-current financial assets 19 479 665
Total non–current assets 16,190 14,847
Current assets
Inventories 20 2,351 2,021
Intercompany receivables 36 256 225
Trade receivables (net) 21,36 1,490 1,118
Other receivables 22 73 144 Corporate income tax receivables - 1
Other current assets 23 165 494
Marketable securities 27 -
Cash and cash equivalents 24 335 364
Total current assets 4,697 4,367
TOTAL ASSETS 20,887 19,214
The accompanying accounting policies and notes form an integral part of this separate statement of financial position.
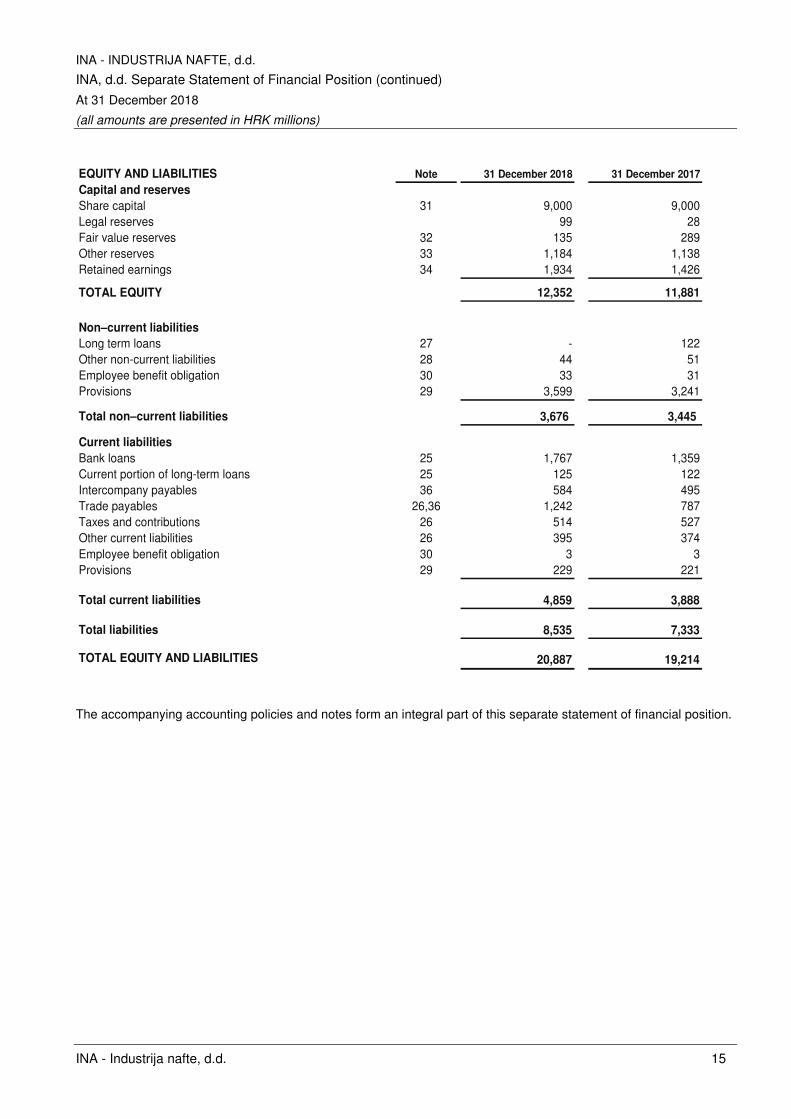
INA - INDUSTRIJA NAFTE, d.d.
INA, d.d. Separate Statement of Financial Position (continued)
At 31 December 2018
(all amounts are presented in HRK millions)
INA - Industrija nafte, d.d. 15
EQUITY AND LIABILITIES Note 31 December 2018 31 December 2017
Capital and reserves
Share capital 31 9,000 9,000 Legal reserves 99 28 Fair value reserves 32 135 289 Other reserves 33 1,184 1,138 Retained earnings 34 1,934 1,426
TOTAL EQUITY 12,352 11,881
Non–current liabilities
Long term loans 27 - 122 Other non-current liabilities 28 44 51 Employee benefit obligation 30 33 31 Provisions 29 3,599 3,241
Total non–current liabilities 3,676 3,445
Current liabilities
Bank loans 25 1,767 1,359 Current portion of long-term loans 25 125 122 Intercompany payables 36 584 495 Trade payables 26,36 1,242 787 Taxes and contributions 26 514 527 Other current liabilities 26 395 374 Employee benefit obligation 30 3 3 Provisions 29 229 221
Total current liabilities 4,859 3,888
Total liabilities 8,535 7,333
TOTAL EQUITY AND LIABILITIES 20,887 19,214
The accompanying accounting policies and notes form an integral part of this separate statement of financial position.
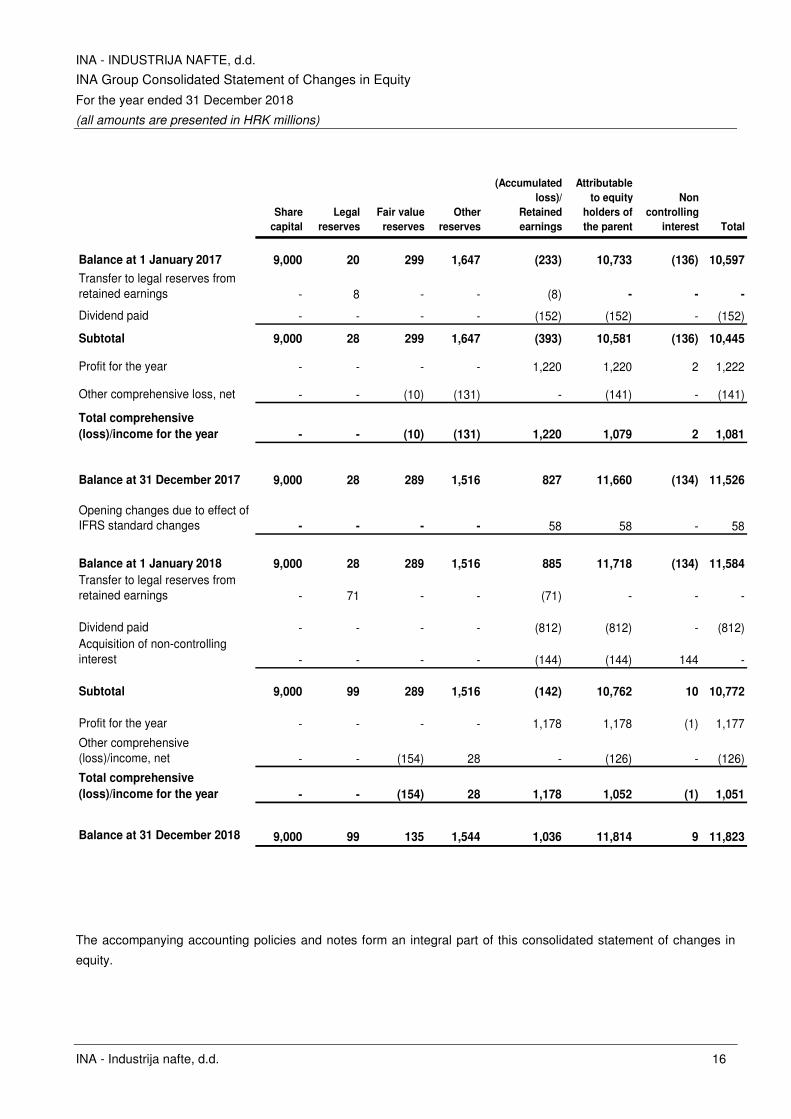
INA - INDUSTRIJA NAFTE, d.d.
INA Group Consolidated Statement of Changes in Equity
For the year ended 31 December 2018
(all amounts are presented in HRK millions)
INA - Industrija nafte, d.d. 16
Share
capital
Legal
reserves
Fair value
reserves
Other
reserves
(Accumulated
loss)/
Retained
earnings
Attributable
to equity
holders of
the parent
Non
controlling
interest Total
Balance at 1 January 2017 9,000 20 299 1,647 (233) 10,733 (136) 10,597
Transfer to legal reserves from retained earnings - 8 - - (8) - - -
Dividend paid - - - - (152) (152) - (152)
Subtotal 9,000 28 299 1,647 (393) 10,581 (136) 10,445
Profit for the year - - - - 1,220 1,220 2 1,222
Other comprehensive loss, net - - (10) (131) - (141) - (141)
Total comprehensive
(loss)/income for the year - - (10) (131) 1,220 1,079 2 1,081
Balance at 31 December 2017 9,000 28 289 1,516 827 11,660 (134) 11,526
Opening changes due to effect of IFRS standard changes - - - - 58 58 - 58
Balance at 1 January 2018 9,000 28 289 1,516 885 11,718 (134) 11,584
Transfer to legal reserves from retained earnings - 71 - - (71) - - -
Dividend paid - - - - (812) (812) - (812)Acquisition of non-controlling interest - - - - (144) (144) 144 -
Subtotal 9,000 99 289 1,516 (142) 10,762 10 10,772
Profit for the year - - - - 1,178 1,178 (1) 1,177
Other comprehensive (loss)/income, net - - (154) 28 - (126) - (126)
Total comprehensive
(loss)/income for the year - - (154) 28 1,178 1,052 (1) 1,051
Balance at 31 December 2018 9,000 99 135 1,544 1,036 11,814 9 11,823
The accompanying accounting policies and notes form an integral part of this consolidated statement of changes in
equity.
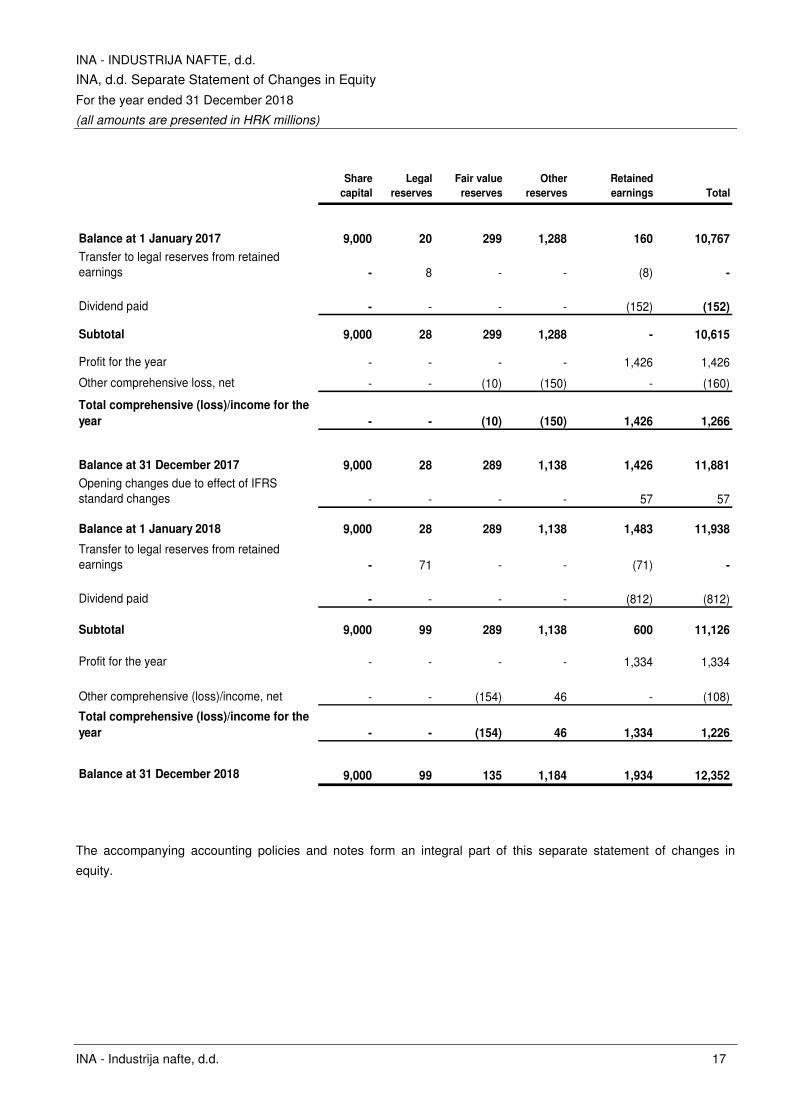
INA - INDUSTRIJA NAFTE, d.d.
INA, d.d. Separate Statement of Changes in Equity
For the year ended 31 December 2018
(all amounts are presented in HRK millions)
INA - Industrija nafte, d.d. 17
Share
capital
Legal
reserves
Fair value
reserves
Other
reserves
Retained
earnings Total
Balance at 1 January 2017 9,000 20 299 1,288 160 10,767
Transfer to legal reserves from retained earnings - 8 - - (8) -
Dividend paid - - - - (152) (152)
Subtotal 9,000 28 299 1,288 - 10,615
Profit for the year - - - - 1,426 1,426
Other comprehensive loss, net - - (10) (150) - (160)
Total comprehensive (loss)/income for the
year - - (10) (150) 1,426 1,266
Balance at 31 December 2017 9,000 28 289 1,138 1,426 11,881
Opening changes due to effect of IFRS standard changes - - - - 57 57
Balance at 1 January 2018 9,000 28 289 1,138 1,483 11,938
Transfer to legal reserves from retained earnings - 71 - - (71) -
Dividend paid - - - - (812) (812)
Subtotal 9,000 99 289 1,138 600 11,126
Profit for the year - - - - 1,334 1,334
Other comprehensive (loss)/income, net - - (154) 46 - (108)
Total comprehensive (loss)/income for the
year - - (154) 46 1,334 1,226
Balance at 31 December 2018 9,000 99 135 1,184 1,934 12,352
The accompanying accounting policies and notes form an integral part of this separate statement of changes in
equity.
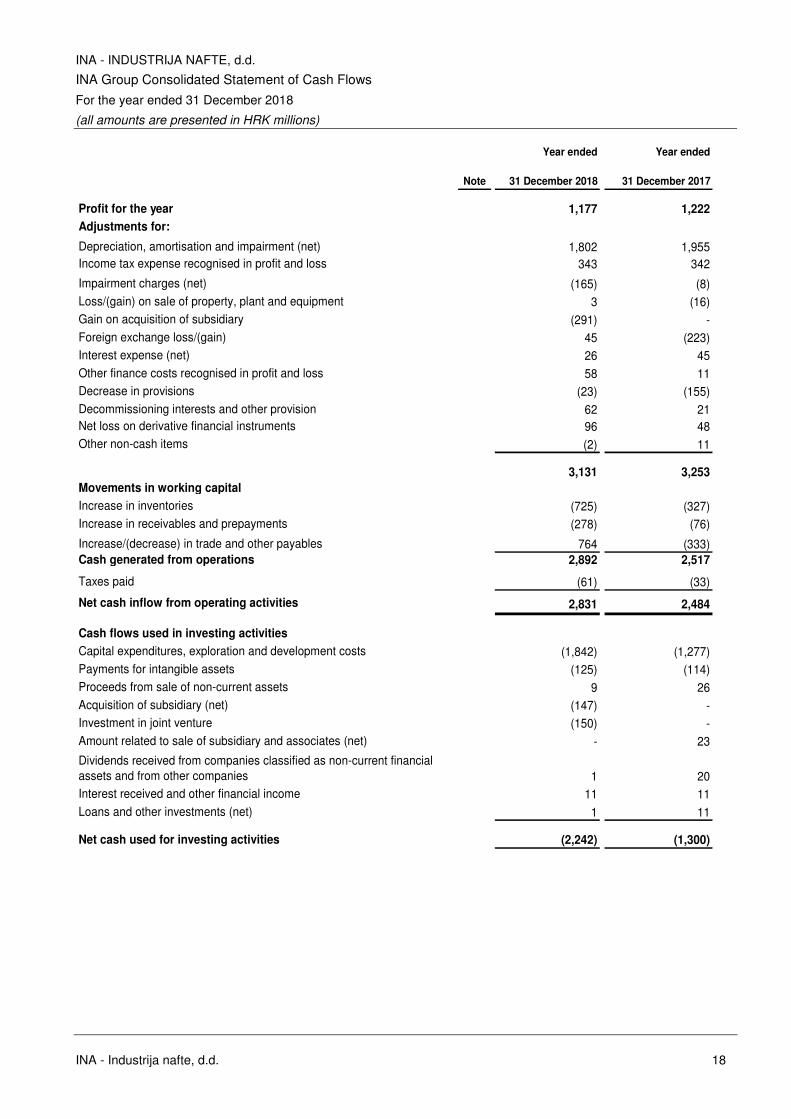
INA - INDUSTRIJA NAFTE, d.d.
INA Group Consolidated Statement of Cash Flows
For the year ended 31 December 2018
(all amounts are presented in HRK millions)
INA - Industrija nafte, d.d. 18
Year ended Year ended
Note 31 December 2018 31 December 2017
Profit for the year 1,177 1,222
Adjustments for:
Depreciation, amortisation and impairment (net) 1,802 1,955Income tax expense recognised in profit and loss 343 342
Impairment charges (net) (165) (8)Loss/(gain) on sale of property, plant and equipment 3 (16)Gain on acquisition of subsidiary (291) -Foreign exchange loss/(gain) 45 (223)Interest expense (net) 26 45Other finance costs recognised in profit and loss 58 11Decrease in provisions (23) (155)Decommissioning interests and other provision 62 21Net loss on derivative financial instruments 96 48Other non-cash items (2) 11
3,131 3,253
Movements in working capital
Increase in inventories (725) (327)Increase in receivables and prepayments (278) (76)
Increase/(decrease) in trade and other payables 764 (333)Cash generated from operations 2,892 2,517
Taxes paid (61) (33)
Net cash inflow from operating activities 2,831 2,484
Cash flows used in investing activities
Capital expenditures, exploration and development costs (1,842) (1,277)Payments for intangible assets (125) (114)Proceeds from sale of non-current assets 9 26Acquisition of subsidiary (net) (147) -Investment in joint venture (150) -Amount related to sale of subsidiary and associates (net) - 23
Dividends received from companies classified as non-current financial assets and from other companies 1 20Interest received and other financial income 11 11Loans and other investments (net) 1 11
Net cash used for investing activities (2,242) (1,300)
INA - INDUSTRIJA NAFTE, d.d.
INA Group Consolidated Statement of Cash Flows (continued)
For the year ended 31 December 2018
(all amounts are presented in HRK millions)
INA - Industrija nafte, d.d. 19
Year ended Year ended
Note 31 December 2018 31 December 2017
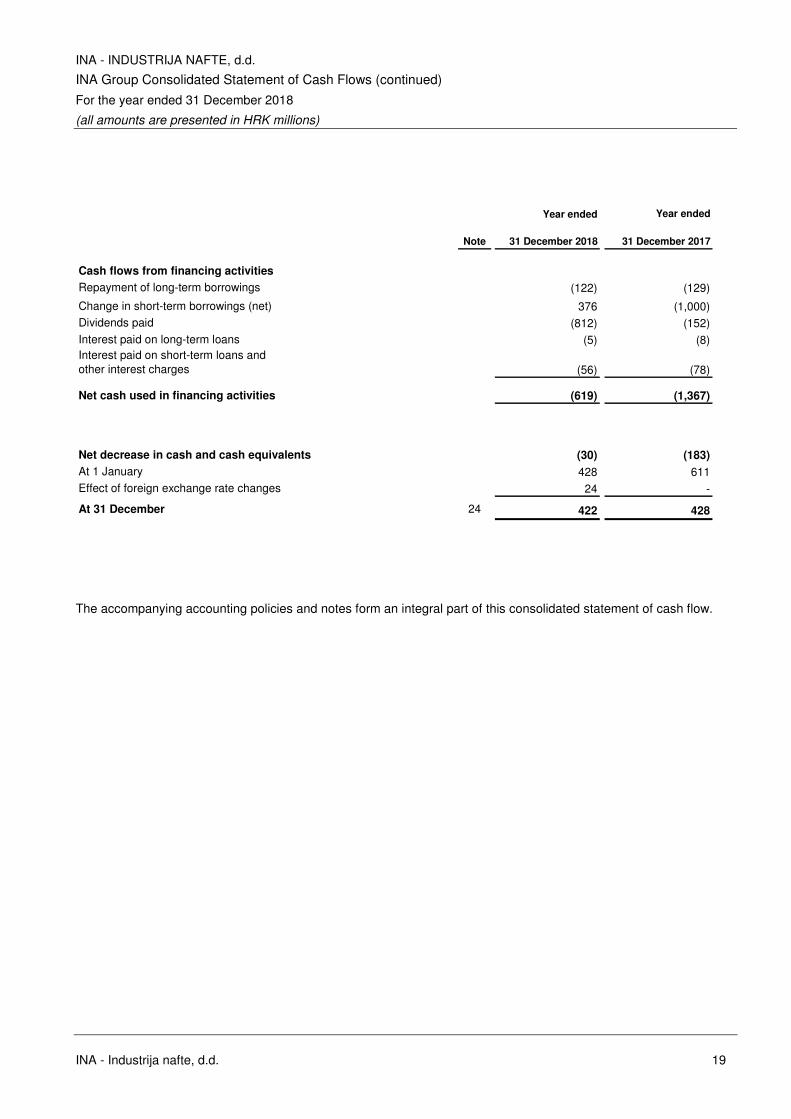
Cash flows from financing activities
Repayment of long-term borrowings (122) (129)
Change in short-term borrowings (net) 376 (1,000)Dividends paid (812) (152)Interest paid on long-term loans (5) (8)Interest paid on short-term loans and other interest charges (56) (78)
Net cash used in financing activities (619) (1,367)
Net decrease in cash and cash equivalents (30) (183)
At 1 January 428 611Effect of foreign exchange rate changes 24 -
At 31 December 24 422 428
The accompanying accounting policies and notes form an integral part of this consolidated statement of cash flow.
INA - INDUSTRIJA NAFTE, d.d.
INA, d.d. Separate Statement of Cash Flows
For the year ended 31 December 2018
(all amounts are presented in HRK millions)
INA - Industrija nafte, d.d. 20
Year ended Year ended
Note 31 December 2018 31 December 2017
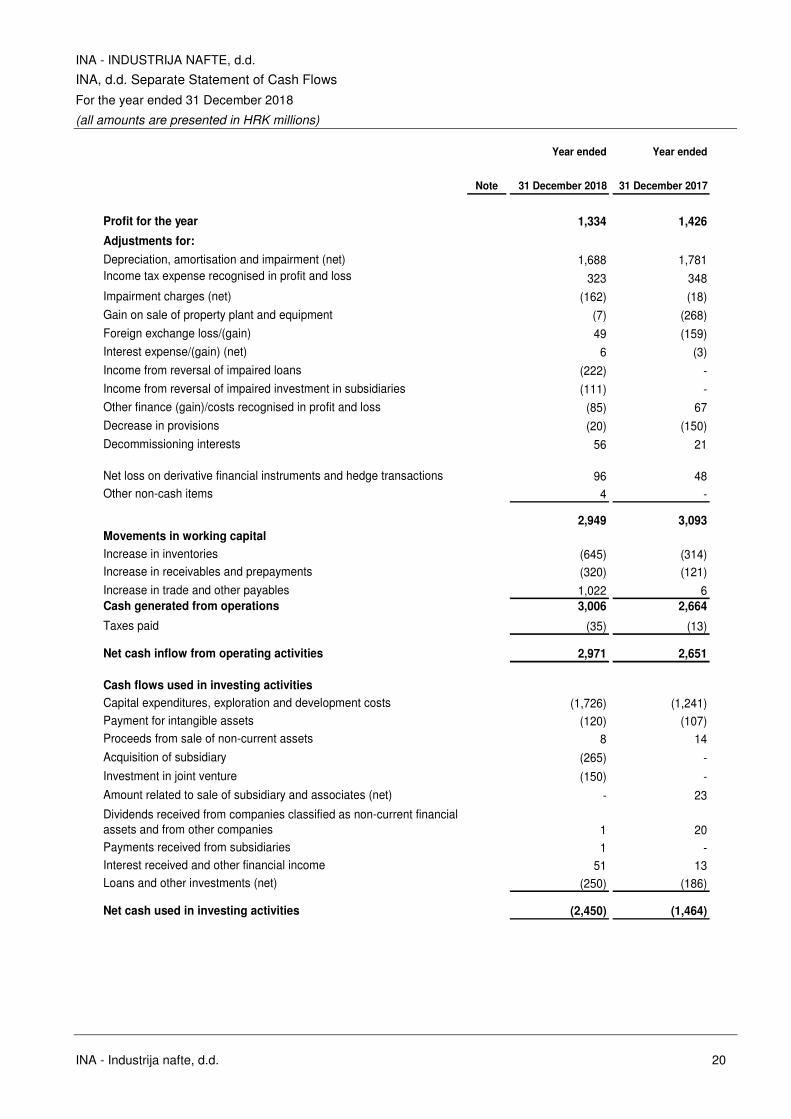
Profit for the year 1,334 1,426
Adjustments for:
Depreciation, amortisation and impairment (net) 1,688 1,781Income tax expense recognised in profit and loss 323 348Impairment charges (net) (162) (18)
Gain on sale of property plant and equipment (7) (268)
Foreign exchange loss/(gain) 49 (159)Interest expense/(gain) (net) 6 (3)
Income from reversal of impaired loans (222) -
Income from reversal of impaired investment in subsidiaries (111) -Other finance (gain)/costs recognised in profit and loss (85) 67
Decrease in provisions (20) (150)
Decommissioning interests 56 21
Net loss on derivative financial instruments and hedge transactions 96 48Other non-cash items 4 -
2,949 3,093
Movements in working capital
Increase in inventories (645) (314)Increase in receivables and prepayments (320) (121)
Increase in trade and other payables 1,022 6Cash generated from operations 3,006 2,664
Taxes paid (35) (13)
Net cash inflow from operating activities 2,971 2,651
Cash flows used in investing activities
Capital expenditures, exploration and development costs (1,726) (1,241)Payment for intangible assets (120) (107)Proceeds from sale of non-current assets 8 14
Acquisition of subsidiary (265) -
Investment in joint venture (150) -
Amount related to sale of subsidiary and associates (net) - 23
Dividends received from companies classified as non-current financial assets and from other companies 1 20Payments received from subsidiaries 1 -Interest received and other financial income 51 13Loans and other investments (net) (250) (186)
Net cash used in investing activities (2,450) (1,464)
INA - INDUSTRIJA NAFTE, d.d.
INA, d.d. Separate Statement of Cash Flows (continued)
For the year ended 31 December 2018
(all amounts are presented in HRK millions)
INA - Industrija nafte, d.d. 21
Year ended Year ended
Note 31 December 2018 31 December 2017
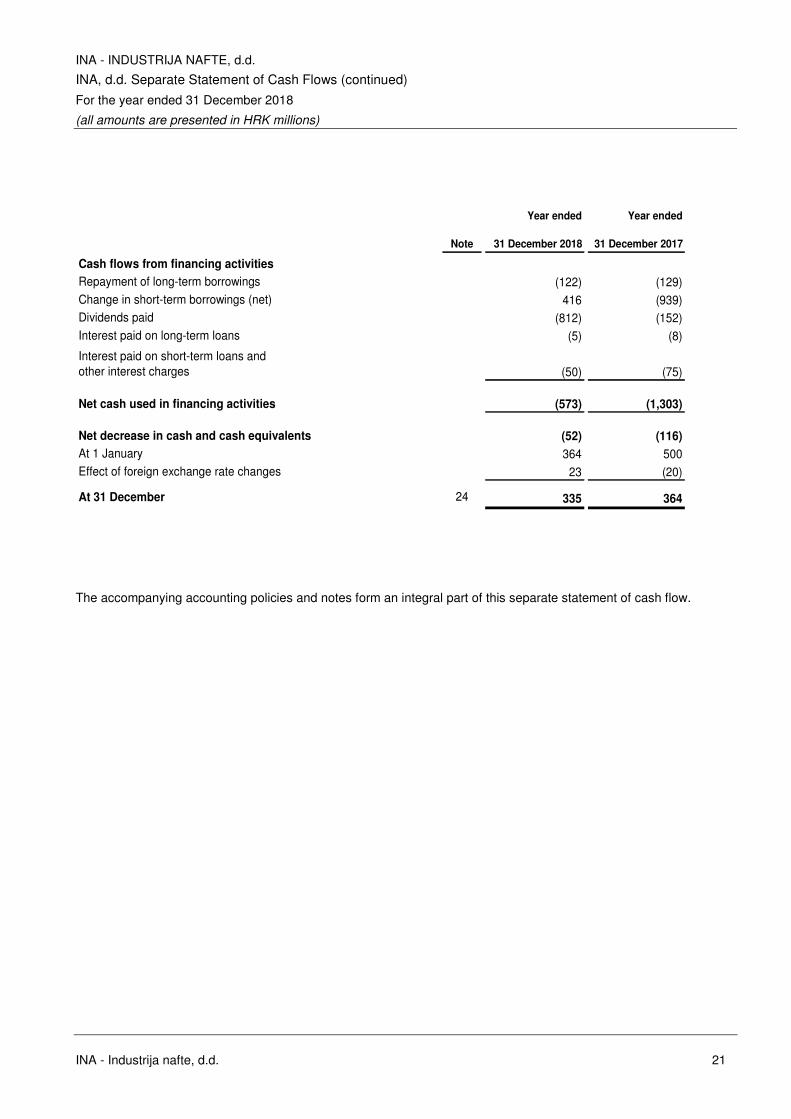
Cash flows from financing activities
Repayment of long-term borrowings (122) (129)Change in short-term borrowings (net) 416 (939)Dividends paid (812) (152)Interest paid on long-term loans (5) (8)
Interest paid on short-term loans and other interest charges (50) (75)
Net cash used in financing activities (573) (1,303)
Net decrease in cash and cash equivalents (52) (116)
At 1 January 364 500Effect of foreign exchange rate changes 23 (20)
At 31 December 24 335 364
The accompanying accounting policies and notes form an integral part of this separate statement of cash flow.
INA - INDUSTRIJA NAFTE, d.d.
Notes to the financial statements
For the year ended 31 December 2018
(all amounts are presented in HRK millions)
INA - Industrija nafte, d.d. 22
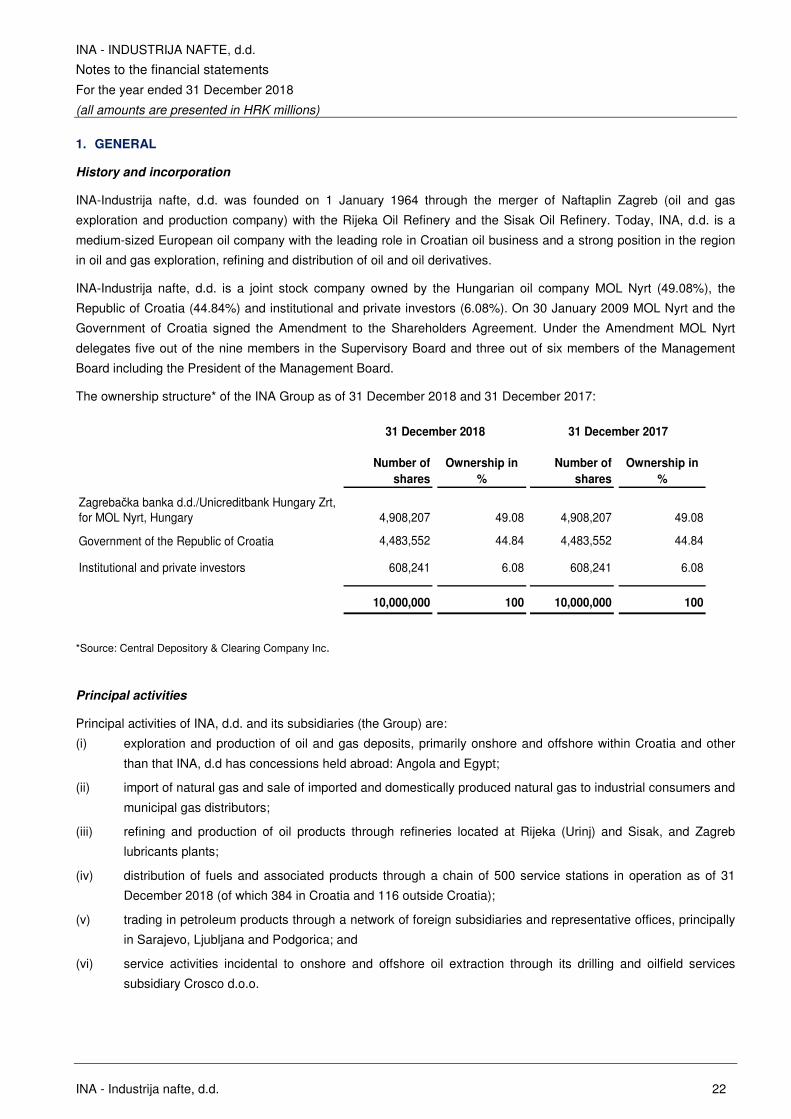
1. GENERAL
History and incorporation
INA-Industrija nafte, d.d. was founded on 1 January 1964 through the merger of Naftaplin Zagreb (oil and gas
exploration and production company) with the Rijeka Oil Refinery and the Sisak Oil Refinery. Today, INA, d.d. is a
medium-sized European oil company with the leading role in Croatian oil business and a strong position in the region
in oil and gas exploration, refining and distribution of oil and oil derivatives.
INA-Industrija nafte, d.d. is a joint stock company owned by the Hungarian oil company MOL Nyrt (49.08%), the
Republic of Croatia (44.84%) and institutional and private investors (6.08%). On 30 January 2009 MOL Nyrt and the
Government of Croatia signed the Amendment to the Shareholders Agreement. Under the Amendment MOL Nyrt
delegates five out of the nine members in the Supervisory Board and three out of six members of the Management
Board including the President of the Management Board.
The ownership structure* of the INA Group as of 31 December 2018 and 31 December 2017:
Number of
shares
Ownership in
%
Number of
shares
Ownership in
%
Zagrebačka banka d.d./Unicreditbank Hungary Zrt, for MOL Nyrt, Hungary 4,908,207 49.08 4,908,207 49.08
Government of the Republic of Croatia 4,483,552 44.84 4,483,552 44.84
Institutional and private investors 608,241 6.08 608,241 6.08
10,000,000 100 10,000,000 100
31 December 2018 31 December 2017
*Source: Central Depository & Clearing Company Inc.
Principal activities
Principal activities of INA, d.d. and its subsidiaries (the Group) are:
(i) exploration and production of oil and gas deposits, primarily onshore and offshore within Croatia and other
than that INA, d.d has concessions held abroad: Angola and Egypt;
(ii) import of natural gas and sale of imported and domestically produced natural gas to industrial consumers and
municipal gas distributors;
(iii) refining and production of oil products through refineries located at Rijeka (Urinj) and Sisak, and Zagreb
lubricants plants;
(iv) distribution of fuels and associated products through a chain of 500 service stations in operation as of 31
December 2018 (of which 384 in Croatia and 116 outside Croatia);
(v) trading in petroleum products through a network of foreign subsidiaries and representative offices, principally
in Sarajevo, Ljubljana and Podgorica; and
(vi) service activities incidental to onshore and offshore oil extraction through its drilling and oilfield services
subsidiary Crosco d.o.o.
INA - INDUSTRIJA NAFTE, d.d.
Notes to the financial statements (continued)
For the year ended 31 December 2018
(all amounts are presented in HRK millions)
INA - Industrija nafte, d.d. 23
1. GENERAL (CONTINUED)
The Group has dominant positions in Croatia over oil and gas exploration and production, oil refining, and the sale of
gas and petroleum products. INA, d.d. also holds an 11.795% interest in JANAF d.d., the company that owns and
operates the Adria pipeline system.
Headquarter of the Group is located in Zagreb, Avenija V. Holjevca 10, Croatia. As at 31 December 2018 there were
10,842 employees at the Group (10,782 as at 31 December 2017). As at 31 December 2018 there were 4,138
employees at INA, d.d. (4,292 as at 31 December 2017).
The Group comprises a number of wholly and partially owned subsidiaries operating largely within the Republic of
Croatia. Foreign subsidiaries include a number of trading subsidiaries that generally act as distributors of INA Group
products and as representative offices within their local markets.
Supervisory Board, Management Board and Council of Directors
Supervisory Board
Supervisory Board since 14 June 2017 until 18 December 2020
Damir Vanđelić President of the Supervisory Board
József Molnár Vice President of the Supervisory Board
Luka Burilović Member of the Supervisory Board
Szabolcs I. Ferencz
Ferenc Horváth
Member of the Supervisory Board
Member of the Supervisory Board
Damir Mikuljan Member of the Supervisory Board
József Simola Member of the Supervisory Board
László Uzsoki Member of the Supervisory Board
Jasna Pipunić Representative of employees in the Supervisory Board
Management Board
Management Board since 1 July 2018 until 30 June 2021
Sándor Fasimon
Niko Dalić
President of the Management Board
Member of the Management Board
Ivan Krešić
Davor Mayer
Member of the Management Board
Member of the Management Board
Zsolt Pethő
Dr Ákos Székely
Member of the Management Board
Member of the Management Board
Council of Directors
Council of Directors appointed by the decision of the Management Board since 1 December 2018 until recall
Gábor Horváth
Darko Markotić
Chief Financial Officer
Operating Director of Consumer Services and Retail;
Acting Operating Director of Industrial Services
Stjepan Nikolić
Tvrtko Perković
Operating Director of Refining and Marketing
Operating Director of Exploration and Production
INA - INDUSTRIJA NAFTE, d.d.
Notes to the financial statements (continued)
For the year ended 31 December 2018
(all amounts are presented in HRK millions)
INA - Industrija nafte, d.d. 24
2. ACCOUNTING POLICIES
The principal accounting policies applied in the preparation of these consolidated and separate financial statements
are set out below. These policies have been consistently applied to all the years presented, unless otherwise stated.
Presentation of the financial statements
These consolidated and separate financial statements are prepared on the consistent presentation and classification
basis. When the presentation or classification of items in the consolidated and separate financial statements is
amended, comparative amounts are reclassified unless the reclassification is impracticable.
The Company’s and the Group’s financial statements are prepared in millions of HRK, which is the Company’s
functional currency.
Basis of accounting
The Company maintains its accounting records in Croatian language, in Croatian kuna, in accordance with Croatian
law and the accounting principles and practices observed by enterprises in Croatia. The accounting records of the
Company's subsidiaries in Croatia and abroad are maintained in accordance with the requirements of the respective
local jurisdictions.
The Company’s and the Group’s financial statements are prepared under the historical cost convention, modified by
the revaluation of certain assets and liabilities under conditions of hyperinflation in the period to 1993 and except for
certain financial instruments that are measured at fair values at the end of each reporting period, and in accordance
with International Financial Reporting Standards as adopted by European Union (EU).
Historical cost is generally based on the fair value of the consideration given in exchange for goods and services.
Fair value is the price that would be received to sell an asset or paid to transfer a liability in an orderly transaction
between market participants at the measurement date, regardless of whether that price is directly observable or
estimated using another valuation technique. In estimating the fair value of an asset or a liability, the Group takes into
account the characteristics of the asset or liability if market participants would consider those characteristics when
pricing the asset or liability at the measurement date. Fair value for measurement and/or disclosure purposes in these
consolidated financial statements is determined on such a basis, except for leasing transactions that are within the
scope of IAS 17, and measurements that have some similarities to fair value but are not fair value, such as net
realisable value in IAS 2 or value in use in IAS 36.
Adoption of new and revised International Financial Reporting Standards
Standards and Interpretations effective in the current period
The following new standards and amendments to the existing standards issued by the International Accounting
Standards Board (IASB) and interpretations issued by the International Financial Reporting Interpretations Committee
and adopted by the EU are effective for the current period:
• IFRIC Interpretation 22: Foreign currency transaction and advance consideration, issued on 8 December
2016 (effective date for annual reporting periods beginning on or after 1 January 2018).
• Amendments to IAS 40: Transfers of investment property, issued on 8 December 2016 (effective date for
annual reporting periods beginning on or after 1 January 2018).
INA - INDUSTRIJA NAFTE, d.d.
Notes to the financial statements (continued)
For the year ended 31 December 2018
(all amounts are presented in HRK millions)
INA - Industrija nafte, d.d. 25
2. ACCOUNTING POLICIES (CONTINUED)
Adoption of new and revised International Financial Reporting Standards (continued)
Standards and Interpretations effective in the current period (continued)
• Amendments to IFRS 2: Classification and measurement of share-based payment transactions, issued on 20
June 2016 and adopted in EU 26 February 2018 (effective date for annual periods beginning on or after 1
January 2018).
• IFRS 9 Financial Instruments, issued in July 2014 the final version that replaced the IAS 39 Financial
Instruments: Recognition and Measurement, adopted in EU on 22 November 2016 (effective for annual periods
beginning on or after 1 January 2018).
• Amendments to IFRS 4: Applying IFRS 9 Financial Instruments with IFRS 4 Insurance Contracts issued in
September 2016 and adopted in EU 3 November 2017 (effective date for annual periods beginning on or after
1 January 2018).
• IFRS 15 Revenue from Contracts with Customers, issued in May 2014, including amendment to IFRS 15.
Effective dates of IFRS 15, adopted in EU 22 September 2016 and Clarifications to IFRS 15 Revenue from
Contracts with Customers, issued in April 2016 and adopted in EU on 31 October 2017 (effective date for
annual periods beginning on or after 1 January 2018).
The adoption of these Standards and Interpretations had no significant impact on the financial statements of the
Company and the Group. New standards are applied but comparative information has not been restated (e.g.
recognising the cumulative effect of applying new standards in the opening balance of equity).
Standards and Interpretations issued by IASB and adopted by the EU but not yet effective
At the date of authorization of these financial statements the following standards, revisions and interpretations
adopted by the EU were in issue but not yet effective:
• IFRS 16 Leases, issued in January 2016 replaces accounting treatment for leases and is a major revision of
the way in which companies account for leases, adopted in EU on 31 October 2017 (effective date for annual
periods beginning on or after 1 January 2019). The standard will affect primarily the accounting for the
Companies and the Group operating leases. During 2018, the Company and the Group have performed a
detailed impact assessment of IFRS 16 based on review of valid contracts. Estimated impact of IFRS 16
transition on the Company is HRK 380 million and the Group level is around HRK 160 million in terms of
increased lease liability and leased assets. The Company and the Group will elect to use the exemptions
proposed by the standard on lease contracts for which the lease terms ends within 12 months as of the date of
initial application, and lease contracts for which the underlying asset is of low value. The Company and the
Group has leases of certain office equipment (i.e. personal computers, printing and photocopying machines)
that are considered of low value.
INA - INDUSTRIJA NAFTE, d.d.
Notes to the financial statements (continued)
For the year ended 31 December 2018
(all amounts are presented in HRK millions)
INA - Industrija nafte, d.d. 26
2. ACCOUNTING POLICIES (CONTINUED)
Adoption of new and revised International Financial Reporting Standards (continued)
Standards and Interpretations issued by IASB and adopted by the EU but not yet effective (continued)
• IFRIC Interpretation 23: Uncertainty over Income Tax Treatments, issued on 7 June 2017 (effective date for
annual reporting periods beginning on or after 1 January 2019).
• Amendments to IFRS 9: Prepayment features with negative compensation, issued on 12 October 2017
(effective date for annual periods beginning on or after 1 January 2019).
• Amendments to IAS 28: Long-term interests in associates and joint ventures, issued on 12 October 2017
(effective date for annual periods beginning on or after 1 January 2019).
The Group does not anticipate that the adoption of these Standards and Interpretations will have a significant impact
on the financial statements of the Company and the Group, except for the above-mentioned impact of adoption IFRS
16.
Standards and Interpretations issued by IASB but not yet adopted by the EU
At the date of authorization of these financial statements the following standards, revisions and interpretations were in
issue by the International Accounting Standards Board but not yet adopted by the EU. The endorsement might be
expected in 2019:
• IFRS 17: Insurance contracts, issued on 18 May 2017 to achieve the goal of a consistent, principle-based
accounting for insurance contracts (effective date for annual periods beginning on or after 1 January 2021).
• Annual Improvements Amendments to IAS 19: Plan Amendment, Curtailment or Settlement, issued on 7
February 2018 (effective date for annual periods beginning on or after 1 January 2019).
• Amendments to References to the Conceptual Framework in IFRS Standards, issued on 29 March 2018
(effective date for annual periods beginning on or after 1 January 2020).
• Amendment to IFRS 3: Business Combinations, issued on 22 October 2018 (effective date for annual periods
beginning on or after 1 January 2020).
• Amendments to IAS 1 and IAS 8: Definition of Material, issued on 31 October 2018 (effective date for annual
periods beginning on or after 1 January 2020).
• Annual Improvements to IFRS Standards 2015-2017 Cycle, issued on 12 December 2017 (effective date for
annual periods beginning on or after 1 January 2019).
INA - INDUSTRIJA NAFTE, d.d.
Notes to the financial statements (continued)
For the year ended 31 December 2018
(all amounts are presented in HRK millions)
INA - Industrija nafte, d.d. 27
2. ACCOUNTING POLICIES (CONTINUED)
Investments in subsidiaries in Parent Company financial statement (INA, d.d.)
In the Company’s financial statements, investments in subsidiaries are accounted for at cost and reduced for
impairment.
Basis of consolidated financial statements (INA Group)
The consolidated financial statements incorporate the financial statements of INA, d.d. (the Company) and entities
controlled by the Company (its subsidiaries) made up to 31 December each year. Control is achieved when the Group
is exposed, or has rights, to variable returns from its involvement with the investee and has ability to affect those
returns through its power over the investee. The Group controls an investee if, and only if, the Group:
• has power over the investee;
• is exposed, or has rights, to variable returns from its involvement with the investee; and
• has the ability to use its power to affect its returns.
When the Company has less than a majority of the voting rights of an investee, it has power over the investee when
the voting rights are sufficient to give it the practical ability to direct the relevant activities of the investee unilaterally.
The Company considers all relevant facts and circumstances in assessing whether or not the Company's voting rights
in an investee are sufficient to give it power, including:
• the size of the Company's holding of voting rights relative to the size and dispersion of holdings of the other
vote holders;
• potential voting rights held by the Company, other vote holders or other parties;
• rights arising from other contractual arrangements; and
• any additional facts and circumstances that indicate that the Company has, or does not have, the current ability
to direct the relevant activities at the time that decisions need to be made, including voting patterns at previous
shareholders' meetings.
The Group re-assesses whether or not it controls an investee if facts and circumstances indicate that there are
changes to one or more of the three elements of control. Consolidation of a subsidiary begins when the Company
obtains control over the subsidiary and ceases when the Company loses control of the subsidiary. Assets, liabilities,
income and expenses of a subsidiary acquired or disposed of during the year are included in the consolidated
financial statements from the date the Company gains control until the date when the Company ceases to control the
subsidiary.
Profit or loss and each component of other comprehensive income are attributed to the owners of the Company and
to the non-controlling interests, even if this results in the non-controlling interests having a deficit balance. When
necessary, adjustments are made to the financial statements of subsidiaries to bring their accounting policies in line
with the Group's accounting policies.
All intragroup assets and liabilities, equity, income, expenses and cash flows relating to transactions between
members of the Group are eliminated in full on consolidation.
A change in the ownership interest of a subsidiary, without a loss of a control, is accounted for as equity transaction. If
the Group loses control over a subsidiary, it derecognises the related assets (including goodwill), liabilities, non-
controlling interest and other components of equity, while any resultant gain or loss is recognised in profit or loss. Any
investment retained is recognised at fair value.
INA - INDUSTRIJA NAFTE, d.d.
Notes to the financial statements (continued)
For the year ended 31 December 2018
(all amounts are presented in HRK millions)
INA - Industrija nafte, d.d. 28
2. ACCOUNTING POLICIES (CONTINUED)
Basis of consolidated financial statements (INA Group) (continued)
The carrying amounts of the Group's interests and the non-controlling interests are adjusted to reflect the changes in
their relative interests in the subsidiaries. Any difference between the amount by which the non-controlling interests
are adjusted and the fair value of the consideration paid or received is recognised directly in equity and attributed to
owners of the Company.
When the Group loses control of a subsidiary, the profit or loss on disposal is calculated as the difference between (i)
the aggregate of the fair value of the consideration received and the fair value of any retained interest and (ii) the
previous carrying amount of the assets (including goodwill), and liabilities of the subsidiary and any non-controlling
interests.
All amounts previously recognised in other comprehensive income in relation to that subsidiary are accounted for as if
the Group had directly disposed of the related assets or liabilities of the subsidiary. The fair value of any investment
retained in the former subsidiary at the date when control is lost is regarded as the fair value on initial recognition for
subsequent accounting under IFRS 9 Financial Instruments or, when applicable, the cost on initial recognition of an
investment in an associate.
Legal merger
In a case of legal merger of the companies in the Group, pooling of interest method is applied, balances of company
that is merged are carried at net book values to a company, which is legal successor, and no restatements of prior
periods are done.
Business combination
Business combinations are accounted for using the acquisition method.
The cost of an acquisition is measured as the aggregate of the consideration transferred, which is measured at
acquisition date fair value, and the amount of any non-controlling interests in the acquiree. For each business
combination, the Group elects whether to measure the non-controlling interests in the acquiree at fair value or at the
proportionate share of the acquiree’s identifiable net assets. Acquisition-related costs are expensed as incurred and
included in administrative expenses.
When the Group acquires a business, it assesses the financial assets and liabilities assumed for appropriate
classification and designation in accordance with the contractual terms, economic circumstances and pertinent
conditions as at the acquisition date. Any contingent consideration to be transferred by the acquirer will be recognised
at fair value at the acquisition date. Contingent consideration classified as an asset or liability that is a financial
instrument and within the scope of IFRS 9 Financial Instruments, is measured at fair value with the changes in fair
value recognised in the statement of profit or loss.
Goodwill is initially measured at cost (being the excess of the aggregate of the consideration transferred and the
amount recognised for non-controlling interests and any previous interest held over the net identifiable assets
acquired and liabilities assumed). If the fair value of the net assets acquired is in excess of the aggregate
consideration transferred, the Group re-assesses whether it has correctly identified all of the assets acquired and all
of the liabilities assumed and reviews the procedures used to measure the amounts to be recognised at the
acquisition date. If the reassessment still results in an excess of the fair value of net assets acquired over the
aggregate consideration transferred, then the gain is recognised in profit or loss.
INA - INDUSTRIJA NAFTE, d.d.
Notes to the financial statements (continued)
For the year ended 31 December 2018
(all amounts are presented in HRK millions)
INA - Industrija nafte, d.d. 29
2. ACCOUNTING POLICIES (CONTINUED)
Business combination (continued)
After initial recognition, goodwill is measured at cost less any accumulated impairment losses. For the purpose of
impairment testing, goodwill acquired in a business combination is, from the acquisition date, allocated to each of the
Group’s cash-generating units that are expected to benefit from the combination, irrespective of whether other assets
or liabilities of the acquiree are assigned to those units.
A cash-generating unit to which goodwill has been allocated is tested for impairment annually, or more frequently
when there is indication that the unit may be impaired. If the recoverable amount of the cash-generating unit is less
than its carrying amount, the impairment loss is allocated first to reduce the carrying amount of any goodwill allocated
to the unit and then to the other assets of the unit pro rata based on the carrying amount of each asset in the unit.
Any impairment loss for goodwill is recognised directly in profit or loss. An impairment loss recognised for goodwill is
not reversed in subsequent periods.
On disposal of the relevant cash-generating unit, the attribute amount of goodwill is included in the determination of
the gain or loss on disposal.
Acquisition of entities under common control
Business combinations arising from transfers of interests in entities that are under the control of the shareholder that
ultimately controls the Group are accounted for using pooling of interest accounting at the date of acquisition. The
assets and liabilities acquired are recognised at the carrying amounts recognised previously in the consolidated
financial statements of the parent group. The components of equity of the acquired entities are added to the same
components within the Group equity except for issued capital. Consolidated financial statements reflect the results of
combining entities from the date of acquisition.
Business combinations under common control are accounted for based on carrying values, with any effects directly
recognised in equity.
Investments in associates and joint ventures
An associate is an entity over which the Group has significant influence. Significant influence is the power to
participate in the financial and operating policy decisions of the investee but is not control or joint control over those
policies.
A joint venture is a joint arrangement and legal entity whereby the parties that have joint control of the arrangement
have rights to the net assets of the joint arrangement. Joint control is the contractually agreed sharing of control of an
arrangement, which exists only when decisions about the relevant activities require unanimous consent of the parties
sharing control. The considerations made in determining significant influence or joint control are similar to those
necessary to determine control over subsidiaries.
An investment in an associate or a joint venture is accounted for using the equity method from the date on which the
investee becomes an associate or a joint venture. The Group discontinues the use of the equity method from the date
when the investment ceases to be an associate or a joint venture, or when the investment is classified as held for
sale.
INA - INDUSTRIJA NAFTE, d.d.
Notes to the financial statements (continued)
For the year ended 31 December 2018
(all amounts are presented in HRK millions)
INA - Industrija nafte, d.d. 30
2. ACCOUNTING POLICIES (CONTINUED)
Interests in joint operations
A joint operation is a joint arrangement whereby the parties that have joint control of the arrangement have rights to
the assets, and obligations for the liabilities, relating to the arrangement. Joint control is the contractually agreed
sharing of control of an arrangement, which exists only when decisions about the relevant activities require
unanimous consent of the parties sharing control.
The Group accounts for the assets, liabilities, revenues and expenses relating to its interest in a joint operation in
accordance with the IFRSs applicable to the particular assets, liabilities, revenues and expenses.
When the Group entity transacts with a joint operation in which a group entity is a joint operator (such as a sale or
contribution of assets), the Group is considered to be conducting the transaction with the other parties to the joint
operation, and gains and losses resulting from the transactions are recognised in the Group's consolidated financial
statements only to the extent of other parties' interests in the joint operation.
When a Group entity transacts with a joint operation in which the Group entity is a joint operator (such as a purchase
of assets), the Group does not recognise its share of the gains and losses until it resells those assets to a third party.
Oil and gas properties
Exploration and appraisal costs
Exploration and appraisal costs are accounted for on the successful efforts method. Costs relating to exploration and
appraisal drilling are initially capitalised as intangible oil and gas assets pending determination of the commercial
viability of the relevant oil and gas properties.
License and data provision costs and costs associated with geological and geophysical activities are charged to the
statement of profit or loss in the period in which they are incurred.
If prospects are subsequently deemed to be unsuccessful on completion of evaluation, the associated costs are
charged to the statement of profit or loss in the period. If the prospects are deemed commercially viable, such costs
are transferred to oil and gas properties. Management Board reviews the status of such prospects regularly.
Fields under development
Oil and gas field development costs are capitalised as tangible oil and gas assets.
Depreciation
Capitalised exploration and development costs of producing domestic and foreign oil and gas properties are
depreciated using a unit of production method, in the proportion of actual production for the period to the total
estimated remaining commercial reserves of the field.
Commercial reserves
Commercial reserves are proved developed oil and gas reserves. Changes in the commercial reserves of fields
affecting unit of production calculations are dealt with prospectively over the revised remaining reserves. The Group
performed reserves determination in accordance with SPE PRMS (Society of Petroleum Engineers Petroleum
Resources Management System) guidelines.
INA - INDUSTRIJA NAFTE, d.d.
Notes to the financial statements (continued)
For the year ended 31 December 2018
(all amounts are presented in HRK millions)
INA - Industrija nafte, d.d. 31
2. ACCOUNTING POLICIES (CONTINUED)
Intangible assets
Intangible assets acquired separately are capitalized at cost and intangible assets acquired from a business
acquisition are capitalized at fair value as at the date of acquisition. Intangible assets are recognized if it is probable
that the future economic benefits that are attributable to the asset will flow to the enterprise and the cost of the asset
can be measured reliably. Amortisation is charged on assets with a finite useful life over the best estimate of their
useful lives using the straight line method, except intangible assets on oil and gas fields are charged with a unit of
production method. The amortisation period and the amortisation method are reviewed annually at each financial
year-end.
Intangible assets are tested for impairment annually either individually or at the cash generating unit level. Research
costs are expensed as incurred. Development expenditure incurred on an individual project is carried forward when its
future recoverability can reasonably be regarded as assured.
Following the initial recognition of the development expenditure the cost model is applied requiring the asset to be
carried at cost less any accumulated impairment losses. Costs in development stage cannot be amortized. The
carrying value of development costs is reviewed for impairment annually when the asset is not yet in use or more
frequently when an indicator of impairment arises during the reporting year indicating that the carrying value may not
be recoverable.
Property, plant and equipment
Property, plant and equipment are shown at historical cost or valuation less accumulated depreciation and any
accumulated impairment loss, except for land, which is stated at cost less any accumulated impairment loss. The
initial cost of property, plant and equipment comprises its purchase price, including import duties and non-refundable
purchase taxes and any directly attributable costs of bringing an asset to its working condition and location for its
intended use.
Expenditures incurred after property, plant and equipment have been put into operation are normally charged to
statement of profit or loss in the period in which the costs are incurred.
In situations where it can be clearly demonstrated that the expenditures have resulted in an increase in the future
economic benefits expected to be obtained from the use of an item of property, plant and equipment beyond its
originally assessed standard performance, the expenditures are capitalised as an additional cost of property, plant
and equipment. Costs eligible for capitalisation include costs of periodic, planned significant inspections and
overhauls necessary for further operation.
The gain or loss arising on the disposal or retirement of an item of property, plant and equipment is determined as the
difference between the sales proceeds and the carrying amount of the asset and is recognised in the statement of
profit or loss.
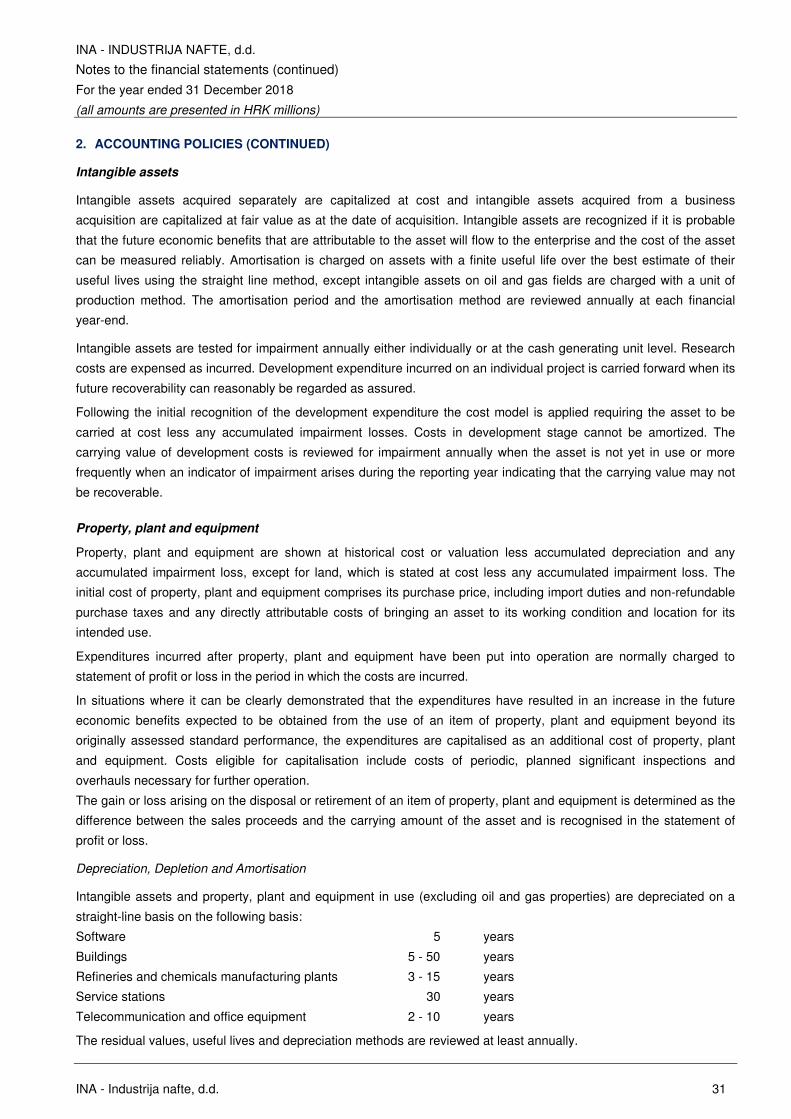
Depreciation, Depletion and Amortisation
Intangible assets and property, plant and equipment in use (excluding oil and gas properties) are depreciated on a
straight-line basis on the following basis:
Software 5 years
Buildings 5 - 50 years
Refineries and chemicals manufacturing plants 3 - 15 years
Service stations 30 years
Telecommunication and office equipment 2 - 10 years
The residual values, useful lives and depreciation methods are reviewed at least annually.
INA - INDUSTRIJA NAFTE, d.d.
Notes to the financial statements (continued)
For the year ended 31 December 2018
(all amounts are presented in HRK millions)
INA - Industrija nafte, d.d. 32
2. ACCOUNTING POLICIES (CONTINUED)
Impairment of tangible and intangible assets other than goodwill
At the end of each reporting period, the Group reviews the carrying amounts of its tangible and intangible assets to
determine whether there is any indication that those assets have suffered an impairment loss. If any such indication
exists, the recoverable amount of the asset is estimated in order to determine the extent of the impairment loss (if
any). Where it is not possible to estimate the recoverable amount of an individual asset, the Group estimates the
recoverable amount of the cash-generating unit to which the asset belongs.
Where a reasonable and consistent basis of allocation can be identified, corporate assets are also allocated to
individual cash-generating units, or otherwise they are allocated to the smallest group of cash-generating units for
which a reasonable and consistent allocation basis can be identified.
Intangible assets with indefinite useful lives and intangible assets not yet available for use are tested for impairment at
least annually, and whenever there is an indication that the asset may be impaired.
Recoverable amount is the higher of fair value less costs to sell and value in use. In assessing value in use, the
estimated future cash flows are discounted to their present value using a pre-tax discount rate that reflects current
market assessments of the time value of money and the risks specific to the asset for which the estimates of future
cash flows have not been adjusted.
If the recoverable amount of an asset (or cash-generating unit) is estimated to be less than its carrying amount, the
carrying amount of the asset (or cash-generating unit) is reduced to its recoverable amount. An impairment loss is
recognised immediately as expenditure, unless the relevant asset is carried at a revalued amount, in which case the
impairment loss is treated as a revaluation decrease.
When an impairment loss subsequently reverses, the carrying amount of the asset (or a cash-generating unit) is
increased to the revised estimate of its recoverable amount, but so that the increased carrying amount does not
exceed the carrying amount that would have been determined had no impairment loss been recognised for the asset
(or cash-generating unit) in prior years. A reversal of an impairment loss is recognised immediately in profit or loss,
unless the relevant asset is carried at a revalued amount, in which case the reversal of the impairment loss is treated
as a revaluation increase.
Finance and operating leases
If fulfilment of an arrangement depends on the use of a specific assets or conveys the right to use the assets, it is
deemed to contain a lease element and is recorded accordingly.
Finance leases, which transfer to the Group substantially all the risks and benefits incidental to ownership of the
leased item, are capitalized at the inception of the lease at the fair value of the leased property or, if lower, at the
present value of the minimum lease payments. Initial direct costs incurred are added to or deducted from the fair
value. Lease payments are apportioned between the finance charges and reduction of the lease liability. Finance
charges are charged directly against finance expenses.
Leases where the lessor retains substantially all the risks and benefits of ownership of the asset are classified as
operating leases. Operating lease payments are recognised as an expense in the statement of profit and loss on a
straight-line basis over the lease term.
INA - INDUSTRIJA NAFTE, d.d.
Notes to the financial statements (continued)
For the year ended 31 December 2018
(all amounts are presented in HRK millions)
INA - Industrija nafte, d.d. 33
2. ACCOUNTING POLICIES (CONTINUED)
Receivables from customers
Trade receivables are carried at amortised cost less impairment. Receivables from customers are shown in amounts
identified in the invoices issued to the customers in accordance with the agreement, order, delivery note and other
documents which serves as basis for invoicing, decreased with impairment of receivables.
Accrued revenues are recorded at the end of reporting period for delivered goods or services if they have not been
invoiced yet.
The adoption of IFRS 9 has changed the Company’s and the Group’s accounting for impairment losses for financial
assets by replacing IAS 39’s incurred loss approach with a forward-looking expected credit loss (ECL) approach. The
Group recognises an allowance for ECL for all debt instruments not held at fair value through profit or loss and
contract assets.
Expected credit loss model is used for calculation of impairment of receivables. The model incorporates forward-
looking factors into assessment of impairment. INA Group applies the simplified approach for receivables. This means
that allowance for the full lifetime expected credit loss is accounted for upon recognition of the financial instrument.
According to the impairment policy, following events are considered as objective evidence on impairment:
• legal claim against the customer;
• default of the issuer;
• total or partial release of claim;
• claim is under external connection;
• >180 days overdue;
• disappearance of an active market.
The calculation of loss rate:
• in case of performing third party items under simplified approach, loss rates are used to calculate the expected
credit loss on these items at initial recognition;
• the loss rate is the arithmetic average of the yearly historical loss rates of the last three years. Upon calculating
the historical loss rate for a given year, only receivables originated in given year are considered in the
calculation;
• this average of yearly historical loss rates is adjusted by the forward-looking macroeconomic element.
Inventories
Inventories of crude oil, finished and semi-finished products and natural gas are valued as follows:
• Crude oil is carried at the weighted average cost or the production cost. If finished i.e. refined products are
impaired, a calculation is used to reduce the crude oil reserve by an aliquot share to its net recoverable
amount.
• Finished products are valued at the lower of cost or approximately 96.88% of future average sales price, which
approximates the net recoverable amount.
INA - INDUSTRIJA NAFTE, d.d.
Notes to the financial statements (continued)
For the year ended 31 December 2018
(all amounts are presented in HRK millions)
INA - Industrija nafte, d.d. 34
2. ACCOUNTING POLICIES (CONTINUED)
Inventories (continued)
• Semi-finished products are measured using a calculation method, by which they are impaired to the extent that
finished products on the basis of actual inventories at the period-end are impaired i.e. when the calculation
shows that their net realisable value may not be recovered, by applying the impairment percentage to each
individual semi-finished product on stock at the period-end.
• Imported natural gas held in underground storage is valued at the lower of cost, based on the price of imported
gas at year-end including transport costs and weighted average sales price based on year-end prices.
• Domestic natural gas held in underground storage is valued at the lower of weighted average sales price and
cost.
• Other inventories, which comprise mainly spare parts, materials and supplies, are valued at the lower of cost or
valuation and net realisable value.
Cash and cash equivalents
Cash and cash equivalents comprise cash on hand and bank, and demand deposits and other short-term highly liquid
investments that are readily convertible to a known amount of cash and are subject to an insignificant risk of changes
in value.
Borrowing costs
Borrowing costs directly attributable to the acquisition, construction or production of qualifying assets, which are
assets that necessarily take a substantial period of time to get ready for their intended use or sale, are added to the
cost of those assets, until such time as the assets are substantially ready for their intended use or sale.
Investment income earned on the temporary investment of specific borrowings pending their expenditure on qualifying
assets is deducted from the borrowing costs eligible for capitalisation. Used capitalisation rate for 2018 was 1.19%
and for 2017 it was 1.41%.
All other borrowing costs are recognised in profit or loss in the period in which they are incurred. Borrowing costs
consist of interest and other costs that an entity incurs in connection with the borrowing of funds.
Foreign currencies
The individual financial statements of each Company and the Group entity are prepared in the currency of the primary
economic environment in which the entity operates (its functional currency). For the purpose of the consolidated
financial statements, the results and financial position of each entity are expressed in Croatian kuna (HRK), which is
the functional currency of the Company, and the presentation currency for the consolidated financial statements.
In the financial statements of the individual Group entities, transactions in currencies other than the entity’s functional
currency are translated to the functional currency of entity at the rates of exchange prevailing on the dates of the
transactions.
At each statement of financial position date, monetary items denominated in foreign currencies are retranslated to the
functional currency of the entity at the rates prevailing on the statement of financial position date. Non-monetary items
carried at fair value that are denominated in foreign currencies are retranslated at the rates prevailing on the date
when the fair value was determined. Non-monetary items that are measured in terms of historical cost in a foreign
currency are not retranslated.
INA - INDUSTRIJA NAFTE, d.d.
Notes to the financial statements (continued)
For the year ended 31 December 2018
(all amounts are presented in HRK millions)
INA - Industrija nafte, d.d. 35
2. ACCOUNTING POLICIES (CONTINUED)
Foreign currencies (continued)
Exchange differences are recognised in profit or loss in the period in which they arise except for:
• exchange differences on foreign currency borrowings relating to assets under construction for future productive
use, which are included in the cost of those assets when they are regarded as an adjustment to interest costs on
those foreign currency borrowings;
• exchange differences on transactions entered into in order to hedge certain foreign currency risks;
• exchange differences on monetary items receivable from or payable to a foreign operation for which settlement
is neither planned nor likely to occur (therefore forming part of the net investment in the foreign operation), which
are recognised initially in other comprehensive income and reclassified from equity to profit or loss on disposal or
partial disposal of the net investment.
For the purpose of presenting consolidated financial statements, the assets and liabilities of the Group’s foreign
operations (including comparatives) are expressed in Croatian kuna using exchange rates prevailing on the statement
of financial position date. Income and expense items (including comparatives) are translated at the average exchange
rates for the period, unless exchange rates fluctuated significantly during that period, in which case the exchange
rates at the dates of the transactions are used. Exchange differences arising from year-end translation, if any, are
classified as equity and transferred to the Group’s other reserve. Such translation differences are recognised in profit
or loss in the period in which the foreign operation is disposed of.
The foreign concessions of INA, d.d. meet the definition of foreign operation and are treated as such.
Business activities of INA, d.d. in Egypt, Angola and in international waters in the North Adriatic Sea (several blocks)
are carried out with a significant degree of autonomy so the functional currency is US dollar (USD) except on gas field
Isabella where the functional currency is euro (EUR). The total revenue of a foreign operation (from the sale of crude
oil and natural gas) is denominated in that currency (USD or EUR), as most of the costs. Capital expenditures are
planned and presented in dollars or euros. Although they are not separate legal entities, they meet the definition of a
foreign operation in accordance with IAS 21.
In the case of a partial disposal that does not result in the Group losing control over a subsidiary that includes a
foreign operation, the proportionate share of accumulated exchange differences are re-attributed to non-controlling
interests and are not recognised in profit or loss. For all other partial disposals, the proportionate share of the
accumulated exchange differences is reclassified to profit or loss.
Goodwill and fair value adjustments on identifiable assets and liabilities acquired arising on the acquisition of a foreign
operation are treated as assets and liabilities of the foreign operation and translated at the rate of exchange prevailing
at the end of each reporting period. Exchange differences arising are recognised in other comprehensive income.
Retirement Benefit and Jubilee Costs
For defined benefit plans for retirement and jubilee awards, the cost of providing benefits is determined using the
projected unit credit method, with actuarial valuations being carried out at each annual reporting period.
Remeasurement, comprising actuarial gains and losses, the effect of the changes to the asset ceiling (if applicable)
and the return on plan assets (excluding interest), is reflected immediately in the statement of financial position with a
charge or credit recognised in other comprehensive income in the period in which they occur. Remeasurement
recognised in other comprehensive income is reflected immediately in retained earnings and will not be reclassified to
profit or loss. Past service cost is recognised in profit or loss in the period of a plan amendment.
INA - INDUSTRIJA NAFTE, d.d.
Notes to the financial statements (continued)
For the year ended 31 December 2018
(all amounts are presented in HRK millions)
INA - Industrija nafte, d.d. 36
2. ACCOUNTING POLICIES (CONTINUED)
Retirement Benefit and Jubilee Costs (continued)
Net interest is calculated by applying the discount rate at the beginning of the period to the net defined benefit liability
or asset. Defined benefit costs are categorised as follows:
• service cost (including current service cost, past service cost, as well as gains and losses on curtailments and
settlements);
• net interest expense or income; and
• remeasurement.
The Group presents the first two components of defined benefit costs in profit or loss in the line item. Curtailment
gains and losses are accounted for as past service costs.
The retirement benefit obligation recognised in the consolidated statement of financial position represents the actual
deficit or surplus in the Group’s defined benefit plans. Any surplus resulting from this calculation is limited to the
present value of any economic benefits available in the form of refunds from the plans or reductions in future
contributions to the plans. A liability for a termination benefit is recognised when the entity can no longer withdraw the
offer of the termination benefit or when the entity recognises any related restructuring costs.
Taxation
The tax expense represents the sum of the tax currently payable and deferred tax.
Current tax
The tax currently payable is based on taxable profit for the year. Taxable profit differs from profit as reported in the
consolidated statement of profit or loss because of items of income or expense that are taxable or deductible in other
years and it further excludes items that are never taxable or deductible. The Company’s and the Group’s liability for
current tax is calculated using tax rates that have been enacted or substantively enacted by the statement of financial
position date.
Deferred tax
Deferred tax is recognised on differences between the carrying amounts of assets and liabilities in the financial
statements and the corresponding tax bases used in the computation of taxable profit and are accounted for using the
statement of financial position liability method.
Deferred tax is calculated using tax rates that have been enacted or substantively enacted by the end of the reporting
year and are expected to apply to taxable income in the years in which those temporary differences are expected to
be recovered or settled.
Deferred tax assets are recognised where it is more likely than not the assets will be realised in the future. At each
date, the Company re-assessed unrecognised deferred tax assets and the carrying amount of deferred tax assets. No
deferred tax liability is provided in respect of any future remittance of earnings of foreign subsidiaries where the Group
is able to control the remittance of earnings and it is probable that such earnings will not be remitted in the
foreseeable future, or where no liability would arise on the remittance.
Deferred tax assets and liabilities are offset when there is a legally enforceable right to set off current tax assets
against current tax liabilities and when they relate to income taxes levied by the same taxation authority and the
Company and the Group intend to settle its current tax assets and liabilities.
INA - INDUSTRIJA NAFTE, d.d.
Notes to the financial statements (continued)
For the year ended 31 December 2018
(all amounts are presented in HRK millions)
INA - Industrija nafte, d.d. 37
2. ACCOUNTING POLICIES (CONTINUED)
Taxation (continued)
Deferred tax (continued)
Deferred tax liabilities are recognised for taxable temporary differences associated with investments in subsidiaries
and associates except where the Group is able to control the reversal of the temporary difference and it is probable
that the temporary difference will not reverse in the foreseeable future.
Current and deferred tax for the period
Current and deferred tax are recognized in profit or loss, except when they relate to items that are recognized in other
comprehensive income or directly in equity, in which case, the current and deferred tax are also recognized in other
comprehensive income or directly in equity respectively. Where current tax and deferred tax arises from the
accounting for a business acquisition, the tax effect is included in accounting for the business combination.
Financial assets
Initial measurement of financial instruments
Financial assets are divided into two main categories, those measured at amortized cost and those measured at fair
value. Fair value measurement is further divided into fair value through profit and loss (FVTPL) and fair value through
other comprehensive income (FVTOCI).
Subsequent measurement of financial assets
Financial assets are classified in four categories:
Financial assets at amortized cost (debt instruments)
A debt instrument that meets the following two conditions is measured at amortized cost:
• Business model test: The financial asset is held to collect the contractual cash flows (rather than to sell the
instrument prior to its contractual maturity to realize its fair value changes), and
• Cash flow characteristics test: The contractual terms of the financial asset give rise on specified dates to cash
flows that are solely payments of principal and interest on the principal amount outstanding.
Financial assets at fair value through other comprehensive income (debt instruments)
A debt instrument that meets the following two conditions must be measured at FVTOCI unless the asset is
designated at FVTPL under the fair value option:
• Business model test: The financial asset is held within a business model with the objective of both holding to
collect contractual cash flows and selling, and
• Cash flow characteristics test: The contractual terms of the financial asset give rise on specified dates to cash
flows that are solely payments of principal and interest on the principal amount outstanding.
The Company’s and the Group’s debt instruments at FVTOCI includes only investments in short-term quoted debt
marketable securities with very low credit risk.
Financial assets at fair value through profit or loss (debt instruments)
All other debt instruments must be measured at FVTPL (including derivatives).
INA - INDUSTRIJA NAFTE, d.d.
Notes to the financial statements (continued)
For the year ended 31 December 2018
(all amounts are presented in HRK millions)
INA - Industrija nafte, d.d. 38
2. ACCOUNTING POLICIES (CONTINUED)
Financial assets (continued)
Financial assets designated at fair value through other comprehensive income (equity instruments)
Upon initial recognition, the Company and Group can elect to classify irrevocably its equity investments as equity
instruments designated at FVTOCI when they meet the definition of equity under IAS 32 Financial Instruments:
Presentation and are not held for trading. The classification is determined on an instrument-by-instrument basis.
The Company and the Group elected to classify its listed equity investments under this category (see note 39).
Derecognition of financial assets
The basic premise for the derecognition model is to determine whether the asset under consideration for
derecognition is:
• an asset in its entirety,
• specifically identified cash flows from an asset (or a group of similar financial assets),
• fully proportionate (pro rata) share of the cash flows from an asset (or a group of similar financial assets), or
• fully proportionate (pro rata) share of specifically identified cash flows from a financial asset (or a group of
similar financial assets).
Once the asset under consideration for derecognition has been determined, an assessment is made as to whether
the asset has been transferred, and if so, whether the transfer of that asset is subsequently eligible for derecognition.
Impairment
The impairment model is based on the premise of providing for expected losses.
General approach
With the exception of purchased or originated credit impaired financial assets, expected credit losses are measured
through a loss allowance at an amount equal to:
• the 12-month expected credit losses (expected credit losses that result from those default events on the
financial instrument that are possible within 12 months after the reporting date);
• or full lifetime expected credit losses (expected credit losses that result from all possible default events over the
life of the financial instrument).
A loss allowance for full lifetime expected credit losses is required for a financial instrument if the credit risk of that
financial instrument has increased significantly since initial recognition, as well as to contract assets or trade
receivables that do not constitute a financing transaction in accordance with IFRS 15.
Simplified approach
The Company and the Group apply the simplified approach for the following financial assets: trade receivables, IFRS
15 contract assets and lease receivables. For all other financial instruments, general approach is applied.
Independently of the two approaches mentioned above, the impairment method stayed the same under the new
standard in case of financial assets where there is an objective evidence on impairment. These are required to be
assessed on a case by case basis. The maximum amount of impairment accounted for by the Company and Group is
100% of unsecured part of the financial asset.
INA - INDUSTRIJA NAFTE, d.d.
Notes to the financial statements (continued)
For the year ended 31 December 2018
(all amounts are presented in HRK millions)
INA - Industrija nafte, d.d. 39
2. ACCOUNTING POLICIES (CONTINUED)
Financial liabilities
Initial recognition and measurement
Financial liabilities are classified, at initial recognition, as financial liabilities at fair value through profit or loss, loans
and borrowings, payables, or as derivatives designated as hedging instruments.
All financial liabilities are recognised initially at fair value and, in the case of loans and borrowings and payables, net
of directly attributable transaction costs. The Company’s and the Group’s financial liabilities include trade and other
payables, loans and borrowings including bank overdrafts and derivative financial instruments.
Subsequent measurement
The measurement of financial liabilities depends on their classification.
Financial liabilities at fair value through profit or loss
Financial liabilities at fair value through profit or loss include financial liabilities held for trading and financial liabilities
designated upon initial recognition as at fair value through profit or loss. Financial liabilities are classified as held for
trading if they are incurred for the purpose of repurchasing in the near term. This category also includes derivative
financial instruments entered into by the Company and the Group that are not designated as hedging instruments in
hedge relationships as defined by IFRS 9. Separated embedded derivatives are also classified as held for trading
unless they are designated as effective hedging instruments. The Company and the Group do not have financial
liabilities at fair value through profit or loss.
Loans and borrowings
This is the category most relevant to the Company and the Group. After initial recognition, interest-bearing loans and
borrowings are subsequently measured at amortised cost. Gains and losses are recognised in profit or loss when the
liabilities are derecognised.
Amortised cost is calculated by taking into account any discount or premium on acquisition and fees or costs.
Derecognition of financial liabilities
A financial liability is removed from the statement of financial position when, and only when, it is extinguished, that is,
when the obligation specified in the contract is either discharged or cancelled or expires.
Where there has been an exchange between an existing borrower and lender of debt instruments with substantially
different terms, or there has been a substantial modification of the terms of an existing financial liability, this
transaction is accounted for as an extinguishment of the original financial liability and the recognition of a new
financial liability. A gain or loss from extinguishment of the original financial liability is recognized in profit or loss.
The Group does not have any financial instrument whose classification has changed as a result of applying IFRS 9
and does not have any instrument that the Group designated upon initial recognition as at fair value through profit or
loss in order to reduce a measurement or recognition inconsistency.
Impairment is only accounted for trade receivables. No impairment is recognised on the remaining financial
instruments based on materiality, history and expectations.
INA - INDUSTRIJA NAFTE, d.d.
Notes to the financial statements (continued)
For the year ended 31 December 2018
(all amounts are presented in HRK millions)
INA - Industrija nafte, d.d. 40
2. ACCOUNTING POLICIES (CONTINUED)
Segmental information
IFRS 8 Operating segments requires operating segments to be identified on the basis of internal reports about
components of the Group that are regularly reviewed by the chief operating decision maker in order to allocate
resources to the segments and to assess their performance.
Provisions for decommissioning and other obligations
Provisions are recognised when the Company and the Group have a present obligation (legal or constructive) as a
result of a past event and it is probable (i.e. more likely than not) that an outflow of resources will be required to settle
the obligation, and a reliable estimate can be made of the amount of the obligation. The amount recognised as a
provision is the best estimate of the consideration required to settle the present obligation at the end of the reporting
period, taking into account the risks and uncertainties surrounding the obligation. When the effect of discounting is
material, the amount of the provision is the present value of the expenditures expected to be required to settle the
obligation, determined using the discount factor which is calculated as CPI (Consumer Price Index) and real interest
rate. When discounting is used, the reversal of such discounting in each year is recognised as a financial expense
and the carrying amount of the provision increases in each year to reflect the passage of time.
Provision relating to the decommissioning and removal of assets, such as an oil and gas production facility are initially
treated as part of the cost of the related property, plant and equipment. Subsequent adjustments to the provision
arising from changes in estimates as decommissioning costs, reserves and production of oil and gas, risk free interest
such as discount rate and inflation rate are also treated as an adjustment to the cost of the property, plant and
equipment and thus dealt with prospectively in the statement of profit or loss through future depreciation of the asset.
Any change to the present value of the estimated costs is reflected as an adjustment of the provisions and the
decommission assets.
Provision for emission quotas
Liability for emission is not recognized until the amount of actual emission reaches the amount of quota allocated free
of charge. This approach is due to the fact that allocated emission allowances are not recorded as intangibles, their
asset value is zero. When actual emission exceeds the amount of emission rights granted, provision should be made
on the actual market price for the exceeding emission allowances. It also means that it is not possible to record a
provision earlier than the date when emissions reach the amount of allowances granted, nor is it possible to spread
the expected shortfall through the calendar years.
Settlement with Government is carried out by offsetting the purchased rights with the provision recorded for the
exceeding emissions. Penalty will be accounted for if the shortfall is not covered by purchased quotas.
Provision should be calculated for each installation separately and recorded on emitting segment.
Revenue from Contracts with Customers
Under IFRS 15 the Company and the Group recognise revenue to depict the transfer of promised goods or services
to customers in an amount that reflects the consideration to which the Company and Group expect to be entitled in
exchange for those goods or services. This core principle is delivered in a five-step model framework.
The Company and the Group consider whether there are other promises in the contract that are separate
performance obligations to which a portion of the transaction price needs to be allocated. In determining the
transaction price, the Company and the Group consider the effects of variable consideration, the existence of
significant financing components, noncash consideration and consideration payable to the customer.
INA - INDUSTRIJA NAFTE, d.d.
Notes to the financial statements (continued)
For the year ended 31 December 2018
(all amounts are presented in HRK millions)
INA - Industrija nafte, d.d. 41
2. ACCOUNTING POLICIES (CONTINUED)
Revenue from Contracts with Customers (continued)
Presentation and disclosure
Contracts with customers are presented in statement of financial position as a contract liability, a contract asset, or a
receivable, depending on the relationship between the performance of the Company and the Group and the
customer's payment.
A contract liability is presented in the statement of financial position where a customer has paid an amount of
consideration prior to the performing by transferring the related good or service to the customer.
Where the Company and the Group have performed the obligation by transferring a good or service to the customer
and the customer has not yet paid the related consideration, a contract asset or a receivable is presented in the
statement of financial position, depending on the nature of right to consideration. A contract asset is recognised when
the Company’s and the Group’s right to consideration is conditional on something other than the passage of time, for
example future performance of the Company and the Group. A receivable is recognised when the Company’s and the
Group’s right to consideration is unconditional except for the passage of time.
Company’s and Group’s sales contracts generally comprise of only one performance obligation. As such, the
Company and the Group do not disclose information about the allocation of the transaction price.
Excise duties
Excise duty is part of amounts collected on behalf of third parties.
Construction – maintenance and service contracts
For each performance obligation satisfied over time, the company and the Group recognizes revenue over time by
measuring the progress towards complete satisfaction of that performance obligation. Management elected to use
input method of calculating progress (costs incurred to date) in revenue recognition from construction contracts.
INA - INDUSTRIJA NAFTE, d.d.
Notes to the financial statements (continued)
For the year ended 31 December 2018
(all amounts are presented in HRK millions)
INA - Industrija nafte, d.d. 42
3. SIGNIFICANT ACCOUNTING JUDGEMENTS AND ESTIMATES
Critical judgements and estimates in applying accounting policies
In the application of the accounting policies, which are described in note 2, Management made certain judgements
and estimates that had a significant impact on the amounts reported in the financial statements (irrespective of the
underlying estimates referred to below).
The preparation of financial statements in conformity with International Financial Reporting Standards, as adopted by
EU requires management to make estimates and assumptions that affect the reported amounts of assets, liabilities,
income and expenses and disclosure of contingencies. The significant areas of estimation used in the preparation of
the accompanying financial statements relate to employee benefits, impairment of assets, determination of fair values
of assets and liabilities, estimated decommissioning costs, environmental provision and provision for legal cases as
well as carrying value of investments and given loans to subsidiaries and contract balances. Future events may occur
which will cause the assumptions used in arriving at the estimates to change. The effect of any changes in estimates
will be recorded in the financial statements when determinable.
These judgements and estimates are provided in detail in the accompanying notes. However, the critical judgements
and estimates relate to the following areas:
Consequences of certain legal actions
The Group is involved in number of litigations arisen from the regular course of business. If there is a present
obligation as a result of a past event (taking into account all available evidence, including the opinion of law experts)
for which it is probable that outflow of resources will be required to settle the obligation and if a reliable estimate can
be made of the amount of the obligation, provisions are recorded (see note 29).
Carrying value of property, plant and equipment
The impairment calculation requires the estimate of the value in use of the cash generating units. Value in use is
measured using the discounted cash flow projections. The most significant variables in determining cash flows are
expected oil and gas prices, production volumes, operating and capital expenditures, discount rates, period of cash
flow projections, as well as assumptions and judgments used in determining cash receipts and payments. The
impairment of assets in the consolidated statement of profit or loss amounted to HRK 32 million in 2018 (2017: HRK
145 million).
Carrying value of goodwill
In 2018 and 2017 there was no goodwill impairment (see note 13). The carrying amount of goodwill amounted to HRK
152 million as of 31 December 2018 and 31 December 2017 (see note 13).
Carrying value of intangible exploration and appraisal assets
The carrying amount of intangible exploration and appraisal assets amounted to HRK 229 million as of 31 December
2018 and HRK 201 million as of 31 December 2017 (see note 13). In 2018 impairment amounted of HRK 71 million
and in 2017 there was no impairment of intangible exploration and appraisal assets (see note 13).
INA - INDUSTRIJA NAFTE, d.d.
Notes to the financial statements (continued)
For the year ended 31 December 2018
(all amounts are presented in HRK millions)
INA - Industrija nafte, d.d. 43
3. SIGNIFICANT ACCOUNTING JUDGEMENTS AND ESTIMATES (CONTINUED)
Critical judgements and estimates in applying accounting policies (continued)
Carrying value of production oil and gas assets
The carrying amount of production oil and gas assets amounted to HRK 3,491 million as of 31 December 2018 and
HRK 3,794 million as of 31 December 2017 (see note 14). In 2018 the Group recognized impairment in the amount of
HRK 32 million (2017: HRK 45 million) (see note 14).
Key assumptions used
Refining and Marketing
INA’s management conducted an analysis of potential impairment triggers – whether the key value drivers of the
business (market demand, crack spreads, oil price) turned considerably to the worse. The analysis concluded that for
Refining and Marketing there is no impairment trigger, therefore no impairment test was performed.
Exploration and Production
Hydrocarbon price outlook, as the key value driver for upstream assets, has improved compared to the reporting
period last year, which led to the conclusion that generally there are no impairment indicators for most of INA’s upstream asset groups.
During 2018, INA's management identified five onshore fields with negative reserves change compared to 2017
reserves. The change was above -1MMboe which is considered as materiality threshold on asset level (Molve,
Kalinovac, Hrastilnica, Ivanić and Žutica) with a total impact of -23.8 MMboe. The volume change for above five fields
was identified as a triggering event for impairment testing, which was prepared for each field since they are identified
as separate cash generating units. However, these revisions are on the fields with significant production volumes and
quite low breakeven prices, so no impairment was recorded as at 31 December 2018.
Investments in Syria
Since 1998 INA, d.d. has had six (6) commercial discoveries on the Hayan Block (Jihar, Al Mahr, Jazal, Palmyra,
Mustadira and Mazrur) with significant oil, gas and condensate reserves. INA, d.d. temporarily suspended all business
activities in Syria on 26 February 2012 by announcing Force Majeure to comply with the relevant sanctions of the US
and the EU.
Current situation
Main production activities have been taken over by Hayan Petroleum Company’s local workforce, which INA, d.d. considers illegal.
Company has assessed situation in Syria and identified no material change compared to 2017. EU sanctions remain
in place and the political situation has not changed significantly either for the better of worse from INA’s investment perspective. INA, d.d. expects similar costs and benefits in case of return to operation of Syrian fields. Therefore, no
triggering event for asset impairment was identified in 2018.
In line with the Petroleum Resources Management System (PRMS) rules, and the fact that Syrian assets are under
Force Majeure and INA, d.d. has no control for a period of almost 7 years, the reserves are shifted from 2P to 2C
category in 2017. No changes in 2018.
INA - INDUSTRIJA NAFTE, d.d.
Notes to the financial statements (continued)
For the year ended 31 December 2018
(all amounts are presented in HRK millions)
INA - Industrija nafte, d.d. 44
3. SIGNIFICANT ACCOUNTING JUDGEMENTS AND ESTIMATES (CONTINUED)
Critical judgements and estimates in applying accounting policies (continued)
Political developments in Egypt
Concerning the INA, d.d. operations in Egypt the key uncertainty of business is the timing of receivables collection. At
31 December 2018 gross book value of Egyptian General Petroleum Corporation receivables amounted to HRK 212
million out of which HRK 69 million was value adjusted. During 2018, INA, d.d. impaired HRK 72 million of receivables
and managed to collect previously value adjusted receivables in the amount of HRK 315 million. Improvement in
collection of receivables is due to better market environment in Egypt.
Quantification and determination of the decommissioning obligations for oil and gas properties
Decommissioning costs are uncertain and cost estimates can vary in response to many factors, including changes to
legal and regulatory requirements, new technologies becoming available and experience of decommissioning other
assets. The expected timing, scope, expenditure and risk profile may also change. Therefore, significant estimates
and assumptions are made in determining decommissioning provisions. The provision estimate requires significant
management judgement and is reviewed on annual basis.
Management makes estimates of future expenditure in connection with decommissioning obligations using prices by
reference to prior similar activities, as well as other assumptions like the estimated effects of any changes in local
regulations, management's expected approach to decommissioning, cost estimates and discount rates. Furthermore,
the time determined for the cash flows reflects the current estimates of priorities, technical equipment requirements
and urgency of the obligations. The obligation with respect to the decommissioning provision for oil and gas properties
amounted to HRK 3,029 million as at 31 December 2018 (31 December 2017: HRK 2,701 million) for INA, d.d. (see
note 29).
The level of provisioning for environmental obligations
The applicable regulations, specifically the environmental protection legislation, do not specify the exact scope of
activities or technology to be applied in provision based environmental liabilities. Provisions are recognised when the
Group has a present obligation (legal or constructive) because of a past event and it is probable (i.e. more likely than
not) that an outflow of resources will be required to settle the obligation, and a reliable estimate can be made of the
amount of the obligation.
Generally, the timing of provisions coincides with the commitment to a formal plan of action or, if earlier, on
divestment or on closure of inactive sites. In determining the level of provisions for environmental obligations, the
management relies on prior experience and their own interpretation of the related legislation. Where the liability will
not be settled for a number of years, the amount recognized is the present value of the estimated future expenditure.
At 31 December 2018 INA Group recognized environmental provision in the amount of HRK 412 million (2017: HRK
335 million) (see note 29), which covers investigation to determine the extent of contamination at specific site,
treatment of accumulated waste generated by former activity, preliminary site investigation with corresponding
laboratory analyses, soil excavation and replacement during the reconstruction of service stations. It does not cover
the cost of remediation in lack of detailed National regulations.
INA - INDUSTRIJA NAFTE, d.d.
Notes to the financial statements (continued)
For the year ended 31 December 2018
(all amounts are presented in HRK millions)
INA - Industrija nafte, d.d. 45
3. SIGNIFICANT ACCOUNTING JUDGEMENTS AND ESTIMATES (CONTINUED)
Critical judgements and estimates in applying accounting policies (continued)
Availability of taxable profit against which the deferred tax assets can be utilised
A deferred tax asset is recognized for unused tax losses to the extent that is probable that taxable profit will be
available against which the losses can be utilised. Significant management judgement is required to determine the
amount of deferred tax assets that can be recognised, based upon the likely timing and the level of future taxable
profits, together with future tax planning savings. Determining the amount of deferred taxes that can be recognised
requires a significant level of judgement, which is based on the probable quantification of the time and level of future
taxable profits, together with the future tax planning strategy.
Management believes that deferred tax asset recognized is recoverable. At 31 December 2018 the carrying amount
of deferred tax assets of the INA Group amounted to HRK 1,199 million (2017: HRK 1,451 million) and deferred tax
liabilities amounted to HRK 14 million at 31 December 2018 (2017: HRK 14 million). At 31 December 2018 the
carrying amount of deferred tax assets of INA, d.d. amounted to HRK 1,089 million, (31 December 2017: HRK 1,343
million respectively) (see note 11).
If the Group was able to recognise all unrecognised deferred tax assets, profit and equity would have increased by
HRK 31 million at 31 December 2018, (31 December 2017: HRK 62 million).
Actuarial estimates used determining the retirement bonuses
The cost of defined benefits is determined using actuarial estimates. Actuarial estimates involve assumptions of
discount rates, future salary increases and the mortality or fluctuation rates. Because of the long-term nature of those
plans, there is uncertainty surrounding those estimates. Provisions for retirement bonuses and jubilee awards for INA
Group amounted to HRK 82 million as at 31 December 2018 (31 December 2017: HRK 78 million), and INA, d.d.
amounted to HRK 36 million as at 31 December 2018 (31 December 2017: HRK 34 million) (see note 30).
Useful life of the assets
The INA Group and INA, d.d. review the estimated useful lives of property, plant and equipment at the end of each
reporting period. Estimation of useful life is considered to be a significant accounting estimation that effects on the
change in depreciation rates. The new review of asset useful life at the end of 2018 had no significant changes
compared to the previous estimate.
Hydrocarbon reserves
Exploration and development projects involve many uncertainties and business risks that may give rise to significant
expenditures. Exploration and development projects of the Company and the Group may be delayed or unsuccessful
for many various reasons, including budgeted cost overrun, geological issues, difficulties in meeting the requirements
of competent bodies, lacks of equipment and technical problems. These projects, particularly those pertaining to the
wells in continental areas or other demanding terrain, often require deployment of new and advanced technologies,
the development, purchase and installation of which may be expensive and that may not operate as expected.
Oil and natural gas exploration and drilling activities are subject to a wide range of inherent risks, including the risk of
eruption, deposit damage, loss of control over the wells, perforation, craters, fire and natural disasters.
INA - INDUSTRIJA NAFTE, d.d.
Notes to the financial statements (continued)
For the year ended 31 December 2018
(all amounts are presented in HRK millions)
INA - Industrija nafte, d.d. 46
3. SIGNIFICANT ACCOUNTING JUDGEMENTS AND ESTIMATES (CONTINUED)
Critical judgements and estimates in applying accounting policies (continued)
Hydrocarbon reserves (continued)
The Company and the Group estimate and report hydrocarbon reserves in line with the principles contained in the
SPE Petroleum Resources Management Reporting System (PRMS) framework. Estimation of hydrocarbon reserves
is a significant area of judgement due to the technical uncertainty in assessing quantities and complex contractual
arrangements dictating the Company’s and the Group’s share of reportable volumes.
As the economic assumptions used may change and as additional geological information is obtained during the
operation of a field, estimates of recoverable reserves may change. Such changes may affect the Company’s and the
Group’s reported financial position and results, which include:
• The carrying value of exploration and evaluation assets; oil and gas properties; property, plant and equipment;
and goodwill may be affected due to changes in estimated future cash flows;
• Depreciation and amortization charges in the statement of profit or loss and other comprehensive income may
change where such charges are determined using the Units of Production (UOP) method, or where the useful
life of the related assets change;
• Provisions for decommissioning may require revision where changes to the reserve estimates affect
expectations about when such activities will occur and the associated cost of these activities;
• The recognition and carrying value of deferred tax assets may change due to changes in the judgments
regarding the existence of such assets and in estimates of the likely recovery of such assets.
Carrying value of investments and given loans to subsidiaries (INA, d.d.)
The carrying amount of the investment in subsidiaries amounts to HRK 1,960 million as at 31 December 2018 and
HRK 1,079 million as at 31 December 2017. During 2018, a net reversal of impairment in the amount of HRK 107
million was recorded (2017: impairment HRK 34 million). Due to the significance exposure to subsidiaries (calculated
as the sum of carrying value of investment and given loans, net) the existence of impairment indicators requires
significant Management judgment in determining the appropriate approach for testing impairment.
The carrying amount of loans granted to subsidiaries amounts to HRK 755 million as at 31 December 2018 and HRK
1,257 million at 31 December 2017. During 2018, INA, d.d. collected previously impaired loan given to subsidiary
Energopetrol d.d and recorded reversal of impairment in the amount of HRK 222 million.
Contract balances
2018 2017 2018 2017
Trade receivables 1,837 1,393 1,490 1,118
Contract asset 2 - - -
Contract liabilities 28 26 - -
INA Group INA, d.d.
INA - INDUSTRIJA NAFTE, d.d.
Notes to the financial statements (continued)
For the year ended 31 December 2018
(all amounts are presented in HRK millions)
INA - Industrija nafte, d.d. 47
3. SIGNIFICANT ACCOUNTING JUDGEMENTS AND ESTIMATES (CONTINUED)
Critical judgements and estimates in applying accounting policies (continued)
Contract balances (continued)
Trade receivables are non-interest bearing and are generally on terms of 3 to 30 days. The acquisition of a subsidiary
resulted in increase in trade receivables of HRK 29 million in 2018 (note 40). In 2018, HRK 1 million (2017: 3 HRK
million) was recognised as impairment for expected credit losses on trade receivables.
Contract assets are initially recognised for revenue earned from construction services as receipt of consideration is
conditional on successful completion of construction. Upon completion of construction services and acceptance by the
customer, the amounts recognised as contract assets are reclassified to trade receivables.
Contract liabilities include short-term advances received for construction services in amount of HRK 28 million in 2018
as well as HRK 26 million in 2017. The remaining performance obligations are expected to be recognised in following
year.
Due to non-material amount, these categories are not presented in separate line in statement of financial position.
Contract assets are presented in line other current asset while contract liabilities are presented in line other current
liabilities in statement of financial position.
Contract assets and contract liabilities are not presented in separate line in statement of financial position because
they are not considered to be significant for the Company and the Group. Contract assets are presented in line other
current asset while contract liabilities are presented in line other current liabilities in statement of financial position.
Performance obligations
Revenue from the sale and transportation of crude oil, natural gas, petroleum products and other merchandise is
recognised when the customer obtains control of the goods, which is normally when title passes to the customer and
the customer takes the physical possession, based on the contractual terms of the agreements.
Sales agreements mainly represent one performance obligation and the Company and the Group principally satisfies
its performance obligations at a point in time.
Reclassification position of profit and loss
In 2018 INA Group and INA, d.d. adjusted its EBITDA methodology and classification between impairment and value
adjustment lines to better align the reporting to business reporting standards with EBITDA now being calculated as
EBIT plus Depreciation, amortization and impairment (net). The effect of reclassification of account of profit and loss
are as follows:
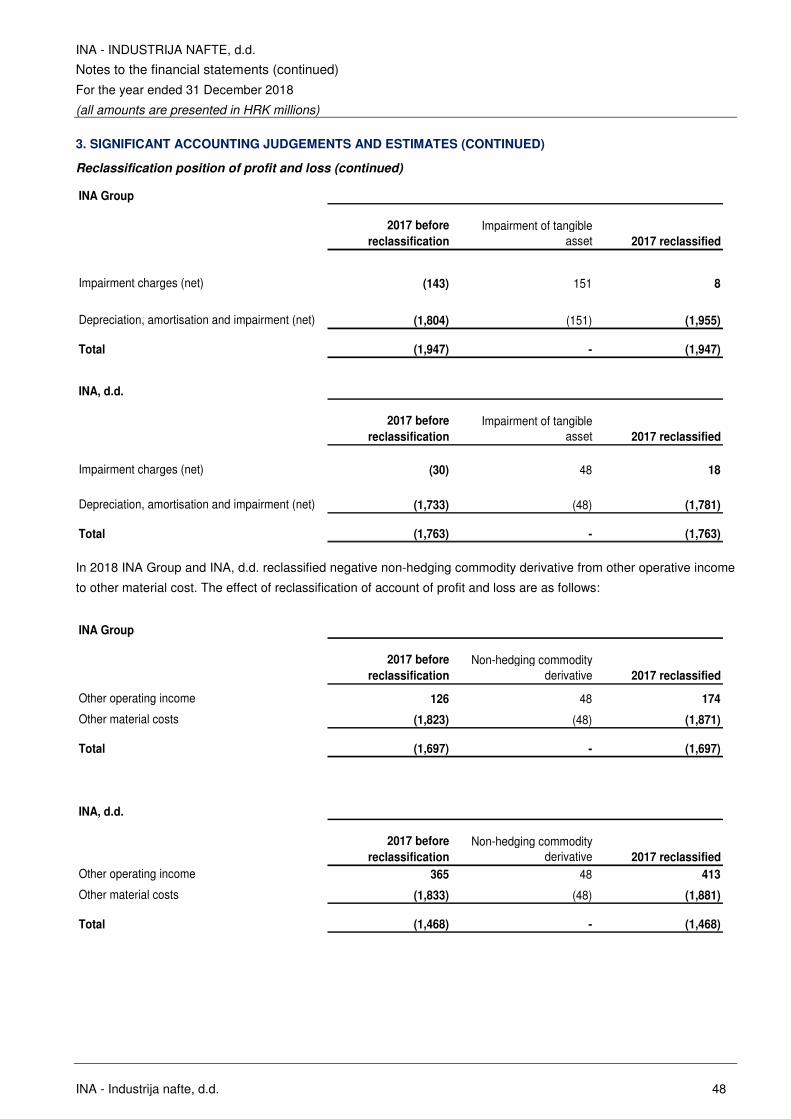
INA - INDUSTRIJA NAFTE, d.d.
Notes to the financial statements (continued)
For the year ended 31 December 2018
(all amounts are presented in HRK millions)
INA - Industrija nafte, d.d. 48
3. SIGNIFICANT ACCOUNTING JUDGEMENTS AND ESTIMATES (CONTINUED)
Reclassification position of profit and loss (continued)
INA Group
2017 before
reclassification
Impairment of tangible asset 2017 reclassified
Impairment charges (net) (143) 151 8
Depreciation, amortisation and impairment (net) (1,804) (151) (1,955)
Total (1,947) - (1,947)
INA, d.d.
2017 before
reclassification
Impairment of tangible asset 2017 reclassified
Impairment charges (net) (30) 48 18
Depreciation, amortisation and impairment (net) (1,733) (48) (1,781)
Total (1,763) - (1,763)
In 2018 INA Group and INA, d.d. reclassified negative non-hedging commodity derivative from other operative income
to other material cost. The effect of reclassification of account of profit and loss are as follows:
INA Group
2017 before
reclassification
Non-hedging commodity derivative 2017 reclassified
Other operating income 126 48 174
Other material costs (1,823) (48) (1,871)
Total (1,697) - (1,697)
INA, d.d.
2017 before
reclassification
Non-hedging commodity derivative 2017 reclassified
Other operating income 365 48 413
Other material costs (1,833) (48) (1,881)
Total (1,468) - (1,468)
INA - INDUSTRIJA NAFTE, d.d.
Notes to the financial statements (continued)
For the year ended 31 December 2018
(all amounts are presented in HRK millions)
INA - Industrija nafte, d.d. 49
4. SEGMENT INFORMATION
The INA Group operates through three core business segments. The strategic business segments offer different
products and services. Reporting segments, which in INA Group represent business operations, have been defined
along value chain standard for the oil companies:
• Exploration and Production - exploration, production and selling of crude oil;
• Refining and Marketing - crude oil processing, wholesale of refinery products, selling of natural gas, selling of
fuels and commercial goods in retail stations and logistics; and
• Corporate and other - in addition to the core segments above, the operations of INA Group provides services
for core activities.
Information regarding the results of each reportable segment is included below. Profit from operations is used to
measure performance, as management believes that such information is the most relevant in evaluating the result of
certain segments. However, Group financing (including finance costs and finance income) and income taxes are
managed on Group basis and are not relevant to making business decisions at the level of business segments.
Intersegment transfer represents the effect of unrealized profit arising in respect of transfers of inventories from
Exploration and Production to Refining and Marketing. Evaluation of inventories of domestic crude, finished and semi-
finished products in Refining and Marketing is based on the transfer price from Exploration and Production to Refining
and Marketing. Elimination of unrealized profit (difference between transfer price and cost of domestic crude) is
performed through intersegment transfer. For segmental reporting purposes, the transferor segment records a profit
immediately at the point of transfer. However, at the Company level profit is only reported when the related third party
sale has taken place.
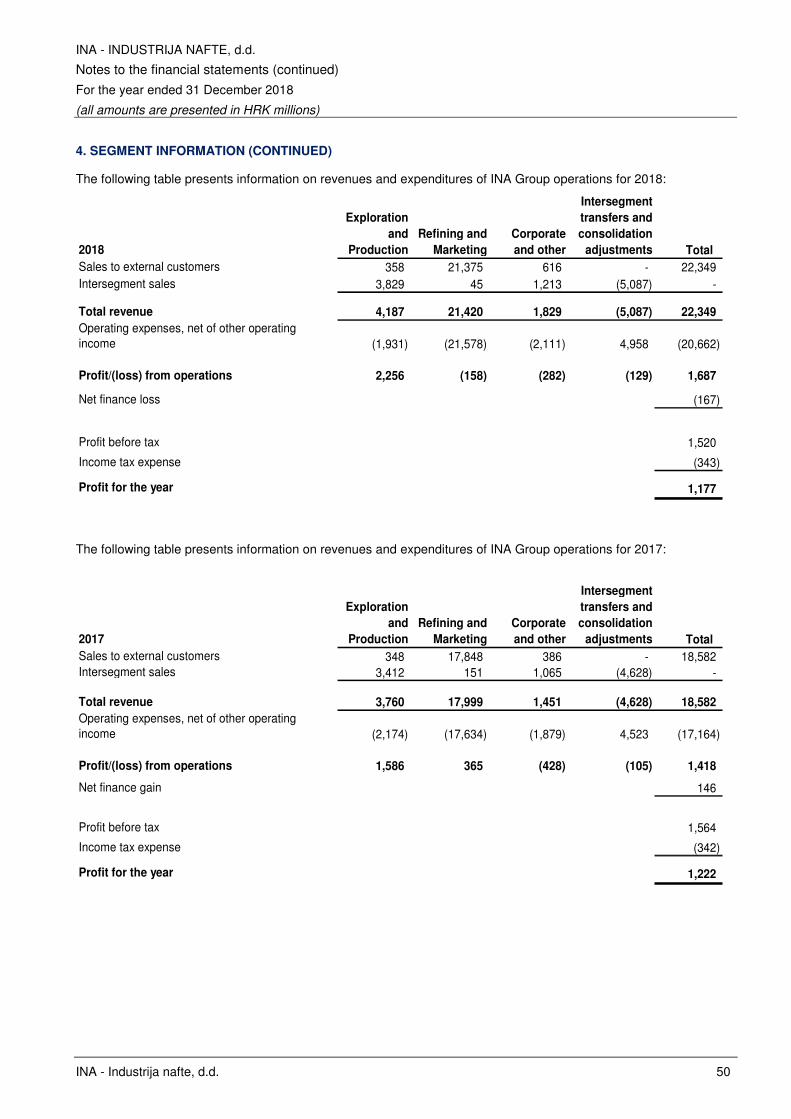
INA - INDUSTRIJA NAFTE, d.d.
Notes to the financial statements (continued)
For the year ended 31 December 2018
(all amounts are presented in HRK millions)
INA - Industrija nafte, d.d. 50
4. SEGMENT INFORMATION (CONTINUED)
The following table presents information on revenues and expenditures of INA Group operations for 2018:
2018
Exploration
and
Production
Refining and
Marketing
Corporate
and other
Intersegment
transfers and
consolidation
adjustments Total
Sales to external customers 358 21,375 616 - 22,349 Intersegment sales 3,829 45 1,213 (5,087) -
Total revenue 4,187 21,420 1,829 (5,087) 22,349
Operating expenses, net of other operating income (1,931) (21,578) (2,111) 4,958 (20,662)
Profit/(loss) from operations 2,256 (158) (282) (129) 1,687
Net finance loss (167)
Profit before tax 1,520
Income tax expense (343)
Profit for the year 1,177
The following table presents information on revenues and expenditures of INA Group operations for 2017:
2017
Exploration
and
Production
Refining and
Marketing
Corporate
and other
Intersegment
transfers and
consolidation
adjustments Total
Sales to external customers 348 17,848 386 - 18,582 Intersegment sales 3,412 151 1,065 (4,628) -
Total revenue 3,760 17,999 1,451 (4,628) 18,582
Operating expenses, net of other operating income (2,174) (17,634) (1,879) 4,523 (17,164)
Profit/(loss) from operations 1,586 365 (428) (105) 1,418
Net finance gain 146
Profit before tax 1,564
Income tax expense (342)
Profit for the year 1,222
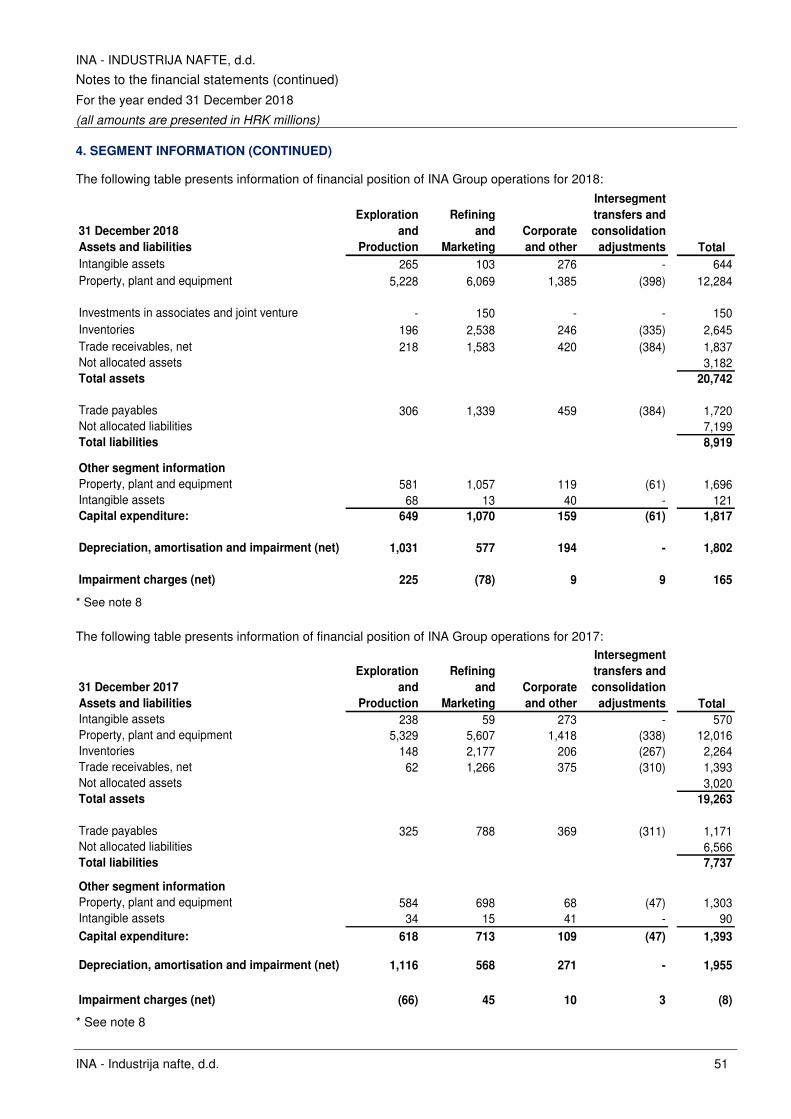
INA - INDUSTRIJA NAFTE, d.d.
Notes to the financial statements (continued)
For the year ended 31 December 2018
(all amounts are presented in HRK millions)
INA - Industrija nafte, d.d. 51
4. SEGMENT INFORMATION (CONTINUED)
The following table presents information of financial position of INA Group operations for 2018:
31 December 2018
Assets and liabilities
Exploration
and
Production
Refining
and
Marketing
Corporate
and other
Intersegment
transfers and
consolidation
adjustments Total
Intangible assets 265 103 276 - 644Property, plant and equipment 5,228 6,069 1,385 (398) 12,284
Investments in associates and joint venture - 150 - - 150Inventories 196 2,538 246 (335) 2,645Trade receivables, net 218 1,583 420 (384) 1,837Not allocated assets 3,182Total assets 20,742
Trade payables 306 1,339 459 (384) 1,720Not allocated liabilities 7,199Total liabilities 8,919
Other segment information
Property, plant and equipment 581 1,057 119 (61) 1,696Intangible assets 68 13 40 - 121Capital expenditure: 649 1,070 159 (61) 1,817
Depreciation, amortisation and impairment (net) 1,031 577 194 - 1,802
Impairment charges (net) 225 (78) 9 9 165
* See note 8
The following table presents information of financial position of INA Group operations for 2017:
31 December 2017
Assets and liabilities
Exploration
and
Production
Refining
and
Marketing
Corporate
and other
Intersegment
transfers and
consolidation
adjustments Total
Intangible assets 238 59 273 - 570Property, plant and equipment 5,329 5,607 1,418 (338) 12,016Inventories 148 2,177 206 (267) 2,264Trade receivables, net 62 1,266 375 (310) 1,393Not allocated assets 3,020Total assets 19,263
Trade payables 325 788 369 (311) 1,171Not allocated liabilities 6,566Total liabilities 7,737
Other segment information
Property, plant and equipment 584 698 68 (47) 1,303Intangible assets 34 15 41 - 90Capital expenditure: 618 713 109 (47) 1,393
Depreciation, amortisation and impairment (net) 1,116 568 271 - 1,955
Impairment charges (net) (66) 45 10 3 (8)
* See note 8
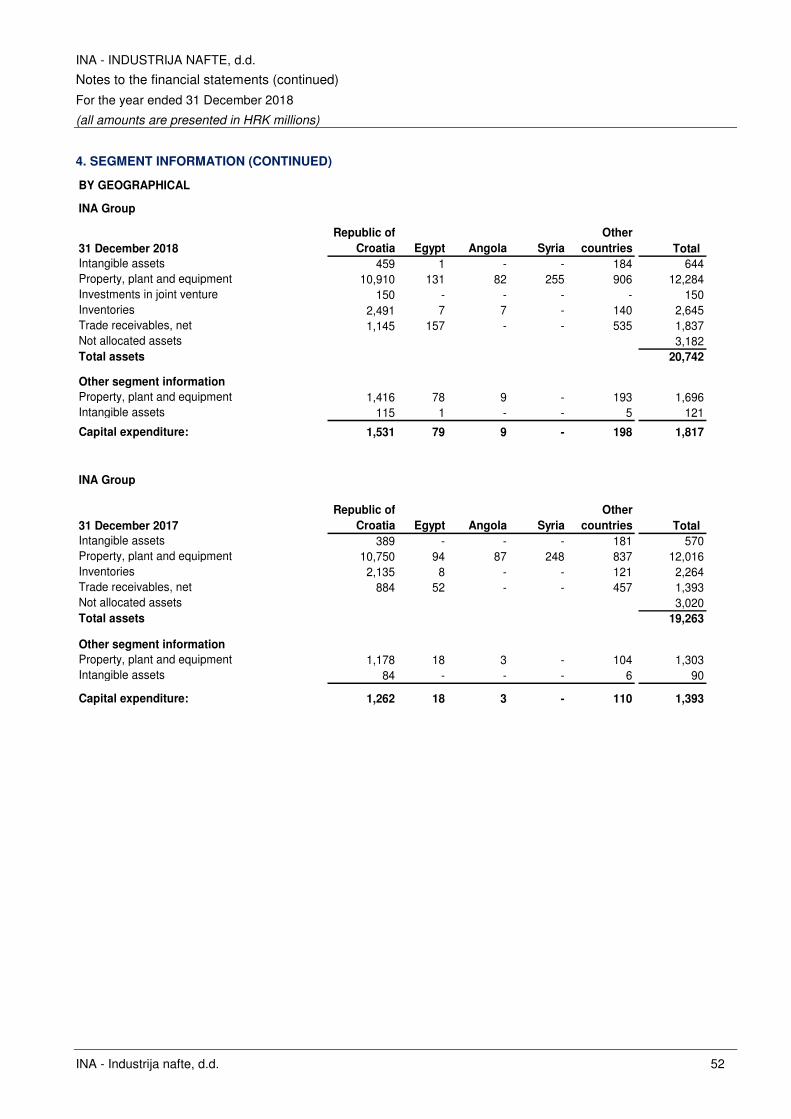
INA - INDUSTRIJA NAFTE, d.d.
Notes to the financial statements (continued)
For the year ended 31 December 2018
(all amounts are presented in HRK millions)
INA - Industrija nafte, d.d. 52
4. SEGMENT INFORMATION (CONTINUED)
BY GEOGRAPHICAL
INA Group
31 December 2018
Republic of
Croatia Egypt Angola Syria
Other
countries Total
Intangible assets 459 1 - - 184 644Property, plant and equipment 10,910 131 82 255 906 12,284Investments in joint venture 150 - - - - 150Inventories 2,491 7 7 - 140 2,645Trade receivables, net 1,145 157 - - 535 1,837Not allocated assets 3,182Total assets 20,742
Other segment information
Property, plant and equipment 1,416 78 9 - 193 1,696Intangible assets 115 1 - - 5 121
Capital expenditure: 1,531 79 9 - 198 1,817
INA Group
31 December 2017
Republic of
Croatia Egypt Angola Syria
Other
countries Total
Intangible assets 389 - - - 181 570Property, plant and equipment 10,750 94 87 248 837 12,016Inventories 2,135 8 - - 121 2,264Trade receivables, net 884 52 - - 457 1,393Not allocated assets 3,020Total assets 19,263
Other segment information
Property, plant and equipment 1,178 18 3 - 104 1,303Intangible assets 84 - - - 6 90
Capital expenditure: 1,262 18 3 - 110 1,393
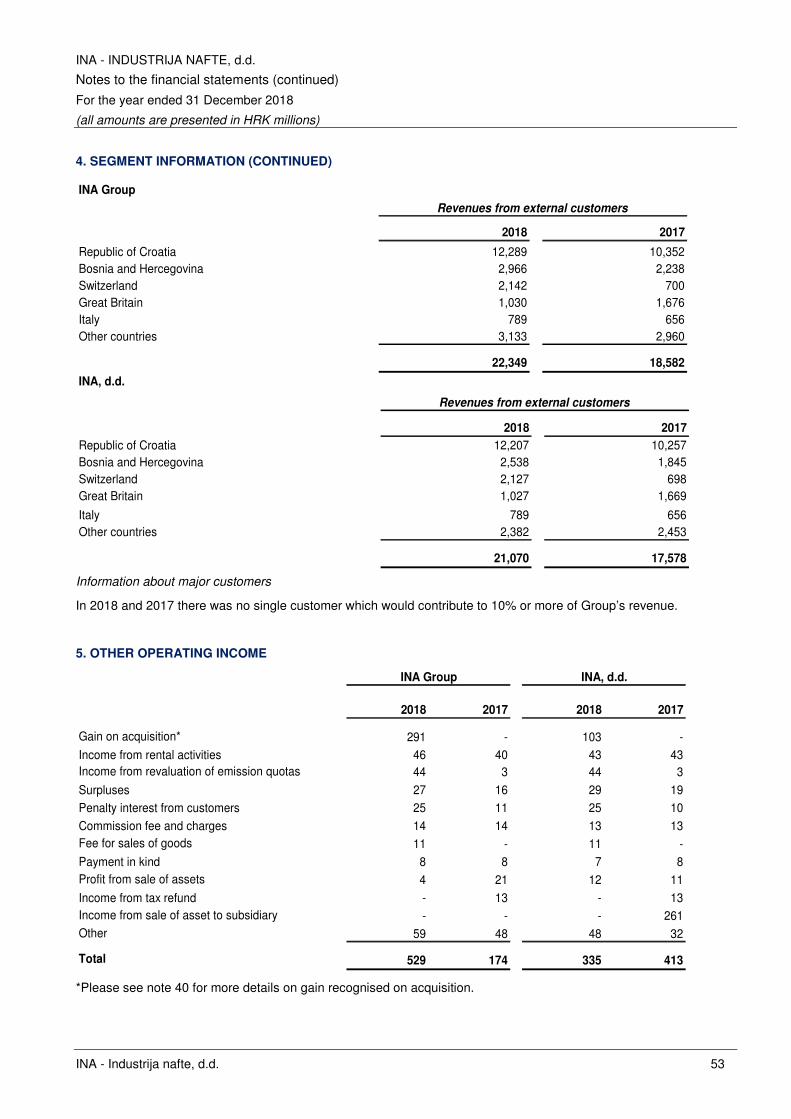
INA - INDUSTRIJA NAFTE, d.d.
Notes to the financial statements (continued)
For the year ended 31 December 2018
(all amounts are presented in HRK millions)
INA - Industrija nafte, d.d. 53
4. SEGMENT INFORMATION (CONTINUED)
2018 2017
Republic of Croatia 12,289 10,352Bosnia and Hercegovina 2,966 2,238Switzerland 2,142 700Great Britain 1,030 1,676Italy 789 656Other countries 3,133 2,960
22,349 18,582
Revenues from external customers
INA Group
2018 2017
Republic of Croatia 12,207 10,257Bosnia and Hercegovina 2,538 1,845Switzerland 2,127 698Great Britain 1,027 1,669
Italy 789 656Other countries 2,382 2,453
21,070 17,578
Revenues from external customers
INA, d.d.
Information about major customers
In 2018 and 2017 there was no single customer which would contribute to 10% or more of Group’s revenue.
5. OTHER OPERATING INCOME
2018 2017 2018 2017
Gain on acquisition* 291 - 103 -Income from rental activities 46 40 43 43Income from revaluation of emission quotas 44 3 44 3
Surpluses 27 16 29 19Penalty interest from customers 25 11 25 10
Commission fee and charges 14 14 13 13Fee for sales of goods 11 - 11 -Payment in kind 8 8 7 8Profit from sale of assets 4 21 12 11
Income from tax refund - 13 - 13Income from sale of asset to subsidiary - - - 261Other 59 48 48 32
Total 529 174 335 413
INA Group INA, d.d.
*Please see note 40 for more details on gain recognised on acquisition.
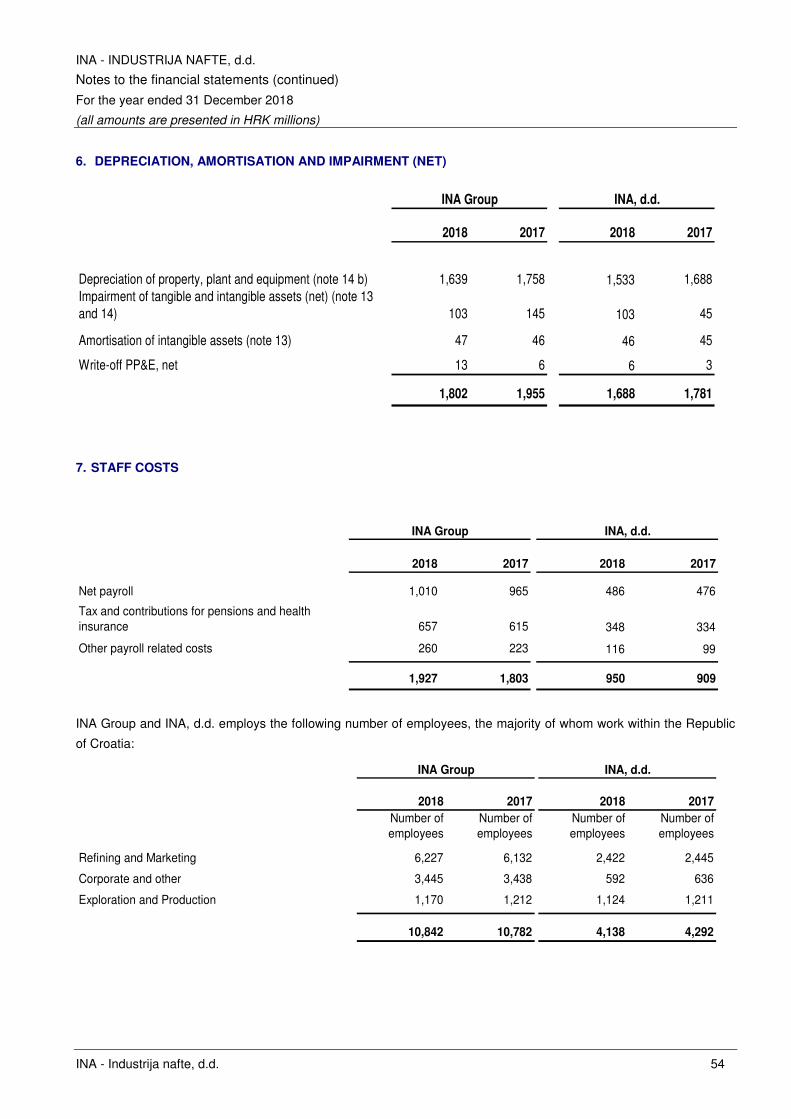
INA - INDUSTRIJA NAFTE, d.d.
Notes to the financial statements (continued)
For the year ended 31 December 2018
(all amounts are presented in HRK millions)
INA - Industrija nafte, d.d. 54
6. DEPRECIATION, AMORTISATION AND IMPAIRMENT (NET)
2018 2017 2018 2017
Depreciation of property, plant and equipment (note 14 b) 1,639 1,758 1,533 1,688Impairment of tangible and intangible assets (net) (note 13 and 14) 103 145 103 45
Amortisation of intangible assets (note 13) 47 46 46 45
Write-off PP&E, net 13 6 6 3
1,802 1,955 1,688 1,781
INA Group INA, d.d.
7. STAFF COSTS
2018 2017 2018 2017
Net payroll 1,010 965 486 476
Tax and contributions for pensions and health insurance 657 615 348 334
Other payroll related costs 260 223 116 99
1,927 1,803 950 909
INA, d.d.INA Group
INA Group and INA, d.d. employs the following number of employees, the majority of whom work within the Republic
of Croatia:
2018 2017 2018 2017
Number of employees
Number of employees
Number of employees
Number of employees
Refining and Marketing 6,227 6,132 2,422 2,445
Corporate and other 3,445 3,438 592 636
Exploration and Production 1,170 1,212 1,124 1,211
10,842 10,782 4,138 4,292
INA, d.d.INA Group
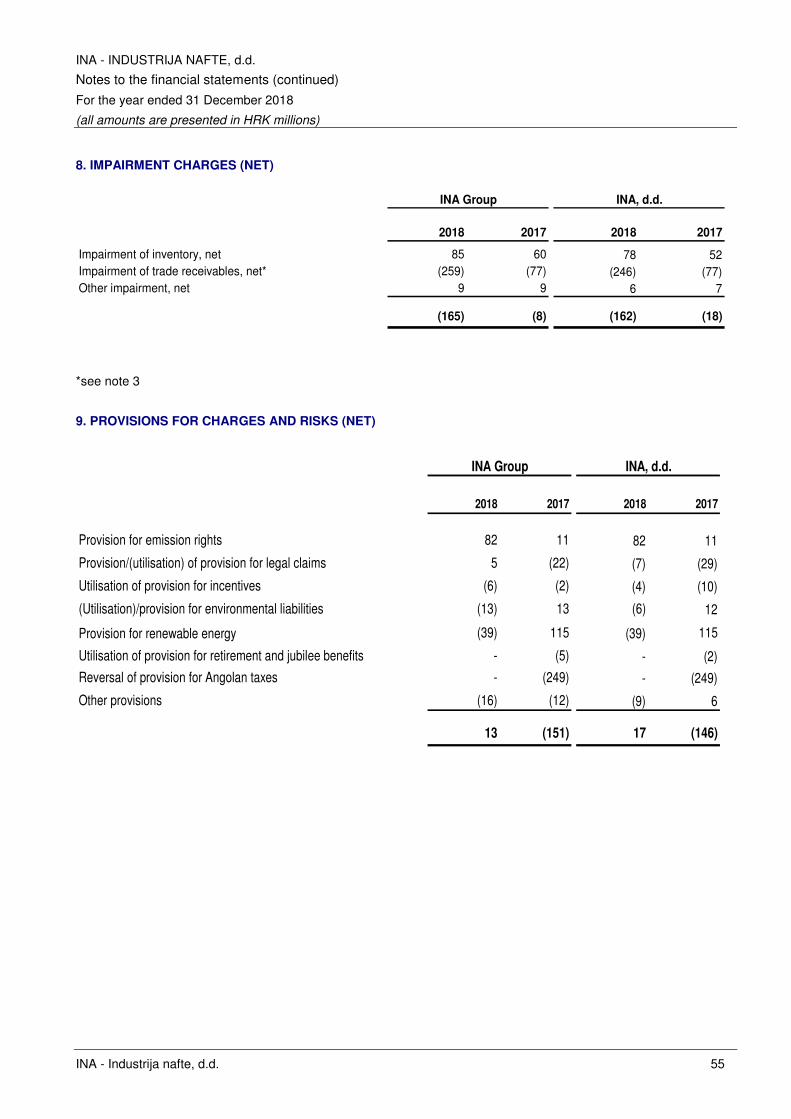
INA - INDUSTRIJA NAFTE, d.d.
Notes to the financial statements (continued)
For the year ended 31 December 2018
(all amounts are presented in HRK millions)
INA - Industrija nafte, d.d. 55
8. IMPAIRMENT CHARGES (NET)
2018 2017 2018 2017
Impairment of inventory, net 85 60 78 52Impairment of trade receivables, net* (259) (77) (246) (77)Other impairment, net 9 9 6 7
(165) (8) (162) (18)
INA Group INA, d.d.
*see note 3
9. PROVISIONS FOR CHARGES AND RISKS (NET)
2018 2017 2018 2017
Provision for emission rights 82 11 82 11
Provision/(utilisation) of provision for legal claims 5 (22) (7) (29)
Utilisation of provision for incentives (6) (2) (4) (10)
(Utilisation)/provision for environmental liabilities (13) 13 (6) 12
Provision for renewable energy (39) 115 (39) 115
Utilisation of provision for retirement and jubilee benefits - (5) - (2)
Reversal of provision for Angolan taxes - (249) - (249)
Other provisions (16) (12) (9) 6
13 (151) 17 (146)
INA Group INA, d.d.
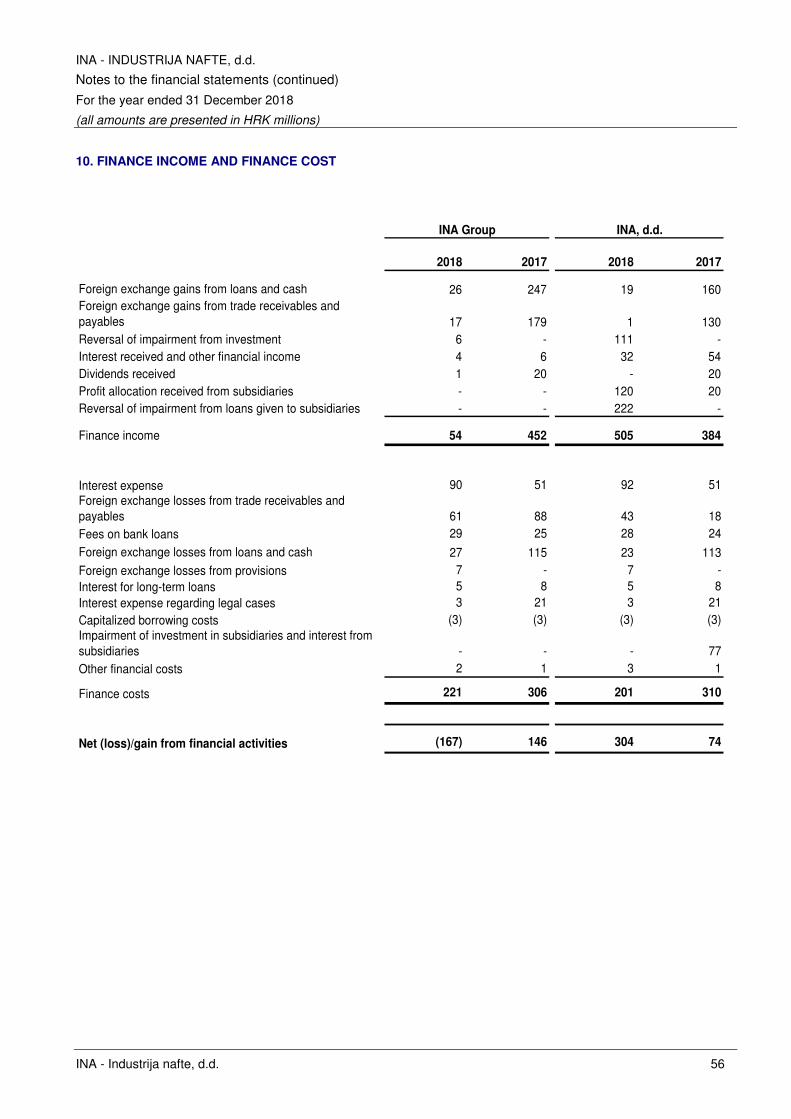
INA - INDUSTRIJA NAFTE, d.d.
Notes to the financial statements (continued)
For the year ended 31 December 2018
(all amounts are presented in HRK millions)
INA - Industrija nafte, d.d. 56
10. FINANCE INCOME AND FINANCE COST
2018 2017 2018 2017
Foreign exchange gains from loans and cash 26 247 19 160Foreign exchange gains from trade receivables and payables 17 179 1 130Reversal of impairment from investment 6 - 111 -Interest received and other financial income 4 6 32 54Dividends received 1 20 - 20Profit allocation received from subsidiaries - - 120 20Reversal of impairment from loans given to subsidiaries - - 222 -
Finance income 54 452 505 384
Interest expense 90 51 92 51Foreign exchange losses from trade receivables and payables 61 88 43 18Fees on bank loans 29 25 28 24
Foreign exchange losses from loans and cash 27 115 23 113Foreign exchange losses from provisions 7 - 7 -Interest for long-term loans 5 8 5 8Interest expense regarding legal cases 3 21 3 21Capitalized borrowing costs (3) (3) (3) (3)Impairment of investment in subsidiaries and interest from subsidiaries - - - 77Other financial costs 2 1 3 1
Finance costs 221 306 201 310
Net (loss)/gain from financial activities (167) 146 304 74
INA Group INA, d.d.
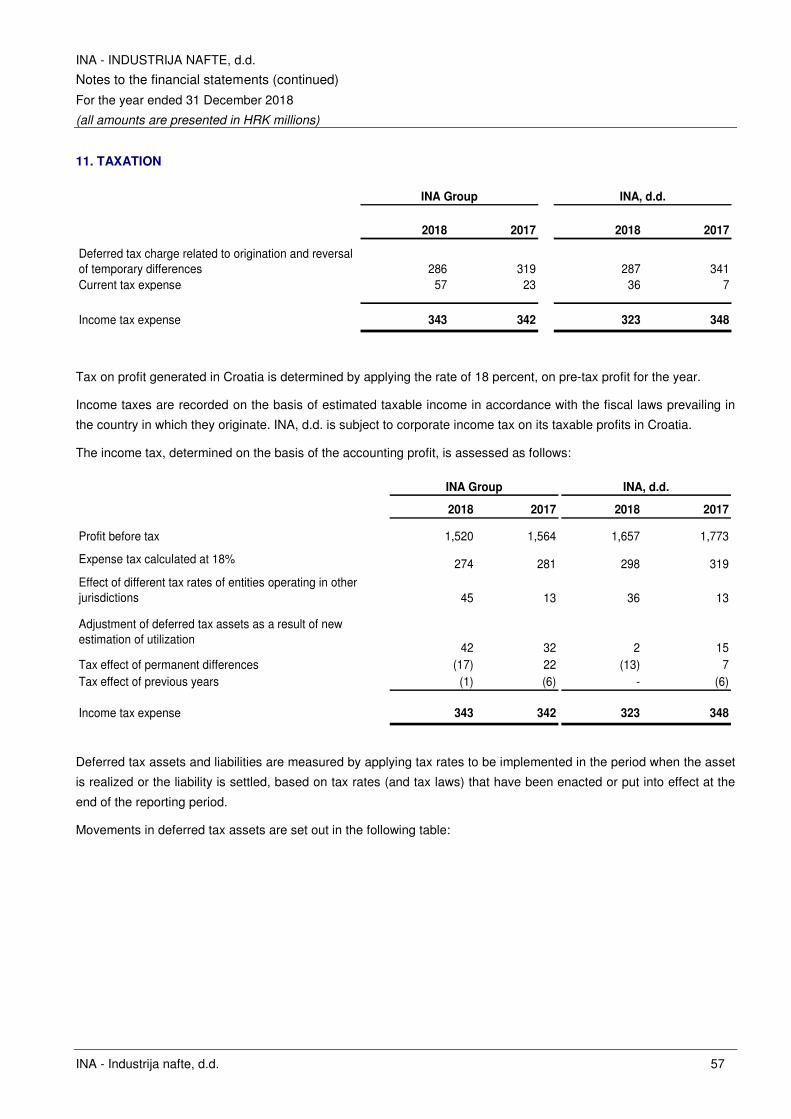
INA - INDUSTRIJA NAFTE, d.d.
Notes to the financial statements (continued)
For the year ended 31 December 2018
(all amounts are presented in HRK millions)
INA - Industrija nafte, d.d. 57
11. TAXATION
2018 2017 2018 2017
Deferred tax charge related to origination and reversal of temporary differences 286 319 287 341Current tax expense 57 23 36 7
Income tax expense 343 342 323 348
INA Group INA, d.d.
Tax on profit generated in Croatia is determined by applying the rate of 18 percent, on pre-tax profit for the year.
Income taxes are recorded on the basis of estimated taxable income in accordance with the fiscal laws prevailing in
the country in which they originate. INA, d.d. is subject to corporate income tax on its taxable profits in Croatia.
The income tax, determined on the basis of the accounting profit, is assessed as follows:
2018 2017 2018 2017
Profit before tax 1,520 1,564 1,657 1,773
Expense tax calculated at 18% 274 281 298 319
Effect of different tax rates of entities operating in other jurisdictions 45 13 36 13
Adjustment of deferred tax assets as a result of new estimation of utilization
42 32 2 15Tax effect of permanent differences (17) 22 (13) 7Tax effect of previous years (1) (6) - (6)
Income tax expense 343 342 323 348
INA Group INA, d.d.
Deferred tax assets and liabilities are measured by applying tax rates to be implemented in the period when the asset
is realized or the liability is settled, based on tax rates (and tax laws) that have been enacted or put into effect at the
end of the reporting period.
Movements in deferred tax assets are set out in the following table:
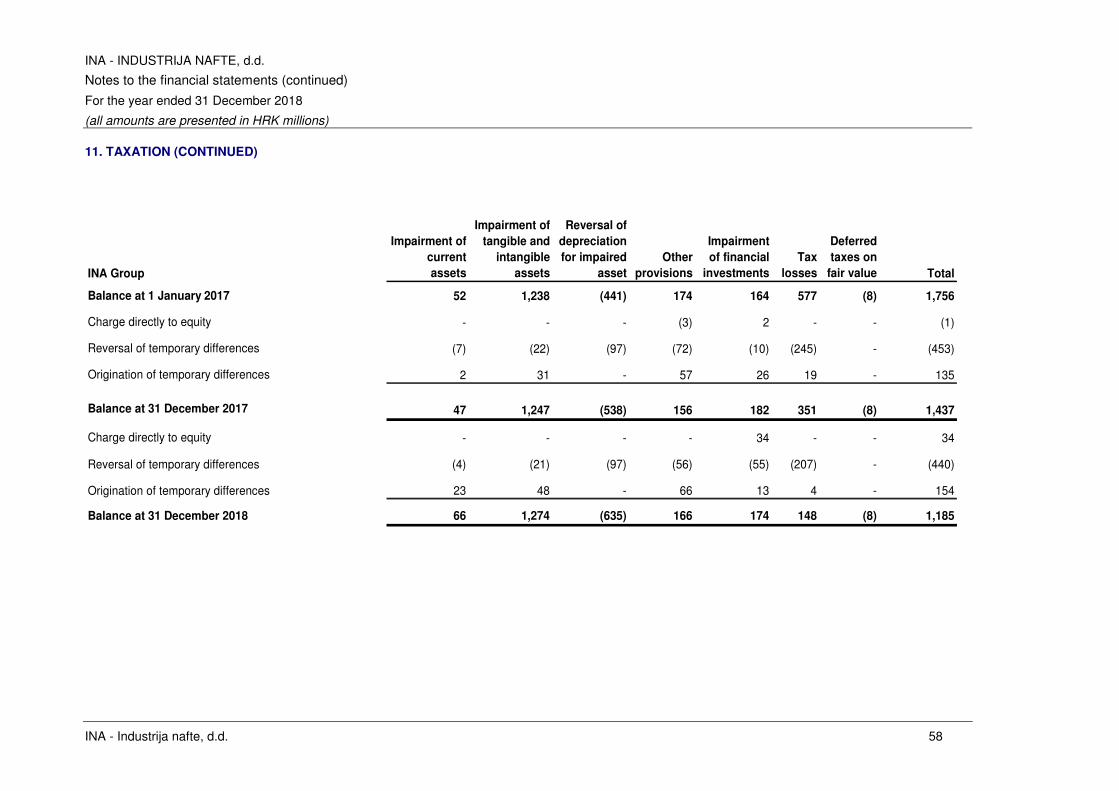
INA - INDUSTRIJA NAFTE, d.d.
Notes to the financial statements (continued)
For the year ended 31 December 2018
(all amounts are presented in HRK millions)
INA - Industrija nafte, d.d. 58
11. TAXATION (CONTINUED)
INA Group
Impairment of
current
assets
Impairment of
tangible and
intangible
assets
Reversal of
depreciation
for impaired
asset
Other
provisions
Impairment
of financial
investments
Tax
losses
Deferred
taxes on
fair value Total
Balance at 1 January 2017 52 1,238 (441) 174 164 577 (8) 1,756
Charge directly to equity - - - (3) 2 - - (1)
Reversal of temporary differences (7) (22) (97) (72) (10) (245) - (453)
Origination of temporary differences 2 31 - 57 26 19 - 135
Balance at 31 December 2017 47 1,247 (538) 156 182 351 (8) 1,437
Charge directly to equity - - - - 34 - - 34
Reversal of temporary differences (4) (21) (97) (56) (55) (207) - (440)
Origination of temporary differences 23 48 - 66 13 4 - 154
Balance at 31 December 2018 66 1,274 (635) 166 174 148 (8) 1,185
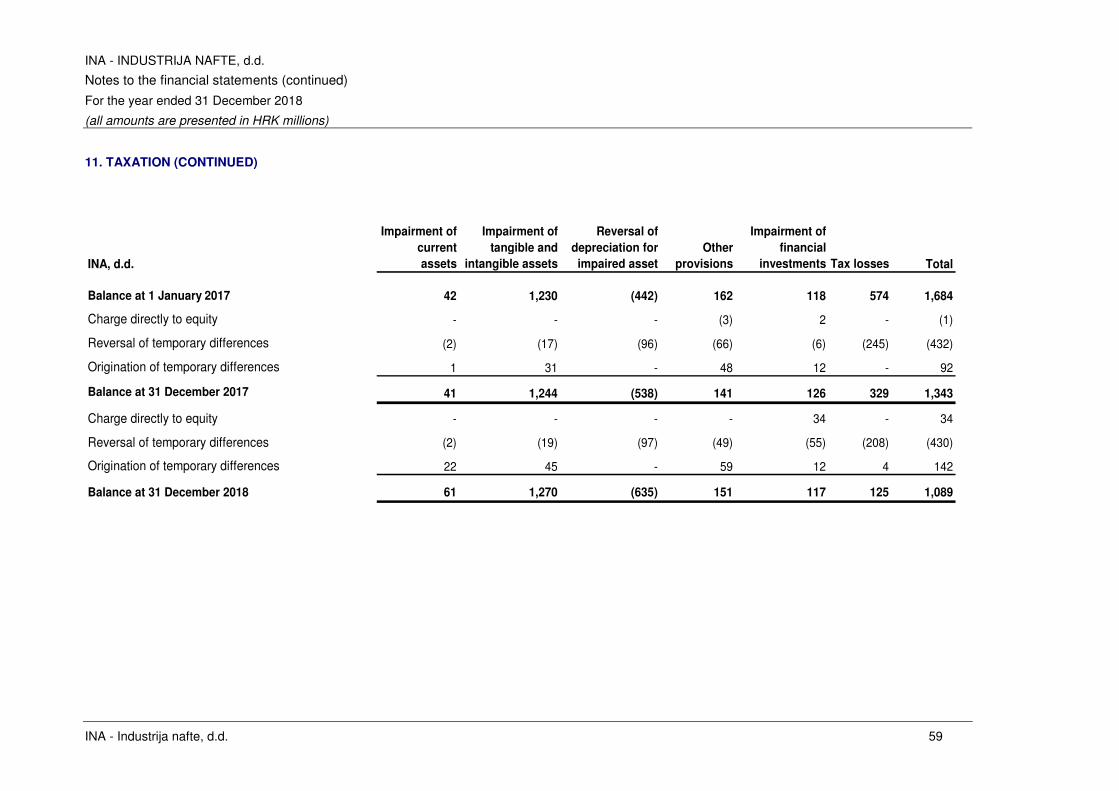
INA - INDUSTRIJA NAFTE, d.d.
Notes to the financial statements (continued)
For the year ended 31 December 2018
(all amounts are presented in HRK millions)
INA - Industrija nafte, d.d. 59
11. TAXATION (CONTINUED)
INA, d.d.
Impairment of
current
assets
Impairment of
tangible and
intangible assets
Reversal of
depreciation for
impaired asset
Other
provisions
Impairment of
financial
investments Tax losses Total
Balance at 1 January 2017 42 1,230 (442) 162 118 574 1,684
Charge directly to equity - - - (3) 2 - (1)
Reversal of temporary differences (2) (17) (96) (66) (6) (245) (432)
Origination of temporary differences 1 31 - 48 12 - 92
Balance at 31 December 2017 41 1,244 (538) 141 126 329 1,343
Charge directly to equity - - - - 34 - 34
Reversal of temporary differences (2) (19) (97) (49) (55) (208) (430)
Origination of temporary differences 22 45 - 59 12 4 142
Balance at 31 December 2018 61 1,270 (635) 151 117 125 1,089
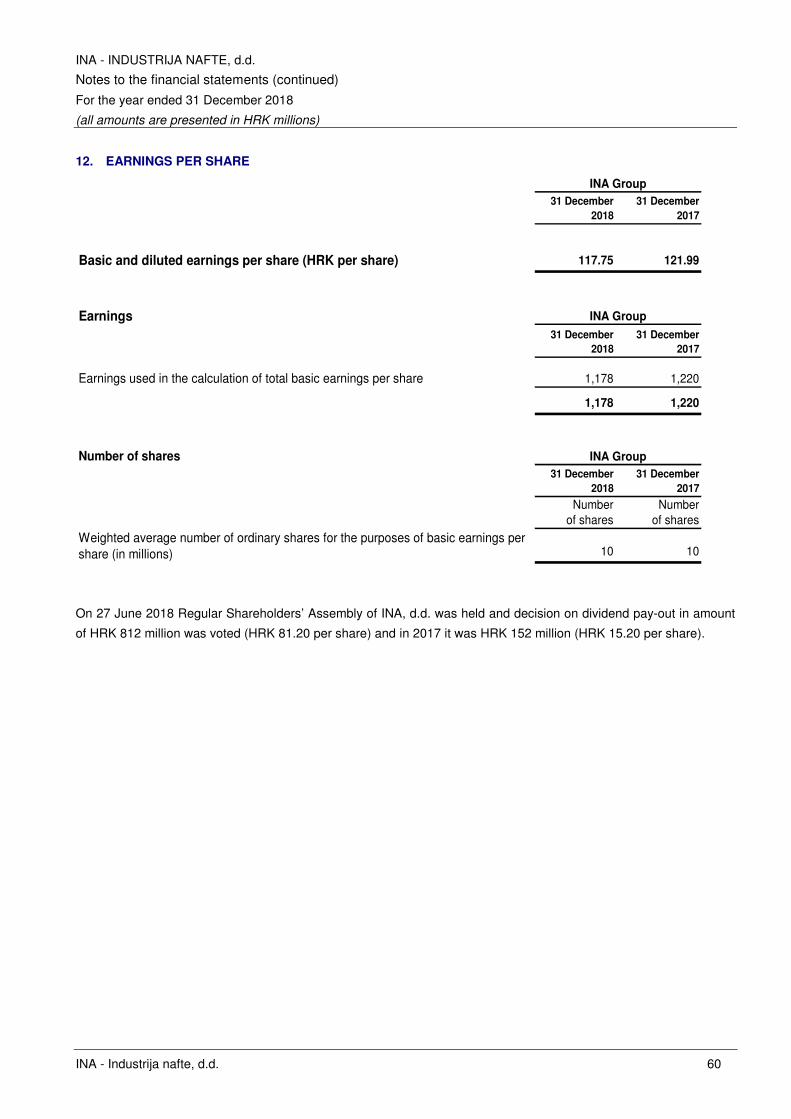
INA - INDUSTRIJA NAFTE, d.d.
Notes to the financial statements (continued)
For the year ended 31 December 2018
(all amounts are presented in HRK millions)
INA - Industrija nafte, d.d. 60
12. EARNINGS PER SHARE
31 December
2018
31 December
2017
Basic and diluted earnings per share (HRK per share) 117.75 121.99
Earnings
31 December
2018
31 December
2017
Earnings used in the calculation of total basic earnings per share 1,178 1,220
1,178 1,220
Number of shares
31 December
2018
31 December
2017
Number of shares
Number of shares
Weighted average number of ordinary shares for the purposes of basic earnings per share (in millions) 10 10
INA Group
INA Group
INA Group
On 27 June 2018 Regular Shareholders’ Assembly of INA, d.d. was held and decision on dividend pay-out in amount
of HRK 812 million was voted (HRK 81.20 per share) and in 2017 it was HRK 152 million (HRK 15.20 per share).
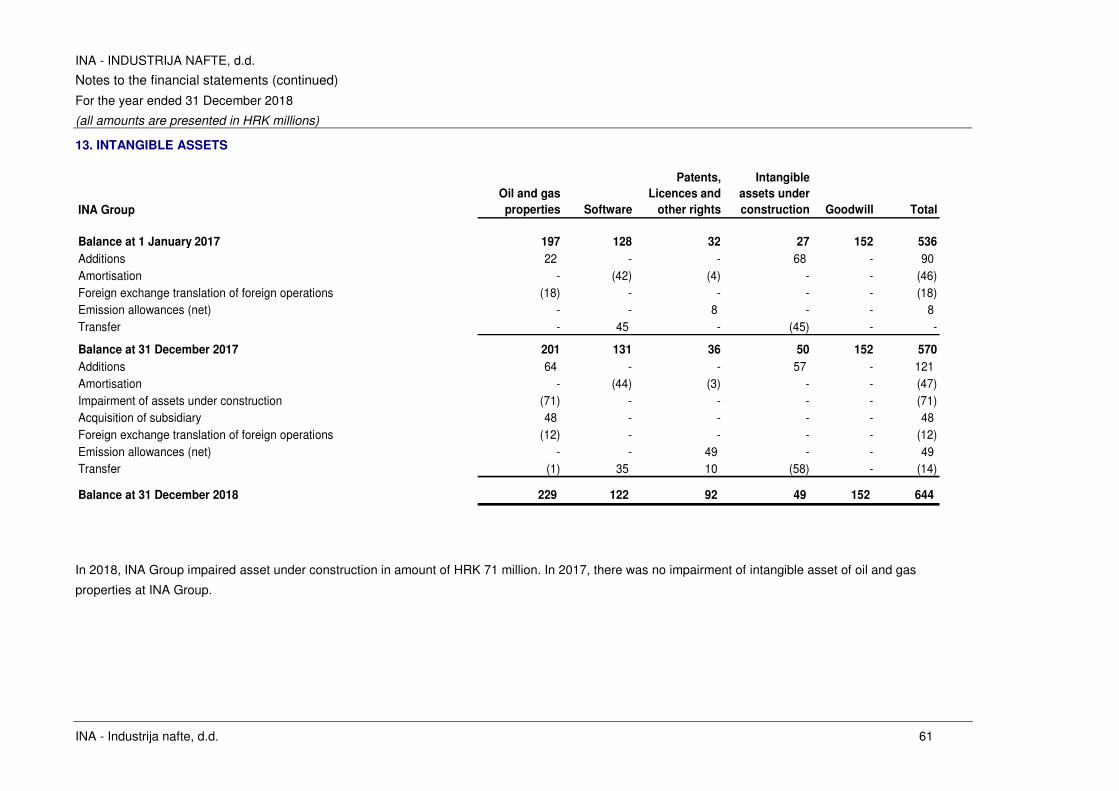
INA - INDUSTRIJA NAFTE, d.d.
Notes to the financial statements (continued)
For the year ended 31 December 2018
(all amounts are presented in HRK millions)
INA - Industrija nafte, d.d. 61
13. INTANGIBLE ASSETS
INA Group
Oil and gas
properties Software
Patents,
Licences and
other rights
Intangible
assets under
construction Goodwill Total
Balance at 1 January 2017 197 128 32 27 152 536
Additions 22 - - 68 - 90 Amortisation - (42) (4) - - (46)Foreign exchange translation of foreign operations (18) - - - - (18)Emission allowances (net) - - 8 - - 8 Transfer - 45 - (45) - -
Balance at 31 December 2017 201 131 36 50 152 570
Additions 64 - - 57 - 121 Amortisation - (44) (3) - - (47)Impairment of assets under construction (71) - - - - (71)Acquisition of subsidiary 48 - - - - 48 Foreign exchange translation of foreign operations (12) - - - - (12)Emission allowances (net) - - 49 - - 49 Transfer (1) 35 10 (58) - (14)
Balance at 31 December 2018 229 122 92 49 152 644
In 2018, INA Group impaired asset under construction in amount of HRK 71 million. In 2017, there was no impairment of intangible asset of oil and gas
properties at INA Group.
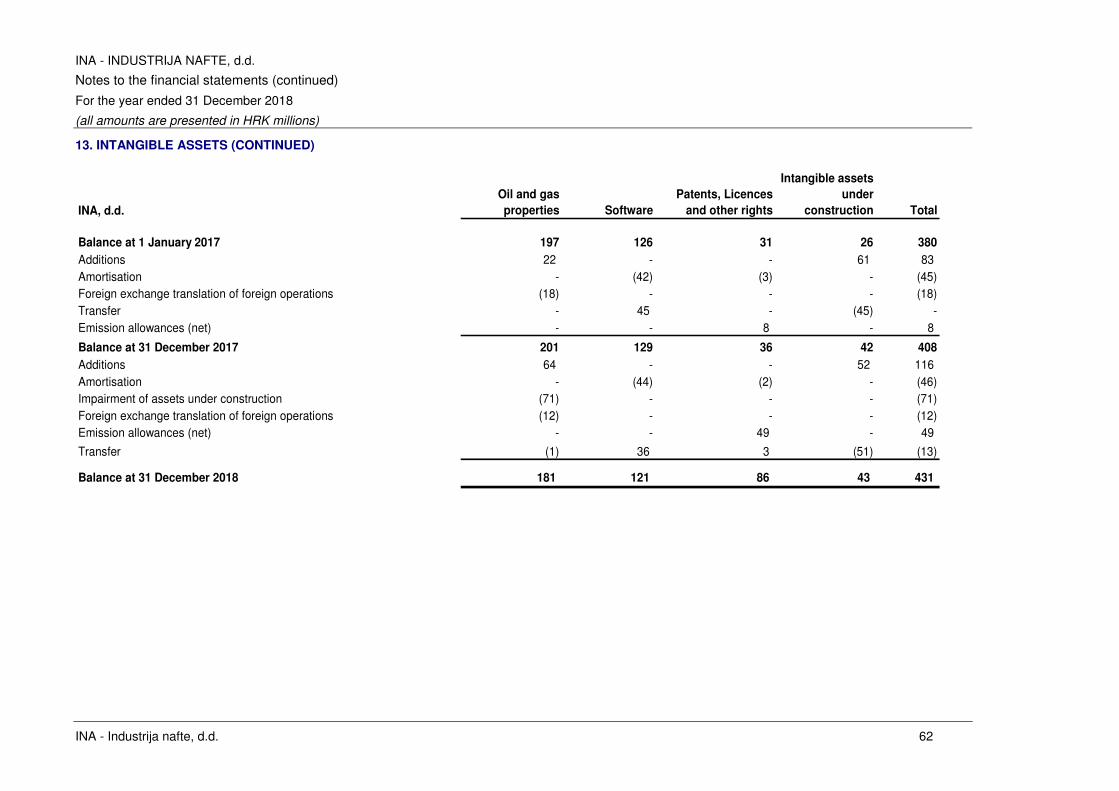
INA - INDUSTRIJA NAFTE, d.d.
Notes to the financial statements (continued)
For the year ended 31 December 2018
(all amounts are presented in HRK millions)
INA - Industrija nafte, d.d. 62
13. INTANGIBLE ASSETS (CONTINUED)
INA, d.d.
Oil and gas
properties Software
Patents, Licences
and other rights
Intangible assets
under
construction Total
Balance at 1 January 2017 197 126 31 26 380
Additions 22 - - 61 83 Amortisation - (42) (3) - (45)Foreign exchange translation of foreign operations (18) - - - (18)Transfer - 45 - (45) -Emission allowances (net) - - 8 - 8
Balance at 31 December 2017 201 129 36 42 408
Additions 64 - - 52 116 Amortisation - (44) (2) - (46)Impairment of assets under construction (71) - - - (71)Foreign exchange translation of foreign operations (12) - - - (12)Emission allowances (net) - - 49 - 49
Transfer (1) 36 3 (51) (13)
Balance at 31 December 2018 181 121 86 43 431
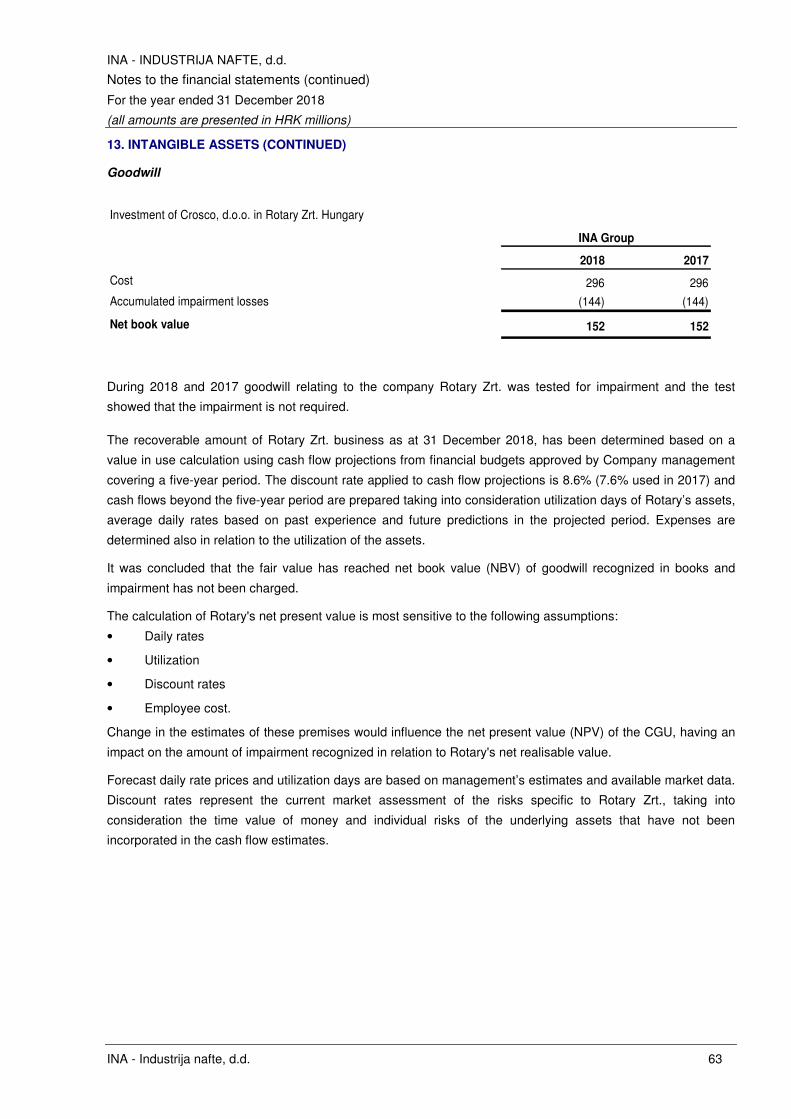
INA - INDUSTRIJA NAFTE, d.d.
Notes to the financial statements (continued)
For the year ended 31 December 2018
(all amounts are presented in HRK millions)
INA - Industrija nafte, d.d. 63
13. INTANGIBLE ASSETS (CONTINUED)
Goodwill
Investment of Crosco, d.o.o. in Rotary Zrt. Hungary
2018 2017
Cost 296 296
Accumulated impairment losses (144) (144)
Net book value 152 152
INA Group
During 2018 and 2017 goodwill relating to the company Rotary Zrt. was tested for impairment and the test
showed that the impairment is not required.
The recoverable amount of Rotary Zrt. business as at 31 December 2018, has been determined based on a
value in use calculation using cash flow projections from financial budgets approved by Company management
covering a five-year period. The discount rate applied to cash flow projections is 8.6% (7.6% used in 2017) and
cash flows beyond the five-year period are prepared taking into consideration utilization days of Rotary’s assets,
average daily rates based on past experience and future predictions in the projected period. Expenses are
determined also in relation to the utilization of the assets.
It was concluded that the fair value has reached net book value (NBV) of goodwill recognized in books and
impairment has not been charged.
The calculation of Rotary's net present value is most sensitive to the following assumptions:
• Daily rates
• Utilization
• Discount rates
• Employee cost.
Change in the estimates of these premises would influence the net present value (NPV) of the CGU, having an
impact on the amount of impairment recognized in relation to Rotary's net realisable value.
Forecast daily rate prices and utilization days are based on management’s estimates and available market data.
Discount rates represent the current market assessment of the risks specific to Rotary Zrt., taking into
consideration the time value of money and individual risks of the underlying assets that have not been
incorporated in the cash flow estimates.
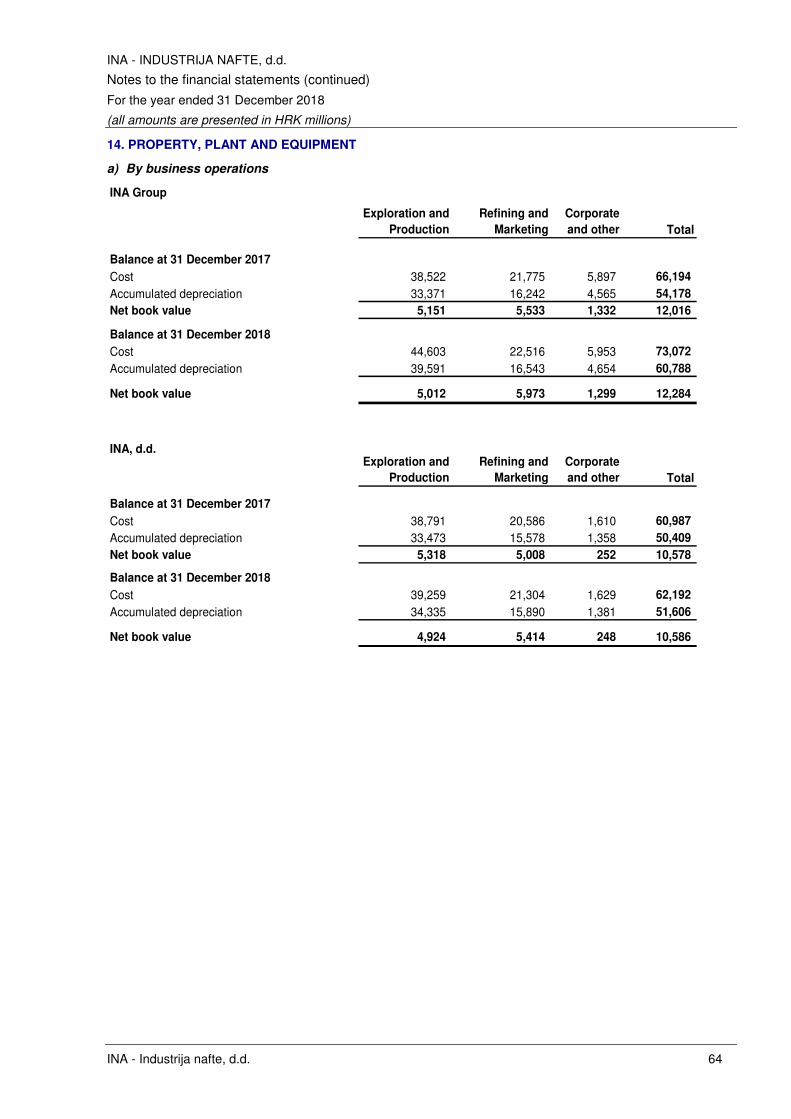
INA - INDUSTRIJA NAFTE, d.d.
Notes to the financial statements (continued)
For the year ended 31 December 2018
(all amounts are presented in HRK millions)
INA - Industrija nafte, d.d. 64
14. PROPERTY, PLANT AND EQUIPMENT
a) By business operations
INA Group
Exploration and
Production
Refining and
Marketing
Corporate
and other Total
Balance at 31 December 2017
Cost 38,522 21,775 5,897 66,194
Accumulated depreciation 33,371 16,242 4,565 54,178
Net book value 5,151 5,533 1,332 12,016
Balance at 31 December 2018
Cost 44,603 22,516 5,953 73,072
Accumulated depreciation 39,591 16,543 4,654 60,788
Net book value 5,012 5,973 1,299 12,284
INA, d.d.Exploration and
Production
Refining and
Marketing
Corporate
and other Total
Balance at 31 December 2017
Cost 38,791 20,586 1,610 60,987
Accumulated depreciation 33,473 15,578 1,358 50,409
Net book value 5,318 5,008 252 10,578
Balance at 31 December 2018
Cost 39,259 21,304 1,629 62,192
Accumulated depreciation 34,335 15,890 1,381 51,606
Net book value 4,924 5,414 248 10,586
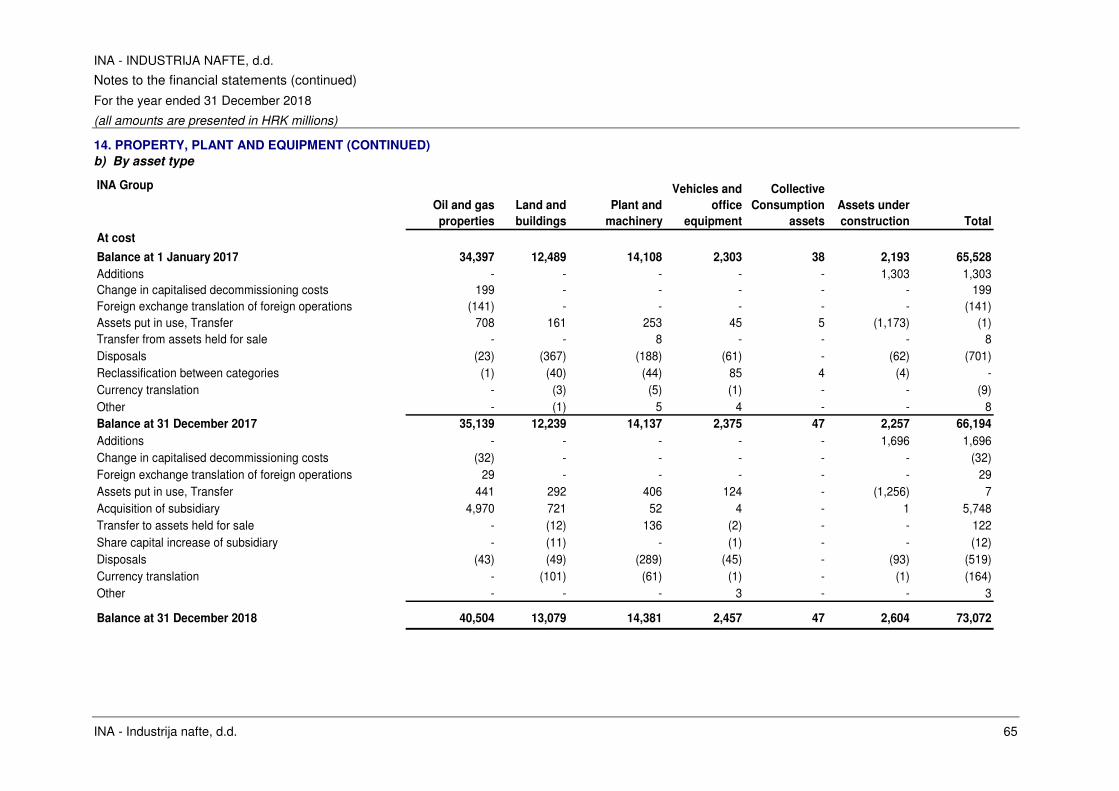
INA - INDUSTRIJA NAFTE, d.d.
Notes to the financial statements (continued)
For the year ended 31 December 2018
(all amounts are presented in HRK millions)
INA - Industrija nafte, d.d. 65
14. PROPERTY, PLANT AND EQUIPMENT (CONTINUED)
b) By asset type
INA Group
Oil and gas
properties
Land and
buildings
Plant and
machinery
Vehicles and
office
equipment
Collective
Consumption
assets
Assets under
construction Total
At cost
Balance at 1 January 2017 34,397 12,489 14,108 2,303 38 2,193 65,528
Additions - - - - - 1,303 1,303Change in capitalised decommissioning costs 199 - - - - - 199Foreign exchange translation of foreign operations (141) - - - - - (141)Assets put in use, Transfer 708 161 253 45 5 (1,173) (1)Transfer from assets held for sale - - 8 - - - 8Disposals (23) (367) (188) (61) - (62) (701)Reclassification between categories (1) (40) (44) 85 4 (4) -Currency translation - (3) (5) (1) - - (9)Other - (1) 5 4 - - 8Balance at 31 December 2017 35,139 12,239 14,137 2,375 47 2,257 66,194
Additions - - - - - 1,696 1,696Change in capitalised decommissioning costs (32) - - - - - (32)Foreign exchange translation of foreign operations 29 - - - - - 29Assets put in use, Transfer 441 292 406 124 - (1,256) 7Acquisition of subsidiary 4,970 721 52 4 - 1 5,748Transfer to assets held for sale - (12) 136 (2) - - 122Share capital increase of subsidiary - (11) - (1) - - (12)Disposals (43) (49) (289) (45) - (93) (519)Currency translation - (101) (61) (1) - (1) (164)Other - - - 3 - - 3
Balance at 31 December 2018 40,504 13,079 14,381 2,457 47 2,604 73,072
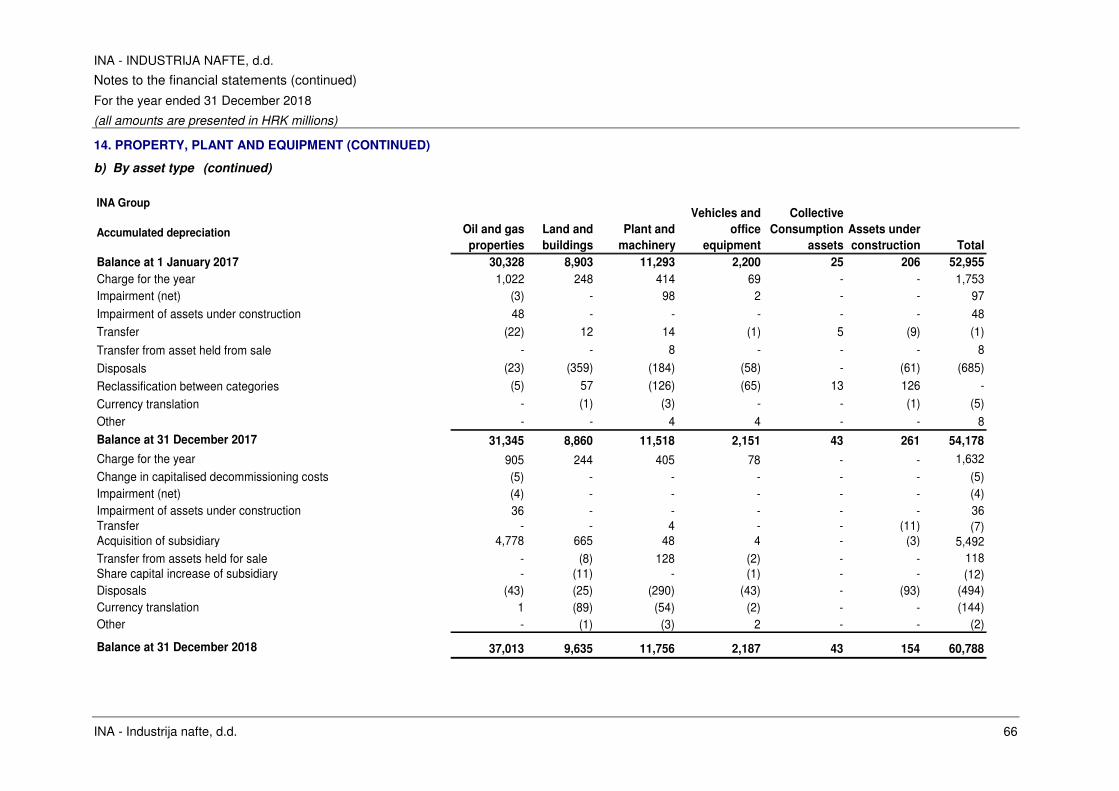
INA - INDUSTRIJA NAFTE, d.d.
Notes to the financial statements (continued)
For the year ended 31 December 2018
(all amounts are presented in HRK millions)
INA - Industrija nafte, d.d. 66
14. PROPERTY, PLANT AND EQUIPMENT (CONTINUED)
b) By asset type (continued)
INA Group
Accumulated depreciation Oil and gas
properties
Land and
buildings
Plant and
machinery
Vehicles and
office
equipment
Collective
Consumption
assets
Assets under
construction Total
Balance at 1 January 2017 30,328 8,903 11,293 2,200 25 206 52,955
Charge for the year 1,022 248 414 69 - - 1,753Impairment (net) (3) - 98 2 - - 97
Impairment of assets under construction 48 - - - - - 48
Transfer (22) 12 14 (1) 5 (9) (1)
Transfer from asset held from sale - - 8 - - - 8
Disposals (23) (359) (184) (58) - (61) (685)
Reclassification between categories (5) 57 (126) (65) 13 126 -
Currency translation - (1) (3) - - (1) (5)
Other - - 4 4 - - 8
Balance at 31 December 2017 31,345 8,860 11,518 2,151 43 261 54,178
Charge for the year 905 244 405 78 - - 1,632
Change in capitalised decommissioning costs (5) - - - - - (5)Impairment (net) (4) - - - - - (4)Impairment of assets under construction 36 - - - - - 36Transfer - - 4 - - (11) (7)Acquisition of subsidiary 4,778 665 48 4 - (3) 5,492Transfer from assets held for sale - (8) 128 (2) - - 118Share capital increase of subsidiary - (11) - (1) - - (12)Disposals (43) (25) (290) (43) - (93) (494)Currency translation 1 (89) (54) (2) - - (144)Other - (1) (3) 2 - - (2)
Balance at 31 December 2018 37,013 9,635 11,756 2,187 43 154 60,788
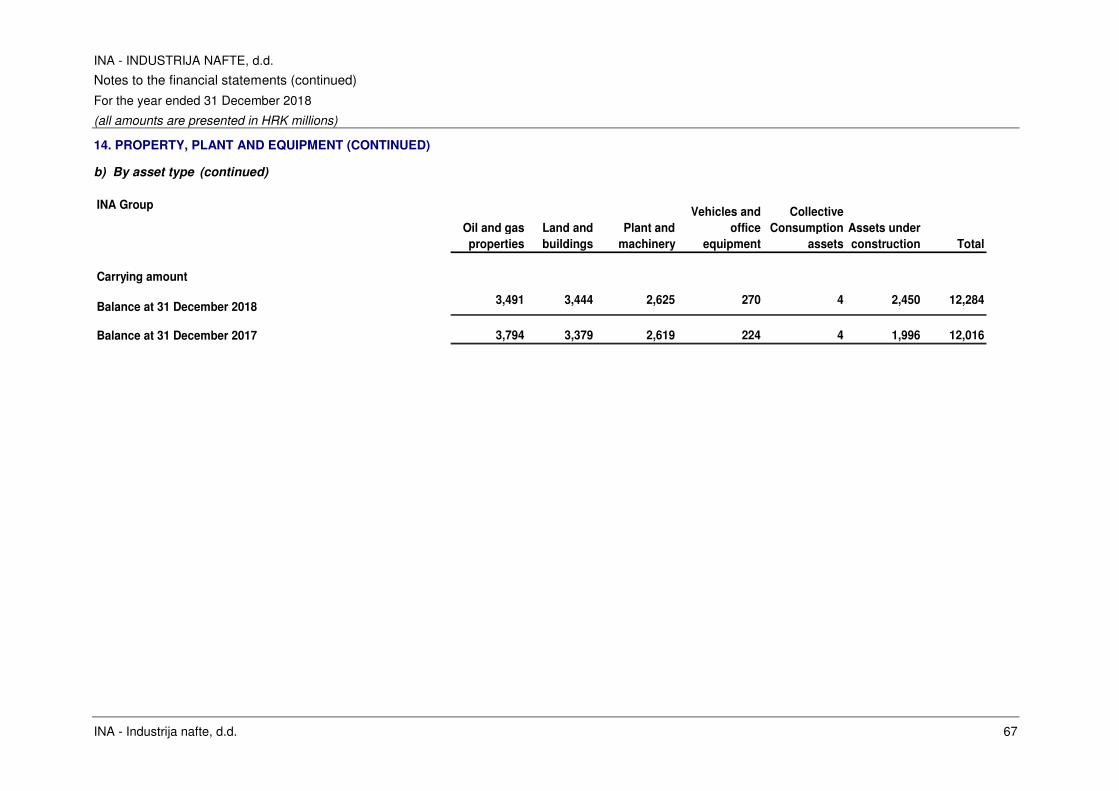
INA - INDUSTRIJA NAFTE, d.d.
Notes to the financial statements (continued)
For the year ended 31 December 2018
(all amounts are presented in HRK millions)
INA - Industrija nafte, d.d. 67
14. PROPERTY, PLANT AND EQUIPMENT (CONTINUED)
b) By asset type (continued)
INA Group
Oil and gas
properties
Land and
buildings
Plant and
machinery
Vehicles and
office
equipment
Collective
Consumption
assets
Assets under
construction Total
Carrying amount
Balance at 31 December 20183,491 3,444 2,625 270 4 2,450 12,284
Balance at 31 December 2017 3,794 3,379 2,619 224 4 1,996 12,016
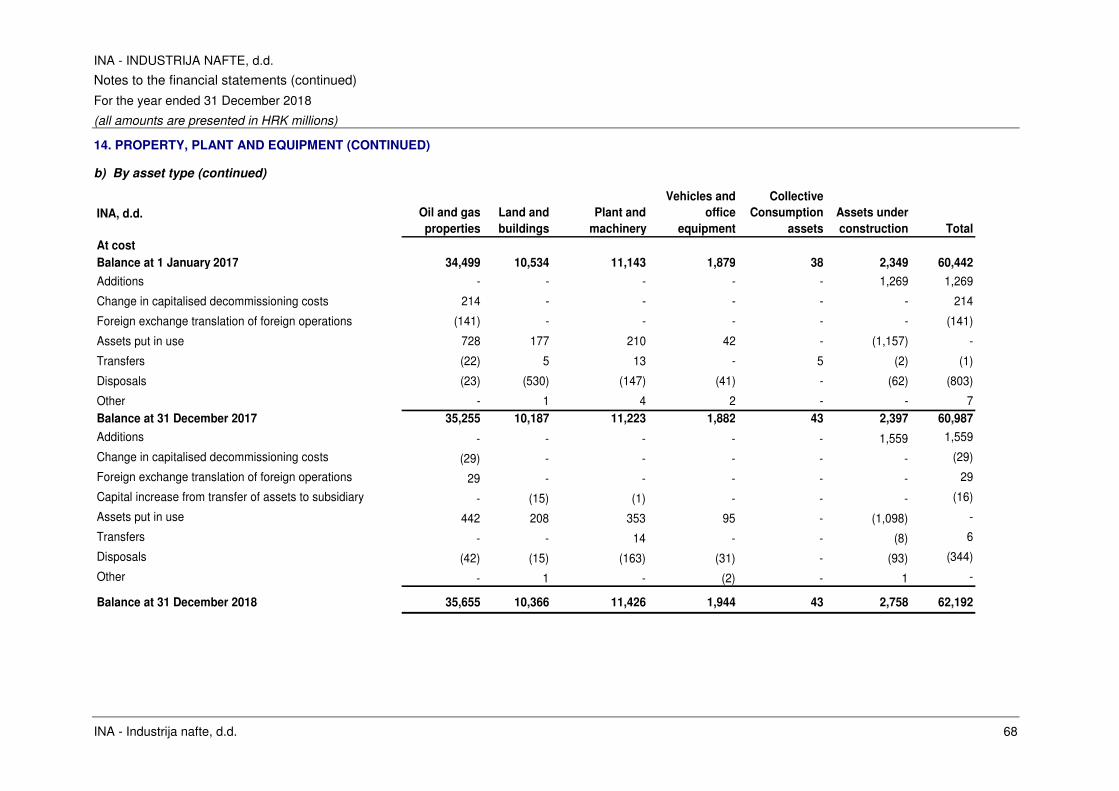
INA - INDUSTRIJA NAFTE, d.d.
Notes to the financial statements (continued)
For the year ended 31 December 2018
(all amounts are presented in HRK millions)
INA - Industrija nafte, d.d. 68
14. PROPERTY, PLANT AND EQUIPMENT (CONTINUED)
b) By asset type (continued)
INA, d.d. Oil and gas
properties
Land and
buildings
Plant and
machinery
Vehicles and
office
equipment
Collective
Consumption
assets
Assets under
construction Total
At cost
Balance at 1 January 2017 34,499 10,534 11,143 1,879 38 2,349 60,442
Additions - - - - - 1,269 1,269
Change in capitalised decommissioning costs 214 - - - - - 214
Foreign exchange translation of foreign operations (141) - - - - - (141)
Assets put in use 728 177 210 42 - (1,157) -
Transfers (22) 5 13 - 5 (2) (1)
Disposals (23) (530) (147) (41) - (62) (803)
Other - 1 4 2 - - 7Balance at 31 December 2017 35,255 10,187 11,223 1,882 43 2,397 60,987
Additions - - - - - 1,559 1,559
Change in capitalised decommissioning costs (29) - - - - - (29)
Foreign exchange translation of foreign operations 29 - - - - - 29
Capital increase from transfer of assets to subsidiary - (15) (1) - - - (16)
Assets put in use 442 208 353 95 - (1,098) -
Transfers - - 14 - - (8) 6
Disposals (42) (15) (163) (31) - (93) (344)
Other - 1 - (2) - 1 -
Balance at 31 December 2018 35,655 10,366 11,426 1,944 43 2,758 62,192
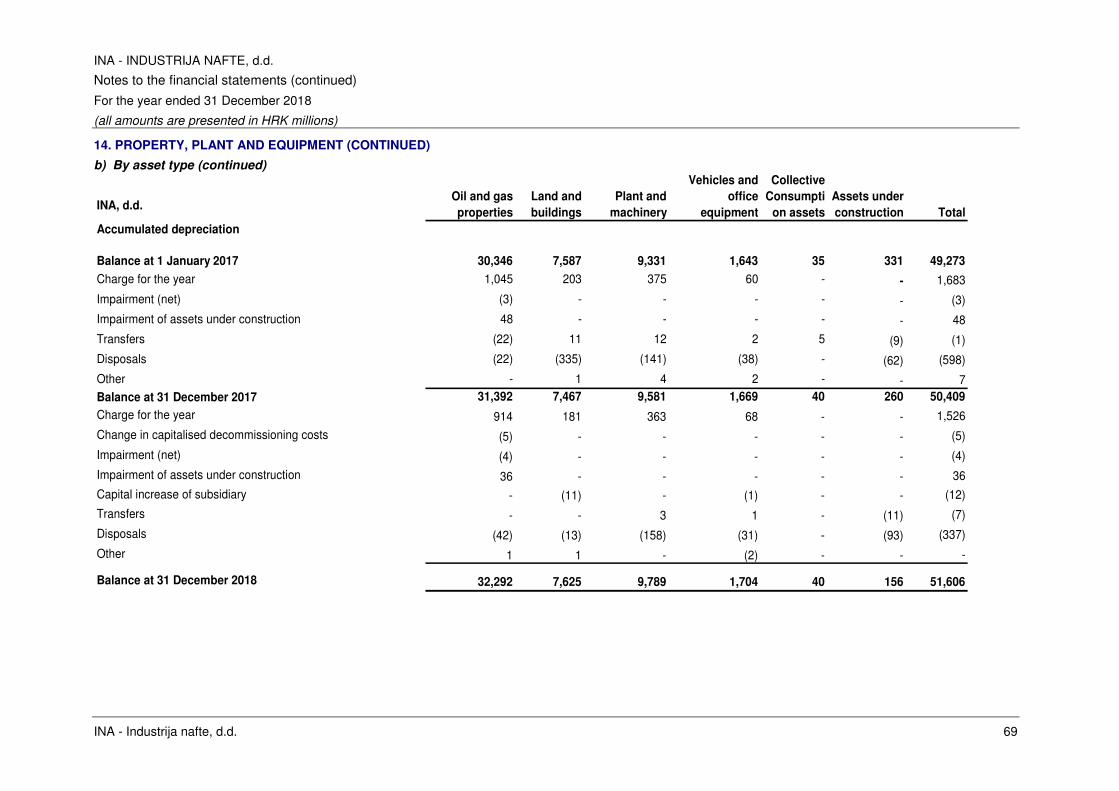
INA - INDUSTRIJA NAFTE, d.d.
Notes to the financial statements (continued)
For the year ended 31 December 2018
(all amounts are presented in HRK millions)
INA - Industrija nafte, d.d. 69
14. PROPERTY, PLANT AND EQUIPMENT (CONTINUED)
b) By asset type (continued)
INA, d.d.Oil and gas
properties
Land and
buildings
Plant and
machinery
Vehicles and
office
equipment
Collective
Consumpti
on assets
Assets under
construction Total
Accumulated depreciation
Balance at 1 January 2017 30,346 7,587 9,331 1,643 35 331 49,273
Charge for the year 1,045 203 375 60 - - 1,683
Impairment (net) (3) - - - - - (3)
Impairment of assets under construction 48 - - - - - 48
Transfers (22) 11 12 2 5 (9) (1)
Disposals (22) (335) (141) (38) - (62) (598)
Other - 1 4 2 - - 7Balance at 31 December 2017 31,392 7,467 9,581 1,669 40 260 50,409
Charge for the year 914 181 363 68 - - 1,526
Change in capitalised decommissioning costs (5) - - - - - (5)
Impairment (net) (4) - - - - - (4)
Impairment of assets under construction 36 - - - - - 36
Capital increase of subsidiary - (11) - (1) - - (12)
Transfers - - 3 1 - (11) (7)
Disposals (42) (13) (158) (31) - (93) (337)
Other 1 1 - (2) - - -
Balance at 31 December 2018 32,292 7,625 9,789 1,704 40 156 51,606
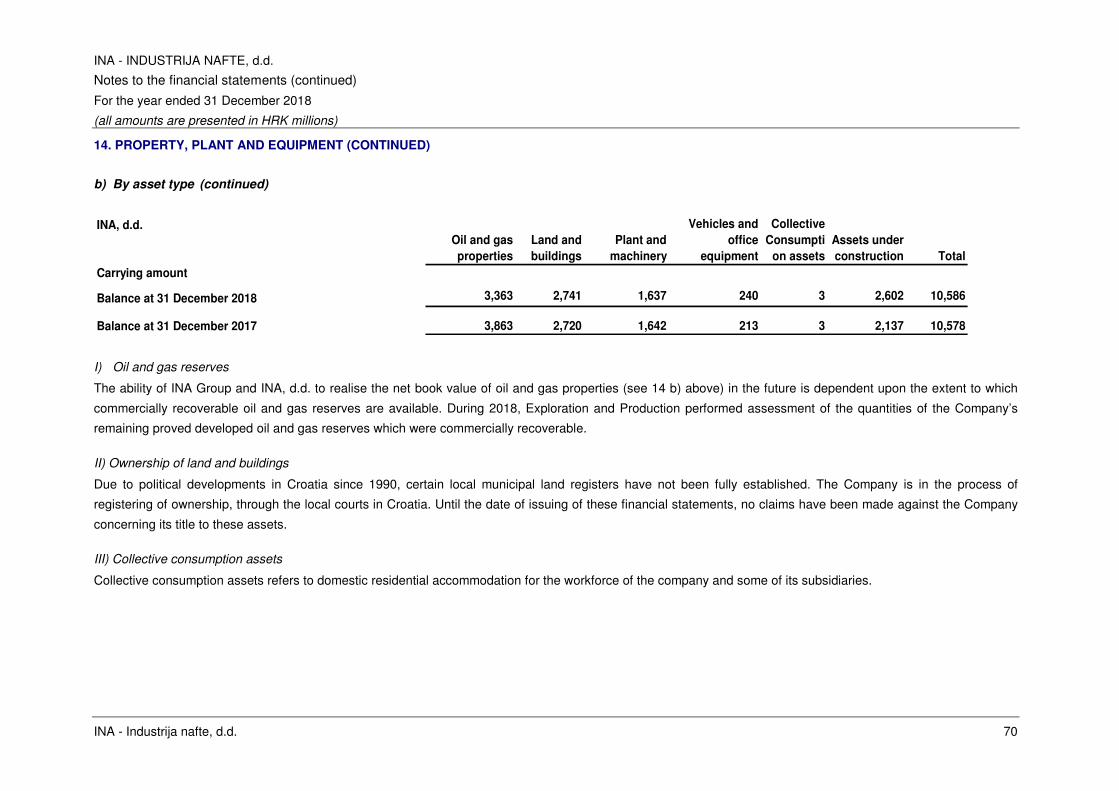
INA - INDUSTRIJA NAFTE, d.d.
Notes to the financial statements (continued)
For the year ended 31 December 2018
(all amounts are presented in HRK millions)
INA - Industrija nafte, d.d. 70
14. PROPERTY, PLANT AND EQUIPMENT (CONTINUED)
b) By asset type (continued)
INA, d.d.
Oil and gas
properties
Land and
buildings
Plant and
machinery
Vehicles and
office
equipment
Collective
Consumpti
on assets
Assets under
construction Total
Carrying amount
Balance at 31 December 2018 3,363 2,741 1,637 240 3 2,602 10,586
Balance at 31 December 2017 3,863 2,720 1,642 213 3 2,137 10,578
I) Oil and gas reserves
The ability of INA Group and INA, d.d. to realise the net book value of oil and gas properties (see 14 b) above) in the future is dependent upon the extent to which
commercially recoverable oil and gas reserves are available. During 2018, Exploration and Production performed assessment of the quantities of the Company’s
remaining proved developed oil and gas reserves which were commercially recoverable.
II) Ownership of land and buildings
Due to political developments in Croatia since 1990, certain local municipal land registers have not been fully established. The Company is in the process of
registering of ownership, through the local courts in Croatia. Until the date of issuing of these financial statements, no claims have been made against the Company
concerning its title to these assets.
III) Collective consumption assets
Collective consumption assets refers to domestic residential accommodation for the workforce of the company and some of its subsidiaries.
INA - INDUSTRIJA NAFTE, d.d.
Notes to the financial statements (continued)
For the year ended 31 December 2018
(all amounts are presented in HRK millions)
INA - Industrija nafte, d.d. 71
14. PROPERTY, PLANT AND EQUIPMENT (CONTINUED)
IV) Carrying value of property, plant and equipment
The Management Board performed identification and assessment of indicators in accordance with IAS 36. Impairment
test was performed on assets where indicators of impairment have been identified. The total net impairment charge of
INA Group is HRK 103 million in 2018 (2017: HRK 145 million).
a) Exploration and Production recorded an impairment of property, plant and equipment in amount of HRK 103
million in 2018 (compared to impairment in amount of HRK 45 million in 2017):
o Dry wells impairment of HRK 107 million was recorded on Božica HRK 60 million, Bunjani 2 South
HRK 33 million, Drava II HRK 14 million (2017: dry wells impairment of HRK 48 million (Iva Duboka))
o Reversal of impairment of decommissioning assets in amount of HRK 4 million (2017: HRK 3
million).
Assumed hydrocarbon prices are based on stable expectations above 70 USD/bbl in middle-term periods
(after 2021) while at 31 December 2017 the expectations were based on 50 USD/bbl. Therefore, impairment
indicators in respect of hydrocarbon prices were not identified and no year-end impairment test were
prepared.
However, impairment indicators were identified on five onshore fields with negative reserves change
compared to 2017 reserves, i.e. -1 MMboe change on Molve, Kalinovac, Hrastilnica, Ivanić and Žutica with a
total impact of 23.8 MMboe. Impairment tests were prepared for each field since they are identified as
separate cash generating units. However, these revisions are on the fields with significant production volumes
and quite low breakeven prices, so no impairment was recorded as at 31 December 2018.
b) Since no impairment indicators were identified, impairment test for Refining and Marketing was not performed
and no impairment or reversal of impairment of property, plant and equipment in 2018, neither in 2017 were
recorded.
c) Corporate and other recorded no impairment or reversal of impairment of property, plant and equipment in
2018, compared to 2017 when impairment was in amount of HRK 100 million regarding Labin platform.
Impairment test of the Labin platform was triggered by low utilization of the asset. The test was based on
planned rig utilization in the coming years and showed no need for additional impairment in 2018.
Discount rates used in the current assessment in 2018 and for 2017 are assets specific and are as follows:
Exploration and Production
2018 2017
Croatia 8.5% 9.1%Syria 17.0% 17.6%Egypt 12.0% 13.6%Angola 12.0% 13.6%
Refining and Marketing
Croatia 9.5% 9.1%
Bosnia and Herzegovina 12.0% 11.6%
A risk factor is included the discount rates considering the risk of each country (see note 3).
INA - INDUSTRIJA NAFTE, d.d.
Notes to the financial statements (continued)
For the year ended 31 December 2018
(all amounts are presented in HRK millions)
INA - Industrija nafte, d.d. 72
14. PROPERTY, PLANT AND EQUIPMENT (CONTINUED)
V) Review of the residual value
The Group has reviewed the residual value for depreciation purposes to reflect the changes in the definition of the
residual value provided in IAS 16 and no need for any adjustment to the residual values related to the current or prior
periods has been established. Useful life of decommissioning assets have been adjusted to reflect the economic life
of fields.
VI) Held-for-sale assets
Management expects that sales transactions will be closed within the following twelve months.
31 December
2018
31 December
2017
Held-for-sale assets
Property, plant and equipment 4 8
Assets classified held-for-sale 4 8
INA Group
INA - INDUSTRIJA NAFTE, d.d.
Notes to the financial statements (continued)
For the year ended 31 December 2018
(all amounts are presented in HRK millions)
INA - Industrija nafte, d.d. 73
15. INVESTMENTS IN SUBSIDIARIES (in separate financial statement of INA, d.d.)
31 December 2018 31 December 2017
Investments in subsidiaries 1,960 1,079
INA, d.d.
2018 2017
Investments in subsidiaries at 1 January 1,079 805
ENERGOPETROL d.d. - share capital increase 496 -
INA Adria B.V. - investment 265 -
STSI, Integrirani tehnički servisi d.o.o. - reversal of impairment 39 -
INA SLOVENIJA d.o.o., - reversal of impairment 30 -
CROPLIN d.o.o. - reversal of impairment 25 -
CROSCO, naftni servisi d.o.o. - reversal of impairment 24 -
INA CRNA GORA d.o.o. - reversal of impairment 18 -
Holdina d.o.o. Sarajevo - share capital increase 13 -
Holdina d.o.o. Sarajevo - reversal of impairment 7 -
Hostin d.o.o. - reversal of impairment 7 -
PETROL d.d. RIJEKA - reversal of impairment 2 -
INA Maloprodajni servisi d.o.o. - reversal of impairment 1 -
Adrigas S.r.l. Milano - reversal of impairment 1 -
ENERGOPETROL d.d. - impairment (47) -
CROSCO, naftni servisi d.o.o. - impairment - (34)
CROSCO, naftni servisi d.o.o.- share capital increase - 433
STSI, Integrirani tehnički servisi d.o.o. - share capital decrease - (40)
Hostin d.o.o. - share capital decrease - (15)
INA MAZIVA d.o.o. - share capital decrease - (70)
Total as of 31 December 1,960 1,079
INA, d.d.
INA - INDUSTRIJA NAFTE, d.d.
Notes to the financial statements (continued)
For the year ended 31 December 2018
(all amounts are presented in HRK millions)
INA - Industrija nafte, d.d. 74
15. INVESTMENTS IN SUBSIDIARIES (in separate financial statement of INA, d.d.) (CONTINUED)
The following portfolio changes were recorded in 2018:
At 9 March 2018 Commercial Court in Sarajevo, registered the increase of share capital in HOLDINA Sarajevo d.o.o.
by entering ownership of five properties. Properties in INA d.d. books were written off by net book value in amount
HRK 4 million, while Holdina Sarajevo's share increased by the appraised value in amount of HRK 13 million. The
difference of HRK 9 million was recognized within other operating income.
At 18 April 2018 Commercial Court in Sarajevo, registered the increase of share capital in ENERGOPETROL d.d. in
the amount of HRK 496 million by issuing new 10,480,000 shares. In accordance with this transaction, INA d.d.
increased investment from 67.02% to 88.66% in ENERGOPETROL d.d.
At 15 November 2018 INA, d.d. acquired the investments of ENI B.V. in the amount of HRK 265 million, and the
company changed its name to INA Adria B.V. By acquiring investment at INA Adria, INA, d.d. has become the sole
owner of INAgip, a company that has changed its name to INA Jadran d.o.o. and is continuing to operate as the joint
operation.
In 2018, based on using discounted cash flow method for valuation of investment in subsidiaries, INA, d.d. recognised
reversal of impairment of investment in amount of HRK 107 million. Impairment of investments and reversal of
impaired investment are recorded in INA Group companies as presented in the table above.
The following portfolio changes were recorded in 2017:
At 20 January 2017 Commercial Court in Zagreb registered the decrease of share capital in STSI d.o.o. in the amount
of HRK 40 million.
At 23 January 2017 Commercial Court in Zagreb registered the decrease of share capital in HOSTIN d.o.o. in the
amount of HRK 15 million.
At 6 February 2017 Commercial Court in Zagreb registered the decrease of share capital in INA MAZIVA d.o.o. in the
amount of HRK 70 million.
At 20 July 2017 Commercial Court in Zagreb registered the increase of share capital in CROSCO d.o.o. in the amount
of HRK 433 million.
In 2017 INA, d.d., increased share in Energopetrol by 0.0179%. by purchase of shares.
At 31 December 2017, the Company recognized an impairment of investment in Crosco d.o.o. in the amount of HRK
34 million based on comparison of shares value and value of net assets of Crosco Group.
At 7 July 2017, Crosco d.o.o. liquidated CROSCO International d.o.o. Slovenia. Before the liquidation, Crosco d.o.o.
held 100% of share capital in CROSCO International d.o.o.
During 2017, Crosco d.o.o. has established a new company Crosco Ukraine LLC with ownership of 100%.
The Company has the following principal subsidiaries (*subsidiary owned directly by the Company):
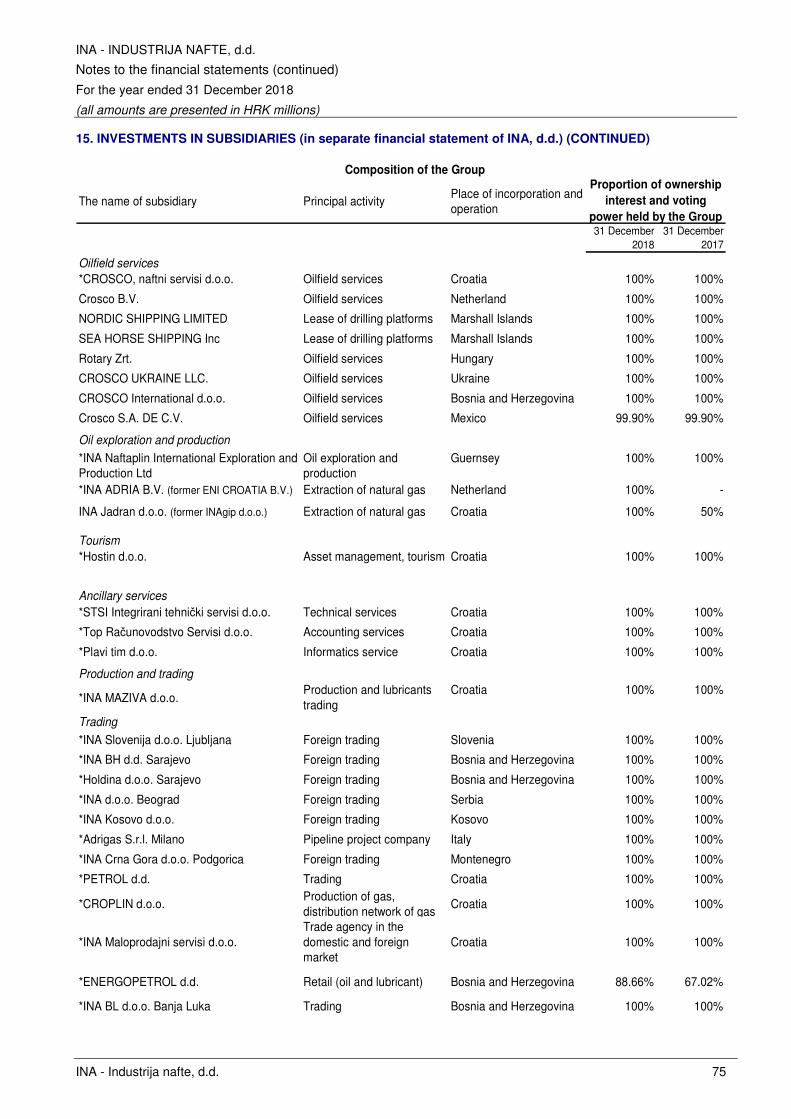
INA - INDUSTRIJA NAFTE, d.d.
Notes to the financial statements (continued)
For the year ended 31 December 2018
(all amounts are presented in HRK millions)
INA - Industrija nafte, d.d. 75
15. INVESTMENTS IN SUBSIDIARIES (in separate financial statement of INA, d.d.) (CONTINUED)
Composition of the Group
The name of subsidiary Principal activityPlace of incorporation and operation
31 December 2018
31 December 2017
Oilfield services
*CROSCO, naftni servisi d.o.o. Oilfield services Croatia 100% 100%
Crosco B.V. Oilfield services Netherland 100% 100%
NORDIC SHIPPING LIMITED Lease of drilling platforms Marshall Islands 100% 100%
SEA HORSE SHIPPING Inc Lease of drilling platforms Marshall Islands 100% 100%
Rotary Zrt. Oilfield services Hungary 100% 100%
CROSCO UKRAINE LLC. Oilfield services Ukraine 100% 100%
CROSCO International d.o.o. Oilfield services Bosnia and Herzegovina 100% 100%
Crosco S.A. DE C.V. Oilfield services Mexico 99.90% 99.90%
Oil exploration and production
*INA Naftaplin International Exploration and Production Ltd
Oil exploration and production
Guernsey 100% 100%
*INA ADRIA B.V. (former ENI CROATIA B.V.) Extraction of natural gas Netherland 100% -
INA Jadran d.o.o. (former INAgip d.o.o.) Extraction of natural gas Croatia 100% 50%
Tourism
*Hostin d.o.o. Asset management, tourism Croatia 100% 100%
Ancillary services
*STSI Integrirani tehnički servisi d.o.o. Technical services Croatia 100% 100%
*Top Računovodstvo Servisi d.o.o. Accounting services Croatia 100% 100%
*Plavi tim d.o.o. Informatics service Croatia 100% 100%
Production and trading
*INA MAZIVA d.o.o. Production and lubricants trading
Croatia 100% 100%
Trading
*INA Slovenija d.o.o. Ljubljana Foreign trading Slovenia 100% 100%
*INA BH d.d. Sarajevo Foreign trading Bosnia and Herzegovina 100% 100%
*Holdina d.o.o. Sarajevo Foreign trading Bosnia and Herzegovina 100% 100%
*INA d.o.o. Beograd Foreign trading Serbia 100% 100%
*INA Kosovo d.o.o. Foreign trading Kosovo 100% 100%
*Adrigas S.r.l. Milano Pipeline project company Italy 100% 100%
*INA Crna Gora d.o.o. Podgorica Foreign trading Montenegro 100% 100%
*PETROL d.d. Trading Croatia 100% 100%
*CROPLIN d.o.o. Production of gas, distribution network of gas
Croatia 100% 100%
*INA Maloprodajni servisi d.o.o. Trade agency in the domestic and foreign market
Croatia 100% 100%
*ENERGOPETROL d.d. Retail (oil and lubricant) Bosnia and Herzegovina 88.66% 67.02%
*INA BL d.o.o. Banja Luka Trading Bosnia and Herzegovina 100% 100%
Proportion of ownership
interest and voting
power held by the Group
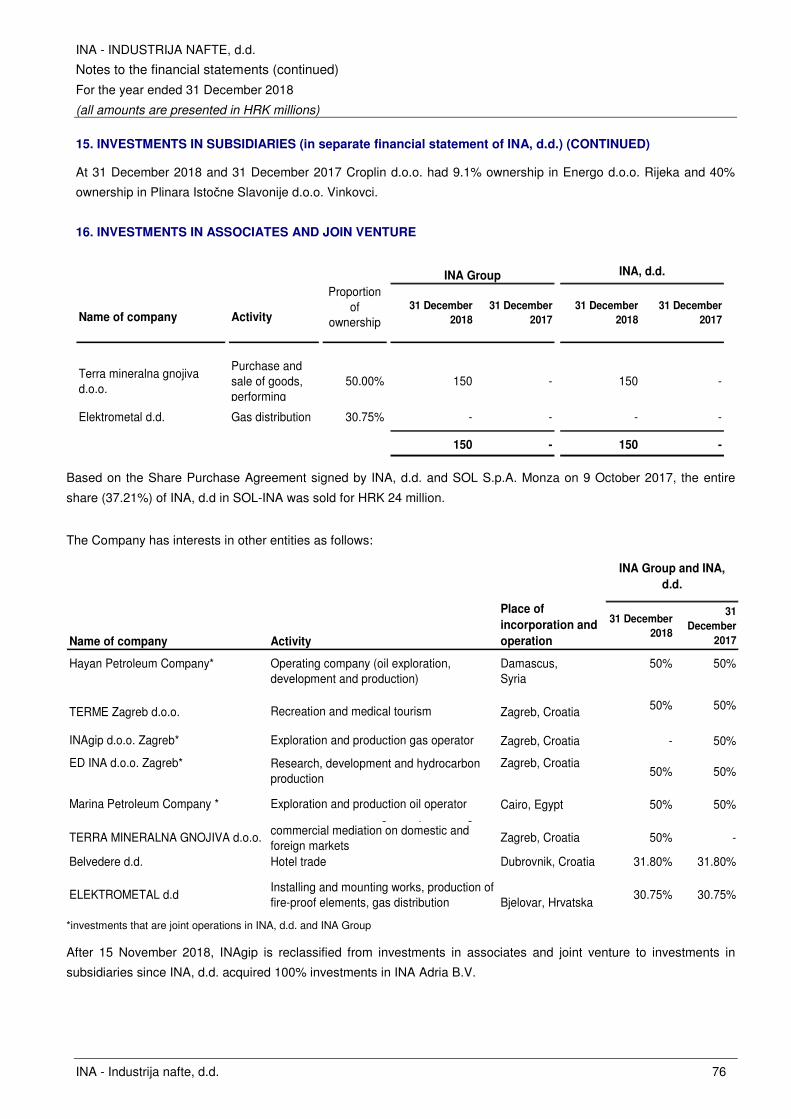
INA - INDUSTRIJA NAFTE, d.d.
Notes to the financial statements (continued)
For the year ended 31 December 2018
(all amounts are presented in HRK millions)
INA - Industrija nafte, d.d. 76
15. INVESTMENTS IN SUBSIDIARIES (in separate financial statement of INA, d.d.) (CONTINUED)
At 31 December 2018 and 31 December 2017 Croplin d.o.o. had 9.1% ownership in Energo d.o.o. Rijeka and 40%
ownership in Plinara Istočne Slavonije d.o.o. Vinkovci.
16. INVESTMENTS IN ASSOCIATES AND JOIN VENTURE
Name of company Activity
Terra mineralna gnojiva d.o.o.
Purchase and sale of goods, performing
50.00% 150 - 150 -
Elektrometal d.d. Gas distribution 30.75% - - - -
150 - 150 -
31 December
2018
31 December
2017
31 December
2018
31 December
2017
INA Group INA, d.d.
Proportion of
ownership
Based on the Share Purchase Agreement signed by INA, d.d. and SOL S.p.A. Monza on 9 October 2017, the entire
share (37.21%) of INA, d.d in SOL-INA was sold for HRK 24 million.
The Company has interests in other entities as follows:
Place of
incorporation and
operation
31 December
2018
31
December
2017
Damascus, Syria
50% 50%
TERME Zagreb d.o.o. Zagreb, Croatia 50% 50%
Zagreb, Croatia - 50%
Zagreb, Croatia50% 50%
Cairo, Egypt 50% 50%
TERRA MINERALNA GNOJIVA d.o.o. Zagreb, Croatia 50% -
Dubrovnik, Croatia 31.80% 31.80%
ELEKTROMETAL d.dBjelovar, Hrvatska
30.75% 30.75%
Purchase and sale of goods, performing commercial mediation on domestic and foreign markets
Installing and mounting works, production of fire-proof elements, gas distribution
INA Group and INA,
d.d.
Name of company Activity
Hayan Petroleum Company* Operating company (oil exploration, development and production)
Recreation and medical tourism
Marina Petroleum Company * Exploration and production oil operator
ED INA d.o.o. Zagreb* Research, development and hydrocarbon production
Belvedere d.d. Hotel trade
INAgip d.o.o. Zagreb* Exploration and production gas operator
*investments that are joint operations in INA, d.d. and INA Group
After 15 November 2018, INAgip is reclassified from investments in associates and joint venture to investments in
subsidiaries since INA, d.d. acquired 100% investments in INA Adria B.V.
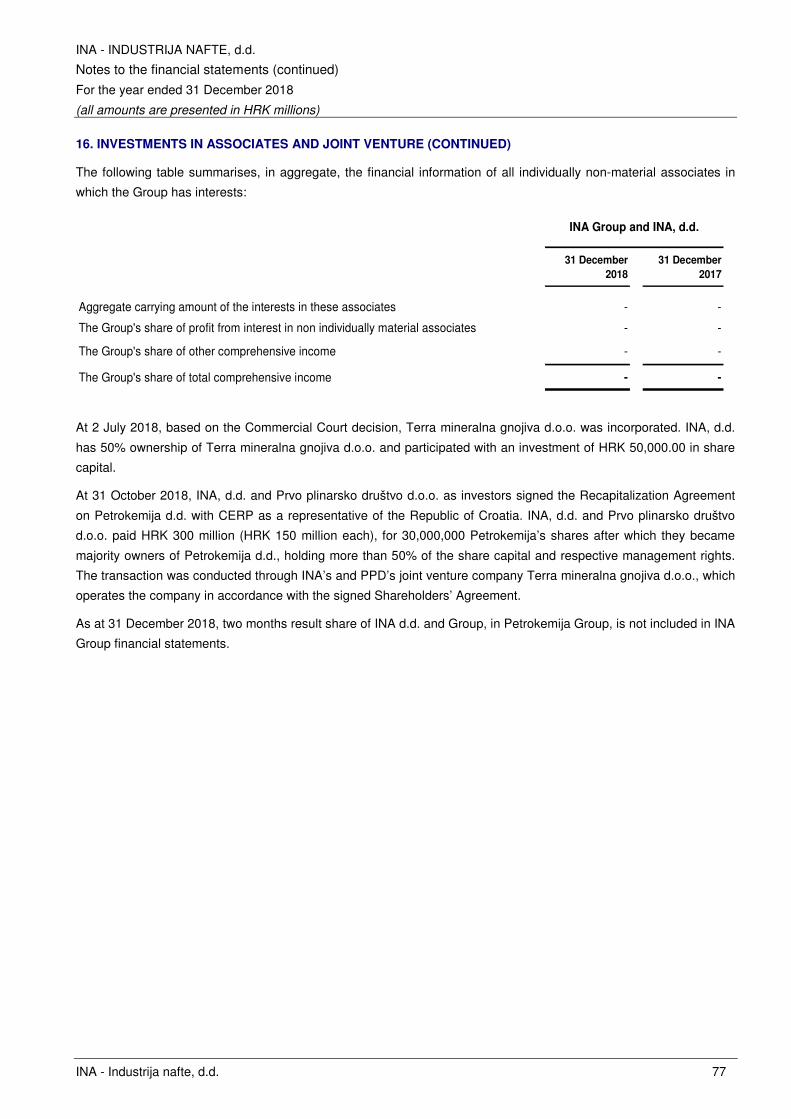
INA - INDUSTRIJA NAFTE, d.d.
Notes to the financial statements (continued)
For the year ended 31 December 2018
(all amounts are presented in HRK millions)
INA - Industrija nafte, d.d. 77
16. INVESTMENTS IN ASSOCIATES AND JOINT VENTURE (CONTINUED)
The following table summarises, in aggregate, the financial information of all individually non-material associates in
which the Group has interests:
31 December
2018
31 December
2017
Aggregate carrying amount of the interests in these associates - -
The Group's share of profit from interest in non individually material associates - -
The Group's share of other comprehensive income - -
The Group's share of total comprehensive income - -
INA Group and INA, d.d.
At 2 July 2018, based on the Commercial Court decision, Terra mineralna gnojiva d.o.o. was incorporated. INA, d.d.
has 50% ownership of Terra mineralna gnojiva d.o.o. and participated with an investment of HRK 50,000.00 in share
capital.
At 31 October 2018, INA, d.d. and Prvo plinarsko društvo d.o.o. as investors signed the Recapitalization Agreement
on Petrokemija d.d. with CERP as a representative of the Republic of Croatia. INA, d.d. and Prvo plinarsko društvo
d.o.o. paid HRK 300 million (HRK 150 million each), for 30,000,000 Petrokemija’s shares after which they became
majority owners of Petrokemija d.d., holding more than 50% of the share capital and respective management rights.
The transaction was conducted through INA’s and PPD’s joint venture company Terra mineralna gnojiva d.o.o., which
operates the company in accordance with the signed Shareholders’ Agreement.
As at 31 December 2018, two months result share of INA d.d. and Group, in Petrokemija Group, is not included in INA
Group financial statements.
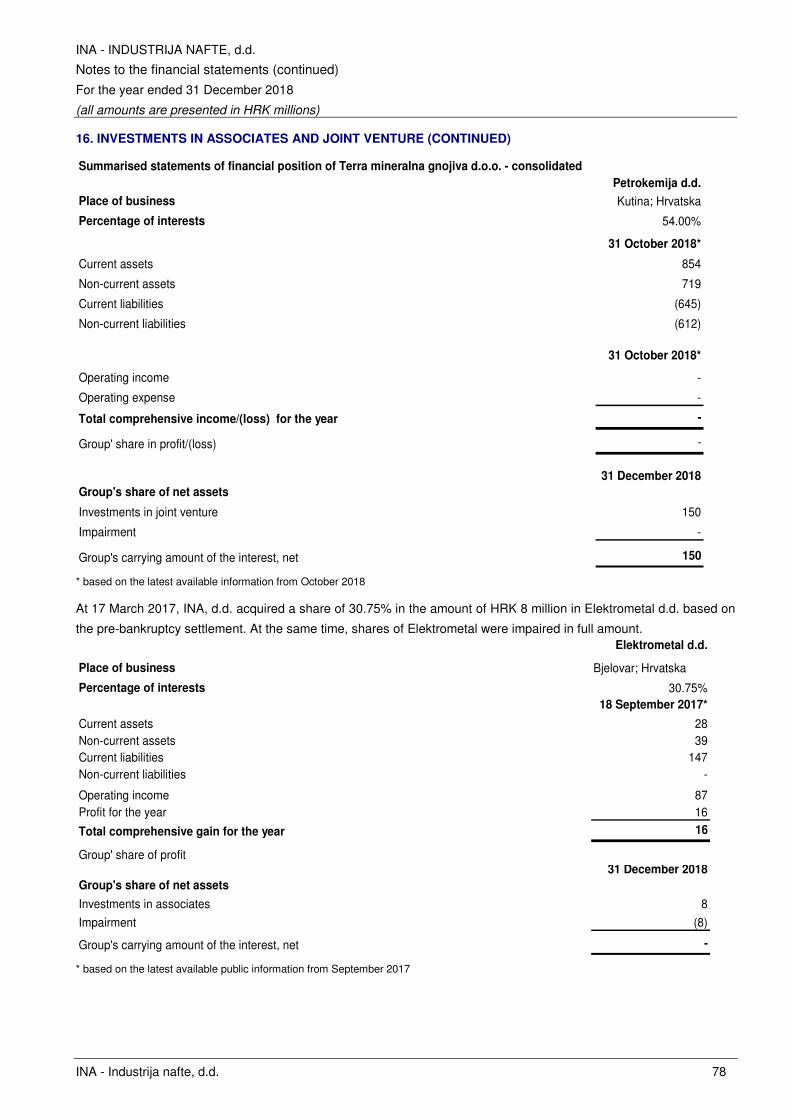
INA - INDUSTRIJA NAFTE, d.d.
Notes to the financial statements (continued)
For the year ended 31 December 2018
(all amounts are presented in HRK millions)
INA - Industrija nafte, d.d. 78
16. INVESTMENTS IN ASSOCIATES AND JOINT VENTURE (CONTINUED)
Summarised statements of financial position of Terra mineralna gnojiva d.o.o. - consolidated
Petrokemija d.d.
Place of business Kutina; Hrvatska
Percentage of interests 54.00%
31 October 2018*
Current assets 854
Non-current assets 719
Current liabilities (645)
Non-current liabilities (612)
31 October 2018*
Operating income -
Operating expense -
Total comprehensive income/(loss) for the year -
Group' share in profit/(loss) -
31 December 2018
Group's share of net assets
Investments in joint venture 150
Impairment -
Group's carrying amount of the interest, net 150
* based on the latest available information from October 2018
At 17 March 2017, INA, d.d. acquired a share of 30.75% in the amount of HRK 8 million in Elektrometal d.d. based on
the pre-bankruptcy settlement. At the same time, shares of Elektrometal were impaired in full amount.
Place of business Bjelovar; Hrvatska
Percentage of interests 30.75%18 September 2017*
Current assets 28Non-current assets 39Current liabilities 147Non-current liabilities -
Operating income 87Profit for the year 16
Total comprehensive gain for the year 16
Group' share of profit 31 December 2018
Group's share of net assets
Investments in associates 8
Impairment (8)
Group's carrying amount of the interest, net -
Elektrometal d.d.
* based on the latest available public information from September 2017
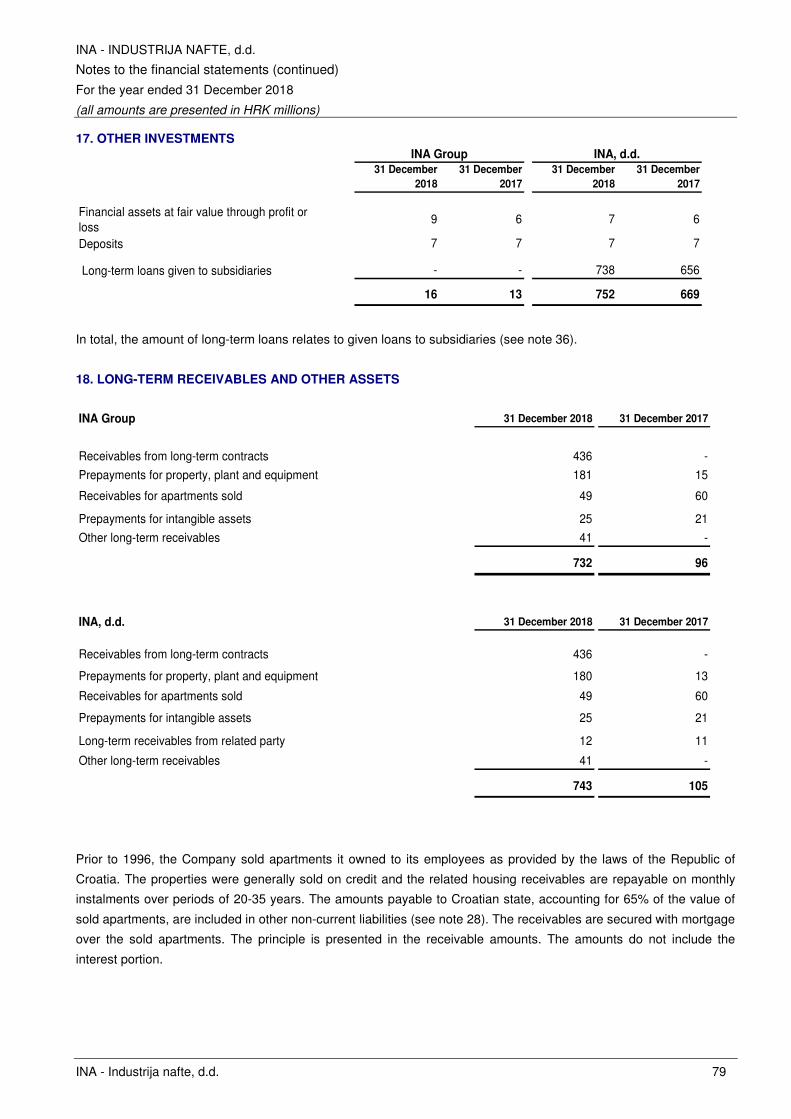
INA - INDUSTRIJA NAFTE, d.d.
Notes to the financial statements (continued)
For the year ended 31 December 2018
(all amounts are presented in HRK millions)
INA - Industrija nafte, d.d. 79
17. OTHER INVESTMENTS
31 December
2018
31 December
2017
31 December
2018
31 December
2017
Financial assets at fair value through profit or loss
9 6 7 6
Deposits 7 7 7 7
Long-term loans given to subsidiaries - - 738 656
16 13 752 669
INA Group INA, d.d.
In total, the amount of long-term loans relates to given loans to subsidiaries (see note 36).
18. LONG-TERM RECEIVABLES AND OTHER ASSETS
INA Group 31 December 2018 31 December 2017
Receivables from long-term contracts 436 -
Prepayments for property, plant and equipment 181 15
Receivables for apartments sold 49 60
Prepayments for intangible assets 25 21
Other long-term receivables 41 -
732 96
INA, d.d. 31 December 2018 31 December 2017
Receivables from long-term contracts 436 -
Prepayments for property, plant and equipment 180 13
Receivables for apartments sold 49 60
Prepayments for intangible assets 25 21
Long-term receivables from related party 12 11
Other long-term receivables 41 -
743 105
Prior to 1996, the Company sold apartments it owned to its employees as provided by the laws of the Republic of
Croatia. The properties were generally sold on credit and the related housing receivables are repayable on monthly
instalments over periods of 20-35 years. The amounts payable to Croatian state, accounting for 65% of the value of
sold apartments, are included in other non-current liabilities (see note 28). The receivables are secured with mortgage
over the sold apartments. The principle is presented in the receivable amounts. The amounts do not include the
interest portion.
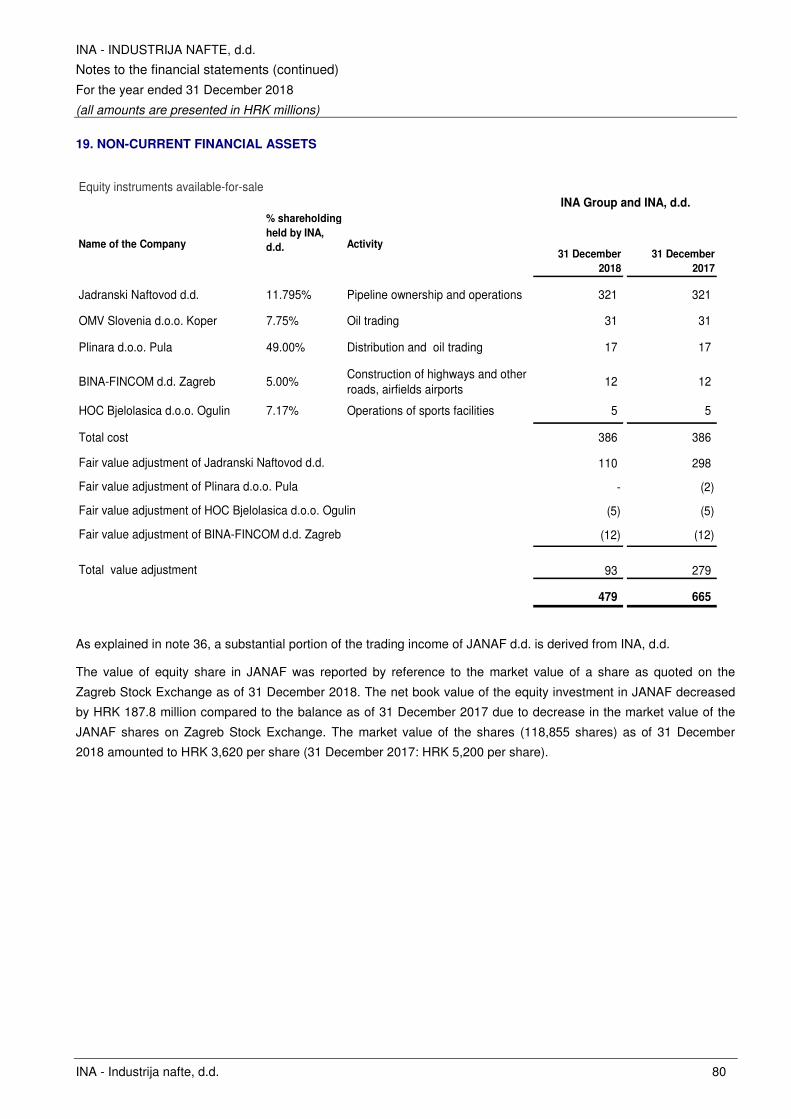
INA - INDUSTRIJA NAFTE, d.d.
Notes to the financial statements (continued)
For the year ended 31 December 2018
(all amounts are presented in HRK millions)
INA - Industrija nafte, d.d. 80
19. NON-CURRENT FINANCIAL ASSETS
Equity instruments available-for-sale
Name of the Company
% shareholding
held by INA,
d.d. Activity31 December
2018
31 December
2017
Jadranski Naftovod d.d. 11.795% Pipeline ownership and operations 321 321
OMV Slovenia d.o.o. Koper 7.75% Oil trading 31 31
Plinara d.o.o. Pula 49.00% Distribution and oil trading 17 17
BINA-FINCOM d.d. Zagreb 5.00%Construction of highways and other roads, airfields airports
12 12
HOC Bjelolasica d.o.o. Ogulin 7.17% Operations of sports facilities 5 5
Total cost 386 386
110 298
- (2)
(5) (5)
(12) (12)
Total value adjustment 93 279
479 665
Fair value adjustment of BINA-FINCOM d.d. Zagreb
INA Group and INA, d.d.
Fair value adjustment of HOC Bjelolasica d.o.o. Ogulin
Fair value adjustment of Jadranski Naftovod d.d.
Fair value adjustment of Plinara d.o.o. Pula
As explained in note 36, a substantial portion of the trading income of JANAF d.d. is derived from INA, d.d.
The value of equity share in JANAF was reported by reference to the market value of a share as quoted on the
Zagreb Stock Exchange as of 31 December 2018. The net book value of the equity investment in JANAF decreased
by HRK 187.8 million compared to the balance as of 31 December 2017 due to decrease in the market value of the
JANAF shares on Zagreb Stock Exchange. The market value of the shares (118,855 shares) as of 31 December
2018 amounted to HRK 3,620 per share (31 December 2017: HRK 5,200 per share).
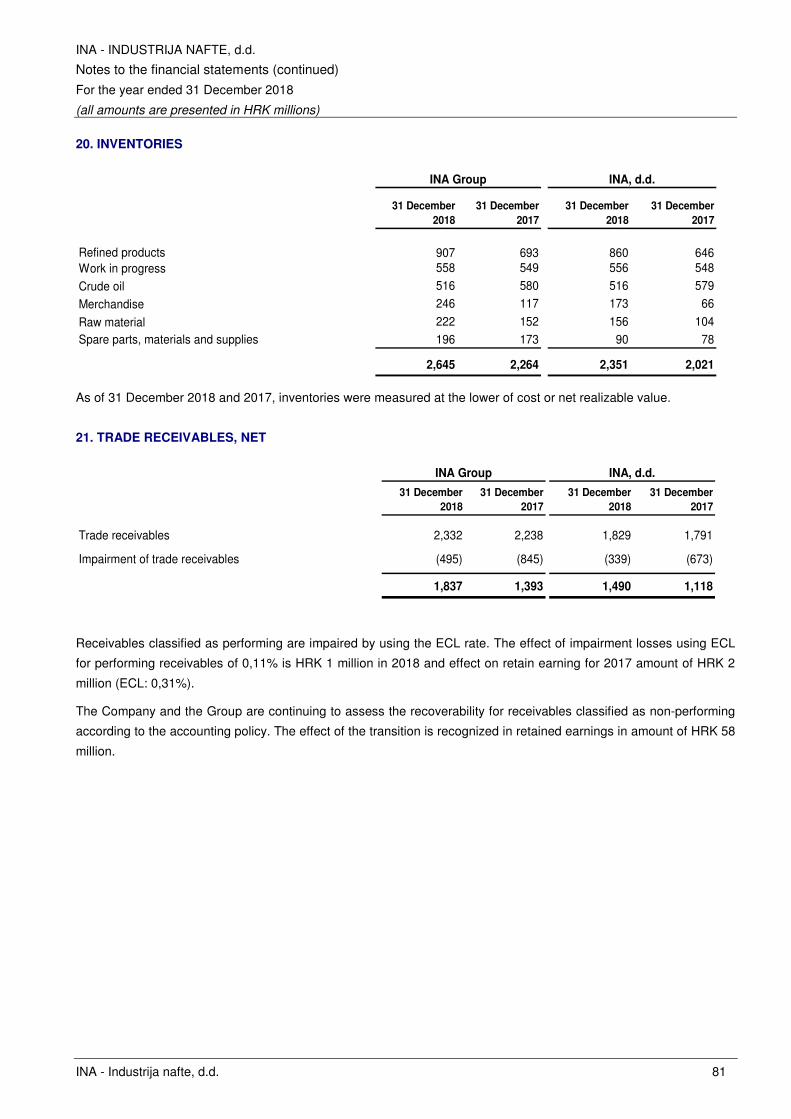
INA - INDUSTRIJA NAFTE, d.d.
Notes to the financial statements (continued)
For the year ended 31 December 2018
(all amounts are presented in HRK millions)
INA - Industrija nafte, d.d. 81
20. INVENTORIES
31 December
2018
31 December
2017
31 December
2018
31 December
2017
Refined products 907 693 860 646Work in progress 558 549 556 548
Crude oil 516 580 516 579
Merchandise 246 117 173 66
Raw material 222 152 156 104
Spare parts, materials and supplies 196 173 90 78
2,645 2,264 2,351 2,021
INA Group INA, d.d.
As of 31 December 2018 and 2017, inventories were measured at the lower of cost or net realizable value.
21. TRADE RECEIVABLES, NET
31 December
2018
31 December
2017
31 December
2018
31 December
2017
Trade receivables 2,332 2,238 1,829 1,791
Impairment of trade receivables (495) (845) (339) (673)
1,837 1,393 1,490 1,118
INA, d.d.INA Group
Receivables classified as performing are impaired by using the ECL rate. The effect of impairment losses using ECL
for performing receivables of 0,11% is HRK 1 million in 2018 and effect on retain earning for 2017 amount of HRK 2
million (ECL: 0,31%).
The Company and the Group are continuing to assess the recoverability for receivables classified as non-performing
according to the accounting policy. The effect of the transition is recognized in retained earnings in amount of HRK 58
million.
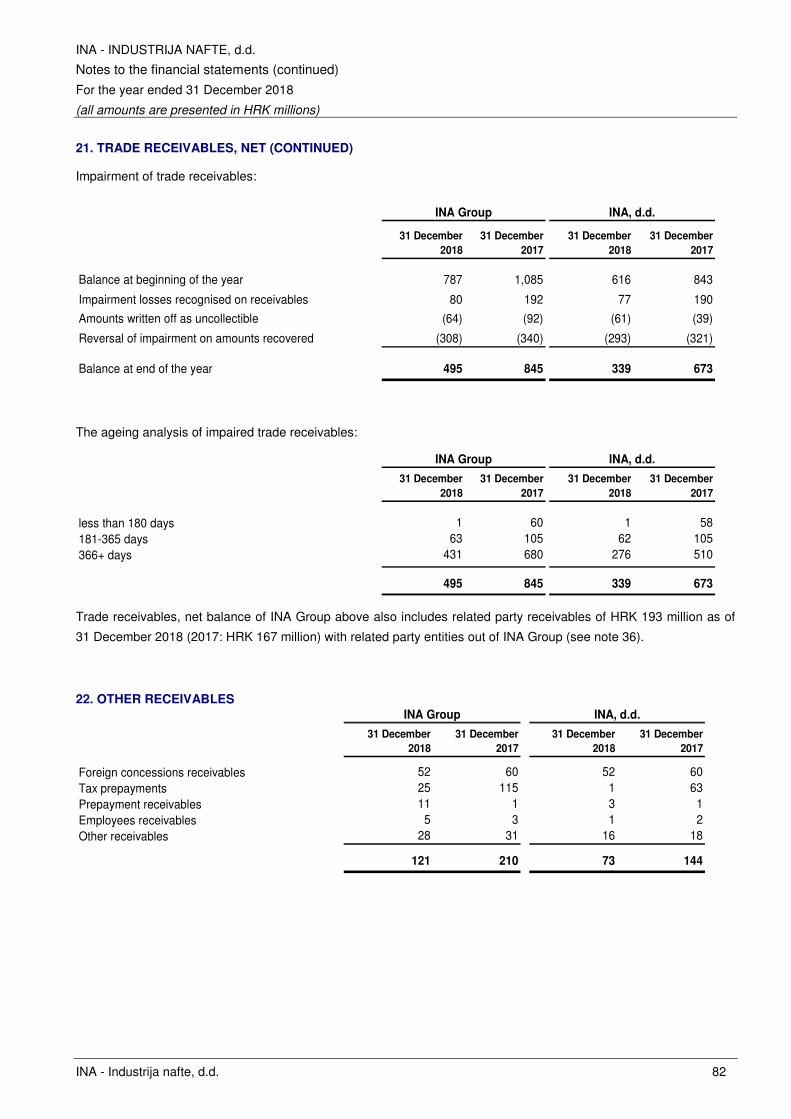
INA - INDUSTRIJA NAFTE, d.d.
Notes to the financial statements (continued)
For the year ended 31 December 2018
(all amounts are presented in HRK millions)
INA - Industrija nafte, d.d. 82
21. TRADE RECEIVABLES, NET (CONTINUED)
Impairment of trade receivables:
31 December
2018
31 December
2017
31 December
2018
31 December
2017
Balance at beginning of the year 787 1,085 616 843
Impairment losses recognised on receivables 80 192 77 190
Amounts written off as uncollectible (64) (92) (61) (39)
Reversal of impairment on amounts recovered (308) (340) (293) (321)
Balance at end of the year 495 845 339 673
INA Group INA, d.d.
The ageing analysis of impaired trade receivables:
31 December
2018
31 December
2017
31 December
2018
31 December
2017
less than 180 days 1 60 1 58181-365 days 63 105 62 105366+ days 431 680 276 510
495 845 339 673
INA Group INA, d.d.
Trade receivables, net balance of INA Group above also includes related party receivables of HRK 193 million as of
31 December 2018 (2017: HRK 167 million) with related party entities out of INA Group (see note 36).
22. OTHER RECEIVABLES
31 December
2018
31 December
2017
31 December
2018
31 December
2017
Foreign concessions receivables 52 60 52 60Tax prepayments 25 115 1 63Prepayment receivables 11 1 3 1Employees receivables 5 3 1 2Other receivables 28 31 16 18
121 210 73 144
INA, d.d.INA Group
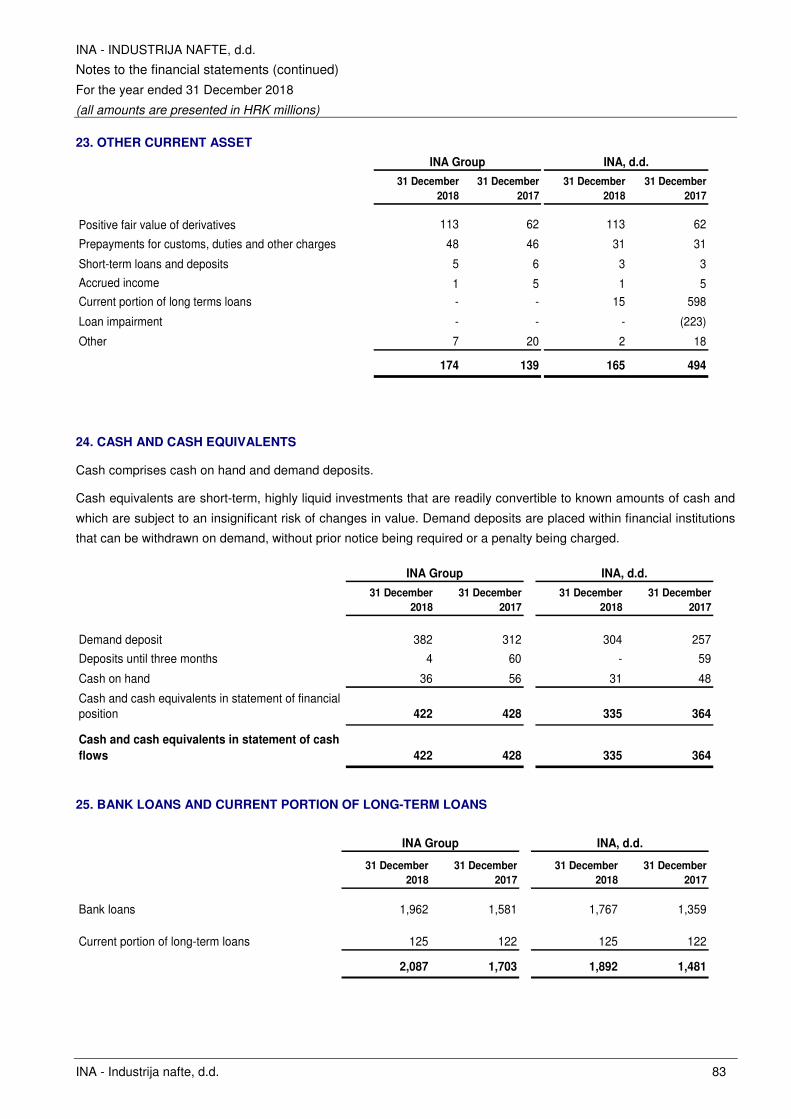
INA - INDUSTRIJA NAFTE, d.d.
Notes to the financial statements (continued)
For the year ended 31 December 2018
(all amounts are presented in HRK millions)
INA - Industrija nafte, d.d. 83
23. OTHER CURRENT ASSET
31 December
2018
31 December
2017
31 December
2018
31 December
2017
Positive fair value of derivatives 113 62 113 62
Prepayments for customs, duties and other charges 48 46 31 31
Short-term loans and deposits 5 6 3 3
Accrued income 1 5 1 5
Current portion of long terms loans - - 15 598
Loan impairment - - - (223)
Other 7 20 2 18
174 139 165 494
INA Group INA, d.d.
24. CASH AND CASH EQUIVALENTS
Cash comprises cash on hand and demand deposits.
Cash equivalents are short-term, highly liquid investments that are readily convertible to known amounts of cash and
which are subject to an insignificant risk of changes in value. Demand deposits are placed within financial institutions
that can be withdrawn on demand, without prior notice being required or a penalty being charged.
31 December
2018
31 December
2017
31 December
2018
31 December
2017
Demand deposit 382 312 304 257
Deposits until three months 4 60 - 59
Cash on hand 36 56 31 48
Cash and cash equivalents in statement of financial position 422 428 335 364
Cash and cash equivalents in statement of cash
flows 422 428 335 364
INA Group INA, d.d.
25. BANK LOANS AND CURRENT PORTION OF LONG-TERM LOANS
31 December
2018
31 December
2017
31 December
2018
31 December
2017
Bank loans 1,962 1,581 1,767 1,359
Current portion of long-term loans 125 122 125 122
2,087 1,703 1,892 1,481
INA Group INA, d.d.
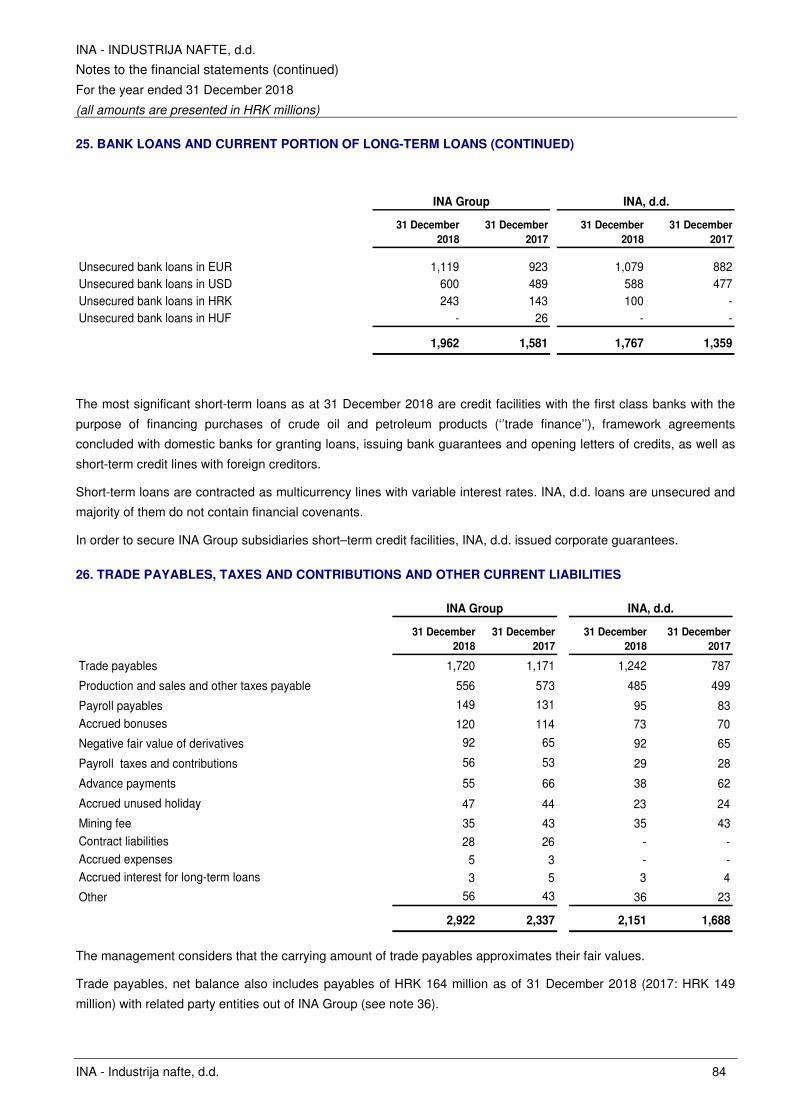
INA - INDUSTRIJA NAFTE, d.d.
Notes to the financial statements (continued)
For the year ended 31 December 2018
(all amounts are presented in HRK millions)
INA - Industrija nafte, d.d. 84
25. BANK LOANS AND CURRENT PORTION OF LONG-TERM LOANS (CONTINUED)
31 December
2018
31 December
2017
31 December
2018
31 December
2017
Unsecured bank loans in EUR 1,119 923 1,079 882Unsecured bank loans in USD 600 489 588 477Unsecured bank loans in HRK 243 143 100 -Unsecured bank loans in HUF - 26 - -
1,962 1,581 1,767 1,359
INA Group INA, d.d.
The most significant short-term loans as at 31 December 2018 are credit facilities with the first class banks with the
purpose of financing purchases of crude oil and petroleum products (‘’trade finance’’), framework agreements
concluded with domestic banks for granting loans, issuing bank guarantees and opening letters of credits, as well as
short-term credit lines with foreign creditors.
Short-term loans are contracted as multicurrency lines with variable interest rates. INA, d.d. loans are unsecured and
majority of them do not contain financial covenants.
In order to secure INA Group subsidiaries short–term credit facilities, INA, d.d. issued corporate guarantees.
26. TRADE PAYABLES, TAXES AND CONTRIBUTIONS AND OTHER CURRENT LIABILITIES
31 December
2018
31 December
2017
31 December
2018
31 December
2017
Trade payables 1,720 1,171 1,242 787
Production and sales and other taxes payable 556 573 485 499
Payroll payables 149 131 95 83Accrued bonuses 120 114 73 70
Negative fair value of derivatives 92 65 92 65
Payroll taxes and contributions 56 53 29 28
Advance payments 55 66 38 62
Accrued unused holiday 47 44 23 24
Mining fee 35 43 35 43Contract liabilities 28 26 - -Accrued expenses 5 3 - -Accrued interest for long-term loans 3 5 3 4
Other 56 43 36 23
2,922 2,337 2,151 1,688
INA Group INA, d.d.
The management considers that the carrying amount of trade payables approximates their fair values.
Trade payables, net balance also includes payables of HRK 164 million as of 31 December 2018 (2017: HRK 149
million) with related party entities out of INA Group (see note 36).
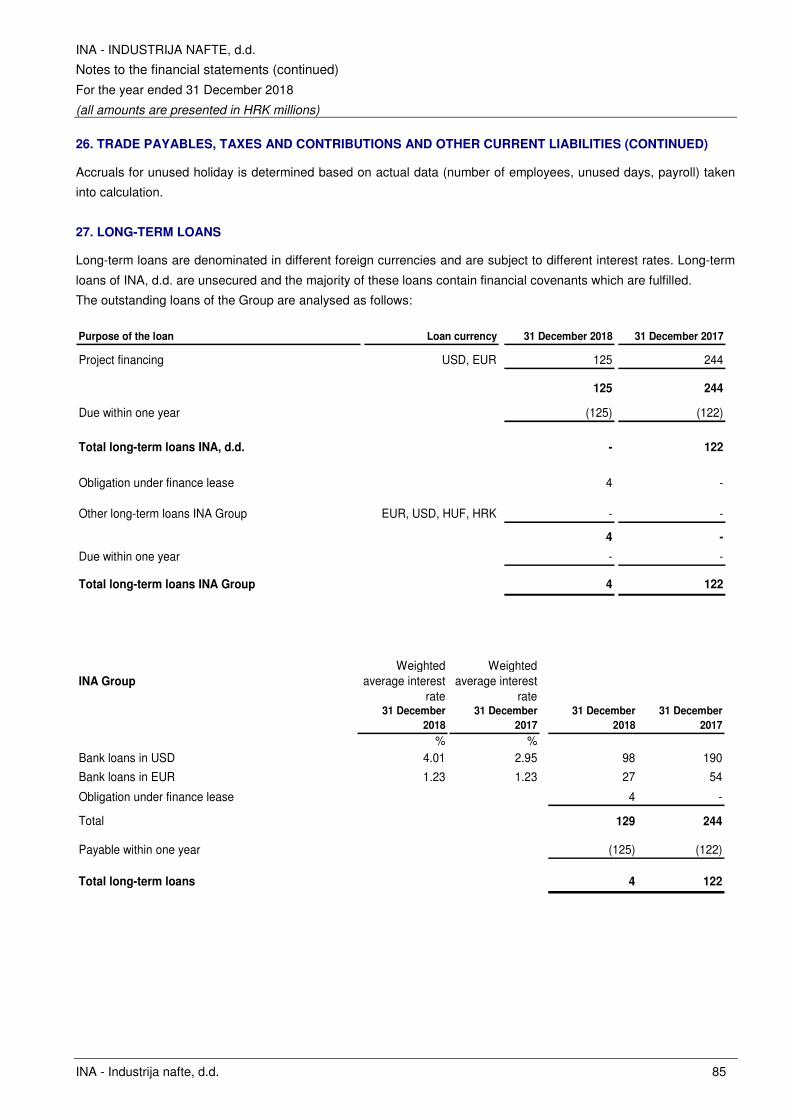
INA - INDUSTRIJA NAFTE, d.d.
Notes to the financial statements (continued)
For the year ended 31 December 2018
(all amounts are presented in HRK millions)
INA - Industrija nafte, d.d. 85
26. TRADE PAYABLES, TAXES AND CONTRIBUTIONS AND OTHER CURRENT LIABILITIES (CONTINUED)
Accruals for unused holiday is determined based on actual data (number of employees, unused days, payroll) taken
into calculation.
27. LONG-TERM LOANS
Long-term loans are denominated in different foreign currencies and are subject to different interest rates. Long-term
loans of INA, d.d. are unsecured and the majority of these loans contain financial covenants which are fulfilled.
The outstanding loans of the Group are analysed as follows:
Purpose of the loan Loan currency 31 December 2018 31 December 2017
Project financing USD, EUR 125 244
125 244
Due within one year (125) (122)
Total long-term loans INA, d.d. - 122
Obligation under finance lease 4 -
Other long-term loans INA Group EUR, USD, HUF, HRK - -
4 -
Due within one year - -
Total long-term loans INA Group 4 122
INA Group
Weighted average interest
rate
Weighted average interest
rate31 December
2018
31 December
2017
31 December
2018
31 December
2017
% %Bank loans in USD 4.01 2.95 98 190
Bank loans in EUR 1.23 1.23 27 54
Obligation under finance lease 4 -
Total 129 244
Payable within one year (125) (122)
Total long-term loans 4 122
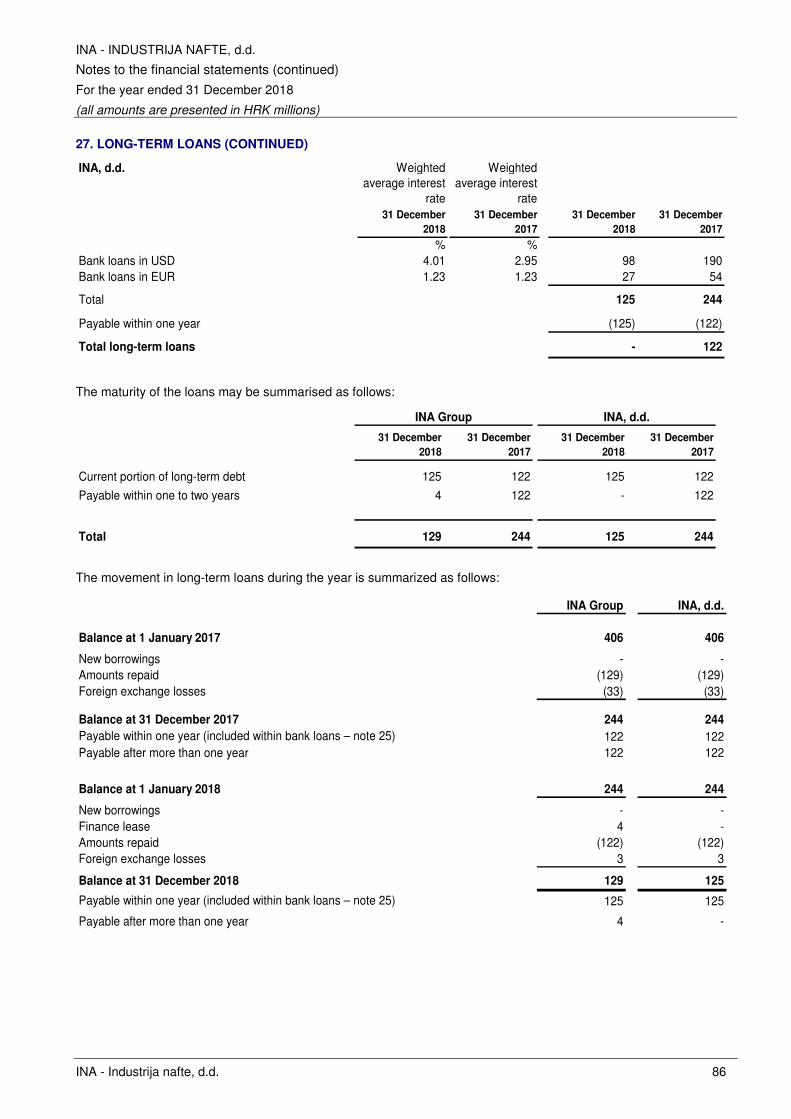
INA - INDUSTRIJA NAFTE, d.d.
Notes to the financial statements (continued)
For the year ended 31 December 2018
(all amounts are presented in HRK millions)
INA - Industrija nafte, d.d. 86
27. LONG-TERM LOANS (CONTINUED)
INA, d.d. Weighted average interest
rate
Weighted average interest
rate31 December
2018
31 December
2017
31 December
2018
31 December
2017
% %Bank loans in USD 4.01 2.95 98 190Bank loans in EUR 1.23 1.23 27 54
Total 125 244
Payable within one year (125) (122)
Total long-term loans - 122
The maturity of the loans may be summarised as follows:
31 December
2018
31 December
2017
31 December
2018
31 December
2017
Current portion of long-term debt 125 122 125 122
Payable within one to two years 4 122 - 122
Total 129 244 125 244
INA Group INA, d.d.
The movement in long-term loans during the year is summarized as follows:
INA Group INA, d.d.
Balance at 1 January 2017 406 406
New borrowings - -Amounts repaid (129) (129)Foreign exchange losses (33) (33)
Balance at 31 December 2017 244 244
Payable within one year (included within bank loans – note 25) 122 122Payable after more than one year 122 122
Balance at 1 January 2018 244 244
New borrowings - -Finance lease 4 -Amounts repaid (122) (122)Foreign exchange losses 3 3
Balance at 31 December 2018 129 125
Payable within one year (included within bank loans – note 25) 125 125
Payable after more than one year 4 -
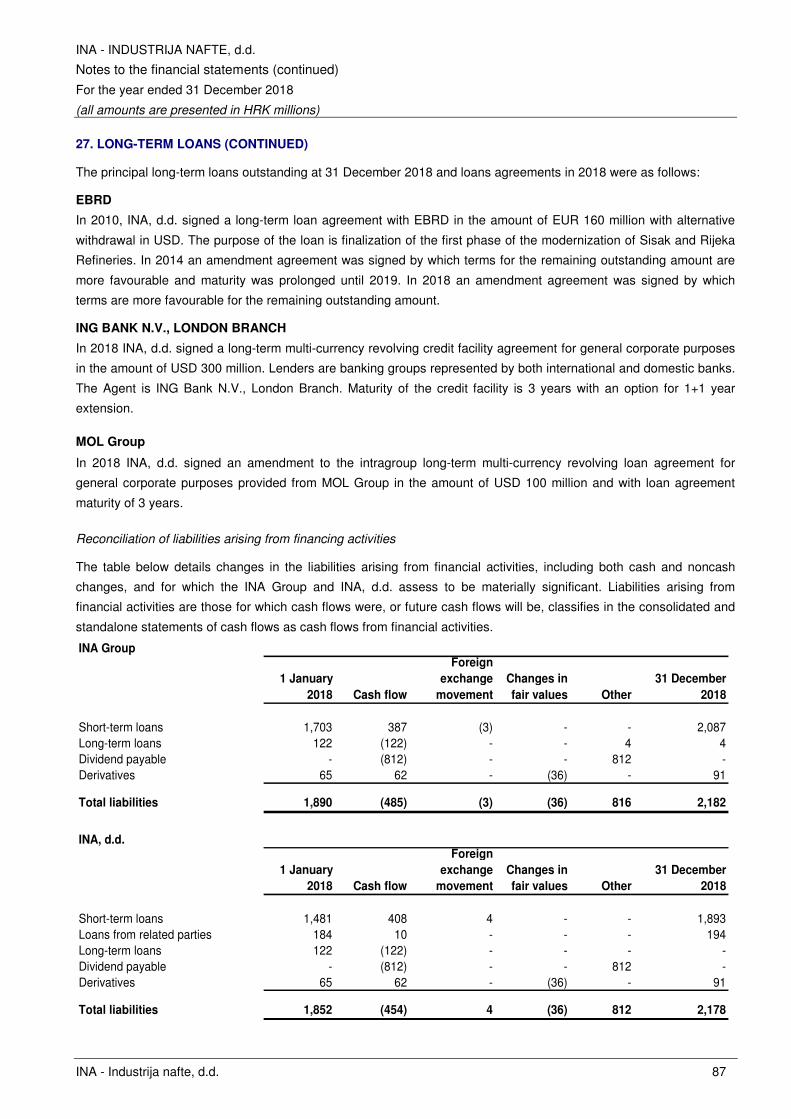
INA - INDUSTRIJA NAFTE, d.d.
Notes to the financial statements (continued)
For the year ended 31 December 2018
(all amounts are presented in HRK millions)
INA - Industrija nafte, d.d. 87
27. LONG-TERM LOANS (CONTINUED)
The principal long-term loans outstanding at 31 December 2018 and loans agreements in 2018 were as follows:
EBRD
In 2010, INA, d.d. signed a long-term loan agreement with EBRD in the amount of EUR 160 million with alternative
withdrawal in USD. The purpose of the loan is finalization of the first phase of the modernization of Sisak and Rijeka
Refineries. In 2014 an amendment agreement was signed by which terms for the remaining outstanding amount are
more favourable and maturity was prolonged until 2019. In 2018 an amendment agreement was signed by which
terms are more favourable for the remaining outstanding amount.
ING BANK N.V., LONDON BRANCH
In 2018 INA, d.d. signed a long-term multi-currency revolving credit facility agreement for general corporate purposes
in the amount of USD 300 million. Lenders are banking groups represented by both international and domestic banks.
The Agent is ING Bank N.V., London Branch. Maturity of the credit facility is 3 years with an option for 1+1 year
extension.
MOL Group
In 2018 INA, d.d. signed an amendment to the intragroup long-term multi-currency revolving loan agreement for
general corporate purposes provided from MOL Group in the amount of USD 100 million and with loan agreement
maturity of 3 years.
Reconciliation of liabilities arising from financing activities
The table below details changes in the liabilities arising from financial activities, including both cash and noncash
changes, and for which the INA Group and INA, d.d. assess to be materially significant. Liabilities arising from
financial activities are those for which cash flows were, or future cash flows will be, classifies in the consolidated and
standalone statements of cash flows as cash flows from financial activities.
INA Group
1 January
2018 Cash flow
Foreign
exchange
movement
Changes in
fair values Other
31 December
2018
Short-term loans 1,703 387 (3) - - 2,087Long-term loans 122 (122) - - 4 4Dividend payable - (812) - - 812 -Derivatives 65 62 - (36) - 91
Total liabilities 1,890 (485) (3) (36) 816 2,182
INA, d.d.
1 January
2018 Cash flow
Foreign
exchange
movement
Changes in
fair values Other
31 December
2018
Short-term loans 1,481 408 4 - - 1,893Loans from related parties 184 10 - - - 194Long-term loans 122 (122) - - - -Dividend payable - (812) - - 812 -Derivatives 65 62 - (36) - 91
Total liabilities 1,852 (454) 4 (36) 812 2,178
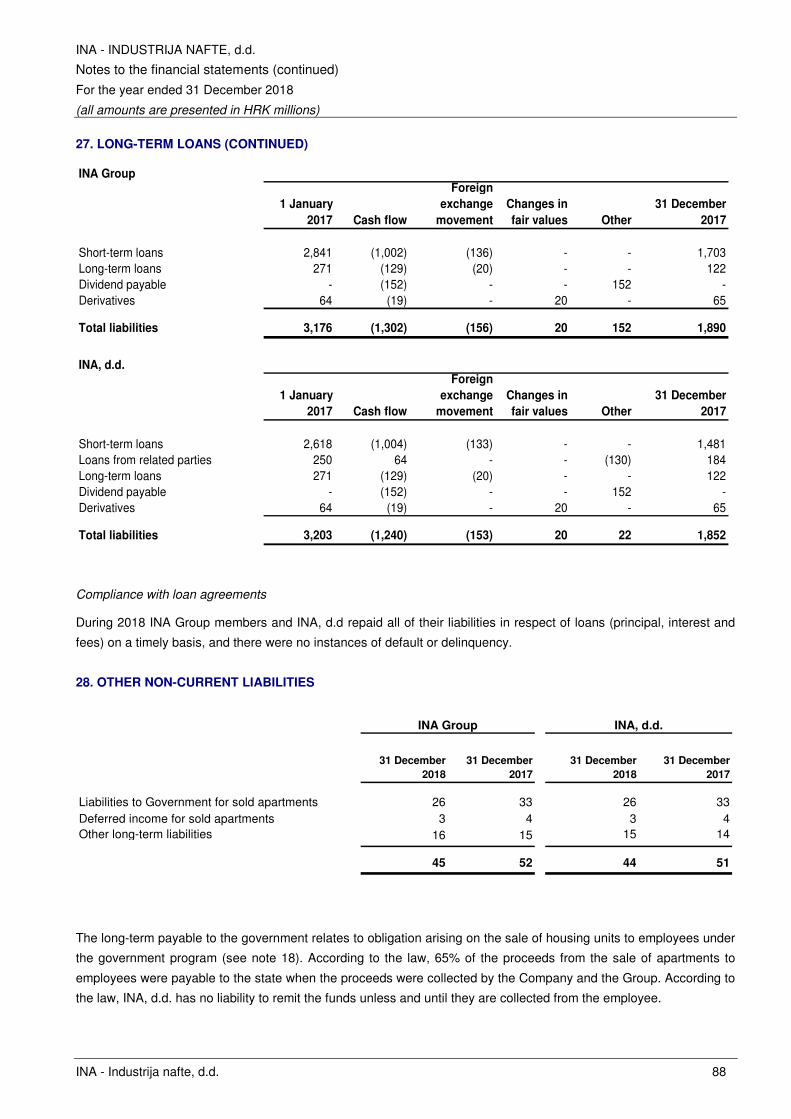
INA - INDUSTRIJA NAFTE, d.d.
Notes to the financial statements (continued)
For the year ended 31 December 2018
(all amounts are presented in HRK millions)
INA - Industrija nafte, d.d. 88
27. LONG-TERM LOANS (CONTINUED)
INA Group
1 January
2017 Cash flow
Foreign
exchange
movement
Changes in
fair values Other
31 December
2017
Short-term loans 2,841 (1,002) (136) - - 1,703Long-term loans 271 (129) (20) - - 122Dividend payable - (152) - - 152 -Derivatives 64 (19) - 20 - 65
Total liabilities 3,176 (1,302) (156) 20 152 1,890
INA, d.d.
1 January
2017 Cash flow
Foreign
exchange
movement
Changes in
fair values Other
31 December
2017
Short-term loans 2,618 (1,004) (133) - - 1,481Loans from related parties 250 64 - - (130) 184Long-term loans 271 (129) (20) - - 122Dividend payable - (152) - - 152 -Derivatives 64 (19) - 20 - 65
Total liabilities 3,203 (1,240) (153) 20 22 1,852
Compliance with loan agreements
During 2018 INA Group members and INA, d.d repaid all of their liabilities in respect of loans (principal, interest and
fees) on a timely basis, and there were no instances of default or delinquency.
28. OTHER NON-CURRENT LIABILITIES
31 December
2018
31 December
2017
31 December
2018
31 December
2017
Liabilities to Government for sold apartments 26 33 26 33Deferred income for sold apartments 3 4 3 4Other long-term liabilities 16 15 15 14
45 52 44 51
INA Group INA, d.d.
The long-term payable to the government relates to obligation arising on the sale of housing units to employees under
the government program (see note 18). According to the law, 65% of the proceeds from the sale of apartments to
employees were payable to the state when the proceeds were collected by the Company and the Group. According to
the law, INA, d.d. has no liability to remit the funds unless and until they are collected from the employee.
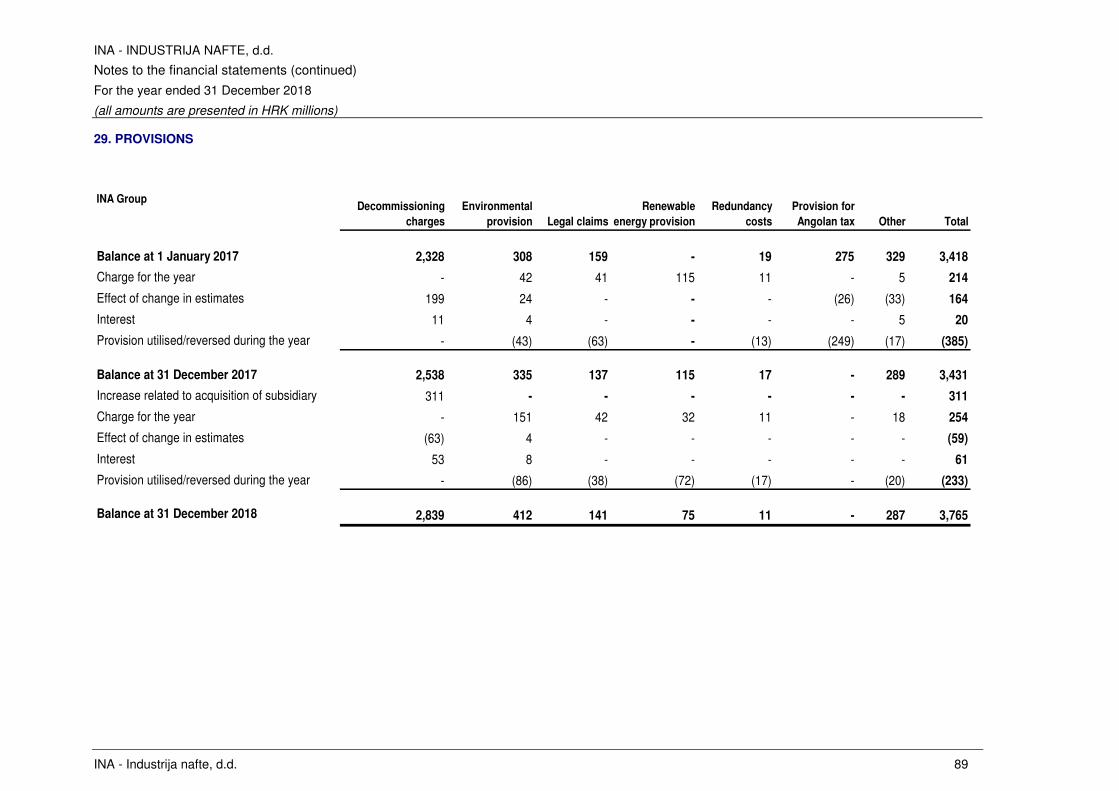
INA - INDUSTRIJA NAFTE, d.d.
Notes to the financial statements (continued)
For the year ended 31 December 2018
(all amounts are presented in HRK millions)
INA - Industrija nafte, d.d. 89
29. PROVISIONS
INA GroupDecommissioning
charges
Environmental
provision Legal claims
Renewable
energy provision
Redundancy
costs
Provision for
Angolan tax Other Total
Balance at 1 January 2017 2,328 308 159 - 19 275 329 3,418
Charge for the year - 42 41 115 11 - 5 214
Effect of change in estimates 199 24 - - - (26) (33) 164
Interest 11 4 - - - - 5 20
Provision utilised/reversed during the year - (43) (63) - (13) (249) (17) (385)
Balance at 31 December 2017 2,538 335 137 115 17 - 289 3,431
Increase related to acquisition of subsidiary 311 - - - - - - 311
Charge for the year - 151 42 32 11 - 18 254
Effect of change in estimates (63) 4 - - - - - (59)
Interest 53 8 - - - - - 61
Provision utilised/reversed during the year - (86) (38) (72) (17) - (20) (233)
Balance at 31 December 2018 2,839 412 141 75 11 - 287 3,765
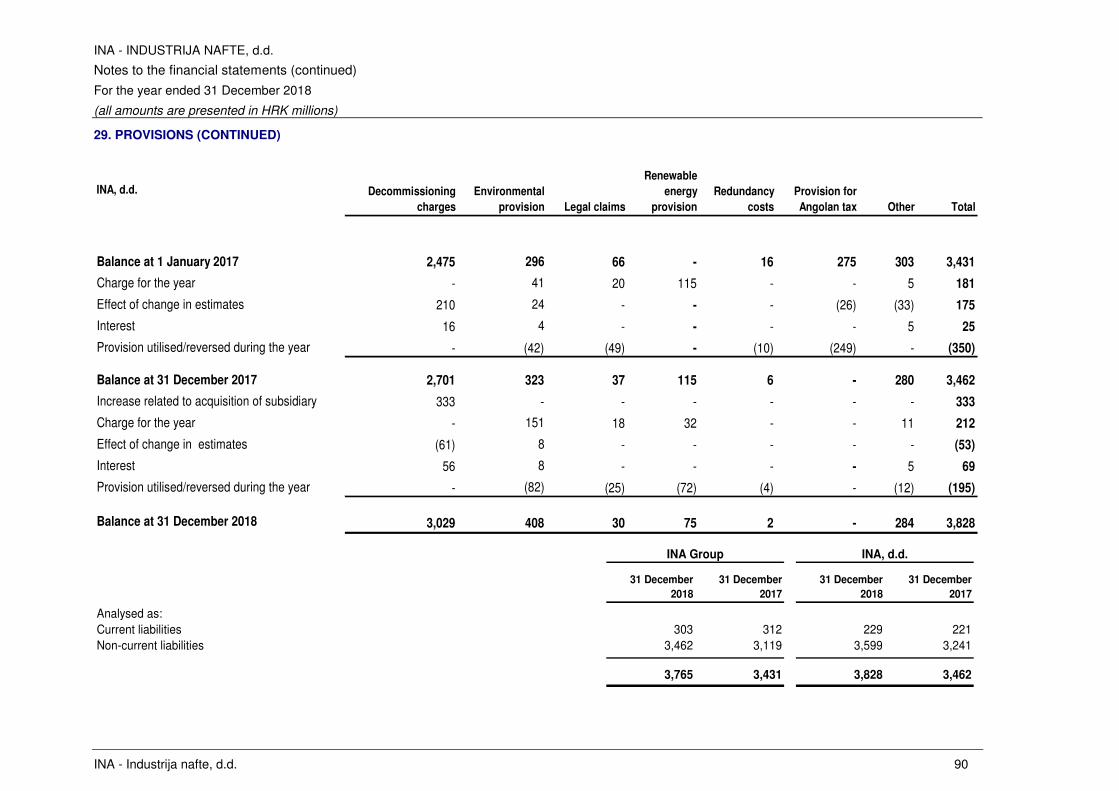
INA - INDUSTRIJA NAFTE, d.d.
Notes to the financial statements (continued)
For the year ended 31 December 2018
(all amounts are presented in HRK millions)
INA - Industrija nafte, d.d. 90
29. PROVISIONS (CONTINUED)
INA, d.d. Decommissioning
charges
Environmental
provision Legal claims
Renewable
energy
provision
Redundancy
costs
Provision for
Angolan tax Other Total
Balance at 1 January 2017 2,475 296 66 - 16 275 303 3,431
Charge for the year - 41 20 115 - - 5 181
Effect of change in estimates 210 24 - - - (26) (33) 175
Interest 16 4 - - - - 5 25
Provision utilised/reversed during the year - (42) (49) - (10) (249) - (350)
Balance at 31 December 2017 2,701 323 37 115 6 - 280 3,462
Increase related to acquisition of subsidiary 333 - - - - - - 333
Charge for the year - 151 18 32 - - 11 212
Effect of change in estimates (61) 8 - - - - - (53)
Interest 56 8 - - - - 5 69
Provision utilised/reversed during the year - (82) (25) (72) (4) - (12) (195)
Balance at 31 December 2018 3,029 408 30 75 2 - 284 3,828
31 December
2018
31 December
2017
31 December
2018
31 December
2017
Analysed as:Current liabilities 303 312 229 221Non-current liabilities 3,462 3,119 3,599 3,241
3,765 3,431 3,828 3,462
INA Group INA, d.d.
INA - INDUSTRIJA NAFTE, d.d.
Notes to the financial statements (continued)
For the year ended 31 December 2018
(all amounts are presented in HRK millions)
INA - Industrija nafte, d.d. 91
29. PROVISIONS (CONTINUED)
Decommissioning charges
The Company and the Group record provisions at present value of estimated future costs of abandoning oil and gas
production facilities estimated at the end of production. The estimate of provisions is based on the applicable legal
regulations, technology and price levels. Decommission assets are created in an amount equal to the estimated
provision, which is also amortized as part of the capital asset costs. Any change to the present value of the
estimated costs is reflected as an adjustment of the provisions and the decommission assets.
As of 31 December 2018, INA, d.d. recognised a decommissioning provision for 45 oil and gas production fields, 6
non-production fields, 10 positive non-production fields and 357 dry non-production wells. As of 31 December 2017,
INA, d.d. recognised a decommissioning provision for 45 oil and gas production fields, 7 non-production fields, 10
positive non-production fields and 357 dry non-production wells.
Environmental provision
The environmental provision recorded by INA Group is HRK 412 million as of 31 December 2018 (31 December
2017: HRK 335 million). The environmental provision covers treatment of accumulated waste generated by former
activity, soil excavation and replacement during the reconstruction of service stations and comprehensive
investigation to determine the extent of the soil and groundwater contaminations.
Emission allowances
Under European Union Emission Trading Scheme, INA, d.d. plants receive a certain amount of emission allowances
for free. The allowances are received on an annual basis, and in return, INA, d.d. is required to submit allowances
equal to its actual verified emissions. The number of emission allowances allocated for free is calculated by the
European Commission filled in by installations, and submitted to Ministry of Environmental and Nature protection by
31 December of the current year for that year.
INA, d.d. has adopted the net liability approach to the emission allowances granted. Therefore, a provision is
recognised only when actual emissions exceed the allocated emission allowances. Provision recorded for exceeding
amount of emission rights granted should be charged with purchased rights. The emission costs are recognised as
other material costs. Detail explanation on the accounting and provision calculation is regulated by internal
Regulation on greenhouse gas and emission allowances management in INA, d.d.
Free Emission allowances are granted with respect to one year period and are distributed by competent authority.
Legal claims
Provisions for legal claims are based on the legal counsel and management estimate, taking into consideration
claim value and probability that outflow of resources will be required to settle the obligation
Renewable energy provision
Renewable energy provision relates to the potential compliance cost which can arise from the Act on bio fuels for
transports and further regulated by Regulation on special environmental fee.
INA - INDUSTRIJA NAFTE, d.d.
Notes to the financial statements (continued)
For the year ended 31 December 2018
(all amounts are presented in HRK millions)
INA - Industrija nafte, d.d. 92
29. PROVISIONS (CONTINUED)
Provision for Angolan tax
At the beginning of 2017 INA, d.d. representatives attended a meeting in Angola with representatives of the Angolan
Ministry of Finance regarding the negotiations of additional tax and profit oil debt amount. As a result of negotiation,
debt for the period 2002 - 2009 was reduced to the amount of USD 6.6 million and debt for the period 2010 - 2015
was annulled. After signing a Global Agreement with the Angolan Ministry of Finance in July 2017, INA, d.d. posted
the reversal of provision in the amount of HRK 249 million.
Other provisions
Other provisions of INA, d.d. in amount of HRK 283 million relate to provision for contractual liability for investments
in Iran of HRK 247 million initially recognized in 2012. INA, d.d. is committed to spending certain resources by
Production Agreement. Since Iran activities have been discontinued, the difference between contractual liability and
actual funds spent was recognized as provisions. Moreover, remaining amount mainly relates to provision for
sediment and non-pumpable inventories in the amount of HRK 33 million.
30. RETIREMENT AND OTHER EMPLOYEE BENEFITS
According to the Collective Agreement, the Group bears the obligation to pay jubilee awards, retirement and other
benefits to employees. The Group operates defined benefit schemes for qualifying employees. Under the schemes,
the employees are entitled to an early retirement benefit in the net amount of HRK 20,000 of which HRK 12,000
represent taxable portion. No other post-retirement benefits are provided. Jubilee awards are paid out according to
Collective Agreement in the following fixed amounts and anniversary dates for continuous service in the Company
and the Group:
Anniversary of continuous services -
years 10 15 20 25 30 35
40 and every 5
more years
Fixed amounts - HRK 1,500 2,000 2,500 3,000 3,500 4,000 5,000
The net amounts specified above, in terms of tax regulations are non-taxable. Defined amounts of jubilee awards
are effective for Collective Agreement signed in 2018.
The actuarial valuations of the present value of the defined benefit obligation were carried out at 31 December 2018
and 2017 by independent actuarial expert. In 2018, the Company made a provision of HRK 14 million in respect of
jubilee awards and HRK 22 million for regular retirement allowance, whereas in 2017 Company made provision in
respect of jubilee awards in amount of HRK 15 million and for regular retirement HRK 20 million.
INA - INDUSTRIJA NAFTE, d.d.
Notes to the financial statements (continued)
For the year ended 31 December 2018
(all amounts are presented in HRK millions)
INA - Industrija nafte, d.d. 93
30. RETIREMENT AND OTHER EMPLOYEE BENEFITS (CONTINUED)
The present values of the defined benefit obligation, the related current service cost and past service cost were
determined using the projection method based on the total number of employees.
Actuarial estimates were derived based on the following key assumptions:
31 December 2018 31 December 2017
Discount rate 2.5% 2.6%
Average longevity at retirement age for current pensioners (years)males 14.9 14.1females 18.3 18.3
Average longevity at retirement age for current employees (future pensioners) (years)
males 14.9 14.1females 18.3 18.3
Mortality HR 2010-2012 Statistical Yearbook
Valuation at
The amounts recognised in other comprehensive income related to retirement and other employee benefits are as
follows:
31 December
2018
31 December
2017
31 December
2018
31 December
2017
Service cost:
Cost of current period 5 6 1 2Interest 2 2 1 1Past service cost, including losses/(gains) on curtailments (7) (8) - -Components of defined benefit costs recognized in
profit and loss: - - 2 3
Remeasurement of the net defined benefit liability:Actuarial gains and losses arising from changes in demographic assumptions 1 (19) - (17)Actuarial gains and losses arising from changes in financial assumptions 3 1 2 -Actuarial gains and losses arising from experience adjustments - 2 - 1Components of defined benefit costs recognised in profit and loss account and other comprehensive income: 4 (16) 2 (16)
Total 4 (16) 4 (13)
INA Group INA, d.d.
INA - INDUSTRIJA NAFTE, d.d.
Notes to the financial statements (continued)
For the year ended 31 December 2018
(all amounts are presented in HRK millions)
INA - Industrija nafte, d.d. 94
30. RETIREMENT AND OTHER EMPLOYEE BENEFITS (CONTINUED)
The change of the present value of defined benefit obligation may be analysed as follows:
2018 2017 2018 2017
At 1 January 78 95 34 48
Acquisition of subsidiary - - - -
Cost of current period 5 6 2 2
Interest 2 2 1 1
Actuarial (gains) or losses
Actuarial gains and losses arising from changes in demographic assumptions 1 (19) - (17)Actuarial gains and losses arising from changes in financial assumptions 3 - 2 -
Actuarial gains and losses arising from experience adjustments - 2 - 1Past service cost, including losses/(gains) on curtailments (7) (8) - -
Benefit paid - - (3) (1)
Closing defined benefit obligation 82 78 36 34
INA, d.d.INA Group
31. SHARE CAPITAL
31 December
2018
31 December
2017
Issued and fully paid:
10 million shares (HRK 900 each) 9,000 9,000
INA Group and INA, d.d.
The Company’s share capital consists of 10 million authorised and issued shares of par value HRK 900 each. Each
share carries one vote and is entitled to dividends.
32. FAIR VALUE RESERVES
31 December 2018 31 December 2017
Balance at the beginning of the year 289 299
Decrease arising on revaluation of long-term financial asset (Janaf) (188) (11)
Deferred tax effect 34 1
Balance at the end of the year 135 289
INA Group and INA, d.d.
In 2018 and 2017, decrease on fair value reserves was recorded due to decrease of JANAF shares, therefore a
decrease on fair value reserves was recorded.
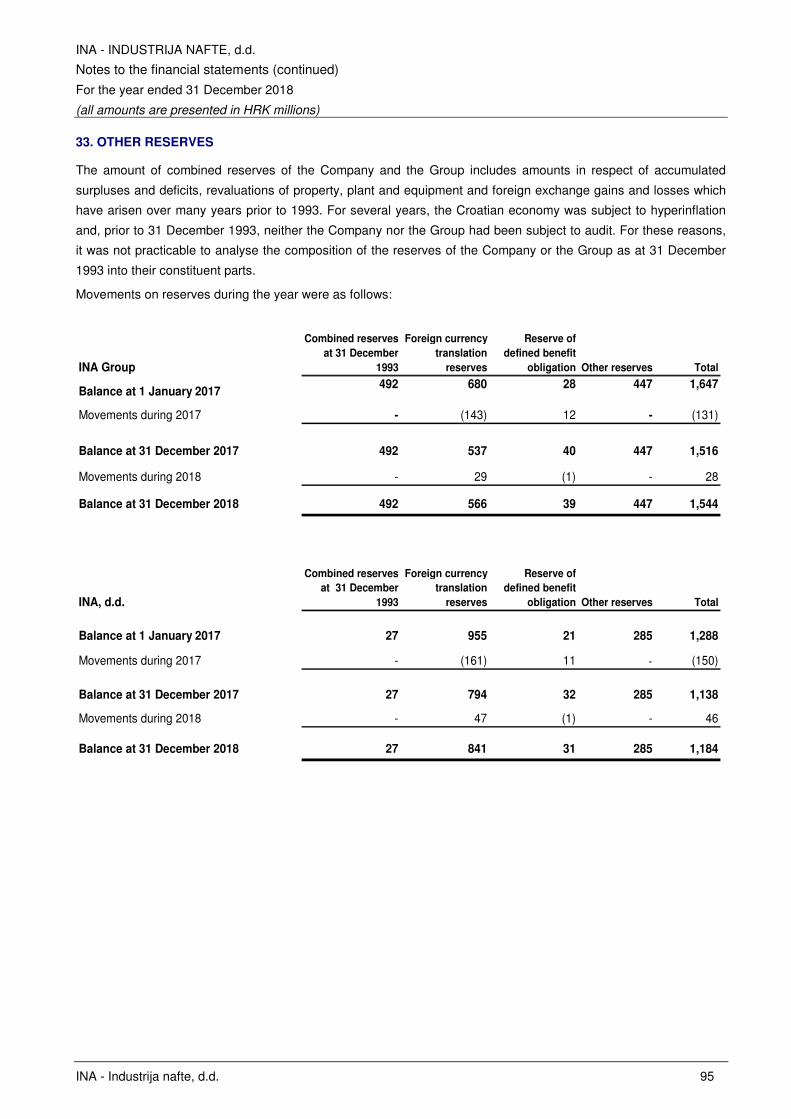
INA - INDUSTRIJA NAFTE, d.d.
Notes to the financial statements (continued)
For the year ended 31 December 2018
(all amounts are presented in HRK millions)
INA - Industrija nafte, d.d. 95
33. OTHER RESERVES
The amount of combined reserves of the Company and the Group includes amounts in respect of accumulated
surpluses and deficits, revaluations of property, plant and equipment and foreign exchange gains and losses which
have arisen over many years prior to 1993. For several years, the Croatian economy was subject to hyperinflation
and, prior to 31 December 1993, neither the Company nor the Group had been subject to audit. For these reasons,
it was not practicable to analyse the composition of the reserves of the Company or the Group as at 31 December
1993 into their constituent parts.
Movements on reserves during the year were as follows:
INA Group
Combined reserves
at 31 December
1993
Foreign currency
translation
reserves
Reserve of
defined benefit
obligation Other reserves Total
Balance at 1 January 2017492 680 28 447 1,647
Movements during 2017 - (143) 12 - (131)
Balance at 31 December 2017 492 537 40 447 1,516
Movements during 2018 - 29 (1) - 28
Balance at 31 December 2018 492 566 39 447 1,544
INA, d.d.
Combined reserves
at 31 December
1993
Foreign currency
translation
reserves
Reserve of
defined benefit
obligation Other reserves Total
Balance at 1 January 2017 27 955 21 285 1,288
Movements during 2017 - (161) 11 - (150)
Balance at 31 December 2017 27 794 32 285 1,138
Movements during 2018 - 47 (1) - 46
Balance at 31 December 2018 27 841 31 285 1,184
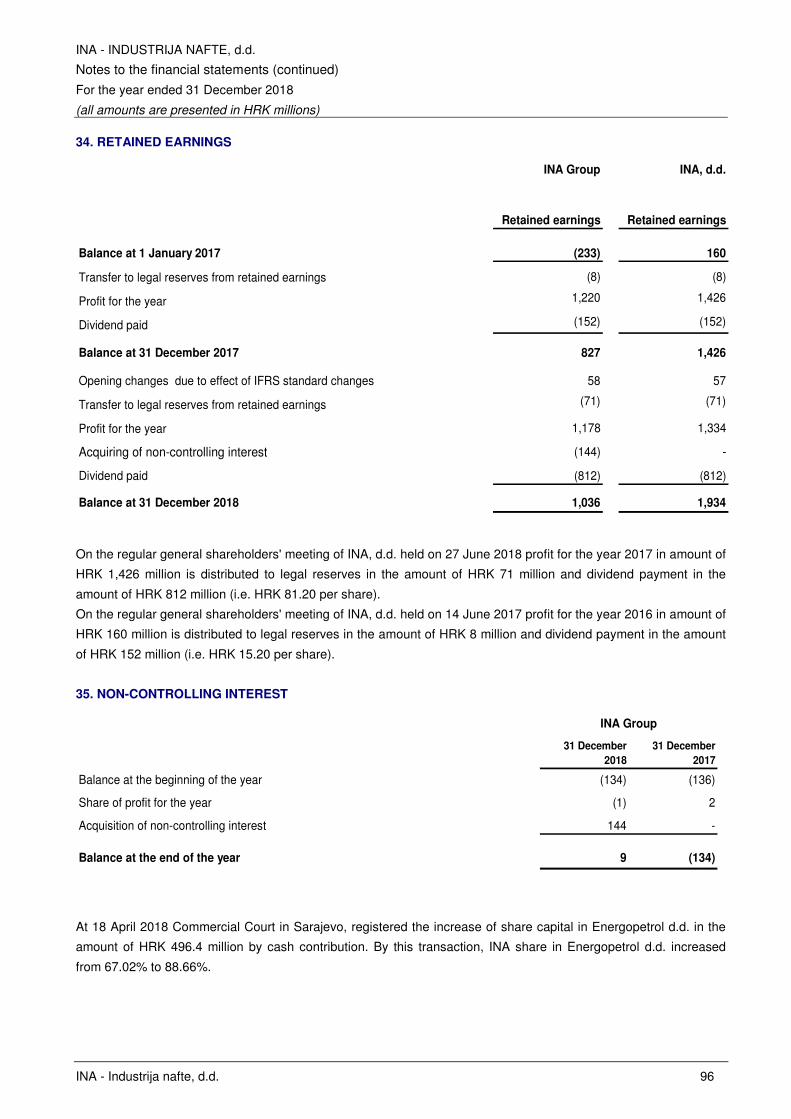
INA - INDUSTRIJA NAFTE, d.d.
Notes to the financial statements (continued)
For the year ended 31 December 2018
(all amounts are presented in HRK millions)
INA - Industrija nafte, d.d. 96
34. RETAINED EARNINGS
INA Group INA, d.d.
Retained earnings Retained earnings
Balance at 1 January 2017 (233) 160
Transfer to legal reserves from retained earnings (8) (8)
Profit for the year 1,220 1,426
Dividend paid (152) (152)
Balance at 31 December 2017 827 1,426
Opening changes due to effect of IFRS standard changes 58 57
Transfer to legal reserves from retained earnings (71) (71)
Profit for the year 1,178 1,334
Acquiring of non-controlling interest (144) -
Dividend paid (812) (812)
Balance at 31 December 2018 1,036 1,934
On the regular general shareholders' meeting of INA, d.d. held on 27 June 2018 profit for the year 2017 in amount of
HRK 1,426 million is distributed to legal reserves in the amount of HRK 71 million and dividend payment in the
amount of HRK 812 million (i.e. HRK 81.20 per share).
On the regular general shareholders' meeting of INA, d.d. held on 14 June 2017 profit for the year 2016 in amount of
HRK 160 million is distributed to legal reserves in the amount of HRK 8 million and dividend payment in the amount
of HRK 152 million (i.e. HRK 15.20 per share).
35. NON-CONTROLLING INTEREST
31 December
2018
31 December
2017
Balance at the beginning of the year (134) (136)
Share of profit for the year (1) 2
Acquisition of non-controlling interest 144 -
Balance at the end of the year 9 (134)
INA Group
At 18 April 2018 Commercial Court in Sarajevo, registered the increase of share capital in Energopetrol d.d. in the
amount of HRK 496.4 million by cash contribution. By this transaction, INA share in Energopetrol d.d. increased
from 67.02% to 88.66%.
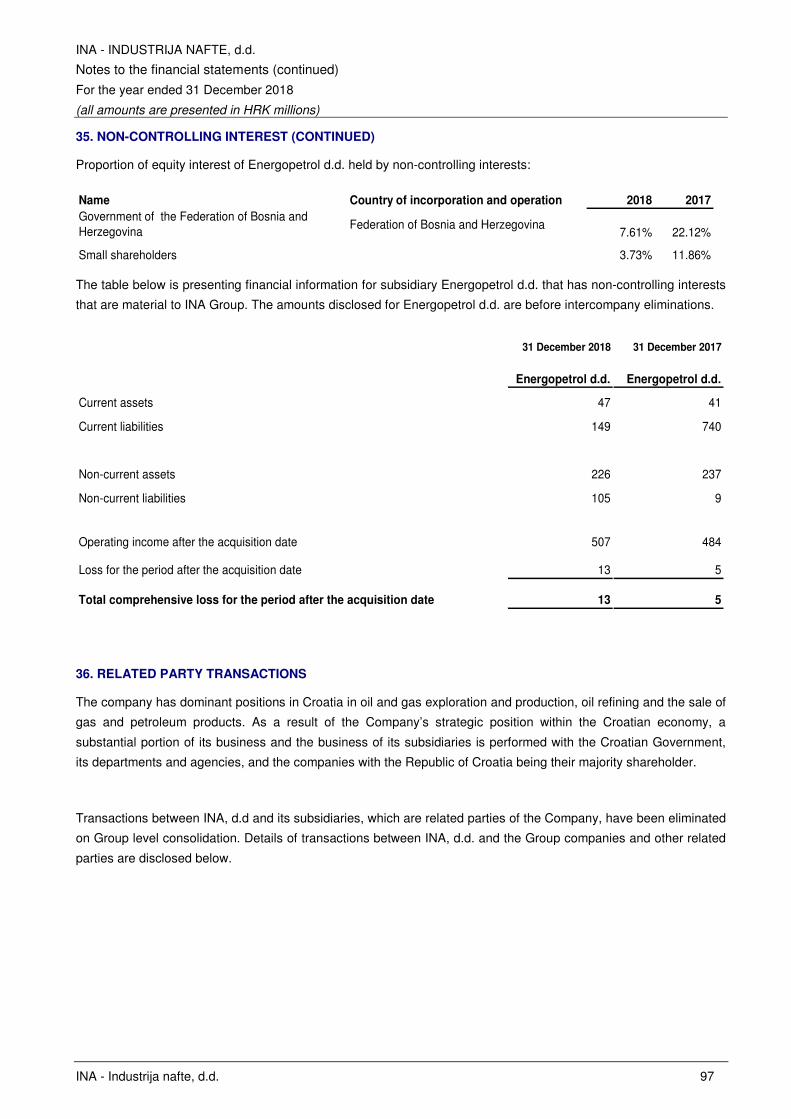
INA - INDUSTRIJA NAFTE, d.d.
Notes to the financial statements (continued)
For the year ended 31 December 2018
(all amounts are presented in HRK millions)
INA - Industrija nafte, d.d. 97
35. NON-CONTROLLING INTEREST (CONTINUED)
Proportion of equity interest of Energopetrol d.d. held by non-controlling interests:
Name Country of incorporation and operation 2018 2017
Government of the Federation of Bosnia and Herzegovina
Federation of Bosnia and Herzegovina7.61% 22.12%
Small shareholders 3.73% 11.86%
The table below is presenting financial information for subsidiary Energopetrol d.d. that has non-controlling interests
that are material to INA Group. The amounts disclosed for Energopetrol d.d. are before intercompany eliminations.
31 December 2018 31 December 2017
Energopetrol d.d. Energopetrol d.d.
Current assets 47 41
Current liabilities 149 740
Non-current assets 226 237
Non-current liabilities 105 9
Operating income after the acquisition date 507 484
Loss for the period after the acquisition date 13 5
Total comprehensive loss for the period after the acquisition date 13 5
36. RELATED PARTY TRANSACTIONS
The company has dominant positions in Croatia in oil and gas exploration and production, oil refining and the sale of
gas and petroleum products. As a result of the Company’s strategic position within the Croatian economy, a
substantial portion of its business and the business of its subsidiaries is performed with the Croatian Government,
its departments and agencies, and the companies with the Republic of Croatia being their majority shareholder.
Transactions between INA, d.d and its subsidiaries, which are related parties of the Company, have been eliminated
on Group level consolidation. Details of transactions between INA, d.d. and the Group companies and other related
parties are disclosed below.
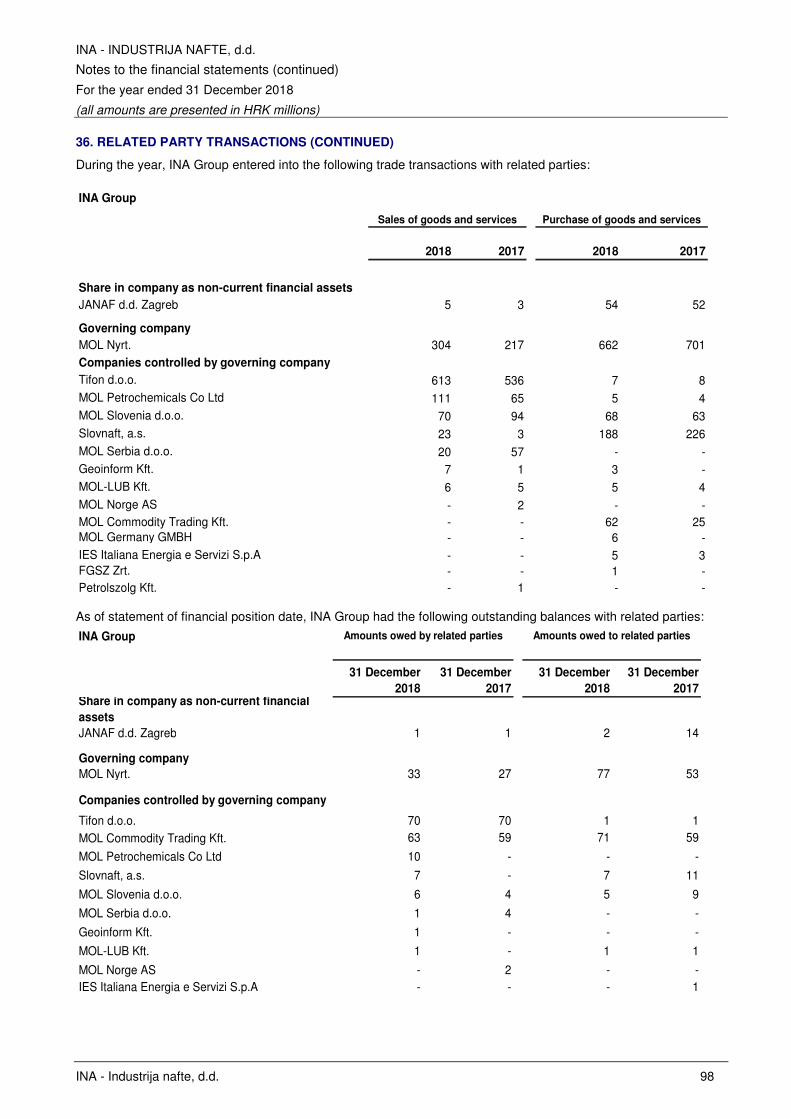
INA - INDUSTRIJA NAFTE, d.d.
Notes to the financial statements (continued)
For the year ended 31 December 2018
(all amounts are presented in HRK millions)
INA - Industrija nafte, d.d. 98
36. RELATED PARTY TRANSACTIONS (CONTINUED)
During the year, INA Group entered into the following trade transactions with related parties:
INA Group
2018 2017 2018 2017
Share in company as non-current financial assets
JANAF d.d. Zagreb 5 3 54 52
Governing company
MOL Nyrt. 304 217 662 701Companies controlled by governing company
Tifon d.o.o. 613 536 7 8MOL Petrochemicals Co Ltd 111 65 5 4MOL Slovenia d.o.o. 70 94 68 63Slovnaft, a.s. 23 3 188 226MOL Serbia d.o.o. 20 57 - -Geoinform Kft. 7 1 3 -MOL-LUB Kft. 6 5 5 4MOL Norge AS - 2 - -MOL Commodity Trading Kft. - - 62 25MOL Germany GMBH - - 6 -IES Italiana Energia e Servizi S.p.A - - 5 3FGSZ Zrt. - - 1 -Petrolszolg Kft. - 1 - -
Purchase of goods and servicesSales of goods and services
As of statement of financial position date, INA Group had the following outstanding balances with related parties:
INA Group
31 December
2018
31 December
2017
31 December
2018
31 December
2017Share in company as non-current financial
assets
JANAF d.d. Zagreb 1 1 2 14
Governing company
MOL Nyrt. 33 27 77 53
Companies controlled by governing company
Tifon d.o.o. 70 70 1 1MOL Commodity Trading Kft. 63 59 71 59
MOL Petrochemicals Co Ltd 10 - - -
Slovnaft, a.s. 7 - 7 11
MOL Slovenia d.o.o. 6 4 5 9
MOL Serbia d.o.o. 1 4 - -
Geoinform Kft. 1 - - -
MOL-LUB Kft. 1 - 1 1
MOL Norge AS - 2 - -IES Italiana Energia e Servizi S.p.A - - - 1
Amounts owed to related partiesAmounts owed by related parties
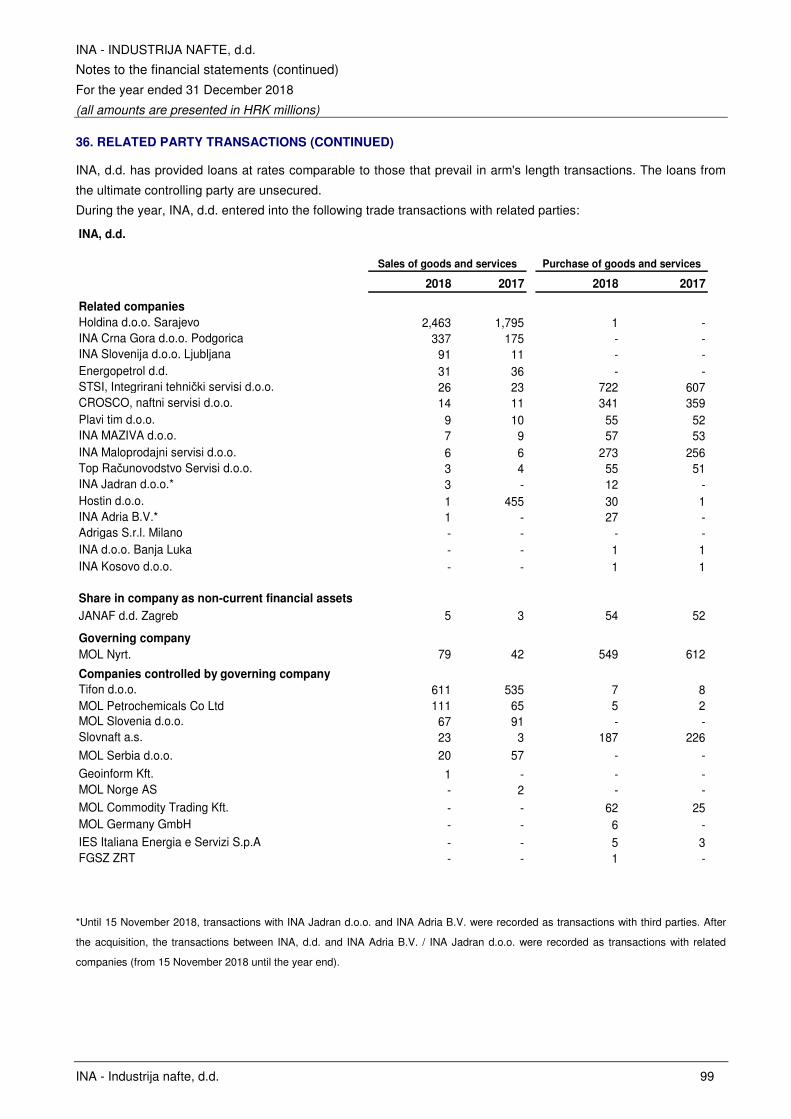
INA - INDUSTRIJA NAFTE, d.d.
Notes to the financial statements (continued)
For the year ended 31 December 2018
(all amounts are presented in HRK millions)
INA - Industrija nafte, d.d. 99
36. RELATED PARTY TRANSACTIONS (CONTINUED)
INA, d.d. has provided loans at rates comparable to those that prevail in arm's length transactions. The loans from
the ultimate controlling party are unsecured.
During the year, INA, d.d. entered into the following trade transactions with related parties:
INA, d.d.
2018 2017 2018 2017
Related companies
Holdina d.o.o. Sarajevo 2,463 1,795 1 -INA Crna Gora d.o.o. Podgorica 337 175 - -INA Slovenija d.o.o. Ljubljana 91 11 - -Energopetrol d.d. 31 36 - -STSI, Integrirani tehnički servisi d.o.o. 26 23 722 607CROSCO, naftni servisi d.o.o. 14 11 341 359Plavi tim d.o.o. 9 10 55 52INA MAZIVA d.o.o. 7 9 57 53INA Maloprodajni servisi d.o.o. 6 6 273 256Top Računovodstvo Servisi d.o.o. 3 4 55 51INA Jadran d.o.o.* 3 - 12 -Hostin d.o.o. 1 455 30 1INA Adria B.V.* 1 - 27 -Adrigas S.r.l. Milano - - - -INA d.o.o. Banja Luka - - 1 1INA Kosovo d.o.o. - - 1 1
Share in company as non-current financial assets
JANAF d.d. Zagreb 5 3 54 52
Governing company
MOL Nyrt. 79 42 549 612
Companies controlled by governing company
Tifon d.o.o. 611 535 7 8MOL Petrochemicals Co Ltd 111 65 5 2MOL Slovenia d.o.o. 67 91 - -Slovnaft a.s. 23 3 187 226
MOL Serbia d.o.o. 20 57 - -
Geoinform Kft. 1 - - -MOL Norge AS - 2 - -MOL Commodity Trading Kft. - - 62 25MOL Germany GmbH - - 6 -IES Italiana Energia e Servizi S.p.A - - 5 3FGSZ ZRT - - 1 -
Sales of goods and services Purchase of goods and services
*Until 15 November 2018, transactions with INA Jadran d.o.o. and INA Adria B.V. were recorded as transactions with third parties. After
the acquisition, the transactions between INA, d.d. and INA Adria B.V. / INA Jadran d.o.o. were recorded as transactions with related
companies (from 15 November 2018 until the year end).
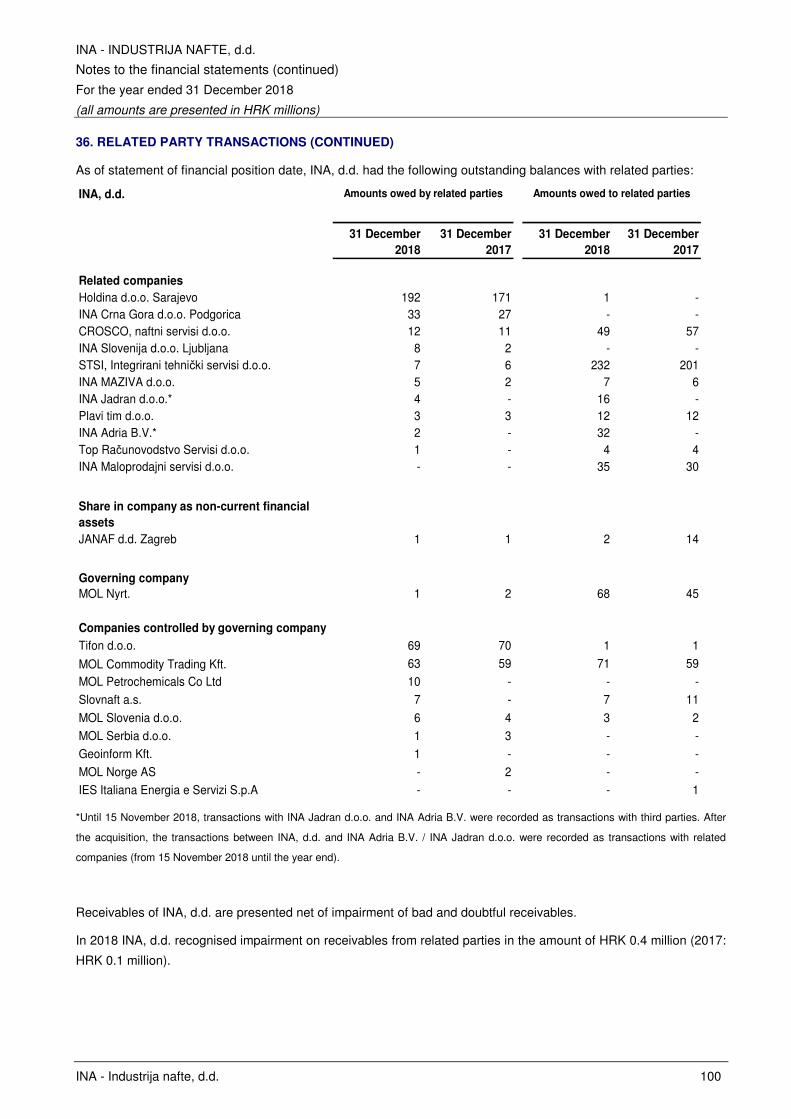
INA - INDUSTRIJA NAFTE, d.d.
Notes to the financial statements (continued)
For the year ended 31 December 2018
(all amounts are presented in HRK millions)
INA - Industrija nafte, d.d. 100
36. RELATED PARTY TRANSACTIONS (CONTINUED)
As of statement of financial position date, INA, d.d. had the following outstanding balances with related parties:
INA, d.d.
31 December
2018
31 December
2017
31 December
2018
31 December
2017
Related companies
Holdina d.o.o. Sarajevo 192 171 1 -INA Crna Gora d.o.o. Podgorica 33 27 - -CROSCO, naftni servisi d.o.o. 12 11 49 57INA Slovenija d.o.o. Ljubljana 8 2 - -STSI, Integrirani tehnički servisi d.o.o. 7 6 232 201INA MAZIVA d.o.o. 5 2 7 6INA Jadran d.o.o.* 4 - 16 -Plavi tim d.o.o. 3 3 12 12INA Adria B.V.* 2 - 32 -Top Računovodstvo Servisi d.o.o. 1 - 4 4INA Maloprodajni servisi d.o.o. - - 35 30
Share in company as non-current financial
assets
JANAF d.d. Zagreb 1 1 2 14
Governing company
MOL Nyrt. 1 2 68 45
Companies controlled by governing company
Tifon d.o.o. 69 70 1 1
MOL Commodity Trading Kft. 63 59 71 59
MOL Petrochemicals Co Ltd 10 - - -
Slovnaft a.s. 7 - 7 11
MOL Slovenia d.o.o. 6 4 3 2
MOL Serbia d.o.o. 1 3 - -
Geoinform Kft. 1 - - -
MOL Norge AS - 2 - -
IES Italiana Energia e Servizi S.p.A - - - 1
Amounts owed by related parties Amounts owed to related parties
*Until 15 November 2018, transactions with INA Jadran d.o.o. and INA Adria B.V. were recorded as transactions with third parties. After
the acquisition, the transactions between INA, d.d. and INA Adria B.V. / INA Jadran d.o.o. were recorded as transactions with related
companies (from 15 November 2018 until the year end).
Receivables of INA, d.d. are presented net of impairment of bad and doubtful receivables.
In 2018 INA, d.d. recognised impairment on receivables from related parties in the amount of HRK 0.4 million (2017:
HRK 0.1 million).
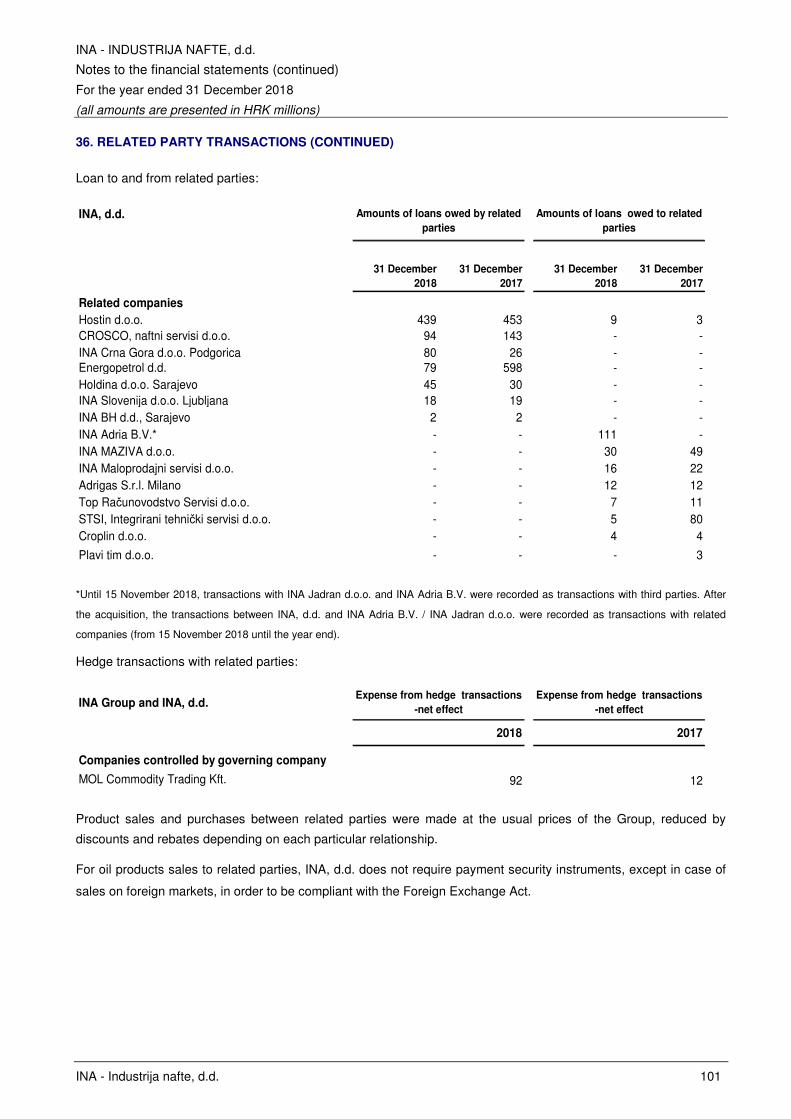
INA - INDUSTRIJA NAFTE, d.d.
Notes to the financial statements (continued)
For the year ended 31 December 2018
(all amounts are presented in HRK millions)
INA - Industrija nafte, d.d. 101
36. RELATED PARTY TRANSACTIONS (CONTINUED)
Loan to and from related parties:
INA, d.d.
31 December
2018
31 December
2017
31 December
2018
31 December
2017
Related companies
Hostin d.o.o. 439 453 9 3CROSCO, naftni servisi d.o.o. 94 143 - -INA Crna Gora d.o.o. Podgorica 80 26 - -Energopetrol d.d. 79 598 - -Holdina d.o.o. Sarajevo 45 30 - -INA Slovenija d.o.o. Ljubljana 18 19 - -INA BH d.d., Sarajevo 2 2 - -INA Adria B.V.* - - 111 -INA MAZIVA d.o.o. - - 30 49INA Maloprodajni servisi d.o.o. - - 16 22Adrigas S.r.l. Milano - - 12 12Top Računovodstvo Servisi d.o.o. - - 7 11STSI, Integrirani tehnički servisi d.o.o. - - 5 80Croplin d.o.o. - - 4 4
Plavi tim d.o.o. - - - 3
Amounts of loans owed by related
parties
Amounts of loans owed to related
parties
*Until 15 November 2018, transactions with INA Jadran d.o.o. and INA Adria B.V. were recorded as transactions with third parties. After
the acquisition, the transactions between INA, d.d. and INA Adria B.V. / INA Jadran d.o.o. were recorded as transactions with related
companies (from 15 November 2018 until the year end).
Hedge transactions with related parties:
INA Group and INA, d.d.
2018 2017
Companies controlled by governing company
MOL Commodity Trading Kft. 92 12
Expense from hedge transactions
-net effect
Expense from hedge transactions
-net effect
Product sales and purchases between related parties were made at the usual prices of the Group, reduced by
discounts and rebates depending on each particular relationship.
For oil products sales to related parties, INA, d.d. does not require payment security instruments, except in case of
sales on foreign markets, in order to be compliant with the Foreign Exchange Act.
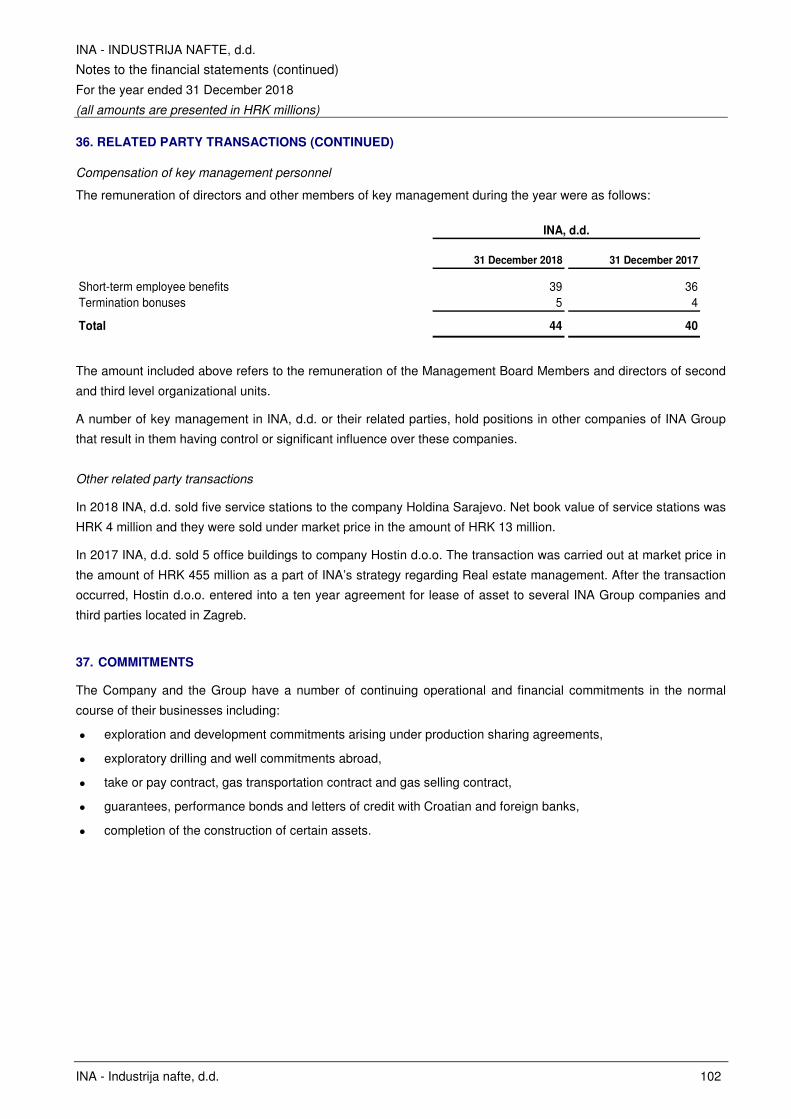
INA - INDUSTRIJA NAFTE, d.d.
Notes to the financial statements (continued)
For the year ended 31 December 2018
(all amounts are presented in HRK millions)
INA - Industrija nafte, d.d. 102
36. RELATED PARTY TRANSACTIONS (CONTINUED)
Compensation of key management personnel
The remuneration of directors and other members of key management during the year were as follows:
31 December 2018 31 December 2017
Short-term employee benefits 39 36Termination bonuses 5 4
Total 44 40
INA, d.d.
The amount included above refers to the remuneration of the Management Board Members and directors of second
and third level organizational units.
A number of key management in INA, d.d. or their related parties, hold positions in other companies of INA Group
that result in them having control or significant influence over these companies.
Other related party transactions
In 2018 INA, d.d. sold five service stations to the company Holdina Sarajevo. Net book value of service stations was
HRK 4 million and they were sold under market price in the amount of HRK 13 million.
In 2017 INA, d.d. sold 5 office buildings to company Hostin d.o.o. The transaction was carried out at market price in
the amount of HRK 455 million as a part of INA’s strategy regarding Real estate management. After the transaction
occurred, Hostin d.o.o. entered into a ten year agreement for lease of asset to several INA Group companies and
third parties located in Zagreb.
37. COMMITMENTS
The Company and the Group have a number of continuing operational and financial commitments in the normal
course of their businesses including:
� exploration and development commitments arising under production sharing agreements,
� exploratory drilling and well commitments abroad,
� take or pay contract, gas transportation contract and gas selling contract,
� guarantees, performance bonds and letters of credit with Croatian and foreign banks,
� completion of the construction of certain assets.
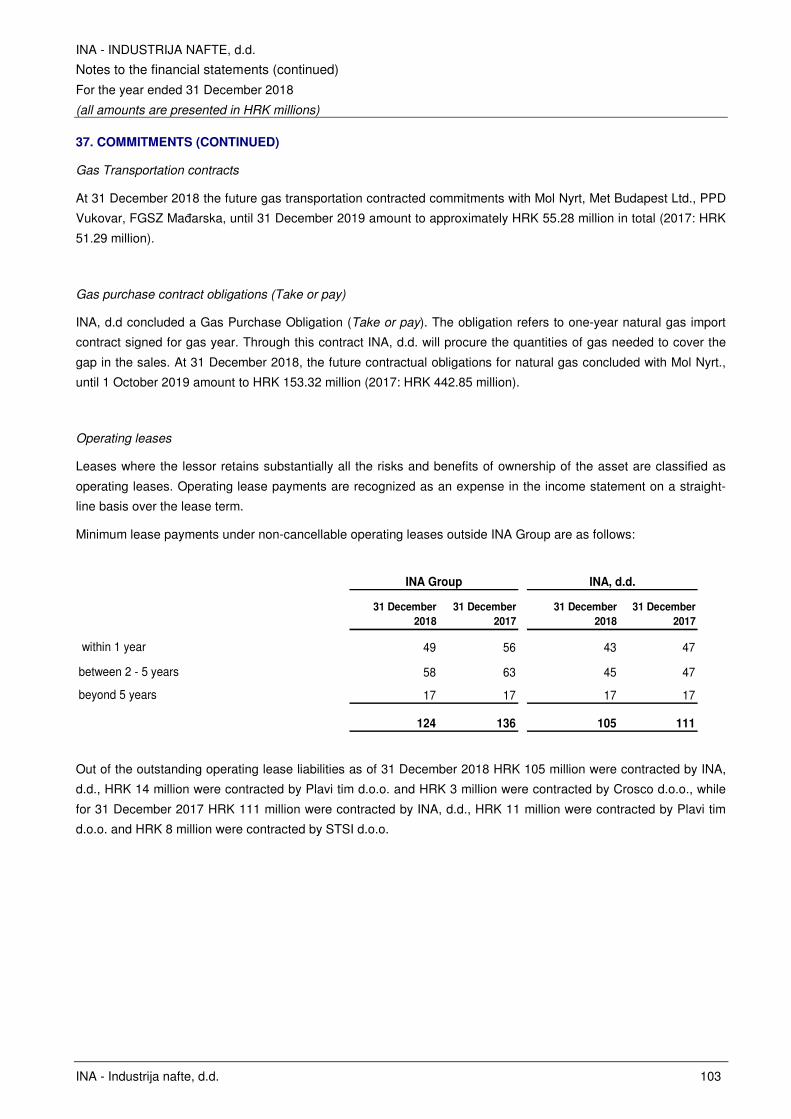
INA - INDUSTRIJA NAFTE, d.d.
Notes to the financial statements (continued)
For the year ended 31 December 2018
(all amounts are presented in HRK millions)
INA - Industrija nafte, d.d. 103
37. COMMITMENTS (CONTINUED)
Gas Transportation contracts
At 31 December 2018 the future gas transportation contracted commitments with Mol Nyrt, Met Budapest Ltd., PPD
Vukovar, FGSZ Mađarska, until 31 December 2019 amount to approximately HRK 55.28 million in total (2017: HRK
51.29 million).
Gas purchase contract obligations (Take or pay)
INA, d.d concluded a Gas Purchase Obligation (Take or pay). The obligation refers to one-year natural gas import
contract signed for gas year. Through this contract INA, d.d. will procure the quantities of gas needed to cover the
gap in the sales. At 31 December 2018, the future contractual obligations for natural gas concluded with Mol Nyrt.,
until 1 October 2019 amount to HRK 153.32 million (2017: HRK 442.85 million).
Operating leases
Leases where the lessor retains substantially all the risks and benefits of ownership of the asset are classified as
operating leases. Operating lease payments are recognized as an expense in the income statement on a straight-
line basis over the lease term.
Minimum lease payments under non-cancellable operating leases outside INA Group are as follows:
31 December
2018
31 December
2017
31 December
2018
31 December
2017
within 1 year 49 56 43 47
between 2 - 5 years 58 63 45 47
beyond 5 years 17 17 17 17
124 136 105 111
INA, d.d.INA Group
Out of the outstanding operating lease liabilities as of 31 December 2018 HRK 105 million were contracted by INA,
d.d., HRK 14 million were contracted by Plavi tim d.o.o. and HRK 3 million were contracted by Crosco d.o.o., while
for 31 December 2017 HRK 111 million were contracted by INA, d.d., HRK 11 million were contracted by Plavi tim
d.o.o. and HRK 8 million were contracted by STSI d.o.o.
INA - INDUSTRIJA NAFTE, d.d.
Notes to the financial statements (continued)
For the year ended 31 December 2018
(all amounts are presented in HRK millions)
INA - Industrija nafte, d.d. 104
38. CONTINGENT LIABILITIES
Environmental matters
The principal activities of the Company and the Group, comprising oil and gas exploration, production,
transportation, refining and distribution, can have inherent effects on the environment in terms of emissions into soil,
water and air. Both, the Company and the Group regularly record, monitor and report on environmental emissions in
accordance with their obligations specified in applicable laws. For all the stated release into the environment, the
Company and the Group, in accordance with the principle of "polluter pays" bear the costs caused by pollution. The
costs include costs connected with environmental pollution, costs of environmental monitoring and the application of
established measures and costs of taking measures to prevent environmental pollution, regardless of whether these
costs are incurred as a result of the prescribed liability for environmental pollution, the release of emissions into the
environment, as a fee established under appropriate financial instruments or as an obligation prescribed by
regulation.
INA Group regularly publishes its sustainability reports on annual basis, in accordance with Guidelines of the Global
Reporting initiative. The report covers a full range of economic, environmental and social impacts of INA Group
companies on their stakeholders.
Harmonization of INA's operations with the Industrial Emission Directive (IED)
The Directive 2010/75/EU of the European Parliament and the Council on industrial emissions (IED) lays down rules
on integrated prevention and control of pollution arising from industrial activities, rules designed to prevent or, where
that is not practicable, to reduce emissions into air, water and land and to prevent the generation of waste, in order
to achieve a high level of protection of the environment taken as a whole. The Directive regulates the question of
environmental permits by which plant working conditions are determined and requires the application of best
available techniques (BAT). During 2014 INA, d.d. obtained Decisions on integrated environmental protection
requirements (environmental permits) for its four plants: Fractionation Facilities Ivanić Grad, Gas Processing
Facilities Molve, Sisak Refinery and Rijeka Refinery.
On 9 October 2014, Commission Implementing Decision establishing best available techniques (BAT) for the
refining of mineral oil and gas was published, in accordance with the Directive 2010/75/EU of the European
Parliament and the Council on industrial emissions. Deadline for compliance with emission limit values was 9
October 2018 except in case of derogation acceptance in line with Article 15(4) of IED. In BAT Conclusions, "bubble
concept” is recognized as one of the best available techniques for integrated emission management of SOx and/or
NOx. Bubble is especially suitable for oil refining sites because it allows refineries to treat all their stacks as they are
enclosed by a giant bubble, which provides flexibility in choosing which unit shall be upgraded based on the lowest
cost, so long as overall resulting emissions are equal to or lower than emissions that would be achieved through a
unit-by-unit application of the individual BAT-AELs. Due to lack of experience in application of the bubble concept in
Croatia, Sustainable Development and Health, Safety and Environment organized meetings in Rijeka Refinery (RR)
and Sisak Refinery (SR) during 2018 with representatives of the Ministry of Environmental Protection and Energy
(Ministry) and authorized the Company for permit revision to inform them in more detail with the bubble concept and
method of alignment with the upper limits of the emission range.
During 2016 INA, d.d. signed the contract for refineries environmental permit revision which is necessary because of
new BAT Conclusions issuance, change of selected technology (FCC) for particulate matter reduction, expired
deadlines for some projects and intention to use a bubble concept. In 2017, an application for an amendment to the
RR and SR environmental permit was submitted to the Ministry of Environmental Protection and Energy.
INA - INDUSTRIJA NAFTE, d.d.
Notes to the financial statements (continued)
For the year ended 31 December 2018
(all amounts are presented in HRK millions)
INA - Industrija nafte, d.d. 105
38. CONTINGENT LIABILITIES (CONTINUED)
Environmental matters (continued)
In order to align the existing technology with the best available techniques, during 2018 all projects in Rijeka
Refinery (RR) are ongoing and are in different stages of implementation. Planed completion of all measures
prescribed in existing RR environmental permit is during turnaround, in Q1 2019.
For some of the improvement measures prescribed in existing SR environmental permit, which are on hold, a cost-
benefit analysis (investments vs benefits for environment) has been made in accordance with Article 15 (4) of the
IED.
It was suggested to the Ministry that the implementation of measures will depend on the results of the analysis,
which will show the justification of the application of each individual measure.
Complete (8 phases) baseline reports for Rijeka and Sisak Refineries were also submitted to the authorities for
approval, as a precondition for initiating environmental permit revision. Completion of baseline reports is not a
precondition for issuing a new environmental permit. During 2018, the Ministry concluded that the baseline reports
need to be updated in a way to be developed in phases, which was further contracted during 2018.
Harmonization of INA's operations with the greenhouse gas emission (GHG) legislation
European Union Emissions Trading Scheme, EU ETS, is one of the fundamental mechanisms of the European
Union in the fight against climate change with a view to meeting the commitments made under the Kyoto Protocol.
Inside the Scheme, a part of the emission allowances (one allowance = 1 tonne of CO2) are allocated to installations
for free and they are used to "cover" the emissions from the previous year. If the installation has a shortage of
allowances in respect to verified emissions, the rest must be bought on the market through auctioning.
From 2013 Rijeka Refinery, Sisak Refinery, Fractionation Facilities Ivanić Grad and Gas Processing Facilities Molve
are a part of the ETS. All four INA's ETS installations have open Operator Holding Account in the Union Registry.
Verified Annual Greenhouse Gas Report had been submitted to Croatian Environment and Nature Agency on time,
until 1 March 2018. Verifier has confirmed the emissions entered into the Registry and emission allowances have
been submitted in the amount equal to verified emissions until 30 April 2018. Due to increase in prices of emission
allowances (increase more than 100% compared to 2017) significantly higher costs were realized in 2018. In order
to reduce costs, dynamics of CO2 trading has changed. Instead of the current trading (purchase of 10% of the total
shortage each month after 20th in the month), an active trading option will be implemented (purchase of 20% of the
total shortage through multiple transactions per month with the aim of achieving the best market price).
INA - INDUSTRIJA NAFTE, d.d.
Notes to the financial statements (continued)
For the year ended 31 December 2018
(all amounts are presented in HRK millions)
INA - Industrija nafte, d.d. 106
38. CONTINGENT LIABILITIES (CONTINUED)
Environmental matters (continued)
Harmonization of INA's operations with the air protection legislation
From 1 January 2016 existing plants have to comply with more stringent emission limit values (ELV), as stipulated
by Industrial Emissions Directive (IED). The provisions of IED have been transposed into Croatian legislation
through Regulation on limit values for pollutant emissions from stationary sources into the air (OG 87/17). To
achieve the prescribed emission limit values, IED provides a possibility to use the exemption for existing plants and
one of them is the inclusion in the Transitional National Plan (TNP), in addition to meeting certain conditions. Sisak
and Rijeka Refineries have submitted an application for inclusion of its existing large combustion plants in the TNP,
which was approved by the European Commission during 2014.
By inclusion in the TNP, refineries are given the possibility of gradual emission reduction of nitrogen oxides, sulphur
dioxide and particulate matter through the period of 1 January 2016 to 30 June 2020 for the realization of
investments and measures for emission reduction which ensure compliance with more stringent ELVs. Given that
refineries intend to use the bubble concept in which existing large combustion plants should be included, these
plants will be withdrawn from the Transitional National Plan during the environmental permit revision and
incorporated into the bubble.
With the legal requirements for harmonization with the technical environmental standards for Volatile Organic
Compound (VOC) emissions resulting from the storage and distribution of petrol, the entire INA's retail network tank
truck loading station and rail tank car (RTC) loading station for white products in Sisak Refinery as well as tank truck
loading station in RR have been harmonized. In 2018 INA, d.d. continued with modernization of the RTC loading
and unloading station in RR, modernization of port Bakar and with improvement of storage tanks in both refineries,
in order to achieve full compliance with the technical environmental standards for VOC’s. Vapour Recovery Units
(VRU) were installed on 7 loading stations.
Environmental provisions
Environmental obligations are the obligations of a company to recover pollutions caused by the company's
operations. They can be divided into two categories: environmental provisions and contingencies. Typical provision
based actions are soil and groundwater pollution assessment, remediation, monitoring actions in order to control the
long-term compliance and re-cultivation of old waste storage depots. Provision based environmental liabilities are
audited in every quarter using internal resources. During 2018, 2 capital reconstruction, 4 tank replacement, 2
demolition and 14 preliminary site investigation related to soil and groundwater contamination were conducted at
retail fuel stations. Also, landfill Šoići remediation within Rijeka Refinery area was completed.
At 31 December 2018, INA, d.d. made environmental provisions in the amount of HRK 408 million, whereas the
provisions at the Group level amounted to HRK 412 million, while at 31 December 2017, INA, d.d. made
environmental provisions in the amount of HRK 323 million, whereas the provisions at the Group level amounted to
HRK 335 million. At 31 December 2018, contingencies at INA, d.d. was estimated at HRK 411 million and for INA
Group level was estimated at HRK 620 million, while at 31 December 2017 contingencies at INA, d.d. was estimated
at HRK 427 million and for INA Group level was estimated at HRK 636 million. The estimates were not recognised
because the timing of the event is uncertain and there is no evidence of pollution.
INA - INDUSTRIJA NAFTE, d.d.
Notes to the financial statements (continued)
For the year ended 31 December 2018
(all amounts are presented in HRK millions)
INA - Industrija nafte, d.d. 107
38. CONTINGENT LIABILITIES (CONTINUED)
Litigation
The Group is exposed to various legal claims. The following claims are considered as contingencies and no
provision is recognised in the financial statements in their respect.
GWDF
In the dispute initiated by GWDF Partnership Gesellschaft Bürgerlicher Rechts and GWDF Limited, Cyprus against
INA-Industrija nafte, d.d. and INA-Naftaplin International Exploration, Channel Islands, before the Commercial Court
in Zagreb, the plaintiffs claim compensation for damage in the amount of app HRK 60 million incurred due to
ungrounded termination of negotiations. On 10 March 2016 the judgment was rendered and the plaintiff’s claim was
dismissed in its entirety. On 18 March 2016 the plaintiff filed an appeal against the judgment of the court of first
instance. In its judgment rendered on 7 November 2018, the High Commercial Court of the Republic of Croatia
rejected the plaintiff’s appeal and confirmed the judgement of the court of first instance. Therefore, the proceedings
are concluded with a judgment that is final and binding. To this day, no revision against the judgment of the High
Commercial Court of the Republic of Croatia has been received.
EKO MEDIA d.o.o.
In September 2012 INA, d.d. entered into an agreement with company EKO MEDIA d.o.o. EKO MEDIA failed to
regularly comply with its obligations. INA, d.d. terminated the agreement with EKO MEDIA d.o.o. at the beginning of
2014. On 19 December 2014 EKO MEDIA d.o.o. filed a lawsuit against INA, d.d. in which EKO MEDIA d.o.o.
specified its claim in amount of HRK 106 million. INA, d.d. filed its official reply to such EKO MEDIA’s lawsuit and
filed a counterclaim for the return of unjust enrichment and asked for the issuance of interim measure for prohibition
of use of advertising boards. The first instance procedure is in progress and the court expert for finances delivered
his opinion in which he determined the amount of the claim towards EKO MEDIA in the moment of termination of the
contract. Due to the departure of a retired judge, the case will be transferred to another judge, following why the next
hearing has not been scheduled and no further dynamic of the proceedings is known.
ĐURO ĐAKOVIĆ
ĐURO ĐAKOVIĆ - ZAVARENE POSUDE d.d. (hereinafter: ĐĐ) submitted a claim against INA, d.d. for damages
based on statement that INA acted contrary to principles of good faith while executing its obligations under signed
Gas bottles SPA, i.e. deliberately prevented the realization of the conditions for increased order of bottles thus
causing the overall damage to the plaintiff amounted to around HRK 29 million. This contract was tied to Settlement
Agreement signed on the same date between INA, d.d. OSIMPEX (ĐĐ’s mother company), FEROIMPEX (ĐĐ’s
daughter company) and ĐĐ by which it was agreed that ĐĐ will join the debt OSIMPEX and FEROIMPEX have
towards INA, d.d. (based on cession between INA OSIJEK PETROL whose buyers were aforementioned companies
and INA, d.d.) and that such debt will be set off with gas bottles purchases under Gas bottles SPA under certain
conditions; first 20,000 bottles are not to be taken into account, yet all further orders should be set off with debt. ĐĐ
is claiming that INA, d.d. deliberately prevented the occurrence of conditions for such subsequent orders, in spite
the fact that from previously established business cooperation with PROPLIN (INA’s former daughter company,
merged with INA, d.d. in 2011 year) it could be reasonably expected that such subsequent order should take place.
INA, d.d. prepared and submitted a statement of defence.
INA - INDUSTRIJA NAFTE, d.d.
Notes to the financial statements (continued)
For the year ended 31 December 2018
(all amounts are presented in HRK millions)
INA - Industrija nafte, d.d. 108
38. CONTINGENT LIABILITIES (CONTINUED)
Litigation (continued)
ĐURO ĐAKOVIĆ (continued)
The preparatory hearing was held on 26 February 2018. On this hearing the court concluded the preliminary part of
the proceedings. The main hearing was held on 8 November 2018 and the plaintiff’s first two witnesses have been
heard. The next hearing should continue with the hearing of the witnesses proposed by the plaintiff, while the
hearing date has not yet been set.
LJUBLJANSKA BANKA
The claims of plaintiff Ljubljanska banka, Ljubljana, Slovenia against INA, d.d. in amount of HRK 60 million have
arisen from two contracts of 1982 on the use of short-term foreign currency loan abroad which were concluded
between INA, d.d. - Rafinerija nafte Rijeka and Ljubljanska banka - Osnovna banka Zagreb. The outcome of the
procedure is still uncertain due to the complexity of the legal matter (claims for altered default interest). The
Supreme Court has not decided on review to this date, so no legal actions were taken in 2018.
CONCESSIONS
In the period from November 2014 - February 2015, the Ministry of Economy, Labour and Entrepreneurship
(hereinafter: the Ministry) rendered three Decisions depriving INA of the license to explore hydrocarbons in
exploration areas “Sava”, “Drava” and “North-West Croatia”.
INA, d.d. filed administrative lawsuits against all said Ministry’s Decisions.
In the “Drava” case, during September 2017 the High Administrative Court of the Republic of Croatia rejected INA's
appeal against the first-instance verdict in the “Drava” case. Thus, the Decision on seizure of hydrocarbon
exploration approvals in the "Drava" research area, issued by the competent Ministry, became final. Against said
judgment of the High Administrative Court of the Republic of Croatia, and Ministry Decision, INA, d.d. filed a
Constitutional lawsuit. The Constitutional Court of the Republic of Croatia didn’t bring any judgment, till now.
In the “Sava” case, during July 2018 the High Administrative Court of the Republic of Croatia accepted INA’s appeal
against earlier first-instance verdict in the “Sava” case and annulled the same verdict brought by the Administrative
Court and also annulled Resolution of the Ministry by which the Ministry deprived INA’s license for exploration
hydrocarbons in exploration area “Sava”. In September 2018 the Ministry of Environmental Protection and
Energetics (as now competent) adopted new Decision by which INA, d.d. is again, for the third time, deprived from
the license to explore hydrocarbons in exploration area “Sava”. The administrative lawsuit against said Ministry
Decision is underway.
In the “North-West Croatia” case, the Administrative Court rejected INA’s administrative lawsuit, against which
judgment INA, d.d. filled appeal. Until now, the High Administrative Court of the Republic of Croatia didn’t bring any
decision and judgment.
INA - INDUSTRIJA NAFTE, d.d.
Notes to the financial statements (continued)
For the year ended 31 December 2018
(all amounts are presented in HRK millions)
INA - Industrija nafte, d.d. 109
38. CONTINGENT LIABILITIES (CONTINUED)
Litigation (continued)
R.I.G.-TEHNIČKI SERVISI GRUPA d.o.o. c/a CROSCO
R.I.G.-TEHNIČKI SERVISI GRUPA d.o.o. initiated lawsuit against CROSCO, naftni servisi, d.o.o. (member of the
INA Group, INA, d.d. is a 100% shareholder) over a value equaling HRK 82 million (approximately EUR 11 million)
with the interest running from 10 March 2010, for damages caused by non-payment of extra and unforeseen works
and, to a minor extent, for damages due to loss of computer equipment. It is still in preparation phase, the Court is
collecting valid data and each Party is proposing evidence and actions.
At the hearing held on 19 October 2017 a legally binding indictment versus the representatives/members of the
company R.I.G.-TEHNIČKI SERVISI GRUPA d.o.o. and the company R.I.G.-TEHNIČKI SERVISI GRUPA d.o.o.
itself was submitted into the court file. The Court invited parties to deliver additional documentation.
At the hearing held on 5 June 2018 Plaintiff submitted to the court file Expertise that were conducted in criminal
cases which were conducted in front of County Attorney’s Office and State Attorney's Office in Vukovar. On stated
Expertise Defendant shall lodge to the competent court its observations/manifestations. During November 2018,
hearings were held on which witnesses were examined.
BELVEDERE cases (CLEOSTONE claim included)
In 2005 INA, d.d. and Belvedere d.d. concluded the Loan agreement on notarial insurance of the claim by
establishing lien over the real estate of Belvedere d.d. for the purpose of ensuring loan repayment. Since the loan
was not repaid, INA, d.d. initiated the procedure of real estate sale, and the real estate was sold to company Vila
Larus d.o.o., whereby INA, d.d. collected HRK 24 million on behalf of principle amount and contractual interest rate.
Consequently, the plaintiff initiated the proceeding to proclaim the real estate sale and purchase agreement as null
and void, as well as the proceeding to cancel the enforceability clause on the Fiduciary Agreement.
The first instance proceeding for the annulment of the agreement on the sale and purchase of real estate has been
finalized in favour of INA, d.d. and upon an appeal filed by the plaintiff, the first instance decision became legally
binding after the High Commercial Court of the Republic of Croatia rejected the appeal and confirmed the judgment.
The proceeding for the cancellation of the enforceability clause has been finalized in the first instance in favour of
INA, d.d., and the decision of the higher court, after the submission of the plaintiff’s appeal, is still pending.
Belvedere – HRK 24 million, 018-11/17
The plaintiff has filed a claim with the Commercial Court in Zagreb, seeking reimbursement of funds received for the
sale of “Hotel Belvedere”, claiming that the sale of the real estate, encumbered by INA’s liens – fiduciary, is illegal.
The plaintiff alleges that INA, d.d. had no right to collect its claims by selling the real estate, because the plaintiff
was in crisis at the moment of loan placement, so the loan was actually a loan substituting the capital which is
settled in a bankruptcy proceeding as a lower payment priority claim. It is also stated that the notary public violated
other legal regulations. The response to the claim has been submitted, in which the plaintiff’s allegations have been
contested, i.e. that the loan was not actually a loan substituting the capital. Only the preparatory hearing was held in
this case and one hearing where one witness gave his testimony.
INA - INDUSTRIJA NAFTE, d.d.
Notes to the financial statements (continued)
For the year ended 31 December 2018
(all amounts are presented in HRK millions)
INA - Industrija nafte, d.d. 110
38. CONTINGENT LIABILITIES (CONTINUED)
Litigation (continued)
Belvedere – HRK 220 million, 018-14/17
The plaintiff has filed a claim with the Commercial Court in Zagreb, seeking reimbursement of damages, claiming
that INA, d.d. has caused damage to the plaintiff by selling its real estate encumbered by INA’s liens – fiduciary,
whereby the plaintiff was prevented from continuing its business operations.
The plaintiff claims that the damage is evident from the fact that the loan was actually a loan substituting the capital
which is settled in a bankruptcy proceeding as a lower payment priority claim. INA, d.d. submitted its response to the
lawsuit in which it contested all the plaintiff’s allegations, both in relation to the grounds and the amount and stated
that the collection of the concerned claims was in any case insured by a separate satisfaction right, granting the
creditor in bankruptcy the right to a separate settlement.
Labour procedure against Energopetrol d.d.
At Municipal Court in Sarajevo the labour procedure against Energopetrol d.d. is conducted with 381 plaintiffs. The
total amount of principal amounts to HRK 58 million. The lawsuit was filed on 11 May 2018 with a claim to
compensation of salary difference for the period 11 May 2015 until 11 May 2018.
The Group expects the plaintiff's attorney to specify the claims in the course of the procedure, in accordance with
the findings of the expert in the financial profession.
In the meantime, and since the plaintiffs' attorney did not regulate the claim referred to the lawsuit, at the court's
request, the court issued the Decision on 4 December 2018, by which the one part of claim from the lawsuit is
considered withdrawn.
The response to the complaint was given on 7 January 2019. The preparatory hearing is expected to be scheduled.
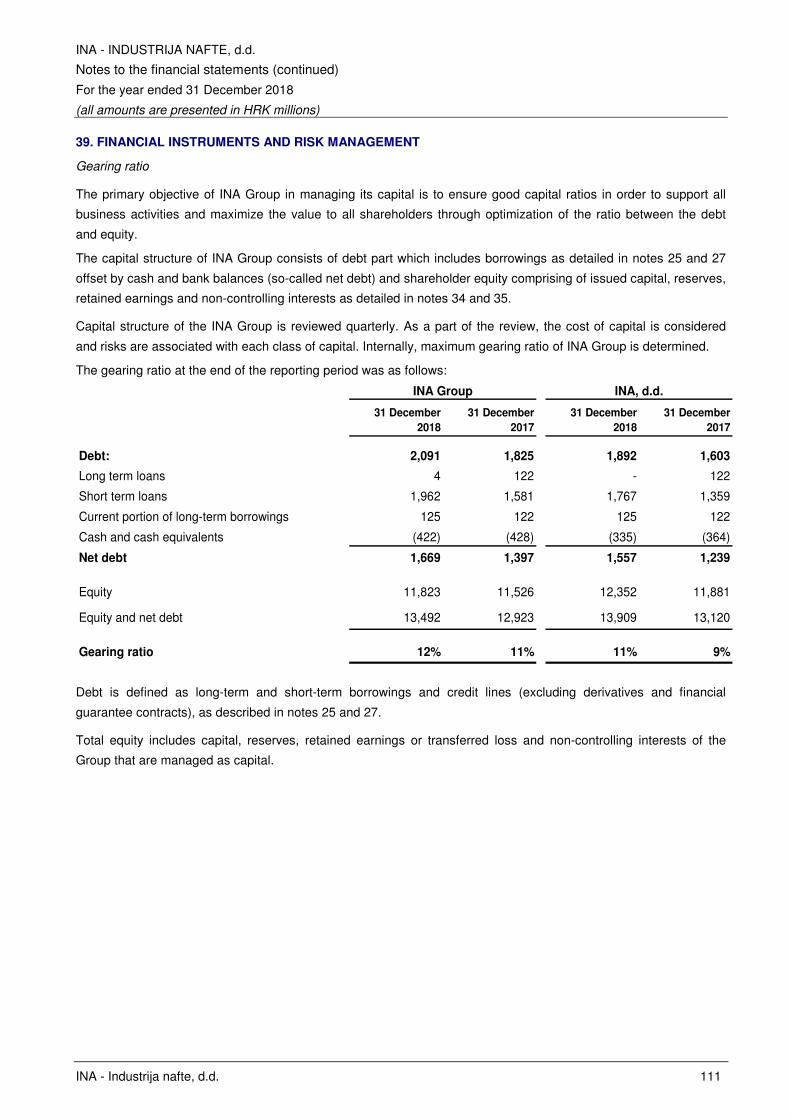
INA - INDUSTRIJA NAFTE, d.d.
Notes to the financial statements (continued)
For the year ended 31 December 2018
(all amounts are presented in HRK millions)
INA - Industrija nafte, d.d. 111
39. FINANCIAL INSTRUMENTS AND RISK MANAGEMENT
Gearing ratio
The primary objective of INA Group in managing its capital is to ensure good capital ratios in order to support all
business activities and maximize the value to all shareholders through optimization of the ratio between the debt
and equity.
The capital structure of INA Group consists of debt part which includes borrowings as detailed in notes 25 and 27
offset by cash and bank balances (so-called net debt) and shareholder equity comprising of issued capital, reserves,
retained earnings and non-controlling interests as detailed in notes 34 and 35.
Capital structure of the INA Group is reviewed quarterly. As a part of the review, the cost of capital is considered
and risks are associated with each class of capital. Internally, maximum gearing ratio of INA Group is determined.
The gearing ratio at the end of the reporting period was as follows:
31 December
2018
31 December
2017
31 December
2018
31 December
2017
Debt: 2,091 1,825 1,892 1,603
Long term loans 4 122 - 122
Short term loans 1,962 1,581 1,767 1,359
Current portion of long-term borrowings 125 122 125 122
Cash and cash equivalents (422) (428) (335) (364)
Net debt 1,669 1,397 1,557 1,239
Equity 11,823 11,526 12,352 11,881
Equity and net debt 13,492 12,923 13,909 13,120
Gearing ratio 12% 11% 11% 9%
INA Group INA, d.d.
Debt is defined as long-term and short-term borrowings and credit lines (excluding derivatives and financial
guarantee contracts), as described in notes 25 and 27.
Total equity includes capital, reserves, retained earnings or transferred loss and non-controlling interests of the
Group that are managed as capital.
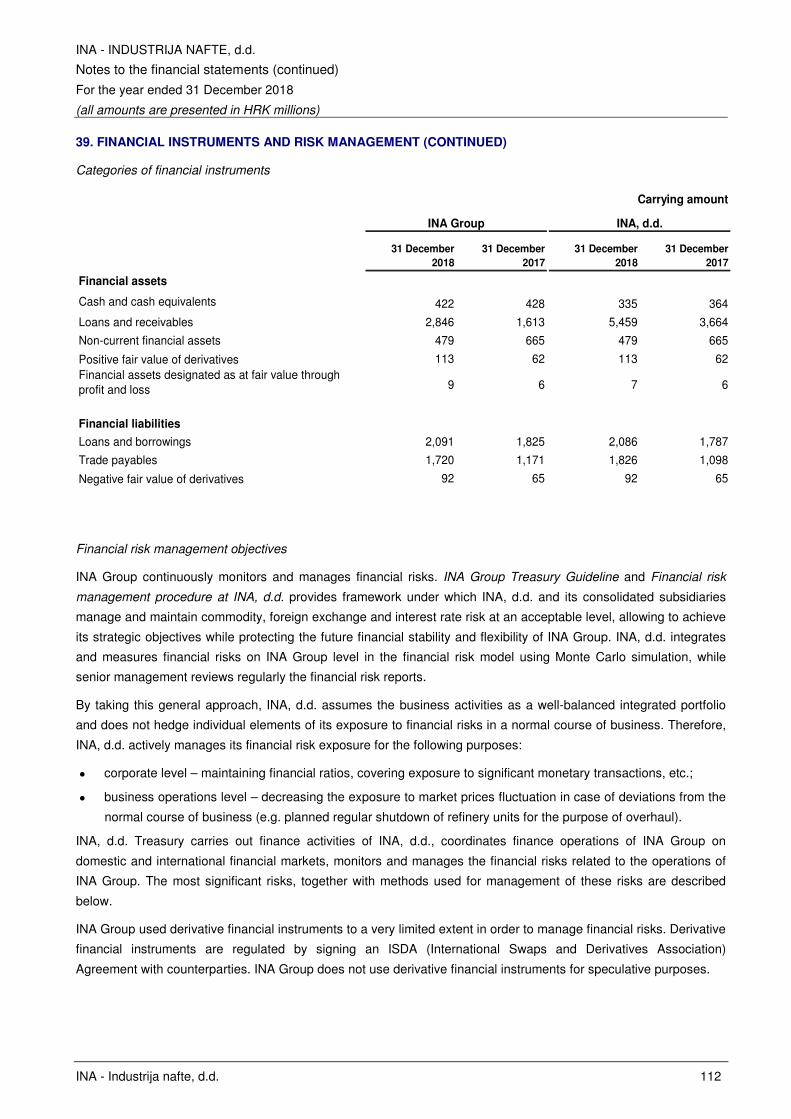
INA - INDUSTRIJA NAFTE, d.d.
Notes to the financial statements (continued)
For the year ended 31 December 2018
(all amounts are presented in HRK millions)
INA - Industrija nafte, d.d. 112
39. FINANCIAL INSTRUMENTS AND RISK MANAGEMENT (CONTINUED)
Categories of financial instruments
31 December
2018
31 December
2017
31 December
2018
31 December
2017
Financial assets
Cash and cash equivalents 422 428 335 364
Loans and receivables 2,846 1,613 5,459 3,664
Non-current financial assets 479 665 479 665
Positive fair value of derivatives 113 62 113 62 Financial assets designated as at fair value through profit and loss 9 6 7 6
Financial liabilities
Loans and borrowings 2,091 1,825 2,086 1,787
Trade payables 1,720 1,171 1,826 1,098
Negative fair value of derivatives 92 65 92 65
INA Group INA, d.d.
Carrying amount
Financial risk management objectives
INA Group continuously monitors and manages financial risks. INA Group Treasury Guideline and Financial risk
management procedure at INA, d.d. provides framework under which INA, d.d. and its consolidated subsidiaries
manage and maintain commodity, foreign exchange and interest rate risk at an acceptable level, allowing to achieve
its strategic objectives while protecting the future financial stability and flexibility of INA Group. INA, d.d. integrates
and measures financial risks on INA Group level in the financial risk model using Monte Carlo simulation, while
senior management reviews regularly the financial risk reports.
By taking this general approach, INA, d.d. assumes the business activities as a well-balanced integrated portfolio
and does not hedge individual elements of its exposure to financial risks in a normal course of business. Therefore,
INA, d.d. actively manages its financial risk exposure for the following purposes:
� corporate level – maintaining financial ratios, covering exposure to significant monetary transactions, etc.;
� business operations level – decreasing the exposure to market prices fluctuation in case of deviations from the
normal course of business (e.g. planned regular shutdown of refinery units for the purpose of overhaul).
INA, d.d. Treasury carries out finance activities of INA, d.d., coordinates finance operations of INA Group on
domestic and international financial markets, monitors and manages the financial risks related to the operations of
INA Group. The most significant risks, together with methods used for management of these risks are described
below.
INA Group used derivative financial instruments to a very limited extent in order to manage financial risks. Derivative
financial instruments are regulated by signing an ISDA (International Swaps and Derivatives Association)
Agreement with counterparties. INA Group does not use derivative financial instruments for speculative purposes.
INA - INDUSTRIJA NAFTE, d.d.
Notes to the financial statements (continued)
For the year ended 31 December 2018
(all amounts are presented in HRK millions)
INA - Industrija nafte, d.d. 113
39. FINANCIAL INSTRUMENTS AND RISK MANAGEMENT (CONTINUED)
Market risk
Commodity price risk management
The volatility of crude oil and gas prices is the prevailing element in the business environment of INA Group. INA Group
buys crude oil mostly through short-term arrangements in USD at the current spot market price. Necessary natural gas
quantities in 2018 INA Group imported in EUR based on spot price.
In addition to exploration and production, and refinery operations, one of the main core activities of INA, d.d. are marketing
and sale of refinery products and natural gas. Prices of crude products were determined weekly based on market
principles, which enables quicker responses to market prices fluctuations.
In accordance with INA Group Treasury Guideline and Financial risk management procedure at INA, d.d., for the
purpose of hedging financial risk exposure on corporate and business operations level, INA, d.d. may use forward (swap)
and option instruments. INA, d.d. entered into short-term forward swap transactions to hedge its exposure on changes in
inventory levels and changes in pricing periods. The transactions were initiated to reduce exposures to potential
fluctuations in prices over the period of decreasing inventories at the refineries, as well as to match the pricing period of
purchased crude oil and crude products with the crude oil processing and refinery product retail pricing periods.
At 31 December 2018 and 31 December 2017, there is no fair value based on hedged transaction related to the price of
the goods.
Foreign currency risk management
As INA Group operates both in Croatia and abroad, many of its transactions are denominated and executed in foreign
currencies, hence INA, d.d. is exposed to exchange rate risks.
INA Group has a net long USD and EUR, and a net short HRK operating cash flow position. Generally, INA Group
manages its currency risk using natural hedging, which is based on the principle that the combination of currencies in the
debt portfolio should reflect the currency position of INA Group's free cash flow. Furthermore, in order to avoid excessive
exposures to fluctuations in the foreign exchange rate with respect to a single currency (i.e. USD), INA, d.d. applies a
portfolio-based approach while selecting the currency mix for its debt portfolio.
INA, d.d. may use a cross-currency swap to adjust its currency mix in the debt portfolio. At 31 December 2018 and 31
December 2017 there were no outstanding cross-currency transactions.
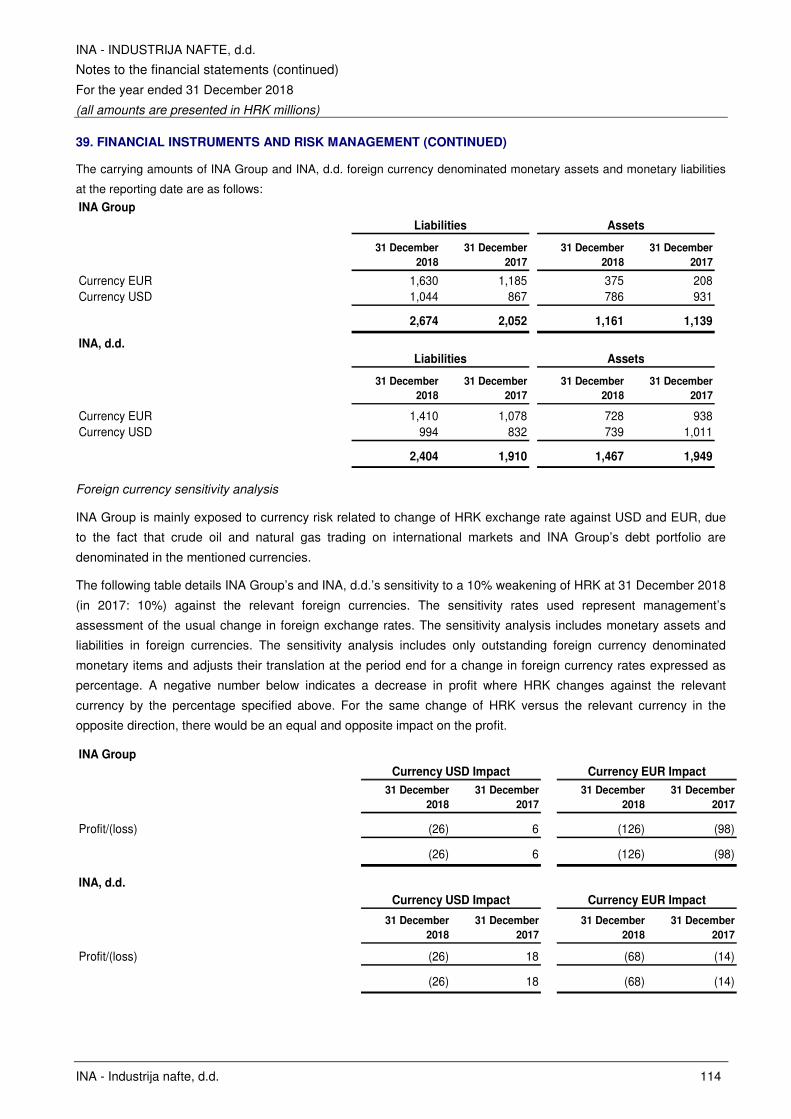
INA - INDUSTRIJA NAFTE, d.d.
Notes to the financial statements (continued)
For the year ended 31 December 2018
(all amounts are presented in HRK millions)
INA - Industrija nafte, d.d. 114
39. FINANCIAL INSTRUMENTS AND RISK MANAGEMENT (CONTINUED)
The carrying amounts of INA Group and INA, d.d. foreign currency denominated monetary assets and monetary liabilities
at the reporting date are as follows:
INA Group
31 December
2018
31 December
2017
31 December
2018
31 December
2017
Currency EUR 1,630 1,185 375 208Currency USD 1,044 867 786 931
2,674 2,052 1,161 1,139
INA, d.d.
31 December
2018
31 December
2017
31 December
2018
31 December
2017
Currency EUR 1,410 1,078 728 938Currency USD 994 832 739 1,011
2,404 1,910 1,467 1,949
Assets
Liabilities Assets
Liabilities
Foreign currency sensitivity analysis
INA Group is mainly exposed to currency risk related to change of HRK exchange rate against USD and EUR, due
to the fact that crude oil and natural gas trading on international markets and INA Group’s debt portfolio are
denominated in the mentioned currencies.
The following table details INA Group’s and INA, d.d.’s sensitivity to a 10% weakening of HRK at 31 December 2018
(in 2017: 10%) against the relevant foreign currencies. The sensitivity rates used represent management’s
assessment of the usual change in foreign exchange rates. The sensitivity analysis includes monetary assets and
liabilities in foreign currencies. The sensitivity analysis includes only outstanding foreign currency denominated
monetary items and adjusts their translation at the period end for a change in foreign currency rates expressed as
percentage. A negative number below indicates a decrease in profit where HRK changes against the relevant
currency by the percentage specified above. For the same change of HRK versus the relevant currency in the
opposite direction, there would be an equal and opposite impact on the profit.
INA Group
31 December
2018
31 December
2017
31 December
2018
31 December
2017
Profit/(loss) (26) 6 (126) (98)
(26) 6 (126) (98)
INA, d.d.
31 December
2018
31 December
2017
31 December
2018
31 December
2017
Profit/(loss) (26) 18 (68) (14)
(26) 18 (68) (14)
Currency EUR Impact
Currency USD Impact Currency EUR Impact
Currency USD Impact
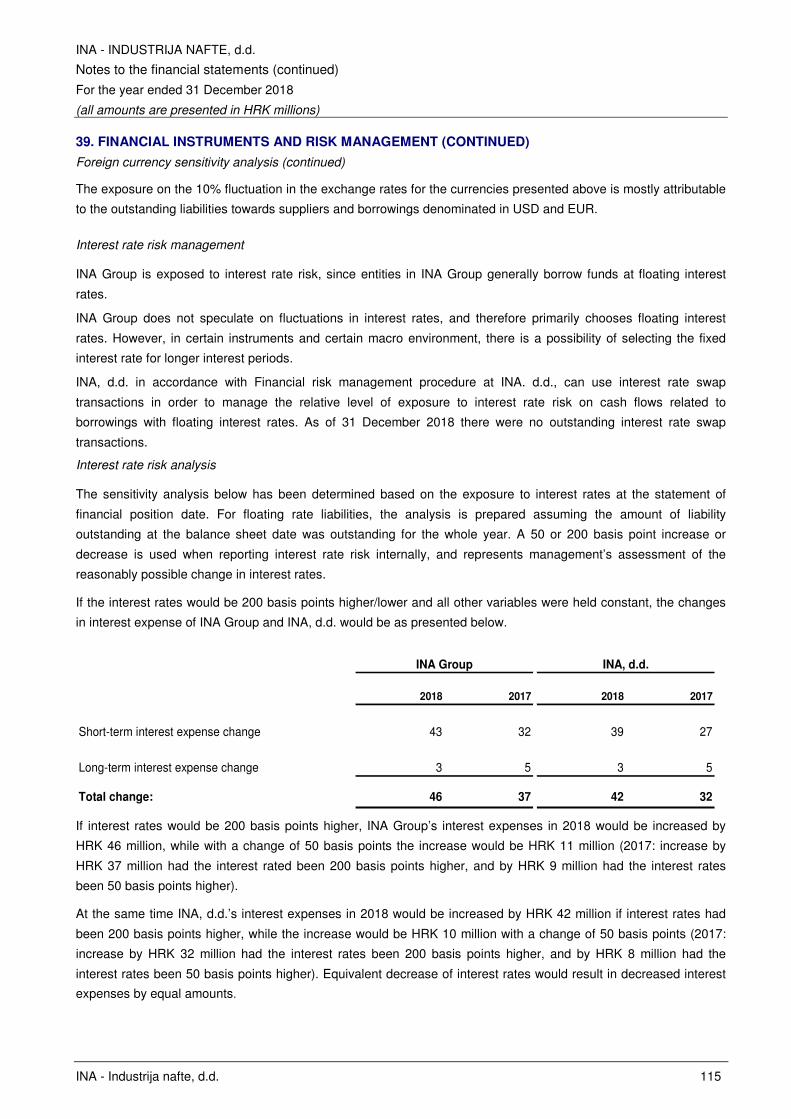
INA - INDUSTRIJA NAFTE, d.d.
Notes to the financial statements (continued)
For the year ended 31 December 2018
(all amounts are presented in HRK millions)
INA - Industrija nafte, d.d. 115
39. FINANCIAL INSTRUMENTS AND RISK MANAGEMENT (CONTINUED)
Foreign currency sensitivity analysis (continued)
The exposure on the 10% fluctuation in the exchange rates for the currencies presented above is mostly attributable
to the outstanding liabilities towards suppliers and borrowings denominated in USD and EUR.
Interest rate risk management
INA Group is exposed to interest rate risk, since entities in INA Group generally borrow funds at floating interest
rates.
INA Group does not speculate on fluctuations in interest rates, and therefore primarily chooses floating interest
rates. However, in certain instruments and certain macro environment, there is a possibility of selecting the fixed
interest rate for longer interest periods.
INA, d.d. in accordance with Financial risk management procedure at INA. d.d., can use interest rate swap
transactions in order to manage the relative level of exposure to interest rate risk on cash flows related to
borrowings with floating interest rates. As of 31 December 2018 there were no outstanding interest rate swap
transactions.
Interest rate risk analysis
The sensitivity analysis below has been determined based on the exposure to interest rates at the statement of
financial position date. For floating rate liabilities, the analysis is prepared assuming the amount of liability
outstanding at the balance sheet date was outstanding for the whole year. A 50 or 200 basis point increase or
decrease is used when reporting interest rate risk internally, and represents management’s assessment of the
reasonably possible change in interest rates.
If the interest rates would be 200 basis points higher/lower and all other variables were held constant, the changes
in interest expense of INA Group and INA, d.d. would be as presented below.
2018 2017 2018 2017
Short-term interest expense change 43 32 39 27
Long-term interest expense change 3 5 3 5
Total change: 46 37 42 32
INA Group INA, d.d.
If interest rates would be 200 basis points higher, INA Group’s interest expenses in 2018 would be increased by
HRK 46 million, while with a change of 50 basis points the increase would be HRK 11 million (2017: increase by
HRK 37 million had the interest rated been 200 basis points higher, and by HRK 9 million had the interest rates
been 50 basis points higher).
At the same time INA, d.d.’s interest expenses in 2018 would be increased by HRK 42 million if interest rates had
been 200 basis points higher, while the increase would be HRK 10 million with a change of 50 basis points (2017:
increase by HRK 32 million had the interest rates been 200 basis points higher, and by HRK 8 million had the
interest rates been 50 basis points higher). Equivalent decrease of interest rates would result in decreased interest
expenses by equal amounts.
INA - INDUSTRIJA NAFTE, d.d.
Notes to the financial statements (continued)
For the year ended 31 December 2018
(all amounts are presented in HRK millions)
INA - Industrija nafte, d.d. 116
39. FINANCIAL INSTRUMENTS AND RISK MANAGEMENT (CONTINUED)
Other price risks
INA Group is exposed to equity price risks arising from equity investments. Equity investments are held for strategic
rather than trading purposes.
Equity price sensitivity analysis
The sensitivity analyses below have been determined based on the exposure to equity price risks at the reporting date.
If equity prices had been 10% higher:
� net profit for the year ended at 31 December 2018 would have been unaffected as the equity investments are
classified as non-current financial assets; and
� other equity reserves of INA, d.d. would increase by HRK 43 million as a result of the changes in fair value of
non-current financial assets.
If equity prices had been 10% lower, there would be an equal and opposite impact on equity.
Credit risk management
Sales of products and services with deferred payment gives rise to credit risk, risk of default or non-performance of
contractual obligations by INA Group customers. Overdue receivables have an adverse effect on the liquidity of INA
Group, whereas impaired overdue receivables have a negative impact on the financial results of INA Group as well.
Under currently valid Customer Credit Management Procedure, measures are taken as a precaution against the risk
of default. Customers are classified into risk groups by reference to their financial indicators and the trading records
with INA Group, and appropriate measures to provide protection against credit risk are taken for each group. The
information used to classify the customers into risk groups is derived from the official financial statements and is
obtained from independent rating agencies. The exposure and the credit ratings of customers are continuously
monitored and credit exposure is controlled by credit limits that are reviewed at least on an annual basis. Whenever
possible, INA Group collects collaterals (payment security instruments) from customers in order to minimize risk of
collection of payments arising from contractual liabilities of customers.
The exposure of INA Group and the credit ratings of its customers are continuously monitored to mitigate the risk of
default (see note 21).
INA Group transacts with a large number of customers from various industries and of various size. A portion of
goods sold with deferred payment includes government institutions and customers owned by the state and local
self-governments that do not provide any payment security instruments. Regarding other customers, provided
collaterals are mainly debentures, being the most frequently used payment security instrument on the Croatian
market, and bank guarantees and insurance of receivables is used as well, whereas from foreign customers are
mostly obtained letters of credit, and to a lesser extent bank and corporate guarantees and exceptionally bills of
exchange.
There is no significant credit risk exposure of INA Group that is not covered with collateral, other than those to the
above-mentioned institutions and entities controlled by the state, local self-government, and those arising from
certain foreign concession agreements.
INA - INDUSTRIJA NAFTE, d.d.
Notes to the financial statements (continued)
For the year ended 31 December 2018
(all amounts are presented in HRK millions)
INA - Industrija nafte, d.d. 117
39. FINANCIAL INSTRUMENTS AND RISK MANAGEMENT (CONTINUED)
Liquidity risk management
Responsibility for liquidity risk management rests with the Management Board, which has built an appropriate
liquidity risk management framework for the management of INA Group’s short, medium and long-term funding and
liquidity management requirements. INA Group manages liquidity risk by maintaining adequate reserves and credit
facilities, by continuously monitoring of forecasted and actual cash flows and due dates of account receivables and
payables.
The policy of INA Group is to ensure sufficient external funding sources in order to achieve the sufficient level of
available frame credit lines ensuring the liquidity of INA Group as well as investment needs.
As of 31 December 2018, INA Group had contracted and available short-term credit lines amounting to HRK 2,332
million (CNB middle rate), excluding overdrafts and trade financing credit lines established with the purpose to
finance the purchase of crude oil and oil products, and contracted and available long-term credit lines amounting to
HRK 2,713 million (CNB middle rate).
Based on business needs and industry practice, INA, d.d. has contracted short-term credit facilities (’trade finance’’)
with first class banking groups for financing crude oil and oil products purchase. As of 31 December 2018, INA
Group had contracted and available short-term credit facilities for financing crude oil and oil products purchase
amounting to USD 1,135 million.
For details of the main external sources of funding for INA Group see note 25 and 27.
With the purpose of diversification of funding sources and in order to ensure sufficient liquidity and financial stability
level, INA, d.d. is continuously considering different funding opportunities with other creditors as well.
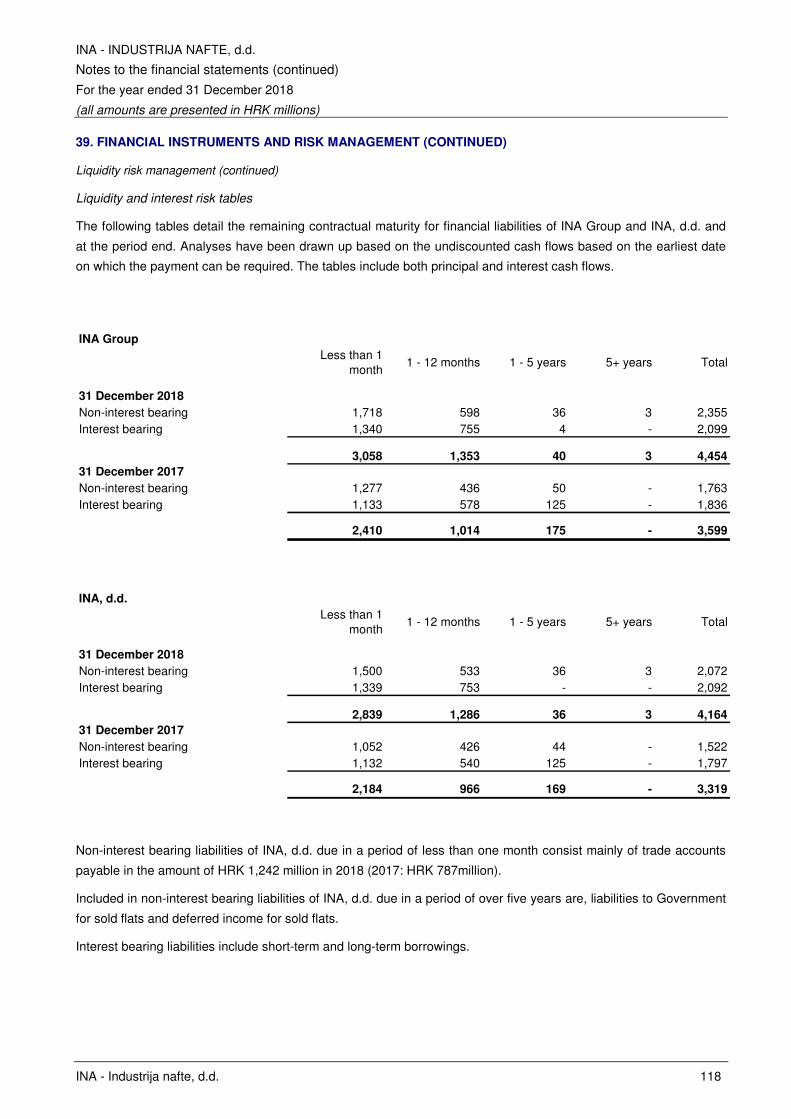
INA - INDUSTRIJA NAFTE, d.d.
Notes to the financial statements (continued)
For the year ended 31 December 2018
(all amounts are presented in HRK millions)
INA - Industrija nafte, d.d. 118
39. FINANCIAL INSTRUMENTS AND RISK MANAGEMENT (CONTINUED)
Liquidity risk management (continued)
Liquidity and interest risk tables
The following tables detail the remaining contractual maturity for financial liabilities of INA Group and INA, d.d. and
at the period end. Analyses have been drawn up based on the undiscounted cash flows based on the earliest date
on which the payment can be required. The tables include both principal and interest cash flows.
INA Group
Less than 1 month
1 - 12 months 1 - 5 years 5+ years Total
31 December 2018
Non-interest bearing 1,718 598 36 3 2,355Interest bearing 1,340 755 4 - 2,099
3,058 1,353 40 3 4,454
31 December 2017
Non-interest bearing 1,277 436 50 - 1,763Interest bearing 1,133 578 125 - 1,836
2,410 1,014 175 - 3,599
INA, d.d.
Less than 1 month
1 - 12 months 1 - 5 years 5+ years Total
31 December 2018
Non-interest bearing 1,500 533 36 3 2,072Interest bearing 1,339 753 - - 2,092
2,839 1,286 36 3 4,164
31 December 2017
Non-interest bearing 1,052 426 44 - 1,522Interest bearing 1,132 540 125 - 1,797
2,184 966 169 - 3,319
Non-interest bearing liabilities of INA, d.d. due in a period of less than one month consist mainly of trade accounts
payable in the amount of HRK 1,242 million in 2018 (2017: HRK 787million).
Included in non-interest bearing liabilities of INA, d.d. due in a period of over five years are, liabilities to Government
for sold flats and deferred income for sold flats.
Interest bearing liabilities include short-term and long-term borrowings.
INA - INDUSTRIJA NAFTE, d.d.
Notes to the financial statements (continued)
For the year ended 31 December 2018
(all amounts are presented in HRK millions)
INA - Industrija nafte, d.d. 119
39. FINANCIAL INSTRUMENTS AND RISK MANAGEMENT (CONTINUED)
Fair value of financial instruments
Valuation techniques and assumptions applied for the purposes of measuring fair value
The fair values of financial assets and financial liabilities are determined as follows:
• the fair value of financial assets and financial liabilities with standard terms and conditions and traded on active
liquid markets is determined with reference to quoted market prices;
• the fair value of other financial assets and financial liabilities is determined in accordance with generally
accepted pricing models based on discounted cash flow analysis using prices from observable current market
transactions and dealer quotes for similar instruments;
• the fair values of derivative instruments are calculated using quoted prices. Where such prices are not
available, a discounted cash flow analysis is performed using the applicable yield curve for the duration of the
instruments for non-optional derivatives, and option pricing models for optional derivatives. Foreign currency
forward contracts are measured using quoted forward exchange rates and yield curves derived from quoted
interest rates matching maturities of the contracts. Interest rate swaps are measured at the present value of
future cash flows estimated and discounted based on the applicable yield curves derived from quoted interest
rates.
The following table provides an analysis of financial instruments that are measured subsequent to initial recognition
at fair value, grouped into Levels 1 to 3 based on the degree to which the fair value is observable:
• Level 1 fair value measurements are those derived from quoted prices (unadjusted) in active markets for
identical assets or liabilities;
• Level 2 fair value measurements are those derived from inputs other than quoted prices included within Level 1
that are observable for the asset or liability, either directly (i.e. as prices) or indirectly (i.e. derived from prices);
and
• Level 3 fair value measurements are those derived from valuation techniques that include inputs for the asset or
liability that are not based on observable market data (unobservable inputs).
INA - INDUSTRIJA NAFTE, d.d.
Notes to the financial statements (continued)
For the year ended 31 December 2018
(all amounts are presented in HRK millions)
INA - Industrija nafte, d.d. 120
39. FINANCIAL INSTRUMENTS AND RISK MANAGEMENT (CONTINUED)
Fair value of financial instruments (continued)
Fair value measurements recognized in the statement of financial position
INA GROUP and INA, d.d.
Level 1 Level 2 Level 3 Total
Financial assets at fair value
Non-current financial assets* 430 - - 430Marketable securities 27 - - 27Positive fair value of derivatives - 113 - 113
Financial liabilities at fair value
Negative fair value of derivatives - 92 - 92
Level 1 Level 2 Level 3 Total
Financial assets at fair value
Non-current financial assets* 618 - - 618Positive fair value of derivatives - 62 - 62
Financial liabilities at fair value
Negative fair value of derivatives - 65 - 65
31 December 2018
31 December 2017
* only non-current financial assets at fair value are presented in tables above, the remaining equity instruments classified as non-current
financial assets in total amount of HRK 49 million are measured at cost (2017: HRK 47 million) and therefore not included in tables above.
There were no transfers between levels 1 and 2 during the year.
(a) Financial instruments in level 1
The fair value of financial instruments included in Level 1 comprise JANAF shares equity investments classified as
non-current financial assets and marketable securities that are based on quoted market prices. A market is
considered as active if quoted prices are current and regularly available.
(b) Financial instruments in level 2 and level 3
The fair value of financial instruments that are not traded in an active market is determined by using valuation
techniques.
Specific valuation techniques used to value financial instruments include:
• The fair value of hedge commodity transactions is calculated based on actual historic quotations from Platts
and market forward quotations of the underlying commodities.
• The fair value of forward foreign exchange contracts has been determined based on exchange rates effective
at the statement of financial position date and an embedded derivative has been determined as the difference
between the cumulative inflation index of the contracted inflation escalation index and the inflation rate in the
country of contract execution.
These valuation techniques maximise the use of observable market data where it is available and rely as little as
possible on entity specific estimates. If all significant inputs required to fair value an instrument are observable, the
instrument is included in level 2. If one or more of the significant inputs is not based on observable market data, the
instrument is included in Level 3.
INA - INDUSTRIJA NAFTE, d.d.
Notes to the financial statements (continued)
For the year ended 31 December 2018
(all amounts are presented in HRK millions)
INA - Industrija nafte, d.d. 121
40. ACQUISITION OF ENI CROATIA B.V.
INA Adria B.V.
Amsterdam, Netherlands
Support activities for petroleum and natural gas extraction 15 November 2018 100.0% -
Headquarters Date of acquisition
Proportion of shares acquired (%)
Consideration transferredPrincipal activity
On 15 November 2018, by executing the Share Transfer Deed, INA-Industrija nafte d.d. became the sole
shareholder of ENI Croatia B.V. and subsequently the 100% owner of Croatia's offshore areas Northern Adriatic and
Marica. As a result, the Group recognized gain on acquisition in amount of HRK 291 million as other operating
income which mainly relates to decommissioning liability taken over in the acquisition and which will be mainly offset
by the unwinding of discount impact of such liability through time.
The fair values of the identifiable assets and liabilities of ENI Croatia B.V. as the date of acquisition were as follows:
Total identifiable net assets acquired 556
Gain on acquisition (291)
Total consideration 265
INA - INDUSTRIJA NAFTE, d.d.
Notes to the financial statements (continued)
For the year ended 31 December 2018
(all amounts are presented in HRK millions)
INA - Industrija nafte, d.d. 122
41. SUBSEQUENT EVENTS
Organisation changes
Following organizational changes, which are effective as of 1 February 2019 and 1 March 2019, with aim of
efficiency and productivity increase, some work positions will be terminated and subsequently there will be decrease
in number of operational employees, but also new positions will be formed. Mentioned changes will result in
decrease in number of approximately 200 employees.
Currently INA, d.d. is in process of consultations with Works Council, after which final proposal on changes will be
forwarded to Management Board for approval.
FINANCE
REPORT
ON COMPANY AND INA GROUP
STATUS FOR JANUARY-DECEMBER 2018 Zagreb, February, 2019
1
CONTENTS
INA Group and INA d.d. financial results (IFRS) .............................................................................................................. 2 Management discussion .................................................................................................................................................... 3 Exploration and Production ............................................................................................................................................... 3 Refining and Marketing, including Retail ........................................................................................................................... 5 Corporate and other .......................................................................................................................................................... 7 Main external parameters .................................................................................................................................................. 7 Financial overview ............................................................................................................................................................. 8 Statement of Profit or Loss – INA Group ........................................................................................................................... 8 Statement of Profit or Loss – INA d.d. ............................................................................................................................... 8 Consolidated Statement of financial position – INA Group ................................................................................................ 9 Statement of financial position – INA d.d. .......................................................................................................................... 9 Cash flow – INA Group ...................................................................................................................................................... 9 Cash flow – INA d.d. ........................................................................................................................................................ 10 Financial instruments and risk management ................................................................................................................... 10 Investments in INA portfolio companies .......................................................................................................................... 11 Related party transactions – INA Group .......................................................................................................................... 12 Related party transactions – INA, d.d. ............................................................................................................................. 13 INA Group and INA, d.d. summary Segmental Results of Operations ............................................................................ 15
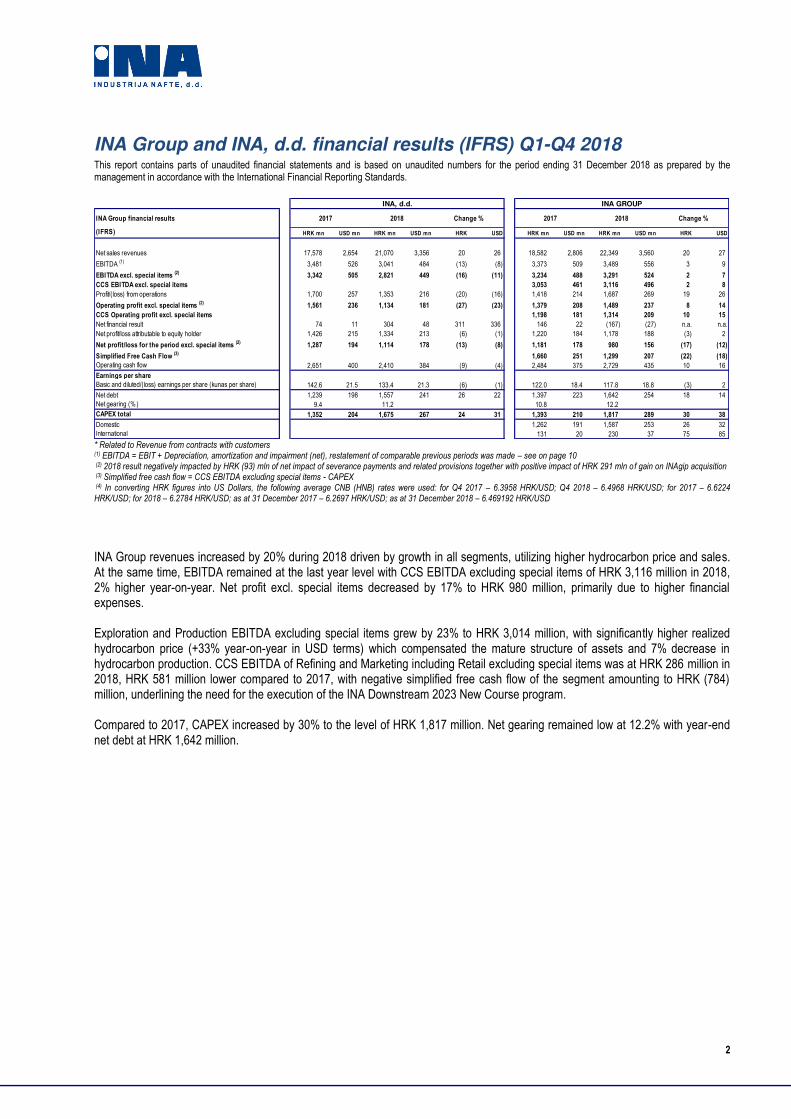
2
INA Group and INA, d.d. financial results (IFRS) Q1-Q4 2018 This report contains parts of unaudited financial statements and is based on unaudited numbers for the period ending 31 December 2018 as prepared by the management in accordance with the International Financial Reporting Standards.
INA Group financial results
(IFRS) HRK mn USD mn HRK mn USD mn HRK USD HRK mn USD mn HRK mn USD mn HRK USD
Net sales revenues 17,578 2,654 21,070 3,356 20 26 18,582 2,806 22,349 3,560 20 27
EBITDA (1) 3,481 526 3,041 484 (13) (8) 3,373 509 3,489 556 3 9
EBITDA excl. special items (2) 3,342 505 2,821 449 (16) (11) 3,234 488 3,291 524 2 7
CCS EBITDA excl. special items 3,053 461 3,116 496 2 8
Profit/(loss) from operations 1,700 257 1,353 216 (20) (16) 1,418 214 1,687 269 19 26
Operating profit excl. special items (2) 1,561 236 1,134 181 (27) (23) 1,379 208 1,489 237 8 14
CCS Operating profit excl. special items 1,198 181 1,314 209 10 15
Net financial result 74 11 304 48 311 336 146 22 (167) (27) n.a. n.a.
Net profit/loss attributable to equity holder 1,426 215 1,334 213 (6) (1) 1,220 184 1,178 188 (3) 2
Net profit/loss for the period excl. special items (2) 1,287 194 1,114 178 (13) (8) 1,181 178 980 156 (17) (12)
Simplified Free Cash Flow (3) 1,660 251 1,299 207 (22) (18)
Operating cash flow 2,651 400 2,410 384 (9) (4) 2,484 375 2,729 435 10 16
Earnings per share
Basic and diluted/(loss) earnings per share (kunas per share) 142.6 21.5 133.4 21.3 (6) (1) 122.0 18.4 117.8 18.8 (3) 2
Net debt 1,239 198 1,557 241 26 22 1,397 223 1,642 254 18 14
Net gearing (%) 9.4 11.2 10.8 12.2
CAPEX total 1,352 204 1,675 267 24 31 1,393 210 1,817 289 30 38
Domestic 1,262 191 1,587 253 26 32
International 131 20 230 37 75 85
INA, d.d. INA GROUP
2017 2018 Change % 2017 2018 Change %
* Related to Revenue from contracts with customers (1) EBITDA = EBIT + Depreciation, amortization and impairment (net), restatement of comparable previous periods was made – see on page 10
(2) 2018 result negatively impacted by HRK (93) mln of net impact of severance payments and related provisions together with positive impact of HRK 291 mln of gain on INAgip acquisition (3) Simplified free cash flow = CCS EBITDA excluding special items - CAPEX (4) In converting HRK figures into US Dollars, the following average CNB (HNB) rates were used: for Q4 2017 – 6.3958 HRK/USD; Q4 2018 – 6.4968 HRK/USD; for 2017 – 6.6224 HRK/USD; for 2018 – 6.2784 HRK/USD; as at 31 December 2017 – 6.2697 HRK/USD; as at 31 December 2018 – 6.469192 HRK/USD
INA Group revenues increased by 20% during 2018 driven by growth in all segments, utilizing higher hydrocarbon price and sales. At the same time, EBITDA remained at the last year level with CCS EBITDA excluding special items of HRK 3,116 million in 2018, 2% higher year-on-year. Net profit excl. special items decreased by 17% to HRK 980 million, primarily due to higher financial expenses. Exploration and Production EBITDA excluding special items grew by 23% to HRK 3,014 million, with significantly higher realized hydrocarbon price (+33% year-on-year in USD terms) which compensated the mature structure of assets and 7% decrease in hydrocarbon production. CCS EBITDA of Refining and Marketing including Retail excluding special items was at HRK 286 million in 2018, HRK 581 million lower compared to 2017, with negative simplified free cash flow of the segment amounting to HRK (784) million, underlining the need for the execution of the INA Downstream 2023 New Course program. Compared to 2017, CAPEX increased by 30% to the level of HRK 1,817 million. Net gearing remained low at 12.2% with year-end net debt at HRK 1,642 million.
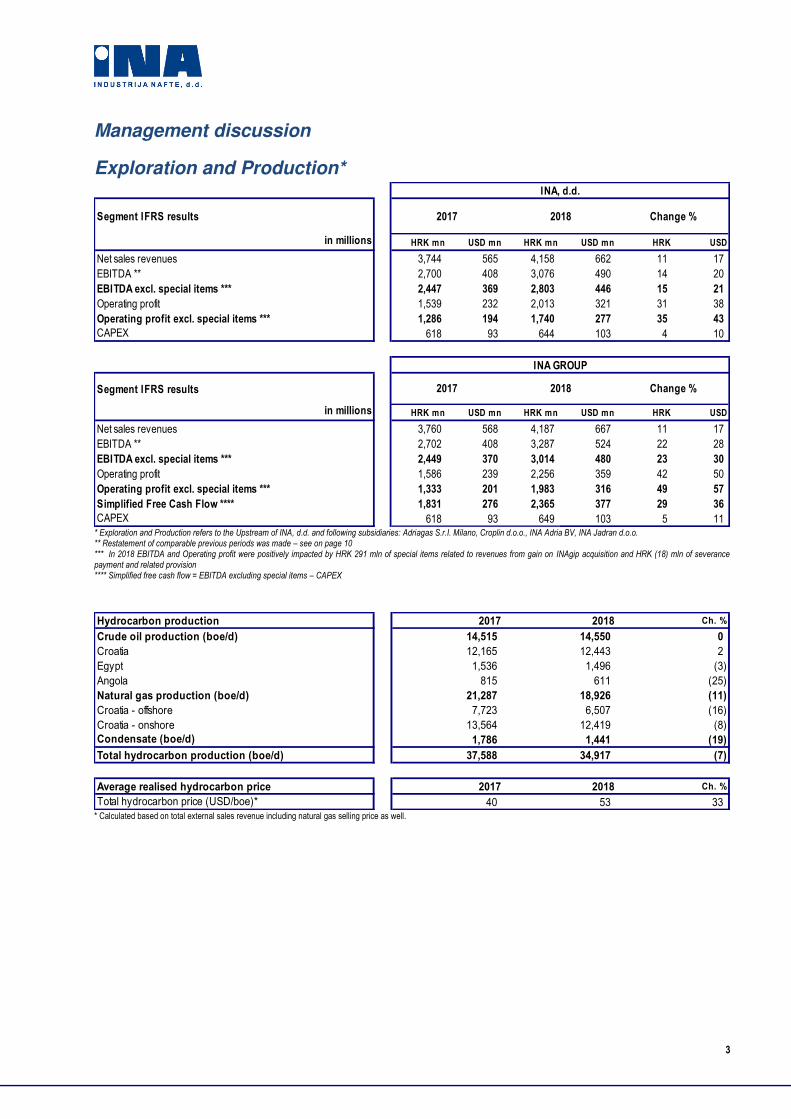
3
Management discussion
Exploration and Production*
Segment IFRS results
in millions HRK mn USD mn HRK mn USD mn HRK USD
Net sales revenues 3,744 565 4,158 662 11 17
EBITDA ** 2,700 408 3,076 490 14 20
EBITDA excl. special items *** 2,447 369 2,803 446 15 21
Operating profit 1,539 232 2,013 321 31 38
Operating profit excl. special items *** 1,286 194 1,740 277 35 43
CAPEX 618 93 644 103 4 10
Segment IFRS results
in millions HRK mn USD mn HRK mn USD mn HRK USD
Net sales revenues 3,760 568 4,187 667 11 17
EBITDA ** 2,702 408 3,287 524 22 28
EBITDA excl. special items *** 2,449 370 3,014 480 23 30
Operating profit 1,586 239 2,256 359 42 50
Operating profit excl. special items *** 1,333 201 1,983 316 49 57
Simplified Free Cash Flow **** 1,831 276 2,365 377 29 36
CAPEX 618 93 649 103 5 11
INA GROUP
INA, d.d.
2017 2018 Change %
2017 2018 Change %
* Exploration and Production refers to the Upstream of INA, d.d. and following subsidiaries: Adriagas S.r.I. Milano, Croplin d.o.o., INA Adria BV, INA Jadran d.o.o. ** Restatement of comparable previous periods was made – see on page 10 *** In 2018 EBITDA and Operating profit were positively impacted by HRK 291 mln of special items related to revenues from gain on INAgip acquisition and HRK (18) mln of severance payment and related provision **** Simplified free cash flow = EBITDA excluding special items – CAPEX
Hydrocarbon production 2017 2018 Ch. %
Crude oil production (boe/d) 14,515 14,550 0
Croatia 12,165 12,443 2
Egypt 1,536 1,496 (3)
Angola 815 611 (25)
Natural gas production (boe/d) 21,287 18,926 (11)
Croatia - offshore 7,723 6,507 (16)
Croatia - onshore 13,564 12,419 (8)
Condensate (boe/d) 1,786 1,441 (19)
Total hydrocarbon production (boe/d) 37,588 34,917 (7)
Average realised hydrocarbon price 2017 2018 Ch. %
Total hydrocarbon price (USD/boe)* 40 53 33 * Calculated based on total external sales revenue including natural gas selling price as well.
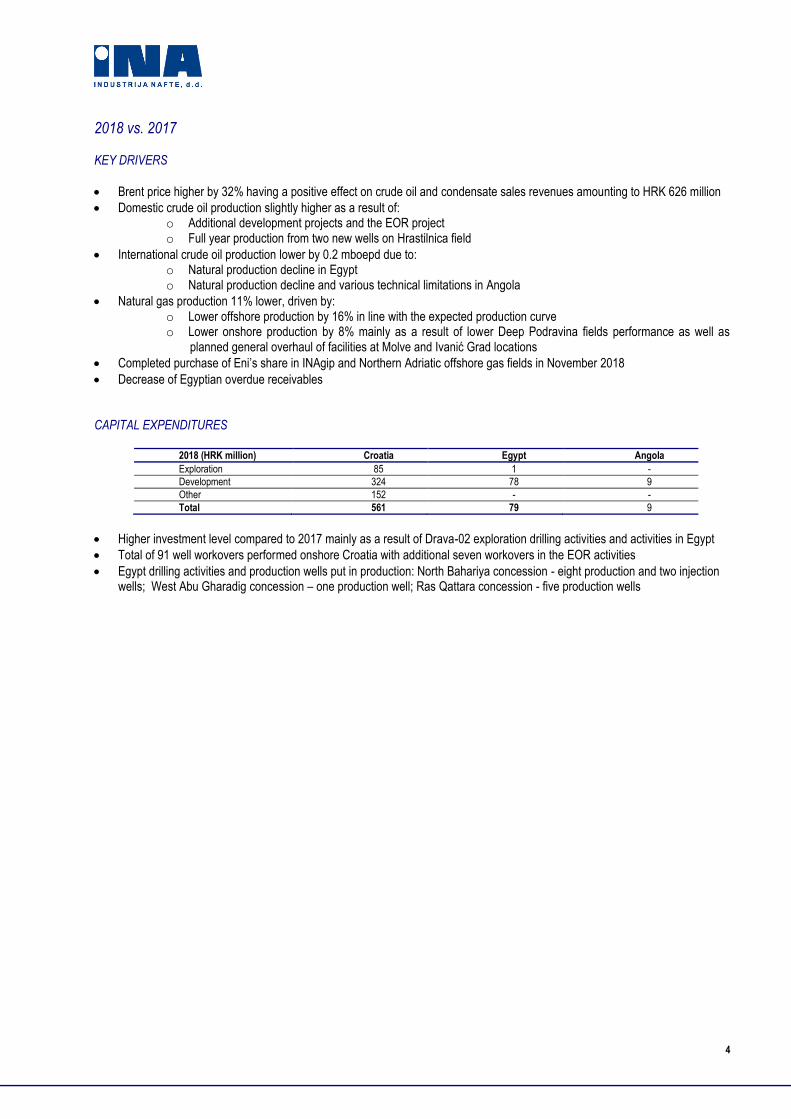
4
2018 vs. 2017 KEY DRIVERS
Brent price higher by 32% having a positive effect on crude oil and condensate sales revenues amounting to HRK 626 million
Domestic crude oil production slightly higher as a result of: o Additional development projects and the EOR project o Full year production from two new wells on Hrastilnica field
International crude oil production lower by 0.2 mboepd due to: o Natural production decline in Egypt o Natural production decline and various technical limitations in Angola
Natural gas production 11% lower, driven by: o Lower offshore production by 16% in line with the expected production curve o Lower onshore production by 8% mainly as a result of lower Deep Podravina fields performance as well as
planned general overhaul of facilities at Molve and Ivanić Grad locations Completed purchase of Eni’s share in INAgip and Northern Adriatic offshore gas fields in November 2018
Decrease of Egyptian overdue receivables
CAPITAL EXPENDITURES
2018 (HRK million) Croatia Egypt Angola
Exploration 85 1 -
Development 324 78 9
Other 152 - -
Total 561 79 9
Higher investment level compared to 2017 mainly as a result of Drava-02 exploration drilling activities and activities in Egypt
Total of 91 well workovers performed onshore Croatia with additional seven workovers in the EOR activities
Egypt drilling activities and production wells put in production: North Bahariya concession - eight production and two injection wells; West Abu Gharadig concession – one production well; Ras Qattara concession - five production wells
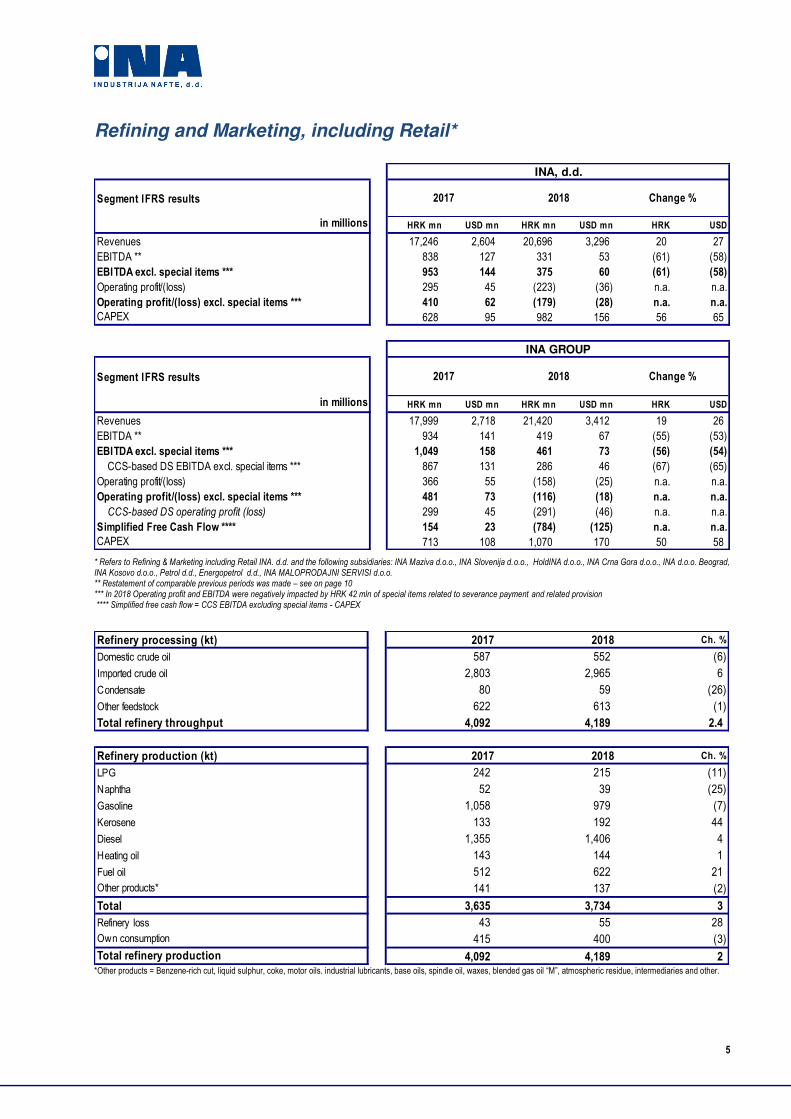
5
Refining and Marketing, including Retail*
Segment IFRS results
in millions HRK mn USD mn HRK mn USD mn HRK USD
Revenues 17,246 2,604 20,696 3,296 20 27
EBITDA ** 838 127 331 53 (61) (58)
EBITDA excl. special items *** 953 144 375 60 (61) (58)
Operating profit/(loss) 295 45 (223) (36) n.a. n.a.
Operating profit/(loss) excl. special items *** 410 62 (179) (28) n.a. n.a.
CAPEX 628 95 982 156 56 65
Segment IFRS results
in millions HRK mn USD mn HRK mn USD mn HRK USD
Revenues 17,999 2,718 21,420 3,412 19 26
EBITDA ** 934 141 419 67 (55) (53)
EBITDA excl. special items *** 1,049 158 461 73 (56) (54)
CCS-based DS EBITDA excl. special items *** 867 131 286 46 (67) (65)
Operating profit/(loss) 366 55 (158) (25) n.a. n.a.
Operating profit/(loss) excl. special items *** 481 73 (116) (18) n.a. n.a.
CCS-based DS operating profit (loss) 299 45 (291) (46) n.a. n.a.
Simplified Free Cash Flow **** 154 23 (784) (125) n.a. n.a.
CAPEX 713 108 1,070 170 50 58
2017 2018 Change %
INA, d.d.
INA GROUP
2017 2018 Change %
* Refers to Refining & Marketing including Retail INA. d.d. and the following subsidiaries: INA Maziva d.o.o., INA Slovenija d.o.o., HoldINA d.o.o., INA Crna Gora d.o.o., INA d.o.o. Beograd, INA Kosovo d.o.o., Petrol d.d., Energopetrol d.d., INA MALOPRODAJNI SERVISI d.o.o. ** Restatement of comparable previous periods was made – see on page 10 *** In 2018 Operating profit and EBITDA were negatively impacted by HRK 42 mln of special items related to severance payment and related provision **** Simplified free cash flow = CCS EBITDA excluding special items - CAPEX
Refinery processing (kt) 2017 2018 Ch. %
Domestic crude oil 587 552 (6)
Imported crude oil 2,803 2,965 6
Condensate 80 59 (26)
Other feedstock 622 613 (1)
Total refinery throughput 4,092 4,189 2.4
Refinery production (kt) 2017 2018 Ch. %
LPG 242 215 (11)
Naphtha 52 39 (25)
Gasoline 1,058 979 (7)
Kerosene 133 192 44
Diesel 1,355 1,406 4
Heating oil 143 144 1
Fuel oil 512 622 21
Other products* 141 137 (2)
Total 3,635 3,734 3
Refinery loss 43 55 28
Own consumption 415 400 (3)
Total refinery production 4,092 4,189 2 *Other products = Benzene-rich cut, liquid sulphur, coke, motor oils. industrial lubricants, base oils, spindle oil, waxes, blended gas oil “M”, atmospheric residue, intermediaries and other.
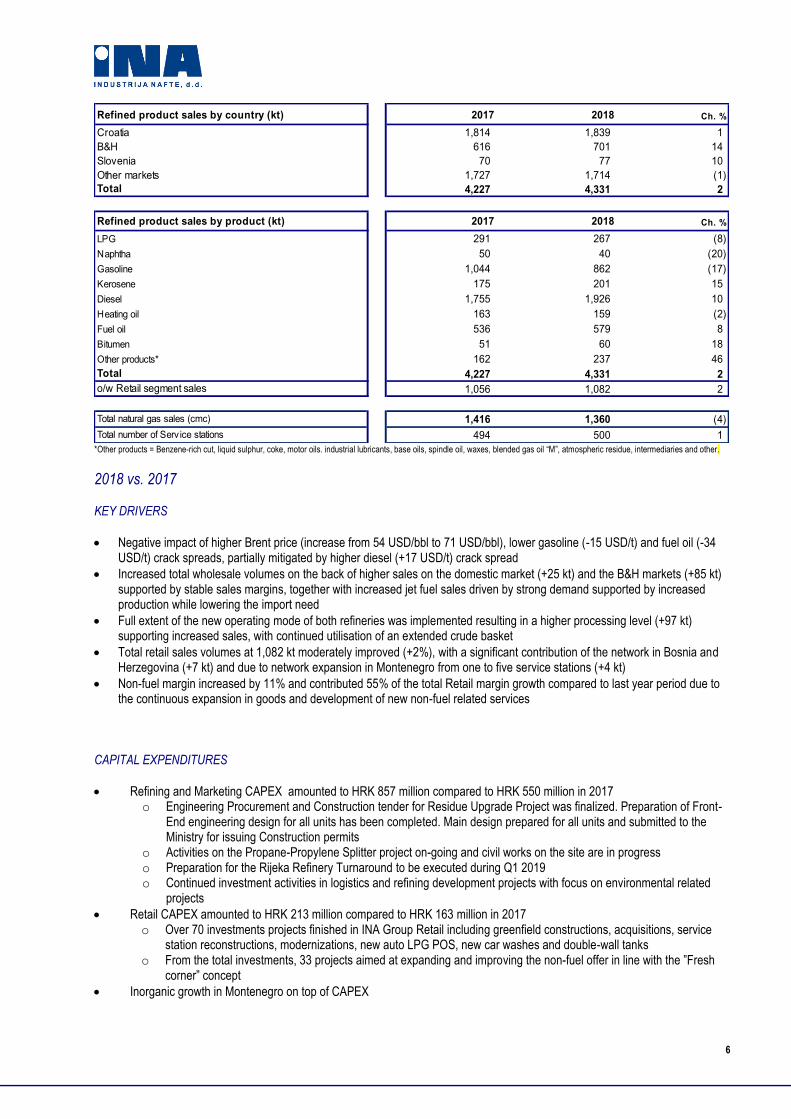
6
Refined product sales by country (kt) 2017 2018 Ch. %
Croatia 1,814 1,839 1
B&H 616 701 14
Slovenia 70 77 10
Other markets 1,727 1,714 (1)
Total 4,227 4,331 2
Refined product sales by product (kt) 2017 2018 Ch. %
LPG 291 267 (8)
Naphtha 50 40 (20)
Gasoline 1,044 862 (17)
Kerosene 175 201 15
Diesel 1,755 1,926 10
Heating oil 163 159 (2)
Fuel oil 536 579 8
Bitumen 51 60 18
Other products* 162 237 46
Total 4,227 4,331 2
o/w Retail segment sales 1,056 1,082 2
Total natural gas sales (cmc) 1,416 1,360 (4)
Total number of Serv ice stations 494 500 1 *Other products = Benzene-rich cut, liquid sulphur, coke, motor oils. industrial lubricants, base oils, spindle oil, waxes, blended gas oil “M”, atmospheric residue, intermediaries and other.
2018 vs. 2017 KEY DRIVERS
Negative impact of higher Brent price (increase from 54 USD/bbl to 71 USD/bbl), lower gasoline (-15 USD/t) and fuel oil (-34 USD/t) crack spreads, partially mitigated by higher diesel (+17 USD/t) crack spread
Increased total wholesale volumes on the back of higher sales on the domestic market (+25 kt) and the B&H markets (+85 kt) supported by stable sales margins, together with increased jet fuel sales driven by strong demand supported by increased production while lowering the import need
Full extent of the new operating mode of both refineries was implemented resulting in a higher processing level (+97 kt) supporting increased sales, with continued utilisation of an extended crude basket
Total retail sales volumes at 1,082 kt moderately improved (+2%), with a significant contribution of the network in Bosnia and Herzegovina (+7 kt) and due to network expansion in Montenegro from one to five service stations (+4 kt)
Non-fuel margin increased by 11% and contributed 55% of the total Retail margin growth compared to last year period due to the continuous expansion in goods and development of new non-fuel related services
CAPITAL EXPENDITURES
Refining and Marketing CAPEX amounted to HRK 857 million compared to HRK 550 million in 2017 o Engineering Procurement and Construction tender for Residue Upgrade Project was finalized. Preparation of Front-
End engineering design for all units has been completed. Main design prepared for all units and submitted to the Ministry for issuing Construction permits
o Activities on the Propane-Propylene Splitter project on-going and civil works on the site are in progress o Preparation for the Rijeka Refinery Turnaround to be executed during Q1 2019 o Continued investment activities in logistics and refining development projects with focus on environmental related
projects
Retail CAPEX amounted to HRK 213 million compared to HRK 163 million in 2017 o Over 70 investments projects finished in INA Group Retail including greenfield constructions, acquisitions, service
station reconstructions, modernizations, new auto LPG POS, new car washes and double-wall tanks o From the total investments, 33 projects aimed at expanding and improving the non-fuel offer in line with the ”Fresh
corner” concept Inorganic growth in Montenegro on top of CAPEX
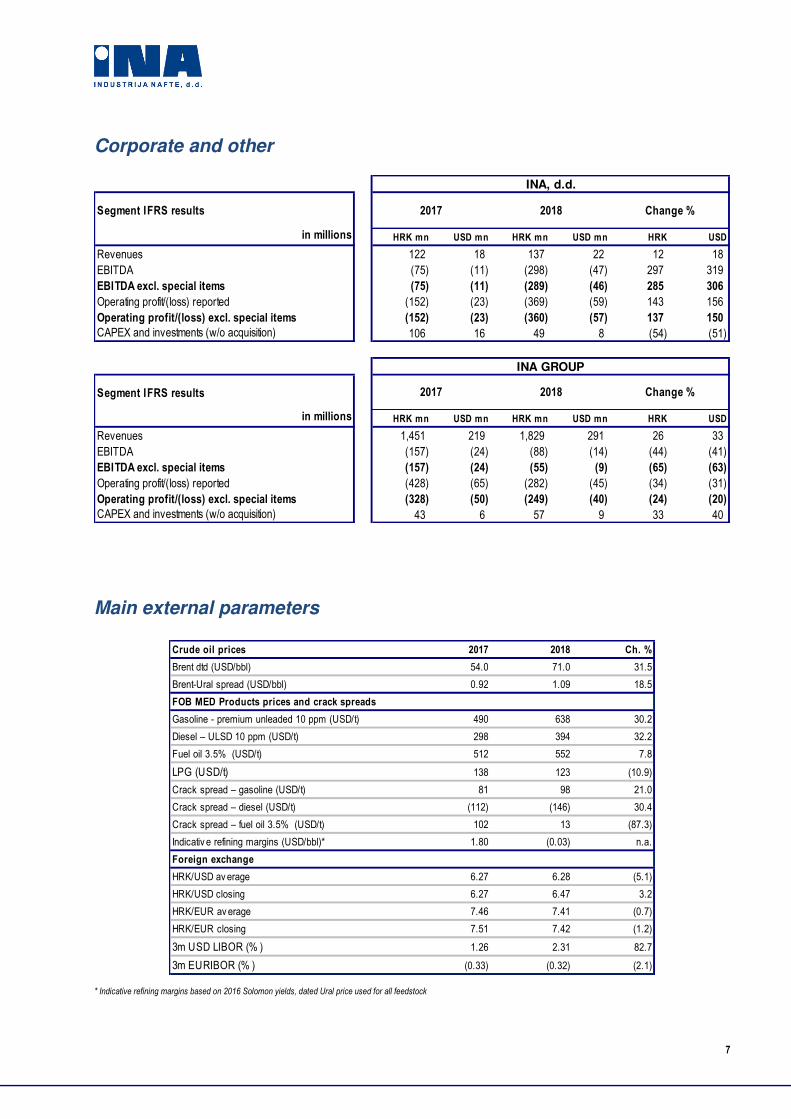
7
Corporate and other
Segment IFRS results
in millions HRK mn USD mn HRK mn USD mn HRK USD
Revenues 122 18 137 22 12 18
EBITDA (75) (11) (298) (47) 297 319
EBITDA excl. special items (75) (11) (289) (46) 285 306
Operating profit/(loss) reported (152) (23) (369) (59) 143 156
Operating profit/(loss) excl. special items (152) (23) (360) (57) 137 150
CAPEX and investments (w/o acquisition) 106 16 49 8 (54) (51)
Segment IFRS results
in millions HRK mn USD mn HRK mn USD mn HRK USD
Revenues 1,451 219 1,829 291 26 33
EBITDA (157) (24) (88) (14) (44) (41)
EBITDA excl. special items (157) (24) (55) (9) (65) (63)
Operating profit/(loss) reported (428) (65) (282) (45) (34) (31)
Operating profit/(loss) excl. special items (328) (50) (249) (40) (24) (20)
CAPEX and investments (w/o acquisition) 43 6 57 9 33 40
INA, d.d.
INA GROUP
2017 2018 Change %
2017 2018 Change %
Main external parameters
Crude oil prices 2017 2018 Ch. %
Brent dtd (USD/bbl) 54.0 71.0 31.5
Brent-Ural spread (USD/bbl) 0.92 1.09 18.5
Gasoline - premium unleaded 10 ppm (USD/t) 490 638 30.2
Diesel – ULSD 10 ppm (USD/t) 298 394 32.2
Fuel oil 3.5% (USD/t) 512 552 7.8
LPG (USD/t) 138 123 (10.9)
Crack spread – gasoline (USD/t) 81 98 21.0
Crack spread – diesel (USD/t) (112) (146) 30.4
Crack spread – fuel oil 3.5% (USD/t) 102 13 (87.3)
Indicativ e refining margins (USD/bbl)* 1.80 (0.03) n.a.
HRK/USD av erage 6.27 6.28 (5.1)
HRK/USD closing 6.27 6.47 3.2
HRK/EUR av erage 7.46 7.41 (0.7)
HRK/EUR closing 7.51 7.42 (1.2)
3m USD LIBOR (% ) 1.26 2.31 82.7
3m EURIBOR (% ) (0.33) (0.32) (2.1)
FOB MED Products prices and crack spreads
Foreign exchange
* Indicative refining margins based on 2016 Solomon yields, dated Ural price used for all feedstock
8
Financial overview
Statement of Profit or Loss – INA Group
Revenues from contract with customers in 2018 amounted to HRK 22,349 million and were 20% above the 2017 level, triggered mainly by higher crude oil and product prices and increased total sales volume on domestic and B&H market. Costs of raw materials and consumables were 33% above the 2017 level at HRK 12,033 million, resulting mainly from higher processing and higher crude prices.
Costs of other goods sold in 2018 recorded an increase of 23% compared to 2017, and amounted to HRK 3,605 million resulting from different sales structure. Other operating costs realized in 2018 include:
Other material costs were higher by 17% and amounted to HRK 2,188 million related to increasing oil prices and higher Crosco engagement abroad.
Service costs in the amount of HRK 569 million were 22% higher than 2017 level mainly due to emission charge
Depreciation, amortistion and impairment (net) in the amount of HRK 1,802 million was 8% lower compared to 2017
Adjustments and provisions had a positive effect in the amount of HRK 152 million mainly related to collection of previously value adjusted EGPC receivables
Staff costs in the amount HRK 1,927 million were 7% higher compared to 2017.
Income tax expense in 2018 amounted to HRK 343 million compared to HRK 342 million income tax expense in 2017. Tax costs and deferred taxes during the interim period are calculated on the basis of actual results and the profit tax rate, 18 % for the periods ended 31 December 2017 and 31 December 2018. Net result from financial activities is negative in 2018 compared to positive 2017 impact mainly as a result of:
Net foreign exchange loss reached HRK 38 million in 2018, while in 2017 net foreign exchange gain reached HRK 223 million.
Interest payable amounted to HRK 68 million and interest received to HRK 3 million in 2018, while in 2017 interest payable amounted to HRK 57 million and interest received to HRK 4 million.
Other financial net expenses amounted to HRK 64 million and are higher compared to HRK 40 million financial expenses in 2017.
Statement of Profit or Loss – INA, d.d.
Total sales revenues in 2018 amounted HRK 21,070 million, 20% higher compared to 2017 level, primarily triggered by higher refined products sales combined with higher crude oil price. Costs of raw materials and consumables were 34% higher and amounted to HRK 11,819 million, resulting mainly from higher processing and higher crude prices. Costs of goods sold recorded an increase of 19%, and amounted HRK 3,169 million, resulting from different sales structure. Within the other operating costs realized in 2018: Other material costs amounted to HRK 2,162 million, a 15% increase compared to 2017. Service costs in the amount of HRK 787 million raised 12% above the last year’s level. Depreciation, amortisation and impairment (net) was 5% lower compared to 2017 and amounted to HRK 1,688 million. Adjustments and provisions had a positive effect of HRK 145 million but were mainly related to collection of previously
value adjusted EGPC receivables. Staff costs in the amount HRK 950 million were 5% higher than 2017. Net financial profit in the amount of HRK 304 million was recorded in 2018, compared to HRK 74 million of net financial profit in 2017.
9
Consolidated Statement of financial position – INA Group
As at 31 December 2018 INA Group total assets amounted to HRK 20,742 million, 8% higher compared to 31 December 2017. In the period ended 31 December 2018, INA Group invested HRK 121 million in intangible assets. The effect of depreciation equals HRK 48 million. Acquisition of INA Adria entity increased NBV of intangible assets in amount of HRK 47 million.
In the period ended 31 December 2018, INA Group invested HRK 1,696 million in property, plant and equipment. The effect of depreciation reduced net book value of property, plant and equipment in amount of HRK 1,632 million.
Share capital as at 31 December 2018 amounted to HRK 9,000 million. There was no movements in the issued capital of the Company in either the current or the prior financial reporting.
Inventories amounted to HRK 2,645 million, and have increased by 17% compared to 31 December 2017 as a result of higher crude oil volume together with higher price.
Trade receivables net amounted to HRK 1,837 million which is 32% higher than 31 December 2017 and in line with the sales revenues dynamic.
As at 31 December 2018 total liabilities amounted to HRK 8,919 million which is 15% or HRK 1,182 million higher compared to 31 December 2017. INA Group net debt amounted to HRK 1,642 million and increased by 18% compared to 31 December 2017. Net gearing1 increased from 10.8% as at 31 December 2017, to 12.2% as at 31 December 2018.
Trade payables increased by 47% to HRK 1,720 million, as a result of INAgip acquisition.
Statement of financial position – INA, d.d. Total assets of INA, d.d., as at 31 December 2018 amounted to HRK 20,887 million and was 9% higher than 31 December 2017. Property, plant and equipment amounted to HRK 10,586 million and were in line with 31 December 2017. Trade receivables outside of INA Group amounted to HRK 1,490 million and were 33% higher compared to 31 December 2017. Total liabilities amounted to HRK 8,535 million and were 16% higher compared to 31 December 2017. Net indebtedness of INA, d.d., amounted to HRK 1,557 million as at 31 December 2018 which is 26% higher compared to 31 December 2017. Gearing ratio2 increased from 9.4% as at 31 December 2017 to 11.2% as at 31 December 2018. As at 31 December 2018 trade payables outside of INA-Group amounted HRK 1,242 million, which is an increase of 58% compared to the 31 December 2017 as a result of INAgip acquisition.
Cash flow – INA Group The operating cash flow before changes in working capital amounted to HRK 3,131 million in 2018 representing a decrease of HRK 121 million compared to 2017, which is in line with the change in EBITDA performance excluding non-cash items compared to the previous year. Movements in working capital affected the operating cash flow negatively by HRK 341 million, due to:
Increased value of inventories in the amount of HRK 725 million mainly related to higher prices and domestic crude inventory volume change
Increase in receivables in the amounth of HRK 319 million as a result of higher sales revenues in 2018 compared to 2017
Increase in trade and other payables in the amounth of HRK 703 million affected by INAgip acquisition. Net cash used for investing activities amounted to HRK 2,242 million of outflows, compared to HRK 1,300 million outflows in 2017.
1 Net debt / net debt plus equity incl. minority interests
10
Cash flow – INA, d.d. The operating cash-flow before changes in working capital amounted to HRK 2,949 million in 2018, which is a decrease of 5% compared to the same period last year. Changes in working capital affected the operating cash flow negatively by HRK 504 million, primarily due to:
Increased value of inventories by HRK 645 million, Increase in receivables by HRK 881 million, Payables increase by HRK 1,022 million.
In 2018, taxes paid influenced the operating cash flow negatively by HRK 35 million, while in 2017 taxed paid influenced the operating cash flow negatively by HRK 13 million. All the above factors resulted in HRK 2,410 million net inflows from operating activities generated by INA d.d. in 2018. Restatement INA adjusted its EBITDA methodology and classification between impairment and value adjustment lines to better align the reporting to business reporting standards with EBITDA now being calculated as EBIT + Depreciation, amortization and impairment (net). Additionally, gas trading operations have been moved from the Exploration and Production to Refining and Marketing incl. Retail and the comparable periods restated.
Financial instruments and risk management Risk Management procedures of INA Group are described in detail in INA’s Consolidated and separate Financial Statements for the year ended 31 December 2017. As of 31 December 2018 INA had: Opened short-term forward commodity swap transactions to hedge its exposure to changes in pricing periods,
inventory levels and refining margins Contracted and available short-term credit lines amounting to HRK 2,232 million excluding overdrafts and trade
financing credit lines established with the purpose to finance the purchase of crude oil and oil products Contracted and available long-term credit lines amounting to HRK 2,713 million.
Special items In addition to international accounting standards, international reporting standards and regulatory requests the company discloses special items to achieve a higher level of transparency and to provide better understanding of the usual business operations. Business events not occurring regularly and having significant effect on operations and results are considered as special items. INA has adopted the materiality level for the special items in the amount of USD 10 million or above. If special items reaches materiality level on cumulative basis, previous quarters are restated. Furthermore, in accordance with the adopted accounting policies and IFRS 36 – Impairment of Assets, INA performs impairment testing at the end of each reporting period if impairment indicators are assessed to be significant. Intersegment profit eliminations Intersegment elimination indicates unrealised profit/loss on domestic crude oil being transferred from Exploration and Production to Refining and Marketing but still being kept on INA inventory as crude oil or finished / semi-finished product. Intersegment EBITDA effect on results in 2018 is HRK (129) million which is lower compared to HRK 106 million in 2017 due to different schedule of domestic crude processing.
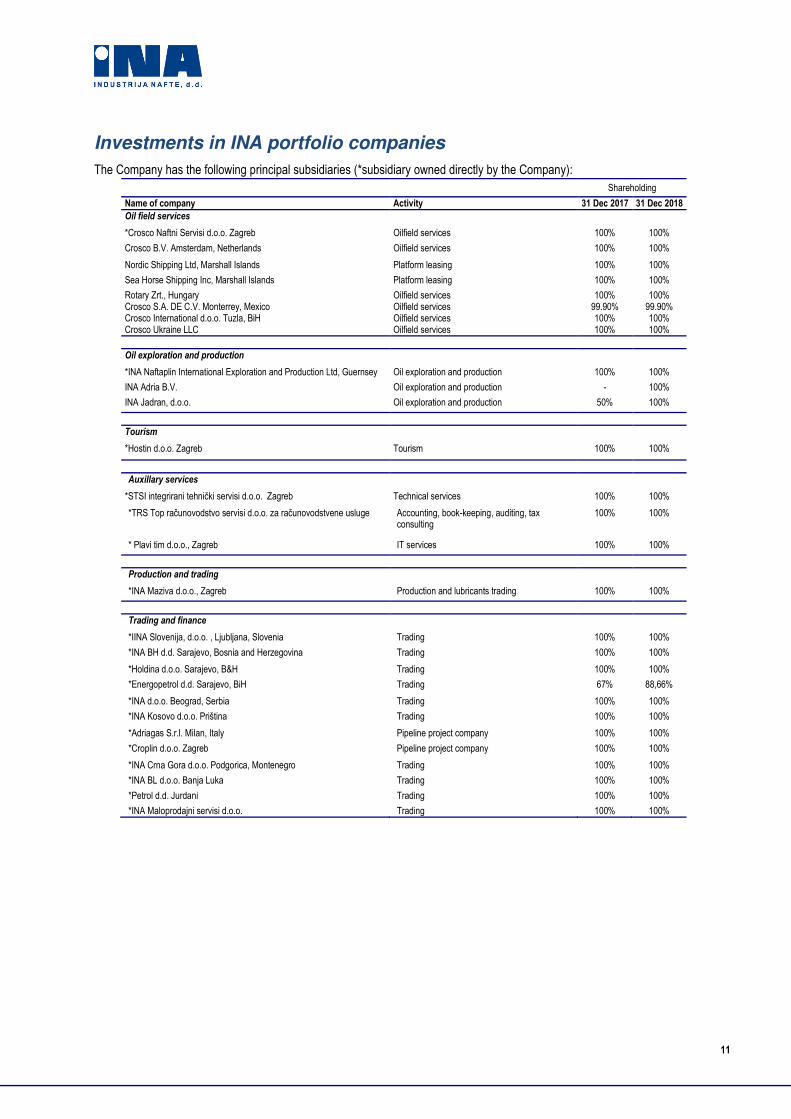
11
Investments in INA portfolio companies
The Company has the following principal subsidiaries (*subsidiary owned directly by the Company):
Shareholding
Name of company Activity 31 Dec 2017 31 Dec 2018
Oil field services
*Crosco Naftni Servisi d.o.o. Zagreb Oilfield services 100% 100%
Crosco B.V. Amsterdam, Netherlands Oilfield services 100% 100%
Nordic Shipping Ltd, Marshall Islands Platform leasing 100% 100%
Sea Horse Shipping Inc, Marshall Islands Platform leasing 100% 100%
Rotary Zrt., Hungary Oilfield services 100% 100% Crosco S.A. DE C.V. Monterrey, Mexico Oilfield services 99.90% 99.90% Crosco International d.o.o. Tuzla, BiH Oilfield services 100% 100% Crosco Ukraine LLC Oilfield services 100% 100%
Oil exploration and production
*INA Naftaplin International Exploration and Production Ltd, Guernsey Oil exploration and production 100% 100%
INA Adria B.V. Oil exploration and production - 100%
INA Jadran, d.o.o. Oil exploration and production 50% 100%
Tourism
*Hostin d.o.o. Zagreb Tourism 100% 100%
Auxillary services
*STSI integrirani tehnički servisi d.o.o. Zagreb Technical services 100% 100%
*TRS Top računovodstvo servisi d.o.o. za računovodstvene usluge Accounting, book-keeping, auditing, tax consulting
100% 100%
* Plavi tim d.o.o., Zagreb IT services 100% 100%
Production and trading
*INA Maziva d.o.o., Zagreb Production and lubricants trading 100% 100%
Trading and finance
*IINA Slovenija, d.o.o. , Ljubljana, Slovenia Trading 100% 100%
*INA BH d.d. Sarajevo, Bosnia and Herzegovina Trading 100% 100%
*Holdina d.o.o. Sarajevo, B&H Trading 100% 100%
*Energopetrol d.d. Sarajevo, BiH Trading 67% 88,66%
*INA d.o.o. Beograd, Serbia Trading 100% 100%
*INA Kosovo d.o.o. Priština Trading 100% 100%
*Adriagas S.r.l. Milan, Italy Pipeline project company 100% 100%
*Croplin d.o.o. Zagreb Pipeline project company 100% 100%
*INA Crna Gora d.o.o. Podgorica, Montenegro Trading 100% 100%
*INA BL d.o.o. Banja Luka Trading 100% 100%
*Petrol d.d. Jurdani Trading 100% 100%
*INA Maloprodajni servisi d.o.o. Trading 100% 100%
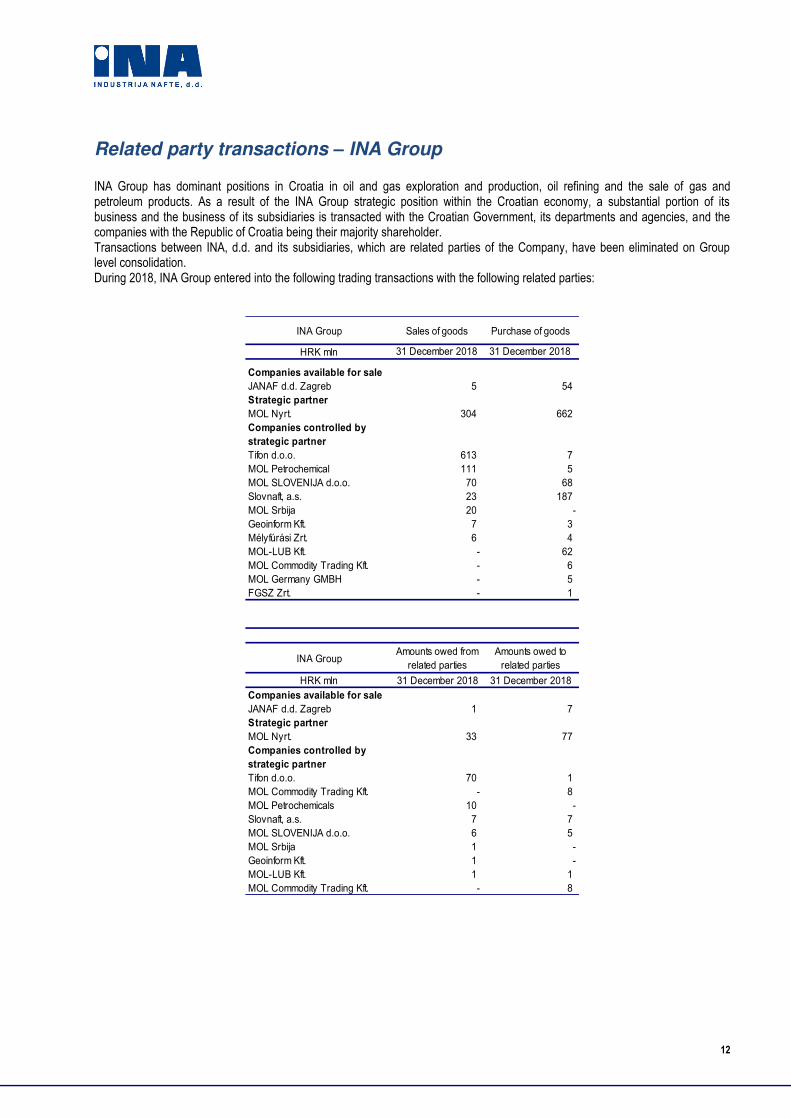
12
Related party transactions – INA Group INA Group has dominant positions in Croatia in oil and gas exploration and production, oil refining and the sale of gas and petroleum products. As a result of the INA Group strategic position within the Croatian economy, a substantial portion of its business and the business of its subsidiaries is transacted with the Croatian Government, its departments and agencies, and the companies with the Republic of Croatia being their majority shareholder. Transactions between INA, d.d. and its subsidiaries, which are related parties of the Company, have been eliminated on Group level consolidation. During 2018, INA Group entered into the following trading transactions with the following related parties:
INA Group Sales of goods Purchase of goods
HRK mln 31 December 2018 31 December 2018
Companies available for sale
JANAF d.d. Zagreb 5 54
Strategic partner
MOL Nyrt. 304 662
Companies controlled by
strategic partner
Tifon d.o.o. 613 7
MOL Petrochemical 111 5
MOL SLOVENIJA d.o.o. 70 68
Slovnaft, a.s. 23 187
MOL Srbija 20 -
Geoinform Kft. 7 3
Mélyfúrási Zrt. 6 4
MOL-LUB Kft. - 62
MOL Commodity Trading Kft. - 6
MOL Germany GMBH - 5
FGSZ Zrt. - 1
INA GroupAmounts owed from
related parties
Amounts owed to
related parties
HRK mln 31 December 2018 31 December 2018
Companies available for sale
JANAF d.d. Zagreb 1 7
Strategic partner
MOL Nyrt. 33 77
Companies controlled by
strategic partner
Tifon d.o.o. 70 1
MOL Commodity Trading Kft. - 8
MOL Petrochemicals 10 -
Slovnaft, a.s. 7 7
MOL SLOVENIJA d.o.o. 6 5
MOL Srbija 1 -
Geoinform Kft. 1 -
MOL-LUB Kft. 1 1
MOL Commodity Trading Kft. - 8
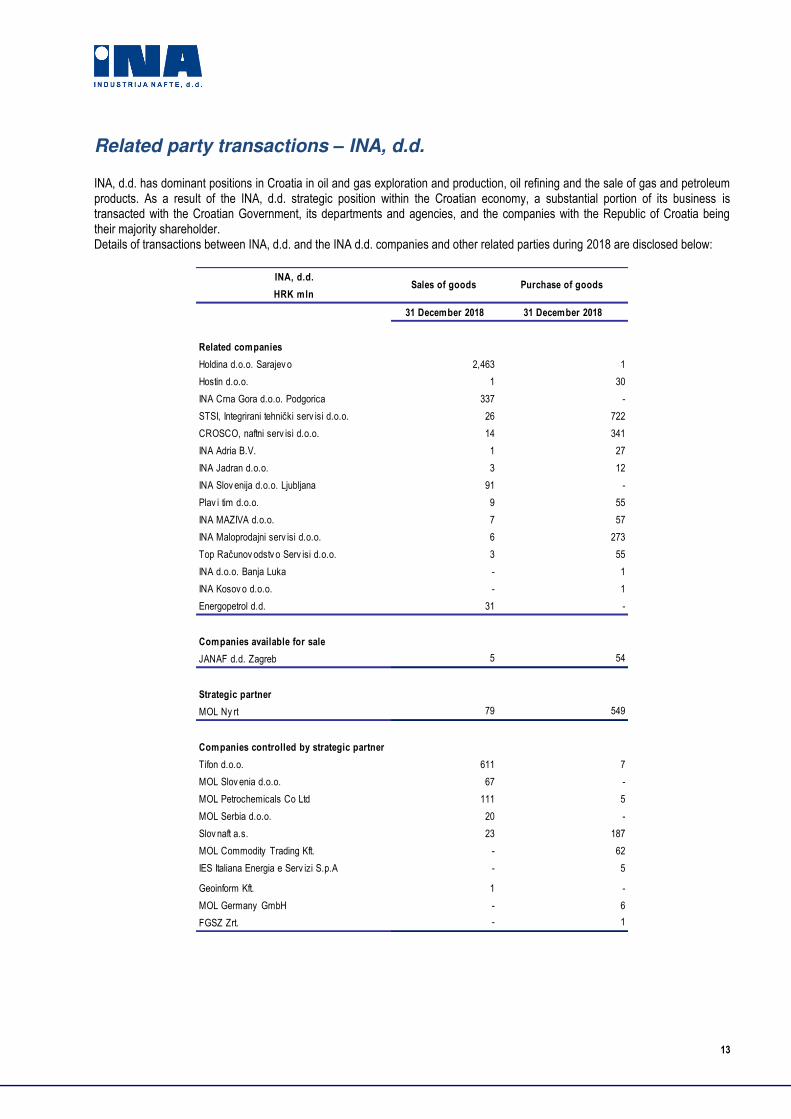
13
Related party transactions – INA, d.d. INA, d.d. has dominant positions in Croatia in oil and gas exploration and production, oil refining and the sale of gas and petroleum products. As a result of the INA, d.d. strategic position within the Croatian economy, a substantial portion of its business is transacted with the Croatian Government, its departments and agencies, and the companies with the Republic of Croatia being their majority shareholder. Details of transactions between INA, d.d. and the INA d.d. companies and other related parties during 2018 are disclosed below:
INA, d.d.
HRK mln
31 December 2018 31 December 2018
Related companies
Holdina d.o.o. Sarajev o 2,463 1
Hostin d.o.o. 1 30
INA Crna Gora d.o.o. Podgorica 337 -
STSI, Integrirani tehnički serv isi d.o.o. 26 722
CROSCO, naftni serv isi d.o.o. 14 341
INA Adria B.V. 1 27
INA Jadran d.o.o. 3 12
INA Slov enija d.o.o. Ljubljana 91 -
Plav i tim d.o.o. 9 55
INA MAZIVA d.o.o. 7 57
INA Maloprodajni serv isi d.o.o. 6 273
Top Računov odstv o Serv isi d.o.o. 3 55
INA d.o.o. Banja Luka - 1
INA Kosov o d.o.o. - 1
Energopetrol d.d. 31 -
Companies available for sale
JANAF d.d. Zagreb 5 54
Strategic partner
MOL Ny rt 79 549
Companies controlled by strategic partner
Tifon d.o.o. 611 7
MOL Slov enia d.o.o. 67 -
MOL Petrochemicals Co Ltd 111 5
MOL Serbia d.o.o. 20 -
Slov naft a.s. 23 187
MOL Commodity Trading Kft. - 62
IES Italiana Energia e Serv izi S.p.A - 5
Geoinform Kft. 1 -
MOL Germany GmbH - 6
FGSZ Zrt. - 1
Sales of goods Purchase of goods
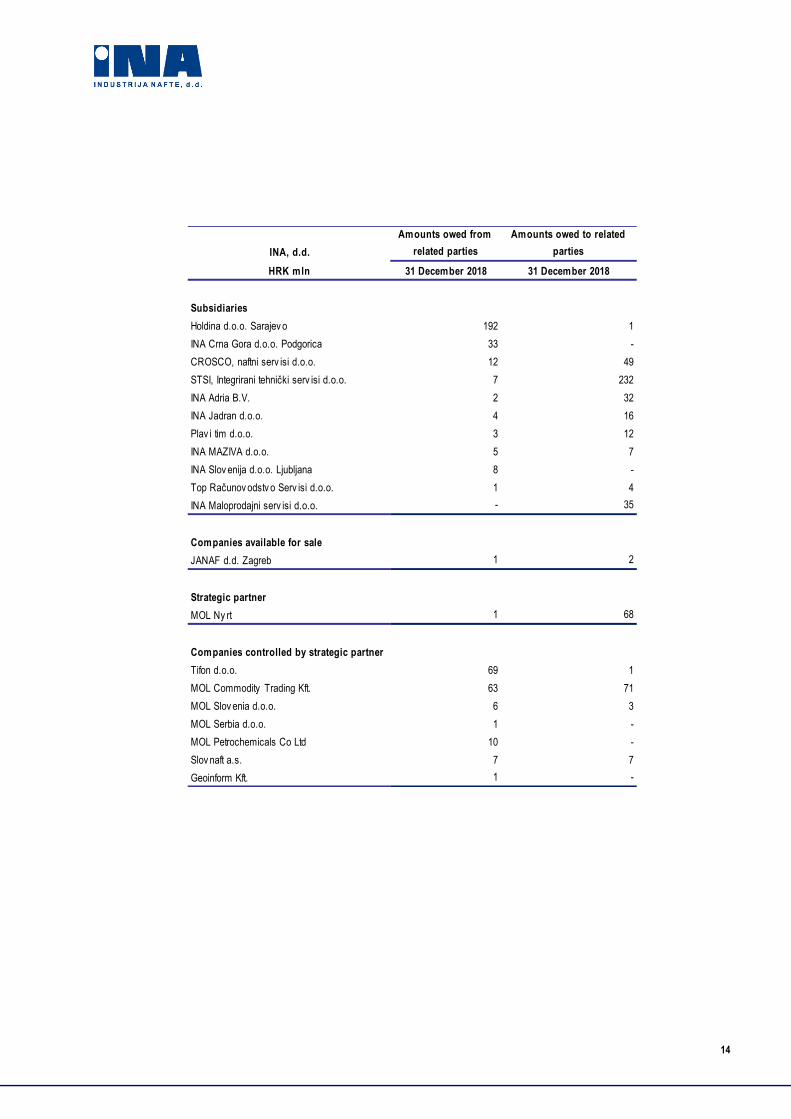
14
INA, d.d.
Amounts owed from
related parties
Amounts owed to related
parties
HRK mln 31 December 2018 31 December 2018
Subsidiaries
Holdina d.o.o. Sarajev o 192 1
INA Crna Gora d.o.o. Podgorica 33 -
CROSCO, naftni serv isi d.o.o. 12 49
STSI, Integrirani tehnički serv isi d.o.o. 7 232
INA Adria B.V. 2 32
INA Jadran d.o.o. 4 16
Plav i tim d.o.o. 3 12
INA MAZIVA d.o.o. 5 7
INA Slov enija d.o.o. Ljubljana 8 -
Top Računov odstv o Serv isi d.o.o. 1 4
INA Maloprodajni serv isi d.o.o. - 35
Companies available for sale
JANAF d.d. Zagreb 1 2
Strategic partner
MOL Ny rt 1 68
Companies controlled by strategic partner
Tifon d.o.o. 69 1
MOL Commodity Trading Kft. 63 71
MOL Slov enia d.o.o. 6 3
MOL Serbia d.o.o. 1 -
MOL Petrochemicals Co Ltd 10 -
Slov naft a.s. 7 7
Geoinform Kft. 1 -
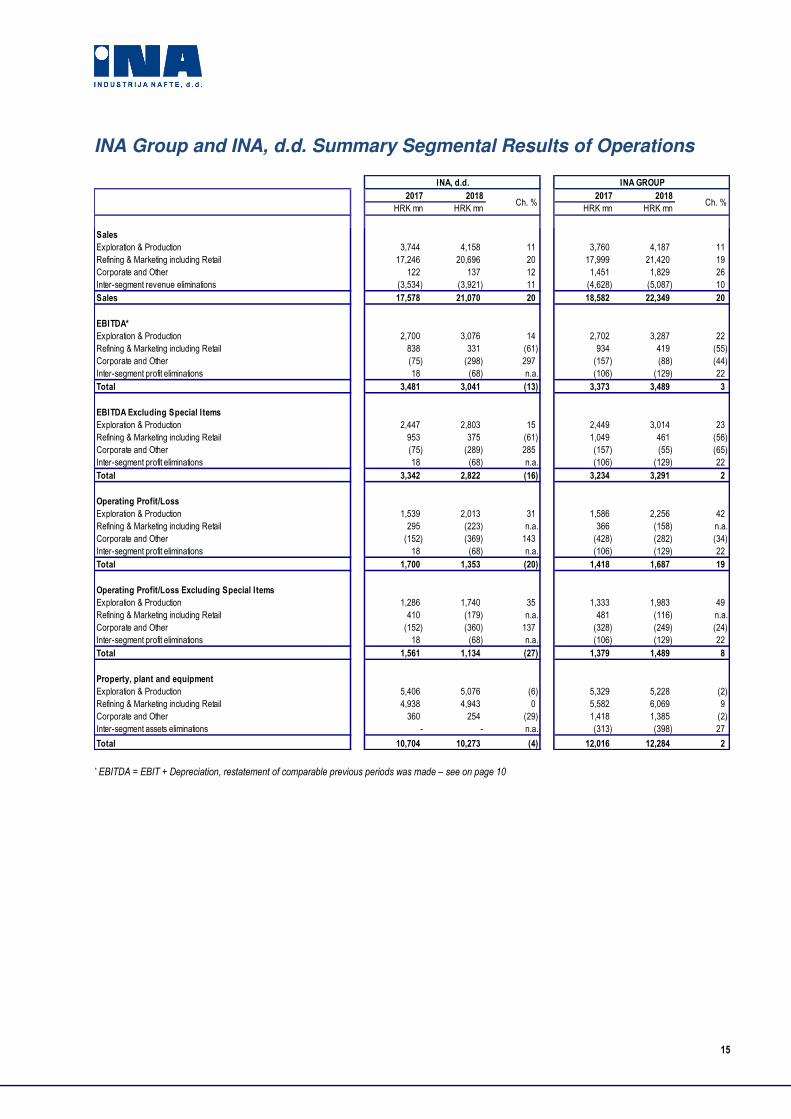
15
INA Group and INA, d.d. Summary Segmental Results of Operations
2017 2018 2017 2018
HRK mn HRK mn HRK mn HRK mn
Sales
Exploration & Production 3,744 4,158 11 3,760 4,187 11
Refining & Marketing including Retail 17,246 20,696 20 17,999 21,420 19
Corporate and Other 122 137 12 1,451 1,829 26
Inter-segment revenue eliminations (3,534) (3,921) 11 (4,628) (5,087) 10
Sales 17,578 21,070 20 18,582 22,349 20
EBITDA*
Exploration & Production 2,700 3,076 14 2,702 3,287 22
Refining & Marketing including Retail 838 331 (61) 934 419 (55)
Corporate and Other (75) (298) 297 (157) (88) (44)
Inter-segment profit eliminations 18 (68) n.a. (106) (129) 22
Total 3,481 3,041 (13) 3,373 3,489 3
EBITDA Excluding Special I tems
Exploration & Production 2,447 2,803 15 2,449 3,014 23
Refining & Marketing including Retail 953 375 (61) 1,049 461 (56)
Corporate and Other (75) (289) 285 (157) (55) (65)
Inter-segment profit eliminations 18 (68) n.a. (106) (129) 22
Total 3,342 2,822 (16) 3,234 3,291 2
Operating Profit/Loss
Exploration & Production 1,539 2,013 31 1,586 2,256 42
Refining & Marketing including Retail 295 (223) n.a. 366 (158) n.a.
Corporate and Other (152) (369) 143 (428) (282) (34)
Inter-segment profit eliminations 18 (68) n.a. (106) (129) 22
Total 1,700 1,353 (20) 1,418 1,687 19
Operating Profit/Loss Excluding Special I tems
Exploration & Production 1,286 1,740 35 1,333 1,983 49
Refining & Marketing including Retail 410 (179) n.a. 481 (116) n.a.
Corporate and Other (152) (360) 137 (328) (249) (24)
Inter-segment profit eliminations 18 (68) n.a. (106) (129) 22
Total 1,561 1,134 (27) 1,379 1,489 8
Property, plant and equipment
Exploration & Production 5,406 5,076 (6) 5,329 5,228 (2)
Refining & Marketing including Retail 4,938 4,943 0 5,582 6,069 9
Corporate and Other 360 254 (29) 1,418 1,385 (2)
Inter-segment assets eliminations - - n.a. (313) (398) 27
Total 10,704 10,273 (4) 12,016 12,284 2
INA, d.d. INA GROUP
Ch. % Ch. %
* EBITDA = EBIT + Depreciation, restatement of comparable previous periods was made – see on page 10
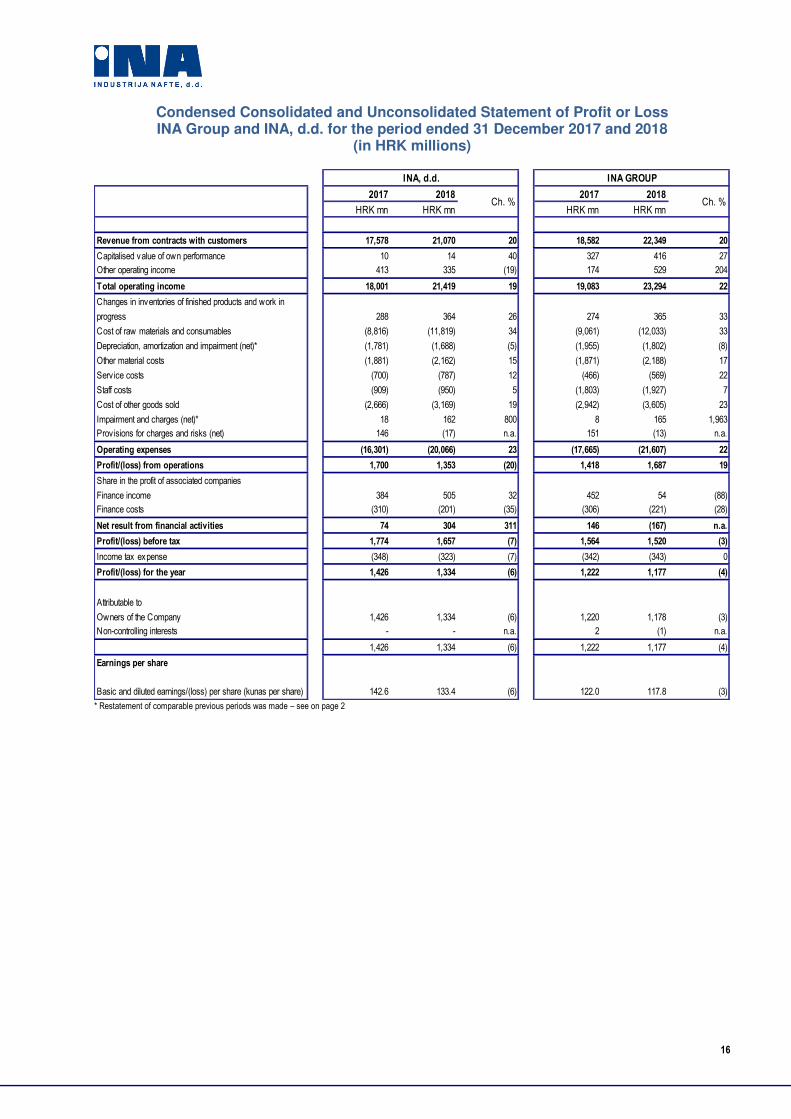
16
Condensed Consolidated and Unconsolidated Statement of Profit or Loss INA Group and INA, d.d. for the period ended 31 December 2017 and 2018
(in HRK millions)
2017 2018 2017 2018
HRK mn HRK mn HRK mn HRK mn
Revenue from contracts with customers 17,578 21,070 20 18,582 22,349 20
Capitalised value of own performance 10 14 40 327 416 27
Other operating income 413 335 (19) 174 529 204
Total operating income 18,001 21,419 19 19,083 23,294 22
Changes in inventories of finished products and work in
progress 288 364 26 274 365 33
Cost of raw materials and consumables (8,816) (11,819) 34 (9,061) (12,033) 33
Depreciation, amortization and impairment (net)* (1,781) (1,688) (5) (1,955) (1,802) (8)
Other material costs (1,881) (2,162) 15 (1,871) (2,188) 17
Serv ice costs (700) (787) 12 (466) (569) 22
Staff costs (909) (950) 5 (1,803) (1,927) 7
Cost of other goods sold (2,666) (3,169) 19 (2,942) (3,605) 23
Impairment and charges (net)* 18 162 800 8 165 1,963
Provisions for charges and risks (net) 146 (17) n.a. 151 (13) n.a.
Operating expenses (16,301) (20,066) 23 (17,665) (21,607) 22
Profit/(loss) from operations 1,700 1,353 (20) 1,418 1,687 19
Share in the profit of associated companies
Finance income 384 505 32 452 54 (88)
Finance costs (310) (201) (35) (306) (221) (28)
Net result from financial activities 74 304 311 146 (167) n.a.
Profit/(loss) before tax 1,774 1,657 (7) 1,564 1,520 (3)
Income tax expense (348) (323) (7) (342) (343) 0
Profit/(loss) for the year 1,426 1,334 (6) 1,222 1,177 (4)
Attributable to
Owners of the Company 1,426 1,334 (6) 1,220 1,178 (3)
Non-controlling interests - - n.a. 2 (1) n.a.
1,426 1,334 (6) 1,222 1,177 (4)
Earnings per share
Basic and diluted earnings/(loss) per share (kunas per share) 142.6 133.4 (6) 122.0 117.8 (3)
Ch. % Ch. %
INA, d.d. INA GROUP
* Restatement of comparable previous periods was made – see on page 2
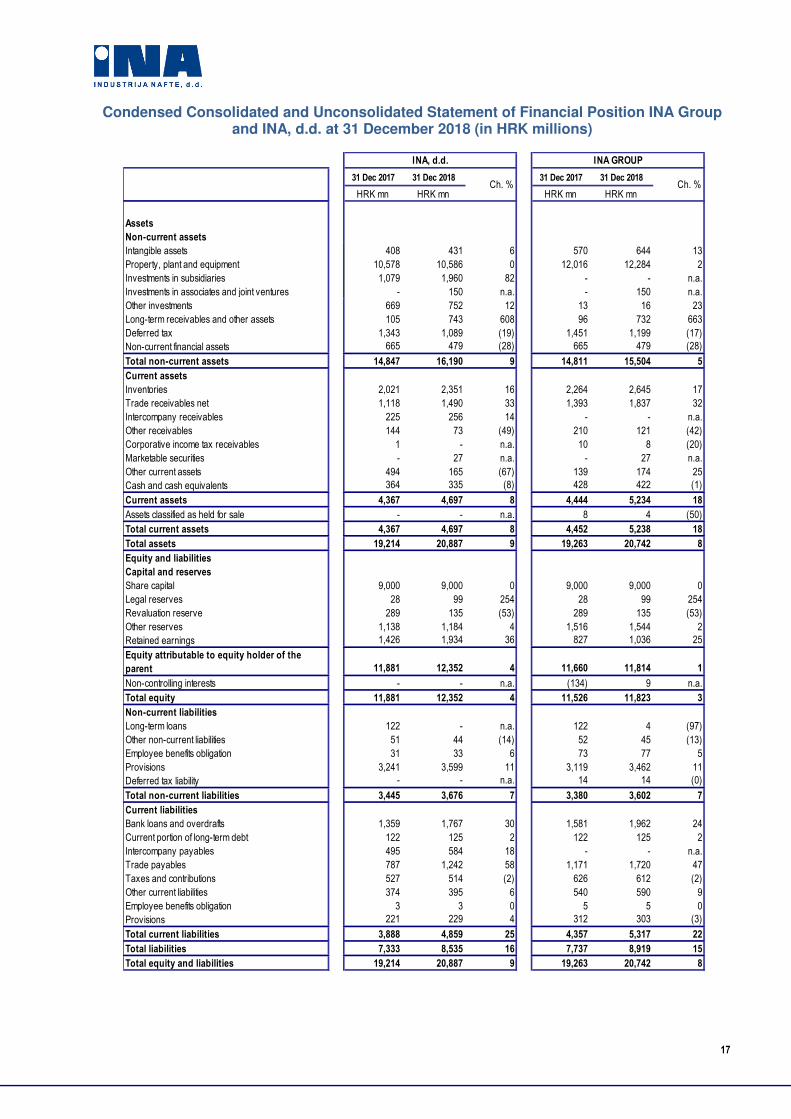
17
Condensed Consolidated and Unconsolidated Statement of Financial Position INA Group and INA, d.d. at 31 December 2018 (in HRK millions)
31 Dec 2017 31 Dec 2018 31 Dec 2017 31 Dec 2018
HRK mn HRK mn HRK mn HRK mn
Assets
Non-current assets
Intangible assets 408 431 6 570 644 13
Property, plant and equipment 10,578 10,586 0 12,016 12,284 2
Investments in subsidiaries 1,079 1,960 82 - - n.a.
Investments in associates and joint ventures - 150 n.a. - 150 n.a.
Other investments 669 752 12 13 16 23
Long-term receivables and other assets 105 743 608 96 732 663
Deferred tax 1,343 1,089 (19) 1,451 1,199 (17)
Non-current financial assets 665 479 (28) 665 479 (28)
Total non-current assets 14,847 16,190 9 14,811 15,504 5
Current assets
Inventories 2,021 2,351 16 2,264 2,645 17
Trade receivables net 1,118 1,490 33 1,393 1,837 32
Intercompany receivables 225 256 14 - - n.a.
Other receivables 144 73 (49) 210 121 (42)
Corporative income tax receivables 1 - n.a. 10 8 (20)
Marketable securities - 27 n.a. - 27 n.a.
Other current assets 494 165 (67) 139 174 25
Cash and cash equivalents 364 335 (8) 428 422 (1)
Current assets 4,367 4,697 8 4,444 5,234 18
Assets classified as held for sale - - n.a. 8 4 (50)
Total current assets 4,367 4,697 8 4,452 5,238 18
Total assets 19,214 20,887 9 19,263 20,742 8
Equity and liabilities
Capital and reserves
Share capital 9,000 9,000 0 9,000 9,000 0
Legal reserves 28 99 254 28 99 254
Revaluation reserve 289 135 (53) 289 135 (53)
Other reserves 1,138 1,184 4 1,516 1,544 2
Retained earnings 1,426 1,934 36 827 1,036 25
Equity attributable to equity holder of the
parent 11,881 12,352 4 11,660 11,814 1
Non-controlling interests - - n.a. (134) 9 n.a.
Total equity 11,881 12,352 4 11,526 11,823 3
Non-current liabilities
Long-term loans 122 - n.a. 122 4 (97)
Other non-current liabilities 51 44 (14) 52 45 (13)
Employee benefits obligation 31 33 6 73 77 5
Provisions 3,241 3,599 11 3,119 3,462 11
Deferred tax liability - - n.a. 14 14 (0)
Total non-current liabilities 3,445 3,676 7 3,380 3,602 7
Current liabilities
Bank loans and overdrafts 1,359 1,767 30 1,581 1,962 24
Current portion of long-term debt 122 125 2 122 125 2
Intercompany payables 495 584 18 - - n.a.
Trade payables 787 1,242 58 1,171 1,720 47
Taxes and contributions 527 514 (2) 626 612 (2)
Other current liabilities 374 395 6 540 590 9
Employee benefits obligation 3 3 0 5 5 0
Provisions 221 229 4 312 303 (3)
Total current liabilities 3,888 4,859 25 4,357 5,317 22
Total liabilities 7,333 8,535 16 7,737 8,919 15
Total equity and liabilities 19,214 20,887 9 19,263 20,742 8
Ch. % Ch. %
INA, d.d. INA GROUP
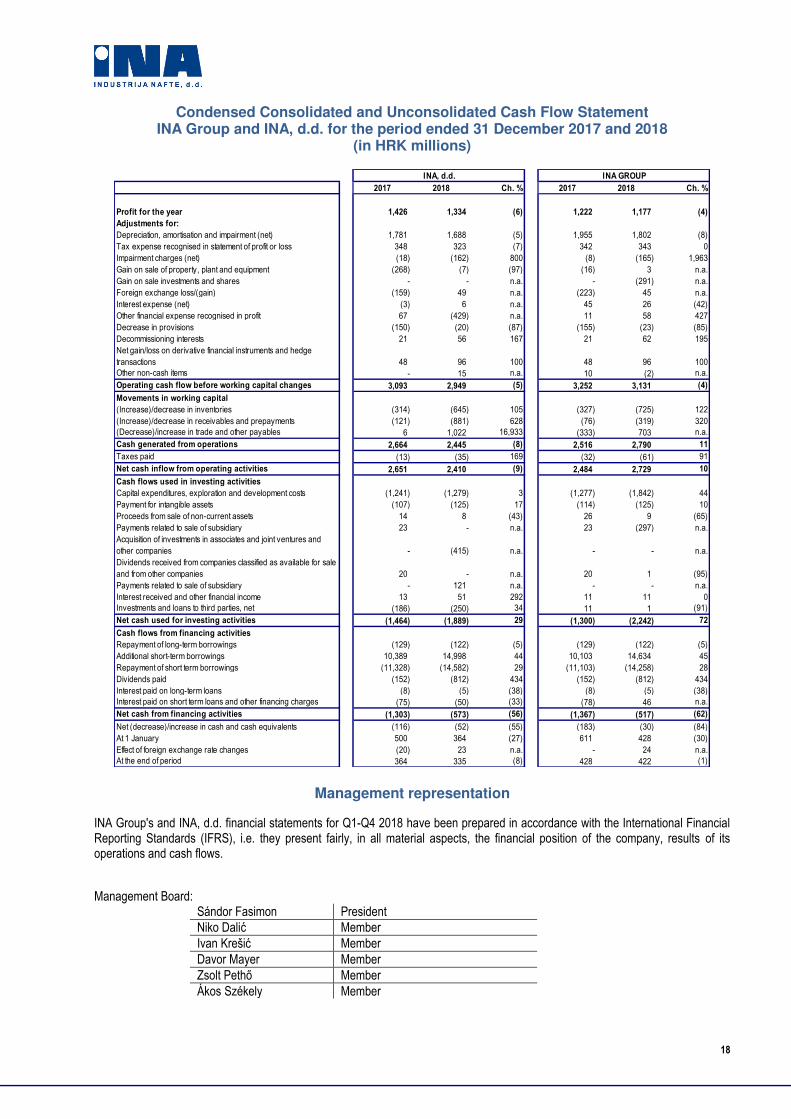
18
Condensed Consolidated and Unconsolidated Cash Flow Statement INA Group and INA, d.d. for the period ended 31 December 2017 and 2018
(in HRK millions)
2017 2018 Ch. % 2017 2018 Ch. %
Profit for the year 1,426 1,334 (6) 1,222 1,177 (4)
Adjustments for:
Depreciation, amortisation and impairment (net) 1,781 1,688 (5) 1,955 1,802 (8)
Tax expense recognised in statement of profit or loss 348 323 (7) 342 343 0
Impairment charges (net) (18) (162) 800 (8) (165) 1,963
Gain on sale of property, plant and equipment (268) (7) (97) (16) 3 n.a.
Gain on sale investments and shares - - n.a. - (291) n.a.
Foreign exchange loss/(gain) (159) 49 n.a. (223) 45 n.a.
Interest expense (net) (3) 6 n.a. 45 26 (42)
Other financial expense recognised in profit 67 (429) n.a. 11 58 427
Decrease in provisions (150) (20) (87) (155) (23) (85)
Decommissioning interests 21 56 167 21 62 195
Net gain/loss on derivative financial instruments and hedge
transactions 48 96 100 48 96 100
Other non-cash items - 15 n.a. 10 (2) n.a.
Operating cash flow before working capital changes 3,093 2,949 (5) 3,252 3,131 (4)
Movements in working capital
(Increase)/decrease in inventories (314) (645) 105 (327) (725) 122
(Increase)/decrease in receivables and prepayments (121) (881) 628 (76) (319) 320
(Decrease)/increase in trade and other payables 6 1,022 16,933 (333) 703 n.a.
Cash generated from operations 2,664 2,445 (8) 2,516 2,790 11
Taxes paid (13) (35) 169 (32) (61) 91
Net cash inflow from operating activities 2,651 2,410 (9) 2,484 2,729 10
Cash flows used in investing activities
Capital expenditures, exploration and development costs (1,241) (1,279) 3 (1,277) (1,842) 44
Payment for intangible assets (107) (125) 17 (114) (125) 10
Proceeds from sale of non-current assets 14 8 (43) 26 9 (65)
Payments related to sale of subsidiary 23 - n.a. 23 (297) n.a.
Acquisition of investments in associates and joint ventures and
other companies - (415) n.a. - - n.a.
Dividends received from companies classified as available for sale
and from other companies 20 - n.a. 20 1 (95)
Payments related to sale of subsidiary - 121 n.a. - - n.a.
Interest received and other financial income 13 51 292 11 11 0
Investments and loans to third parties, net (186) (250) 34 11 1 (91)
Net cash used for investing activities (1,464) (1,889) 29 (1,300) (2,242) 72
Cash flows from financing activities
Repayment of long-term borrowings (129) (122) (5) (129) (122) (5)
Additional short-term borrowings 10,389 14,998 44 10,103 14,634 45
Repayment of short term borrowings (11,328) (14,582) 29 (11,103) (14,258) 28
Dividends paid (152) (812) 434 (152) (812) 434
Interest paid on long-term loans (8) (5) (38) (8) (5) (38)
Interest paid on short term loans and other financing charges (75) (50) (33) (78) 46 n.a.
Net cash from financing activities (1,303) (573) (56) (1,367) (517) (62)
Net (decrease)/increase in cash and cash equivalents (116) (52) (55) (183) (30) (84)
At 1 January 500 364 (27) 611 428 (30)
Effect of foreign exchange rate changes (20) 23 n.a. - 24 n.a.
At the end of period 364 335 (8) 428 422 (1)
INA, d.d. INA GROUP
Management representation
INA Group's and INA, d.d. financial statements for Q1-Q4 2018 have been prepared in accordance with the International Financial Reporting Standards (IFRS), i.e. they present fairly, in all material aspects, the financial position of the company, results of its operations and cash flows.
Management Board: Sándor Fasimon President
Niko Dalić Member
Ivan Krešić Member
Davor Mayer Member
Zsolt Pethő Member
Ákos Székely Member