in volume 13 number 6 of 1982, we wrote: mesoscale, … · standing its relationship to meteorology...
TRANSCRIPT
STORMSCALE WEATHER (I!)
by Lee Edson
In Mosaic Volume 13 Number 6 of 1982, we wrote: "Mesoscale, or stormscale, weather systems are the ones
that do the most damage. Predicting them has been beyond reach." A decade later, after extraordinary and ingenious effort
and the best that technology can offer, prediction of these
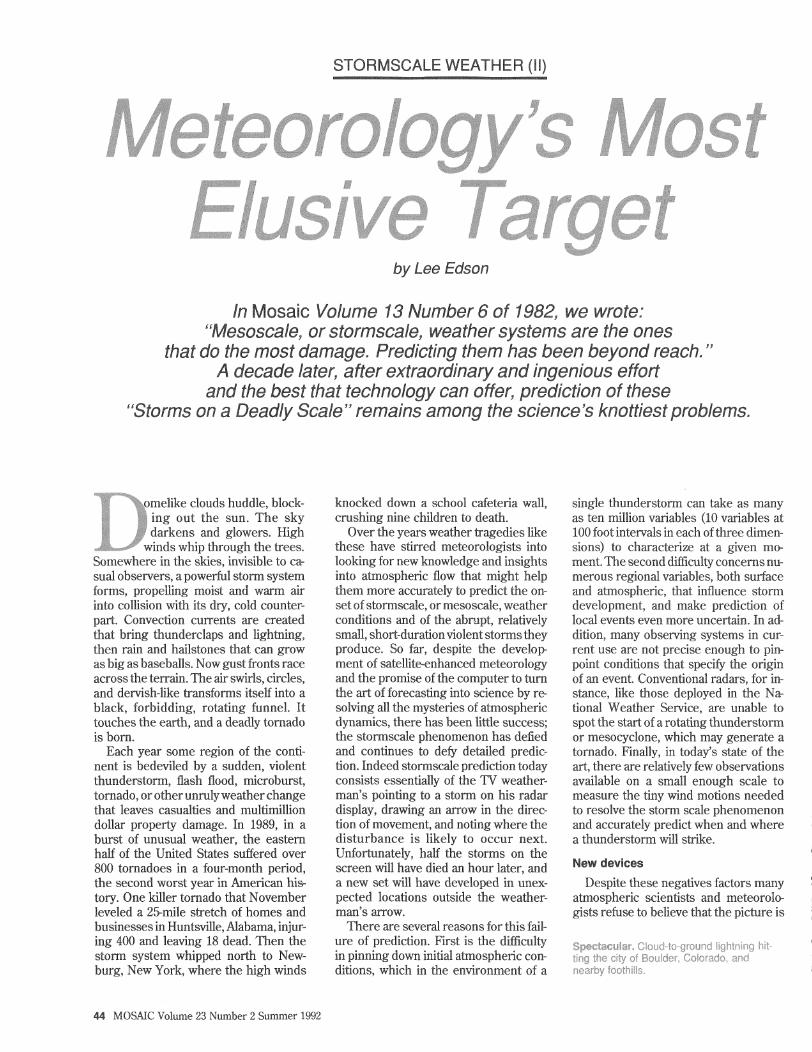
omelike clouds huddle, block-; ing out the sun. The sky
, darkens and glowers. High • winds whip through the trees.
Somewhere in the skies, invisible to casual observers, a powerful storm system forms, propelling moist and warm air into collision with its dry, cold counterpart Convection currents are created that bring thunderclaps and lightning, then rain and hailstones that can grow as big as baseballs. Now gust fronts race across the terrain* The air swirls, circles, and dervish-like transforms itself into a black, forbidding, rotating funnel. It touches the earth, and a deadly tornado is born.
Each year some region of the continent is bedeviled by a sudden, violent thunderstorm, flash flood, microburst, tornado, or other unruly weather change that leaves casualties and multimillion dollar property damage. In 1989, in a burst of unusual weather, the eastern half of the United States suffered over 800 tornadoes in a four-month period, the second worst year in American history. One killer tornado that November leveled a 25-mile stretch of homes and businesses in Huntsville, Alabama, injuring 400 and leaving 18 dead. Then the storm system whipped north to New-burg, New York, where the high winds
knocked down a school cafeteria wall, crashing nine children to death.
Over the years weather tragedies like these have stirred meteorologists into looking for new knowledge and insights into atmospheric flow that might help them more accurately to predict the onset of stormscale, or mesoscale, weather conditions and of the abrupt, relatively small, short-duration violent storms they produce. So far, despite the development of satellite-enhanced meteorology and the promise of the computer to turn the art of forecasting into science by resolving all the mysteries of atmospheric dynamics, there has been little success; the stormscale phenomenon has defied and continues to defy detailed prediction. Indeed stormscale prediction today consists essentially of the TV weatherman's pointing to a storm on his radar display, drawing an arrow in the direction of movement, and noting where the disturbance is likely to occur next. Unfortunately, half the storms on the screen will have died an hour later, and a new set will have developed in unexpected locations outside the weatherman's arrow.
There are several reasons for this failure of prediction. First is the difficulty in pinning down initial atmospheric conditions, which in the environment of a
single thunderstorm can take as many as ten million variables (10 variables at 100 foot intervals in each of three dimensions) to characterize at a given moment. The second difficulty concerns numerous regional variables, both surface and atmospheric, that influence storm development, and make prediction of local events even more uncertain. In addition, many observing systems in current use are not precise enough to pinpoint conditions that specify the origin of an event. Conventional radars, for instance, like those deployed in the National Weather Service, are unable to spot the start of a rotating thunderstorm or mesocyclone, which may generate a tornado. Finally, in today's state of the art, there are relatively few observations available on a small enough scale to measure the tiny wind motions needed to resolve the storm scale phenomenon and accurately predict when and where a thunderstorm will strike.
New dewices
Despite these negatives factors many atmospheric scientists and meteorologists refuse to believe that the picture is
44 MOSAIC Volume 23 Number 2 Summer 1992
"Storms on a Deadly Scale" remains among the sciences knottiest problems.
omelike clouds huddle, blocking out the sun. The sky darkens and glowers. High
winds whip through the trees.

#
as gloomy as portrayed. In rebuttal to Mark Twain's classic aphorism that we all talk about the weather but don't do anything about it, the modern meteorologist points to the recent development and application of new meteorological devices, many of them just coming on line, that are more versatile, sophisticated, and sensitive than the traditional barometers, thermometers, balloon-carrying rawinsondes, or other devices and instruments now in use.
Among the newer devices that are coming of age the most noteworthy is weather Doppler radar, which uses the well-known Dopple effect to measure wind speed in the radar beam direction with good accuracy and with high space and time resolution. Ground-based "wind profilers—a special kind of remote-sensor radar—also collect continuous data on the changes of wind speed and direction at closely spaced altitudes over depths of the atmosphere up to 15 kilometers or greater. Other sensitive instruments such as thermodynamic profilers provide information on the vertical distribution of temperature and moisture. The data from these sources are fed for analysis into faster and more powerful computers. Finally, aircraft equipped with Doppler radar and other devices are now available to bring observers in close communication with the center of storm-scale phenomena.
With such advanced instrumentations and with the help of improved mathematical models, the operational meteorologist can call up and diagnose the three dimensional dynamics of an approaching storm on a workstation screen and can predict its direction and evolution with greater accuracy and confidence than ever before. Although this is an advance of considerable significance, Kevin Droegemeier, deputy director of the Center for the Analysis and Prediction of Storms at the University of Oklahoma in Norman, the newest center of its kind, believes that the meteorologist may soon do even better. "Our mission is to develop techniques for the practical prediction of short-lived and small-scale weather events, especially those involving intense convection," Droegemeier says.
Edson is a freelance science writer in Stamford, Connecticut, who has written on many subjects for Mosaic. His most recent contribution was "B Physics and B Factories" in Volume 22 Number 2.
Convection, the rise of warm air currents through a colder environment, is of course the natural generator of thunderstorms. With new radar networks under development and with new mathematical models soon to be deployed, Droegemeier expects to be able to predict in close detail the location, intensity, and type of precipitation of an existing storm, from one to six hours hence, and to accurately forecast a new thunderstorm two hours in advance, in ample time to warn people to take necessary precautions. He also contends that he will be able to depict the evolution of existing storms three to six hours ahead.
If this new predictive capacity should come to pass, it will mark striking progress in the relatively young science of mesoscale meteorology, and in understanding its relationship to meteorology and the atmospheric sciences in general. As a discipline, meteorology dates back to the early 1900s when Vilhelm Bjerknes and the Norwegian school first described weather as a global battle between cold and warm fronts. Meteorologist LP. Richardson of Great Britain provided the mathematical basis of weather forecasting. In the forties, John von Neumann, the eminent mathematician, led meteorology into the world of computers and opened up a new vista for the growing science.
The introduction of radar in weather observation in the 1950s and the advent of globe-circling satellites in the 1960s contributed significantly to data acquisition. The meteorologist could add new data points to the conventional network of observation that led to the construction of weather maps and synoptic charts and that provided the basis for TV displays of global cloud and wind movements. Tracking the large-scale processes, however, could not reveal the site and timing of the next thunderstorm. That was left to the complexities of mesoscale analysis and prediction.
The stormscales
Mesoscale, or midscale, meteorology joined the parent discipline in the fifties and identified its turf as weather phenomena that are typically too small in extent (smaller than the State of Oklahoma, for instance) to be captured by the upper air and satellite soundings used routinely by the National Weather Service. It also covered phenomena that were too large to be adequately measured by line of sight observations of
events at a single fixed location. Today, meteorologists find it conven
ient to break down the mesoscale into three subscales: alpha (200 to 2,000 kilometers), beta (20 to 200) and gamma (2 to 20). Each domain is a specialty with its own niche of research and model building. The alpha scale, for instance, embraces frontal and land/sea breeze circulations that set the stage for thunderstorm development; the beta scale covers supercell thunderstorms and includes banded precipitation structures such as squall lines, and the gamma scale deals with shorter duration and smaller severe storms such as tornadoes, microbursts, and cloudbursts.
Meteorologists have recently recognized, however, that in predicting thunderstorms and related phenomena the scales are interlinked and work together. Even motions on very small scales, such as a single cloud that lasts for only an hour or so, can play a role in many large-scale weather events that transverse continents and oceans and may persist for days or weeks. Although the large-scale processes do not by themselves totally determine the initiation of a thunderstorm in Kansas, say, or Oklahoma, they do tend, according to the scientists, to establish the instabilities that are released sequentially to the smaller scale storms, while the latter feed back their own modifications to affect the largescale weather systems.
Meteorologist Edward Zipser of Texas A & M has studied multiple scales in weather and their linkages in the de velopment of severe storms in the Southwest On a typical day in April or early May, he notes, the synoptic scale (1000 km) weather predictions from global forecasters, usually two to three days in advance, reveal the first signs of approaching stormy weather in trough, which can bring contrasting dry and cool, and warm and wet air masses into closer contact and thus increase the buoyant instabilities. As the storm devel-ops, disturbances occur at the 100-kilometer scale on the dryline, a sharp, volatile boundary structure that arises when western desert air spilling over the Rockies meets moist Gulf of Mexico air moving north. Such a meeting may lead to the formation of a thunderstorm. Once thunderstorms form, radar can identify the regions where the air is starting to rotate on the scale of a few kilometers, a phenomena that is often the precursor to an intense 100-meter
46 MOSAIC Volume 23 Number 2 Summer 1992

gests that throughout the interplay the mesoscale's function is primarily that of setting the stage for a severe thunderstorm and often acting to initiate it. He theorizes that the synoptic and the me-soscale processes provide the buoyancy necessary to lift warm air into cooler regions and thus to create the deep moist convective state that is the key to weather phenomena ranging from lash foods at one end of the mesoscale to microbursts at the other end. Focusing on these convective events, and analyzing them in terms of the other scales,
scale tornado* As the storm reaches and passes max
imum intensity, the scale interactions tend to reverse. The storms expand their regions of influence, often forming long precipitating anvils. Individual storms tend to amalgamate, forming squall lines, or the circular arrays known as mesoscale convective systems. These storm activity centers then generate important changes in the larger synoptic and climate scales as they decay.
Charles Doswell of the National Severe Storms Laboratory in Norman, sug-
MOSAIC Volume 23 Number 2 Summer 1992 47

underlies much of the work of modem mesoscale meteorologists in their attempts to improve the accuracy of predicting local weather.
Consider lash loods, for instance. In recent years sudden devastating torrents of rain that overwhelm gully or slope and drown everything in sight have caused more deaths than tornadoes have. In 1976, as an example , the Big Thompson River near Loveland, Colorado, overflowed during a heavy storm, creating a flood that roared down the Big Thompson Canyon, killing 154 people. A year later a series of thunderstorms in Johnstown, Pennsylvania dropped 10 inches of rain in a small region of the Conemaugh River Basin, cre~ ating a flash flood that took 77 lives*
The conwectiwe system
How does one know where the heavy rainfall will concentrate and why, meteorologically, it should persist longer than normal? Can science quantify the rainfall in advance? To answer these questions scientists have looked to the recently discovered mesoscale convec-tive system, or MCS, a type of storm system which provides much of the
48 MOSAIC Volume 23 Number 2 Summer 1992
midwest's beneficial rainfall during the growing season. In its violent state it is well known for producing locally severe storms and accompanying flash floods.
The MCS takes many forms, but the largest and longest lived—indeed the Cadillac of the class—is the Mesoscale Convective Complex (MCC). It was first described by Robert Maddox of the National Oceanic and Atmospheric Administration in 1979 following a study of enhanced infrared photographs of clouds taken by geostationary satellites. Maddox discovered that the cloud tops towering above this type of storm could grow to form a very cold slab (32 degrees C below zero) spread over an area of a hundred thousand square kilometers and persisting for periods of more than twelve hours.
From this finding Maddox tracked the convective currents that initially rise from the sun-warmed mountain slopes to regions of thermodynamic instability that occur when warm air is topped by upper colder air. Maddox also studied the way in which the air circulation was maintained through the various phases of the life cycle of these storm systems as they advance into the adjacent plains. He found that the slow-moving multicellular nature of the mesoscale convective complex, and its relatively long duration, can process moisture into precipitation quite efficiently and can generate heavy rainfall over small areas. In the case of the Johnstown Flood, which was created by an MCC, thunderstorms formed and reformed along the periphery of the MCC, taking similar trajectories that led to the intense flooding.
Charles Chappell of the National Center for Atmospheric Research describes the basic process as the formation of a "quasi-stationary convective event" in which meteorological processes on several scales work together synergistically to keep the storm stationary for several hours. In many cases the parent mesoscale storm system will stand still while the individual convective cells that compose it may move in concert along similar paths and produce pulsating heavy rains. In other cases the entire storm may move away, only to have a new storm system reappear in the same spot, thus concentrating rainfall in a relatively small area.
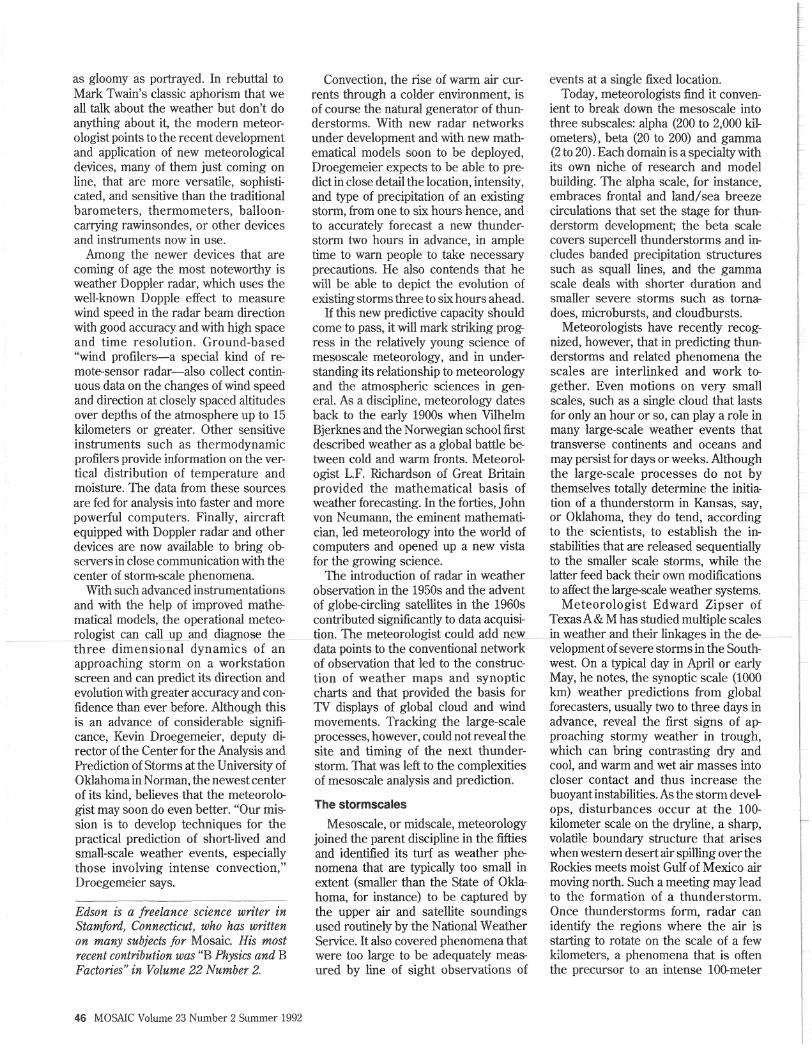
Da-lin Zhang of McGill University in Montreal and Michael Fritsch of Penn State University, at University Park, have been working on stimulating vari-
m.
ous flash flood events using computer models. In simulating the Johnstown flash flood they have been able to reproduce many of the main features of the storm, such as the mesoscale surface pressure patterns and the rainbands that
MOSAIC Volume 23 Number 2 Summer 1992 49
produced the heavy rainfall in the early part of the storm. Fritsch acknowledges, however, that their computer model does not yet have enough resolution to predict the specific time and intensity of the flood* 'The new models we are de-veloping will define the state of the atmosphere with sufficient resolution to be able to predict these small-scale events/' Fritsch says.
An integrated assault
Meanwhile, information on MCCS and their rainfall characteristics is accumulating. In 1985, in a landmark experiment sponsored by NSF and NOAA, known as PRE-STOEM (Preliminary Regional Experiment for Stormscale Operational and Research Meteorology), Bradley Smull and his colleagues at NOAA'S Me™ soscale Research Division in Boulder, Colorado, zeroed in on various aspects of the internal structure of the MCC that struck Kansas and Oklahoma that year. Using data from a special sounding balloon network, wind profilers, and both surface and airborne Doppler radar (the first time such a wide variety of instruments had been combined to study these complex storms), Smull found that

o z
ift^
Classic storms. A sine - -Florida; a squall line (bottom) at sunset at UKiahoma City, Uklahoma.
50 MOSAIC Volume 23 Number 2 Summer 1992

the mature MCC could comprise a veritable microcosm of contrasting environments and weather. These could range from supercell thunderstorms to autumn-like chilling rains, all apparently cooperating with one another to create a longer-lasting circulation than any single storm in the complex.
SmulFs finding suggests that MCCS may interact closely with synoptic-scale frontal boundaries along which they travel, alternating patterns of air low, temperature, and moisture to create the characteristic bands of precipitation of these storms. The flash flood potential of the MCC arises from a series of events occurring both within and around the storm. Early in the storm, for instance, moisture is confined to the lower level of the atmosphere. As the MCC develops its owe circulation, it modifies the entire environment of the storm. The low-level moist air moves upward, reaching the upper levels of the troposphere and embedding the component thunderstorms in an environment more conducive to the production of heavy rainfall
These new findings about MCCS and flash-flooding have already been utilized in operational meteorology. BillTogstad of the National Weather Service in Minneapolis was able to detect the coming of an MCC flash flood south of Minneapolis in August 1991 in sufficient time to issue a warning. The flash flood arrived on schedule and created heavy damage, but no lives were lost. Fatalities might have occurred without the warning.
Squall lines
In recent years scientists have attempted to look more closely at another less threatening flash-flood-producing storm system, the squall line or lines of thunderstorms. These occur throughout the tropics and midlatitudes and are often preceded by a sharp roll-like line of clouds followed by sudden wind gusts and a brief heavy downpour, which may produce as much as 30 millimeters of rain in 30 minutes. The heavy initial downpour is often followed by light to moderate rainfall from the anvil cloud that characteristically trails the squall front Flash floods may follow.
Not all squall lines produce flash flooding, however. Some squall line storms in middle latitudes, known as derechos {derecho is Spanish for straight ahead), are dangerous for other reasons. They can generate severe, wide-ranging surface winds of fifty to a hun
dred kilometers an hour that are long lived and can do considerable damage. Bob Maddox and his colleagues at the National Severe Storms laboratory have studied the wind patterns in derechos while Morris Weisman at NCAR in Boulder and William Colton at Colorado State University in Fort Collins have used computer simulations to investigate the related bow-shaped segments of convective lines known as bow echoes. They discovered that the most damaging winds usually occur when the systems encounter unusual amounts of low-level thermal instability. Instability, along with wind shear that increases in intensity with height, gives rise to the
• '< • Joseph Klemp (below) of . - ' , :ation (circular-ribbon arrows)
-. . > '.' flow; barbed lines, the cold air
bow echoes. The early detection of low-level jets of wind and upper troposphere polar jets may help forecasters in identifying atmospheric conditions that support the development of these strange wind phenomena.
In another investigation, Richard Johnson of Colorado State University, found a special pressure feature, called a wake low, in the trailing edge of a squall line storm. It produced light rainfall with strong surface winds. Johnson reports that strong low-level wind shear can occur in this region and pose potential threats for aircraft Indeed, this light rain regime is now regarded as being as dangerous to aircraft as heavy rain zones because of the high winds associated with it Other studies have also shown the existence of wake lows in the GuM of Mexico, where they have presented problems for offshore oil-drilling.
Tornadoes
Under certain conditions severe squall line thunderstorms can generate individual tornadoes, the most dramatic and most intensively studied mesoscale phenomenon of atmospheric power and violence. Tornadoes are usually associated with relatively more isolated but long-lived thunderstorms that are composed of a single giant cell or supercell This type of tomadic thunderstorm begins with a broad and intense updraft entering its southeast flank that rises vertically and then turns cyclonically,
MOSAIC Volume 23 Number 2 Summer 1992 51
that is, counterclockwise, in the outflow region. Such a storm frequently harbors a mesocyclone, the precursor of the spiralling tornado. Hailstones in such thunderstorms can grow as large as grapefruit
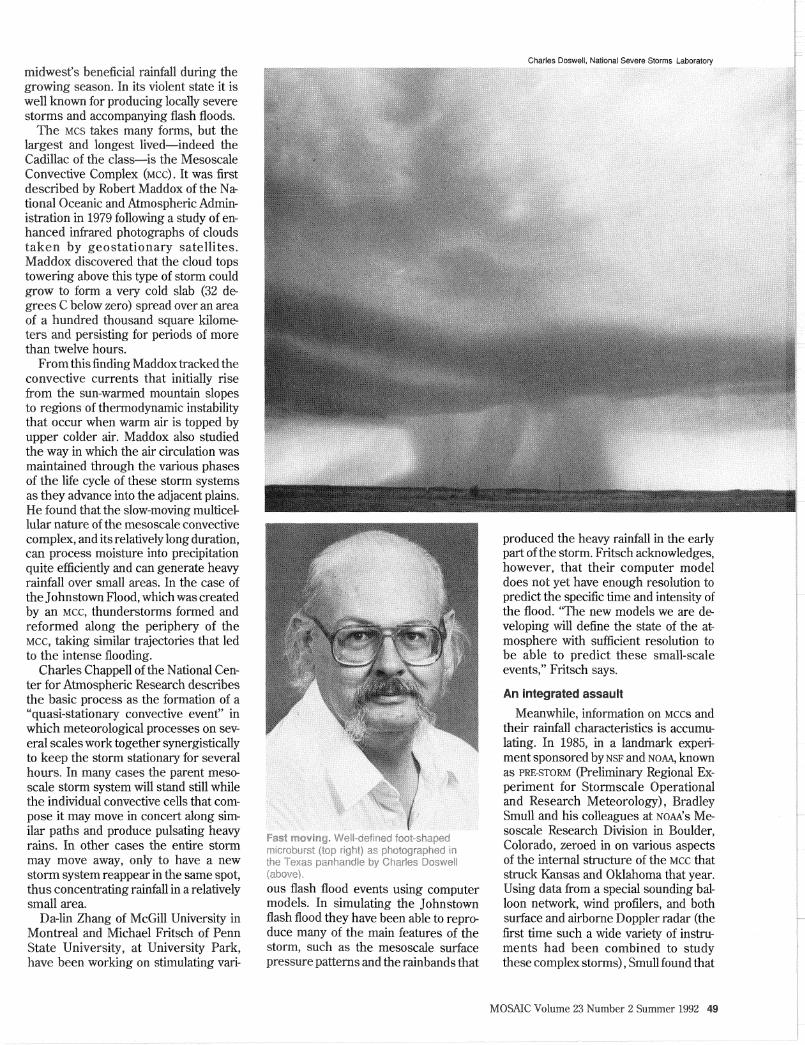
Just what fluid dynamic conditions are required for the formation of a tornado within a mesocyclone are still a matter of speculation. Careful 3 dimension numerical modeling of tornadoes, however, based on recent radar data and supplemented by observations and movies from storm intercept teams and tornado chasers, have provided the base for a general theory of the tornado mechanism. According to tornado modeling specialists Joe Klemp and Rich Rotunno of NCAR, the wind shear in the tornado-producing supercell storm sets up forces that result in the formation of narrow tubes of spiralling air, or vortices. These vortices are embedded in the shear and run horizontally through the storm between the various layers of air. Like a string of paddle wheels in a stream, the vortices turn faster as the wind whips up speed, causing some of them to tilt upward into the updraft at the center of the storm and to form two vertical vortices, one rotating and the other counterrotating.
As more air is drawn inward and the storm becomes more concentrated, the whole system starts rotating faster, like ice skaters drawing their arms closer to their bodies to achieve greater spin. The air motion is so rapid that a mesocyclone is formed that can spin as fast as 60 miles an hour. Decending through the cloud base as it grows, the mesocyclone brings with it a rainfree rotating wall cloud. This is what makes the mesocyclone visible. If the wind shear is weak and high-energy surface air runs out, the storm will simply dissipate and the wall cloud attached to it will die without ever forming a tornado. If the shear is strong and the storm continues to feed on high-energy surface air, however, a small column of air ahead of a strong downdraft may start rotating along the edge of the wall cloud and eventually spin off, forming a classic funnel-shaped tornado.
Under some circumstances the entire wall cloud may be swiftly transformed into a truly gigantic tornado, which can take an entire town by surprise. On April 10, 1979, a towering thunderstorm extending over 15 kilometers high produced one of the largest tornadoes ever sighted. It touched down in Wichita
Falls, Texas, where 60 people were killed before the storm subsided.
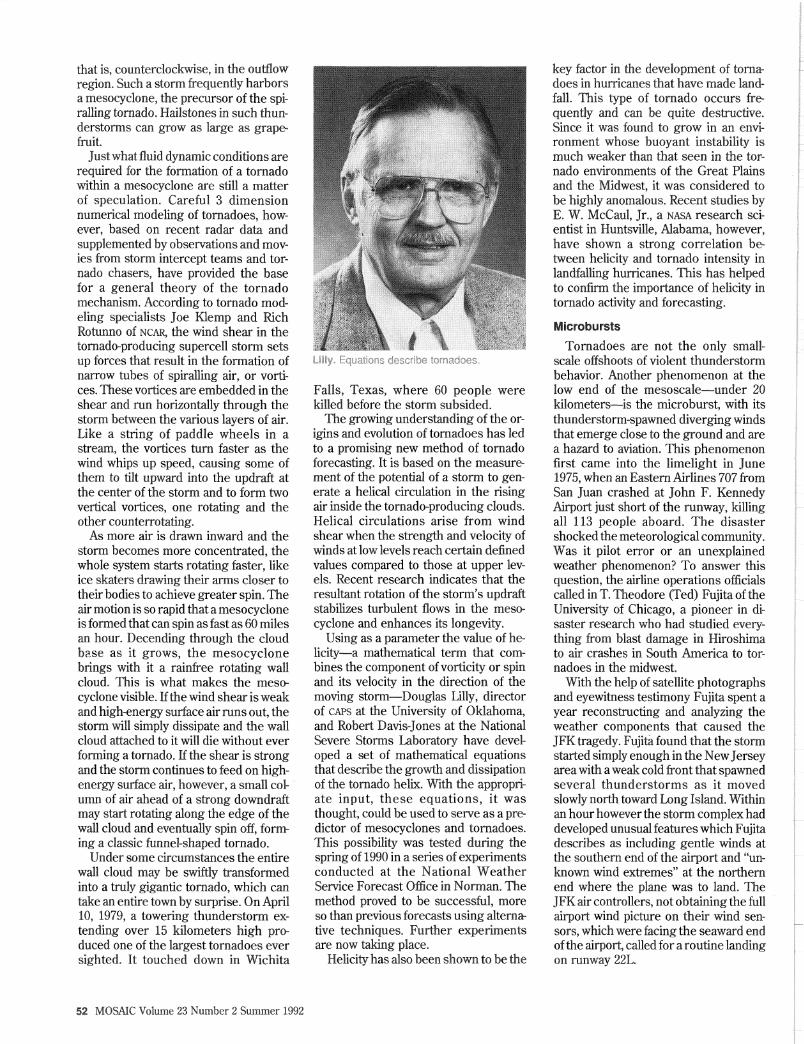
The growing understanding of the origins and evolution of tornadoes has led to a promising new method of tornado forecasting. It is based on the measure ment of the potential of a storm to generate a helical circulation in the rising air inside the tornado-producing clouds. Helical circulations arise from wind shear when the strength and velocity of winds at low levels reach certain delned values compared to those at upper levels. Recent research indicates that the resultant rotation of the storm's updraft stabilizes turbulent flows in the mesocyclone and enhances its longevity.
Using as a parameter the value of he-licity—a mathematical term that combines the component of vorticity or spin and its velocity in the direction of the moving storm—Douglas Lilly, director of CAPS at the University of Oklahoma, and Robert Davis-Jones at the National Severe Storms Laboratory have developed a set of mathematical equations that describe the growth and dissipation of the tornado helix. With the appropri-ate input, these equations, it was thought, could be used to serve as a predictor of mesocyclones and tornadoes. This possibility was tested during the spring of 1990 in a series of experiments conducted at the National Weather Service Forecast Office in Norman. The method proved to be successful, more so than previous forecasts using alternative techniques. Further experiments are now taking place.
Helicity has also been shown to be the
key factor in the development of tornadoes in hurricanes that have made landfall This type of tornado occurs fre quently and can be quite destructive. Since it was found to grow in an environment whose buoyant instability is much weaker than that seen in the tornado environments of the Great Plains and the Midwest, it was considered to be highly anomalous. Recent studies by E. W. McCaul, Jr., a NASA research scientist in Huntsville, Alabama, however, have shown a strong correlation b e tween helicity and tornado intensity in landfalling hurricanes. This has helped to confirm the importance of helicity in tornado activity and forecasting.
Microbursts
Tornadoes are not the only small-scale offshoots of violent thunderstorm behavior. Another phenomenon at the low end of the mesoscale—under 20 kilometers—is the microburst, with its thunderstorm-spawned diverging winds that emerge close to the ground and are a hazard to aviation. This phenomenon first came into the limelight in June 1975, when an Eastern Airlines 707 from San Juan crashed at John F. Kennedy Airport just short of the runway, killing all 113 people aboard. The disaster shocked the meteorological community. Was it pilot error or an unexplained weather phenomenon? To answer this question, the airline operations officials called in T. Theodore (Ted) Fujita of the University of Chicago, a pioneer in disaster research who had studied everything from blast damage in Hiroshima to air crashes in South America to tornadoes in the midwest
With the help of satellite photographs and eyewitness testimony Fujita spent a year reconstructing and analyzing the weather components that caused the JFK tragedy. Fujita found that the storm started simply enough in the New Jersey area with a weak cold front that spawned several thunderstorms as it moved slowly north toward Long Island. Within an hour however the storm complex had developed unusual features which Fujita describes as including gentle winds at the southern end of the airport and "unknown wind extremes" at the northern end where the plane was to land. The JFK air controllers, not obtaining the full airport wind picture on their wind sensors, which were facing the seaward end of the airport, called for a routine landing on runway 22L
52 MOSAIC Volume 23 Number 2 Summer 1992
This was an appropriate decision. Indeed, during the twenty-two minutes prior to the accident 12 airplanes made successful approaches along runway 22L A number of the pilots detected a wind problem on landing, but only a few admitted later that they thought it was serious enough to report it to the tower. They all landed without incident. Not so with flight 66, Eastern's thirteenth flight of the day.
As the ill-fated plane approached the runway, the pilot had no inkling that the winds above his landing area were joining together to create a huge downdraft, a rash of air to the ground that spreads like water over a hosed driveway. His instruments reported only a head wind at 500 feet above the runway and a light thunderstorm moving in. As with the earlier flights, this seemed not especially worrisome.
But minutes later as the 707 trimmed its speed for normal touchdown, the plane suddenly experienced a doubling of its sinking speed. The evidence indicates that the pilot saw a sudden increase in lift and air speed on his ap-proach and, never realizing it was due to head winds caused by the outflow from the downdraft, responded by reducing his engine power. Once the plane passed the center of the down-draft, however, the head wind became an equally strong tail wind. The extra air speed and lift disappeared and the plane sank. The pilot was unable to compensate for the sudden loss of speed and altitude by boosting the engines or taking other measures and the plane stalled and crashed, killing all aboard.
Fujita found that the wind shear— rapid changes in horizontal wind speed and direction—experienced by the aircraft as it crossed the center of the down-draft was "spectacular." And when it was combined with the effects of air rushing downward, the effect produced was far beyond the usual intensity of down-drafts. Concluding that it was a hitherto unreported hazardous weather event of great severity, he invented a new word for it: downburst. This phenomenon now embraces microbursts (four kilometers across and smaller) and macro-bursts (larger than four kilometers.) Downbursts are characterized on a radar screen by distinctively shaped echoes known as spearhead echoes.
Fujita looked into the origins of two other major crashes in the late 1970s and again identified the culprit as the
downburst. These findings provoked controversy and some skepticism among meteorologists at first. Eventually they had a strong impact on U.S. aviation officials. The FAA, for instance, soon installed throughout the country more than 100 systems of low-level sensors at airports that were designed to detect evolving downburst cells. These sensors are currently being enhanced to detect microburst precursors that were able to evade the earlier detection systems. Some experts believe that airborne Doppler radars can provide better detection of wind shear. Such devices— which employ forward scanning to determine changes in wind velocity—are being developed for the FAA and NASA by several industrial laboratories.
In the mid-eighties, through the NSF-sponsored NCAR, the FAA established a Doppler weather radar program at Stapleton International Airport in Denver, which experiences many microbursts a year. The program was integrated with other instrumentation systems to provide automatic detection and warning of low-altitude wind shear. A check of the program in 1988 showed that the integrated system could accurately provide critical weather information that could be relayed to the pilots by the controllers. As a result, the FAA has let contracts for 47 systems of this type at major U.S. airports.
Electrical activity
Meteorologists' focus on the mesa-scale convective system has also shed new light on a familiar characteristic of a severe storm, its electrical structure and lightening activity. For one thing, scientists have found that lightening is not a simple electrical dipole arc between cloud and earth or between cloud and cloud, but is much more complicated. A lightening discharge, for instance, may be affected by the internal wind in the core of the storm, by the collisions of raindrops in the region, and by the activity of the convective cells in the storm. These forces can affect the frequency and polarity of the strikes to ground and contribute to their danger.
Interestingly, lightening potential may be dangerous even if no thunderstorm is present An unusual instance of this occurred in March 1987 when an Atlas/Centaur space vehicle carrying a naval communications satellite was launched from Cape Canaveral A minute after launch it was unexpectedly
struck by a series of lightening bolts that seemed to come from nowhere. The electric current of the bolts caused a false signal that created havoc in the spacecraft's digital computer, which led to the vehicle's breakup.
In the subsequent investigation, NASA scientists revealed that even though there were no lightening discharges prior to the time of launch, the clouds were charged to a surprisingly high degree. What seems to have happened is that the vehicle itself triggered a lightening discharge, which developed into several follow up cloud-to-ground flashes. The lightening traversed the entire length of the vehicle and exited through the rocket plume.
This unusual accident caused NASA to reevaluate its method of assessment of weather conditions prior to launch. The event also confirmed something the aviation industry had known—namely, that a vehicle can trigger lightening, not merely intercept it during a storm. Moreover it emphasized that these hazards can occur under weather conditions thought to be safe. This in turn has led the industry to provide special protective measures for aircraft and to pay increased attention to nonthunderstorm but hazardous flying weather.
Steven Rutledge at Colorado State University and Donald R. MacGorman at the National Severe Storms Laboratory, have studied further details of the electrification process in thunderstorms, beginning with the 1985 Oklahoma-Kansas PRESTORM project Using a unique network of lightening recorders, they found that some storms are so highly electrified that they were able to count 26,000 lightening strikes to ground in eight hours in northern Texas and Oklahoma. One of the mysteries has been that lightening flashes between earth and clouds can reverse polarities, going from the normal negative cloud-to-earth flash to the unusual positive cloud-to-earth flash. The reasons for this continue to be studied.
In 1988 Rutledge and Earle Williams of MIT also began a two-year investigation of tropical thunderstorms that have provided some additional insights into the relation between the mesoscale convective system and the electric field. Known as DUNDEE (Down Under Doppler and Electricity Experiment) the project took place at the northern tip of Australia in the vicinity of Darwin. This area experiences some of the world's heavi-
MOSAIC Volume 23 Number 2 Summer 1992 53

est rainfall attended by high incidences of lightening*
Rutledge and Williams discovered, among other things, that lightening flashes over land in the Darwin vicinity occur ten times as often as over the surrounding Indian Ocean but that no single parameter like cloud height can be used to predict the flash rate, at least in the tropical monsoon area. They also found predominantly positive cloud-to-ground flash polarity in the stratiform regions of the tropical cloud clusters. They suggest that the reversal of polarity in this case may be explained by the presence of a strong mesoscale updraft and associated generation of charge differences by microphysical processes arising from a mix of water and ice. Finally, Rutledge and Williams note that the frequency of lightening flashes is directly related to the convective vigor of the storm system measured by its convective available potential energy (CAPE) .
Insight to application
Can these new discoveries and insights concerning mesoscale weather phenomena be used to improve the prediction of thunderstorms? To what extent will the new observational systems being planned augment the process? The answer to the second question is that they can to quite an extent, it seems. For one thing, meteorologists no longer will have to depend on scattered data collected from grid points that are tens or even hundreds of kilometers apart. A national program (jointly sponsored by the Department of Commerce, the Department of Defense, and the Department of Transportation) and known as Nexrad (next generation radar) is under-way to provide the first comprehensive high-resolution, on-line Doppler radar network in the United States. Planned for completion in the mid-1990s it will cover the nation, utilizing an assembly of 175 Doppler radars that will provide some of the data at spacings (down to a few kilometers in critical areas near cities and airports) required to analyze and predict thunderstorms and other mesoscale phenomena.
Each Doppler radar station will be designed to incorporate three components: the familiar scanning radar dish in its radome, which collects and transmits the basic data—echo reflectivity (that is, power reflected by the storm), wind speed, and spectrum width; the radar product generator, which pro
cesses the data, and the principal user processor, the work station where they are converted into meteorological products and deployed for evaluation. Reflectivity data, for instance, are digested by the computer to bring forth hourly rainfall accumulation as well as such information as past storm tracks and future projections of storm motion, all digitized and visualized. The velocity data tells the meteorologist whether a mesocyclone and a tornado are a probable product. And the spectrum width provides information on the key elements of wind shear and turbulence in the area.
The first Nexrad station was placed in operation in 1990 near Oklahoma City. Hardly had the dish been set into scanning mode when radar reported winds moving toward the station on one side of the storm and away from it on the other—a sign of rotation in the storm. A tornado warning went out 19 minutes before the tornado became visible. When it touched down near the town of Laverae, it remained on the ground long enough to leave a swath of damage one mile wide and three miles long, but there were no casualties. "Our forecast was pretty good," says Ron Alberty, Director of Nexrad's Operational Support Facility, who notes that the national average lead time with the old conventional radar is only a few minutes, often zero. Then he adds: "But I think we can do even better." Interestingly, another tornado did strike the same day, the precursors of which were noted 24 minutes before touchdown. Elsewhere, out of range of the Nexrad station, four tornadoes ravaged Kansas and Oklahoma killing 17 people.
When Nexrad is fully operative (and that may take longer than expected b e cause of federal budget cuts), the radars will be supplemented by wind profilers located strategically in remote rural areas of the country, to avoid false r e flections from passing planes or other interference. Designed to detect the small changes in the index of refraction of the eddies moving with the wind, the wind profiler utilizes a pattern of radar pulses that are directed into the atmosphere on three fixed beams and in controlled sequence. The eddies scatter the energy, and the return signals are picked up by the wind profiler's receivers and translated into wind direction and speed.
Wind profilers were long used as research tools before they went into prac
tical operation in 1982. Since then they have been refined enough to measure the effect of wind eddies as gentle as those caused by a butterfly's wing. The new wind profiles—generated every ten minutes compared to the present twelve hours between successive releases of balloon-borne sondes—-will provide the detailed wind picture that has long been missing from weather data-collection. NOAA has established a demonstration network of wind profilers that will be used this year for further research and for testing operational concepts.
Models
Whether these additions are enough to significantly improve thunderstorm forecasts will depend ultimately on advances in numerical simulation models. These types of models are computer-generated, mathematical representations of the dynamics of weather as an atmospheric event proceeds into the future from an initial state as determined by observations. The future states are calculated by integrating over time the values in a grid of points in space.
The current thunderstorm models are simulation models that are generally inadequate for making the leap to forecasting because they are only designed to resolve a specific research problem and are often modified to accommodate the particular objective of the instigator. Moreover, some existing models utilize numerical solution techniques that do not work on the small scales needed for thunderstorm prediction. Even more importantly, they do not have the capability to continuously assimilate the necessary updated information from Doppler radars and wind profilers.
Model makers believe they can overcome some of these limitations in current simulation models by building into the models more accurate formulations of the physics of the storm and its environment The science of cloud physics, the science that addresses complex particle interactions within clouds, can tell the forecasters something of the potential structure and movement of the cloud over given regions and enable them to correlate this information with the intensity and direction of a storm over a given area.
Some progress with mesoscale predictive models has already been made. One such model, tested for its predictive value in microbursts, is a 3 dimension cloud model developed in 1986 by Jerry
54 MOSAIC Volume 23 Number 2 Summer 1992

Straka of the University of Oklahoma and John Anderson of the University of Wisconsin. In a program known as the Cooperative Httntsville Meteorological Experiment the scientists compared the model simulations with the actual atmospheric data from several thunderstorms in the Huntsville, Alabama re-gion during June and July of 1985. They concluded that if sufficiently dense surface and upper air data were put into the model, the evolution of the simulated storm appeared to be in good agreement with the real storm, thus opening up the possibility for the irst time of using a cloud model to detect the precursors of the microburst thunderstorm To test this prospect the FAA sent soundings on six storms to Straka, challenging him to identify the storm with the microburst. Straka was able to make the proper identification in each case.
Other models have also shown good potential for mesoscale prediction* The most widely used mesoscale model is the Penn State-NCAR model, which was developed 18 years ago by Tom Warner of Penn State and Rick Anthes of NCAR and has been continuously refined and
tested. Currently regarded as ideal for beta-scale studies, it is expected to be further modified for higher resolution prediction problems.
The CAPS model, now under design at the University of Oklahoma, has advantages of its own. It has a fully interactive menu-driven, window interface for monitoring the progress of the prediction as events unfold and allows insertion of new data as it becomes necessary.
To determine the thermodynamics of a storm system and for analyzing its three-dimensional structure, the CAPS model, like any other numerical model, requires data of a type that is not directly observable by the Doppler radar. These data include the wind velocity in three directions and the pressure distribution in the storm. A similar problem exists with the satellite system which measures the radiation leaving the tops of the clouds, from which temperature and water vapor can be inferred but fails to quantify moisture directly. The relevant data have to be deduced or retrieved by the computer and then assimilated, a process requiring considerable mathematical operation.
MOSAIC Volume 23 Number 2 Summer 1992 55
In the case of the CAPS model, the theoretical underpinnings for the assimilation of data were established by French and Soviet mathematicians and were translated into the connective storm environment by Douglas Lilly and Tzvi Gal-Chen at the University of Oklahoma and John Lewis at the National Severe Storms Laboratory. These scientists turned to a process in science of matching estimate and reality that goes back conceptually to the ancient Greeks. Today it is known in mathematics as control theory. It has been applied in fields as far ranging as cybernetics, ballistics, and biology and to such other problems as predicting the trajectory of Haley's comet
Control theory
The use of control theory in determining and optimizing the initial state of the atmosphere—a process known in meteorology as initialization—has intrigued a number of meteorological researchers. At the University of Oklahoma, Dr. Dawn Wolfsberg-Flicker, working with single Doppler radar observations, suggested using the so-called mathematical adjoint method to assess the consistency of prediction and observations. In this method two sets of equations—one for the observed variables of the storm over time and the other, its adjoint, for the predictive variables—are integrated over time and space and then matched, with changes made to bring the predicted values in line with the observed. The result is to produce a four-dimensional dynamic portrait of the changing atmosphere. Unfortunately, this adjoint method initially proved to be rather inefficient and expensive in terms of computer time. The reason: the large number (2,000) of repeated calculations required to retrieve and match the unobserved variables to real atmospheric data without error.
Juanzhen (Jenny) Sun of Lanzhou University in the People's Republic of China, now working with CAPS and NCAR in Boulder, improved on Wolfsberg-Flicker's formulation. Her strategy removes 75 percent of the error in the first 10 iterations and the balance of the error in 50 subsequent iterations.
Other computer model initialization strategies are under development. At Penn State, for example, Tom Warner, Nelson Seaman, and David Stouffer have concentrated on a mathematical technique known as the Newtonian Re
laxation Technique or colloquially among meteorologists as "nudging." This technique—which enables the me teorologist to modify predictions as new data appear—is advantageous for developing a four-dimensional data assimilation procedure suitable for short-term predictions. Indeed, Penn State's Michael Fritsch believes that this approach is "the one most likely to allow7
rapid progress toward a viable, short-term mesoscale forecasting system for aviation." Additional models, incorporating variations of this technique, are being developed at NOAA, NCAR, and at several universities, notably Colorado State, Drexel University, University of Wisconsin, Florida State, and the University of Illinois.
All these advances on various fronts have created rising expectations among many mesoscale meteorologists that they are on the threshold of removing many of the barriers to accurate stormscale prediction. More conservative weather scientists, however, are less sanguine, especially in calculating how long it will take. They are in good historical company. Arnold Sommerfeld, the great German theoretical physicist, for instance, once said wistfully that b e fore he died he hoped to understand two phenomena: quantum dynamics and turbulence. Sommerfeld died in 1924. Just before his death he was very close to understanding quantum dynamics, but admitted sadly that turbulence was still an impenetrable mystery.
Today, almost 70 years later, quantum dynamics has experienced such extraordinary progress that physicists routinely use the theory. Turbulence, on the other hand, is still an enigma wrapped in the elusive disorderly nonlinear behavior of the atmosphere that continues to defy mathematical analysis and remains a major obstacle to weather predictions. Nonetheless, the rapid progress in mesoscale meteorology during the last few years, combined with the advances expected in the next decade, offer atmospheric scientists renewed confidence in the future. They are convinced that for the first time they are possessed of the tools likely to lead to the age of accurate thunderstorm prediction. •
The National Science Foundation has contributed to the support of the research described in this article principally through several programs in its Division of Atmospheric Sciences.
56 MOSAIC Volume 23 Number 2 Summer 1992