in vivo evidence of intestinal lead dissolution from lead dioxide (pbo ... · pbo 2 adsorption and...
TRANSCRIPT
1
In vivo evidence of intestinal lead dissolution from lead dioxide (PbO2) nanoparticles and
resulting bioaccumulation and toxicity in medaka fish
Ding-Quan Ng1,2,#
, Yao Chu1,#
, Shih-Wei Tan1, Shan-Li Wang
1, Yi-Pin Lin
3, -
4,
Yun-Liang Soo4, Yen-Fang Song
4 and Pei-Jen Chen
1, *
Submitted to Environmental Science Nano
Supplementary Materials content 12 pages:
Table A1 and Fig. A1-Fig. A10
Electronic Supplementary Material (ESI) for Environmental Science: Nano.This journal is © The Royal Society of Chemistry 2018
2
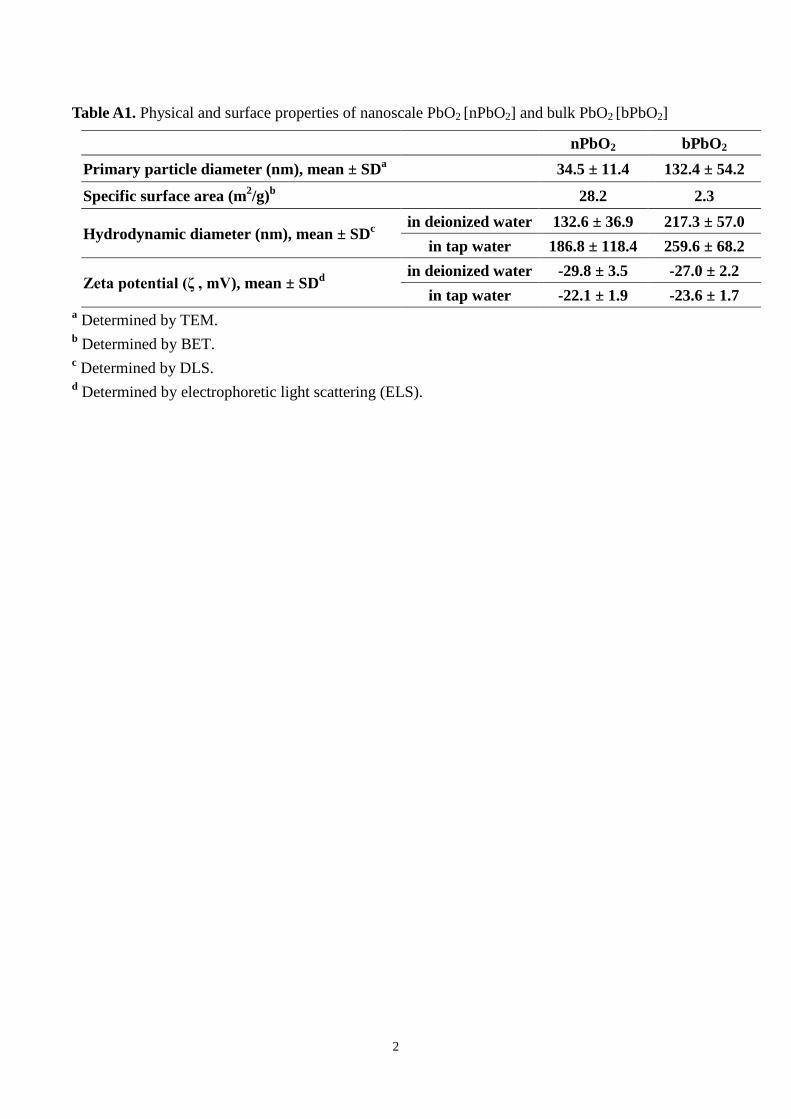
Table A1. Physical and surface properties of nanoscale PbO2 [nPbO2] and bulk PbO2 [bPbO2]
nPbO2 bPbO2
Primary particle diameter (nm), mean ± SDa 34.5 ± 11.4 132.4 ± 54.2
Specific surface area (m2/g)
b 28.2 2.3
Hydrodynamic diameter (nm), mean ± SDc
in deionized water 132.6 ± 36.9 217.3 ± 57.0
in tap water 186.8 ± 118.4 259.6 ± 68.2
Zeta potential (ζ , mV), mean ± SDd
in deionized water -29.8 ± 3.5 -27.0 ± 2.2
in tap water -22.1 ± 1.9 -23.6 ± 1.7 a Determined by TEM.
b Determined by BET.
c Determined by DLS.
d Determined by electrophoretic light scattering (ELS).
3
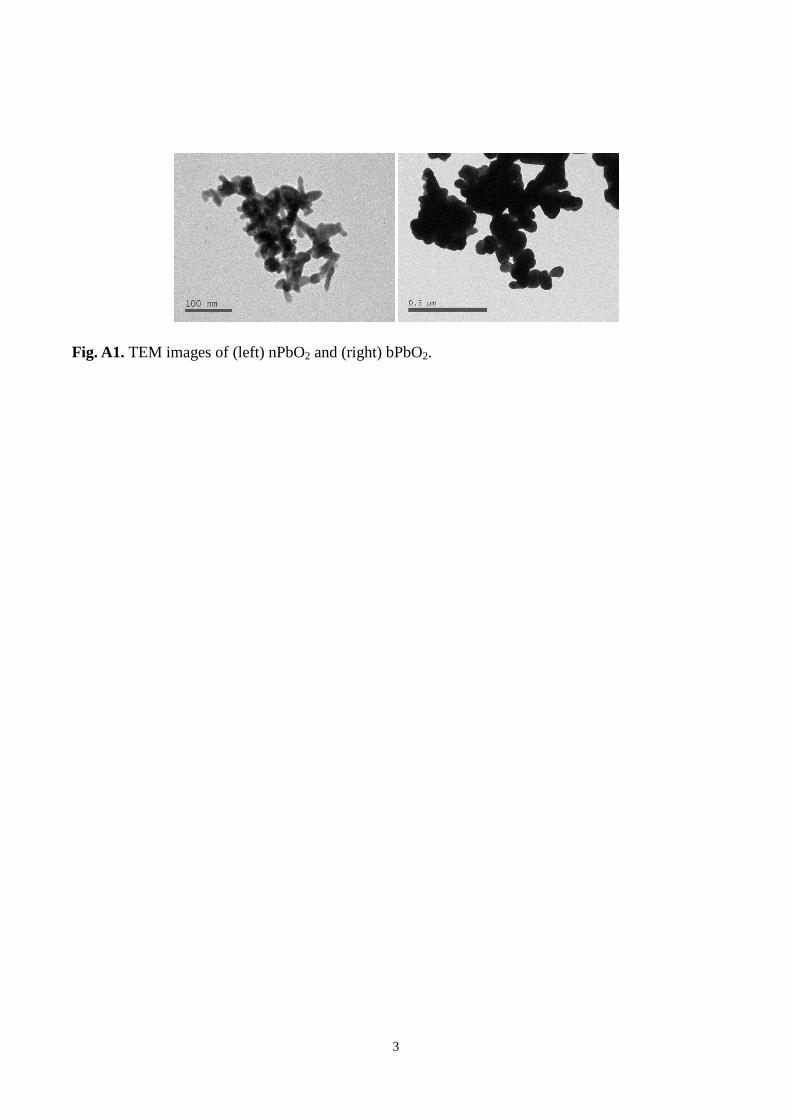
Fig. A1. TEM images of (left) nPbO2 and (right) bPbO2.
4
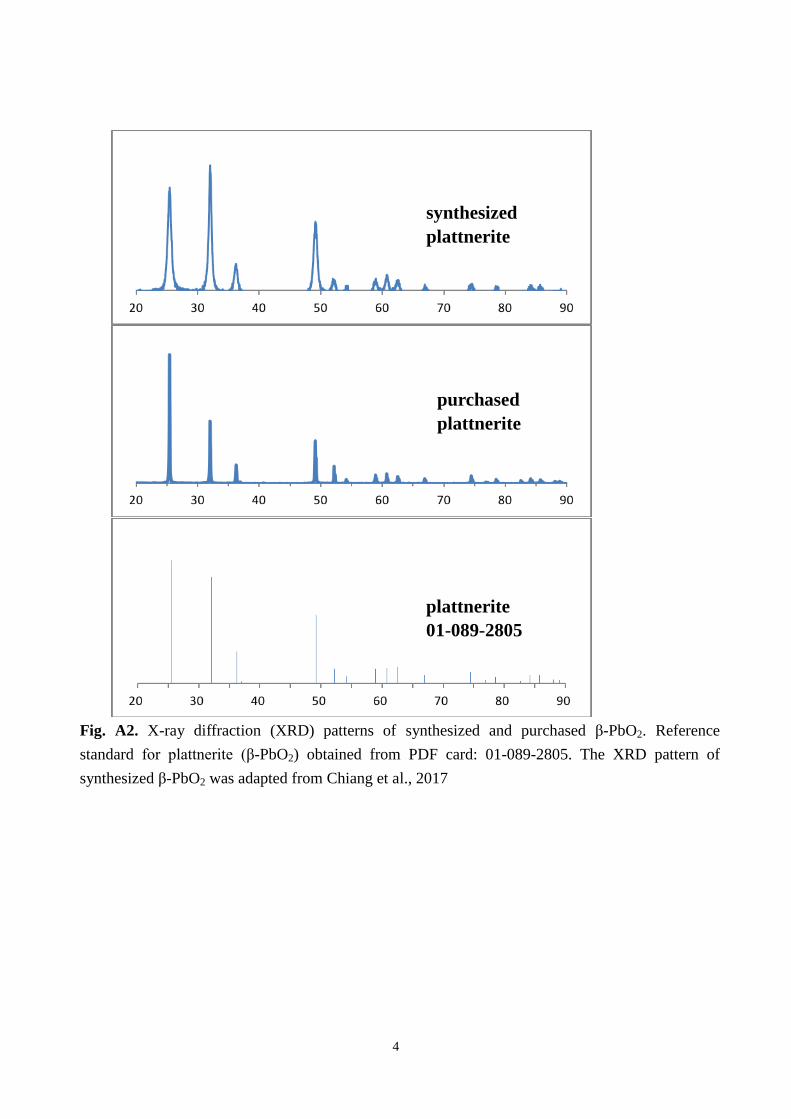
Fig. A2. X-ray diffraction (XRD) patterns of synthesized and purchased β-PbO2. Reference
standard for pl tt er te (β-PbO2) obtained from PDF card: 01-089-2805. The XRD pattern of
synthesized β-PbO2 was adapted from Chiang et al., 2017
synthesized
plattnerite
plattnerite
01-089-2805
purchased
plattnerite

5
Fig. A3. Pb L3 edge XANES images of different Pb-containing minerals. nPbO2 were
laboratory-synthesized and bPbO2 commercially purchased.
6
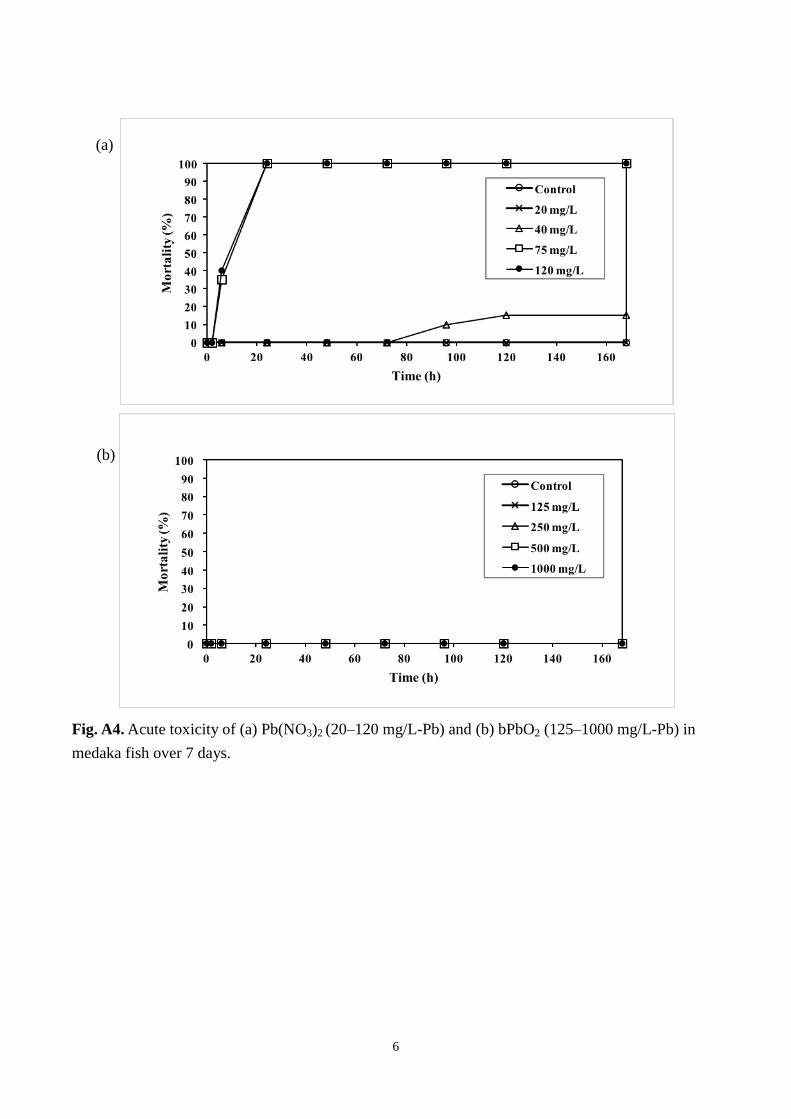
Fig. A4. Acute toxicity of (a) Pb(NO3)2 (20–120 mg/L-Pb) and (b) bPbO2 (125–1000 mg/L-Pb) in
medaka fish over 7 days.
(a)
(b)

7
(a)
(b)
Fig. A5. Dynamic changes in (a) size or (b) sedimentation rates of nPbO2 and bPbO2 particles (20
mg/L) in tap water (TW) and intestinal extract (IE). Sedimentation rate was determined as the
absorbance of nPbO2 at 300 nm in suspension at each time normalized by its initial absorbance at
time 0. Data are meanSD (n=3).
8
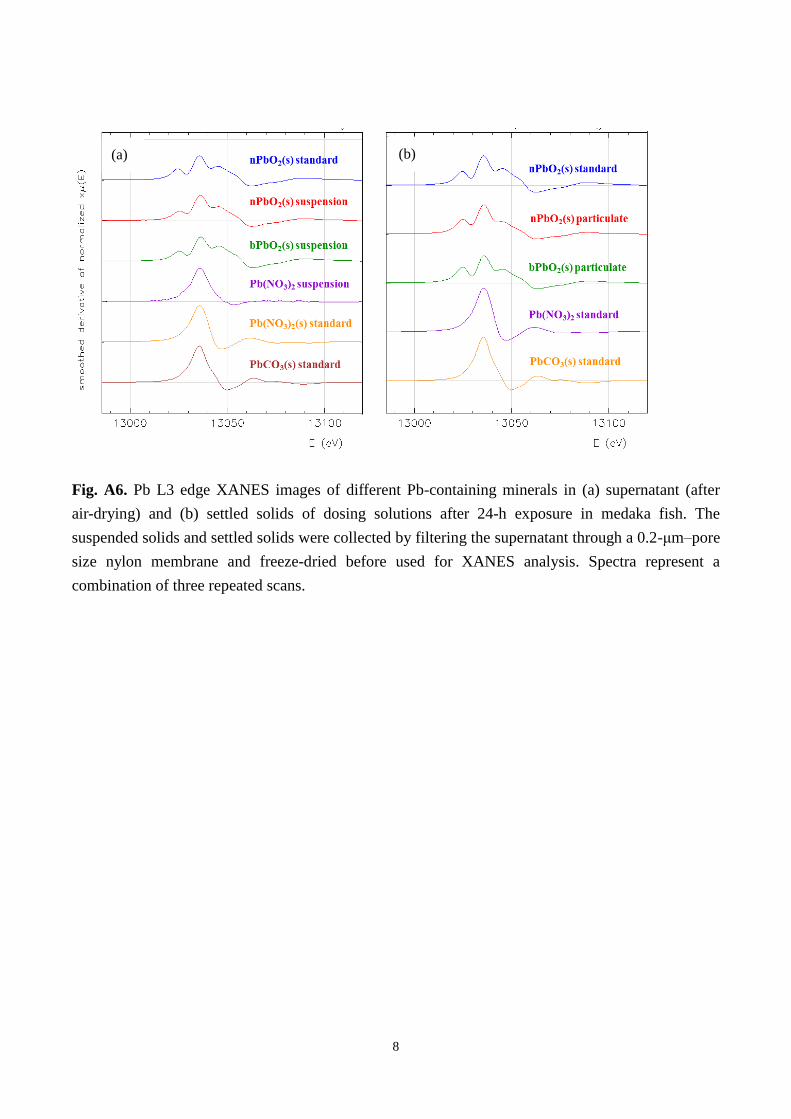
Fig. A6. Pb L3 edge XANES images of different Pb-containing minerals in (a) supernatant (after
air-drying) and (b) settled solids of dosing solutions after 24-h exposure in medaka fish. The
suspended solids and settled solids were collected by filtering the supernatant through a 0.2-μm–pore
size nylon membrane and freeze-dried before used for XANES analysis. Spectra represent a
combination of three repeated scans.
(a) (b)
9
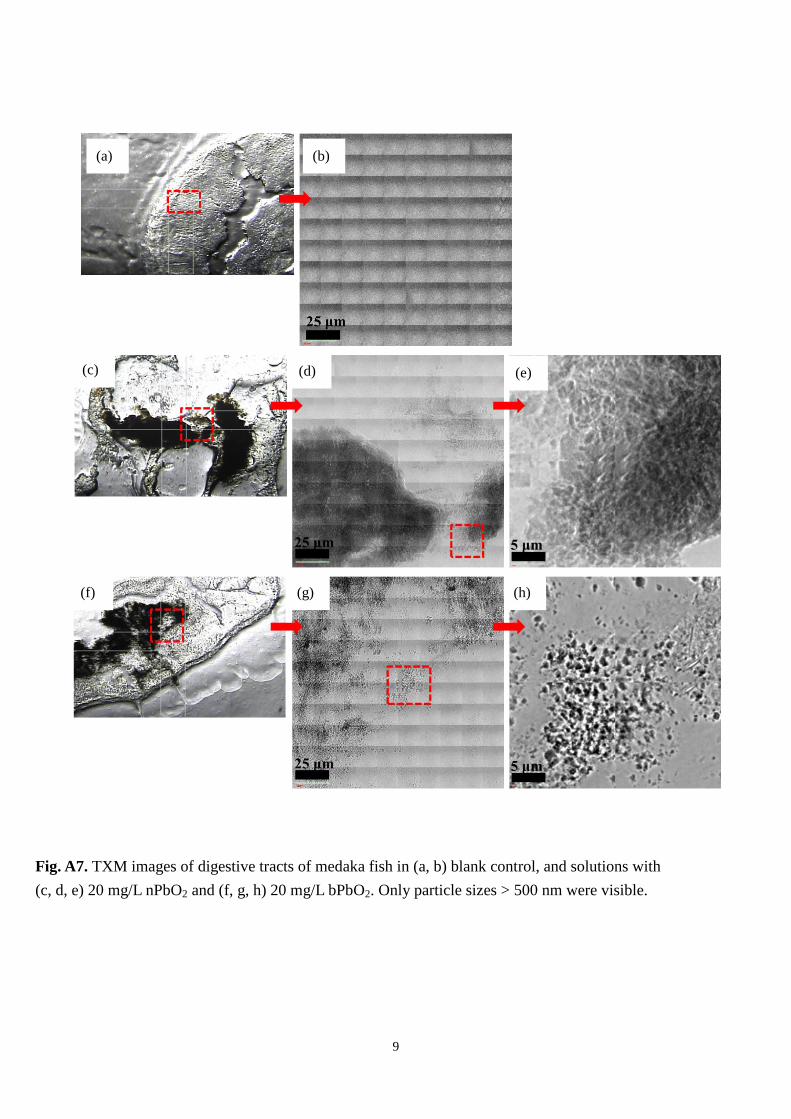
Fig. A7. TXM images of digestive tracts of medaka fish in (a, b) blank control, and solutions with
(c, d, e) 20 mg/L nPbO2 and (f, g, h) 20 mg/L bPbO2. Only particle sizes > 500 nm were visible.
(a) (b)
(c) (d) (e)
(f) (g) (h)
10
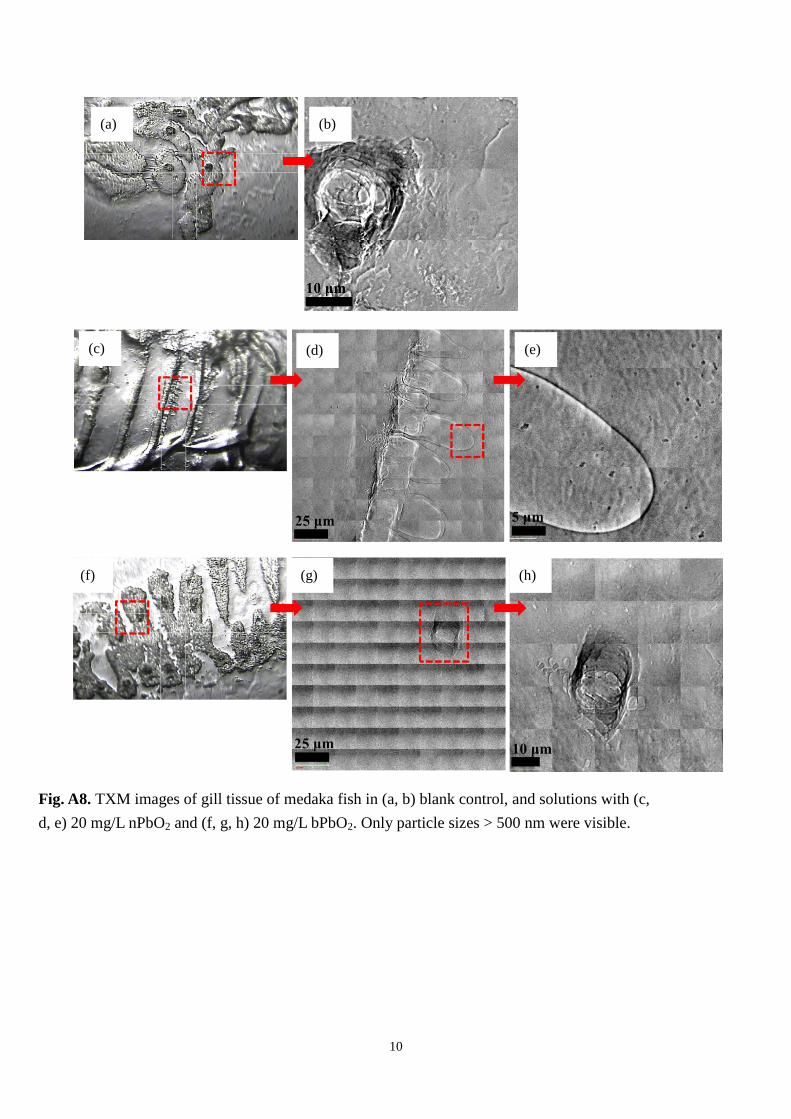
Fig. A8. TXM images of gill tissue of medaka fish in (a, b) blank control, and solutions with (c,
d, e) 20 mg/L nPbO2 and (f, g, h) 20 mg/L bPbO2. Only particle sizes > 500 nm were visible.
(a) (b)
(c) (d) (e)
(f) (g) (h) (f)
11
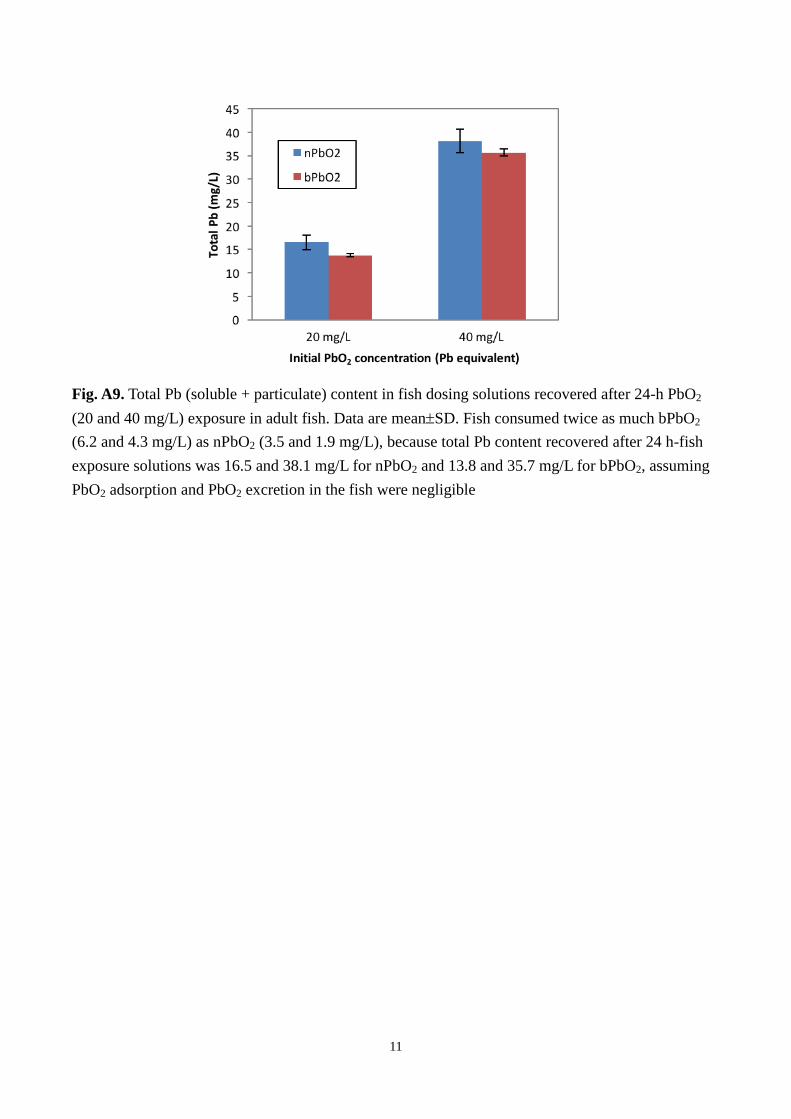
Fig. A9. Total Pb (soluble + particulate) content in fish dosing solutions recovered after 24-h PbO2
(20 and 40 mg/L) exposure in adult fish. Data are meanSD. Fish consumed twice as much bPbO2
(6.2 and 4.3 mg/L) as nPbO2 (3.5 and 1.9 mg/L), because total Pb content recovered after 24 h-fish
exposure solutions was 16.5 and 38.1 mg/L for nPbO2 and 13.8 and 35.7 mg/L for bPbO2, assuming
PbO2 adsorption and PbO2 excretion in the fish were negligible
12
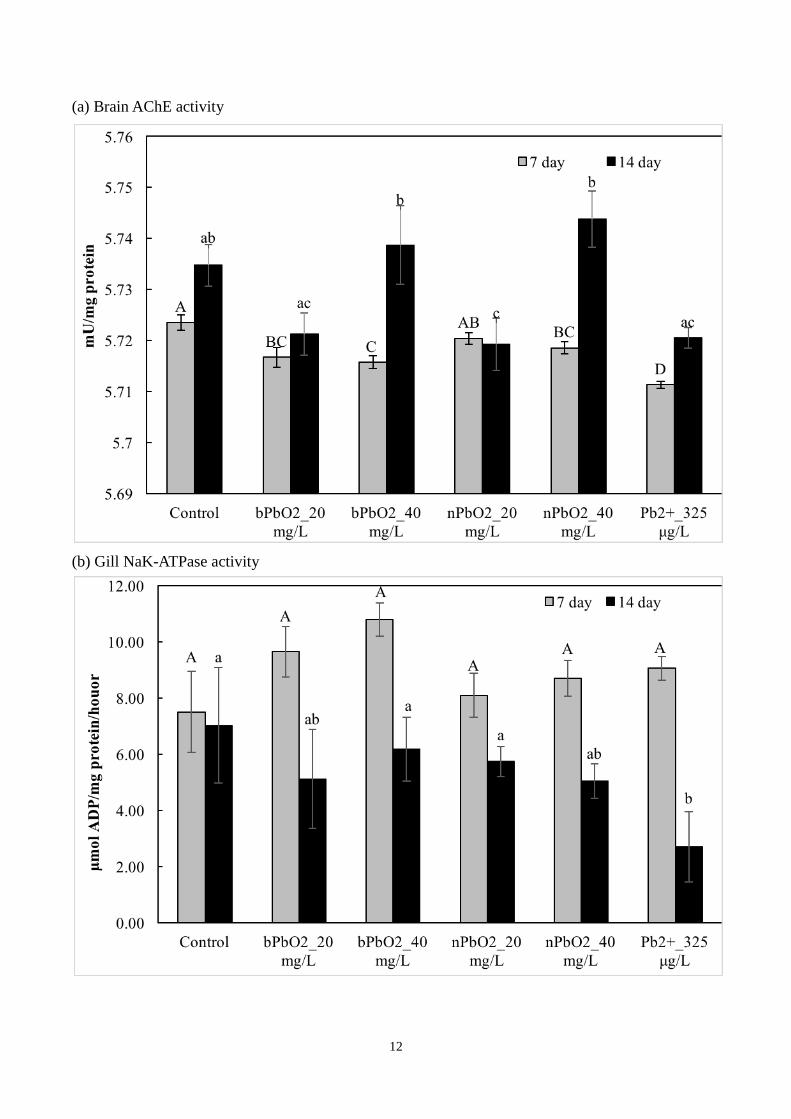
(a) Brain AChE activity
(b) Gill NaK-ATPase activity

13
(c) MDA content in liver
Fig. A10. (a) Brain acetylcholinesterase (AChE) activity, (b) gill NaKATPase activity and (c)
malondialdehyde (MDA) content in liver of adult male medaka fish with 7- to 14-day aqueous
exposure to bPbO2, nPbO2 (20 and 40 mg/L) and Pb2+
(325 μ /L). Different letters indicate p<0.05
among treatments. Data are mean SD (tissues from two fish were pooled as a subsample; n=3 for
each concentration in accordance with sub-lethal exposures)