in vivo: a role for liver fructokinase josep m. fernández ... · halotan in a specifically...
TRANSCRIPT
Glucose and fructose have sugar-specific effects in both liver and skeletal muscle in
vivo: a role for liver fructokinase
Josep M. Fernández-Novell1, Laura Ramió-Lluch2, Anna Orozco1,3, Anna M.
Gómez-Foix1,3, Joan J. Guinovart3,4, Joan E. Rodríguez-Gil2*
1Dept. Biochemistry and Molecular Biology, University of Barcelona, E-08028
Barcelona, Spain.2Dept. Animal Medicine and Surgery, Autonomous University of Barcelona, E-08193
Bellaterra, Spain.3 Centro de Investigación Biomédica en Red de Diabetes y Enfermedades Metabólicas
Asociadas (CIBERDEM), Spain.4 Institute for Research in Biomedicine, Barcelona Science Park, E-08028 Barcelona,
Spain.
*Corresponding author.
Short Title: Glucose and fructose have separate function effects in vivo.
Correspondence address: Dept. Animal Medicine and Surgery, Autonomous University
of Barcelona, E-08190 Bellaterra (Barcelona), Spain.
Phone: 34-935811045
Fax: 34-935812006
E-mail: [email protected]
1
5
10
15
20
25
Abstract
We examined glucose and fructose effects on serine phosphorylation levels of a range
of proteins in rat liver and muscle cells. For this, healthy adult rats were subjected to
either oral glucose or fructose loads. A mini-array system was utilized to determine
serine phosphorylation levels of liver and skeletal muscle proteins. A glucose oral load
of 125mg/100g body weight (G 1/2) did not induce changes in phosphorylated serines
of the proteins studied. Loading with 250mg/100g body weight of fructose (Fr), which
induced similar glycemia levels as G 1/2, significantly increased serine phosphorylation
of liver cyclin D3, PI3 kinase/p85, ERK-2, PTP2 and clusterin. The G 1/2 increased
serine levels of the skeletal muscle proteins cyclin H, Cdk2, IRAK, total PKC, PTP1B,
c-Raf 1, Ras and the β-subunit of the insulin receptor. The Fr induced a significant
increase only in muscle serine phosphorylation of PI3 kinase/p85. The incubation of
isolated rat hepatocytes with 10mM glucose for 5 min significantly increased serine
phosphorylation of 31 proteins. In contrast, incubation with 10mM fructose produced
less intense effects. Incubation with 10mM glucose plus 75µM fructose counteracted
the effects of the incubation with glucose alone, except those on Raf-1 and Ras. Less
marked effects were detected in cultured muscle cells incubated with 10mM glucose or
10mM glucose plus 75µM fructose. Our results suggest that glucose and fructose act as
specific functional modulators through a general mechanism that involves
liver-generated signals, like micromolar fructosemia, which would inform peripheral
tissues of the presence of either glucose- or fructose-derived metabolites.
Keywords: glucose, fructose, function modulators, liver, skeletal muscle.
2
30
35
40
45
50
55

Introduction
The rapid, relatively recent dietary changes in Western societies have highlighted the
effects of ingesting certain sugars. Thus, substitution of glucose by other glucide
sweeteners, such as fructose, has revealed unexpected side-effects, like transient uric
acid peaks in serum (1), elevated cholesterol, lipid dysregulation (2), leptin resistance
(3), inflammatory responses in tissues like the kidney (4), and hypertriglyceridemia and
metabolic syndrome associated with insulin resistance (5-7). The differences between
glucose and fructose are attributed to the distinct ways in which they are metabolized in
the liver. Thus, while glucose is metabolized in hepatocytes via glucose 6-phosphate (G
6P), mainly through the hexokinase-I/glucokinase pathway, fructose is metabolized via
fructose 1-phosphate (F 1P), mainly through the fructokinase (FK) pathway (8,9). These
distinct pathways lead to specific changes in intracellular levels of crucial regulatory
metabolites, such as G 6P, glycogen and ATP, thus inducing sugar-specific changes in
the rhythm of metabolic pathways like gluconeogenesis, glycogenesis, lipid synthesis
and urea metabolism (8,9). These changes, in turn, lead to alterations in serum
concentrations of metabolic products, such as triglycerides and uric acid (1,2).
However, the difference in serum metabolite levels after liver metabolization of
glucose and fructose are not the only way through which these sugars exert their
specific in vivo effects. In fact, alone, these sugars act directly on key points of the
regulatory function of several cells and tissues. Moreover, some of these actions do not
appear to be related to the modulation of the expression of certain genes but are linked
to specific changes in the general actions of proteins present in the cell, thus inducing
rapid effects that trigger further physiological alterations in target tissues. As an
example, glucose potentiates vascular smooth muscle cell chemotaxis through a
phosphatidylinositol 3-kinase and mitogen-activated protein kinase-dependent
up-regulation of the platelet-derived growth factor receptor (10). Another example is the
glucose-mediated activation of the protein kinase B (Akt) and the subsequent
up-regulation of TGF-β1 in mesangial cells through a pathway that is dependent on the
activity of the protein kinase C-β1 (11). Likewise, one of the key signals that induces
pancreatic insulin secretion is linked to the glucose-induced tyrosine phosphorylation of
protein p125 in beta cells and pancreatic islets (12). Fructose also has specific effects on
the activity of certain proteins. An example is the fructose-induced insulin resistance in
adipose tissue, which is linked to activation of the protein kinase C (13). Other well
3
60
65
70
75
80
85

known fructose-induced alterations in insulin-sensitive tissues are associated with
changes in cell signalling and inflammatory pathways through modification of the
activity of proteins like tumor necrosis alpha (TNFα), c-Jun amino terminal kinase 1
(JNK 1), protein tyrosine phosphatase 1B (PTP-1B), liver X receptor, farnesoid X
receptor and sterol regulatory element-binding protein-1c (SREBP-1c; see 6). However,
little is known about the mechanism/s underlying the origin of these effects and their in
vivo regulation by the liver.
The liver is the main regulatory tissue of sugar metabolism and the subsequent
utilization of these molecules in the body. Here we aimed to establish a unified view of
the differential effects of the in vivo administration of glucose and fructose on this
organ. For this purpose, healthy adult rats were subjected to an oral load of either
fructose or glucose at a range of doses. Using a mini-array system, we then analyzed the
phosphorylation levels of proteins linked to cell cycle control,
phospho-dephosphorylation regulatory mechanisms, and cell-to-cell interactions in liver
and in the most important peripheral tissue with respect to sugar consumption, such as
skeletal muscle. Furthermore, a similar analysis was performed in isolated hepatocytes
from starved healthy rats and from cultured rat skeletal muscle L6E9 cells incubated
with fructose or glucose, in order to gain further insight into the nature of the changes
induced by these sugars in these cell types.
4
90
95
100
105
Material and Methods
Animals and in vivo treatment protocols
All animal procedures and treatment protocols were in accordance with the Law
5/1995 on Animal Protection for Research and other Scientific Purposes (Generalitat de
Catalunya, Spain). From this Law, the University of Barcelona developed its own
ethical protocols guidelines that follow all of the international ones. Under this basis,
the animal procedures and treatment protocols utilized in this work have been
specifically approved by the Institutional Animal Care and Use Committee (IACUC) of
the University of Barcelona. Following this specific approval, healthy adult male Wistar
HsdOla:WI rats of 8 weeks of age as a mean weight of 200 g and without any genetic
modification or other previous manipulations were utilized. Animals were housed in a
SPF facility [Plataforma de Recerca Aplicada a l’Animal de Laboratori (PRAAL-PCB);
Barcelona Science Park, University of Barcelona] in which they were housed in
polysulfone Type III shoebox cages (Tecniplast; Varese, Italy). Bedding material used
was autoclaved aspen wood. Rats were house 2 each per cage. Animals were kept under
a constant 12h-12h light-dark cycle at 20ºC-22ºC and at a relative humidity of
50%-60%. They were allowed to eat and drink ad libitum. All animals were health- and
welfare-assessed daily. Prior to, during and after the experiments further welfare
assessment was performed by researchers and technicians of the facility. Animals were
fasted 24 h before the start of the in vivo oral sugar load. The final step of the
experimental study was in all cases carried out between 9:00 AM and 11:30 AM. This
final step was performed at the facilities of the PRAAL-PCB. Animals were then
divided into 6 groups. The first group (Control) was immediately anesthetized with
halotan in a specifically designed chamber to obtain a halotan saturated atmosphere and
subsequently killed by decapitation. Halotan was selected because being a potent
anaesthesic that completely avoided any subsequent pain of suffering of animals
inducing minimal effects on the evaluated parameters. The other 5 groups were
intragastrically intubated and administered a 5 mL solution as follows:
Saline group: 0.9% (w/v) NaCl solution (saline solution).
Glucose 1/4 group (G 1/4): 65 mg/100 g body weight of glucose in saline
solution.
Glucose 1/2 group (G ½): 125 mg/100 g body weight of glucose in saline
solution.
5
110
115
120
125
130
135
140
5

Glucose group (G): 250 mg/100 g body weight of glucose in saline solution.
Fructose group (F): 250 mg/100 g body weight of fructose in saline solution.
In each case, animals from the same experimental group were caged together with a
total of 2 animals per cage. Intragastrical intubation was immediately removed after
administration of the solutions and animals were returned to their cages for 30 min.
They were then anesthetized with halotan and killed by decapitation as previously
indicated. Immediately before the intragastric load, an aliquot of blood of approximately
10 μL was taken from each animal through tail puncture in order to measure glycemia.
Immediately after decapitation, blood was collected in heparinized tubes while liver and
longissimus dorsi muscle samples were dissected and frozen in liquid N2 for further
processing. Each experimental group was composed by 5 rats. This number was
established following our previous experience with other experimental designs based in
the obtainment of information through a mini-array system in which the same number
of separate replicates was utilized as a minimally significant to yield relevant results
(14). Thus, the total number of animals utilized for the in vivo experimental procedure
was of 30. In all cases, animals were processed during the final steps of the
experimental procedure following a random order of processing.
Preparation and incubation of hepatocytes
Hepatocyte suspensions were prepared from healthy adult male Wistar HsdOla:WI
rats of 8 weeks of age and weighted 200 g that were previously fasted for 24 h, as
described in (15). The total number of animals utilized for this purpose was of 5. In this
way, the total number of animals utilized in this work after summing those utilized in
the in vivo experimental procedure and those used for the isolation of hepatocytes was
of 35. Cells were resuspended in Krebs-Ringer bicarbonate buffer (pH 7.4). Samples (4
mL) of these suspensions, containing 4-5x10⁶ cells/mL, were incubated at 37ºC with
gassing and continuous shaking (100 strokes/min). Glucose and fructose were dissolved
in a saline solution at a concentration of 1 M. Suitable volumes of these solutions were
added to the cell suspensions to obtain the desired final concentration (10mM in all
cases). Control hepatocytes were incubated with the same volume of saline solution.
After 5 min of incubation, cells were centrifuged (3000 g for 20 s) and pellets were
immediately frozen in liquid N2 until their subsequent processing.
6
145
150
155
160
165
170
175

Preparation and incubation of cultured skeletal muscle cells
We utilized rat L6E9 myoblasts, which were kindly donated by Dr. Anna Gumà
(University of Barcelona). Myoblasts were grown in DMEM medium (Invitrogen;
Carlsbad, CA, USA) containing 25mM glucose and supplemented with 25mM
4-(2-hydroxyethyl)-1-piperazineethanesulfonic acid (HEPES) and 10% (w:v) fetal
bovine serum (FBS). Cells were cultured until reaching confluence. They were then
induced to fuse by means of incubation in DMEM medium containing 25mM glucose,
25mM HEPES and 2% (w:v) FBS for 5 days. Afterwards, the differentiated myotubes
were then incubated for 18 h in DMEM medium with any addition before being used in
the experiments. As in case of hepatocytes, the incubation of the differentiated
myotubes with the utilized monosaccharides was of 5 minuts. Afterwards, cells were
centrifuged (3000 g for 20 s) and pellets were immediately frozen in liquid N2 until their
subsequent processing. The time of incubation of 5 minuts was chosen both in
hepatocytes and myotubes as a good mean time in which any putative effect of sugars
on phosphorylation levels can be easily detected, following all of the literature
accumulated at this respect in the last 50 years.
Mini-array analysis of selected proteins from tissue and cell extracts
Liver and muscle tissues, as well as resuspended hepatocytes samples were
homogenized in 1 mL of an ice-cold extraction solution comprising a 15mM Tris/HCl
buffer (pH 7.5) plus 120mM NaCl, 25mM KCl, 2mM EGTA, 2mM EDTA, 0.1mM
DTT, 0.5% Triton X-100, 10 µg/mL leupeptin, 0.5mM PMSF and 1mM Na2VO4
(extraction solution) using a Polytron. Homogenized samples were then left for 30 min
at 4ºC and then centrifuged at 10,000 g for 15 min at 4°C. Supernatants were taken and
then used to test the degree of tyrosine, serine and threonine phosphorylation of selected
proteins included in a Custom AntibodyArrayTM (Hypromatrix, Inc. Worcester, MA,
USA), following the standard protocol provided by the manufacturer. Briefly, each
sample was diluted in 2 mL of extraction solution containing 1% dry milk to reach a
final protein concentration of 2 µg/ µL. Simultaneously, Antibody ArrayTM membranes
were placed in suspension culture dishes (60mm x 15mm; Corning Incorporated;
Corning, NY, USA) and incubated with a blocking solution containing 150mM NaCl,
25mM Tris and 0.05% (v:v) Tween-20 (TBST; pH 7.5) plus 5% (w:v) dry milk and left
for 1 h at room temperature under slow shaking. Membranes were then incubated with
the samples for 2 h at room temperature under slow shaking. After incubation,
7
180
185
190
195
200
205
210
membranes were washed 3 x 15 min with TBST. They were then incubated with 10
µg/mL HRP-conjugated anti-phosphoserine antibody (HM2070; Hypromatrix). At the
same time, preliminary experiments involving the determination of phosphotyrosine and
phosphoserine phosphorylation levels of the proteins were performed. For this purpose,
HRP-conjugated anti-phosphotyrosine (HM2040; Hypromatrix) and
anti-phosphothreonine (HM2090; Hypromatrix) were also utilized. However, since the
results obtained with the phosphotyrosine and phosphothreonine antibodies were
unconsistent, they were not included in this work (data not shown). In all cases,
antibodies were diluted in TBST and array membranes were subsequently incubated
with these antibodies for 2 h at room temperature under slow shaking. Finally, samples
were washed 3 x 15 min with TBST and then incubated with peroxidase substrate
(ECL-Plus Western Blotting Detection; GE Healthcare UK Ltd, Buckinghamshire,
England) and exposed to X-ray film (Amersham Hyperfilm ECL; GE Healthcare UK
Ltd, Buckinghamshire, England). The total protein content of the supernatants was
determined by the Bradford method (16) using a commercial kit (Bio-Rad Protein Assay
Dye Reagent; Bio-Rad Laboratories). The intensity of the spots obtained was quantified
using specific software for image analysis of blots and arrays (Multi Gauge v3.0;
Fujifilm Europe; Düsseldorf, Germany), in which the background was previously
standardized for all the arrays analyzed. The values obtained for the control samples, i.e.
those incubated in the absence of sugars, were transformed in order to obtain a basal
arbitrary value of 100, from which the intensity values for the other samples were
calculated. Furthermore, two types of negative control were applied. In one, two arrays
were incubated with a randomly chosen sample but without further incubation with the
primary antibody. In the other, two arrays were incubated with the antibodies but
without samples. The proteins included in this study are described in Fig. 1. All the
antibodies included in the arrays were previously tested for their specificity for rat
tissues by the manufacturer of the array.
Analytical procedures in serum samples
Glycemia was measured by the hexokinase method and fructosemia by the
fructokinase technique. Both determinations were performed using the appropriate
commercial kits (Roche Biomedical; Basel, Switzerland). Serum insulin levels were
determined by an enzyme-linked immunosorbent assay (ELISA) using a commercial kit
(Crystal Chem, Chicago, ILL).
8
215
220
225
230
235
240

Determination of ATP and G 6P in resupended hepatocytes
Frozen cellular pellets were homogenized in 1 mL 10% (v/v) ice-cold HClO4.
Homogenates were centrifuged at 10,000 g for 15 min at 4ºC and the resultant
supernatants were neutralized with 5M K2CO3 before analysis. G 6P and ATP were
determined enzymatically as in (17) and (18), respectively.
Statistical analysis
Statistical analyses were performed using SPSS 15.0 for Windows
(SPSS Inc., Chicago, IL, USA) and data are presented as means±S.E.M. Data were
tested for normality and homoscedasticity using the Shapiro–Wilk and Levene tests.
When necessary, data were transformed using arcsine square root before a generalised
estimating equation (GEE), an extension of generalised linear model (GLM) for
repeated-measures, was performed. Characteristics of the GEE were normal distribution
and identity link function. The inter-subject factor was treatment. In all cases, each
sugar administration/incubation was the dependent variable and multiple post hoc
comparisons were calculated using Sidak’s test. In all statistical analyses, the minimal
level of significance was set at P<0.05. However, since the analytical technique has an
intrinsic subjective component, we considered true differences to be only those for
which P<0.05 and with a percent difference above 20%.
Suppliers
All chemical reagents were of analytical grade and were obtained from Sigma (Saint
Louis, MO), Merck (Darmstadt, Germany), Bio-Rad Laboratories (Hercules, CA) and
EMS (Fort Washington, PA).
9
245
250
255
260
265

Results
Changes in serum levels of glucose, fructose and insulin and in serine
phosphorylation levels of proteins linked to cell cycle regulation and
phosphor/dephosphor-ylation mechanisms in rats subjected to an oral glucose or
fructose load
Oral administration of 250 mg of glucose/100 g body weight (G) induced an increase
in glycemia from 5.9mM±0.3mM to 13.0mM±1.1mM after 30 min (Table 1). The
administration of the same dose of fructose produced a lower increase (P<0.05) in
glycemia, which reached values of 9.8mM±0.9mM after 30 min. Interestingly, the oral
administration of 125 mg of glucose/100 g body weight (G 1/2) increased glycemia
after 30 min to values similar to that reached with 280 mg of fructose/100 g body
weight (9.5mM±0.9mM after glucose administration, see Table 1). Oral saline
administration did not modify glycemia, thereby indicating that the values observed
were not influenced by the administration technique used.
The oral administration of glucose did not induce measurable values of fructosemia at
any of the loads tested. In contrast, the oral fructose loads caused fructosemia, which
reached 73.8µM±6.0µM after 30 min (Table 1). Concomitantly, insulinemia reached
maximal values 30 min after the glucose load (from 62.3mIU±L9.9mIU/L before
administration to 251.6mIU/L±12.3mIU/L after loading of 250 mg/100 g body weight
glucose, see Table 1). Fructose administration induced a lower increase in insulinemia
than that caused by the maximal glucose load. However, insulinemia after fructose
loading was not significantly different to that detected in animals after the
administration of G 1/2 (193.0mIU/L±11.2mIU/L in rats receiving fructose vs.
217.4mIU/L±10.8mIU/L in those receiving G 1/2, Table 1).
The oral administration of saline did not induce any significant change in the serine
phosphorylation levels of the proteins compared to rats that received non-intragastric
infusion. The minimal load of 65 mg/100 g body weight did not cause any significant
change in the serine phosphorylation levels of any of the proteins studied (Fig. 2 and
Table 2). In contrast, the maximal glucose load of 250 mg/100 g body weight caused a
significant (P<0.05) increase in this parameter for liver total protein kinase C, ERK-2,
protein phosphatase PTP1B, c-kit and clathrin, when compared with saline-treated rats
(Fig. 2 and Table 2). Remarkably, the highest glucose load also induced a very intense
10
270
275
280
285
290
295
300
10
and significant (P<0.05) increase in the serine phosphorylation levels of cyclin D3
(from 100.0±5.1 arbitrary units in saline-loaded animals to 180.9±6.4 arbitrary units in
high glucose-loaded animals, see Fig. 2 and Table 2). The fructose load also induced an
increase (P<0.05) in serine phosphorylation of several liver proteins, like ERK-2, PTP2,
cyclin D3, PI3 kinase/p85 and clusterin (Fig. 2 and Table 2). However, of note, the
highest glucose load increased serine phosphorylation of total PKC, PTP1B, c-kit and
clathrin, while the highest fructose load increased that of PI3 kinase/p85, clusterin and
especially PTP2 (Fig. 2 and Table 2). Remarkably, comparison of the oral treatments
that rendered similar glycemia and insulinemia levels, namely the oral load of 125 mg
of glucose/100 g body weight (G 1/2) and the oral fructose load, revealed a totally
different behavior of the two experimental groups. Thus, the G ½ load did not induce
any significant increase in the serine phosphorylation of any of the proteins analyzed.
This finding clearly contrasted with that found for the fructose load, which, as indicated
above, caused several significant (P<0.05) increases (i.e., PTP2 went from 100.0±4.0
arbitrary units after saline load to 107.7±5.3 arbitrary units after G1/2 glucose load and
to 142.4±6.2 arbitrary units after fructose load, see Fig. 2 and Table 2).
The effects of oral monosaccharide administration on serine phosphorylation levels of
skeletal muscle proteins differed to those observed in liver. Again, the oral
administration of either saline or 65 mg glucose/100 g body weight did not significantly
modify any protein. Furthermore, the maximal glucose load induced an increase
(P<0.05) in serine phosphorylation of muscle total PKC, PI3 kinase/p85, IRAK, PTP1B,
cyclin H, Cdk2, c-Raf 1, ras, clusterin and the β subunit of the insulin receptor (Fig. 2
and Table 3). The administration of G1/2 glucose produced less intense effects, with a
significant (P<0.05) increase (P<0.05) in muscle serine phosphorylation of cyclin H,
Cdk2, IRAK, PTP1B, total PKC, c-Raf, ras and the β subunit of the insulin receptor. In
contrast, the fructose load, which induced an increase in glycemia and insulinemia
similar to those observed after the administration of the G1/2 load, caused a significant
(P<0.05) increase only in the serine phosphorylation of muscle PI3 kinase/p85 (from
100.0±6.3 arbitrary units after saline administration to 136.6±6.4 arbitrary units after
fructose treatment; see Fig. 2 and Table 3).
11
305
310
315
320
325
330

Changes in intracellular G 6P and ATP levels and in serine phosphorylation levels
of proteins linked to cell cycle regulation and phospho/dephosphorylation
mechanisms in isolated hepatocytes incubated in the presence of glucose or
fructose
Isolated hepatocytes were incubated in media without sugars or in the presence of
three distinct combinations of monosaccharides. The rationale behind these
combinations is that in the previously described in vivo experimental design,
hepatocytes were subjected to different concentrations of sugars depending on their
specific location in the liver. Thus, after a glucose load all hepatocytes were exposed to
a similar glucose concentration, which was the one determined by blood glucose levels.
On the contrary, after the fructose load, liver hepatocytes were classified into two
conditions. Those in contact with portal blood were incubated with about 10mM
fructose, while those in contact with peripheral blood were maintained under high
concentrations of glucose (about 10mM) and very low concentrations of fructose (about
75µM). Thus, our next experimental design was based on the incubation of isolated
hepatocytes from starved healthy rats in the presence of 10mM glucose, 10mM fructose
or 10mM glucose plus 75µM fructose in order to mimic the range of conditions
observed in hepatocytes in vivo.
The incubation of hepatocytes with 10mM glucose for 5 min induced a significant
(P<0.05) increase in the intracellular levels of both G 6P (27.9 nmol/mg protein±4.7
nmol/mg protein vs. 16.2 nmol/mg protein±3.4 nmol/mg in control cells) and ATP (2.24
µmol/mg protein±0.63 µmol/mg protein vs. 1.09 µmol/mg protein±0.61 µmol/mg in
control cells; see Table 4). The 5-min incubation in the presence of 10mM fructose also
led to an increase in G 6P levels that was similar to that induced by 10mM glucose.
Notwithstanding, fructose caused a concomitant, significant (P<0.05) decrease in
intracellular ATP levels, which reached values of 0.51 µmol/mg protein±0.09 µmol/mg
(Table 4). The incubation of isolated hepatocytes with 10mM glucose+75µM fructose
for 5 min caused a strong increase in G 6P levels, with values about 100% higher than
those observed after the incubation with either glucose or fructose alone (Table 4). The
combination of glucose and fructose also induced a significant (P<0.05) increase in
intracellular ATP levels, although in this case the increase was similar to that induced by
the incubation with glucose alone (Table 4).
12
335
340
345
350
355
360
365

Incubation of cells with 10mM glucose induced a strong and significant (P<0.05)
increase in the serine phosphorylation levels of practically all the proteins tested,
reaching more than 2-fold increases in protein kinases such as IRAK, PYK2 and PI3
kinase/p85, cell cycle regulating proteins such as cyclins A, B and E and Cdk2, and
other proteins, such as c-kit and clathrin (Fig. 3 and Table 4). Remarkably, the effect of
the incubation with 10mM fructose was much less intense. In this regard, there were
only three proteins, namely Cdk2, Cdk4 and Hsp-70, in which the increase in serine
phosphorylation was similar after incubation with either glucose alone or fructose alone
(Fig. 3 and Table 4). In proteins such as cyclins A, B, E and H, Cdk1-cdc2, Cdk6, cdc6,
total Akt, IRAK, PYK2, PI3 kinase/p85, ERK-1, ERK-2, total tyrosine kinase, PTP2,
c-kit and clathrin, the fructose-induced increase in serine phosphorylation was
significantly lower (P<0.05) than that induced by glucose. Furthermore, in contrast to
glucose, incubation with fructose did not significantly change the serine
phosphorylation levels of cyclin D3, cdc 25A, total protein kinase C, total protein
phosphatases (PP1, PP2A, PP2B and PPX), GSK-3, PTP1, PTP1B, caspase 9, Raf-1,
ras, clusterin or the β subunit of the insulin receptor (Fig. 3 and Table 4). Remarkably,
the incubation of hepatocytes with 10mM glucose plus 75µM fructose counteracted
practically all the glucose- and fructose-induced increases observed in serine
phosphorylation levels (Fig. 3 and Table 4). Finally, the joined glucose/fructose
incubation induced a significant (P<0.05) decrease in serine phosphorylation levels of
proteins like cyclin D3 and Hsp-70 (Fig. 3 and Table 4)
Changes in intracellular G 6P and ATP levels and in the serine phosphorylation
levels of proteins linked to cell cycle regulation and phospho/dephosphorylation
mechanisms in cultured skeletal muscle cells incubated in the presence of glucose
or fructose
As in the case of hepatocytes, the in vivo experimental design led to the presence of
two distinct blood sugar environments for skeletal muscle cells. Thus, after the glucose
load, these cells were exposed to a high blood glucose concentration of about 10mM.
After the fructose load, muscle cells were exposed to glucose concentrations around 10
mM, which was accompanied with a concomitant exposure to very low concentrations
of fructose (about 75µM). Given these observations, our next experimental design was
based on the incubation of cultured skeletal muscle cells from starved healthy rats in the
13
370
375
380
385
390
395

presence of 10mM glucose or 10mM glucose plus 75µM fructose in order to mimic the
range of conditions observed in skeletal muscle cells in vivo.
The incubation of these cells in the presence of 10mM glucose for 5 min induced a
strong and significant (P<0.05) increase in the intracellular concentrations of G 6P
(from 6.8±1.4 nmol/mg protein in basal cells to 16.8±2.4 nmol/mg protein after glucose
incubation) and ATP intracellular levels (from 0.80±0.06 µmol/mg protein in basal cells
to 5.12±1.87 µmol/mg protein after glucose incubation, see Table 5). Incubation in the
same conditions but with the addition of 75 µM fructose rendered increases in G 6P and
ATP intracellular levels that were not significantly different to those observed in the
presence of glucose alone (Table 5).
Strikingly, the presence of 75µM fructose altered the effects on the serine
phosphorylation levels shown by glucose alone. Thus, incubation with 10mM glucose
for 5 min induced a significant (P<0.05) in serine phosphorylation levels of a wide array
of proteins. The greatest increases were those observed in total Akt (from 100.0±5.3 to
198.4 ±6.6 arbitrary units), Ras, (from 100.0±5.9 to 194.4±6.0 arbitrary units), c-Raf-1
(from 100.0±6.0 to 180.8±6.4 arbitrary units), PYK2/CAKβ (from 100.0±5.7 to
178.8±7.1 arbitrary units) and total tyrosine kinase (from 100.0±5.8 to 173.4 ±6.9
arbitrary units, see Fig. 3 and Table 5). However, the serine phosphorylation levels of
Cdk6, cyclin E, IRAK, PI3 kinase/p85, ERK-1 and ERK-2, total protein kinase C, PTP
1 and PTP2 also significantly (P<0.05) increased. The incubation with 10mM glucose
plus 75µM fructose practically prevented all the increases in serine phosphorylation
levels induced by glucose alone. Thus, the glucose-induced increases in the above
mentioned proteins were blocked by the presence of 75µM fructose. In addition, the
glucose-induced increases in total Akt (from 198.4±6.6 arbitrary units in the presence of
10mM glucose to 130.7±5.7 arbitrary units in the presence of 10mM glucose plus 75µM
fructose), cyclin E (from 169.2±6.6 arbitrary units in the presence of 10mM glucose to
124.4±5.5 arbitrary units in the presence of 10mM glucose plus 75M fructose) and
c-Raf-1 were partially counteracted (from 180.8±6.4 arbitrary units in the presence of
10 mM glucose to 126.7 ±5.5 arbitrary units in the presence of 10mM glucose plus
75µM fructose, see Fig. 3 and Table 5). Finally, the presence of 75µM fructose induced
a decrease (P<0.05) in the serine phosphorylation levels of two proteins that were not
affected by the incubation with glucose alone, namely c-kit (from 100.0±4.5 arbitrary
units in control cells to 71.0 ±5.3 arbitrary units in the presence of 10mM glucose plus
14
400
405
410
415
420
425
430

75µM fructose) and cyclin H (from 100.3±5.8 arbitrary units in control cells to 78.3±5.1
arbitrary units in the presence of 10mM glucose plus 75µM fructose, see Fig. 3 and
Table 5).
15
435
15

Discussion
Our results indicate that glucose and fructose oral loads induce sugar-specific and
rapid functional responses not only in liver but also in peripheral tissues like skeletal
muscle. The differential effects of these two sugars in vivo are easily observed when
comparing the results obtained after loads that induced similar increases of glycemia to
about 9.5mM/10mM and insulinemia to about 200mIU/L in both cases. In these
conditions, with similar glycemia and insulinemia, fructose loading induced a
significant increase in serine phosphorylation levels of only muscle PI3 kinase/p85. On
the contrary, oral glucose loading increased serine phosphorylation levels of muscle
cyclin H, Cdk2, IRAK, total PKC, PTP1B, c-Raf 1, Ras and the β unit of the insulin
receptor, without affecting muscle PI3 kinase/p85. This observation indicates that
glycemia and/or insulinemia are not the sole factors involved in the differential effects
of glucose and fructose on muscle, since these specific effects were caused despite
similar values of blood glucose and insulin levels. In fact, that glucose is not the sole
factor involved in these specific effects is also highlighted in both isolated hepatocytes
and cultured muscle cells. While the addition of 10mM glucose to the former increased
serine phosphorylation levels of practically all of the proteins tested, in the latter the
effect was much less intense, and only 15 of the proteins showed an increase. Thus, we
propose that other factors are involved in the observed effects of sugars on protein
serine phosphorylation.
Regarding the effects observed in vivo in liver and isolated hepatocytes, several
questions arising from our results. The first concerns the comparison of effects between
the two experimental systems. Thus, it is evident that the response to sugars in vivo is
less intense than in isolated cells. This effect can be caused by several factors, being one
of this the unavoidable effect of anaesthesia on both liver and muscle metabolism.
However, since the effect of the anaesthesia will be of the same magnitude in all of the
experimental conditions studied, we can infer that these compounds will not affect the
specific response of the utilized sugars, albeit the intensity of the effects would be
changed in a similar intensity in all cases, regardless of the sugar utilized. Additionally,
we might highlight that in the case of fructose there are proteins in which the effect is
the contrary when comparing the results obtained in vivo and in isolated/cultured cells.
These distinct effects on whole liver and isolated hepatocytes can be attributed to the
experimental systems. In this regard, the treatment by which isolated hepatocytes are
16
440
445
450
455
460
465

obtained modifies their membrane structure, and key membrane proteins like the insulin
receptor are altered during this process (19). This implies that the response to external
stimuli, such as sugars, differs between isolated hepatocytes and whole liver. Moreover,
the whole liver has a complex structure, in which two types of hepatocytes can be
distinguished. The first type, centro-lobulillar hepatocytes, are in direct contact with
portal blood and thus are direct targets for all the substances that arise from the portal
vein (20). The other cellular type includes hepatocytes that are in direct contact with the
peripheral circulation from hepatic arteria and veins (20). In these cells, the effects
induced by portal substances are mediated through the centro-lobulillar hepatocytes.
Thus, a hierarchy of effects induced by either portal fructose or portal glucose is exerted
in vivo. In contrast, hepatic suspensions mix both types of hepatocyte, thus eliminating
any possible hierarchical action of sugars. Thus, the hepatic suspension model will yield
results that differ to those observed in vivo. This is an unavoidable effect, since the
separation of the two hepatocyte subpopulations is not possible in in vivo experiments.
There are other technical questions that difficult the overall interpretation of the results
shown here. Thus, the mini-array analysis can be only interpreted as a broad approach to
the specific effects determined in all of the analyzed proteins. This implies that the
interpretation of the results obtained with the mini-array technique must be done with
caution and a more definitive interpretation of the results would be carried out with the
support of complementary techniques like Western blot. However, despite all of these
difficulties, the results obtained here are a good indication that both glucose and
fructose has specific and separate effects on the overall hepatocyte and myocyte
physiology taken as a whole, although the precise ways by which these specificities are
launched can not be elucidate at this point.
Despite all these differences and difficulties, the combined analysis of results obtained
in in vivo and in isolated and cultured cells allows us to draw a number of conclusions.
First, the effects of sugars are rapid, since they induce strong changes after only 5 min
of incubation in both isolated and cultured cells. Moreover, the different effect of
glucose and fructose appears to be associated with the sugar-specific changes observed
in the intracellular levels of metabolites like G 6P and ATP. Thus with regard to the
liver, the glucose-induced increase in ATP would activate phosphorylation pathways by
increasing substrate (9). Meanwhile, the fructose-induced decrease in ATP would induce
the opposite effect (21). It is noteworthy that the fructose-induced decrease in ATP in
hepatocytes is mainly a consequence of the low Km (about 0.5mM) of FK for fructose,
17
470
475
480
485
490
495
500
which induces a very high velocity of fructose phosphorylation to fructose 1-phosphate
(22). In fact, the ATP lowering triggered by the fructose-FK system is at the basis of the
other well known metabolic alterations induced by this sugar, such as
hypertriglyceridemia or the transient increase in serum uric acid (1,6,7). In fact, the
mere presence of FK in liver is surprising at a first glance as hepatic cells can uptake
and metabolize fructose via other hexokinases, such as the ubiquitous hexokinase-I (23).
Thus FK appears to contribute to modulating the functional status of hepatocytes, which
would change their overall functional activity depending on the specific changes
induced by the FK pathway on the phosphorylation status of a wide range of proteins.
This hypothesis would also explain the presence of FK in the liver of animals whose
diets contain low fructose levels, like the dog and cat (24). In these animals, fructose,
via hepatic FK, would serve as a true modulator of hepatic function rather than merely a
direct energy source.
However, while the effects of glucose and fructose on liver could be explained by a
direct, specific action of these two sugars through their portal door of entry, the effects
observed on peripheral skeletal muscle can not be attributed to the same direct effect. In
this regard, our results indicate that while glucose alone has a distinct effect on serine
phosphorylation of many proteins, fructose alone does not. In fact, hepatic
metabolization of fructose implies that, in the best of cases, fructosemia is consistently
in the µM range, whereas glycemia is in all cases in the mM range. The sugar-specific
effects observed in muscle would be due to an inducer that would be produced from
liver after the action of either portal glucose or portal fructose on this organ. We can
only speculate regarding this question, although there are several points of interest.
First, as indicated above, the sugar-specific actions do not appear to be related to the
specific serum glycemia and/or insulinemia, since these effects were observed in
conditions in which serum glucose and insulin were similar. We propose that other
factors are therefore involved. It is noteworthy that fructose-rich diets cause
hyperlipidemia through a hepatic mechanism involving FK and the lowering of
intracellular hepatic ATP levels (21). Thus the increase in lipidemia could be a
signalling factor of fructose ingestion for peripheral tissues. Notwithstanding,
fructosemia itself is another factor related to the fructose-linked effects in skeletal
muscle. A specific effect of micromolar concentrations of fructose can be inferred after
analyzing the results observed in isolated skeletal muscle cells, in which the addition of
75µM of this sugar dramatically changed the glucose-induced effects on protein serine
18
505
510
515
520
525
530
535

phosphorylation. It is also remarkable that these fructose-linked effects were not
associated with changes in intracellular G 6P or ATP contents, since the values of these
two metabolites were very similar in skeletal muscle cells incubated with glucose alone
or with glucose plus fructose. Regarding this point, there are a series of paradoxes
related to in vivo fructose utilization. The genetic lack of liver FK induces fructosuria, a
benign process in which fructosemia reaches serum concentration values of mM;
however, none of the known side-effects related to fructose metabolization, such as
hypertension, hyperlypidemia and insulin resistance occur (25). In fact, one of the very
few complications that arise in fructosuria is the appearance of proximal renal tubular
acidosis, which is caused by an excess of kidney filtration of fructose (25). This
observation contrasts with the presence of the specific fructose transporter GLUT5 in
skeletal muscle (26). The presence of this transporter indicates that these cells have the
capacity to take up fructose from the environment. However, there are no signs that
peripheral muscle uses this sugar in conditions of fructosuria. Perhaps this paradox can
be explained by the concentration of fructose reached in each condition. In healthy
individuals that present hepatic FK, the maximal fructosemia is in the µM range, not
mM as in fructosuria. Moreover, this fructosemia is always accompanied by glycemia
concentrations in the mM range. This finding is relevant as several studies carried out in
isolated hepatocytes indicate that the incubation of rat hepatocytes with 8mM glucose
plus 100µM fructose caused a dramatic increase in the glycolytic flux by raising the
intracellular levels of fructose 2,6-bisphosphate (Fru(2,6)P2) when compared with the
incubation with 8mM glucose alone (27). The effect of the glucose-fructose
combination was accompanied by an increase in intracellular G 6P through a
mechanism linked to the glucose-and-fructose induced activation of liver glucokinase
(28). Remarkably, the incubation of isolated hepatocytes with 100 µM fructose alone
did not increase the intracellular levels of either Fru(2,6)P2 or G 6P (27). Thus the
induced increase in G 6P levels in hepatocytes incubated with glucose plus fructose
cannot be attributed to an increase in the pool of fructose 6-phosphate resulting from
fructose metabolism. These reflections raise the question as to the nature of the role
played by FK in the modulation of in vivo fructose signalling. At present, we can only
speculate on this question, and more experiments are required to elucidate the presence
of a putative, co-operative action of high glucose concentrations and low fructose
concentrations on overall cell function.
19
540
545
550
555
560
565
570
The data collected using our experimental approach allows us to propose a general
hypothesis to explain the in vivo functional effects of glucose and fructose. In this
hypothesis (see Fig. 4), the response of peri-portal hepatocytes to glucose and fructose
depends on changes in intracellular G 6P and ATP levels induced by the sugars. This
specific response is caused by the presence of separate phosphorylation mechanisms for
glucose (hexokinase-I/glucokinase system) and for fructose (FK system). The response
of peri-portal hepatocytes is communicated to other hepatic cells and the liver as a
whole signals peripheral tissues to indicate the sugar source of the circulating
metabolites. These signals may be related to the presence of metabolites such as
triglycerides and specifically fructose. Thus peripheral tissues, like skeletal muscle,
would respond in a specific manner to these signals by changing the
phospho-dephosphorylation levels of several key proteins, thereby inducing alterations
in the physiology of these cells. The response of each tissue to the specific signals from
the liver would depend on the processing mechanisms involved. For instance, the
presence of GLUT 5 in muscle cells would be explained as a specific response
mechanism for fructose-induced circulating function modulators. In summary, on the
basis of our results, we propose the existence of a general in vivo mechanism that
utilizes sugars as specific modulators of overall body sugar utilization.
20
575
580
585
20

Acknowledgments
We thank Mrs. Anna Adrover for her skilled technical assistance in the experiments
and Mrs. Tanya Yates for her thoroughly English writing revision of the manuscript.
This work has been partially supported by Grants AGL2008-01792GAN (Dirección
General de Programas y Transferencia de Conocimiento, Ministerio de Ciencia e
Innovación, Spain) and SAF2009-07559 from the Spanish Ministerio de Ciencia e
Innovación, and CIBERDEM from the Instituto de Salud Carlos III (Spain). All of the
funding needed for this study has been provided by the aforementioned institutions.
21
590
595
Author Contributions
Conceived and designed the experiments: JMFN, AMGF, JERG. Performed the
experiments: JMFN, LRLL, AO, AMGF, JERG. Analyzed the data: JERG. Contributed
reagents/materials/analysis tools: JMFN, JJG, JERG. Wrote the paper: JERG.
22
600
References
1. Nakagawa T, Hu H, Zharikov S, Tuttle KR, Short RA, Glushakova O, Ouyang
X, Feig DI, Block ER, Herrera-Acosta J, Patel JM Johnson RJ. A causal role for
uric acid in fructose-induced metabolic syndrome Am J Physiol Renal Physiol
290:F625-F631, 2006.
2. Kelley GL, Allan G, Salman S. High dietary fructose induces a hepatic stress
response resulting in cholesterol and lipid dysregulation. Endocrinology 145:
548-555, 2004.
3. Shapiro A. Mu W, Roncal C, Cheng K-Y, Johnson RJ, Scarpace PJ.
Fructose-induced leptin resistance exacerbates weight gain in response to
subsequent high-fat feeding. Am J Physiol Regul Integr Comp Physiol 295:
R1370-R1375, 2008.
4. Glushakova O, Kosugi T, Roncal C, Mu W, Heinig M, Cirillo P, Sánchez-Lozada
LG, Johnson RJ, Nakagawa T. Fructose induces the inflammatory molecule
ICAM-1 in endothelial cells. Am Soc Nephrol 19: 1712-1720, 2008
5. Gaby AR. Adverse effects of dietary fructose. Altern Med Rev 10: 294-306,
2005.
6. Rutledge AC, Adeli K. Fructose and the metabolic syndrome: pathophysiology
and molecular mechanisms. Nutr Rev 65: S13-S23, 2007.
7. Thorburn AW, Storlien LH, Jenkins AB, Khouri S, Kraegen EW.
Fructose-induced in vivo insulin resistance and elevated plasma triglyceride
levels in rats. Am J Clin Nutrition 49: 1155-1163, 1989.
8. Mayes PA. Intermediary metabolism of fructose. Am J Clin Nutr 58:754S-765S,
1993.
9. Nordlie RC, Foster JD, Lange AJ. Regulation of glucose production by the liver.
Annu Rev Nutr 19: 379-406, 1999.
10. Campbell M, Allen WE, Silversides JA, Trimble ER. Glucose-induced
phosphatidylinositol 3-kinase and mitogen-activated protein kinase–dependent
upregulation of the platelet-derived growth factor-receptor potentiates vascular
smooth muscle cell chemotaxis. Diabetes 52: 519–526, 2003
11. Wu D, Peng F, Zhang B, Ingram AJ, Kelly DJ, Gilbert RE, Gao B, Krepinsky JC.
PKC-β1 mediates glucose-induced Akt activation and TGF-β1 upregulation in
mesangial cells. J Am Soc Nephrol 20: 554-566, 2009
23
605
610
615
620
625
630
635

12. Konrad RJ, Dean RM, Young RA, Billings PC, WOLF BA. Glucose-induced
tyrosine phosphorylation of p125 in beta cells and pancreatic islets: a novel
proximal signal in insulin secretion. J Biol Chem 271: 24179–24186, 1996.
13. Donnelly R, Chang H, Azhar S, Reaven GM. Tissue-dependent activation of
protein kinase C in fructose-induced insulin resistance. Endocrine 3: 129-133,
1995.
14. Fernández-Novell JM, Ballester J, Altirriba J, Ramió-Lluch L, Barberà A, Gomis
E, Guinovart JJ, Rodríguez-Gil JE. Glucose and fructose as functional
modulators of overall dog, but not boar sperm function. Reprod Fertil Develop
23: 1-13.
15. Massagué J, Guinovart, JJ. Insulin control of rat hepatocyte glycogen synthase
and phosphorylase in the absence of glucose. FEBS Lett 82: 317-320, 1977.
16. Bradford MM. A rapid and sensitivemethod for the quantitation of microgram
quantities of protein utilizing the principle of protein-dye binding. Anal Biochem
72: 248-254, 1976.
17. Michal G. Glucose 6-phosphate. In: Methods of Enzymatic Analysis, edited by
Bergmeyer: Verlag Chemie, Weinheim, p 191-197, 1984.
18. Lambrecht M, Transtschold D. ATP determination with hexokinase and glucose
6-phosphate dehydrogenase. In: Methods of Enzymatic Analysis, edited by
Bergmeyer HU: Verlag Chemie, Weinheim, p 543-551, 1984.
19. Falcieri E, Coco R, Mariani AR, Gobbi P, Santi P. Membrane modifications in
the course of hepatocyte isolation. Cytotechnology 4: 251-259, 1990.
20. Bruni C, Porter KR. The fine structure of the parenchymal cell of the normal rat
liver. I. General observations. Am J Pathol 46: 691–755, 1965.
21. Latta M, Künstle G, Leist M, Wendel A. Metabolic depletion of ATP by fructose
inversely controls CD95- and tumor necrosis factor receptor 1-mediated hepatic
apoptosis. J Exp Med 191:1975-1985, 2000.
22. Bais R, James HM, Rofe AM, Conyers RA. The purification and properties of
human liver ketohexokinase. A role for ketohexokinase and
fructose-bisphosphate aldolase in the metabolic production of oxalate from
xylitol. Biochem J 230: 53–60, 1985.
23. Creighton SR, McClure AM, Watrous BJ, Hansen RJ. Hexose-ATP
phosphotransferases: Comparative aspects—III. Interrelationships of animal
hexokinases. Comparative Biochem Physiol 42: 509-516, 1972.
24
640
645
650
655
660
665
670

24. Tanaka A, Inoue A, Takeguchi A, Washizu T, Bonkobara M, Arai T. Comparison
of expression of glucokinase gene and activities of enzymes related to glucose
metabolism in livers between dog and cat. Vet Res Commun 29:477-485, 2005.
25. Asipu A, Hayward BE, O'Reilly J, Bonthron DT. Properties of normal and
mutant recombinant human ketohexokinases and implications for the
pathogenesis of essential fructosuria. Diabetes 52: 2426–2432, 2003.
26. Hundal HS, Darakhshan F, Kristiansen S, Blakemore SJ, Richter EA. GLUT5
expression and fructose transport in human skeletal muscle. Adv Exp Med Biol
441: 35-45, 1998.
27. Fillat C, Gómez-Foix AM, Guinovart JJ. Stimulation of glucose utilization by
fructose in isolated rat hepatocytes. Arch Biochem Biophys 300: 564-569, 1993.
28. Van Schaftingen E, Vandercammen A. Stimulation of glucose phosphorylation
by fructose in isolated rat hepatocytes. Eur J Biochem 179: 173-177, 1989.
25
675
680
685
25

Figure 1. General scheme of protein distribution for the mini-array analysis.
Figure 2. Mini-array analysis of the serine phosphorylation status of several
proteins involved in overall cell function and the regulation of cell cycle in whole
rat liver and skeletal muscle after oral loading of different amounts of glucose and
fructose. The mini-array analysis and the distribution of the proteins are described in
the Material and Methods section and Figure 1. Healthy adult rats were subjected to an
oral glucose or fructose load, as described in the Material and Methods section. The
serine-phosphorylation levels of each spot in the mini-arrays were then analyzed.
Control: rats that were not subjected to an oral load. Saline: rats subjected to a mock
oral load with xx mL of saline solution (0.9%; w/v, NaCl in fresh drinking water).
Glucose 1/4: animals subjected to an oral load of 65 mg glucose/100 g body weight.
Glucose 1/2: animals subjected to an oral load of 125 mg glucose/100 g body weight.
Glucose: animals subjected to an oral load of 250 mg glucose/100 g body weight.
Fructose: animals subjected to an oral load of 280 mg fructose/100 g body weight. C-:
negative controls. Liver: whole liver extracts. Muscle: whole skeletal muscle extracts.
The Figures shows a representative image for five separate experiments. Negative
controls were designed as described in the Material and Methods section.
Figure 3. Mini-array analysis of the serine phosphorylation status of several
proteins involved in overall cell function and the regulation of cell cycle in isolated
hepatocytes and cultured skeletal muscle cells after incubation with a range of
concentrations of glucose, fructose or glucose plus fructose. The mini-array analysis
and the distribution of the proteins are described in the Material and Methods section
and Figure 1. Isolated hepatocytes and skeletal muscle cell cultures were obtained and
incubated as described in the Material and Methods section. The serine-phosphorylation
levels of each spot in the mini-arrays were then analyzed. Control: cells incubated for 5
min without the presence of any monosaccharide. Glucose: cells incubated for 5 min in
the presence of 10 mM glucose. Fructose: hepatocytes incubated for 5 min in the
presence of 10 mM fructose. Glucose+Fructose: cells incubated for 5 min in the
presence of 10 mM glucose plus 75 µM fructose. Hepatocytes: isolated hepatocytes.
Muscle: skeletal muscle cell cultures. The figures shows a representative image for five
separate experiments.
26
690
695
700
705
710
715

Figure 4. Diagram explaining the postulated hypothesis given to explain the
specific effects of fructose and glucose on the overall function of liver and skeletal
muscle cells after ingestion of/incubation with these sugars. Following this
hypothesis, peri-portal hepatocytes respond to glucose or fructose in a specific manner,
depending on the sugar-specific changes that intracellular G 6P and ATP levels undergo
in these cells and, perhaps, other unknown signalling mechanisms. The response of
these cells is communicated to other hepatic cells and the liver as a whole signals
peripheral tissues; this signalling, which is probably based on the presence or absence of
micromolar concentrations of fructose in circulating blood, in addition to other putative,
unknown signalling mechanisms, indicates that the circulating metabolites derive from
either glucose or fructose. Peripheral tissues, like skeletal muscle, would then respond
in a specific manner to these signals by changing the phospho-dephosphorylation levels
of several key proteins, thus inducing an alteration in the physiology of these cells.
27
720
725
730

Table 1. Values of glycemia, fructosemia and insulinemia in rats subjected to either an oral glucose or
fructose load.
Control Saline Glucose 1/4 Glucose 1/2 Glucose Fructose Glycemia (mM) 5.9±0.3a 5.4±0.5a 7.0±0.4b 9.5±0.6c 13.0±1.1d 9.8±0.9c
Fructosemia (µM) 3.9±3.0a 3.9±3.5a 1.7±1.6a 1.1±1.1a 7.4±6.8a 73.8±7.0b
Insulinemia (mIU/L) 62.3±9.9a 84.1±9.6a 220.7±11.1b 217.4±10.8b 251.6±12.3c 193.0±11.2b
The experimental groups are described in the Materials and Methods section. Different superscripts in arow indicate significant (P<0.05) differences following the statistical analysis described in the Materialand Methods section. Thus, data marked with an “a” in superscript are significantly different from thosemarked with any other letter in the same file. Results are expressed as means±S.E.M. for 5 individualsin each experimental group.
Table 2. Relative increase in serine phosphorylation levels of selected liver proteins in rats subjected toeither an oral glucose or fructose load.
Control Saline Glucose 1/4 Glucose 1/2 Glucose Fructose
Cyclin D3 96.1±4.9a 100.0±5.1a 96.6±4.7a 104.3±5.6a* 180.9±6.4b 147.2±6.7c*
PI3
kinase/p85
88.3±6.4a 100.0±7.1a 101.8±7.3a 117.3±7.6a 117.3±7.7a 123.9±7.7b
Total PKC 89.2±5.7a 100.0±6.2a 108.2±6.7a 121.0±7.0a 137.4±6.5b 121.0±5.3a
ERK-2 92.2±4.7a 100.0±5.1a 100.6±5.0a 121.7±5.8a 151.1±6.2b 127.8±6.0b
PTP1B 79.9±5.8a 100.0±5.9a 102.7±6.0a 104.5±5.7a 123.0±5.7b 107.2±5.7a
PTP2 (SH) 91.2±3.8a 100.0±4.0a 104.0±4.6a 107.7±5.3a* 120.1±5.9a 142.4±6.2b*
c-kit 98.0±3.3a 100.0±3.7a 103.0±3.2a 109.5±4.8a 131.1±4.7b 114.9±4.8a
Clathrin 78.6±4.2a 100.0±5.0a 100.6±4.9a 103.2±4.9a 134.1±5.6b 100.7±4.0a
Clusterin 93.5±4.0a 100.0±4.4a 86.9±4.7a 100.6±4.7a* 92.1±3.9a 130.4±4.9b*
Table shows proteins from arrays in which significant (P<0.05) differences above 25% were obtainedcompared to control or saline. Results are expressed in arbitrary units, transforming the intensityobtained to 100 in control points. Different superscript letters in a row indicate significant (P<0.05)differences among values from the same row. Thus, data marked with an “a” in superscript aresignificantly different from those marked with any other letter in the same file. Additionally, superscriptasterisks indicate significant (P<0.05) differences between Glucose 1/2 values and Fructose ones. In bothcases, differences were established following the statistical analysis described in the Material andMethods section. Acronyms for the proteins are described in Figure 1 while the experimental groups aredescribed in the Materials and Methods section. Results are means±S.E.M. for 5 individuals in eachgroup.
28
735
740
745
750
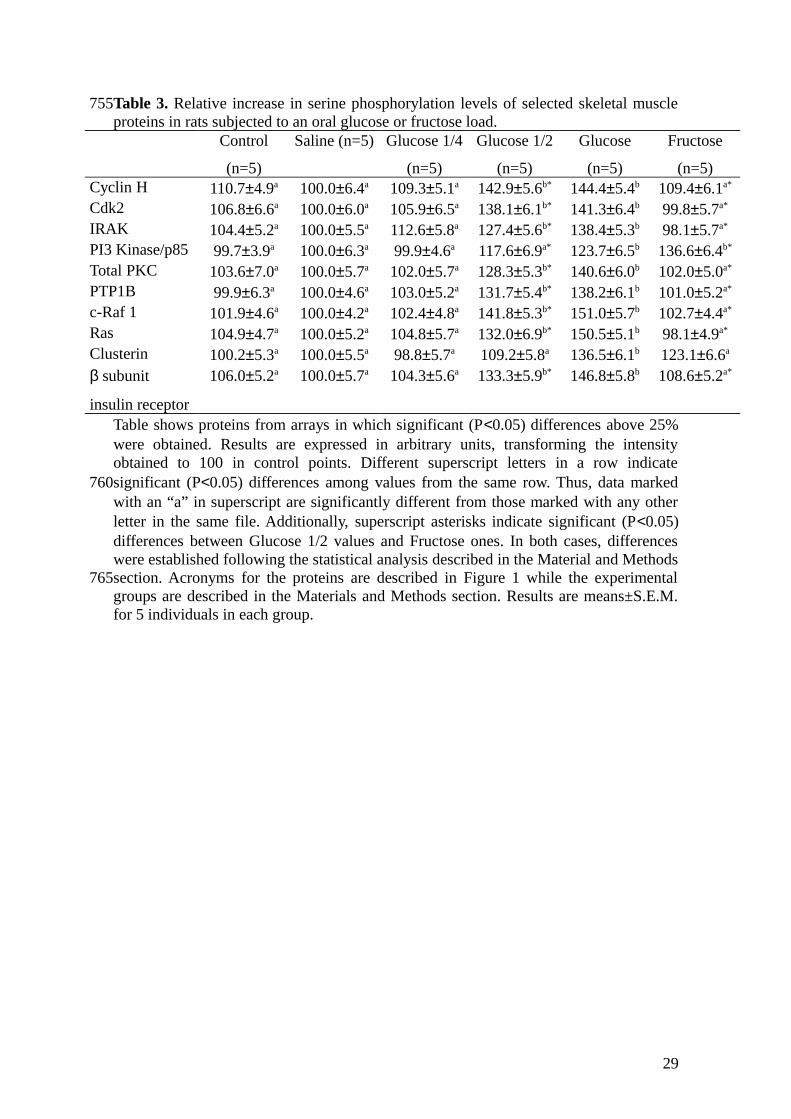
Table 3. Relative increase in serine phosphorylation levels of selected skeletal muscleproteins in rats subjected to an oral glucose or fructose load.
Control
(n=5)
Saline (n=5) Glucose 1/4
(n=5)
Glucose 1/2
(n=5)
Glucose
(n=5)
Fructose
(n=5)Cyclin H 110.7±4.9a 100.0±6.4a 109.3±5.1a 142.9±5.6b* 144.4±5.4b 109.4±6.1a*
Cdk2 106.8±6.6a 100.0±6.0a 105.9±6.5a 138.1±6.1b* 141.3±6.4b 99.8±5.7a*
IRAK 104.4±5.2a 100.0±5.5a 112.6±5.8a 127.4±5.6b* 138.4±5.3b 98.1±5.7a*
PI3 Kinase/p85 99.7±3.9a 100.0±6.3a 99.9±4.6a 117.6±6.9a* 123.7±6.5b 136.6±6.4b*
Total PKC 103.6±7.0a 100.0±5.7a 102.0±5.7a 128.3±5.3b* 140.6±6.0b 102.0±5.0a*
PTP1B 99.9±6.3a 100.0±4.6a 103.0±5.2a 131.7±5.4b* 138.2±6.1b 101.0±5.2a*
c-Raf 1 101.9±4.6a 100.0±4.2a 102.4±4.8a 141.8±5.3b* 151.0±5.7b 102.7±4.4a*
Ras 104.9±4.7a 100.0±5.2a 104.8±5.7a 132.0±6.9b* 150.5±5.1b 98.1±4.9a*
Clusterin 100.2±5.3a 100.0±5.5a 98.8±5.7a 109.2±5.8a 136.5±6.1b 123.1±6.6a
β subunit
insulin receptor
106.0±5.2a 100.0±5.7a 104.3±5.6a 133.3±5.9b* 146.8±5.8b 108.6±5.2a*
Table shows proteins from arrays in which significant (P<0.05) differences above 25%were obtained. Results are expressed in arbitrary units, transforming the intensityobtained to 100 in control points. Different superscript letters in a row indicatesignificant (P<0.05) differences among values from the same row. Thus, data markedwith an “a” in superscript are significantly different from those marked with any otherletter in the same file. Additionally, superscript asterisks indicate significant (P<0.05)differences between Glucose 1/2 values and Fructose ones. In both cases, differenceswere established following the statistical analysis described in the Material and Methodssection. Acronyms for the proteins are described in Figure 1 while the experimentalgroups are described in the Materials and Methods section. Results are means±S.E.M.for 5 individuals in each group.
29
755
760
765
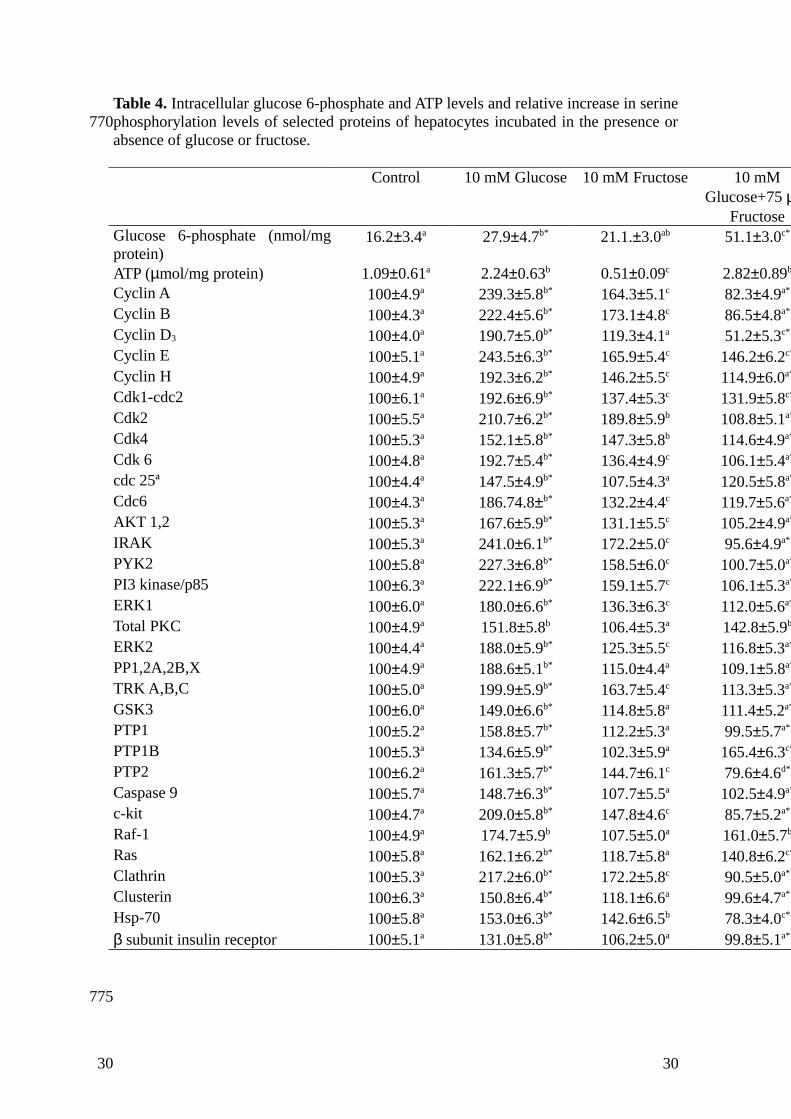
Table 4. Intracellular glucose 6-phosphate and ATP levels and relative increase in serinephosphorylation levels of selected proteins of hepatocytes incubated in the presence orabsence of glucose or fructose.
Control 10 mM Glucose 10 mM Fructose 10 mMGlucose+75 µ
FructoseGlucose 6-phosphate (nmol/mgprotein)
16.2±3.4a 27.9±4.7b* 21.1.±3.0ab 51.1±3.0c*
ATP (µmol/mg protein) 1.09±0.61a 2.24±0.63b 0.51±0.09c 2.82±0.89b
Cyclin A 100±4.9a 239.3±5.8b* 164.3±5.1c 82.3±4.9a*
Cyclin B 100±4.3a 222.4±5.6b* 173.1±4.8c 86.5±4.8a*
Cyclin D3 100±4.0a 190.7±5.0b* 119.3±4.1a 51.2±5.3c*
Cyclin E 100±5.1a 243.5±6.3b* 165.9±5.4c 146.2±6.2c*
Cyclin H 100±4.9a 192.3±6.2b* 146.2±5.5c 114.9±6.0a*
Cdk1-cdc2 100±6.1a 192.6±6.9b* 137.4±5.3c 131.9±5.8c*
Cdk2 100±5.5a 210.7±6.2b* 189.8±5.9b 108.8±5.1a*
Cdk4 100±5.3a 152.1±5.8b* 147.3±5.8b 114.6±4.9a*
Cdk 6 100±4.8a 192.7±5.4b* 136.4±4.9c 106.1±5.4a*
cdc 25ª 100±4.4a 147.5±4.9b* 107.5±4.3a 120.5±5.8a*
Cdc6 100±4.3a 186.74.8±b* 132.2±4.4c 119.7±5.6a*
AKT 1,2 100±5.3a 167.6±5.9b* 131.1±5.5c 105.2±4.9a*
IRAK 100±5.3a 241.0±6.1b* 172.2±5.0c 95.6±4.9a*
PYK2 100±5.8a 227.3±6.8b* 158.5±6.0c 100.7±5.0a*
PI3 kinase/p85 100±6.3a 222.1±6.9b* 159.1±5.7c 106.1±5.3a*
ERK1 100±6.0a 180.0±6.6b* 136.3±6.3c 112.0±5.6a*
Total PKC 100±4.9a 151.8±5.8b 106.4±5.3a 142.8±5.9b
ERK2 100±4.4a 188.0±5.9b* 125.3±5.5c 116.8±5.3a*
PP1,2A,2B,X 100±4.9a 188.6±5.1b* 115.0±4.4a 109.1±5.8a*
TRK A,B,C 100±5.0a 199.9±5.9b* 163.7±5.4c 113.3±5.3a*
GSK3 100±6.0a 149.0±6.6b* 114.8±5.8a 111.4±5.2a*
PTP1 100±5.2a 158.8±5.7b* 112.2±5.3a 99.5±5.7a*
PTP1B 100±5.3a 134.6±5.9b* 102.3±5.9a 165.4±6.3c*
PTP2 100±6.2a 161.3±5.7b* 144.7±6.1c 79.6±4.6d*
Caspase 9 100±5.7a 148.7±6.3b* 107.7±5.5a 102.5±4.9a*
c-kit 100±4.7a 209.0±5.8b* 147.8±4.6c 85.7±5.2a*
Raf-1 100±4.9a 174.7±5.9b 107.5±5.0a 161.0±5.7b
Ras 100±5.8a 162.1±6.2b* 118.7±5.8a 140.8±6.2c*
Clathrin 100±5.3a 217.2±6.0b* 172.2±5.8c 90.5±5.0a*
Clusterin 100±6.3a 150.8±6.4b* 118.1±6.6a 99.6±4.7a*
Hsp-70 100±5.8a 153.0±6.3b* 142.6±6.5b 78.3±4.0c*
β subunit insulin receptor 100±5.1a 131.0±5.8b* 106.2±5.0a 99.8±5.1a*
30
770
775
30

Isolated hepatocytes were incubated for 5 min in the absence or the presence of 10 mMglucose or 10 mM fructose, as described in the Material and Methods. The table showsglucose 6-phosphate and ATP intracellular levels, as well as the relative degree of serinephosphorylation of proteins in which differences above 25% were obtained. Results areexpressed in arbitrary units, transforming the intensity obtained to 100 in control points.Different superscript letters in a row indicate significant (P<0.05) differences amongvalues from the same row. Thus, data marked with an “a” in superscript are significantlydifferent from those marked with any other letter in the same file. Additionally,superscript asterisks indicate significant (P<0.05) differences between 10 mM Glucosevalues and 10 mM Glucose+75µM Fructose ones. In both cases, differences wereestablished following the statistical analysis described in the Material and Methodssection. Acronyms for the proteins are described in Figure 1. Results are means±S.E.M.for 5 separate experiments.
31
780
785
790
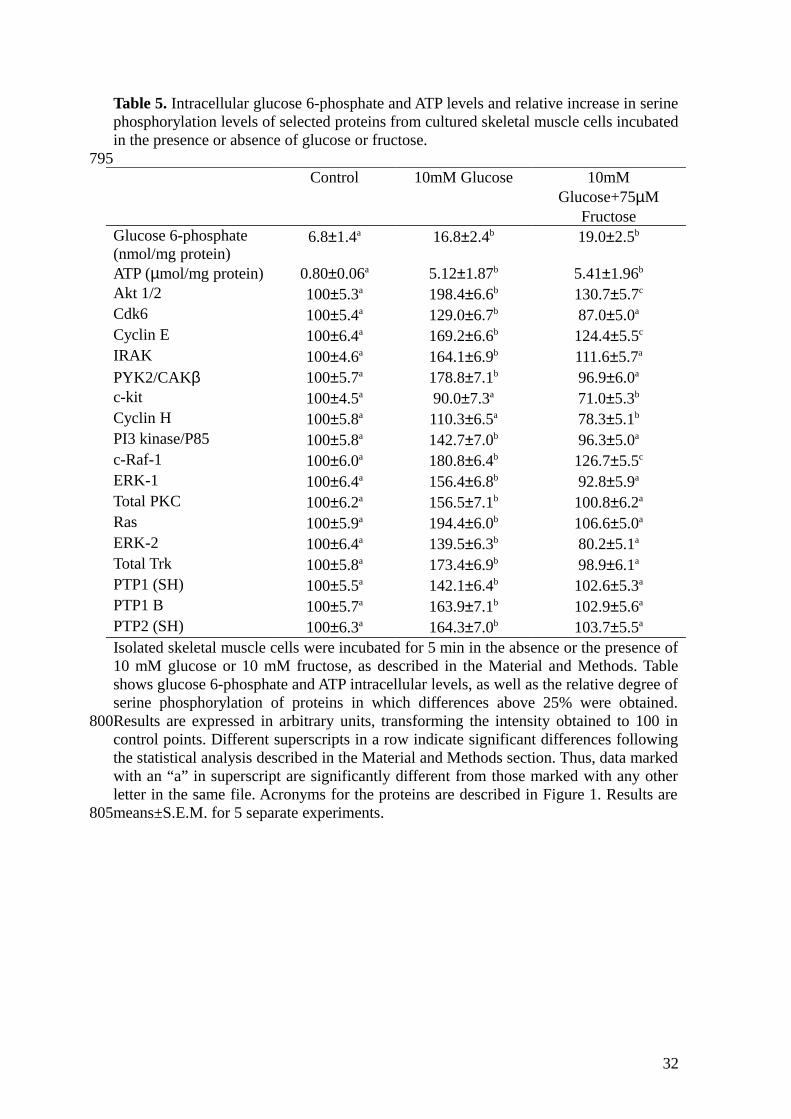
Table 5. Intracellular glucose 6-phosphate and ATP levels and relative increase in serinephosphorylation levels of selected proteins from cultured skeletal muscle cells incubatedin the presence or absence of glucose or fructose.
Control 10mM Glucose 10mMGlucose+75µM
FructoseGlucose 6-phosphate (nmol/mg protein)
6.8±1.4a 16.8±2.4b 19.0±2.5b
ATP (µmol/mg protein) 0.80±0.06a 5.12±1.87b 5.41±1.96b
Akt 1/2 100±5.3a 198.4±6.6b 130.7±5.7c
Cdk6 100±5.4a 129.0±6.7b 87.0±5.0a
Cyclin E 100±6.4a 169.2±6.6b 124.4±5.5c
IRAK 100±4.6a 164.1±6.9b 111.6±5.7a
PYK2/CAKβ 100±5.7a 178.8±7.1b 96.9±6.0a
c-kit 100±4.5a 90.0±7.3a 71.0±5.3b
Cyclin H 100±5.8a 110.3±6.5a 78.3±5.1b
PI3 kinase/P85 100±5.8a 142.7±7.0b 96.3±5.0a
c-Raf-1 100±6.0a 180.8±6.4b 126.7±5.5c
ERK-1 100±6.4a 156.4±6.8b 92.8±5.9a
Total PKC 100±6.2a 156.5±7.1b 100.8±6.2a
Ras 100±5.9a 194.4±6.0b 106.6±5.0a
ERK-2 100±6.4a 139.5±6.3b 80.2±5.1a
Total Trk 100±5.8a 173.4±6.9b 98.9±6.1a
PTP1 (SH) 100±5.5a 142.1±6.4b 102.6±5.3a
PTP1 B 100±5.7a 163.9±7.1b 102.9±5.6a
PTP2 (SH) 100±6.3a 164.3±7.0b 103.7±5.5a
Isolated skeletal muscle cells were incubated for 5 min in the absence or the presence of10 mM glucose or 10 mM fructose, as described in the Material and Methods. Tableshows glucose 6-phosphate and ATP intracellular levels, as well as the relative degree ofserine phosphorylation of proteins in which differences above 25% were obtained.Results are expressed in arbitrary units, transforming the intensity obtained to 100 incontrol points. Different superscripts in a row indicate significant differences followingthe statistical analysis described in the Material and Methods section. Thus, data markedwith an “a” in superscript are significantly different from those marked with any otherletter in the same file. Acronyms for the proteins are described in Figure 1. Results aremeans±S.E.M. for 5 separate experiments.
32
795
800
805