in-vitro simulation of acute ischemic stroke
TRANSCRIPT

University of Arkansas, FayettevilleScholarWorks@UARKBiomedical Engineering Undergraduate HonorsTheses Biomedical Engineering
5-2018
In-Vitro Simulation of Acute Ischemic StrokePaolo Garcia
Follow this and additional works at: http://scholarworks.uark.edu/bmeguht
Part of the Cardiovascular Diseases Commons, Cardiovascular System Commons, Circulatoryand Respiratory Physiology Commons, and the Other Biomedical Engineering and BioengineeringCommons
This Thesis is brought to you for free and open access by the Biomedical Engineering at ScholarWorks@UARK. It has been accepted for inclusion inBiomedical Engineering Undergraduate Honors Theses by an authorized administrator of ScholarWorks@UARK. For more information, pleasecontact [email protected], [email protected].
Recommended CitationGarcia, Paolo, "In-Vitro Simulation of Acute Ischemic Stroke" (2018). Biomedical Engineering Undergraduate Honors Theses. 58.http://scholarworks.uark.edu/bmeguht/58

In-Vitro Simulation of Acute Ischemic Stroke
Undergraduate Honors Thesis by Paolo M. Garcia Department of Biomedical Engineering
College of Engineering University of Arkansas
Honors Advisors: Drs. Morten and Hanna Jensen Graduate Student Advisor: Anne Preut
Submitted on 26 April 2018

Honors Thesis: In-Vitro Simulation of Acute Ischemic Stroke Paolo M. Garcia
2
Table of Contents ABSTRACT ..................................................................................................................................................3 ARTICLE I. BACKGROUND ...................................................................................................................4
SECTION 1.1. OVERVIEW OF ACUTE ISCHEMIC STROKE AND TREATMENT METHODS ...................................4 SECTION 1.2. DEVICE DESIGN CRITERIA .....................................................................................................5 SECTION 1.3. DEVICE DESIGN PROCESS ......................................................................................................8
ARTICLE II. MATERIALS .......................................................................................................................9 SECTION 2.1. STANDARD, NON-ELECTRONIC MATERIALS ............................................................................9 SECTION 2.2. VESSEL CREATION MATERIALS .............................................................................................10 SECTION 2.3. FLOW LOOP FUNCTION AND REGULATION EQUIPMENT .......................................................10
ARTICLE III. METHODS .......................................................................................................................11 SECTION 3.1. PRE-VESSEL FLOW LOOP COMPONENTS ..............................................................................11 SECTION 3.2. VESSEL AND CONSTRUCTION PROCESS ................................................................................12 SECTION 3.3. POST-VESSEL FLOW LOOP COMPONENTS ............................................................................13 SECTION 3.4. MEASUREMENT VALIDATION ................................................................................................14 SECTION 3.5. CLOT INSERTION MECHANISM VALIDATION .........................................................................17
ARTICLE IV. RESULTS ..........................................................................................................................18 ARTICLE V. DISCUSSION .....................................................................................................................20
SECTION 5.1. PROJECT ACCOMPLISHMENTS ..............................................................................................20 SECTION 5.2. PROJECT LIMITATIONS AND SOLUTIONS ...............................................................................21
ARTICLE VI. CONCLUSION .................................................................................................................22 ARTICLE VII. FUTURE WORK ............................................................................................................23 ACKNOWLEDGEMENTS ......................................................................................................................24 REFERENCES ...........................................................................................................................................25

Honors Thesis: In-Vitro Simulation of Acute Ischemic Stroke Paolo M. Garcia
3
Abstract
Acute ischemic stroke (AIS) is a condition that involves the occlusion of a blood vessel
within the brain, effectively preventing the passage of oxygen and nutrients. AIS is highly
prevalent in the United States, where nearly 795,000 strokes happen per year and 87% of those are
ischemic. From a medical standpoint, the obstructing clot can be removed with the use of a stroke
retrieval device. However, a need arises for testing the aforementioned devices on a patient’s
specific vascular geometries in order to increase the likelihood of a successful procedure. Outlined
is a process for developing a physical simulation of patient vasculature with adjustable parameters
for practical use.
This in-vitro model is created to address the following biological factors: temperature,
volumetric flow rate, vessel measurements, and fluid properties of blood. Overall, the model
system functions as a continuous loop that draws fluid from a heated reservoir kept at a temperature
slightly above 37°C; temperature is observed through the use of a thermocouple thermometer.
Similarly, volumetric flow rate is monitored through the use of a flow meter attached to a
numerical display. In this case, a hollow silicone vessel was created with particular attention to the
lengths and diameters of the internal carotid artery, middle cerebral artery, and basilar artery. The
vessel is included as a part of the flow loop.
A clot can be introduced into the system to occlude the vessel; this can be visually observed
from directly above. Once the vessel has been occluded, the retrieval device can be inserted and
used. The resulting parameter changes can be observed. Overall, the factors physically represented
in this simulation provide a fairly accurate depiction of cardiovascular biology in relation to AIS.

Honors Thesis: In-Vitro Simulation of Acute Ischemic Stroke Paolo M. Garcia
4
Article I. Background Section 1.1. Overview of Acute Ischemic Stroke and Treatment Methods
One of the most prominent conditions affecting public health on the global scene is stroke,
which is considered third in a lineup of the most expensive medical conditions affecting developed
countries [2]. In the United States alone, this condition is very prevalent; a recent study suggested
that there are near 795,000 cases of stroke in the US per year [3]. From a pathophysiological
standpoint, stroke is primarily of the acute ischemic type, which is also known as AIS for short.
Approximately 87% of all cases of strokes are classified as ischemic [3], where blood flow to the
brain becomes obstructed by a blood clot. This occlusion can prevent the delivery of blood to the
surrounding tissues, creating deficits in oxygen and nutrient supply. In this situation, the main
priority of a medical professional will usually be directed towards the reestablishment of blood
flow to the affected blood vessels and the removal of the clot itself. The terms for these outcomes
are reperfusion and recanalization
respectively.
These goals can be achieved
with the use of a clot retrieval device
(Figure 1) such as the Penumbra or the
Solitaire mechanical thrombectomy
devices for recanalization; recent
studies have shown that there is a
clinical advantage in using a retrieval
device in comparison to standard
intravenous therapy with thrombolytic
Figure 1. Various thrombolytic treatment
procedures [2].
Honors Thesis: In-Vitro Simulation of Acute Ischemic Stroke Paolo M. Garcia
5
agents such as tPA. Intra-arterial thrombolysis (IAT) has a recanalization rate of less than 50% in
comparison to 85% in mechanical thrombectomy devices [2]. This statistical outcome, though
encouraging, reveals the possibility of increasing the success rate of the aforementioned devices.
This can be achieved through the use of a patient-specific simulation system to aid in device design
and validation. Such a model could have potential applications in the fields of clinical research
and education. For instance,
Section 1.2. Device Design Criteria The primary goal of this work was to develop a highly customizable system to
simulate human vasculature for the purposes of thrombolytic device testing and clotting
process observation. For the purposes of evaluating the finished product, it was necessary for the
completed system to be able to meet the following four criteria outlined below:
1. The model must be able to accurately represent vascular geometry, specifically vessel
lengths, diameters, and angles.
2. The model must be able to sustain a fluid flow rate within the typical boundaries of blood
flow within brain vasculature.
3. The model must be able to maintain a temperature consistent with biological temperature.
4. The model must be able to simulate the biological occurrences during AIS in some way.

Honors Thesis: In-Vitro Simulation of Acute Ischemic Stroke Paolo M. Garcia
6
To meet the first condition,
particular focus was directed toward the
internal carotid artery (ICA), middle
cerebral artery (MCA), and basilar artery
(BA), as they are integral components in
brain blood flow. The ICA in particular
provides blood to the MCA among other
arteries. The BA receives blood from
both vertebral arteries and is connected
to the Circle of Willis (Figure 2), much
like the MCA and ICA [1]. Even though
there is not a direct connection between
the BA and the ICA, the completed model will have the vessel representing the ICA bifurcate into
the vessels representing the MCA and BA. The purpose of this change was due to the prevalence
of bifurcations in the cardiovascular system as a whole. The angle of the model’s bifurcation will
be set at an angle of 74.4°, an average of physiological parameters.
In addition, utilization of average vessel lengths and diameters will account for the highly
variable differences in morphometry across individuals. For simplification purposes, the ICA
portion of the model was set as 8.5 centimeters long and 5 millimeters in diameter. The model’s
MCA length for this project was set at 20 millimeters and the MCA diameter was 2.5 millimeters.
Lastly, the measurements of the BA were set at a length of 30 millimeters and a diameter of 3
millimeters. Through the use of rounded lengths and diameters for the ICA, MCA, and BA, the
need for connection pieces was eliminated in the final model.
Figure 2. The circle of Willis and associated
vasculature [1].

Honors Thesis: In-Vitro Simulation of Acute Ischemic Stroke Paolo M. Garcia
7
The normal parameters of blood flow within the human brain are highly variable between
the vessels in question. Therefore, the range of flow rates in which the model should function
should include all of these values. The necessary range for this model was established as 100 to
240 milliliters per minute to represent normal cerebral blood flow. All of the aforementioned
chosen parameters for the vessel, from length measurements to flow rates, are detailed in Table 1
below in conjunction with their corresponding physiological values for comparison.
Table 1. Parameters for bifurcation model in comparison to physiological conditions.
Physiological Conditions Bifurcation Model Conditions
ICA MCA BA ICA MCA BA
Length 8.9 cm [6] 20 mm [12]
29.15 mm [16] 8.5 cm 20 mm 30 mm
Diameter 5.1 mm [11]
2.8 mm [15]
3.2 mm [14] 5 mm 2.5 mm 3 mm
Flow Rate 240 ml/min [11]
121 ml/min [15]
100 to 200 ml/min
[13] 100 to 240 ml/min
Bifurcation Angle 37° to 133° [4] 74.4°
To address the third criterion, temperature in the model was set as 37°C. This temperature
represents biological temperature though slight fluctuations may occur. The system must also be
able to prevent major heat loss at the source of fluid flow, so sufficient insulation is required.
Lastly, the final condition details a need for simulating the events associated with AIS. To
do this, the model must have a blood clot entry point and mechanism for clot insertion. Once the
blood clot is inserted, it will cause fluid turbulence and the formation of circular eddies. According
to previous work, flow phantoms such as the model that serves as the focus of this project can be
tested by loading a blood clot into a syringe and flushing it through the system [8]. The
Honors Thesis: In-Vitro Simulation of Acute Ischemic Stroke Paolo M. Garcia
8
aforementioned procedure was chosen for administering the clot into this particular model.
However, a guidewire will not be used as part of clot insertion.
Section 1.3. Device Design Process
Since the requirements of the finished model and system have been detailed, the process
of developing the model itself is the next point of focus. Development of the model had to progress
from the four criterion earlier in this section to a finished product. Firstly, an artificial vessel
interior corresponding to the morphological measurements selected in the first criteria had to be
created. From there, the vessel interior was to be surrounded by silicone rubber and removed,
leaving a hollow vessel.
The process of creating the model is partially based on various flow phantom creations
with changes to specific parts of the process. Similar to some previous work on simulating
vasculature, the material representing the tunica intima and surrounding structures is silicone [5]
[9]. Through the use of silicone, the finished product would be able to withstand the shear stress
similar to that created by blood flow. A peristaltic pump was also the ideal driving mechanism
behind the volumetric flow rate for simulated vasculature [8]. The most prominent difference
between the aforementioned methods and the one developed is that the vessel created in this project
was an original creation that was not taken from patient magnetic resonance imaging scans [8] [9].
The completion of this project involves the simulation of conditions similar to AIS in a
setting that does not require integration with a living organism; all clot retrieval device testing with
this model can be conducted in a silicone vessel.

Honors Thesis: In-Vitro Simulation of Acute Ischemic Stroke Paolo M. Garcia
9
Article II. Materials Section 2.1. Standard, Non-Electronic Materials
For the non-electronic and non-powered components of this in-vitro simulation of acute
ischemic stroke (except for the vessel itself), the following materials were used.
• Platinum-cured Silicone MasterFlex Tubing, 8 mm I.D.
• MasterFlex Pulse Dampener
• Acrylic Tubing, 8 mm I.D.
• Polyethylene Y-connection pieces
• Polyethylene T-connection piece
• Plastic two-input stopcock with plug
• Plastic one-input stopcock
• Generic Food-Safe Silicone Tubing, 5 mm I.D.
• Generic Food-Safe Silicone Tubing, 2.5 mm I.D.
• Styrofoam Packing Peanuts
• Glass Mason Jar
• 8 mm to 5 mm Plastic connection piece
• Ring Stand and Clamp
• Plastic Tubing Clamps
• Syringe
• Electrical tape
• Silicone caulk

Honors Thesis: In-Vitro Simulation of Acute Ischemic Stroke Paolo M. Garcia
10
Section 2.2. Vessel Creation Materials
For the development of the customized vessel bifurcation, the following materials and
equipment were used. Parts of the list removed for confidentiality purposes.
• MagikMold Silicone Rubber Base and Catalyst
• Plexiglass Sheets, ¼” in thickness
• Epilog Mini Laser Cutter
• Vacuum Pump & Chamber
• Electronic Balance
Section 2.3. Flow Loop Function and Regulation Equipment
In addition, the following electronic devices and equipment were used in the regulation and
maintenance of flow loop conditions.
• MasterFlex Peristaltic Pump with Head Attachment
• Flow Technology Inc. FTO 3NITW Turbine Flow Meter
• Flow Technology Inc. SRI-2 Indicator
• VWR Thermal Bath with Metal Lid
• Omega HH802U Thermocouple Thermometer

Honors Thesis: In-Vitro Simulation of Acute Ischemic Stroke Paolo M. Garcia
11
Article III. Methods
Section 3.1. Pre-Vessel Flow Loop Components
Much like body circulation,
the system utilized for the in-vitro
simulation of acute ischemic stroke
is a closed flow loop (Figure 3). The
whole system is exhibited in the
picture. In this case, the factors that
are being monitored and directly
controlled are both the temperature
of the fluid in the system and the
flow rate. Heated distilled water is drawn out of a container in an insulated water bath (Figure 4)
at slightly above body temperature through the use of a peristaltic pump (Figure 5). The pulsativity
of the fluid flowing through the pump is greatly decreased by passing through a pulse dampener.
The fluid is then passed through a turbine flow meter, which displays the flow rate on an electronic
Figure 3. An overhead view of the whole system.
Figure 4. Water bath, insulated with Styrofoam and covered during operation.
Figure 5. Peristaltic pump with head attachment and pulse dampener.

Honors Thesis: In-Vitro Simulation of Acute Ischemic Stroke Paolo M. Garcia
12
indicator. A calibration curve created before flow loop assembly is used to calculate the actual
flow rate. After being measured, the fluid travels past the thermocouple and toward a y-shaped
polypropylene piece, where one branch provides a point for clot and device insertion. Directly
after the clot insertion point is the simulated vessel bifurcation.
Section 3.2. Vessel and Construction Process
The vessel itself (Figure 6) is a bifurcation that focuses on the characteristics of three
arteries near the circle of Willis: the ICA, the MCA, and the BA. These three vessels were
amalgamated into a bifurcation to be used for device testing. As previously mentioned, several
factors were taken into
consideration; literature research
provided typical vessel
tortuosity/angle values of the
aforementioned arteries, average
diameters, and average lengths.
An acrylic box was laser-cut with
the Epilog Mini to accommodate
the specific measurements of the
vessel lumen with the tubing attached. This silicone tubing had inner diameters that matched up
exactly with the outer diameters of the vessel lumen branches to prevent gaps. If a clot were to be
introduced into the system, the main aim for simulation is that the clot would be stuck near the
bifurcation and cause an occlusion that could be removed with a device.
Figure 6. The silicone vessel.
Honors Thesis: In-Vitro Simulation of Acute Ischemic Stroke Paolo M. Garcia
13
Section 3.3. Post-Vessel Flow Loop Components
Once the fluid passes through the vessel, it returns to the container in the water bath. From
there, the water is reheated and returned through the flow loop once again. The bypass system,
however, is not included in the pathway of the flow loop during normal function. Designed for
pressure relief, it is attached with a polyethylene T-connector piece and is present before the
thermocouple insertion point. Throughout the process of preliminary testing, this bypass has been
shut with a clamp. It would only be opened should the turbulence in the system be noticeably
damaging to the vessel upon visual observation.
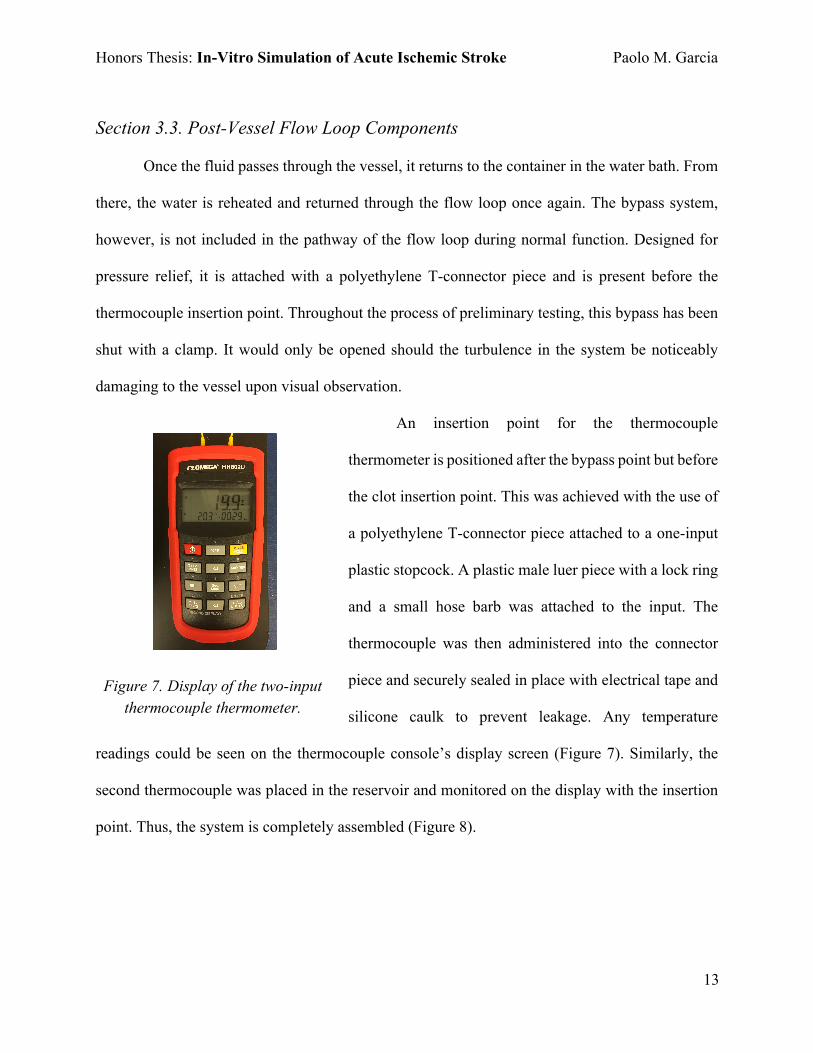
An insertion point for the thermocouple
thermometer is positioned after the bypass point but before
the clot insertion point. This was achieved with the use of
a polyethylene T-connector piece attached to a one-input
plastic stopcock. A plastic male luer piece with a lock ring
and a small hose barb was attached to the input. The
thermocouple was then administered into the connector
piece and securely sealed in place with electrical tape and
silicone caulk to prevent leakage. Any temperature
readings could be seen on the thermocouple console’s display screen (Figure 7). Similarly, the
second thermocouple was placed in the reservoir and monitored on the display with the insertion
point. Thus, the system is completely assembled (Figure 8).
Figure 7. Display of the two-input thermocouple thermometer.

Honors Thesis: In-Vitro Simulation of Acute Ischemic Stroke Paolo M. Garcia
14
Figure 8. Simplified diagram of the flow loop system.
Section 3.4. Measurement Validation
In order to test the flow loop’s functionality, water was initially used as the circulating
fluid. The accuracy of volumetric flow rate readings was ensured for the particular pump used
through the creation of a calibration curve. Readings for mass of water displaced, indicator value,
and time elapsed were taken over a range of pump RPM values from 20 to 70; this process was
repeated three times to ensure accuracy. First, the pump was attached in series with a pulse
dampener and the turbine flow meter, the latter of which was connected to the indicator (Figure
9). Unlike the flow loop, the assembled
complex was an open system as it
started and ended in different points.
The pump itself drew room temperature
distilled water from a reservoir and
passed it through the pulse dampener
and flow meter, where it exited the
system into a cup on a tared balance. Figure 9. Turbine flow meter (Left) and indicator (Right).
Honors Thesis: In-Vitro Simulation of Acute Ischemic Stroke Paolo M. Garcia
15
The pump was allowed to run for approximately one minute for each reading; the exact times at
which the pump was halted were measured with a
stopwatch. From this, the volumetric flow rate in
mL/min (Q) for a particular reading could be
calculated (Equations 1 and 2) given the mass in
grams (m), the time elapsed in minutes (t), and the
density of water (r), which was assumed to be 1 g/ml.
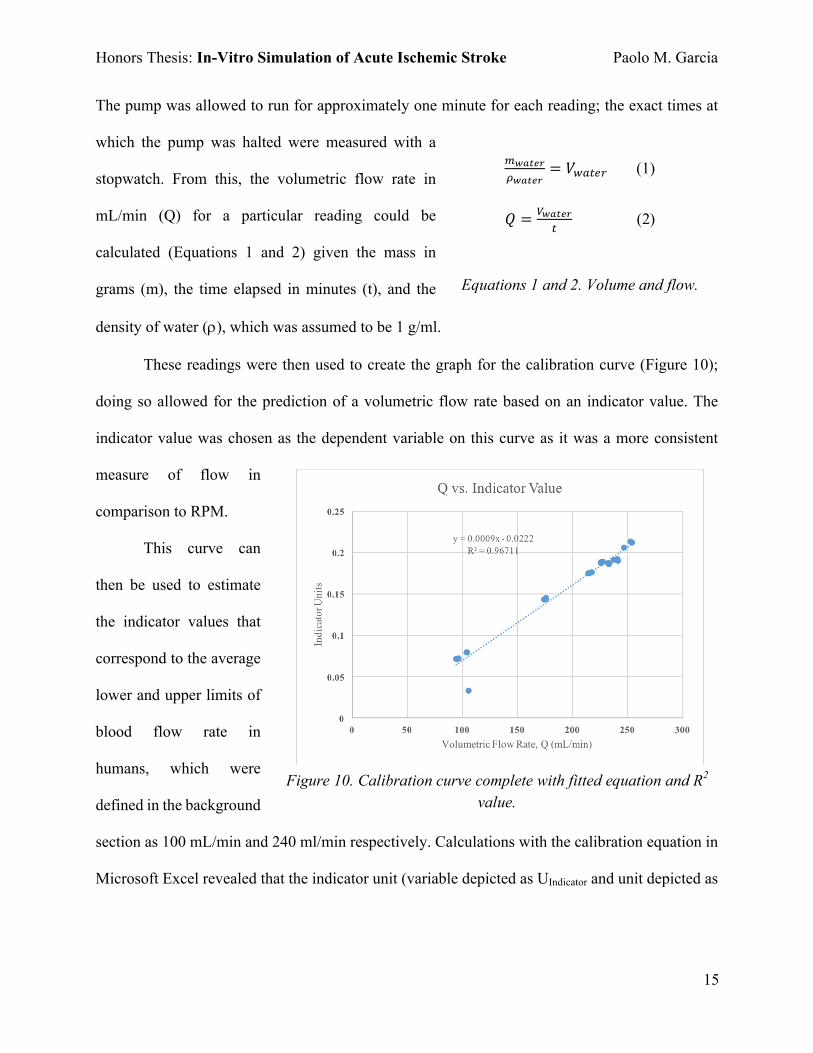
These readings were then used to create the graph for the calibration curve (Figure 10);
doing so allowed for the prediction of a volumetric flow rate based on an indicator value. The
indicator value was chosen as the dependent variable on this curve as it was a more consistent
measure of flow in
comparison to RPM.
This curve can
then be used to estimate
the indicator values that
correspond to the average
lower and upper limits of
blood flow rate in
humans, which were
defined in the background
section as 100 mL/min and 240 ml/min respectively. Calculations with the calibration equation in
Microsoft Excel revealed that the indicator unit (variable depicted as UIndicator and unit depicted as
!"#$%&'"#$%&
= 𝑉*+,-. (1)
𝑄 = 0"#$%&
, (2)
Equations 1 and 2. Volume and flow.
Figure 10. Calibration curve complete with fitted equation and R2 value.

Honors Thesis: In-Vitro Simulation of Acute Ischemic Stroke Paolo M. Garcia
16
IU) of 0.0678
corresponds to 100
mL/min and 0.1938
corresponds to 240
mL/min (Equation 3).
Therefore, flow
within the flow loop must be constantly regulated so that the indicator value reads between 0.0678
and 0.1978 to maintain biological accuracy.
To verify the accuracy of the calculations, the peristaltic pump was adjusted until the lower
and upper boundary rates were achieved. Once this was done, the flow rates were verified through
the previously mentioned process involving a mass balance, stopwatch, and Equations 1 and 2.
The testing was also repeated three times for both
boundary values. Afterwards, the percent error of each
flow rate data point in comparison to those calculated
from the calibration curve was taken using a formula
(Equation 4).
After the verification of the volumetric flow rate parameters to be used in the simulation,
it was necessary to ascertain the exact value that the thermal bath needed to be set to. As the fluid
in question is pumped through the system, it inevitably loses heat to the surrounding environment.
Therefore, the temperature at the clot insertion point should be closest to normal body temperature.
To discern the correct setting, a one-way flow system was used; the liquid in question would be
drawn from a heated reservoir by the pump and transferred throughout the entire flow loop system.
However, instead of returning the fluid to the reservoir, the temperature of the output was measured
𝑈23456+,7.(𝑄) = 0.0009𝑄 − 0.0222 (3)
𝑈23456+,7.?100 𝑚𝐿 𝑚𝑖𝑛F G = 0.0009×100 − 0.0222 = 0.0678 𝐼𝑈
𝑈23456+,7.?240 𝑚𝐿 𝑚𝑖𝑛F G = 0.0009×240 − 0.0222 = 0.1938 𝐼𝑈
Equation 3. Use of calibration equation to calculate upper and lower bounds of Q.
% 𝑒𝑟𝑟𝑜𝑟 =|𝑄+6,T+U − 𝑄,V-7.-,56+U|
𝑄,V-7.-,56+U
Equation 4. Percent Error

Honors Thesis: In-Vitro Simulation of Acute Ischemic Stroke Paolo M. Garcia
17
immediately in a separate container and recorded. The value obtained from the tubing output was
then compared to the temperature of the thermal bath to determine how close the value was to
36°C and how much heat was lost. Heat loss along the tubing after the vessel model was also taken
into account as the temperature exiting the system should be slightly less than 37°C; doing so
would satisfy the assumption that the fluid within direct proximity to the vessel would be closest
to biological temperature conditions. By monitoring the area temperature with the thermocouple
thermometer, the necessary adjustments to the water bath setting could be made in order to
maintain the correct temperature within the vessel.
Section 3.5. Clot Insertion Mechanism Validation
The clot insertion point was kept shut during measurement and only opened when testing
the insertion mechanism. This was achieved by creating three “clots” of sponge that were cut into
small cylindrical portions of a set diameter of 2.5 millimeters and varying lengths. The first piece
of sponge had a length of 2.5 millimeters, forming a small and nearly spherical clot analog. The
second pieces and third pieces had lengths of 1 centimeter and 2 centimeters respectively, forming
more cylindrical shapes. These sponges were briefly hydrated and loaded into the insertion point,
which has a female luer piece for attaching a syringe. Using the same circulatory fluid in the loop,
the two-input stopcock was adjusted to allow flow from the syringe, which in turn would push the
clot into the system. Once complete, the insertion point could be shut off and reopened again to
insert a device guidewire for testing purposes.
Honors Thesis: In-Vitro Simulation of Acute Ischemic Stroke Paolo M. Garcia
18
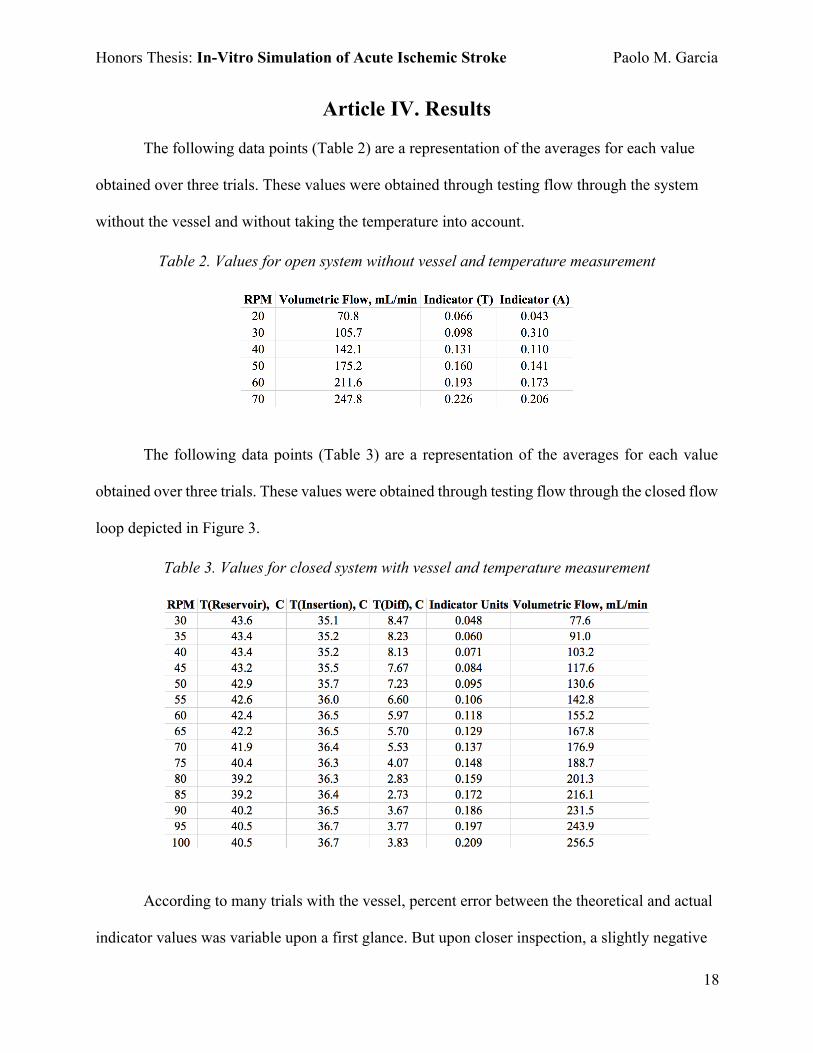
Article IV. Results
The following data points (Table 2) are a representation of the averages for each value
obtained over three trials. These values were obtained through testing flow through the system
without the vessel and without taking the temperature into account.
Table 2. Values for open system without vessel and temperature measurement
The following data points (Table 3) are a representation of the averages for each value
obtained over three trials. These values were obtained through testing flow through the closed flow
loop depicted in Figure 3.
Table 3. Values for closed system with vessel and temperature measurement
According to many trials with the vessel, percent error between the theoretical and actual
indicator values was variable upon a first glance. But upon closer inspection, a slightly negative

Honors Thesis: In-Vitro Simulation of Acute Ischemic Stroke Paolo M. Garcia
19
correlation (Figure 11) could be found between indicator value percent error and volumetric flow
rate. As the flow rate gradually increased, the percent error of the turbine flow readings was
generally lessened.
Figure 11. Negative correlation between flow and percent error.
All three sizes of sponge “clots” were successfully administered into the tubing through
the clot insertion point upon testing. In addition, there were no leaks at the various connection
points in the most recent iteration of the system. Therefore, the risk of continued circulatory fluid
loss was greatly decreased.

Honors Thesis: In-Vitro Simulation of Acute Ischemic Stroke Paolo M. Garcia
20
Article V. Discussion Section 5.1. Project Accomplishments The system as a whole is a fairly accurate representation of AIS in that nearly all of the
physiological parameters were represented by components in the flow loop. For instance, the
peristaltic pump provides consistent movement of fluid in the system, much like the human heart.
The water bath functions as a parallel to the homeostatic mechanisms that regulate temperature in
the body. All of the tubing and the vessel itself serve as a representation of arteries and veins. Each
component was carefully configured to work together to form an accurate simulation.
In the process of constructing and designing the system, all of the criteria detailed in
Section 1.2 was also successfully met to create a fully functional product. Physiological accuracy
in factors such as flow rate, temperature, and shape gives the model a unique advantage over other
models; some only account for one or two of the aforementioned factors. In addition, no other
stroke simulation devices on the market sell all of the model’s components together as a completed
flow loop. Lastly, the high degree of system customizability offers the user more control; certain
components can be removed or altered to suit the needs of the user. This is best observed in the
creation of the vessel, as the dimensions of the lumen can be adjusted in size through the use of
computer-assisted design software or even based on patient vascular geometry.
When considering the values in Table 3, it is important to take into consideration that the
system was open ended and water was flowing out of the tubing to be measured and recorded.
While this occurred, the flow meter display screen exhibited a value other than zero. Thus, it can
be said that volumetric flow is present whenever the monitor displays a positive, nonzero value.
Since each reading for indicator units in Tables 2 and 3 meet these conditions, then the fluid is

Honors Thesis: In-Vitro Simulation of Acute Ischemic Stroke Paolo M. Garcia
21
traveling in the tubing whenever the pump is enabled. Flow within the system conclusively
functions.
Section 5.2. Project Limitations and Solutions There were only a few challenging aspects in the maintenance of basic flow loop function.
However, each of these challenges were resolved. For instance, the volumetric flow rates displayed
on the indicator would fluctuate rapidly on certain occasions. This fluctuation would make the
recording of data points less accurate, considering that the fluctuations were over a wide range.
However, this issue was resolved with the incorporation of the pulse dampener, which would
reduce the fluctuations to a smaller difference of around 0.003 indicator units between the higher
and lower measurements at a particular RPM.
The second most challenging issue facing the system’s development was the maintenance
of system temperature at 37°C. Since the water bath device functioned through cyclic heating,
fluctuations in temperature would occur near the vessel. The fluctuations occurred from between
roughly 35°C to 38°C. This problem was addressed with the addition of added insulation and
constant monitoring of the temperature indicated on both the water bath heating device and the
thermocouple thermometer’s display.
The main limitation of this device is the lack of a system that controls pressure within the
vessel. Since most components of the model are at roughly the same height off of the ground
(except for the area of tubing close to the vertically oriented flow meter), the pressure at these
points can be presumed to be equal. This situation, however, is not a realistic depiction of pressure
in the human body. A proposal to address this limitation is detailed later, in Article VII of this
document.

Honors Thesis: In-Vitro Simulation of Acute Ischemic Stroke Paolo M. Garcia
22
Article VI. Conclusion
The finished model and flow loop system as a whole successfully fulfill all of the criteria
detailed in the background section of this document. Through the use of SolidWorks to design the
vessel, the model accurately represented average diameters and lengths of the ICA, MCA, and BA.
Physiological temperature of 37°C was achieved through the use of an insulated reservoir, a water
bath, and constant monitoring. Flow rates close to those recorded in the aforementioned arteries
were repeatedly achieved in the system and recorded for future use. Lastly, a mechanism for
administering clots into the vessel was developed and successfully functioned in directing clot-
like entities towards the correct sections of the system. With these things in mind, this system for
the in-vitro simulation of AIS is a fairly accurate model that can be used to test new thrombolysis
devices. The completion of this model also opens up a wide variety of potential projects and
changes (detailed in the next section) that can be conducted in the future.

Honors Thesis: In-Vitro Simulation of Acute Ischemic Stroke Paolo M. Garcia
23
Article VII. Future Work
The development and completion of this project has created a wealth of opportunities for
system customization. Combined with the use of a device and clot, an interventional cardiologist
has the opportunity to rehearse the procedure before it takes place.
Visibility of the vessels in question can also be adjusted through the use of a more opaque
material in conjunction with an imaging modality such as ultrasound to reflect the possible
conditions of a true AIS treatment procedure. The material used can also be chosen to more
accurately depict the stress-strain properties of endothelial cell tissues.
In order to make the model even more accurate, pressure drop across the vessel can be
simulated with the use of elevated reservoirs on adjustable scissor lifts. The height differential can
be adjusted to increase or decrease the hydrostatic pressure, which can be quantified by pressure
transducers.
The rheological and dynamic properties of blood can also be simulated with the use of a
blood analogue. In this case, a 40% by weight mixture of glycerin and water can be used with the
system [10]. Red dye can also be added to simulate the color of blood.
Lastly, the flow loop regulatory devices can be connected to both a data acquisition device
and a computer in order to simplify continuous observation and handling of data points. This
process can even be taken a step further with the implementation of an automated pressure valve
attached to the bypass tubing; the valve can release to relieve pressure buildup should the system
pressure exceed a maximum threshold.

Honors Thesis: In-Vitro Simulation of Acute Ischemic Stroke Paolo M. Garcia
24
Acknowledgements Many special thanks to my advisors, Drs. Morten and Hanna Jensen for sponsoring my
thesis, offering valuable insights and guidance, as well as providing the resources to work on this
project. I would also like to thank Anne Preut for also providing great guidance, mentoring me in
the research process, and aiding me in the laboratory. Lastly, I would like to acknowledge Aksel
Terkelsen and Bailey Stinnett for their contributions.

Honors Thesis: In-Vitro Simulation of Acute Ischemic Stroke Paolo M. Garcia
25
References [1] Alastruey J, Parker KH, Peiró J, Byrd SM, Sherwin SJ. Modelling the circle of Willis to assess
the effects of anatomical variations and occlusions on cerebral flows. Journal of biomechanics.
2007 Jan 1;40(8):1794-805.
[2] Asadi H, Dowling R, Yan B, Wong S, Mitchell P. Advances in endovascular treatment of
acute ischaemic stroke. Internal medicine journal. 2015 Aug 1;45(8):798-805.
[3] Benjamin EJ, Blaha MJ, Chiuve SE, Cushman M, Das SR, Deo R, Floyd J, Fornage M,
Gillespie C, Isasi CR, Jiménez MC. Heart disease and stroke statistics-2017 update: a report from
the American Heart Association. Circulation. 2017 Mar;135(10):e146-603.
[4] Canham PB, Finlay HM. Morphometry of medial gaps of human brain artery branches. Stroke.
2004 May 1;35(5):1153-7.
[5] Chong CK, How TV, Harris PL. Flow visualization in a model of a bifurcated stent-graft.
Journal of Endovascular Therapy. 2005 Aug;12(4):435-45.
[6] Choudhry FA, Grantham JT, Rai AT, Hogg JP. Vascular geometry of the extracranial carotid
arteries: an analysis of length, diameter, and tortuosity. Journal of neurointerventional surgery.
2015 Apr 3:neurintsurg-2015.
[7] Duffy S, Farrell M, McArdle K, Thornton J, Vale D, Rainsford E, Morris L, Liebeskind DS,
MacCarthy E, Gilvarry M. Novel methodology to replicate clot analogs with diverse composition
in acute ischemic stroke. Journal of neurointerventional surgery. 2016 Apr 28:neurintsurg-2016.
[8] Ionita CN, Mokin M, Varble N, Bednarek DR, Xiang J, Snyder KV, Siddiqui AH, Levy EI,
Meng H, Rudin S. Challenges and limitations of patient-specific vascular phantom fabrication
using 3D Polyjet printing. InMedical Imaging 2014: Biomedical Applications in Molecular,
Honors Thesis: In-Vitro Simulation of Acute Ischemic Stroke Paolo M. Garcia
26
Structural, and Functional Imaging 2014 Mar 13 (Vol. 9038, p. 90380M). International Society for
Optics and Photonics.
[9] Kaufmann TA, Wong KC, Schmitz-‐Rode T, Steinseifer U. Mimicking of cerebral
autoregulation by flow-‐dependent cerebrovascular resistance: a feasibility study. Artificial organs.
2012 Apr 1;36(4).
[10] Nestler F, Bradley AP, Wilson SJ, Timms DL, Frazier OH, Cohn WE. A hybrid mock
circulation loop for a total artificial heart. Artificial organs. 2014 Sep 1;38(9):775-82.
[11] Oktar SO, Yücel C, Karaosmanoglu D, Akkan K, Ozdemir H, Tokgoz N, Tali T. Blood-flow
volume quantification in internal carotid and vertebral arteries: comparison of 3 different
ultrasound techniques with phase-contrast MR imaging. American journal of neuroradiology. 2006
Feb 1;27(2):363-9.
[12] Pai SB, Varma RG, Kulkarni RN. Microsurgical anatomy of the middle cerebral artery.
Neurology India. 2005 Apr 1;53(2):186.
[13] Siegelbaum SA, Hudspeth AJ. Principles of neural science. Kandel ER, Schwartz JH, Jessell
TM, editors. New York: McGraw-hill; 2000 Jan (Vol. 4, p. 1414).
[14] Smoker WR, Corbett JJ, Gentry LR, Keyes WD, Price MJ, McKusker S. High-resolution
computed tomography of the basilar artery: 2. Vertebrobasilar dolichoectasia: clinical-pathologic
correlation and review. American Journal of Neuroradiology. 1986 Jan 1;7(1):61-72.
[15] Stock KW, Wetzel SG, Lyrer PA, Radü EW. Quantification of blood flow in the middle
cerebral artery with phase-contrast MR imaging. European radiology. 2000 Oct 1;10(11):1795-
800.

Honors Thesis: In-Vitro Simulation of Acute Ischemic Stroke Paolo M. Garcia
27
[16] Zhang DP, Zhang SL, Zhang JW, Zhang HT, Fu SQ, Yu M, Ren YF, Ji P. Basilar artery
bending length, vascular risk factors, and pontine infarction. Journal of the neurological sciences.
2014 Mar 15;338(1):142-7.