in vitro pro-apoptotic and anti-migratory effects of
TRANSCRIPT

In vitro pro-apoptotic and anti-migratory effects of Marantodes pumilum (Blume) Kuntze and Ficus deltoidea L.
extracts on prostate cancer cell lines.
MOHD MUKRISH MOHD HANAFI
PhD thesis
UCL School of Pharmacy
2017
Supervisors:
Dr. Jose Prieto-Garcia, UCL School of Pharmacy
Prof. Simon Gibbons, UCL School of Pharmacy

2
Declaration Statement
I Mohd Mukrish Mohd Hanafi confirm that the work presented in this thesis is my
own. This work has been conducted at the School of Pharmacy, University
College London between June 2013 and October 2016 under the supervision of
Dr. Jose Prieto-Garcia and Prof. Simon Gibbons. I certify that research
described is original and have written all the text and that all source materials,
which have already appeared in publication, have been clearly acknowledged by
suitable citations.
Date :
Signature :
Mohd Mukrish Mohd Hanafi
Department of Pharmaceutical and Biological Chemistrty
UCL School of Pharmacy
29-39 Brunswick Square
WC1N 1AX London

3
To Ayah, Mak, & Ina

4
Abstract
This thesis evaluates the in vitro pro-apoptotic and anti-migratory effects of Marantodes
pumilum Blume Kuntze and Ficus deltoidea L. plants on prostate cancer cells,
characterising both their mechanism of actions on some of the main Hallmarks of
Cancer, and their chemistry with a view to contribute to future chemopreventive
strategies. Plant materials of M. pumilum (MP) F. deltoidea var. angustifolia (FD1) and
F. deltoidea var. deltoidea (FD2) were obtained from dedicated farms in Southern
Malaysia. The crude methanolic extract was partitioned into n-hexane (MPh, FD1h,
FD2h) chloroform (MPc, FD1c, FD2c) and aqueous extracts (MPa, FD1a, FD2a). Active
fractions (GI50<30 μg/mL) based on prostate cancer cell line, PC3, Sulforhodamine B
staining were further fractionated. Active compound/s were identified using
spectroscopic methods. In vitro mechanistic studies on PC3 cells were conducted to
investigate the mode of death of PC3 cells and effects of the active extracts on PC3
cells migration and invasion. MPc, FD1c and FD2c extracts induced cell death via
apoptosis as evidenced by nuclear DNA fragmentation, accompanied by a significant
increase in MMP depolarization (P<0.05), activation of caspases 3 and 7 (MPc P<0.01;
FD1c and FD2c P<0.05) in both PC3 and LNCaP cell lines. All active plant extracts up-
regulated Bax and Smac/DIABLO and down-regulated Bcl-2 (P<0.05). Only MPc
inhibited the expression of ALOX-5 mRNA gene expression (P<0.001). None resulted
cytotoxic against normal human fibroblast cells (HDFa) at the tested concentrations. All
active plant extracts inhibited both migration and invasion of PC3 cells (MPc; P<0.01,
FD1c and FD2c; P<0.05), achieved by down-regulation of both VEGF and CXCL-12
gene expressions (P<0.001). A monounsaturated 5-alkyl resorcinol was isolated as the
active compound present in the MPc extract. LC-MS dereplication identified isovitexin in
FD1c; and oleanolic acid, moretenol, betulin, lupenone and lupeol in FD2c. In
conclusion, evidence gathered in this study suggests a role for interaction of MPc, FD1c
and FD2c in three of the Hallmarks of Cancer in PC3 cells: (1) apoptosis by activating
of the intrinsic pathway, (2) inhibition of both migration and invasion by modulating the
CXCL12-CXCR4 axis, and (3) inhibiting angiogenesis by modulating VEGF-A
expression. The compounds identified and dereplicated in this study will be further
characterized and used for the standardization of the active extracts in the future.

5
Impact Statement
In 2011, a “Herbal Development Office” has been formed under the Ministry of
Agriculture (MoA) in Malaysia. This office is assigned with the task of outlining the
strategic direction, policies and regulation of research and development (R&D) clusters
focusing on the discovery, crop production and agronomy, standardization and product
development, toxicology/pre-clinical and clinical studies, and processing technology.
Preference has been given to a subset of 11 traditional plant species with high
economic potential. This list includes the two plants selected for this project namely
Marantodes pumilum (Blume) Kuntze (synonym Labisia pumila var pumila) and Ficus
deltoidea L. This project is designed to promote and protect the growth of a local herbal
industry, as well as producing high value herbal supplements and remedies. We have
successfully characterised the mechanism of actions that lead to prostate cancer cells
death and inhibition of both prostate cancer cells migration and invasion, which are
induced by the active extracts and fractions from these 2 plants species. This is the first
time such characterisation has been done; therefore the output of this project would
serve as a new knowledge to academia. Since more work needs to be done before the
output of this project can be used for human application, the immediate impact of it, is
to use the data collected in this project for research grant applications because funding
is essential in drug development. In the long run, based on the potential of the
standardized extracts of these plants, they could be further developed into herbal
remedies or supplements and then produced commercially. This will benefit everyone in
the supply chain starting from the farmers to entrepreneurs and the end-product users.

6
Table of Contents
Declaration Statement........................................................................................................2
Abstract....................................................................................................................................4
Impact Statement..................................................................................................................5
Table of Contents.................................................................................................................6
List of Figures......................................................................................................................13
List of Tables........................................................................................................................30
List of Abbreviations.........................................................................................................33
Acknowledgements...........................................................................................................40
1 Introduction....................................................................................................................43
1.1 Research Background....................................................................................................43
1.2 Problem Statement..........................................................................................................46
1.3 Hypothesis..........................................................................................................................46
1.4 Objectives of study..........................................................................................................47
2 Literature Review.........................................................................................................49
2.1 Prostate Cancer.................................................................................................................49
2.1.1 Incidence.......................................................................................................................................50
2.1.2 Risk Factors.................................................................................................................................52
2.1.3 Stages.............................................................................................................................................54

7
2.1.4 Pathophysiology of Prostate Cancer..............................................................................55
2.1.4.1 Chromosomal abnormalities and oncogenes....................................................................55
2.1.4.2 Androgen receptor...........................................................................................................................57
2.1.4.3 Metastasis............................................................................................................................................58
2.1.4.4 Arachidonic acid metabolism.....................................................................................................61
2.1.4.5 Angiogenesis......................................................................................................................................62
2.1.5 Treatment......................................................................................................................................65
2.1.5.1 Chemoprevention of Prostate cancer....................................................................................65
2.1.5.2 Management of Prostate cancer..............................................................................................67
2.2 Possible therapeutic targets for Prostate Cancer based on the major
hallmarks of cancer....................................................................................................................69
2.2.1 Resisting cell death: Role of Smac/DIABLO in cancer progression..............71
2.2.2 Activation of invasion and metastasis: Role of CXCL12/CXCR4 axis in
cancer metastasis.....................................................................................................................................75
2.2.3 Induction of Angiogenesis: Role of VEGF in angiogenesis................................78
2.3 Modern trends in the use of natural products in cancer prevention and
treatment.........................................................................................................................................82
2.3.1 R & D of Anticancer drugs from natural products....................................................85
2.3.2 R & D of nutraceuticals for prostate health.................................................................86
2.3.3 Development of Natural Anticancer Products from Malay Biodiversity........89
2.4 Marantodes pumilum (Blume) Kuntze.....................................................................90

8
2.4.1 Traditional Use...........................................................................................................................90
2.4.2 Anticancer Phytochemicals.................................................................................................92
2.5 Ficus deltoidea L..............................................................................................................96
2.5.1 Traditional Use...........................................................................................................................96
2.5.2 Anticancer Phytochemicals.................................................................................................97
3 Materials and Methods...........................................................................................102
3.1 Plant Material....................................................................................................................102
3.1.1 Plant Extraction........................................................................................................................103
3.1.2 Fractionation of plant extracts..........................................................................................103
3.1.3 Thin Layer Chromatography (TLC)...............................................................................104
3.1.4 Preparation of stock solution of extracts and fractions.......................................104
3.2 Cell Lines...........................................................................................................................105
3.3 Cell Culture Protocols..................................................................................................106
3.3.1 Sub-culture and Routine Maintenance........................................................................106
3.3.2 Cell passaging/sub-culturing.............................................................................................107
3.3.3 Cell Counting and Cell Viability.......................................................................................107
3.3.4 Cell Cryopreservation...........................................................................................................109
3.3.5 Cell Recovery...........................................................................................................................109
3.4 Proliferation and viability analysis..........................................................................110
3.4.1 Proliferation assay (SRB)...................................................................................................111

9
3.4.2 Mitochondrial viability Assay (MTT)..............................................................................113
3.4.3 Cells morphology....................................................................................................................114
3.5 Apoptosis detection......................................................................................................114
3.5.1.1 4’-6-Diamidino-2-phenylindole (DAPI) staining..............................................................117
3.5.1.2 Annexin V-FITC and Propidium Iodide staining............................................................117
3.5.1.3 Caspases 3/7 activity..................................................................................................................118
3.5.1.4 Determination of Mitochondrial Membrane potential (MMP)..................................118
3.5.1.5 Terminal deoxynucleotidyl transferase-mediated biotin dUTP Nick End
Labeling assay.....................................................................................................................................................119
3.6 Cell migration and Invasion study...........................................................................120
3.6.1 In Vitro cell migration assay..............................................................................................121
3.6.1.1 Oris™96-well 2D cell migration assay................................................................................121
3.6.1.2 Boyden chamber 3D migration assay.................................................................................122
3.6.2 In Vitro 3D cell invasion assay.........................................................................................123
3.7 Cell cycle distribution study......................................................................................125
3.8 Real-Time RT-qPCR Analysis....................................................................................125
3.8.1 mRNA Extraction and cDNA Synthesis......................................................................125
3.8.2 RT-qPCR Conditions and Analysis...............................................................................126
3.9 HPLC-DAD (High Performance liquid chromatography-diode array
detector)........................................................................................................................................128
3.10 Nuclear Magnetic Resonance (NMR)...................................................................128

10
3.11 Mass spectrometry......................................................................................................129
3.12 Fourier Transformed Infrared spectroscopy (FT-IR).....................................129
3.13 Ultra High Performance Liquid Chromatography (UHPLC) Mass
Spectrometry (MS)....................................................................................................................130
3.14 Statistical Analysis......................................................................................................130
4 Results and Discussion.........................................................................................132
4.1 Results................................................................................................................................132
4.1.1 Plant extractions......................................................................................................................132
4.1.2 HPLC Fingerprint....................................................................................................................134
4.1.2.1 HPLC Fingerprint analysis of Marantodes pumilum and Ficus spp....................134
4.1.3 In vitro cytotoxic effects of plant extracts on different human Prostate
Cancer cell lines......................................................................................................................................152
4.1.3.1 Effects of plant extracts on cells proliferation using sulfhorhodamine staining
assay (SRB)..........................................................................................................................................................152
4.1.3.2 Effects of plant extracts on cells viability using MTT (3-(4,5-dimethylthiazolyl-
2)-2,5-diphenyltetrazolium bromide) assay..........................................................................................153
4.1.4 Morphological changes of LNCaP and PC3 cell lines after treated with
active extracts of the plant extracts...............................................................................................156
4.1.5 Effect of the active extracts of the plants on apoptosis of prostate cancer
cell lines.......................................................................................................................................................167
4.1.5.1 DAPI staining...................................................................................................................................167
4.1.5.2 Annexin V-FITC and Propidium Iodide staining...........................................................172
4.1.5.3 Caspase 3 and 7 activity...........................................................................................................182

11
4.1.5.4 MMP depolarization in active plant extracts treated PC3 cell line.......................187
4.1.5.5 Nuclear DNA fragmentation.....................................................................................................190
4.1.5.6 PC3 cell death via apoptosis (instrinsic pathway) based on Bax, Bcl-2 and
Smac/DIABLO mRNA gene expression.................................................................................................194
4.1.6 Effect of the active extracts of the plants on the cell cycle of prostate
cancer cell lines.......................................................................................................................................200
4.1.7 Effect of the plant extracts on Arachidonic metabolism (ALOX-5)................205
4.1.8 Inhibition of PC3 cells migration and invasion.........................................................206
4.1.8.1 Active extracts of the plants suppressed Migration of PC3 cells in Vitro.........207
4.1.8.2 Active extracts of the plants suppressed invasion of PC3 cells in vitro............214
4.1.8.3 VEGF-A, CXCR4 and CXCL12 mRNA Gene expression........................................216
4.1.9 Identification of the active fractions from the plant extracts.............................219
4.1.9.1 Fractionation of the plant extracts........................................................................................219
4.1.9.2 Identification of the active fractions using SRB staining assay.............................234
4.1.10 Effects of the active fractions of the plant extracts on mRNA genes
expression..................................................................................................................................................237
4.1.10.1 Apoptosis-related Gene expression (Bcl-2, Bax, Smac-Diablo, ALOX-5)....237
4.1.10.2 Migration-related Gene expression (VEGF, CXCR4, CXCL12).........................239
4.1.11 Specificity study using normal Human Dermal Fibroblast cells...................240
4.1.12 Identification of the active principles from the plant extracts........................242
4.1.12.1 Bioguided isolation of monounsaturated Alkyl Resorcinol from MPc F30-33
fraction 242

12
4.1.12.2 Dereplication of Isovitexin from FD1c F43-51, Lupeol, Moretenol from FD2c
F29-33 and Oleanolic acid from FD2c F34-36 fractions................................................................259
4.1.12.3 Anti-proliferative activity of dereplicated compounds..............................................268
4.2 Discussions......................................................................................................................273
5 Conclusions and Future Work............................................................................282
5.1 Conclusion........................................................................................................................282
5.2 Future Work......................................................................................................................284
5.2.1 Future Phytochemical studies of the plants..............................................................286
5.2.2 In vivo study using Prostate cancer xenograft model..........................................287
5.2.3 Transcriptomics using Next Generation Sequencing (NGS)...........................288
5.2.4 In silico studies of selected phytochemicals.............................................................290
6 References...................................................................................................................292
7 Appendix......................................................................................................................322

13
List of Figures
FIGURE 2.1 POSTERIOR VIEW OF THE PROSTATE GLAND. ADAPTED FROM
BALLACCHINO (2015) 49
FIGURE 2.2 WORLDWIDE INCIDENCE AND MORTALITY RATE OF PROSTATE CANCER.
ADAPTED FROM FERLAY, SOERJOMATARAM ET AL. (2013) 51
FIGURE 2.3 STAGES OF PROSTATE CANCER. ADAPTED FROM HEALTHFAVO (2014) 55
FIGURE 2.4 THE PROCESS OF CANCER METASTASIS. ADAPTED FROM “THE
PATHOGENESIS OF CANCER METASTASIS: THE 'SEED AND SOIL' HYPOTHESIS
REVISITED” BY I. J. FIDLER, 2003. A. GROWTH OF PRIMARY TUMOURS REQUIRE
NUTRIENT THAT IS INITIALLY SUPPLIED BY SIMPLE DIFFUSION. B. THE GROWTH
OF TUMOUR MASS EXCEEDING 1-2 MM IN DIAMETER REQUIRES EXTENSIVE
VASCULARIZATION. C. LYMPHATIC CHANNELS, WHICH ARE CHARACTERIZED BY
THEIR THIN-WALLED VENULES, ACT AS THE MOST COMMON ROUTE FOR
TUMOUR-CELL ENTRY INTO THE CIRCULATION. D. TUMOUR CELLS THAT
SURVIVED THE CIRCULATION BECOME TRAPPED IN THE CAPILLARY BED OF
DISTANT ORGANS BY ADHERING EITHER TO EXPOSED CAPILLARY ENDOTHELIAL
CELLS OR SUBENDOTHELIAL BASEMENT MEMBRANE. E. EXTRAVASATION
OCCURS. F. PROLIFERATION OF THE TUMOUR CELLS AT DISTANT ORGAN
ACCOMPANIED BY MICROMETASTASIS. NATURE REVIEWS CANCER 3, 453-458.
COPYRIGHT 2003 BY NATURE PUBLISHING GROUP. ADAPTED WITH PERMISSION.
59
FIGURE 2.5 THE CLASSICAL ANGIOGENIC PROCESS. ADAPTED FROM “CIRCULATING
ENDOTHELIAL CELLS AS BIOMARKERS OF PROSTATE CANCER” BY H. D.
GEORGIOU, B. NAMDARIAN, N. M. CORCORAN, A. J. COSTELLO, AND C. M.
HOVENS, 2008, NATURE CLINICAL PRACTICE UROLOGY (2008) 5, 445-454.
COPYRIGHT 2008 BY NATURE PUBLISHING GROUP. ADAPTED WITH PERMISSION.
64
FIGURE 2.6 THE HALLMARKS OF CANCER. ADAPTED FROM “HALLMARKS OF CANCER:
THE NEXT GENERATION” BY D. HANAHAN, AND R. A. WEINBERG, 2011, CELL (2011)
144 (5), 646-674. COPYRIGHT 2011 BY ELSEVIER INC. ADAPTED WITH PERMISSION.
70

14
FIGURE 2.7 THE EXTRINSIC AND INTRINSIC APOPTOSIS. ADAPTED FROM “EXTRINSIC
VERSUS INTRINSIC APOPTOSIS PATHWAYS IN ANTICANCER CHEMOTHERAPY” BY
S. FULDA AND K-M. DEBATIN, 2006. APOPTOSIS SIGNALLING PATHWAYS.
APOPTOSIS PATHWAYS CAN BE INITIATED THROUGH TWO MAIN ENTRY SITES, AT
THE PLASMA MEMBRANE BY DEATH RECEPTOR PATHWAY OR AT THE
MITOCHONDRIA BY THE MITOCHONDRIAL-DRIVEN PATHWAY. STIMULATION OF
THE DEATH RECEPTOR PATHWAY (EXTRINSIC APOPTOSIS) INVOLVES LIGATION
TO THE TUMOR NECROSIS FACTOR (TNF) RECEPTOR SUPERFAMILY SUCH AS
CD95 OR TNF-RELATED APOPTOSIS-INDUCING LIGAND (TRAIL) RECEPTORS.
ACTIVATION OF THE DEATH RECEPTORS RESULTS IN RECRUITMENT OF THE
ADAPTOR MOLECULE FAS-ASSOCIATED DEATH DOMAIN (FADD) AND CASPASE-8.
UPON RECRUITMENT, CASPASE-8 BECOMES ACTIVATED AND INITIATES
APOPTOSIS BY CLEAVING AND ACTIVATING DOWNSTREAM EFFECTOR
CASPASES. THE MITOCHONDRIAL-DRIVEN PATHWAY (INTRINSIC APOPTOSIS) IS
INITIATED BY STRESS SIGNALS THROUGH THE RELEASE APOPTOGENIC
FACTORS SUCH AS CYTOCHROME C, APOPTOSIS INDUCING FACTOR (AIF), OR
SMAC/DIABLO FROM THE MITOCHONDRIAL INTERMEMBRANE SPACE.
CYTOCHROME C FORMS AN AGGREGATE CALLED APOPTOSOME COMPLEX WITH
APOPTOTIC PROTEASE ACTIVATING FACTOR 1 (APAF-1) AND CASPASE-9. THE
FORMATION OF THIS COMPLEX WILL ACTIVATE CASPASE-3 AND OTHER
DOWNSTREAM EFFECTOR CASPASES. SMAC/DIABLO PROMOTES CASPASE
ACTIVATION BY NEUTRALIZING THE INHIBITORY EFFECTS OF IAPS, WHEREAS IAF
CAUSE DNA CONDENSATION. ONCOGENE (2006) 25, 4798–4811. COPYRIGHT 2006
BY NATURE PUBLISHING GROUP. ADAPTED WITH PERMISSION. 72
FIGURE 2.8 ROLE OF SMAC/DIABLO IN APOPTOSIS. ADAPTED FROM “ROLE OF
SMAC/DIABLO IN CANCER PROGRESSION” BY G. M. RUIZ, V. MALDONADO, G.
CEBALLOS-CANCINO, J. P. R. GRAJEDA, J. MELENDEZ-ZAJGLA, 2008, JOURNAL OF
EXPERIMENTAL & CLINICAL CANCER RESEARCH (2008) 27(1): 48. OPEN-ACCESS.
74
FIGURE 2.9 THE ROLE OF CXCL12/CXCR4 AXIS AND ITS MICROENVIRONMENT IN
TUMOR CELLS PROGRESSION. ADAPTED FROM “CXCL12 / CXCR4 / CXCR7
CHEMOKINE AXIS AND CANCER PROGRESSION” BY X. SUN, G. CHENG, M. HAO, J.
ZHENG, R. S. TAICHMAN, K. J. PIENTA, AND J. WANG, 2010, CANCER AND
METASTASIS REVIEWS (2010) 29 (4), 709-722. COPYRIGHT 2010 BY SPRINGER
SCIENCE+BUSINESS MEDIA, LLC. ADAPTED WITH PERMISSION. 77

15
FIGURE 2.10 ROLE OF VEGF/VEGFR IN TUMOR CELLS ANGIOGENESIS. THE
EXPRESSION OF VEGF LIGANDS ON TUMOR CELLS OR HOST STROMAL CELLS
STIMULATE THE VEGFR1 AND VEGFR2 ON ENDOTHELIAL CELLS AND LEAD TO
THE ACTIVATION OF TUMOR CELLS PROLIFERATION, MIGRATION, SURVIVAL AND
VASCULAR PERMEABILITY. ADAPTED FROM “ROLE OF THE VASCULAR
ENDOTHELIAL GROWTH FACTOR PATHWAY IN TUMOR GROWTH AND
ANGIOGENESIS” BY D. J. HICKLIN AND L. M. ELLIS, 2005, JOURNAL OF CLINICAL
ONCOLOGY (2005) 23 (5), 1011-1027. COPYRIGHT 2005 BY AMERICAN SOCIETY OF
CLINICAL ONCOLOGY. ADAPTED WITH PERMISSION. 81
FIGURE 2.11 MARANTODES PUMILUM (BLUME) KUNTZE PLANT 91
FIGURE 2.12 THE FARMING OF MARANTODES PUMILUM (BLUME) KUNTZE PLANT IN
MALAYSIA 91
FIGURE 2.13 THE CHEMICAL STRUCTURE OF THE KNOWN PHYTOCHEMICALS IN
MARANTODES PUMILUM WITH ANTICANCER ACTIVITY 93
FIGURE 2.14 THE CHEMICAL STRUCTURE OF THE KNOWN PHYTOCHEMICALS IN
MARANTODES PUMILUM. (5) CATECHIN, (6) EPIGALLOCATECHIN, (7) GALLIC ACID,
(8) COUMARIC ACID, (9) QUERCETIN AND (10) MYRICETIN 94
FIGURE 2.15 FICUS DELTOIDEA PLANT 97
FIGURE 2.16 THE CHEMICAL STRUCTURE OF THE KNOWN PHYTOCHEMICALS IN FICUS
DELTOIDEA (11) GALLOCATECHIN, (12) EPIGALLOCATECHIN, (13) CATECHIN, (14)
NARINGENIN AND (15) QUERCETIN. 99
FIGURE 2.17 CHEMICAL STRUCTURE OF KNOWN PHYTOCHEMICAL IN FICUS
DELTOIDEA (16) VITEXIN, (17) 4-P-COUMAROYLQUINIC ACID, (18) ORIENTIN, (19)
RUTIN AND (20) ISOVITEXIN 100
FIGURE 3.1 HAEMOCYTOMETER (IMPROVED NEUBAUER), MAGNIFIED VIEW OF THE
TOTAL AREA OF THE GRID SHOWING VIABLE CELLS AS UNSTAINED AND CLEAR,
WITH A REFRACTILE RING AROUND THEM AND NON-VIABLE CELLS ARE DARK
AND HAVE NO REFRACTILE RING (FRESHNEY 2005). 108
FIGURE 3.2 PHASES OF CELLS GROWTH (FRESHNEY 2005) 111

16
FIGURE 3.3 SCREENING CASCADE FOR APOPTOSIS 116
FIGURE 3.4 THE SCHEMATIC OF ORIS CELL MIGRATION ASSAY 121
FIGURE 3.5 THE SCHEMATIC OF MODIFIED BOYDEN CHAMBER 3D MIGRATION ASSAY
123
FIGURE 3.6 THE SCHEMATIC OF MODIFIED BOYDEN CHAMBER 3D INVASION ASSAY124
FIGURE 4.1 HPLC FINGERPRINT OF FICUS DELTOIDEA 1 HEXANE EXTRACT. 137
FIGURE 4.2 HPLC FINGERPRINT OF FICUS DELTOIDEA 1 CHLOROFORM EXTRACT. 138
FIGURE 4.3 HPLC FINGERPRINT OF FICUS DELTOIDEA 1 AQUEOUS EXTRACT. 139
FIGURE 4.4 HPLC FINGERPRINT OF FICUS DELTOIDEA 2 HEXANE EXTRACT. 140
FIGURE 4.5 HPLC FINGERPRINT OF FICUS DELTOIDEA 2 CHLOROFORM EXTRACT. 141
FIGURE 4.6 HPLC FINGERPRINT OF FICUS DELTOIDEA 2 AQUEOUS EXTRACT. 142
FIGURE 4.7 HPLC FINGERPRINT OF FICUS DELTOIDEA 3 HEXANE EXTRACT. 143
FIGURE 4.8 HPLC FINGERPRINT OF FICUS DELTOIDEA 3 CHLOROFORM EXTRACT. 144
FIGURE 4.9 HPLC FINGERPRINT OF FICUS DELTOIDEA 3 AQUEOUS EXTRACT 145
FIGURE 4.10 HPLC FINGERPRINT OF MARANTODES PUMILUM HEXANE EXTRACT 146
FIGURE 4.11 HPLC FINGERPRINT OF MARANTODES PUMILUM CHLOROFORM EXTRACT
147
FIGURE 4.12 HPLC FINGERPRINT OF MARANTODES PUMILUM AQUEOUS EXTRA 148
FIGURE 4.13. MORPHOLOGICAL CHANGES OF PC3 CELLS TREATED WITH THE GI50 OF
PACLITAXEL (POSITIVE CONTROL) FOR 24, 48, AND 72 HOURS VIEWED UNDER
THE EVOS® FL IMAGING SYSTEM (100X MAGNIFICATION). STEADY DECLINE OF
THE CELL POPULATION WAS NOTED AT ALL ENDPOINTS AS COMPARED TO THE
CONTROL (UNTREATED CELLS).LENGTH OF THE WHITE SCALE IS 400 UM 157
17
FIGURE 4.14. MORPHOLOGICAL CHANGES OF PC3 CELLS TREATED WITH THE GI50 OF
MPC AND MPH FOR 24, 48, AND 72 HOURS VIEWED UNDER THE EVOS® FL
IMAGING SYSTEM (100X MAGNIFICATION). STEADY DECLINE OF THE CELL
POPULATION WAS NOTED AT ALL ENDPOINTS AS COMPARED TO THE CONTROL
(UNTREATED CELLS). 158
FIGURE 4.15. MORPHOLOGICAL CHANGES OF PC3 CELLS TREATED WITH THE GI50 OF
FD1C AND FD2C FOR 24, 48, AND 72 HOURS VIEWED UNDER THE EVOS® FL
IMAGING SYSTEM (100X MAGNIFICATION). STEADY DECLINE OF THE CELL
POPULATION WAS NOTED AT ALL ENDPOINTS AS COMPARED TO THE CONTROL
(UNTREATED CELLS). 159
FIGURE 4.16. MORPHOLOGICAL CHANGES OF LNCAP CELLS TREATED WITH THE GI50
OF PACLITAXEL FOR 24, 48, AND 72 HOURS VIEWED UNDER THE EVOS® FL
IMAGING SYSTEM (100X MAGNIFICATION). STEADY DECLINE OF THE CELL
POPULATION WAS NOTED AT ALL ENDPOINTS AS COMPARED TO THE CONTROL
(UNTREATED CELLS). 160
FIGURE 4.17. MORPHOLOGICAL CHANGES OF LNCAP CELLS TREATED WITH THE GI50
OF MPC AND MPH FOR 24, 48, AND 72 HOURS VIEWED UNDER THE EVOS® FL
IMAGING SYSTEM (100X MAGNIFICATION). STEADY DECLINE OF THE CELL
POPULATION WAS NOTED AT ALL ENDPOINTS AS COMPARED TO THE CONTROL
(UNTREATED CELLS). 161
FIGURE 4.18. MORPHOLOGICAL CHANGES OF LNCAP CELLS TREATED WITH THE GI50
OF FD1C AND FD2C FOR 24, 48, AND 72 HOURS VIEWED UNDER THE EVOS® FL
IMAGING SYSTEM (100X MAGNIFICATION). STEADY DECLINE OF THE CELL
POPULATION WAS NOTED AT ALL ENDPOINTS AS COMPARED TO THE CONTROL
(UNTREATED CELLS) 162
FIGURE 4.19. PC3 CELLS VIEWED UNDER THE EVOS® FL IMAGING SYSTEM (200X
MAGNIFICATION) AFTER 72 HOURS OF TREATMENT WITH THE GI50
CONCENTRATION OF PACLITAXEL (B), MARANTODES PUMILUM (CHLOROFORM)
(C), AND MARANTODES PUMILUM (N-HEXANE) (D) EXTRACTS. (A) REPRESENTS
THE CONTROL (UNTREATED PC3 CELLS). THE CELLS SHOWED
CHARACTERISTICS OF APOPTOSIS SUCH AS THE FORMATION OF APOPTOTIC
BODIES (AB), MEMBRANE BLEBBING (MB) AND NUCLEAR COMPACTION (NC). 163

18
FIGURE 4.20. LNCAP CELLS VIEWED UNDER THE EVOS® FL IMAGING SYSTEM (200X
MAGNIFICATION) AFTER 72 HOURS OF TREATMENT WITH THE GI50
CONCENTRATION OF PACLITAXEL (B), MARANTODES PUMILUM (CHLOROFORM)
(C), AND MARANTODES PUMILUM (N-HEXANE) (D) EXTRACTS. (A) REPRESENTED
THE CONTROL (UNTREATED LNCAP CELLS). THE CELLS SHOWED
CHARACTERISTICS OF APOPTOSIS SUCH AS THE FORMATION OF APOPTOTIC
BODIES (AB), MEMBRANE BLEBBING (MB) AND NUCLEAR COMPACTION (NC). 164
FIGURE 4.21. PC3 CELLS VIEWED UNDER THE EVOS® FL IMAGING SYSTEM (200X
MAGNIFICATION) AFTER 72 HOURS OF TREATMENT WITH THE GI50
CONCENTRATION OF PACLITAXEL (B), FD1 (CHLOROFORM) (C), AND FD2
(CHLOROFORM) (D) EXTRACTS. (A) REPRESENTS THE CONTROL (UNTREATED
PC3 CELLS). THE CELLS SHOWED CHARACTERISTICS OF APOPTOSIS SUCH AS
THE FORMATION OF APOPTOTIC BODIES (AB), MEMBRANE BLEBBING (MB) AND
NUCLEAR COMPACTION (NC). 165
FIGURE 4.22. LNCAP CELLS VIEWED UNDER THE EVOS® FL IMAGING SYSTEM (200X
MAGNIFICATION) AFTER 72 HOURS OF TREATMENT WITH THE GI50
CONCENTRATION OF PACLITAXEL (B), FD1 (CHLOROFORM) (C), AND FD2
(CHLOROFORM) (D) EXTRACTS. (A) REPRESENTS THE CONTROL (UNTREATED
PC3 CELLS). THE CELLS SHOWED CHARACTERISTICS OF APOPTOSIS SUCH AS
THE FORMATION OF APOPTOTIC BODIES (AB), MEMBRANE BLEBBING (MB) AND
NUCLEAR COMPACTION (NC). 166
FIGURE 4.23. FLUORESCENCE IMAGE OF PC3 CELLS STAINED WITH DAPI AFTER 72
HOURS INCUBATION WITH THE ACTIVE EXTRACTS OF MARANTODES PUMILUM
AND PACLITAXEL (POSITIVE CONTROL). APOPTOTIC CELLS WERE REPRESENTED
BY THE BLUE FLUORESCENCE COLOUR SEEN IN THE IMAGES. MORE APOPTOTIC
CELLS CAN BE SEEN IN THE CELLS TREATED WITH PACLITAXEL AND THE ACTIVE
EXTRACTS OF MARANTODES PUMILUM. 168
FIGURE 4.24. FLUORESCENCE IMAGE OF LNCAP CELLS STAINED WITH DAPI AFTER 72
HOURS INCUBATION WITH THE ACTIVE EXTRACTS OF MARANTODES PUMILUM
AND PACLITAXEL (POSITIVE CONTROL). APOPTOTIC CELLS WERE REPRESENTED
BY THE BLUE FLUORESCENCE COLOUR SEEN IN THE IMAGES. MORE APOPTOTIC
CELLS CAN BE SEEN IN THE CELLS TREATED WITH PACLITAXEL AND THE ACTIVE
EXTRACTS OF MARANTODES PUMILUM. 169

19
FIGURE 4.25. FLUORESCENCE IMAGE OF PC3 CELLS STAINED WITH DAPI AFTER 72
HOURS INCUBATION WITH THE ACTIVE EXTRACTS OF FICUS DELTOIDEA AND
PACLITAXEL (POSITIVE CONTROL). APOPTOTIC CELLS WERE REPRESENTED BY
THE BLUE FLUORESCENCE COLOUR SEEN IN THE IMAGES. MORE APOPTOTIC
CELLS CAN BE SEEN IN THE CELLS TREATED WITH PACLITAXEL AND THE ACTIVE
EXTRACTS OF FICUS DELTOIDEA. 170
FIGURE 4.26. FLUORESCENCE IMAGE OF LNCAP CELLS STAINED WITH DAPI AFTER 72
HOURS INCUBATION WITH THE ACTIVE EXTRACTS OF FICUS DELTOIDEA AND
PACLITAXEL (POSITIVE CONTROL). APOPTOTIC CELLS WERE REPRESENTED BY
THE BLUE FLUORESCENCE COLOUR SEEN IN THE IMAGES. MORE APOPTOTIC
CELLS CAN BE SEEN IN THE CELLS TREATED WITH PACLITAXEL AND THE ACTIVE
EXTRACTS OF FICUS DELTOIDEA. 171
FIGURE 4.27. THE DOT PLOTS OF LNCAP CELLS AFTER 6 HOURS TREATMENT WITH
THE ACTIVE EXTRACTS OF MARANTODES PUMILUM AS DETERMINED BY ANNEXIN
V-FITC AND PI STAINING. THE CELLS WERE TREATED WITH DIFFERENT ACTIVE
EXTRACTS FOR 6 HOURS. RESULTS SHOWN ARE REPRESENTATIVE OF THREE
INDEPENDENT EXPERIMENTS. 174
FIGURE 4.28. THE PERCENTAGE (%) OF CELL DISTRIBUTION OF LNCAP CELLS AFTER 6
HOURS TREATMENT WITH THE ACTIVE EXTRACTS OF MARANTODES PUMILUM AS
DETERMINED BY ANNEXIN V-FITC AND PI STAINING. THE CELLS WERE TREATED
WITH DIFFERENT ACTIVE EXTRACTS FOR 6 HOURS. * P< 0.05 AS COMPARED TO
THE UNTREATED CELLS. RESULTS SHOWN ARE REPRESENTATIVE OF THREE
INDEPENDENT EXPERIMENTS. 175
FIGURE 4.29. THE DOT PLOTS OF PC3 CELLS AFTER 6 HOURS TREATMENT WITH THE
ACTIVE EXTRACTS OF MARANTODES PUMILUM AS DETERMINED BY ANNEXIN V-
FITC AND PI STAINING. THE CELLS WERE TREATED WITH DIFFERENT ACTIVE
EXTRACTS FOR 6 HOURS. RESULTS SHOWN ARE REPRESENTATIVE OF THREE
INDEPENDENT EXPERIMENTS. 176
FIGURE 4.30. THE PERCENTAGE (%) OF CELL DISTRIBUTION OF PC3 CELLS AFTER 6
HOURS TREATMENT WITH THE ACTIVE EXTRACTS OF MARANTODES PUMILUM AS
DETERMINED BY ANNEXIN V-FITC AND PI STAINING. THE CELLS WERE TREATED
WITH DIFFERENT ACTIVE EXTRACTS FOR 6 HOURS. * P< 0.05 AS COMPARED TO

20
THE UNTREATED CELLS. RESULTS SHOWN ARE REPRESENTATIVE OF THREE
INDEPENDENT EXPERIMENTS. 177
FIGURE 4.31. THE DOT PLOTS OF LNCAP CELLS AFTER 6 HOURS TREATMENT WITH
THE ACTIVE EXTRACTS OF FICUS DELTOIDEA AS DETERMINED BY ANNEXIN V-
FITC AND PI STAINING. THE CELLS WERE TREATED WITH DIFFERENT ACTIVE
EXTRACTS FOR 6 HOURS. RESULTS SHOWN ARE REPRESENTATIVE OF THREE
INDEPENDENT EXPERIMENTS. 178
FIGURE 4.32. THE PERCENTAGE (%) OF CELL DISTRIBUTION OF LNCAP CELLS AFTER 6
HOURS TREATMENT WITH THE ACTIVE EXTRACTS OF FICUS DELTOIDEA AS
DETERMINED BY ANNEXIN V-FITC AND PI STAINING. THE CELLS WERE TREATED
WITH DIFFERENT ACTIVE EXTRACTS FOR 6 HOURS. * P< 0.05 AS COMPARED TO
THE UNTREATED CELLS. RESULTS SHOWN ARE REPRESENTATIVE OF THREE
INDEPENDENT EXPERIMENTS. 179
FIGURE 4.33. THE DOT PLOTS OF PC3 CELLS AFTER 6 HOURS TREATMENT WITH THE
ACTIVE EXTRACTS OF FICUS DELTOIDEA AS DETERMINED BY ANNEXIN V-FITC
AND PI STAINING. THE CELLS WERE TREATED WITH DIFFERENT ACTIVE
EXTRACTS FOR 6 HOURS. RESULTS SHOWN ARE REPRESENTATIVE OF THREE
INDEPENDENT EXPERIMENTS. 180
FIGURE 4.34. THE PERCENTAGE (%) OF CELL DISTRIBUTION OF PC3 CELLS AFTER 6
HOURS TREATMENT WITH THE ACTIVE EXTRACTS OF FICUS DELTOIDEA AS
DETERMINED BY ANNEXIN V-FITC AND PI STAINING. THE CELLS WERE TREATED
WITH DIFFERENT ACTIVE EXTRACTS FOR 6 HOURS. * P< 0.05 AS COMPARED TO
THE UNTREATED CELLS. RESULTS SHOWN ARE REPRESENTATIVE OF THREE
INDEPENDENT EXPERIMENTS. 181
FIGURE 4.35. CASPASE 3/7 ACTIVITY IN LNCAP CELLS TREATED WITH THE ACTIVE
EXTRACTS OF MARANTODES PUMILUM FOR 72 HOURS. THE Y-AXIS SHOWS THE
LUMINESCENT SIGNAL SUBTRACTED FROM A BLANK, WHICH IS PROPORTIONAL
TO THE CASPASE ACTIVITY. THE ERROR BARS DISPLAY THE STANDARD ERROR
OF MEAN (SEM) OBTAINED FROM 3 INDEPENDENT EXPERIMENTS. SIGNIFICANCE
COMPARED TO CONTROL, *(P<0.05),**(P<0.01) AS DETERMINED BY UN-PAIRED T-
TEST. 183
FIGURE 4.36. CASPASE 3/7 ACTIVITY IN PC3 CELLS TREATED WITH THE ACTIVE
EXTRACTS OF MARANTODES PUMILUM FOR 72 HOURS. THE Y-AXIS SHOWS THE

21
LUMINESCENT SIGNAL SUBTRACTED FROM A BLANK, WHICH IS PROPORTIONAL
TO THE CASPASE ACTIVITY. THE ERROR BARS DISPLAY THE STANDARD ERROR
OF MEAN (SEM) OBTAINED FROM 3 INDEPENDENT EXPERIMENTS. SIGNIFICANCE
COMPARED TO CONTROL, *(P<0.05),**(P<0.01) AS DETERMINED BY UN-PAIRED T-
TEST. 184
FIGURE 4.37. CASPASE 3/7 ACTIVITY IN LNCAP CELLS TREATED WITH THE ACTIVE
EXTRACTS OF FICUS DELTOIDEA FOR 72 HOURS. THE Y-AXIS SHOWS THE
LUMINESCENT SIGNAL SUBTRACTED FROM A BLANK, WHICH IS PROPORTIONAL
TO THE CASPASE ACTIVITY. THE ERROR BARS DISPLAY THE STANDARD ERROR
OF MEAN (SEM) OBTAINED FROM 3 INDEPENDENT EXPERIMENTS. SIGNIFICANCE
COMPARED TO CONTROL, *(P<0.05),**(P<0.01) AS DETERMINED BY UN-PAIRED T-
TEST. 185
FIGURE 4.38. CASPASE 3/7 ACTIVITY IN PC3 CELLS TREATED WITH THE ACTIVE
EXTRACTS OF FICUS DELTOIDEA FOR 72 HOURS. THE Y-AXIS SHOWS THE
LUMINESCENT SIGNAL SUBTRACTED FROM A BLANK, WHICH IS PROPORTIONAL
TO THE CASPASE ACTIVITY. THE ERROR BARS DISPLAY THE STANDARD ERROR
OF MEAN (SEM) OBTAINED FROM 3 INDEPENDENT EXPERIMENTS. SIGNIFICANCE
COMPARED TO CONTROL, *(P<0.05),**(P<0.01) AS DETERMINED BY UN-PAIRED T-
TEST. 186
FIGURE 4.39. REPRESENTATIVE MMP PROFILES OF FLOW CYTOMETRY FOR ACTIVE
PLANT EXTRACTS-TREATED PC3 CELLS. DEPOLARIZATION OF MITOCHONDRIAL
MEMBRANE POTENTIAL (MMP) OF PC3 PROSTATE CANCER CELL LINES WAS
INDUCED BY THE ACTIVE EXTRACTS OF MARANTODES PUMILUM .PC3 CELL LINES
WERE TREATED WITH THE GI50 OF THE PLANT EXTRACTS FOR 6 HOURS.
RESULTS SHOWN ARE REPRESENTATIVE OF THREE INDEPENDENT
EXPERIMENTS. 188
FIGURE 4.40. REPRESENTATIVE MMP PROFILES OF FLOW CYTOMETRY FOR ACTIVE
PLANT EXTRACTS-TREATED PC3 CELLS. DEPOLARIZATION OF MITOCHONDRIAL
MEMBRANE POTENTIAL (MMP) OF PC3 PROSTATE CANCER CELL LINES WAS
INDUCED BY THE ACTIVE EXTRACTS OF FICUS DELTOIDEA.PC3 CELL LINES WERE
TREATED WITH THE GI50 OF THE PLANT EXTRACTS FOR 6 HOURS. RESULTS
SHOWN ARE REPRESENTATIVE OF THREE INDEPENDENT EXPERIMENTS. 189

22
FIGURE 4.41. QUANTIFICATION ANALYSIS OF PERCENTAGE MMP INTENSITY IN FIGURE
4.39 & FIGURE 4.40. DATA REPRESENTED AS MEANS ± SEMS (N=3). *P<0.05 AND
**P<0.01 AND AGAINST CONTROL. 189
FIGURE 4.42. PC3 CELLS TREATED DNASE (POSITIVE CONTROL) AND STAINED WITH
DEADEND™ FLUROMETRIC TUNEL SYSTEM AFTER 72 HOURS. RED
FLUORESCENCE INDICATES HEALTHY CELLS WHILE GREEN FLUORESCENCE
SHOWS FRAGMENTED NUCLEAR DNA. RESULTS SHOWN ARE REPRESENTATIVE
OF THREE INDEPENDENT EXPERIMENTS. 191
FIGURE 4.43. PC3 CELLS TREATED WITH MARANTODES PUMILUM PLANT EXTRACTS
AND STAINED WITH DEADEND™ FLUROMETRIC TUNEL SYSTEM AFTER 72 HOURS.
RED FLUORESCENCE INDICATES HEALTHY CELLS WHILE GREEN FLUORESCENCE
SHOWS FRAGMENTED NUCLEAR DNA. 192
FIGURE 4.44. PC3 CELLS TREATED WITH FICUS DELTOIDEA PLANT EXTRACTS AND
STAINED WITH DEADEND™ FLUROMETRIC TUNEL SYSTEM AFTER 72 HOURS. RED
FLUORESCENCE INDICATES HEALTHY CELLS WHILE GREEN FLUORESCENCE
SHOWS FRAGMENTED NUCLEAR DNA. 193
FIGURE 4.45. BCL-2, BAX AND SMAC/DIABLO MRNA GENE EXPRESSIONS IN PC3 CELLS
TREATED WITH MNTC OF THE ACTIVE PLANT EXTRACTS OF MARANTODES
PUMILUM AND FICUS DELTOIDEA AFTER 96 HOURS. THE GENES EXPRESSIONS
WERE DETERMINED AS DESCRIBED IN RT-QPCR CONDITIONS AND ANALYSIS.
DATA ARE MEAN ± SD; N=4 EXPERIMENTS. * P < 0.05, *** P< 0.001. 196
FIGURE 4.46. EFFECT OF THE ACTIVE EXTRACTS OF MARANTODES PUMILUM ON THE
CELL CYCLE OF LNCAP CELLS ANALYSED BY MEASURING DNA CONTENT USING
FLOW CYTOMETER. THE CELLS WERE TREATED WITH THE GI50 OF THE ACTIVE
EXTRACTS. *P<0.05 AS COMPARED TO THE UNTREATED CELLS. PACLITAXEL
TREATMENT WAS USED AS POSITIVE CONTROL. RESULTS SHOWN ARE
REPRESENTATIVES OF THREE INDEPENDENT EXPERIMENTS. 201
FIGURE 4.47. EFFECT OF THE ACTIVE EXTRACTS OF MARANTODES PUMILUM ON THE
CELL CYCLE OF PC3 CELLS ANALYSED BY MEASURING DNA CONTENT USING
FLOW CYTOMETER. THE CELLS WERE TREATED WITH THE GI50 OF THE ACTIVE
EXTRACTS. *P<0.05 AS COMPARED TO THE UNTREATED CELLS. PACLITAXEL
TREATMENT WAS USED AS POSITIVE CONTROL. RESULTS SHOWN ARE
REPRESENTATIVES OF THREE INDEPENDENT EXPERIMENTS. 202

23
FIGURE 4.48. EFFECT OF THE ACTIVE EXTRACTS OF FICUS DELTOIDEA ON THE CELL
CYCLE OF LNCAP CELLS ANALYSED BY MEASURING DNA CONTENT USING FLOW
CYTOMETER. THE CELLS WERE TREATED WITH THE GI50 OF THE ACTIVE
EXTRACTS. *P<0.05 AS COMPARED TO THE UNTREATED CELLS. PACLITAXEL
TREATMENT WAS USED AS POSITIVE CONTROL. RESULTS SHOWN ARE
REPRESENTATIVES OF THREE INDEPENDENT EXPERIMENTS. 203
FIGURE 4.49. EFFECT OF THE ACTIVE EXTRACTS OF FICUS DELTOIDEA ON THE CELL
CYCLE OF PC3 CELLS ANALYSED BY MEASURING DNA CONTENT USING FLOW
CYTOMETER. THE CELLS WERE TREATED WITH THE GI50 OF THE ACTIVE
EXTRACTS. *P<0.05 AS COMPARED TO THE UNTREATED CELLS. PACLITAXEL
TREATMENT WAS USED AS POSITIVE CONTROL. RESULTS SHOWN ARE
REPRESENTATIVES OF THREE INDEPENDENT EXPERIMENTS. 204
FIGURE 4.50. ALOX-5 MRNA GENE EXPRESSIONS IN PC3 CELLS TREATED WITH MNTC
OF THE ACTIVE PLANT EXTRACTS OF MARANTODES PUMILUM AND FICUS
DELTOIDEA AFTER 96 HOURS. THE GENES EXPRESSIONS WERE DETERMINED AS
DESCRIBED IN RT-QPCR CONDITIONS AND ANALYSIS. DATA ARE MEAN ± SD; N=4
EXPERIMENTS. * P < 0.05, *** P< 0.001. 205
FIGURE 4.51. MIGRATION OF PC3 CELLS TREATED WITH THE MNTC OF PACLITAXEL
FOR 24, 48, AND 72 HOURS VIEWED UNDER THE EVOS® FL IMAGING SYSTEM.
INHIBITION OF MIGRATION CAN BE CLEARLY SEEN AFTER TREATMENT WITH
PACLITAXEL COMPARED TO THE UNTREATED CELLS. RESULTS SHOWN ARE
REPRESENTATIVE OF THREE INDEPENDENT EXPERIMENTS. 209
FIGURE 4.52. MIGRATION OF PC3 CELLS TREATED WITH THE MNTC OF THE ACTIVE
EXTRACTS OF MARANTODES PUMILUM FOR 24, 48, AND 72 HOURS VIEWED
UNDER THE EVOS® FL IMAGING SYSTEM. INHIBITION OF MIGRATION CAN BE
CLEARLY SEEN AFTER TREATMENT WITH MPC AND MPH COMPARED TO THE
UNTREATED CELLS. RESULTS SHOWN ARE REPRESENTATIVE OF THREE
INDEPENDENT EXPERIMENTS. 210
FIGURE 4.53. MIGRATION OF PC3 CELLS TREATED WITH THE MNTC OF THE ACTIVE
EXTRACTS OF FICUS DELTOIDEA FOR 24, 48, AND 72 HOURS VIEWED UNDER THE
EVOS® FL IMAGING SYSTEM. INHIBITION OF MIGRATION CAN BE CLEARLY SEEN
AFTER TREATMENT WITH FD1C AND FD2C COMPARED TO THE UNTREATED

24
CELLS. RESULTS SHOWN ARE REPRESENTATIVE OF THREE INDEPENDENT
EXPERIMENTS. 211
FIGURE 4.54. ORIS™CELL MIGRATION ANALYSIS: 5 X 10⁴ OF PC3 CELLS WERE SEEDED
PER WELL AND ALLOWED TO ADHERE. STOPPERS WERE THEN REMOVED AND
THE ACTIVE EXTRACTS OF BOTH MARANTODES PUMILUM (MPC AND MPH) AND
FICUS DELTOIDEA (FD1C AND FD2C) WERE ADDED TO TE WELLS, AND THE
PLATE WAS INCUBATED TO PERMIT CELL MIGRATION. THE CELLS WERE
LABELLED WITH CELLTRACKER™ GREEN AND THE FLUORESCENCE QUANTIFIED
IN THE DETECTION ZONE USING A SYNERGY HT BIOTEK PLATE READER.
RESULTS SHOWN ARE REPRESENTATIVES OF THREE INDEPENDENT
EXPERIMENTS, *P<0.05 AND **P<0.01 AND AGAINST CONTROL AS ANALYSED BY
THE STUDENT’S T TEST. 212
FIGURE 4.55. CYTOSELECT CELL MIGRATION ANALYSIS: EFFECTS OF THE ACTIVE
EXTRACT OF BOTH MARANTODES PUMILUM (MPC AND MPH) AND FICUS
DELTOIDEA (FD1C AND FD2C) PLANTS ON THE MIGRATION OF THE PC3 CELLS.
PC3 CELLS WERE TREATED WITH THE MNTC CONCENTRATION OF MPC, MPH,
FD1C AND FD2C FOR 24 HOURS. RESULTS SHOWN ARE REPRESENTATIVES OF
THREE INDEPENDENT EXPERIMENTS, *P<0.05 AND **P<0.01 AND AGAINST
CONTROL AS ANALYSED BY THE STUDENT’S T TEST. 213
FIGURE 4.56. CYTOSELECT CELL INVASION ANALYSIS: EFFECTS OF THE ACTIVE
EXTRACT OF BOTH MARANTODES PUMILUM (MPC AND MPH) AND FICUS
DELTOIDEA (FD1C AND FD2C) PLANTS ON THE INVASION OF THE PC3 CELLS. PC3
CELLS WERE TREATED WITH THE MNTC CONCENTRATION OF MPC, MPH, FD1C
AND FD2C FOR 48 HOURS. RESULTS SHOWN ARE REPRESENTATIVES OF THREE
INDEPENDENT EXPERIMENTS, *P<0.05 AND **P<0.01 AND AGAINST CONTROL AS
ANALYSED BY THE STUDENT’S T TEST. 215
FIGURE 4.57. CXCR4, CXCL12 AND VEGF-A MRNA GENES EXPRESSION IN PC3 CELLS
TREATED WITH MNTC OF THE ACTIVE PLANT EXTRACTS OF MARANTODES
PUMILUM AND FICUS DELTOIDEA AFTER 96 HOURS. THE GENES EXPRESSIONS
WERE DETERMINED AS DESCRIBED IN RT-QPCR CONDITIONS AND ANALYSIS.
DATA ARE MEAN ± SD; N=4 EXPERIMENTS. * P < 0.05, *** P< 0.001 217

25
FIGURE 4.58 TLC ANALYSIS OF SEPHADEX OF THE MPC EXTRACT (FRACTION 4 TO 68)
VIEWED UNDER WHITE LIGHT. T STANDS FOR TOTAL CRUDE EXTRACT (CRUDE
EXTRACT OF MPC). 220
FIGURE 4.59 TLC ANALYSIS OF SEPHADEX OF THE MPC EXTRACT (FRACTION 4 TO 68),
VIEWED UNDER 254 NM WAVELENGTH. T STANDS FOR TOTAL CRUDE EXTRACT
(CRUDE EXTRACT OF MPC). 220
FIGURE 4.60 TLC ANALYSIS OF SEPHADEX OF THE MPC EXTRACT (FRACTION 4 TO 68),
VIEWED UNDER 366 NM WAVELENGTH. T STANDS FOR TOTAL CRUDE EXTRACT
(CRUDE EXTRACT OF MPC). 221
FIGURE 4.61 TLC ANALYSIS OF SEPHADEX OF THE MPC EXTRACT AFTER
DERIVATISATION WITH ANISALDEGYDE (FRACTION 4 TO 68), VIEWED UNDER
WHITE LIGHT. T STANDS FOR TOTAL CRUDE EXTRACT (CRUDE EXTRACT OF MPC).
221
FIGURE 4.62 TLC ANALYSIS OF SEPHADEX OF THE MPC EXTRACT (FRACTION 1 TO 18),
VIEWED UNDER 254 NM WAVELENGTH. T STANDS FOR TOTAL CRUDE EXTRACT
(CRUDE EXTRACT OF MPC). 222
FIGURE 4.63 TLC ANALYSIS OF SEPHADEX OF THE MPC EXTRACT (FRACTION 1 TO 18),
VIEWED UNDER 366 NM WAVELENGTH. T STANDS FOR TOTAL CRUDE EXTRACT
(CRUDE EXTRACT OF MPC). 222
FIGURE 4.64 TLC ANALYSIS OF SEPHADEX OF THE MPC EXTRACT AFTER
DERIVATISATION WITH ANISALDEGYDE (FRACTION 1 TO 18), VIEWED UNDER
WHITE LIGHT. T STANDS FOR TOTAL CRUDE EXTRACT (CRUDE EXTRACT OF MPC).
223
FIGURE 4.65 TLC ANALYSIS OF SEPHADEX OF THE MPC EXTRACT (FRACTION 19 TO
36), VIEWED UNDER 254 NM WAVELENGTH. T STANDS FOR TOTAL CRUDE
EXTRACT (CRUDE EXTRACT OF MPC). 223
FIGURE 4.66 TLC ANALYSIS OF SEPHADEX OF THE MPC EXTRACT (FRACTION 19 TO
36), VIEWED UNDER 366 NM WAVELENGTH. T STANDS FOR TOTAL CRUDE
EXTRACT (CRUDE EXTRACT OF MPC). 224

26
FIGURE 4.67 TLC ANALYSIS OF SEPHADEX OF THE MPC EXTRACT AFTER
DERIVATISATION WITH ANISALDEGYDE (FRACTION 19 TO 36), VIEWED UNDER
WHITE LIGHT. T STANDS FOR TOTAL CRUDE EXTRACT (CRUDE EXTRACT OF MPC).
224
FIGURE 4.68 TLC ANALYSIS OF SEPHADEX OF THE FD1C EXTRACT (FRACTION 16 TO
33), VIEWED UNDER 254 NM WAVELENGTH. T STANDS FOR TOTAL CRUDE
EXTRACT (CRUDE EXTRACT OF FD1C). 226
FIGURE 4.69 TLC ANALYSIS OF SEPHADEX OF THE FD1C EXTRACT (FRACTION 16 TO
33), VIEWED UNDER 366 NM WAVELENGTH. T STANDS FOR TOTAL CRUDE
EXTRACT (CRUDE EXTRACT OF FD1C). 226
FIGURE 4.70 TLC ANALYSIS OF SEPHADEX OF THE FD1C EXTRACT AFTER
DERIVATISATION WITH ANISALDEGYDE (FRACTION 16 TO 33), VIEWED UNDER
WHITE LIGHT. T STANDS FOR TOTAL CRUDE EXTRACT (CRUDE EXTRACT OF
FD1C). 227
FIGURE 4.71 TLC ANALYSIS OF SEPHADEX OF THE FD1C EXTRACT (FRACTION 34 TO
51), VIEWED UNDER 254 NM WAVELENGTH. T STANDS FOR TOTAL CRUDE
EXTRACT (CRUDE EXTRACT OF FD1C). 227
FIGURE 4.72 TLC ANALYSIS OF SEPHADEX OF THE FD1C EXTRACT (FRACTION 34 TO
51), VIEWED UNDER 366 NM WAVELENGTH. T STANDS FOR TOTAL CRUDE
EXTRACT (CRUDE EXTRACT OF FD1C). 228
FIGURE 4.73 TLC ANALYSIS OF SEPHADEX OF THE FD1C EXTRACT AFTER
DERIVATISATION WITH ANISALDEGYDE (FRACTION 34 TO 51), VIEWED UNDER
WHITE LIGHT. T STANDS FOR TOTAL CRUDE EXTRACT (CRUDE EXTRACT OF
FD1C). 228
FIGURE 4.74 TLC ANALYSIS OF SEPHADEX OF THE FD2C EXTRACT (FRACTION 16 TO
33), VIEWED UNDER 254 NM WAVELENGTH. T STANDS FOR TOTAL CRUDE
EXTRACT (CRUDE EXTRACT OF FD2C). 230
FIGURE 4.75 TLC ANALYSIS OF SEPHADEX OF THE FD2C EXTRACT (FRACTION 16 TO
33), VIEWED UNDER 366 NM WAVELENGTH. T STANDS FOR TOTAL CRUDE
EXTRACT (CRUDE EXTRACT OF FD2C). 230

27
FIGURE 4.76 TLC ANALYSIS OF SEPHADEX OF THE FD2C EXTRACT AFTER
DERIVATISATION WITH ANISALDEGYDE (FRACTION 16 TO 33), VIEWED UNDER
WHITE LIGHT. T STANDS FOR TOTAL CRUDE EXTRACT (CRUDE EXTRACT OF
FD2C). 231
FIGURE 4.77 TLC ANALYSIS OF SEPHADEX OF THE FD2C EXTRACT (FRACTION 34 TO
51), VIEWED UNDER 254 NM WAVELENGTH. T STANDS FOR TOTAL CRUDE
EXTRACT (CRUDE EXTRACT OF FD2C). 231
FIGURE 4.78 TLC ANALYSIS OF SEPHADEX OF THE FD2C EXTRACT (FRACTION 34 TO
51), VIEWED UNDER 366 NM WAVELENGTH. T STANDS FOR TOTAL CRUDE
EXTRACT (CRUDE EXTRACT OF FD2C). 232
FIGURE 4.79 TLC ANALYSIS OF SEPHADEX OF THE FD2C EXTRACT AFTER
DERIVATISATION WITH ANISALDEGYDE (FRACTION 34 TO 51), VIEWED UNDER
WHITE LIGHT. T STANDS FOR TOTAL CRUDE EXTRACT (CRUDE EXTRACT OF
FD2C). 232
FIGURE 4.80. DOSE-RESPONSE CURVES OF THE EFFECT OF THE EXTRACTS AGAINST
PC3 CELL LINE. A) EFFECT OF MPC FRACTIONS, B) EFFECT OF FD1C AND FD2C
FRACTIONS ON THE VIABILITY OF PC3 CELL LINE AFTER 72 HOURS OF
EXPOSURE. ALL DATA REPRESENT THE MEAN VALUES AND STANDARD ERROR
OF MEAN (SEM) FOR THE CYTOTOXIC EXTRACTS AFTER 72 HOURS OF
EXPOSURE. EACH POINT WAS OBTAINED FROM THREE INDEPENDENT
EXPERIMENTS, WHICH WAS RUN IN TRIPLICATE. 236
FIGURE 4.81. EFFECTS OF A) MPC, MPH, FD1C AND FD2C, AND B) MPC F30-33, FD1C
F43-51, FD2C F29-33, AND FD2C F34-36 PLANTS ON THE GROWTH OF HDFA CELLS
AS ASSESSED BY SRB ASSAYS AFTER 72 HOURS. EACH RESULT WAS OBTAINED
IN THREE INDEPENDENT EXPERIMENTS, WHICH WAS RUN IN TRIPLICATE. 241
FIGURE 4.82. HPLC CHROMATOGRAM OF MPC F30-33. 4 DIFFERENT WAVELENGTHS
WERE USED IN THIS STUDY INCLUDING 254, 210, 270 AND 330NM. THE PEAKS
DISTRIBUTION LOOKS ALMOST SIMILAR IN ALL INVESTIGATED WAVELENGTHS,
HOWEVER THE INTENSITY OF EACH PEAK IS DIFFERENT. THEREFORE, THE
SCALE ON THE Y-AXIS IS DIFFERENT FOR EACH WAVELENGTH DUE TO
DIFFERENT SIGNAL INTENSITIES. 243

28
FIGURE 4.83. OVERLAY OF THE HPLC CHROMATOGRAM OF MPC F30-33 WITH THEIR
RESPECTIVE GI50. THE GI50 CONCENTRATIONS (µG/ML) OF THE
MICROFRACTIONS DETERMINED FOR PC3 CELLS AS ASSESSED BY THE SRB
ASSAYS AT 72 HOURS. PACLITAXEL (0.01µM) WAS USED AS A REFERENCE DRUG.
EACH RESULT WAS OBTAINED IN THREE INDEPENDENT EXPERIMENTS AND RUN
IN TRIPLICATE. 244
FIGURE 4.84 STRUCTURE OF MP-1 246
FIGURE 4.85 STRUCTURE OF 1-O-METHYL-6-ACETOXY-5-(PENTADEC-10Z-
ENYL)RESORCINOL 249
FIGURE 4.86 MP-1 ESI-MS RESULT 250
FIGURE 4.87 1HNMR OF MP-1 DISSOLVED IN BENZENE-D6 AT 500MHZ. THE 1HNMR
SPECTRUM GAVE SIGNALS THAT ARE CHARACTERISTIC OF RESORCINOL WITH
UNSATURATED ALKYL SUBSTITUENTS AT THE 5TH POSITION, 5-
ALKYLRESORCINOL (AR). A SINGLET AT δ5.87 PPM AND OVERLAPPED SIGNALS AT
δ6.02 PPM, FORM THE AROMATIC PART OF THE COMPOUND. THE ALKENYL SIDE
CHAIN IS IDENTIFIED AT δ2.37 PPM (M), δ1.53 PPM (M), δ2.07 PPM (Q, J=26.5, 13.5,
7), AND δ5.45 PPM (M), OVERLAPPED SIGNALS FROM δ1.21 PPM TO δ2.37 PPM, AND
AT δ0.87 PPM (M). 251
FIGURE 4.88 13CNMR OF MP-1 DISSOLVED IN BENZENE-D6 AT 500MHZ 252
FIGURE 4.89 DEPT OF MP-1 DISSOLVED IN BENZENE-D6 AT 500MHZ 253
FIGURE 4.90 HMQC CORRELATIONS OF MP-1 DISSOLVED IN BENZENE-D6 AT 500MHZ.
CORRELATIONS BETWEEN H AND C ARE SHOWN IN THE FIGURE 254
FIGURE 4.91 HMBC CORRELATIONS OF MP-1 DISSOLVED IN BENZENE-D6 AT 500MHZ.
CORRELATIONS BETWEEN H AND C ARE SHOWN IN THE FIGURE. 255
FIGURE 4.92 COSY OF MP-1 DISSOLVED IN BENZENE-D6 AT 500MHZ 256
FIGURE 4.93 NOESY OF MP-1 DISSOLVED IN BENZENE-D6 AT 500MHZ 257
FIGURE 4.94 INFRARED SPECTRA FOR MP-1 258

29
FIGURE 4.95 OVERLAY OF ELSD, UV AND MS (BASE PEAK MONITORING)
CHROMATOGRAMS FOR SAMPLE FD1C F43-51. 261
FIGURE 4.96 THE CHEMICAL STRUCTURE OF ISOVITEXIN, VITEXIN AND
BROSIMACUTIN A. 263
FIGURE 4.97 OVERLAY OF ELSD, UV AND MS (BASE PEAKS MONITORING)
CHROMATOGRAMS FOR SAMPLES FD2C F29-33 AND FD2C F34-36. 265
FIGURE 4.98 THE CHEMICAL STRUCTURE OF OLEANOLIC ACID, LUPENONE, LUPEOL,
MORETENOL AND BETULIN 267
FIGURE 4.99 EFFECTS OF ACTIVE PLANT EXTRACTS ON THE INTRINSIC PATHWAY OF
APOPTOSIS 274
FIGURE 5.1 MA PLOT SHOWING THE RMA NORMALISED DATA OF ALL THE POSSIBLE
COMPARISONS BETWEEN THE PAIRWISE LOG2 INTENSITIES OF THE SAMPLES289

30
List of Tables
TABLE 3.1 PLANT SPECIES, VOUCHER NUMBER AND LOCAL NAMES.....................................102
TABLE 3.2 SEQUENCE OF PRIMERS USED IN RT-QPCR ANALYSIS............................................127
TABLE 4.1 THE YIELDS OF MARANTODES PUMILUM, FICUS DELTOIDEA 1 (FD1), FICUS
DELTOIDEA 2 (FD2), AND FICUS DELTOIDEA 3 (FD3)..................................................................133
TABLE 4.2 THE DISTRIBUTION OF MOST CHARACTERISTICS PEAKS FOR MARANTODES
PUMILUM (MP) AND THREE DIFFERENT VARIETIES OF FICUS DELTOIDEA PLANT
EXTRACTS AS ANALYSED BY HIGH PERFORMANCE LIQUID CHROMATOGRAPHY
(HPLC). RESULTS SHOWN ARE REPRESENTATIVE OF THREE INDEPENDENT
EXPERIMENTS........................................................................................................................................................135
TABLE 4.3 GI50 CONCENTRATIONS (µG/ML) OF THE N-HEXANE, CHLOROFORM AND
AQUEOUS PLANT EXTRACTS DETERMINED FOR PC3, DU145, AND LNCAP CELLS
AS ASSESSED BY THE MTT AND SRB ASSAYS AT 72 HOURS. PACLITAXEL (0.01µM)
WAS USED AS A REFERENCE DRUG. EACH RESULT WAS OBTAINED IN THREE
INDEPENDENT EXPERIMENTS AND RUN IN TRIPLICATE. *(P<0.05) AS DETERMINED
BY UN-PAIRED T-TEST......................................................................................................................................154
TABLE 4.4 MRNA GENE EXPRESSION ANALYSIS (BAX, BCL-2 & SMAC/DIABLO) IN PC3
CELLS TREATED WITH MNTC OF THE ACTIVE PLANT EXTRACTS OF MARANTODES
PUMILUM AND FICUS DELTOIDEA AFTER 96 HOURS. THE GENES EXPRESSIONS
WERE DETERMINED AS DESCRIBED IN RT-QPCR CONDITIONS AND ANALYSIS
WHERE CONTROL = 1. DATA ARE MEAN ± SD; N=4 EXPERIMENTS. * P < 0.05, *** P<
0.001...............................................................................................................................................................................197
TABLE 4.5 SUMMARY LIST OF ALL THE INVESTIGATION CARRIED OUT TO DETERMINE
THE MODE OF DEATH INDUCED BY THE ACTIVE EXTRACTS OF BOTH
MARANTODES PUMILUM AND FICUS DELTOIDEA PLANTS AND THEIR RESPECTIVE
RESULTS....................................................................................................................................................................198
TABLE 4.6 MRNA GENE EXPRESSION ANALYSIS (CXCR4, CXCL12 & VEGF-A) IN PC3
CELLS TREATED WITH MNTC OF THE ACTIVE PLANT EXTRACTS OF MARANTODES
PUMILUM AND FICUS DELTOIDEA AFTER 96 HOURS. THE GENES EXPRESSIONS
WERE DETERMINED AS DESCRIBED IN RT-QPCR CONDITIONS AND ANALYSIS

31
WHERE CONTROL = 1. DATA ARE MEAN ± SD; N=4 EXPERIMENTS. * P < 0.05, *** P<
0.001...............................................................................................................................................................................218
TABLE 4.7 GI50 CONCENTRATIONS (µG/ML) OF THE ACTIVE FRACTIONS FROM
MARANTODES PUMILUM AND FICUS DELTOIDEA PLANT EXTRACTS DETERMINED
FOR PC3 CELLS AS ASSESSED BY SRB ASSAYS AFTER 72 HOURS. EACH RESULT
WAS OBTAINED IN THREE INDEPENDENT EXPERIMENTS, WHICH WAS RUN IN
TRIPLICATE...............................................................................................................................................................235
TABLE 4.8 MRNA GENE EXPRESSION ANALYSIS (BAX, BCL-2 & SMAC/DIABLO) IN PC3
CELLS TREATED WITH MNTC OF THE ACTIVE FRACTIONS OF MARANTODES
PUMILUM AND FICUS DELTOIDEA AFTER 96 HOURS (APOPTOSIS-RELATED
GENES). THE GENES EXPRESSIONS WERE DETERMINED AS DESCRIBED IN RT-
QPCR CONDITIONS AND ANALYSIS WHERE CONTROL = 1. DATA ARE MEAN ± SD;
N=4 EXPERIMENTS. * P < 0.05, *** P< 0.001........................................................................................238
TABLE 4.9 MRNA GENE EXPRESSION ANALYSIS (VEGF-A, CXCR4 & CXCL12) IN PC3
CELLS TREATED WITH MNTC OF THE ACTIVE FRACTIONS OF MARANTODES
PUMILUM AND FICUS DELTOIDEA AFTER 96 HOURS (MIGRATION-RELATED
GENES). THE GENES EXPRESSIONS WERE DETERMINED AS DESCRIBED IN RT-
QPCR CONDITIONS AND ANALYSIS WHERE CONTROL = 1. DATA ARE MEAN ± SD;
N=4 EXPERIMENTS. * P < 0.05, *** P< 0.001........................................................................................239
TABLE 4.10 1H AND 13C NMR SPECTROSCOPIC DATA FOR COMPOUND MP-1
MEASURED IN BENZENE-D6 AND 1H AND 13C NMR SPECTROSCOPIC DATA FOR 1-O-
METHYL-6-ACETOXY-5-(PENTADEC-10Z-ENYL)RESORCINOL MEASURED IN CDCL3.
THE SPECTROSCOPIC DATA IS PUT SIDE BY SIDE SO THAT THE STRUCTURE CAN
BE EASILY COMPARED, THUS VALIDATING THE STRUCTURE OF MP-1. THE
SPECTROSCOPIC DATA FOR 1-O-METHYL-6-ACETOXY-5-(PENTADEC-10Z-
ENYL)RESORCINOL IS ADAPTED FROM “ALKYLRESORCINOLS AND CYTOTOXIC
ACTIVITY OF THE CONSTITUENTS ISOLATED FROM LABISIA PUMILA” BY N. A. AL-
MEKHLAFI, K. SHAARI, F. ABAS, R. KNEER, E. J. JEYARAJ, J. STANSLAS, N.
YAMAMOTO, T. HONDA, AND N. H. LAJIS, 2012, PHYTOCHEMISTRY (2012) 80, 42-49.
COPYRIGHT 2012 BY ELSEVIER. ADAPTED WITH PERMISSION.........................................247
TABLE 4.11 MSI DEREPLICATION OF FD1C F43-51 SAMPLE............................................................262
TABLE 4.12 MSI DEREPLICATION OF FD2C F29-33 AND FD2C F34-36 SAMPLES..............266

32
TABLE 4.13 GI50 CONCENTRATIONS (µg/ML) OF THE COMPOUNDS IDENTIFIED
THROUGH LC-MS DEREPLICATION DETERMINED FOR PC3 CELLS AS ASSESSED
BY SRB ASSAYS AFTER 72 HOURS. EACH RESULT WAS OBTAINED IN THREE
INDEPENDENT EXPERIMENTS, WHICH WAS RUN IN TRIPLICATE....................................269
TABLE 4.14 SUMMARY OF ALL THE INVESTIGATIONS CARRIED OUT USING THE ACTIVE
EXTRACTS OF MARANTODES PUMILUM (N-HEXANE AND CHLOROFORM) AND
FICUS DELTOIDEA (CHLOROFORM) PLANTS. ‘é’ INCREASED, ‘ê’ DECREASED ‘+’
CHARACTERISTIC DETECTED, AND ‘−‘ CHARACTERISTIC NOT DETECTED .............270
TABLE 4.15 SUMMARY OF ALL THE INVESTIGATIONS CARRIED OUT USING THE ACTIVE
FRACTIONS OF MARANTODES PUMILUM AND FICUS DELTOIDEA PLANTS. ‘é’
INCREASED, ‘ê’ DECREASED AND 'NA' NOT AVAILABLE.........................................................272
TABLE 5.1 DIFFERENTIAL GENE EXPRESSION IN PC3 CELLS ANALYSED USING
ILLUMINA MISEQ RNA SEQUENCING......................................................................................................289

33
List of Abbreviations
5-LOX 5-lipoxygenase
ACE Angiotensin-converting Enzyme
ADP Adenosine di-phosphate
AICR American Institute for Cancer Research
AIF Apoptosis-inducing Factor
AIF Apoptosis-inducing Factor
AR Androgen Receptor
ASAP Atypical small acinar proliferation
ATCC American Type Culture Collection
BIR Baculoviral IAP Repeat
BPH Benigh Prostate Hyperplasia
CAD Caspase-activated DNAse
CAM Complimentary and Alternative Medicine
CDK Cyclin-dependent Protein Kinase
cDNA Complementary Deoxyribonucleic acid
COSY Correlation Spectroscopy
COX Cyclooxygenase
CRPC Castration-resistant Prostate Cancer

34
DAPI 4’-6-Diamidino-2-phenylindole
DEPT Distortionless enhancement by polarization transfer
DHT Dihydrotestosterone
DMEM Dulbecco’s modified eagle medium
DMSO Dimethyl Sulfoxide
DNA Deoxyribonucleic Acid
DSHEA Dietary Supplement, Health and Education Act
ECM Extracelullar Matrix
EGF Epidermal Growth Factor
ELSD Evaporative Light Scattering Detector
EMEM Eagle’s Minimum Essential Medium
ER Estrogen Receptor
ESI-MS Electrospray Ionisation Mass Spectrometry
EU European Union
FBS Fetal Bovine Serum
FDA Food and Drug Administration
FGF Fibroblast Growth Factor
FITC Fluorescein Isothiocynate
FIM Foundation for Innovation in Medicine

35
FSQD Food Safety and Quality Division
FT-IR Fourier Transformed Infrared Spectroscopy
gDNA Genomic Deoxyribonucleic acid
GI50 Growth Inhibitory concentration 50
HDFa Human Dermal Fibroblast adult
HDL High-density Lipoprotein
HGPIN High Grade Intraepithelial Neoplasia
HMBC Heteronuclear Multiple-Bond Correlation
HMQC Heteronuclear Multiple-Bond Correlation
HPLC-DAD High Performance Liquid Chromatography-Diode Array
Detector
HRES-MS High Resolution-Mass Spectrometry
IAP Inhibitor of Apoptosis Proteins
IARC International Agency for Research on Cancer
IBD Institute of Bioproduct Development
IGF-1 Insulin-like Growth Factor 1
IGF-2 Insulin-like Growth Factor 2
IGFBP Insulin-like Growth Factor Binding Protein
IND Investigational New Drug

36
IncRNA Long non-coding RNA
LDL Low-density Lipoprotein
LHRH Luteinizing Hormone-releasing Hormone
m/z mass-to-charge-ratio
miRNA micro RNA
MMP Matrix Metalloproteases
MMP Mitochondrial Membrane Potential
MNTC Maximum non-toxic Concentration
MoA Ministry of Agriculture
MOH Ministry of Health
MPT Mitochondrial Permeability Transition
mRNA Messenger Ribonucleic Acid
MS Mass Spectrometry
MTT (3-(4,5-dimethylthiazolyl-2)-2,5-diphenyltetrazolium bromide
NAD Nicotinamide adenine dinucleotide
NCI National Cancer Institute
NCE New chemical entity
NDA New drug application
NEAA Non-essential Amino Acids

37
NMR Nuclear Magnetic Resonance
NOD-SCID Non-obese Diabetic Severe Combined Immunodeficiency
NOESY Nuclear Overhauser Effect Spectroscopy
OD Optical Density
PARP Poly ADP Ribose Polymerase
PBS Phosphate-buffered Saline
PCR Polymerase Chain Reaction
PDGF-B Platelet-derived Growth Factor B
PI Propidium Iodide
PIN Prostatic Intraepithelial Neoplasia
PPM Parts per million
PS Phosphatidylerine
PSA Prostate Specific Antigen
PTP Permeability Transition Pore
R&D Research and Develeopment
RLU Relative Light Unit
RMA Robust Multiarray Average
ROS Reactive Oxygen Species
RPMI Roswell Park Memorial Institute

38
rpm rotation per minute
RT-qPCR Quantitative Reverse Trancription Polymerase Chain
Reaction
rRNA ribosomal Ribonucleic Acid
SDF-1 Stromal-derived Factor 1
SFDA State Food and Drug Administration
SRB Sulforhodamine B
TCA Trichloroacetic Acid
TdT Terminal deoxynucleotidyl Transferase
TGF Transforming Growth Factor
TGFβ Tumour Growth Factor β
TIC Total Ion Chromatogram
TLC Thin Layer Chromatography
TNF Tumour Necrosis Factor
TNM Tumour, Node and Metastasis
tR Retention time
TRAIL TNF-related Apoptosis Inducing Ligand
tRNA transfer Ribonucleic acid

39
TUNEL Terminal deoxynucleotidyl transferase dUTP-mediated nick
end labeling
UHPLC Ultra High Performance Liquid Chromatography
UPM Universiti Putra Malaysia
UTM Universiti Teknologi Malaysia
UV Ultraviolet
VEGF Vascular Endothelial Growth Factor
VEGFR Vascular Endothelial Growth Factor Receotor
WHO World Health Organization

40
Acknowledgements
First and foremost, Alhamdulillah, thanks to Allah s.w.t., for giving me the
strengths, guidance and patience in completing this project. With His blessing,
this project is finally accomplished. This project has taught me lot and pushes
me well beyond my boundaries, and from this I begin to appreciate even the
smallest things in my life. Here, I would like to express my sincere appreciation
to Dr Jose-Prieto Garcia, my project’s supervisor, for his continuous believe in
me, encouragement, guidance, and willingness to give me a helping hand and
advices even at the most unexpected time and places. I would also want to
express my appreciation to my co-supervisor, Professor Simon Gibbons for his
wisdom and support throughout the course of the project. I am also grateful to
Professor Mohamad Roji Sarmidi, Professor Ramlan Azizi and Dr Harisun
Yaakob at Institute of Bioproduct Development (IBD), Universiti Teknologi
Malaysia for providing me with support and plant materials for this project.
Special appreciation is extended to my beloved wife, Wan Norazrina Wan Rusli
for her perseverance, patience, and endless motivations that she had given me
until now. Her contribution towards the making of this project is priceless.
Without her by my side, this project would not have come to fruition. Special
thank to our collaborator, Prof Jean-Luc Wolfender and his PhD student Mrs
Adlin Afzan from University of Geneva for their willingness to assist us with
UHPLC-MS analysis.
I would also like to thank everyone in the UCL Pharmacognosy group
especially Fon, Maria, Andre, Pedro, Sarah, Gugu, Awo, Ovr, Tony, Banaz,
Johanna, Francesca, Tariq, our hardworking technician Cory and the rest of the
group for their kind assistance whenever and wherever I needed it, their crazy
and spontaneous yet brilliant ideas and the great company that they have given
me, which make my life as a PhD student a lot easier. I would also like to give a
special mention to the lovely people in the UCL Pharmaceutics group especially

41
Zahra, Norhayati, Atiqah, Era, Fauzi, Acom, Nattika, Aderito, Mina, Mandana
and Isabel for making my stay in UCL School of Pharmacy an unforgettable
experience. Hopefully our friendship will continue to last forever. I am pleased to
thank my dear family; for their love, prayers and support. Special thanks to all
my fellow friends, who were directly and indirectly involved in the making of this
thesis. Thanks a lot for everything. May Allah repay all your kind deeds in the
future. Last but not least, I would like to thank Universiti Teknologi Malaysia for
providing the funding to run this project.

42
Chapter 1
Introduction

43
1 Introduction
1.1 Research Background
Cancer is a broad group of various diseases characterized by unregulated
cell growth (Ochwang’i, Kimwele et al. 2014). In cancerous cells, growth and
division are uncontrollable that could result in the formation of tumours which
can become malignant by metastasizing other parts of the body. Current
treatment regimes for cancer include chemotherapy, radiotherapy and surgery
(Vickers 2004). However, toxic effects on other non-target tissues often limit the
effectiveness of these treatments such as chemotherapy. It is usual that cancer
patients resort to the use of complementary and alternative therapies to palliate
these toxic effects or to extend their chances of survival. In the last decade, the
population has become more ‘health conscious’ and an expanding range of
complementary and alternative medicines (CAMs) is now globally available
leading to a dramatic increase in the use of such approaches in recent years.
Since ancient times, almost all cultures and communities have considered
plants as a valuable source of bioactive compounds for treating many diseases,
including cancer (Mohan, Bustamam et al. 2011). History shows that the use of
herbal drug preparations for medicinal purposes evolved for thousands of years
and reached its peak hundreds of years ago. The 19th century brought about
the application of modern chemistry to therapy; facilitating the isolation and
characterization of plant compounds which in turn have been the building blocks
of modern drug discovery and development.
44
In the last 30 years of the 20th century, the scientific community embarked
into a giant quest for anticancer drugs with a focus on plants. This sparked a
wider global research applying modern methods in a scale never seen before.
As a result, it is believed that up to 70,000 species of plants have been screened
for their medicinal use, most of them were selected based on their
ethnopharmacological uses (Veeresham 2012). According to Newman and
Cragg (2012), about 50% of the approved drugs during the last 30 years (1981-
2010) are derived either directly or indirectly from natural products. In the field of
cancer treatment, over the time frame from around 1940s to date, 85 from the
175 drugs used are being directly or indirectly derived from natural products.
This clearly shows the importance of natural products in drug discovery and they
will continue to do so in many years ahead.
Prostate cancer is one of the most common types of cancer worldwide,
especially in Western societies. In the last 5 to 10 years, the incidence of
prostate cancer is significantly increasing in Asian countries including Malaysia.
Initially, this phenomenon was linked to the influx of Western food restaurants
and franchises in most of the Asian continent that have led to the change of the
normal dietary pattern of Asians. However, numerous studies made clear that
even though diet could be one of the risk factors for prostate cancer, it only has
a weak association with the disease. Direct risk factors such as age, ethnicity,
family history and genetic conditions are reported to play major role in the onset
of prostate cancer.
Traditional herbal medicines are still very important for Malaysians both
from a nutritional and a medicinal point of view. Malay traditional medicine is
largely driven to gender-related groups of preparations: women’s health (Jamu
and/or Meroyan remedies) and men’s health (tonics or makjun) which work by
“cleansing the blood” and improving virility (Zakaria and Mohd 2010). In the

45
same way that daily administration of phytoestrogens has been put forward as a
potential chemopreventive approach for prostate cancer, (Morrissey and G
Watson 2003) plants traditionally used for women’s health may be a source of
such compounds for prostate cancer therapy.
The use of plant-derived products in prevention and/or treatment of cancer
may take two different pathways, in the one hand the identification and
characterization of active extracts for use as food supplements (nutraceuticals)
with the purpose of ‘contributing to a healthy bodily function’ which is in fact a
hidden chemopreventive claim and in the other hand the isolation and
identification of active molecules as lead compounds to develop drugs for future
chemotherapy. Each option has extremely different regulatory frameworks,
which lead to different research and development processes as explained in
more details in section 2.3. The sponsor of this project retains that the first
option is more realistic in the context of current market trends, nevertheless they
did not want to compromise on the quality; therefore they decided to gather
preclinical data even if this is not strictly necessary for this class of final product.
With this in mind, the main aims of this research are to investigate both
the mechanisms of cytotoxic effect and the chemistry of the active plant extracts
from two Malaysian plant species, predominantly used by the women namely
Marantodes pumilum (Blume) Kuntze (synonym Labisia pumila var pumila) and
Ficus deltoidea L. This study will inform the development of herbal preparations
for prostate health standardized in the identified/dereplicated phytochemicals by
Universiti Teknologi of Malaysia.

46
1.2 Problem Statement
Prostate cancer is the fourth most common type of cancer worldwide, and
the second most common cancer in men. Prostate cancer is the fifth leading
cause of death from cancer in men. The metastatic type of prostate cancer,
which is often lethal, has no effective therapeutic management to date.
Therefore, the finding of any new lead compounds from other sources including
plants is important to improve the current management available for this
condition.
1.3 Hypothesis
The active extracts of Marantodes pumilum (Blume) Kuntze (synonym
Labisia pumila var pumila) and Ficus deltoidea L. plants induce prostate cancer
cell death and inhibit both prostate cancer cell migration and invasion.

47
1.4 Objectives of study
This project aims to investigate the effect of Marantodes pumilum (Blume)
Kuntze (synonym Labisia pumila var pumila) and Ficus deltoidea L. plant
extracts on prostate cancer cells, characterize the phytochemistry and anti-
cancer mechanism of actions based on the main Hallmarks of Cancer with a
view to develop chemopreventive therapies. This aim will be achieved by
following an array of different strategies including:
Ø Characterizing the prostate cancer cells mode of death by using In vitro
mechanistic studies
Ø Characterizing the molecular pathways involved in the inhibition of both
prostate cancer cells migration and invasion induced by the cytotoxic
fractions or principles of the plants
Ø Bioguided isolation and identification of bioactive compounds from the
plants with a view to future standardisation of the extracts

48
Chapter 2
Literature Review

49
2 Literature Review
2.1 Prostate Cancer
Prostate cancer is also known as the carcinoma of the prostate. It occurs
when cancerous cells develop in the prostate which is a gland in the male
reproductive system.
Figure 2.1 Posterior view of the Prostate gland. Adapted from Ballacchino (2015)
Prostate cancer is classified as adenocarcinoma or glandular cancer. It
begins when some normal cells of the semen-secreting prostate glands mutate
into cancerous cells. Prostate cancers are usually slow growing tumour cells,
however in rare cases some prostate cancer cells can grow relatively fast.
Adenocarcinoma cells are commonly found in the peripheral zone of the
prostate gland where they initially form small clumps of cancer cells that remain
confined to otherwise normal prostate glands. This condition is known as
50
carcinoma in situ or prostatic intraepithelial neoplasia (PIN). As mentioned
earlier, most prostate carcinomas are slow growing tumours, therefore it will take
time for these cancer cells to begin multiplying and spreading to the surrounding
prostate tissue (the stroma) in order to form a full blown tumour. Eventually, the
tumour has the ability to grow large enough to invade nearby organs such as the
seminal vesicles or the rectum. Apart from that, given suitable conditions, the
tumour cells could also develop the ability to travel in the bloodstream and
lymphatic system. Therefore, because of these abilities, prostate cancer is
considered as a malignant tumour, which is able to metastasize to other parts of
the human body. The most common parts where prostate cancer metastasizes
include the bones, lymph nodes, and local organs such as bladder and lower
ureters (Roodman 2012). The tumour cells can spread to the bones using a
specialized route known as the prostatic venous plexus, which connect directly
to the vertebral veins (Casimiro, Guise et al. 2009).
2.1.1 Incidence
Prostate cancer is the fourth most common type of cancer worldwide, and
the second most common cancer in men. In 2012, an estimated 1.1 million men
worldwide were diagnosed with prostate cancer, which account for almost 15%
of the cancers diagnosed in men. 70% of these cases occurred in more
developed nations and this could be due to the practice of prostate specific
antigen (PSA) testing and subsequent biopsy that has become widespread in
this part of the world. 307,000 estimated deaths were reported in 2012 which
make prostate cancer as the fifth leading cause of death from cancer in men
(6.6% of the total men deaths) (Ferlay, Soerjomataram et al. 2013). In the
United Kingdom, prostate cancer contributed to the 46,690 (13%) new cases
and 11,287 deaths annually. 54% of prostate cancer cases in the UK are
diagnosed in males aged 70 and over every year (Cancer Research UK 2016).
According to the statistics provided by the National Cancer Registry (2011) of

51
Malaysia, prostate cancer ranked ninth overall and is the fourth most frequent
cancer (7.3% of all cancers) diagnosed in men. Although the incidence of
prostate cancer is more prevalent in the western countries, the number of
prostate cancer cases has also grown rapidly in Asian countries such as Japan,
and Hong Kong (Figure 2.2) (Wynder, Fujita et al. 1991, Liu 1993). These
statistical data show that prostate cancer has no geographical boundaries and
may be found in different parts of the world.
Figure 2.2 Worldwide incidence and mortality rate of prostate cancer. Adapted from
Ferlay, Soerjomataram et al. (2013)

52
2.1.2 Risk Factors
Many studies have been conducted to determine the risk factors that are
related to the onset of prostate cancer. However, a complete understanding of
the cause of prostate cancer remains elusive. No modifiable and preventable
factors have been conclusively linked with prostate cancer risk due to the
complexity in interpreting the epidemiological evidence around prostate cancer
(Giovannucci, Liu et al. 2007, Cogliano, Baan et al. 2011). The International
Agency for Research on Cancer (IARC) (2014) together with the American
Institute for Cancer Research (AICR) (2014) have underlined several risk factors
for prostate cancer.
One of the risk factors include age and ethnicity which are strongly
related to prostate cancer. The highest incidence of prostate cancer cases occur
in older men. In the UK between 2009 and 2011, an average of 36% of cases
were diagnosed in men aged 70 years and over while only 1% were diagnosed
in the under-50s (Northern Ireland Cancer Registry , Welsh Cancer Intelligence
and Surveillance Unit) and this number has increased steadily over time as 54%
of prostate cancer cases were diagnosed in the UK between the period of 2012
to 2014 in men aged 70 and over (Cancer Research UK 2016). Ethnicity also
play an important role in prostate cancer incidence as age-standardised rates for
White males with prostate cancer range from 96.0 to 99.9 per 100,000. Rates for
Asian males are significantly lower, ranging from 28.7 to 60.6 per 100,000
whereas the rates for Black males are significantly higher, ranging from 120.8 to
247.9 per 100,000 (National Cancer Intelligence and Cancer Research UK). In
Malaysia, the overall age standardized incidence is 12 per 100,000 populations,
with the highest incidence of prostate cancer reported among Chinese (15.8 per
100,000) followed by Indians (14.8 per 100,000) and the lowest in Malays (7.7
per 100,000).

53
Apart from that, family history and genetic conditions also play important
roles in prostate cancer, for example men whose father has/had the disease has
2.1-2.4 times higher risked in developing prostate cancer (Johns and Houlston
2003, Watkins Bruner, Moore et al. 2003, Kicinski, Vangronsveld et al. 2011)
and Men whose brother has/had prostate cancer in the family has 2.9-3.3 times
higher risk of developing the disease (Johns and Houlston 2003, Watkins
Bruner, Moore et al. 2003, Kicinski, Vangronsveld et al. 2011). However,
prostate cancer is not associated with a breast cancer in a sister (Hemminki and
Chen 2005, Chen, Page et al. 2008). Prostate cancer risk is not associated with
prostate cancer in adoptive parents or adoptive family (Zöller, Li et al.); this has
further supported the family history and genetic link hypothesis. Men with
BRCA2 mutation has up to 5 times higher risk in developing prostate cancer
when compared to the general population and this risk could increase to 7 times
higher in men aged under 65 (The Breast Cancer Linkage Consortium, 1999).
BRCA1 mutation in men could also increase prostate cancer risk but the
evidence remains unclear (Thompson, Easton et al. 2002, Fachal, Gómez-
Caamaño et al. 2011). Lynch syndrome which is an autosomal dominant genetic
condition could also increase the risk of prostate cancer by 2.1-4.9 times higher
when compared to the general population as shown by a meta-analysis and a
cohort study (Haraldsdottir, Hampel et al. 2014, Ryan, Jenkins et al. 2014) Apart
from that, endogenous hormone such as insulin-like growth factor-1 (IGF-1) has
been reported to increase prostate cancer risk by 38-39% higher in men with
highest level of IGF-1 (Renehan, Zwahlen et al. , Roddam, Allen et al. 2008).
However, studies have shown that prostate cancer risk is not associated with
both insulin-like growth factor-2 (IGF-2) and insulin-like growth factor binding
protein (IGFBP) (Roddam, Allen et al. 2008, Rowlands, Gunnell et al. 2009), but
the risk may vary between IGFBPs. These are the main risk factors associated
with prostate cancer, other risk factors with weaker association include diet,
occupational exposures, exposure to ionizing radiation and obesity.

54
2.1.3 Stages
Cancer staging is very important as it will help to determine the extent to
which a cancer has developed by spreading. There are a few different staging
system used for prostate cancer. Two of the most commonly used systems are
the ‘TNM’ staging system and the ‘number staging’ system. TNM is an
abbreviation for tumour (T), node (N), and metastasis (M). TNM system shows
how far the cancer has spread in and around the prostate, it also shows how far
the cancer has spread to the nearby lymph nodes and evaluate whether the
cancer has already spread to other parts of the body such as the bones. The
‘number staging’ for prostate cancer is divided into 4 stages (I,II,III and IV)
(Figure 2.3). Primary prostate cancer is under stages I and II. In these two
stages the cancer cells are still localised in the prostate. Stage II prostate cancer
means that the cancer cells are at an advanced stage compared to stage I but
are still localised in the prostate. Patients with stage I and stage II prostate
cancer has low or intermediate risk of having a metastasis. Stage III and stage
IV prostate cancer cells are characterized by the spreading of the cells to other
bodily parts. In stage III prostate cancer, the cells have spread beyond the outer
layer of prostate and may have spread to the seminal vesicles whereas in stage
IV, the cancer cells have spread beyond the seminal vesicles to nearby tissues
or organs such as the rectum, bladder or pelvic wall and also to distant parts of
the body. Therefore stage IV represents the worst stage of prostate cancer and
patients at this stage only have 28% of 5-year relative survival rate according to
the American Cancer Society (2016).

55
Figure 2.3 Stages of prostate cancer. Adapted from Healthfavo (2014)
2.1.4 Pathophysiology of Prostate Cancer
Many abnormalities at cellular, molecular and genetics levels have been
associated with the occurrence of prostate cancer. These include chromosomal
abnormalities, the presence of oncogenes and overexpression of certain
proteins.
2.1.4.1 Chromosomal abnormalities and oncogenes
Chromosomal abnormalities associated with prostate cancer includes the
deletion of 8p,10q, 13q, and 16q as well as the gains of 7p,7q,8q and Xq
chromosomes. These allelic abnormalities has been reported by Nupponen and
Visakorpi (1999), Hughes, Murphy et al. (2005) and Shi, Sun et al. (2013). Apart
from that other allelic loss has been reported by Rubin and Rubin (1998), Shen

56
and Abate-Shen (2010) and Fraser, Sabelnykova et al. (2017) which include the
loss of 6q,7q,17p and 18q.
The MYC is a well-known oncogene which plays an important role in the
regulation of cellular proliferation, differentiation and apoptosis. This oncogene is
located at 8q24 and also at other amplified region of 8q (Visakorpi, Kallioniemi et
al. 1995, Cher, Bova et al. 1996, Nupponen, Kakkola et al. 1998, Taylor, Schultz
et al. 2010). The overexpression and amplification of this oncogene have been
detected in prostate cancer cells especially in the metastatic stage (Bubendorf,
Kononen et al. 1999, Taylor, Schultz et al. 2010, Rickman, Beltran et al. 2017).
Besides MYC, the RAS family oncogenes are the most common oncogenes in
human cancer. However, in prostate tumours, mutations in the ras genes
(HRAS, KRAS and NRAS) are relatively uncommon (Min, Zaslavsky et al. 2010,
Zeng, Hu et al. 2014), except in the rare ductal form of the disease. Morote, de
Torres et al. (1999), has reported that overexpression of ERBB2 gene is a
frequent event in prostate cancer. The ERBB2 gene, commonly referred to as
Her-2/neu belongs to a family of genes that provide instructions for producing
growth factors receptors. These growth factors are important in stimulating cell
growth and division. ERBB2 gene amplification will result in the overproduction
of ErbB2 protein and this can cause cells to grow and divide continuously
leading to uncontrolled cell division, which is one of the hallmarks of cancerous
tumour progression (Pignon, Koopmansch et al. 2009, Yan, Parker et al. 2014).
Another oncogene that plays a very important role in the progression of prostate
cancer is Bcl-2. Several authors have reported the overexpression of Bcl-2
especially in recurrent tumours (McDonnell, Troncoso et al. 1992, Colombel,
Symmans et al. 1993, Krajewska, Krajewski et al. 1996, Pienta and Bradley
2006, Delbridge, Grabow et al. 2016), however, this event did not seem to
happen due to the amplification of the genes (Nupponen and Visakorpi 1999,
Pienta and Bradley 2006). Bcl-2 inhibits apoptosis of the prostate cancer cells

57
subjected to androgen deprivation therefore allowing the cancerous cells to
survive even without the presence of required hormone.
2.1.4.2 Androgen receptor
Androgen receptor (AR) is a type of nuclear receptor that is encoded by a
single copy gene located on the X-chromosome (Xq11.2-q12), which consists of
919 amino acids in length, but this can vary depending on the poly-glutamine,
poly-glycine, and poly-proline repeats of variable lengths (Velcheti, Karnik et al.
2008). AR signalling is very important as it plays critical role not only for prostate
function and differentiation but also for the growth and progression of prostate
cancer (Velcheti, Karnik et al. 2008, Yuan, Cai et al. 2014). AR activity is
regulated by two major ligands, testosterone and dihydrotestosterone (DHT).
DHT, which has 10 times higher binding affinity to AR is the primary androgen
bound to AR. The binding of DHT to AR promotes the recruitment of proteins
kinases, which lead to the phosphorylation of several serine residues. This
process is very important as it serves many functions such as protection from
proteolytic degradation, stabilization, and transcriptional activation (Edwards and
Bartlett 2005). The transactivation of AR is vital as it regulates specific gene
targets that are involved in cells growth and survival (Chmelar, Buchanan et al.
2007). The rate of cells proliferation and the rate of cells apoptosis are balanced
in normal prostate epithelium, however, the balance is lost in prostate cancer
that leads to the formation of tumour cells (Denmeade, Lin et al. 1996). Since
prostate cancer growth is highly dependent on androgen, androgen-ablation
therapy has always been the most effective treatment for prostate cancer at an
early stage. However, this therapy only manages to delay tumour progression by
18-24 months followed by the development of a lethal drug-resistant stage
known as castration-resistant prostate cancer (CRPC). Visakorpi, Kallioniemi et
al. (1995), has reported that in CRPC patients, the frequent amplification of
chromosome Xq in recurrent tumours has led to the overexpression of AR after

58
androgen deprivation therapy. This type of chromosomal amplification is rarely
seen in the primary tumours. The overexpression of AR overcomes the
decreased levels of circulating androgens in hormone-independent prostate
cancer thus allowing the cancer cells to continue growing even in very low level
of androgen left in serum after castration (Visakorpi, Kallioniemi et al. 1995, Tan,
Li et al. 2015). The overexpression of AR also produce a receptor that is more
sensitive to a low androgen levels or that can be activated by other types of
steroids such as adrenal androgens, estrogens, progestins, as well as anti-
androgens that used in the management of the disease (Scher and Sawyers
2005).
2.1.4.3 Metastasis
Metastasis is defined as the spread of tumour cells from their primary site
to distant organs and their ability to grow and survive at the new sites remains
the most fearsome aspect of cancer. Metastasis has been the subject of study
for more than 100 years. However, only until recently that researchers have
gained important insight into the mechanism by which metastatic cells arise from
primary tumour and the reasons why certain tumours tend to spread or
metastasize to specific organs (Fidler 2003). Back in 1889, an English surgeon
proposed the ‘seeds and soil’ hypothesis that says metastasis depends on
cross-talk between selected cancer cells (the ‘seeds’) and the specific
microenvironments (the ‘soils’) surrounding them (Paget 1889). Although this
hypothesis still holds forth today, it is now understood that the ability of tumour
cells to metastasize depend on several elements including its interactions with
the homeostatic factors that promote tumour-cell growth, angiogenesis, survival,
invasion and metastasis (Fidler 2003). Figure 2.4 shows the general process of
cancer metastasis, which consists of a long series of sequential and inter-related
steps. Each of these steps can be rate-limiting, therefore a failure or

59
insufficiency at any steps could lead to the collapse of the whole process (Poste
1980, Fidler 2002).
Figure 2.4 The process of cancer metastasis. Adapted from “The pathogenesis of cancer
metastasis: the 'seed and soil' hypothesis revisited” by I. J. Fidler, 2003. a. Growth of primary tumours require nutrient that is initially supplied by simple diffusion. b. The
growth of tumour mass exceeding 1-2 mm in diameter requires extensive vascularization.
c. Lymphatic channels, which are characterized by their thin-walled venules, act as the
most common route for tumour-cell entry into the circulation. d. Tumour cells that
survived the circulation become trapped in the capillary bed of distant organs by
adhering either to exposed capillary endothelial cells or subendothelial basement
membrane. e. Extravasation occurs. f. Proliferation of the tumour cells at distant organaccompanied by micrometastasis. Nature Reviews Cancer 3, 453-458. Copyright 2003 by
Nature Publishing Group. Adapted with permission.

60
Prostate cancer is one of the most malignant types of cancer in men. It
has the ability to spread to other distant sites including bones, lymph nodes,
lungs, liver and brain. However, prostate cancer frequently metastasizes to the
bone marrow.(Roudier, Morrissey et al. 2008) This is evident as almost 90% of
advanced prostate cancer patient suffer from pathologic fractures, spinal cord
compression, and pain due in part of deregulated cycles of osteoblastic and
osteolytic resorption/formation driven by the growing tumour mass (Rubens
1998, Fizazi, Carducci et al. 2011). Although the mechanisms that account for
the tendency of prostate cancer cells to metastasize to bone have not yet been
elucidated but it may include direct vascular pathway, highly permeable
sinusoids, chemotactic factors produced by bone marrow stromal cells and the
synthesis of growth factors important to support cells survival, and proliferation
of ‘seeded’ cancer cells (Diel 1994, Geldof 1996). Taichman, Cooper et al.
(2002) hypothesize that metastatic prostate carcinomas may use the
hematopoietic model to localize to the bone barrow. In this model, chemokines,
which are a group of molecules known to play significant roles as activators and
chemoattractants, including CXC chemokine such as CXCL12 and its receptor
CXCR4 appear to be critical molecular determinants for the events in this model
(Aiuti, Tavian et al. 1999, Kim and Broxmeyer 1999). In their study, Taichman,
Cooper et al. (2002) showed that the CXCL12/CXCR4 chemokine axis was
activated in prostate cancer metastasis to the bone. They also confirmed that
CXCR4 expression is related to increasing tumour grade, as well as showing
that CXCL12 signalling through CXCR4 triggers the adhesion of prostate cancer
cells to bone marrow endothelial cells (Sun, Wang et al. 2003). Similar studies
conducted by other researchers also suggest that CXCL12/CXCR4 axis play
parallel roles in other tumours that also metastasize to the marrow. Müller,
Homey et al. (2001) reported that CXCL12/CXCR4 axis play central roles in
regulating metastasis by showing that normal breast tissues express little
CXCR4 receptors compared to breast neoplasms, which express high levels of
CXCR4. Furthermore, this study also shows that the use of antibody that could

61
block CXCR4 receptor was able to prevent the spread of tumours cells to lungs
and lymph nodes.
Apart from that, the metastatic progression of prostate cancer is also
closely associated with two genes namely E-cadherin (CDH1) and KAI1 genes.
The expressions of both genes are significantly reduced in metastatic prostate
cancer cells (Umbas, Schalken et al. 1992, Morton, Ewing et al. 1993).
However, this was not caused by allelic loss but rather by post-transcriptional
events regulated by p53. Therefore loss of p53 function in the late stages of
tumour progression could cause down-regulation of these two genes with
subsequent metastasis (Mashimo, Watabe et al. 1998).
2.1.4.4 Arachidonic acid metabolism
Besides the abnormalities in chromosomes, as well as the presence of
oncogenes and the overexpression of specific receptors, malignant cancer cells
commonly overexpress key enzymes of the arachidonic acid metabolism (mainly
COX-2 and 5-LOX). The COX-2 is overexpressed in practically every
premalignant and malignant condition involving the colon, liver, pancreas,
breast, lung, bladder, skin, stomach, head, neck and oesophagus (Eberhart,
Coffey et al. 1994, Hida, Yatabe et al. 1998, Hwang, Byrne et al. 1998, Koga,
Sakisaka et al. 1999, Mohammed, Knapp et al. 1999, Tucker, Dannenberg et al.
1999, Aggarwal and Shishodia 2006, Wolfesberger, Walter et al. 2006).
Interestingly, human prostate cancer cells are known to generate 5-
lipoxygenase (5-LOX) instead. 5-LOX is a type of enzyme in human encoded by
the ALOX-5 gene. Ghosh and Myers (1997) reported that chemical constituents
such as arachidonic acid, an omega-6, polyunsaturated fatty acid was found to
stimulate prostate cancer cell growth via the 5-LOX pathway. This has been
recently corroborated by Yang, Cartwright et al. (2012),who also point towards

62
12-LOX. The expression of 5-LOX is normally restricted to specified immune
cells such as neutrophils, eosinophils basophils and macrophages whereas the
vast majority of non-immune body cells do not express 5-LOX unless at the
onset of certain diseases such as asthma, arthritis, psoriasis and cancer
(Fürstenberger, Krieg et al. 2006, Werz and Steinhilber 2006, Rådmark, Werz et
al. 2007, Ghosh 2008). 5-LOX plays a very important role in chemotaxis in these
cells (Werz and Steinhilber 2006). Ghosh and Myers (1997), reported that the
inhibition of 5-LOX would block the production of 5-LOX metabolites and triggers
apoptosis in prostate cancer cells. The expression of 5-LOX in normal prostate
glands is almost undetectable, however 5-LOX is heavily expressed in prostate
tumour tissues. Therefore, this finding is very important for the development of
future therapeutic approaches for prostate cancer as 5-LOX plays a critical role
in the survival of prostate cancer cells. This leads to the concept that 5-LOX may
play a major role in the development and progression of prostate cancer and
could be used as a promising target in prostate cancer therapy. Other
abnormalities including the amplification and overexpression of certain genes
mentioned earlier could also be used as potential target in future prostate cancer
therapy.
2.1.4.5 Angiogenesis
Tumour normally consists of cancer cells and stromal cells. These
stromal cells face a very hostile metabolic environment characterized by
acidosis and hypoxia. Tumour development requires the supply of oxygen and
nutrition, this is usually provided by the nearby blood vessels (Holmgren,
O'Reilly et al. 1995). With this, the tumour growth is only limited to 1-2 mm in
diameter (avascular phase) (Carmeliet 2003). Therefore in order for the tumour
to exceed the size limit, the tumour needs an increased blood supply. This is
mainly provided by the formation of new blood vessels from pre-existing
capillaries and venules. This process is called angiogenesis (Carmeliet 2003).

63
The classical angiogenesis process is shown in Figure 2.5. Prostate tumours
like other type of tumour cells overexpress vascular endothelial growth factor
(VEGF) (Li, Younes et al. 2004). VEGF is a homodimeric glycoprotein that
belongs to the first group of pro-angiogenic factors (Ferrara, Gerber et al. 2003).
Other important pro-angiogenic factors include fibroblast growth factor (FGF)
(Friesel and Maciag 1995), platelet-derived growth factor B (PDGF-B) (Battegay,
Rupp et al. 1994), angiopoietins (Battegay, Rupp et al. 1994, Friesel and Maciag
1995), growth-related oncogenes (Wang, Hendricks et al. 2006), tumour growth
factor β (TGFβ) (Sankar, Mahooti-Brooks et al. 1996), and matrix
metalloproteases (MMPs) (Egeblad and Werb 2002).
The overexpression of VEGF in prostate tumours will promote the
development of tumour neovascularization and this overexpression also
correlate with increasing grade, vascularity and tumorigenicity. Besides that, the
receptor for VEGF, VEGFRs and α5β integrin were expressed by prostate
cancer cells in-vitro and and prostate tumours in-vivo and their expression was
elevated at sites of bones metastasis compared to original prostate tumour. He,
Kozaki et al. (2002) reported that the angiogenic effect of VEGF in prostate
tumour could be blocked by the inactivation of its receptor, VEGFR. Without
VEGF or VEGFR, the prostate tumour cells would not be a able to form
sprouting capillaries. Therefore, this could be a potential target to stop the
development and progression of prostate cancer.

64
Figure 2.5 The classical angiogenic process. Adapted from “Circulating endothelial cells
as biomarkers of prostate cancer” by H. D. Georgiou, B. Namdarian, N. M. Corcoran, A. J. Costello, and C. M. Hovens, 2008, Nature Clinical Practice Urology (2008) 5, 445-454.
Copyright 2008 by Nature Publishing Group. Adapted with permission.

65
2.1.5 Treatment
2.1.5.1 Chemoprevention of Prostate cancer
The idea of chemoprevention was initially introduced in the mid 1970s
(Sporn and Newton 1979, Brawley 2002). It is defined as the administration of
agents or substances such as drugs or vitamins to try and reduce the risk or
delay the development or recurrence of cancer. Carcinogenesis in cancer
development is a complex process that normally requires a long period of time;
therefore chemoprevention could play a major role in inhibition or slowing of this
process before cancer growth becomes clinically significant (Kelloff, Lieberman
et al. 1999). Chemoprevention is a type of preventive medicine and can be
divided into primary, secondary and tertiary prevention. Primary prevention
deals with the incidence of disease in an otherwise healthy individual.
Secondary prevention aims to stop the progression of a disease to a clinically
significant stage by focusing on the treatment given to an individual already with
a premalignant condition. Tertiary prevention focuses on the prevention of
recurrence or progression of disease in an individual previously treated with
malignancy (Sandhu, Nepple et al. 2013). In the case of prostate cancer,
chemoprevention is essentially aimed at primary and secondary prevention
(Sandhu, Nepple et al. 2013).
There are many reasons that support the use of chemoprevention as part
of prostate therapy. As mentioned earlier in this section, carcinogenesis in
cancer development occurs over time and this is also the case for prostate
cancer. In fact, carcinogenesis in prostate cancer is thought to consist of a
protracted multistep molecular processes affecting numerous pathways
(Gonzalgo and Isaacs 2003). This molecular pathogenesis could lead to the

66
development of pre-cancerous characteristics such as atypical small acinar
proliferation (ASAP) and high grade intraepithelial neoplasia (HGPIN) (Epstein
and Herawi 2006). Both ASAP and HGPIN can be detected many years before
the formation of the actual cancer mass in the prostate gland itself. These
characteristics make prostate cancer as an ideal target for primary
chemopreventation. Apart from that, prostate cancer also has a prolonged latent
disease state. This simply means there is a long period between the
development of the cancerous cells and their eventual manifestations by
symptoms. Therefore increasing the incidence of prostate cancer in elderly men
aged between 60-79 years old (Stamatiou, Alevizos et al. 2006). This specific
characteristic of prostate cancer makes it suitable as a target for secondary
chemoprevention.
In chemoprevention, it is vital to use agents or substances with low
toxicity as it involves the treatment of healthy individual (Hong and Lippman
1994). In prostate cancer, chemoprevention can be used to prevent the
transformation of normal cells or precursor lesions to cancerous cells
(secondary prevention) as well as stopping the growth of the existing tumour
cells (Walsh 2010). 5 Alpha-reductase inhibitors are one of the
chemopreventives used in prostate cancer therapy. Inhibition of 5-α-reductase
will decrease the amount of dihydrotestosterone (DHT) in prostate cancer
tissues, thus lowering the androgenic stimulation to the prostate (Brawley 2002).
Several studies showed that the inhibition of 5-α-reductase in prostate cancer
tumours grafted into animal has significantly impeded tumour implantation and
growth (Tsukamoto, Akaza et al. 1998, Roehrborn, Boyle et al. 1999).
Finasteride is a type of 5-α-reductase inhibitor, which lowers intraprostatic DHT
levels while causing testosterone level to increase slightly (Stoner 1994). It was
the first 5-α-reductase inhibitor to enter human trial. Another 5-α-reductase
inhibitor that is used for prostate cancer chemoprevention is dutasteride. Unlike
finasteride, dutasteride is thought to have better efficacy in chemoprevention as

67
it can inhibit both isoforms of 5-α-reductase (Bramson, Hermann et al. 1997).
Recent study conducted by Andriole, Bostwick et al. (2010) showed that
dutasteride reduced the risk of prostate cancers and precursor lesions among
men at increased risk of prostate cancer and for benign prostatic hyperplasia
(BPH) while improving many outcomes related to BPH. Other agents such as
vitamin C, vitamin B1, vitamin B2, vitamin B3, calcium, zinc, protein and
selenium have been used in the hope of preventing the growth of prostate
cancer, however no clear association exists between these common dietary
factors and prostate cancer (Brawley 2002). In this study, characterization of the
active extracts could lead to their use in prostate cancer chemoprevention in the
future.
2.1.5.2 Management of Prostate cancer
Treatments and prostate cancer management depends on several factors
such as the stage of the disease, age, general health, and a person’s view about
potential treatments and their possible side effects. Due to the aggresiveness
and the annoying side effects (erectile and urinary dysfunction) of most
treatment options, treatment discussion often focus on balancing the goals of
therapy with the risk of lifestyle alterations. A combinations of treatment options
is highly recommended for managing the disease (Lu-Yao, Albertsen et al. 2009,
Mongiat-Artus, Peyromaure et al. 2009, Picard, Golshayan et al. 2012). The
management of prostate cancer can be divided into three categories; 1)
management of localised prostate cancer, 2) management of locally advanced
prostate cancer, 3) management of metastatic prostate cancer.

68
Most patients diagnosed with localised prostate cancer will have an
excellent prognosis. This is achieved by radical prostatectomy and/or radiation
therapy. One-fifth of the patients opt out surgery and will undergo ‘watchful
waiting’. However, 20%-40% of the patients who went through primary therapy
will experience biochemical relapse, with 30%-70% of those developing
metastatic disease within 10 years after the introduction of local therapy (Pound
and Pound 1999, D'Amico, Cote et al. 2002, Antonarakis, Trock et al. 2009,
Uchio and Uchio 2010). Metastatic stage of prostate cancer is normally
managed by the use of androgen-deprivation therapy or also known as hormone
ablation therapy. A luteinizing hormone-releasing hormone (LHRH) agonist will
improve the symptoms but tumours invariably become hormone independent
(castration-resistant) and evolve to the progressive stage. Before 1990s,
patients with castration-resistant prostate cancer (CRPC) were generally treated
with palliative approaches, as no other life-prolonging options were available. As
prostate cancer is often associated with elderly men with limited bone marrow
reserve and concurrent medical conditions, the use of chemotherapy at this time
was not recommended as it can further deteriorate the quality of life (Paller and
Antonarakis 2011).
Tannock, Osoba et al. (1996) has reported that mitoxantrone (with
prednisone) has the ability to improve quality of life and reduce bone pain
besides lowering serum PSA level in men with CRPC. This important discovery
has led to the use of intercalating agent mitoxantrone as the initial standard of
care for such patients. The cytotoxic Docetaxel has replaced the use of
mitoxantrone as the first line standard of care in 2004 after the Soutwest
Oncology Group reported that docetaxel (with estramustine) significantly
extended progression-free and overall survival for CRPC patients when
compared to mitoxantrone (with prednisone) (Petrylak, Petrylak et al. 2004).
However, up until 2010, physicians have no other life-prolonging second-line
options after the failure of docetaxel. On June 17 the same year, the US Food

69
and Drug Administration (FDA) approved the use of cabazitaxel for CRPC
patients previously treated with a docetaxel-containing regime (US Food and
Drug Administration) thus changing from stabilisation of microtubule to inhibition
of the assembly as the underlying mechanism of therapeutic action. Until
recently, other therapies including Enzalutamide (Xtandi®), Abiraterone
(Zytiga®) and Radium-233 (Xofigo®) have been used for the management of
CRPC patients. Both Enzalutamide and Abiraterone are a new type of hormone
therapy for men with prostate cancer that is no longer responding to hormone
therapy or chemotherapy. Enzalutamide works by blocking the hormone
testosterone from reaching the prostate cancer cells whereas Abiraterone works
by stopping the production of testosterone in the body. Without the availability of
this hormone, prostate cancer cells will cease to grow wherever they are in the
body.
2.2 Possible therapeutic targets for Prostate Cancer based on the major hallmarks of cancer
Figure 2.6 shows the 6 main hallmarks of cancer originally proposed by
Hanahan and Weinberg (2000) which include sustaining proliferative signaling,
evading growth suppressors, resisting cell deaths, activating invasion and
metastasis, inducing angiogenesis and enabling replicative immortality. The
same authors later extended this list after considering the new progresses made
in the past decade by adding two new hallmarks comprising the reprogramming
of energy metabolism and the evasion of immune destruction (Hanahan and
Weinberg 2011). These are the biological capabilities acquired by the tumor
cells during their multistep development that enable them to become
tumorigenic and ultimately malignant. The understanding of these hallmarks is
very important in order to find suitable therapeutic targets that can be used more
effectively in cancer treatment. Blandin, Renner et al. (2015) has reported that
ß1 integrins which is a type of matricellular receptors (extracellular matrix

70
component), plays important role in the modulation of these cancer hallmarks.
Therefore, it can be used as one of the suitable therapeutic targets for cancer
therapy. This study aims to find bioactive compound/s from plants that could
modulate some of the cancer hallmarks namely resisting cell death or evading
apoptosis, activating invasion and metastasis and inducing angiogenesis. These
are the three main hallmarks of cancer that would be the focus of this study. The
discovery of bioactive compound/s with the ability to modulate these 3 important
hallmarks would be vital for the future of prostate cancer therapy.
Figure 2.6 The Hallmarks of Cancer. Adapted from “Hallmarks of Cancer: The Next
Generation” by D. Hanahan, and R. A. Weinberg, 2011, Cell (2011) 144 (5), 646-674.
Copyright 2011 by Elsevier Inc. Adapted with permission.

71
2.2.1 Resisting cell death: Role of Smac/DIABLO in cancer progression
The ability of tumor cells to expand in numbers depends not only on the
rate of cells proliferation but also on the rate of cells death, which occur normally
through apoptosis. In normal cells, this process is tightly regulated in order to
maintain cells population and immune system development (Vaux and
Korsmeyer 1999). However, disruptions and deregulations of the process lead to
uncontrolled cell growth, which is a characteristic of tumor cells. Therefore,
inducing cancer cells apoptosis is important in any type of cancer therapy and in
this case prostate cancer therapy.
Apoptosis can be activated through two distinct pathways (Figure 2.7):
The extrinsic pathway, which is mediated by death receptors (CD95 and TRAIL)
or the intrinsic pathway, which is mediated by the mitochondria (Martinez-Ruiz,
Maldonado et al. 2008). Stimulation of death receptors such as CD95 or TNF-
related apoptosis-inducing ligand (TRAIL) located on the plasma membrane
result in the activation of the initiator caspase-8 which can cause direct cleavage
of downstream effector caspases such as caspase-3 (Walczak and Krammer
2000). Effector caspases such as caspase-3 will cause irreversible damage to
the nuclear lamina, cleave the proteins that normally hold a DNA degrading
enzyme (DNAse) in an inactive form, freeing the DNAse to cut the DNA in the
cell nucleus and ultimately causing the dismantling of the cells in a quick and
neat way (Fulda and Debatin 2006).

72
Figure 2.7 The Extrinsic and Intrinsic Apoptosis. Adapted from “Extrinsic versus intrinsic
apoptosis pathways in anticancer chemotherapy” by S. Fulda and K-M. Debatin, 2006. Apoptosis signalling pathways. Apoptosis pathways can be initiated through two main
entry sites, at the plasma membrane by death receptor pathway or at the mitochondria by
the mitochondrial-driven pathway. Stimulation of the death receptor pathway (Extrinsic
Apoptosis) involves ligation to the tumor necrosis factor (TNF) receptor superfamily such
as CD95 or TNF-related apoptosis-inducing ligand (TRAIL) receptors. Activation of the
death receptors results in recruitment of the adaptor molecule Fas-associated death
domain (FADD) and caspase-8. Upon recruitment, caspase-8 becomes activated and initiates apoptosis by cleaving and activating downstream effector caspases. The
mitochondrial-driven pathway (Intrinsic Apoptosis) is initiated by stress signals through
the release apoptogenic factors such as cytochrome c, apoptosis inducing factor (AIF), or
Smac/DIABLO from the mitochondrial intermembrane space. Cytochrome c forms an
aggregate called apoptosome complex with apoptotic protease activating factor 1 (Apaf-
1) and caspase-9. The formation of this complex will activate caspase-3 and other
downstream effector caspases. Smac/DIABLO promotes caspase activation by
neutralizing the inhibitory effects of IAPs, whereas IAF cause DNA condensation. Oncogene (2006) 25, 4798–4811. Copyright 2006 by Nature Publishing Group. Adapted
with permission.

73
The mitochondrial-driven (intrinsic) pathway is initiated with the
permeabilization of the outer mitochondrial membrane by pro-apoptotic
members of the Bcl-2 family such as Bax and Bak (Green and Kroemer 2004).
This process is regulated by proteins from the Bcl-2 family (e.g. Bcl-2, Bcl-xL,
Bcl-w, Bax, Bak and Bok), mitochondrial lipids, proteins that regulate
bioenergetics metabolic flux and components of the permeability transition pore
(Green and Kroemer 2004). After the disruption of the outer mitochondrial
membrane, apoptogenic factors such as cytochrome c, apoptosis-inducing
factor (AIF), TG (Smac/DIABLO), Omi/HtrA2 or endonuclease G are released
into the cytosol from the mitochondrial intermembrane space (Candé, Cecconi et
al. 2002, Saelens, Festjens et al. 2004). The release of cytochrome c activates
caspase-3 and eventually leads to the dismantling of the cells in a neat and
quick way without causing any harm to the neighboring cells.
Smac/DIABLO is a novel mitochondria-derived pro-apoptotic protein that
plays an important role in sensitizing tumor cells to die by apoptosis (Figure 2.8)
(Du, Fang et al. 2000, Verhagen, Ekert et al. 2000). It has a pro-apoptotic effect
that is mediated by its interaction with inhibitor of apoptosis proteins (IAPs) and
the release of effector caspases from them. The IAP protein family that includes
XIAP, c-IAP1 and c-IAP2 blocks both intrinsic and extrinsic apoptotic pathways
by binding to and inhibiting active caspases, thus stopping the caspase cascade
(Jia, Patwari et al. 2003). XIAP is the most potent among the IAPs due to the
presence of three domains known as baculoviral IAP repeat (BIR) domains. BIR
domains are very important in inhibiting the activity of active caspases
(Deveraux, Roy et al. 1998). Smac/DIABLO functions by neutralizing the
caspase-inhibitory properties of XIAP (Ekert, Silke et al. 2001). This is achieved
by the displacement of XIAP from caspase 9 by Smac/DIABLO, thus
overcoming the ability of XIAP to repress the activity of effector caspase,
caspase-9, within the apoptosome complex (Srinivasula, Hegde et al. 2001).
Several studies have shown that Smac/DIABLO is required for mitochondrial-

74
driven apoptosis in human multiple myeloma and prostate cancer cells (Carson,
Behnam et al. 2002). Smac peptide was also reported to enhance apoptosis
induced chemo or immunotherapeutic agents in the leukaemic Jurkat cell line
(Guo, Nimmanapalli et al. 2002) and in malignant glioma cells in vivo (Fulda,
Wick et al. 2002). These findings prompted scientists to develop peptides
derived from NH2-terminal of Smac/DIABLO and small molecules that mimic the
funtions of Smac/DIABLO as therapeutic agents to induce cancer cells death or
increase the apoptotic effects of the chemotherapeutic agents (Martinez-Ruiz,
Maldonado et al. 2008). Currently small molecules such as AT-406, LCL-161
and Birinapant are all being in preclinical phase for their anticancer properties in
combination with more specific chemotherapy drugs such as TRAIL and BRAF
inhibitors (Perimenis, Galaris et al. 2016). In this study, we are interested to find
bioactive compound/s from several species of Malaysian plant that could
increase the expression of Smac/DIABLO protein, thus increasing the apoptotic
effect.
Figure 2.8 Role of Smac/DIABLO in apoptosis. Adapted from “Role of Smac/DIABLO in
cancer progression” by G. M. Ruiz, V. Maldonado, G. Ceballos-Cancino, J. P. R. Grajeda,
J. Melendez-Zajgla, 2008, Journal of Experimental & Clinical Cancer Research (2008)
27(1): 48. Open-access.

75
2.2.2 Activation of invasion and metastasis: Role of CXCL12/CXCR4 axis in cancer metastasis
Even though prostate cancer could spread to other distant sites including
lymph nodes, lung, liver and brain, the spread to the bone marrow prove to be
the most frequent as almost 90% of advanced prostate cancer patient suffer
from pathologic fractures, spinal cord compression, and pain due in part of
deregulated cycles of osteoblastic and osteolytic resorption/formation driven by
the growing tumour mass (Rubens 1998). Several reports have shown that
CXCL12/CXCR4 axis is involved in breast (Müller, Homey et al. 2001) and
prostate (Taichman, Cooper et al. 2002, Chinni, Sivalogan et al. 2006) cancer
cells metastasis to bone, where high expression of CXCR4, receptor for the
CXCL12 chemokine, is detected (Conley-LaComb, Saliganan et al. 2013,
Singareddy, Semaan et al. 2013).
Chemokines are a superfamily of cytokine-like proteins that activate
chemokine receptors by binding to them (Sun, Cheng et al. 2010). To date, over
50 chemokines have been identified, and they are divided into 4 distinct families
namely CXC, CX3C, CC and C. These divisions are made based on the
positions of 4 conserved cysteine residues (Vindrieux, Escobar et al. 2009).
Previously, chemokines are associated with their inflammatory responses
achieved through the stimulation of leukocytes chemotaxis during inflammation
(Thelen 2001), however new evidences suggest that they are major regulators
of cells trafficking and adhesion (Kyriakou, Rabin et al. 2008, Gillette, Larochelle
et al. 2009). CXCL12 or stromal-derived factor 1 (SDF-1), is a CXC chemokine,
and its receptor CXCR4 are reported to play critical role in the spread of prostate
cancer cells to the bone.
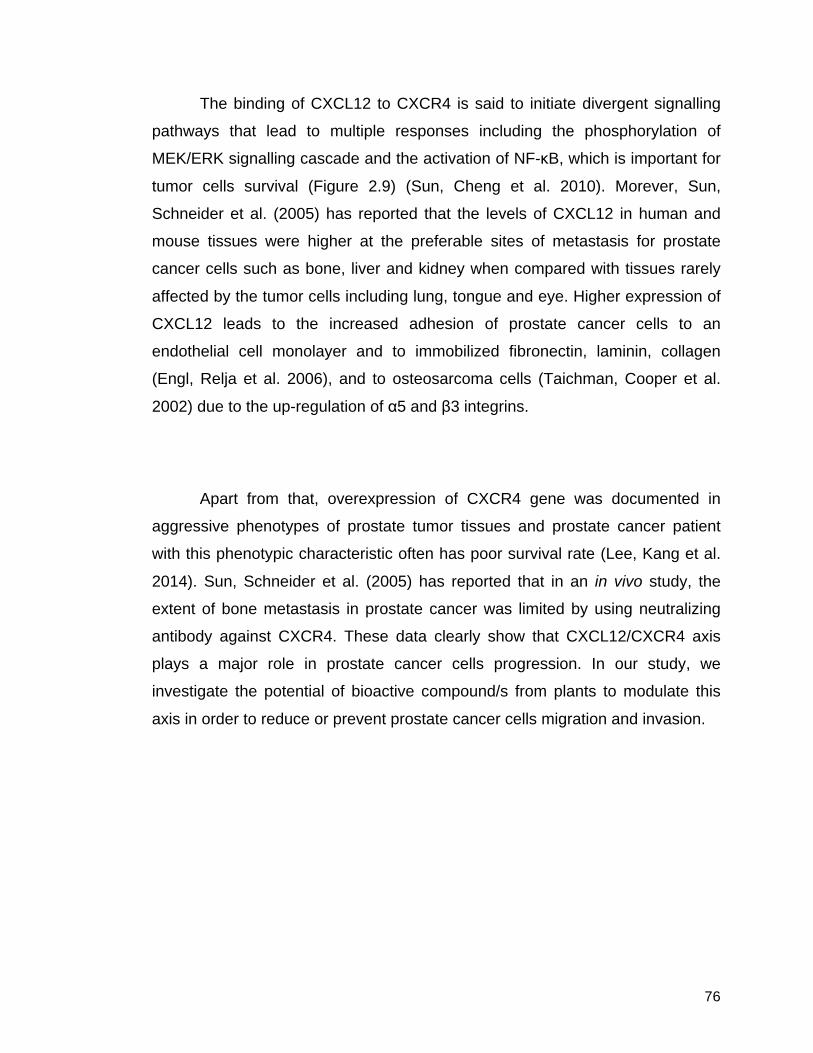
76
The binding of CXCL12 to CXCR4 is said to initiate divergent signalling
pathways that lead to multiple responses including the phosphorylation of
MEK/ERK signalling cascade and the activation of NF-κB, which is important for
tumor cells survival (Figure 2.9) (Sun, Cheng et al. 2010). Morever, Sun,
Schneider et al. (2005) has reported that the levels of CXCL12 in human and
mouse tissues were higher at the preferable sites of metastasis for prostate
cancer cells such as bone, liver and kidney when compared with tissues rarely
affected by the tumor cells including lung, tongue and eye. Higher expression of
CXCL12 leads to the increased adhesion of prostate cancer cells to an
endothelial cell monolayer and to immobilized fibronectin, laminin, collagen
(Engl, Relja et al. 2006), and to osteosarcoma cells (Taichman, Cooper et al.
2002) due to the up-regulation of α5 and β3 integrins.
Apart from that, overexpression of CXCR4 gene was documented in
aggressive phenotypes of prostate tumor tissues and prostate cancer patient
with this phenotypic characteristic often has poor survival rate (Lee, Kang et al.
2014). Sun, Schneider et al. (2005) has reported that in an in vivo study, the
extent of bone metastasis in prostate cancer was limited by using neutralizing
antibody against CXCR4. These data clearly show that CXCL12/CXCR4 axis
plays a major role in prostate cancer cells progression. In our study, we
investigate the potential of bioactive compound/s from plants to modulate this
axis in order to reduce or prevent prostate cancer cells migration and invasion.

77
Figure 2.9 The role of CXCL12/CXCR4 axis and its microenvironment in tumor cells
progression. Adapted from “CXCL12 / CXCR4 / CXCR7 chemokine axis and cancer progression” by X. Sun, G. Cheng, M. Hao, J. Zheng, R. S. Taichman, K. J. Pienta, and J.
Wang, 2010, Cancer and Metastasis Reviews (2010) 29 (4), 709-722. Copyright 2010 by
Springer Science+Business Media, LLC. Adapted with permission.

78
2.2.3 Induction of Angiogenesis: Role of VEGF in angiogenesis
One of the most important phenotypic traits of malignant tumors is their
ability to have sustained angiogenesis. Angiogenesis is a crucial process as it
ensures continues supply of oxygen, nutrients, growth factors and hormones,
and proteolytic enzymes (Folkman 1990). Without angiogenesis, the progression
of malignant tumors to distant site will not be possible. Although, a report has
been made a century ago regarding the observation that tumor growth can be
accompanied by increased vascularity (Ferrara, Hillan et al. 2004), it was not
until 1939 that the first postulate about the existence of a tumor-derived-blood-
vessel-growth stimulating factor that serve to aid the formation of new blood
supply to the tumor, was made by Ide and colleagues (Ide, Baker et al. 1939). 6
years later, Algire, Chalkley et al. (1945) made a proposal saying that the rapid
growth of tumor transplant is dependent on the development of a rich vascular
supply. This proposal was made based on the observation that tumor growth
started after an increased in blood-vessel density using a transparent chamber
technique to the mouse. (Algire 1943, Algire, Chalkley et al. 1945). In 1971,
Folkman has proposed that finding an anti-angiogenesis factor could be an
effective anticancer strategy (Folkman 1971), and this pioneering hypothesis
has led to the understanding of several important angiogenic factors such as
epidermal growth factor (EGF), transforming growth factor (TGF)-α, TGF-ß,
tumour-necrosis factor-α (TNF-α) and angiogenin (Folkman and Klagsbrun
1987). However, most of the research efforts initially put for these angiogenic
factors were then discontinued as they were only shown to promote
angiogenesis in bioassay models but not physiologically (Klagsbrun and
D'Amore 1991).
Vascular Endothelial Growth Factor (VEGF), which is now known to be
the main regulators of angiogenesis was first described by Senger, Galli et al.
(1983) and then was successfully isolated and identified by Ferrara and

79
colleagues in 1989 (Ferrara and Henzel 1989). VEGF is a homodimeric
glycoprotein with an approximate molecular weight of 45 kDa. It belongs to a
family of structurally related mitogen known as platelet-derived growth factor
(PDGF) (Carmeliet 2005). The VEGF family consists of six secreted
glycoproteins known as VEGF-A, VEGF-B, VEGF-C, VEGF-D, VEGF-E, and
placenta growth factor (PlGF-1 and PlGF-2) all of which are derived from distinct
genes (Hicklin and Ellis 2005).
VEGF-A has been indicated to play the most critical role in the regulation
of angiogenesis (Ferrara, Carver-Moore et al. 1996) whereas the vascular effect
of the other VEGF in the family members remain to be fully characterized
(Ferrara and Davis-Smyth 1997, Ferrara 1999, Ferrara 2001). Initially, two
VEGF receptors were identified on endothelial cells and characterized as the
specific tyrosine kinase receptors VEGFR-1 and VEGFR-2 (Shibuya,
Yamaguchi et al. 1990, Terman, Dougher-Vermazen et al. 1992), and several
years after that another tyrosine kinase receptors known as VEGFR-3 was
identified and has been found to play major role in lymphangiogenesis
(Kaipainen, Korhonen et al. 1995, Paavonen, Puolakkainen et al. 2000). All
VEGF family members have different binding affinity towards these receptors,
and this characteristic has helped to elucidate their specific functions. All of the
isoforms of VEGF-A can bind to both VEGFR-1 and VEGFR-2, while the
naturally occurring heterodimers of VEGF-A has been shown to have higher
binding affinity towards VEGFR-2 (DiSalvo, Bayne et al. 1995, Cao, Chen et al.
1996).
Since VEGF-A has the ability to bind to both VEGFR-1 and VEGFR-2
receptors, questions has been asked about which receptor activation could lead
to direct effect on tumor cells angiogenesis. A consensus has been reached on
this matter as studies show that VEGFR-2 is the major mediator of angiogenesis

80
process (Ferrara 2004). Even though VEGFR-1 is said not to have direct effect
on mitogenesis and angiogenesis, but it might act as a decoy receptor that
sequesters VEGF and prevents its interaction with VEGFR-2 (Park, Chen et al.
1994).
Angiogenesis or also known as neovascularization, is very important in
human cancers and it has been specifically linked to increased tumor growth
and metastatic potential (Ferrara 2002). Figure 2.10 summarizes the role played
by VEGF/VEGFR in tumor cells angiogenesis. Overexpression of VEGF mRNA
has been observed in various human tumors including lung, breast, prostate,
gastrointestinal tract, renal, and ovarian carcinomas through in situ hybridization
studies (Yoshiji, Gomez et al. 1996, Ferrer, Miller et al. 1997, Sowter, Corps et
al. 1997, Volm, Koomägi et al. 1997, Ellis, Takahashi et al. 1998, Tomisawa,
Tokunaga et al. 1999). The expression of VEGF ligands in tumor cells supported
the hypothesis that claimed that VEGF supports the growth of tumor cells not
only by inducing angiogenesis but also through their direct action on VEGFRs
that created a VEGF/VEGFR autocrine loop, which induces tumor growth arrest
and apoptosis when disrupted (Hicklin and Ellis 2005). Studies conducted by
Warren, Yuan et al. (1995) has demonstrated that in an in vivo mouse colon
cancer model of liver metastasis, a significant decrease in the size of tumor was
achieved after the treatment with anti-VEGF monoclonal antibodies. Another
studies also show that a significant decreased in tumor size and prolonged
survival were achieved in mice bearing human leukaemias xenograft after
treatment with antibodies that function by blocking the VEGFR-2 receptor (Dias,
Hattori et al. 2001). Therefore, the results from all these studies clearly
demonstrate that angiogenesis is VEGF-dependent and finding bioactive
compound/s that could block VEGFs and its receptors or both could reduce or
prevent tumor cell angiogenesis.

81
Figure 2.10 Role of VEGF/VEGFR in tumor cells angiogenesis. The expression of VEGF
ligands on tumor cells or host stromal cells stimulate the VEGFR1 and VEGFR2 on endothelial cells and lead to the activation of tumor cells proliferation, migration, survival
and vascular permeability. Adapted from “Role of the Vascular Endothelial Growth Factor
Pathway in Tumor Growth and Angiogenesis” by D. J. Hicklin and L. M. Ellis, 2005,
Journal of Clinical Oncology (2005) 23 (5), 1011-1027. Copyright 2005 by American
Society of Clinical Oncology. Adapted with permission.

82
2.3 Modern trends in the use of natural products in cancer prevention and treatment
Chemical substances derived from natural products including plants,
animals and microbes have played a vital role in cancer chemotheraphy for the
past 30 years (Mann 2002). Plants have been used by almost all cultures and
communities in the world due to their continous role as important source of
bioactive compounds not just for cancer therapy but other diseases as well
(Challand and Willcox 2009). Harwell (1982) has produced an extensive review
that listed almost 3000 plants species that have been reported to be used in the
treatment of cancer. However, in many instances, the term ‘cancer’ is undefined
or reference is made to conditions such as abcesses, ‘hard-swelling’, calluses,
wart, polyps or tumors. But many of the claims for efficacy should be viewed
with extreme skepticisim because cancer as a disease is likely to be poorly
defined in terms of folklore and traditional medicine (Cragg and Newman 2005).
For example, the roots of mayapple, Podophyllum peltatum for example,
have been used by the American Indians to treat skin cancer and venereal
warts. The main chemical constituent in this plant is known as podophyllotoxin.
This chemical belongs to the anticancer agent group known as podophyllins
which includes other bioactive compounds such as etoposide and teniposide
(Mann 2002). Similarly, a plant known as Catharanthus roseus has been used
as hypoglycaemic agent in many parts of Asia, but it was not until 1958 that its
two main constituents known as vinblastine and vincristine were discovered to
have potent cytotoxic activities against cancer cells (Roussi, Guéritte et al.
2012). These discoveries encouraged the National Cancer Institute (NCI) to
launch a large-scale screening programme to look for antitumor agents (Zubrod
1984). 35,000 plant samples were evaluated primarily against the mouse
leukaemia cell line, L1210 and P388, between 1960 and 1982 in this large-scale
study. The most significant drug produced from this huge study was Taxol,

83
which was obtained from the bark of the Pacific yew Taxus brevifolia. (Kingston
2005). Positive outcomes from this massive screening programme have
encouraged the National Cancer Institute to start a new programme in 1985 in
which extracts from plants, animals and microorganisms were screened against
a panel of 60 human cancer cells line including prostate, breast, lung, colon,
kidney, skin, ovary and brain cancer. Due to this giant quest to find new
anticancer drugs, almost 50% of the approved drugs during the last 30 years
(1981-2010) are derived either directly or indirectly from natural products
(Newman and Cragg 2012).
The above examples, although compelling for the case of natural products
as effective sources of anticancer therapies; represent extremely expensive
approaches. It also yields non-readily available therapies for much of the world
populations. This makes equally compelling the case for high quality extracts
standardized on proven anticancer phytochemicals, which may be put in the
market at a reduced price with chemopreventives indications, thus making the
final products more accessible to the public even in developing countries.
Saw palmetto berry is a perfect example for this as it is widely used for the
treatment of benign prostatic hyperplasia (BPH), often as an alternative to
pharmaceutical agents. Although pathologically, BPH is not considered as a
precursor for prostate cancer, approximately 83% of prostate cancer incidence
occur in men with BPH (Bostwick, Cooner et al. 1992, Chokkalingam, Nyrén et
al. 2003) and both conditions share common risk factors and respond to anti-
androgen therapy. Saw palmetto is a palm plant that is commonly found along
the Atlantic and Gulf coast of the USA. The large berries produced by the plant
are highly enriched in fatty acids, phytosterols, and flavonoids (Schantz, Bedner
et al. 2008). Numerous clinical trials had been conducted to evaluate the
effectiveness of the extract of the fruits in treating BPH (Bent and Ko 2004,

84
Gerber and Fitzpatrick 2004, Bonnar-Pizzorno, Littman et al. 2006), and based
on the positive results of these clinical trials, saw palmetto was developed as a
whole extract with no single active ingredient unlike any other conventional drug.
It has been marketed as a dietary supplement to treat enlarged prostate. In
continental Europe, saw palmetto is available as a Full Licensed Medicine
(Permixon®) but also available as a Traditional Medicine (THMP) (Prostasan®)
as well as food supplement without explicit indications but obviously transporting
onto the health conscious consumer the hidden message of prostate health.
Outside Europe, the market drastically splits into Food or Drug leaving Saw
Palmetto manufacturers and consumers with the food supplement pathway as
the sole way to bring this obviously efficacious natural product to the public
Approximately 2.5 millions adult in the United States were reported to use
saw palmetto in a National Survey conducted in 2002 (Barnes, Powell-Griner et
al. 2004). It is also very popular in Europe as half of German urologist prefers
prescribing plant-based extracts to synthetic drugs (Lowe and Ku 1996, Bent ,
Kane et al. 2006). Saw palmetto is available in the market as encapsulated
capsule, powdered berries and gel capsules containing liquid extract. This
extract is thought to treat BPH by inhibiting the 5-α-reductase enzyme (Bayne,
Donnelly et al. 1999, Habib, Ross et al. 2005), which is similar to finasteride, a
popular chemopreventive used in prostate cancer therapy, as explained in
section 2.1.5.1. Several studies were conducted to investigate whether saw
palmetto is active against prostate cancer and these studies showed that the
lipidosterolic extract of saw palmetto appears to inhibit LNCaP, PC3, 267B-1,
and BRFF-41T prostate cancer cell line in-vitro when treated with physiologically
plausible doses (Goldmann, Sharma et al. 2001, Iguchi, Okumura et al. 2001,
Hill and Kyprianou 2004). The inhibition of the prostate cancer cell lines occurs
through several different mechanism including apoptosis, necrosis, and growth
inhibition (Goldmann, Sharma et al. 2001, Iguchi, Okumura et al. 2001).
However, no studies have been conducted to examine the activity of saw

85
palmetto in any animal models. The development of saw palmetto as an agent
to promote prostate health could be a good example on how the active extracts
of both Marantodes pumilum and Ficus deltoidea plants can be introduced into
the market in the near future.
2.3.1 R & D of Anticancer drugs from natural products
The process of developing a new drug is complex, time consuming and
very expensive. Normally it takes around 12 years from the discovery of a new
drug in laboratory settings to its application in human diseases. It also involves
more than 1 billion USD of investment in today’s context in order to develop a
new drug from laboratories to clinics (Katiyar, Gupta et al. 2012). Drug
development process in current pharmaceutical settings can be divided into 7
phases namely: 1) Preclinical research, 2) Investigational New Drug (IND)
application, 3) Phase 1 trials, 4) Phase 2 trials, 5) Phase 3 trials, 6) New Drug
Application (NDA), and 7) Approval.
In the case of natural products, drug discovery process started with
rigorous screening procedures using different species of plants on a panel of
different cancer cell lines (Monks, Scudiero et al. 1991). Different approaches
can be used for screening of plants to be tested against cancer cell lines. These
approaches include random approach, ethnopharmacology approach (Ganesan
2008), traditional system of medicine approach and zoo-pharmacognosy
approach (Katiyar, Gupta et al. 2012). Once the task of screening potential
candidates is over, the next steps include; 1) screening of biological activity
using selective assays, 2) Bioguided fractionation of the identified plant, 3)
Isolation and structure elucidation of the active compounds, 4) Evaluation of
chemical do-ability, druggability, and patentability, 5) Decisions based on safety
and biological activity screening(Katiyar, Gupta et al. 2012). This process is

86
considered as the preclinical research phase mentioned earlier. Once this phase
is completed, the potential drug needs to go through 6 remaining phases for
drug development before it can reach clinics for human application.
However, due to low succes rate of finding new chemical entities (NCE) by
following this conventional approach, maybe now is the right time for large-scale
pharmaceutical organizations to open up the developmental strategies and
adopt nutraceuticals approach (Section 2.3.2). This approach that allows the
development of herbal extracts hitting multiple targets as new drugs should be
given serious consideration. This strategy will not only reduce developmental
cost, but would also enhance the chances of success in terms of providing
effective and safe drugs as well as minimizing the risk of post-marketing
withdrawal. In this study, the active extracts of the plants will be characterized
and the bioactive compounds responsible for the inhibition of prostate cancer
cells growth will be used as markers for future standardization of the extract.
However, before the standardized active extracts could reach the market for
human consumption, additional studies are required to be carried out to
investigate the efficacy of the standardized extract on relevant animal models as
well as following the regulations set for nutraceuticals development in the
targeted market.
2.3.2 R & D of nutraceuticals for prostate health
The term ‘nutraceuticals’ was first introduced in 1989 by the founder and
chairman of the Foundation for Innovation in Medicine (FIM), Dr Stephen
DeFlice. It is a term derived from ‘nutrition’ and ‘pharmaceuticals’ and is defined
as any substance that is food or part of a food that provide medical or health
benefits, including prevention and/or treatment of a disease. Recently, the use of
nutraceuticals in prostate disease is becoming more popular. Approximately

87
30% of men diagnosed with prostate disease in North America were reported to
use some complementary and alternative medical (CAM) therapy or
nutraceuticals products (Lee, Chang et al. 2002, Chan, Elkin et al. 2005).
Prostate cancer develops over a long period of time thus making it suitable for
primary, secondary and tertiary prevention strategies (Trottier, Bostrom et al.
2010). This is one of the reasons why CAM and nutraceuticals are becoming
very popular to promote prostate health. Besides that, nutraceuticals are not
regulated in the same way as drugs are, as they are classified according to
different food categories. The regulations for nutraceuticals also vary from one
country to another and not as stringent as medicines. This lowers their cost of
production and development, so the population can use them in appreciable
amounts to prevent diseases. Consequently, the global use and trade of
nutraceuticals has boomed in recent years and investment in this sector is very
attractive to pharmaceuticals companies, for example Glaxosmithkline (GSK)
has Benecol® for lowering cholesterol and Bayer markets Iberogast® for
functional dyspepsia.
The most popular dietary approaches to promote healthy prostate include
popular nutraceuticals such as saw palmetto (Section 2.3), Pygeum africanum,
phytosterols, rye pollen extract (eg, Cernilton®, Graminex LLC, Saginaw) and
vitamins and minerals, such as vitamin E and selenium (Curtis Nickel, Shoskes
et al. 2008). Despite the lack of stringent regulations associated with the
production and development of nutraceuticals, sound research practices are
required in order to provide high quality products backed by scientific evidence.
Therefore, it is very common to see scientists involved in pre-clinical research as
part of the development of nutraceuticals. Following this step, some might
choose to continue testing the efficacy of the nutraceuticals on relevant animal
models while the others could directly release the product into the market
providing that the regulations for nutraceuticals development in that specific
country or region are strictly followed. For example, in the US, nutraceuticals are

88
monitored as ‘dietary supplements’ according to the Dietary Supplement, Health
and Education Act (DSHEA) of 1994 (Coppens, Da Silva et al. 2006). The
DSHEA establishes that manufacturers are responsible for the safety evaluation
of the product and if a new ingredient was to be introduced into the product, they
must inform FDA that the new ingredient ‘can reasonably be expected to be
safe’ at least 75 days before going to the market. In the European Union (EU), a
specific law regulating nutraceuticals does not exist, however if a claim was
made that implies medicinal benefit for a nutraceutical product, the product
needs to comply with the regulatory requirements for medicinal products in
respect of safety, efficacy, quality testing and marketing authorization
procedures (Coppens, Da Silva et al. 2006). EU regulations also state that the
beneficial effects of nutraceuticals can only be ‘health claim’ and not ‘medicinal
claim’. In Malaysia, no specific law on nutraceuticals exists, however they are
monitored under the Malaysia’s Food Act 1983 and the Food Regulations of
1985, which govern food safety and quality control, including food standards,
hygiene, import and export activities, advertisement and accreditation of
laboratories (Arora, Sharma et al. 2013). This law is enforced by the Food
Safety and Quality Division (FSQD) of the Ministry of Health (MOH).
Despite the lack of stringent regulations for nutraceuticals development,
this should not be an excuse for scientists and manufacturers to ignore good
research practice to ensure production of high quality nutraceuticals backed by
scientific evidence.

89
2.3.3 Development of Natural Anticancer Products from Malay
Biodiversity
With the global resurgence of interest for natural remedies as a
commodity, Malaysia is looking towards capitalizing on its megabiodiversity,
which includes the oldest rain forest in the world and an estimated 1,200
medicinal plants. To harness this potential, a “Herbal Development Office” has
been formed under the Ministry of Agriculture (MoA). It outlines the strategic
direction, policies and regulation of research and development (R&D) clusters
focusing on the discovery, crop production and agronomy, standardization and
product development, toxicology/pre-clinical and clinical studies, and processing
technology. Preference has been given to a subset of 11 traditional plant
species with high economic potential. This list includes the two plants selected
for this project namely Marantodes pumilum (Blume) Kuntze (synonym Labisia
pumila var pumila) and Ficus deltoidea L. Given that Malaysia is mostly an
agricultural country, sufficient supply of raw materials for research and
development (R&D) is ensured. Moreover, its multi-ethnic population facilitates
clinical trials which results can be extrapolated to many other markets. With this
in mind, and to promote and protect the growth of a local herbal industry,
endemic species and varieties of these medicinal plants are under active study
to derive high value herbal supplements and remedies (Malaysian Ministry of
Agriculture, 2011).
Phytochemical research previously conducted on both of the selected plant
species showed that they contain phytochemicals linked to cancer prevention:
flavonols such as epigallocatechins, phenolic acids such as gallic acids and
phytoestrogens among others. Therefore, this project aims to investigate the
effect of these phytochemicals on prostate cancer cells, isolate and identify the
bioactive compound/s providing maximum efficacy and characterize the
mechanism of actions that lead to prostate cancer cells growth inhibition.

90
2.4 Marantodes pumilum (Blume) Kuntze
2.4.1 Traditional Use
Marantodes pumilum (Blume) Kuntze (Figure 2.11 and Figure 2.12)
(synonym Labisia pumila var pumila) belongs to Myrsinaceae family, locally
known as Kacip Fatimah, is a herb that has been widely used in South East
Asian communities for a variety of illnesses and also as health supplements
(Jamal, Houghton et al. 2003). It is an indigenous medicinal herb of Malaysia
and sometimes also referred locally as Akar Fatimah, Selusoh Fatimah, Tadah
Matahari, Rumput Siti Fatimah, Bunga Belangkas Hutan and Pokok Pinggang
There are three varieties of Marantodes pumilum, i.e. Marantodes pumilum var.
alata, Marantodes pumilum var. pumila and Marantodes pumilum var.
lanceolata. Each variety has their respective use and local healers tend to use
var alata and var pumila traditionally (Ibrahim and Jaafar 2011). This herb’s
extract is prepared by boiling the roots, leaves or the whole plant with water and
the extract is taken orally (Jamal, Houghton et al. 2003, Ibrahim and Jaafar
2011). The decoction of the roots is also given to pregnant women between one
or two months before delivery, as this is believed to induce and expedite labour.
It has also been widely used with a long history by women in Malaysia to treat
post-partum illnesses, to assist contraction of the birth channel, shrink the
uterus, improve menstrual cycle, and weight loss (Jamal, Houghton et al. 2003).
It was also reported that Marantodes pumilum can be used for delaying fertility
and to regain body strength; while some other folkloric uses include treatment of
flatulence, dysentery, dysmenorrhoea, gonorrhoea and “sickness in the bones”.
Due to its various applications, hence Marantodes pumilum is known as “queen
of plants” of all Malaysian herbs.

91
Figure 2.11 Marantodes pumilum (Blume) Kuntze plant
Figure 2.12 The farming of Marantodes pumilum (Blume) Kuntze plant in Malaysia

92
2.4.2 Anticancer Phytochemicals
Al-Mekhlafi, Shaari et al. (2012), described the anti-proliferative
properties of Marantodes pumilum extracts against different types of cancer
cells. In this study, 4 compounds isolated from the leaves of Marantodes
pumilum namely 1-O-methyl-6-acetoxy-5-(pentadec-10Z-enyl)resorcinol (1),
labisiaquinone A (2) , labisiaquinone B (3), and 1-O-methyl-6-acetoxy-5-
pentadecylresorcinol (4) (Figure 2.13) showed strong cytotoxicity activity against
3 different cancer cell lines, PC3 (prostate), HCT116 (colon) and MCF-7 (breast)
with very low IC50 value (<10 µM). These 4 compounds also exhibited strong
selectivity for PC3 and HCT116 relative to MCF-7. Moreover, the presence of
certain phytochemicals such as favonols (catechin and epigallocatechin),
phenolic acids (gallic acid, coumaric acid), flavanols (quercetin, myricetin)
(Figure 2.14) and phytoestrogens indicate that the use of this plant could be
expanded for other pharmacological applications (Chua, Lee et al. 2012). Other
studies using plants containing similar phytochemical compounds have clearly
demonstrated their anticancer properties by addressing some of the hallmarks of
cancer. Gallic acid is identified as the major anticancer compound in T. sinesis
leaf extract. Studies conducted using this extract have shown that gallic acid is
cytotoxic against DU145 prostate cancer cells through generation of reactive
oxygen species (ROS). It is also capable of blocking the growth of DU145 cells
at G2/M phases by activating Chk1 and Chk2 and inhibiting Cdc25C and Cdc2
(Huei et al., 2009).

93
(1)
(2)
(3)
(4)
Figure 2.13 The chemical structure of the known phytochemicals in Marantodes pumilum
with anticancer activity
OCH3
OH
O
OH3C
O
OOCH3
OH
OH
O
OOCH3
HO
OH
OCH3
OH
O
O

94
(5) (6)
(7) (8)
(9) (10)
Figure 2.14 The chemical structure of the known phytochemicals in Marantodes
pumilum. (5) Catechin, (6) Epigallocatechin, (7) Gallic Acid, (8) Coumaric Acid, (9)
Quercetin and (10) Myricetin
O
OH
OH
OH
OH
HO HO
OH
O
OH
OHOH
OH
HO
HOOH
OH
O
HO
OH
O
OH
HO O
OOH
OH
OH
OH
HO O
OOH
OHOH
OH

95
Another phytochemical compound available in Marantodes pumilum,
epigallocatechin, has been shown to have anticancer properties on another
prostate cancer cell line PC-3. This study has indicated that epigallocatechin
was able to inhibit PC-3 prostate cancer cell proliferation via MEK-independent
ERK1/2 activation (Albrecht, Clubbs et al. 2008).
The regulation of estrogen receptor alpha (ERalpha) and estrogen receptor
beta (ERbeta) is very important in prostate cancer prevention (Pravettoni,
Mornati et al. 2007). One of the phytochemical compounds that can mimic the
action of estrogen in inhibiting the growth of prostate cancer cell line is
phytoestrogens. Research has shown that one of the most important
phytochemical compounds in Marantodes pumilum extract is the phytoestrogen
(Adlercreutz 2002). Early biological studies on the activity of the phytoestrogen
in soy (isoflavones) have demonstrated that phytoestrogen has the ability to
upregulate estrogen receptor beta (ERbeta) and downregulate estrogen
receptor alpha (ERalpha), which then lead to the inhibition of prostate cancer
cell proliferation (Hussain, Banerjee et al. 2003). Therefore, it is believed that,
the phytoestrogen content in Marantodes pumilum plant extract could also
cause similar action, which might lead to the death of the cancer cells. With that
in mind, this study aims to investigate the potential of Marantodes pumilum
(Blume) Kuntze extract in prostate cancer prevention and characterize the
mechanism involved in inhibiting prostate cancer cell proliferation leading to
cancer cell death.

96
2.5 Ficus deltoidea L.
2.5.1 Traditional Use
Ficus deltoidea is a native shrub, which belongs to the family of Moracea
(Figure 2.15). The plant is characterized by the evergreen small tree or shrub
and in the wild the plant can reach around 5-7 meters tall. This species of plant
can normally be found in south-east Asian countries including Malaysia,
Indonesia and southern Phillipines. It is commonly known as “Mas Cotek” in the
peninsular Malaysia and people in east Malaysia normally refer to this plant as
“sempit-sempit” and “agolaran” (Berg 2003). This plant plays a vital role in
traditional medicine, where different parts of the plant is used for the treatment
of several ailments such as the relief of headache (fruit part), toothache (fruit
part), and sores and wound (roots and leaves). Women consume the decoction
of boiled leaves of Ficus deltoidea as an after-birth treatment to contract the
uterus and vaginal muscles besides treating the disorders of the menstrual cycle
and leucorrhoea (Burkill and Haniff 1930). Even though, the plant has a lot of
important applications traditionally, only few studies have been conducted to
explore its potential pharmacological properties. Abdullah, Karsani et al. (2008),
reported that the fruit extract of Ficus deltoidea showed inhibitory effects against
Angiotensin-I converting enzyme (ACE) enzyme. This finding suggested that the
fruit extract has antihypertensive properties. Moreover, tea prepared from Ficus
deltoidea showed high potential in reducing total cholesterol level, LDL-
cholesterol and the risk of cardiovascular disease by lowering the antherogenic
index (LDL/HDL ratio) and increasing the percentage of HDL/total cholesterol
ratio (Hadijah, Normah et al. 2007). This study also finds no sign of cytotoxicity
in rats based on a sub-acute toxicity study.

97
Figure 2.15 Ficus deltoidea plant
2.5.2 Anticancer Phytochemicals
Flavonoids is one of the phytochemical compounds that can be found in
abundance in Ficus deltoidea which includes gallocatechin, epigallocatechin,
catechin, luteolin-8-C-glucoside, 4-p-coumaroylquinic acid, orientin, vitexin,
isovitexin, rutin, quercetin and naringenin (Figure 2.16 and Figure 2.17)
(Bunawan, Amin et al. 2014). The presence of these phytochemicals gives its
yellow pigmentation, and many studies confirmed that any herbs containing
flavonoids could have the ability to acts as anti inflammatory, anti allergy, anti
cancer and anti microbial agents, so this explain how the plant is able to protect
itself from insects and microorganism (Abdullah, Hussain et al. 2009, Uyub,
Nwachukwu et al. 2010, Akhir, Chua et al. 2011, Zakaria, Hussain et al. 2012).
As mentioned earlier flavonoids such as epigallocatechin has the ability to inhibit
PC3 prostate cancer cell line. Zhou, Liu et al. (2009) has reported that vitexin
showed cytotoxic effect on breast, ovarian and prostate cancer cells by inducing
apoptosis with the cleavage of PARP protein, up-regulation of Bax and

98
downregulation of Bcl-2. Rutin, quercetin and orientin have been reported to
have anticancer properties by inducing apoptosis in murine leukemia WEHI-3
cells (rutin) (Lin, Yang et al. 2012), human lung cancer cell line A-549
(quercetin) (Zheng, Li et al. 2012), and human cervical carcinoma cells, HeLa
(orientin) (Guo, Tian et al. 2014). Ficus species containing
phenanthroindolizidine alkaloids and a series of triterpenoids with C-28
carboxylic acid functional groups are reported to be very strong cytotoxic
compounds. Triterpenoids, isolated from the aerial roots of Ficus microcarpa
demonstrated cytotoxicity in three human cancer cell lines with IC50 values from
4.0 to 9.4 µM, including HONE-1 nasopharyngeal carcinoma cells, KB oral
epidermoid carcinoma cells, and HT29 colorectal carcinoma cells (Chiang and
Kuo 2002, Chiang, Chang et al. 2005). In a study by Akhir, Chua et al. (2011),
they found that both aqueous and ethanolic extracts of Ficus deltoidea extracts
gave IC50 value of 224.39 + 6.24 µg/ml and 143.03 ± 20.21 µg/ml respectively.
The aqueous extract caused the detachment of the cancer cell as observed by
cell viability assay. While DNA fragmentation was not detectable after treatment
with the aqueous extract, but at 1000 µg/ml of the ethanolic extract DNA
fragmentation occurred around 200 Kbp (Akhir, Chua et al. 2011). Therefore,
this study aims to investigate the anticancer properties of Ficus deltoidea plant
extracts and three other varieties of the plants on human prostate cancer cell
lines.

99
(11) (12)
(13) (14)
(15)
Figure 2.16 The chemical structure of the known phytochemicals in Ficus deltoidea (11)
Gallocatechin, (12) Epigallocatechin, (13) Catechin, (14) Naringenin and (15) Quercetin.
HO
OH
O
OH
OHOH
OHHO
OH
O
OH
OHOH
OH
O
OH
OH
OH
OH
HO
OH
HO O
O
OH
OH
HO O
OOH
OH
OH

100
(16) (17)
(18) (19)
(20)
Figure 2.17 Chemical structure of known phytochemical in Ficus deltoidea (16) Vitexin,
(17) 4-p-coumaroylquinic acid, (18) Orientin, (19) Rutin and (20) Isovitexin
O
OHO
OH
OHHO
HOOH
O
OH
O
OH
O
O
HO
HO
OH
OH
O
OO
HO
HO OH
O
OH
HO
OH
OH
OH
O
OH O
OH
OO
OH
OHOH OH OH
OHO
O
HOOH
O
OHO
OHO
HOOH
OHOH
OH

101
Chapter 3
Materials and Methods

102
3 Materials and Methods
3.1 Plant Material
Plant materials used in this research were acquired by the Institute of
Bioproduct Development (IBD), Universiti Teknologi Malaysia (UTM), from a
local farm (Johor, Malaysia) over the period of September 2013 to February
2014 (Table 3.1). A Pharmacognosist at Universiti Putra Malaysia (UPM),
Malaysia, identified the plant materials and Vouchers were deposited at IBD.
Table 3.1 Plant Species, Voucher Number and Local names
Voucher Number
Code Family Name
Scientific Name Local Name Parts
SK 2308/13
MP Primulaceae Marantodes
pumilum (Blume)
Kuntze (synonym
Labisia pumila var.
pumila)
Kacip
Fatimah
Aerial
SK 2309/13
FD1 Moraceae Ficus deltoidea var.
angustifolia (Miq.)
Corner
Mas Cotek Aerial
SK 2310/13
FD2 Moraceae Ficus deltoidea
Jack var. deltoidea
Mas Cotek Aerial
SK 2311/13
FD3 Moraceae Ficus deltoidea
Jack var. deltoidea
Mas Cotek Roots

103
3.1.1 Plant Extraction
Samples were processed using a laboratory scale mill until fine powder
was produced at IBD. The air-dried and powdered parts of different amount of
plants (± 50 g) were extracted at the UCL School of Pharmacy with methanol for
72 hours via a maceration process. The crude extracts were obtained after the
evaporation of the methanol to complete dryness under reduced pressure at
40°C. The crude methanol extracts was re-dissolved in 90% methanol and
subjected to liquid-liquid partition with n-hexane for three times (100 ml each
time) to yield the n-hexane extracts (MPh, FD1h, FD2h). The aqueous phase
was further partitioned with chloroform and ethyl acetate to give the chloroform
(MPc, FD1c, FD2c) and aqueous extracts (MPa, FD1a, FD2a). This procedure
was repeated three times. The n-hexane and chloroform extracts were collected
and concentrated by using rotary evaporator under reduced pressure at 40°C.
Water in the aqueous extracts was removed by freeze-drying overnight to
produce dried extracts. These dried extracts were then stored at -20°C until
required for further testing.
3.1.2 Fractionation of plant extracts
A sample (500 mg) of the crude chloroform extract was suspended in 2 mL
of absolute methanol and applied onto a chromatographic column (2.3 x 40 cm)
packed with Sephadex LH-20 (GE Healthcare, UK) and equilibrated with
absolute methanol. The column was exhaustively washed with absolute
methanol. The sample was eluted with absolute methanol at a flow rate of 4
mL/min and 6 mL fractions were collected using a Retriever ® II fraction collector
in soda glass test tubes. 140 fractions were collected for each plant extract.
Eluates were then pooled into major fractions based on the TLC profiles. After
evaporation of methanol, the samples were left to air-dried and residues
weighed.

104
3.1.3 Thin Layer Chromatography (TLC)
All fractions were examined by a thin layer chromatography (TLC)
methodology on silica gel plates (TLC Silica gel 60 F254, Merck KGaG, 64271
Darmstadt) using (a) Chloroform-Methanol (80:20, v/v) as mobile phase. The
bands were visualized at white light, 254 nm and 366 nm wavelengths before
and after derivatization with anisaldehyde using CAMAG TLC Visualizer.
3.1.4 Preparation of stock solution of extracts and fractions
Stock solutions for each plant extracts and fractions were prepared by
dissolving them in Dimethyl sulfoxide (DMSO) Cell culture grade (Sigma-
Aldrich©, UK) at a concentration of 50 mg/ml. All plant extracts and fractions
were cold sterilized using a syringe-driven filter (pore size: 0.2 µm) (Millex ®) in
a laminar flow cabinet before being used for cell-based assays.

105
3.2 Cell Lines
The following tumour cell lines were used: the PC3 cell line (ATCC
Number: CRL-1435™) was kindly provided by Dr Cyrill Bussy (Centre for Drug
Delivery Research, UCL School of Pharmacy, UK), the DU145 cell line (ATCC
Number: HTB-81™) was purchased from Sigma Aldrich UK, and was obtained
from the American Type Culture Collection (ATCC) and the LNCaP clone FGC
cell line (ATCC Number: CRL-1740™) was purchased from Sigma Aldrich UK,
and was obtained from the American Type Culture Collection (ATCC). Human
Dermal Fibroblasts, adult (HDFa) catalogue number C-013-5C was kindly
provided by Dr George Pasparakis (Department of Pharmaceutics, UCL School
of Pharmacy), this cell line has been used for specificity study as it is not a
tumour cell line. All tumour cell lines were used for the cytotoxicity, and PC3 cell
line was used for mechanistic studies including apoptosis, cell cycle analyses,
migration and invasion studies. All cell lines are adherent cells that tend to grow
as monolayer and are classified as Biosafety Level 1. Three cell lines were used
because of the different characteristics of each cell lines, which are important in
order to achieve the objectives and aims of this study. LNCaP cells have
androgen receptors that are functional enabling them to be androgen sensitive
and these cells also secrete prostate-specific antigen (PSA). Both PC3 and
DU145 cells are androgen independent but PC3 cells are highly invasive with
strong metastatic potential as compared to DU145 cells.

106
3.3 Cell Culture Protocols
3.3.1 Sub-culture and Routine Maintenance
Both PC3 and LNCaP cell lines were grown in a cell culture flask (Nunc),
surface area 75 cm2 and maintained in RPMI-1640 (Roswell Park Memorial
Institute medium) (Lonza, BE12-702F) containing L-glutamine. The media was
supplemented with 10% of heat-inactivated fetal bovine serum (FBS) (Gibco®,
10500-064) and 1% penicillin-streptomycin antibiotics containing 10000 Units/ml
of penicillin and 10000 µg/ml streptomycin (Gibco®, 15140-122) to prevent
bacterial growth. DU145 cell line was grown in a cell culture flask (Nunc),
surface area 75 cm2 and maintained in EMEM (Eagle’s Minimum Essential
Medium) (Sigma, M4655) containing Earle’s salt, L-glutamine and Sodium
bicarbonate. The media was supplemented with 10% of heat-inactivated fetal
bovine serum (FBS) (Gibco®, 10500-064) and 1% penicillin-streptomycin
antibiotics containing 10000 Units/ml of penicillin and 10000 µg/ml streptomycin
(Gibco®, 15140-122) to prevent bacterial growth. HDFa cell line was grown in a
cell culture flask (Nunc), surface area 75 cm2 and maintained in DMEM
(Dulbecco’s Modified Eagle Medium) containing L-Glutamine and high glucose
(Gibco® 11965092). The media was supplemented with 10% of heat-inactivated
fetal bovine serum (FBS) (Gibco®, 10500-064), 1% 100X NEAA (non-essential
amino acids, Gibco® 11140035), and 0.1% of both 10 mg/mL Gentamicin
solution 1000X (Gibco® 15710049) and 250 ug/mL Amphotericin B solution
1000X (Gibco® 15290018) to prevent bacterial growth. All cells were maintained
at 37ºC in a humidified atmosphere of 5% CO2. The prepared media was used
to grow and seed the cells in a 96-well plate (Nunclon™) for cellular based
assays and for plant extracts as well as fractions dilution.

107
3.3.2 Cell passaging/sub-culturing
The growth media was changed every 2-3 days and all cell lines were
sub-cultured every 3-4 days when the monolayer culture of the cells has
reached almost 70-80% confluency. The cells were split into ratios of 1:3, 1:4 or
1:8. The media used in this monolayer culture was aspirated before the flasks
were rinsed gently with 10 ml Phosphate buffered saline (PBS) pH 7.4 (Gibco,
10010-056). This procedure was done in order to remove traces of serum, which
could cause inhibition to the action of tyrpsin. After that, the wash solution was
removed and 1 ml of 0.25% trypsin EDTA (Gibco, 25200-056) was added. The
0.25% trypsin EDTA will act as a dissociation agent. The flask containing the cell
lines was incubated for 5 minutes at 37ºC in 5% CO2. When the cells were
ready, the cells began to change and transform into rounded shapes and
detached from the surface of the flasks. These changes were observed by using
an inverted microscope. After cell detachment, the proteolytic activity of trypsin
was inhibited by the addition of 3 ml of growth media. A suitable amount of cell
suspension, depending on the split ratio was transferred to a flask containing
20ml of pre-warmed media. The flask containing the cells was labelled with the
cell name, passage number and date and was then carefully placed in an
incubator (NuAire™ Autoflow CO2 Air-Jacketed Incubator, NuAir Inc.) with
humidified air of 5% CO2 and atmosphere at 37ºC (Wang 2006).
3.3.3 Cell Counting and Cell Viability
The dye exclusion test is normally used in cell culture to determine the
number of viable cells present in a cell suspension. This method is based on the
principle that live cells possess intact cell membrane, which will exclude certain
dyes whereas dead cells do not. In this study, Trypan blue exclusion test using
Neubauer improved bright-line haemocytometer (FORTUNA®, Germany) (Figure
3.1) was used for cell counting. Trypan blue (Gibco, 15250-061) is excluded by
live cells but accumulates in dead cells. A clear coverslip was placed on a

108
haemocytometer slide. 50 µL of cell suspension was mixed with 50 µL trypan
blue. The cell suspension mixture was carefully transferred to the edge of the
coverslip. The number of stained (non-viable) cells and non-stained (viable) cells
were counted under an inverted microscope. Concentration of viable cells and
the percentage of viable cells are calculated using the following formula:
Cells/ml = the average count per square x dilution factor x 10 4
Total cells = cell/ml x original volume from which sample is removed
The percentage viability is calculated as shown below:
Percentage viability =Number of unstained cells×100
Total number of stained and unstained
This test was used to count cells for experimental setup and also for the
proliferation analysis of all cell lines in 75 cm2 T- flask (Wang 2006).
Figure 3.1 Haemocytometer (improved Neubauer), magnified view of the total area of the
grid showing viable cells as unstained and clear, with a refractile ring around them and
non-viable cells are dark and have no refractile ring (Freshney 2005).
109
3.3.4 Cell Cryopreservation
Healthy PC3, DU145, LNCaP, and HDFa cells at log phase (exponential
phase) were used for the freezing procedure. The healthy cells needed to be
trypsinized and centrifuged at 1000 rpm (Biofuge primo®) before the addition of
the freeze medium. The freezing medium was prepared manually and contained
90% FBS and 10% DMSO or 90% complete media and 10% DMSO. The
freezing medium was slowly added to the cell suspension containing
approximately 106–107 cells/ml of cells concentration. Cells were then aliqouted
at 1 ml and transferred into cryogenic vials. The cryogenic vials were labelled
with the name of the cell lines, passage number and date. Before putting the
cryogenic vials containing the cells into a liquid nitrogen tank, the vials were kept
inside a freezing container (Nalgene Cryo™) containing 250 ml isopropanol to
achieve a -1ºC/min cooling rate and stored at -80ºC overnight. On the next day
the vials were then transferred into a liquid nitrogen Dewar with the temperature
of -200ºC and stored until needed (Wang 2006).
3.3.5 Cell Recovery
The cryopreserved cells are fragile and the thawing procedure is stressful
to them, so careful handling is required to ensure a high proportion of cell
survival. The cryogenic vial containing the cells was slowly and carefully
removed from the liquid nitrogen storage. The cells were then thawed by gently
agitating the vial in a water bath set at 37ºC temperature until it was completely
thawed. After thawing the content of the vials, the cells were transferred into a
pre-warmed media and centrifuged at 1000 rpm. After that, the supernatant was
discarded from the centrifuge tube leaving a cell pellet. The cell pellet was
suspended in a culture flask containing 20 ml of growth media previously
equilibrated at 37ºC in 5% CO2 and the flask was labelled with the cell name,
split ratio, passage number, and date. The flask was placed back in an incubator

110
at 37ºC in a humidified atmosphere with 5% CO2 then the cell lines were sub-
cultured as described earlier in section 2.4.2 (Wang 2006).
3.4 Proliferation and viability analysis
To measure the viability and/or proliferation of cultured cells, the
Sulforhodamine B (SRB) and the (3-(4,5-dimethylthiazolyl-2)-2,5-
diphenyltetrazolium bromide (MTT) assays were chosen, respectively. Two
different assays were chosen as both assays utilize different mechanisms in
assessing cells proliferation and viability. The SRB assay determines cell’s
proliferation by staining the cellular protein contents whereas the MTT assay
determine cell’s viability by measuring the mitochondrial activity based on the
conversion of MTT into formazan crystals by living cells. The total mitochondrial
activity is related to the number of viable cells. Therefore, the use of these two
assays was important for results validation.
PC3, DU145, LNCaP, and HDFa cells were seeded in 96-well flat-bottom
microtiter plate at a density of 2 x 10⁴ cells/well for proliferation and viability
assays. The number of cells seeded in the 96-well flat-bottom microtiter plate for
each cell lines were determined using an optimization procedure. This specific
cells seeding was used because it will result in 80% of the space in each well to
be occupied by each cancer cell lines. Therefore, it allows the cells especially in
the negative control (untreated cells) to grow within the 72 hours incubation
period without running out of space for growth. Lack of growing space will cause
the cells to die either via apoptosis or necrosis thus influencing the results of the
experiment. 72 hours of incubation time after the treatment with the active
extracts or active fractions of the plants was chosen because at this period, the
cells are at the exponential phase of growth for the specific cell lines used in this
study (PC3, DU145 and LNCaP). Figure 3.2 shows the growth curve for cells,

111
which consist of lag phase, exponential phase, stationary phase and death
phase. A complete understanding on the growth profile for each cell lines used
in any scientific studies is important in order to produce reliable data. The plates
were then incubated at 37ºC in 5% CO2 in order to allow the cells to grow and
reach confluency. After 24 hours of incubation, the cells were treated with
different concentration of extracts or fractions, vehicle control (DMSO) (Sigma,
D2650), and Paclitaxel as positive control (Sigma, T7402-5MG). All the
preparation was done in the culture media within a laminar flow cabinet.
Figure 3.2 Phases of Cells growth (Freshney 2005)
3.4.1 Proliferation assay (SRB)
The sulforhodamine B assay (SRB) is a colorimetric assay characterized
by simplicity with a high level of reproducibility (McCaffrey, Agarwal et al. 1988,
Vichai and Kirtikara 2006). In this study, the SRB assay was performed
according to a previously described method by Skehan, Storeng et al. (1990). In
this method, cell number is estimated by the determination of cell density based
on the staining of proteins with SRB. Under mild acidic condition (trichloroacetic

112
acid, TCA), the SRB has the ability to bind to the protein compounds of fixated
cells providing a sensitive index of cellular protein content. As the binding is
stoichiometric, an increase or decrease in the number of cells (total biomass)
results in a corresponding change in the amount of dye extracted from stained
cells (Skehan, Storeng et al. 1990, Vichai and Kirtikara 2006).
The cells were seeded in 96 well plates and plant extracts or fractions
were added. After the incubation period of 24, 48, and 72 hours, 50 µL of cold
40% w/v trichloroacetic acid (TCA) solution (Sigma, T6399-500G) in deionised
water was added to the cell culture supernatant for cell fixation. The plates were
incubated at 4ºC for 1 hour and then rinsed four times with distilled water. The
TCA-fixed cells were stained by adding 100 µL of SRB solution (0.4% SRB
(Sigma, S1402-5G0 in 0.1% acetic acid) and left at room temperature for 1 hour.
After that, the plates were quickly rinsed four times with 1% acetic acid and
flicked to remove unbound dye and then left to air-dry overnight.
After drying completely, 100 µL of 10 mM Tris buffer solution (Sigma,
T1503-25G) was added to each wells and the plates agitated in an orbital
shaker for 5 minutes, to allow for the solubilisation of the SRB-protein complex.
The optical density (OD) was measured at 510 nm by using a microtiter plate
reader (Tecan Infinite® M200). The percentage of change in cell growth was
calculated as follows:
% Of viable cells = [OD (sample) - OD (Blank)] / [OD (Control) –
OD(Blank)]*100.
This assay was performed independently in triplicate.

113
3.4.2 Mitochondrial viability Assay (MTT)
MTT is a colorimetric assay that can be used to measure cell viability.
This assay assesses cell viability by measuring the activity of NAD(P)H-
dependent cellular oxidoreductase enzymes which reflect the number of viable
cells present. The yellow tetrazolium dye, MTT (3-(4,5-dimethylthiazolyl-2)-2,5-
diphenyltetrazolium bromide) (Sigma, M5655-100MG) is reduced by
metabolically active cells, in part by the action of mitochondrial dehydrogenase
enzymes, to generate reducing equivalents such as NADH and NADPH. The
resulting intracellular purple formazan can be dissolved in acidified isopropanol
and quantified by spectrophotometric means (microtiter plate reader). The
amount of formazan formed is directly proportional to the number of
metabolically active cells.
Normally, the MTT assay is used for cytotoxicity studies of a drug or a
plant extract on certain types of cell and in this case, the PC3, DU145 and
LNCaP cell lines. The cells were seeded in microplates and extracts were added
as detailed earlier (section 3.1). The MTT assay was performed according to the
original method (Mosmann 1983) with slight modifications.
After the 24, 48, and 72 hours incubation period, 10µL of the MTT
solution (5 mg/ml dissolved in PBS) was added into all wells and incubated
again for 4 hours in a humidified atmosphere at 37°C. After 4 hours, both the
cell media and the MTT solution were removed from the wells and 200 µl of
DMSO was added in each well in order to allow dissolution of the purple MTT-
formazan crystals.

114
The absorbancy (optical density, OD) was measured at wavelength of
570 nm and reference wavelength 630 nm with a microplate reader (Tecan
Infinite® M200) within one hour after adding MTT solvent. The relative
difference to control was determined by;
Relative difference to control =OD (sample) − OD (Blank)OD (Control) – OD(Blank
The assay was performed independently in triplicate.
3.4.3 Cells morphology
PC3 and LNCaP cells were seeded in 12 well plates and left to attach
and proliferate for 48 hours of incubation time. Then the plant extracts were
added, the morphology and the population of the cells were monitored using an
EVOS® FL Imaging System at 24, 48 and 72 hours.
3.5 Apoptosis detection
The number of cells in a multicellular organism is highly regulated. This
process does not only involve controlling the rate of cells division but also by
controlling the rate of cell death. When cells are no longer needed or become a
threat to the organism, these cells could be destroyed by a tightly regulated cell
suicide process known as programmed cell death or apoptosis (Alberts,
Johnson et al. 2002). Apoptosis is a complex process and proceed through at
least two main pathways namely extrinsic and intrinsic (Elmore 2007). Both
pathways are mediated by an intracellular proteolytic cascade involving a family
of cysteine proteases known as Caspases (Alberts, Johnson et al. 2002).
Apoptosis can be described by its morphological characteristics, which include
cells shrinkage, membrane blebbing, nuclear fragmentation, chromatin

115
condensation, and global mRNA decay (Kerr, Winterford et al. 1994). In cancer
study, the discovery of bioactive compound/s that could induce cancer cells
death via apoptosis is more favorable than necrosis. Necrotic cell death leads to
a spill of cells content all over their neighbors causing a potentially damaging
inflammatory response whereas apoptotic cells shrink and condense to form a
structure called apoptotic bodies which can be rapidly phygocytosed by
macrophages preventing any leakage of the cells contents (Kerr, Winterford et
al. 1994). Figure 3.3 shows the flowchart for the screening cascade used in
determining prostate cancer cell death via apoptosis.

116
Figure 3.3 Screening cascade for Apoptosis
Apoptosis
Morphological observation for
characteristics of apoptosis
DAPI staining to detect apoptotic cells
Annexin V-FITC analysis to detect early apoptosis
RT-PCR MMP Depolarization analysis
using JC-1 Probe
Caspase 3/7
detection
Detection of Nuclear DNA
fragmentation using TUNEL
Bcl-2 Bax Smac/DIABLO

117
3.5.1.1 4’-6-Diamidino-2-phenylindole (DAPI) staining
This method was used to determine the presence of apoptotic cells. 1 x
105 cells/well of PC3 and LNCaP cells were seeded in 12 wells plates. After 48
hours, the cells were treated with plant extracts and positive control for 72 hours.
After 72 hours the cells were rinsed with 1 mL of 1X PBS and fixed with 4%
formaldehyde for 10 minutes. After 10 minutes, the cells were treated with 0.1%
Triton X-100 in PBS for 10 minutes at room temperature. After washing with
PBS, the cells were stained with DAPI (1 µg/mL) and incubated in the dark for
30 minutes. The cells were then viewed and photographed using the EVOS® FL
Imaging System.
3.5.1.2 Annexin V-FITC and Propidium Iodide staining
PC3 and LNCaP cells were seeded in 12 well plates and incubated for 48
hours. After incubation, plant extracts and Paclitaxel (positive control) were
added and further incubated for 6 hours at 37 °C in a 5% CO2 atmosphere. The
cells were then washed with PBS and detached with 0.25% Trypsin-EDTA
solution. The cells were then re-suspended in 100 µL of 1X binding buffer and
10 µL of Annexin V-FITC were added. The mixture was mixed carefully and
incubated for 15 minutes in the dark at room temperature. After 15 minutes, the
cells were washed again with 1mL of 1X binding buffer and centrifuged at 300xg
for 10 minutes. Subsequently the cells were re-suspended in 500 µL of 1X
binding buffer and Propidium Iodide (PI) solution were added prior to
flowcytometry (MACSQuant® Analyzer 10) analysis.

118
3.5.1.3 Caspases 3/7 activity
In this study, the apoptosis induced by plant extracts was determined by
measuring the activity of Caspases 3 and 7 using an apoptosis detection kit
(Promega, G8091). The Caspase-Glo® 3/7 assay was performed according to
the manufacturer’s protocol. PC-3, DU145 and LNCaP cells were seeded in 96
well plate at 2.5 x 10³ cells/well. The cells were left for 24 hours to allow cells
attachment. After 24 hours the cells were treated with extracts, fractions, vehicle
control (DMSO), Paclitaxel and a blank (cell-free medium) for 48 hours. 100 µl of
Caspase-Glo® 3/7 reagent was added to each wells after 48 hours incubation
period and mixed gently for 30 seconds. Then, the plate was incubated for 1
hour at room temperature. After the completion of the incubation period, the
luminescence of each plant extracts was measured using a plate-reading
luminometer (Tecan Infinite® M200). The assay was performed independently
in triplicate and the results were calculated using the following equation:
RLU = Luminescence (samples) – Luminescence (blank)
3.5.1.4 Determination of Mitochondrial Membrane potential (MMP)
The change in mitochondrial transmembrane potential (Δψm) induced by
the active extracts of the plants in prostate cancer cell line (PC3) was
determined by using flowcytometry technique with the appropriate fluorescent
probe known as JC-1 (Isenberg and Klaunig 2000). 1 x 10⁶ cells/ml of PC3 was
seeded into 6 well plate and incubated for 48 hours. After incubation, plant
extracts and Paclitaxel (positive control) were added and further incubated for 6
hours at 37 °C in a 5% CO2 atmosphere. The treated cells were then labeled
with 2 µM of JC-1 for 15 minutes at 37 °C and washed with warm phosphate-
buffered saline (PBS). The cells were analyzed on a flowcytometer

119
(MACSQuant® Analyzer 10) with 488 nm with 530- and 585 nm pass emission
filters. CCCP-treated cells (10 µM) were taken as positive controls.
3.5.1.5 Terminal deoxynucleotidyl transferase-mediated biotin dUTP Nick End Labeling assay
To detect apoptotic cells, in situ end labelling of the 3′OH end of the DNA
fragments generated by apoptosis-associated endonucleases was performed
using the Dead End apoptosis detection kit (dUTP Nick End Labeling, TUNEL
assay) from Promega (Madison, USA). Briefly, the cells were grown in LabTek II
chamber slide and treated with plant extracts for 72 hours. The cells were
washed in phosphate-buffered saline and fixed by immersing the slides in 4%
paraformaldehyde for 25 min. All the steps were performed at room
temperature, unless otherwise specified. They were then washed twice by
immersing in fresh phosphate-buffered saline for 5 min. Cells were
permeabilised with 0.1% Triton X-100 solution in phosphate-buffered saline for 5
min, washed twice in phosphate-buffered saline, and then covered with 100µL of
equilibration buffer and kept for 5–10 min. The equilibrated areas were blotted
around with tissue paper, and 50 µL of terminal deoxynucleotidyl transferase
(TdT) reaction mix was added to the sections on the slide and were then
incubated at 37 °C for 60 minutes inside a humidified chamber for the end-
labelling reaction to occur. Immersing the slides in 2X sodium chloride–sodium
citrate buffer for 15 minutes terminated the reactions. The slides were washed
three times by immersing them in fresh phosphate-buffered saline for 5 minutes
to remove unincorporated biotinylated nucleotides. The slides were then
immersed in a freshly prepared 1 µg/mL propidium iodide solution for 15
minutes at room temperature in the dark. The washing procedure was repeated
after 15 minutes and then the slides were immediately analyze under a
fluorescence microscope (EVOS® FL Imaging System) using a standard

120
fluorescein filter set to view the green fluorescein at 520 ± 20 nm and the red
fluorescence of propidium iodide at 620 nm.
3.6 Cell migration and Invasion study
The ability of cells to move or migrate is important for the development and
maintenance of multicellular organisms. Processes including embryonic
development, wound healing and immune responses require the orchestrated
movement of cells in particular directions to specific locations. Cells migration is
defined as the directed movement of cells within the body, which allow cells to
change their position within tissues or different organs (Kramer, Walzl et al.
2013). Cells migration only occurs on 2D surfaces such as basal membranes,
extracellular matrix (ECM) fibers or plastic plates without any obstructive fiber
network (Kramer, Walzl et al. 2013). Cells invasion, which is defined as the
ability of cells to penetrate through tissue barriers such as the basement
membranes and the underlying interstitial tissues, occurs via a 3D matrix that
requires restructuring and remodeling of the ECM (Friedl and Wolf 2010). Some
malignant cancer cells have the ability to metastasize to other organs within the
human body including advanced prostate cancer cells. Metastasis is a process,
which involves infiltrative growth through the ECM, cells migration through blood
and lymph vessels and rise of distant colonies (Gupta and Massagué 2006).
Therefore, finding new strategies to control or inhibit cancer cells migration and
invasion are important in cancer studies.

121
3.6.1 In Vitro cell migration assay
3.6.1.1 Oris™96-well 2D cell migration assay
The In Vitro cell migration was determined by using the Oris™ 96-well cell
migration assay kit (Platypus Technologies) (Figure 3.4) following the
manufacturer’s instruction. 5 x 10⁴ of PC3 cells were seeded in each well and
left for 24 hours. The stoppers that were used to create the migration zone were
removed after 24 hours and the cells were washed with PBS to remove any
unattached cells. 100 µL of fresh media with or without the plant extracts were
added to each well. The cells were allowed to migrate into the migration zone for
72 hours. Cells were fluorescently stained with CellTracker™ Green (Life
Technologies). The seeded plate was incubated in a humidified chamber for 72
hours and at various time points (24h, 48h, 72h), the fluorescent signals in the
detection zone were measured using a microplate reader (Synergy™ HT,
BioTek) with 492 nm excitation and 517 nm emission filters.
Figure 3.4 The schematic of Oris cell migration assay

122
3.6.1.2 Boyden chamber 3D migration assay
The cell migration study was also performed using the CytoSelect Cell
Migration Assay kit (Catalogue number CBA-100-C purchased from Cell Biolab
Inc.) (Ridley, Schwartz et al. 2003) (Figure 3.5). This kit contains polycarbonate
membrane inserts (8µm pore size) in a 24 well plate. The membrane serves as
a barrier to discriminate migratory cells from non-migratory cells. Migratory cells
are able to extend protrusions towards chemoattractants (via actin cytoskeleton
reorganization) and ultimately pass through the pores of the polycarbonate
membrane. These migratory cells are then dissociated from the membrane and
subsequently detected by a microtiter plate reader.
Under sterile conditions, the 24 well migration plate was allowed to warm
up to room temperature for 10 min. Cell suspension containing 1.0 × 10⁶ cells/ml
in serum-free media was prepared. Fresh media (control) and media with
respected plant extracts, were added directly to individual microwell inserts (8
µm pore size) (Transwell©, Corning®, UK) with the cell suspension. Overnight
serum starvation had been performed prior to running the assay. 500 µL of
media containing 10% fetal bovine serum was added to the lower well of the
migration plate and 300 µL of the cell suspension solution was added to the
inside of each insert and then incubated for 24 hours in a cell culture incubator.
After 24 hours incubation, the media were carefully aspirated from the inside of
the microwell insert. The interior part of the inserts was washed with wet cotton
swab in order to remove non-migratory cells. The inserts were transferred to a
clean well containing 400 µL of Cell Stain Solution (Crystal Violet dye) and
incubated for 10 min at room temperature. Then, the inserts were gently washed
in a beaker of water and left to air dry. Each inserts were transferred into wells
containing 200 µL of Extraction Solution (10% Acetic Acid), incubated for 10
minutes at room temperature on an orbital shaker. 100 µL of each sample was

123
transferred to a 96 well plate and was measured at 560 nm by using a microtiter
plate reader (Tecan Infinite® M200).
Figure 3.5 The schematic of Modified Boyden chamber 3D migration assay
3.6.2 In Vitro 3D cell invasion assay
The cell invasion was measured using a Cytoselect 24-well cell invasion
assay kit (Catalogue number CBA-100-C purchased from Cell Biolabs, Inc.)
(Figure 3.6). This kit included polycarbonate membrane inserts (8 µm pore size).
The upper surface of the insert membrane was coated with a protein matrix
isolated from Engelbreth-Holm-Swarm tumor cells. Basement membranes of
Boyden chambers were rehydrated with 300 µL serum-free media, and 1× 10⁶
cells were then seeded into the upper area of the chamber in serum-free media
(control) with or without the plant extracts. Overnight serum starvation had been
performed prior to running the assay. 500 µL of media containing 10% fetal

124
bovine serum was added to the lower well of the migration plate. After
incubation for 48 hours, the non-invading cells on the upper surface of the
inserts were removed with a cotton swab and invading cells on the lower surface
were stained with crystal violet Cell Stain Solution and incubated for 10 minutes
at room temperature. Then, the inserts were gently washed in a beaker of water
and left to air dry. Each inserts were transferred into wells containing 200 µL of
Extraction Solution (10% Acetic Acid), incubated for 10 minutes at room
temperature on an orbital shaker. 100 µL of each sample was transferred to a
96-well plate and was measured at 560 nm by using a microtiter plate reader
(Tecan Infinite® M200).
Figure 3.6 The schematic of Modified Boyden chamber 3D invasion assay

125
3.7 Cell cycle distribution study
PC3 and LNCaP cells were seeded in 6 well plates and incubated for 48
hours. Plant extracts and Paclitaxel (positive control) were added after 48 hours,
and the cells were further incubated for 48 hours at 37 °C in a 5% CO2
atmosphere. The cells were then washed and trypsinized with 0.25% Trypsin-
EDTA solution for cells detachment. Cell pellet were re-suspended in 1 mL PBS
and washed twice by adding 10 mL PBS. After that the cells were centrifuged at
300xg for 10 minutes at 4°C. Once the supernatant was removed, 1 mL of ice-
cold 70% ethanol was slowly added drop by drop to the cell pellet. The cells
were allowed to fix in ethanol for 18 hours. After 18 hours, the cells were
centrifuged at 500xg for 10 minutes at 4°C. The supernatant was removed and 1
mL of staining solution containing 1 mg/mL Propidium Iodide and 100 Kunitz
units/mL of RNase A were added to the cells and incubated for 30 minutes
before being analysed using flowcytometry (MACSQuant® Analyzer 10).
3.8 Real-Time RT-qPCR Analysis
3.8.1 mRNA Extraction and cDNA Synthesis
After exposing PC3 cells (5 x 10⁵ cells/well) to plant extracts, fractions and
DMSO 1% for 96 hours, total RNA was extracted using RNeasy® Plus Mini
(Qiagen) according to the manufacturer’s protocol. Samples were treated with
gDNA eliminator spin column (Qiagen) to avoid genomic DNA contamination.
The quantity and quality of RNA was determined by differential readings at 260
and 280 nm wavelength using Nanodrop 2000 (Thermo Scientific). The integrity
of total RNA from PC3 cells was assessed by visual inspection of the two rRNAs
28 and 18 s on agarose gels. cDNA was synthesized from 1 µg of total RNA by

126
using Omniscript® Reverse Transcription kit (Qiagen) as per the manufacturer’s
instructions in a final volume of 20 µL.
3.8.2 RT-qPCR Conditions and Analysis
Sequence for the primers used in this study are listed in Table 3.2. All
primers used in this study were designed and obtained from Primerdesign®.
The RT-qPCR was carried out in 96-well plates using a PikoReal™ Real-Time
PCR detection System (Thermo Fisher Scientific). Each well contained a final
reaction volume of 20 µL (10 µL of PrecisionFAST™ MasterMix with SYBR
Green, 5 µL of cDNA template diluted appropriately, 1 µL of resuspended primer
mix at a final concentration of 300nM and 4 µL of RNase/DNase free distilled
water). PCR reaction was performed using the following conditions: initial
denaturation at 95ºC for 2 minutes, then 40 cycles of denaturation at 95ºC for 15
seconds, corresponding annealing temperature of each genes as listed in table
1 for 30 seconds and extension at 72ºC for 30 seconds. At the end of the run,
heating the amplicon from 60 to 95ºC in order to confirm the specificity of the
amplification for each primer pair generated a melting curve. All RT-qPCR were
run in quadruplicates. Standard curves were produced to check the PCR
efficiency using a fivefold dilution series of cDNA. Efficiency (E) of primer pairs
was obtained from the slope of the calibration curve generated. The relative
expression was calculated on the basis of ‘delta delta Ct’ (∆∆Ct) values.
Normalization of the target genes was achieved by using GAPDH as a reference
gene.
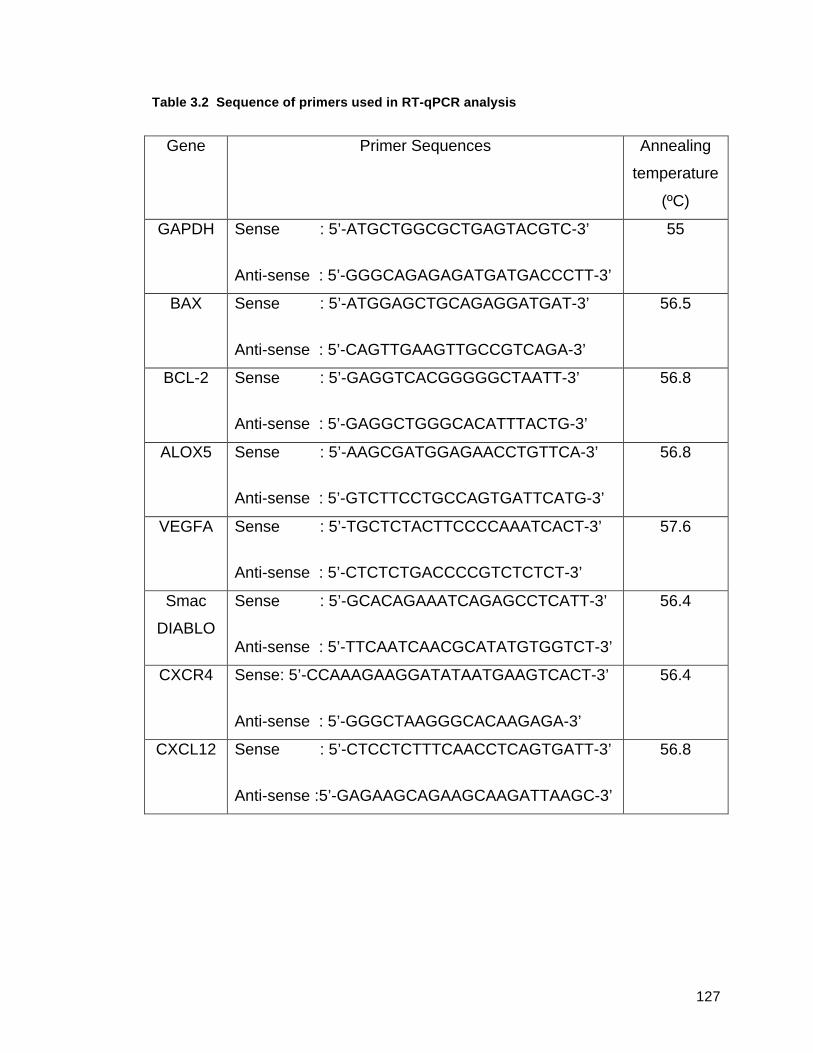
127
Table 3.2 Sequence of primers used in RT-qPCR analysis
Gene Primer Sequences Annealing
temperature
(ºC)
GAPDH Sense : 5’-ATGCTGGCGCTGAGTACGTC-3’
Anti-sense : 5’-GGGCAGAGAGATGATGACCCTT-3’
55
BAX Sense : 5’-ATGGAGCTGCAGAGGATGAT-3’
Anti-sense : 5’-CAGTTGAAGTTGCCGTCAGA-3’
56.5
BCL-2 Sense : 5’-GAGGTCACGGGGGCTAATT-3’
Anti-sense : 5’-GAGGCTGGGCACATTTACTG-3’
56.8
ALOX5 Sense : 5’-AAGCGATGGAGAACCTGTTCA-3’
Anti-sense : 5’-GTCTTCCTGCCAGTGATTCATG-3’
56.8
VEGFA Sense : 5’-TGCTCTACTTCCCCAAATCACT-3’
Anti-sense : 5’-CTCTCTGACCCCGTCTCTCT-3’
57.6
Smac
DIABLO
Sense : 5’-GCACAGAAATCAGAGCCTCATT-3’
Anti-sense : 5’-TTCAATCAACGCATATGTGGTCT-3’
56.4
CXCR4 Sense: 5’-CCAAAGAAGGATATAATGAAGTCACT-3’
Anti-sense : 5’-GGGCTAAGGGCACAAGAGA-3’
56.4
CXCL12 Sense : 5’-CTCCTCTTTCAACCTCAGTGATT-3’
Anti-sense :5’-GAGAAGCAGAAGCAAGATTAAGC-3’
56.8

128
3.9 HPLC-DAD (High Performance liquid chromatography-diode array detector)
HPLC-DAD chromatograms were obtained on an Agilent 1200 series
HPLC system (Agilent, USA). Fingerprint analysis of plant extracts was
conducted as described by Springfield, Eagles et al. (2005). All samples were
dissolved in methanol (≥99.9% for HPLC, Sigma-Aldrich) and mixed properly
using an ultrasonic bath. The concentration of each extract was equivalent to 1
mg/mL. A volume of 5 mL of each sample was filtered through a 0.45µm filter
before analysis. The rest were evaporated to dry and stored in a freezer. The
filtered samples (10 µL) were injected for HPLC analysis. The stationary phase
was Agilent C18 column (250mm x 4.6mm id, 5µm). Samples were eluted with a
mobile phase consisted of formic acid solution (A, 0.1 % v/v) and acetonitrile (B,
≥99.9% for HPLC, Fisher Scientific) using a linear gradient program (5% B in 0–
5 min, 5–15% B in 5–20 min, 15–20% B in 20–35 min, 20–35% B in 35–45 min,
35–100% B in 45–60 min). The flow rate was 1.0 mL/min and the chromatogram
was detected at wavelengths of 210nm, 269 nm, 280nm, 365 nm. The data was
collected and processed with the Agilent Chemstation© Edition software
(Agilent).
3.10 Nuclear Magnetic Resonance (NMR)
Samples for NMR characterization were prepared by dissolving in 0.8 ml
of appropriate deuterated solvents. All NMR spectra were obtained using Bruker
Avance 500 MHz NMR spectrometer equipped with broadband and triple
resonance (1H, 13C and 15N) inverse probe in order to identify the correlation
between protons and protons as well as protons and carbons. 2D experiments
carried out include (i) COSY (Correlation Spectroscopy) that analyses direct
correlation between a proton and its coupled partner, (ii) HMQC (Heteronuclear
Multiple-Bond Correlation), shows correlation between carbons and protons, (iii)

129
HMBC (Heteronuclear Multiple-Bond Correlation), shows the present of long-
range couplings between protons and carbons in the distance of two or three
bonds, and (iv) NOESY (Nuclear Overhauser Effect Spectroscopy), which
shows correlations between protons, through bonds and spaces.
3.11 Mass spectrometry
The mass spectrometric analyses were performed by the Research
Services Unit of the UCL School of Pharmacy. The molecular weight of the
isolated compounds was determined by electrospray ionisation mass
spectrometry (ESI-MS), using both positive and negative mode on a LCQ Duo
Ion-Trap mass spectrometer (Thermo Finnigan). The samples were run in either
50% methanol in water or a solvent it is best soluble in, as a mobile phase under
the following conditions; sheath gas flow rate (20-100 units), auxiliary gas flow
rate (0 - 60 units), ion spray voltage (1-8 KV), spray current (0.34uA), capillary
temperature (100-220oC), capillary Voltage (38-100 V) and tube lens offset (0-
40V).
3.12 Fourier Transformed Infrared spectroscopy (FT-IR)
The FT-IR spectra of the compounds were recorded on a Perkin Elmer
precise spectrum 100 FT-IR spectrometer as a thin film.

130
3.13 Ultra High Performance Liquid Chromatography (UHPLC) Mass Spectrometry (MS)
This study was done in collaboration with Prof Jean-Luc Wolfender and
funded by a Plants for Health Award (Appendix 1). The active fractions of FD1c
and FD2c were dried and sent to Phytochimie et Produits Naturels Bioactifs,
Université de Genève for analysis. The samples were analysed according to
standard protocols previously published with slight modifications (Yang, Liang et
al. 2014).
3.14 Statistical Analysis
Data collected and reported in this study is expressed as a mean ±
standard deviation. Statistical analysis of the data was carried out using the
GraphPad software (GraphPad Software Inc, La Jolla, CA, USA). The values of
p < 0.05 were considered to be statistically significant. All experiments were
conducted three times independently in triplicate.
The Growth Inhibitory concentration 50 (GI50) values were taken from the
minimal experimental concentration showing 50% cell death and calculated
using GraphPad Prism 5. Each plant extracts was compared to the control group
with GraphPad by using the student’s t-test to determine any significant effect of
the extract. Other statistical calculations (averages, standard deviation, etc.) in
this study were calculated using Microsoft Excel (Microsoft, Redmont, USA)

131
Chapter 4
Results and Discussions

132
4 Results and Discussion
These experiments were conducted to study the in vitro effects of the
plant extracts on three prostate cancer cell lines, LNCaP, DU145 and PC3.
These cell lines represent two different stages of prostate cancer, LNCaP (Stage
1, hormone-dependent prostate cancer), DU145 and PC3 (Stage 2, hormone-
independent prostate cancer). The cytotoxicity of the n-hexane, chloroform and
aqueous extracts against LNCaP, DU145 and PC3 cell lines were measured by
performing SRB and MTT assay after 72 hours of exposure to each respective
extracts. Extracts exhibiting potential activity based on the results of the
cytotoxicity assays were subjected to further mechanistic studies.
4.1 Results
4.1.1 Plant extractions
All plant materials were subjected to a solvent-solvent partitioning
process with n-hexane, chloroform and ethyl acetate as described in the
previous section (3.1.1). The yields of each fraction are presented in Table 4.1.

133
Table 4.1 The yields of Marantodes pumilum, Ficus deltoidea 1 (FD1), Ficus deltoidea 2
(FD2), and Ficus deltoidea 3 (FD3)
Plant Extract Plant Sample (g) Yield (%)
Marantodes pumilum
Hexane 50 0.11
Chloroform 50 0.42
Aqueous 50 3.44
Ethyl Acetate 50 0.49
Ficus deltoidea 1 (FD1)
Hexane 50 0.27
Chloroform 50 0.96
Aqueous 50 13.18
Ficus deltoidea 2 (FD2)
Hexane 50 0.22
Chloroform 50 0.65
Aqueous 50 13.10
Ethyl Acetate 50 1.95
Ficus deltoidea 3 (FD3)
Hexane 50 0.24
Chloroform 50 0.25
Aqueous 50 6.92
Ethyl Acetate 50 1.79

134
4.1.2 HPLC Fingerprint
4.1.2.1 HPLC Fingerprint analysis of Marantodes pumilum and Ficus spp.
The establishment of a standard fingerprint for various plant extracts is
very important due to the high chemical complexity of the plant extracts. The
fingerprint accounts for the variability in the chemistry of the plants depending on
the variety, climates, and places. Chang, Ding et al. (2008) reported that
chromatographic fingerprint is a powerful tool for the analysis of multi-
component of herbal medicines and plant extracts. The Chinese State Food and
Drug Administration (SFDA) and the World Health Organization (WHO) have
accepted chromatographic fingerprint as an identification and quality evaluation
technique for herbal medicines (Chang, Ding et al. 2008). The chromatographic
fingerprints of the different plant extracts (hexane, chloroform and aqueous) are
shown in Figure 4.1 to Figure 4.12. The acetonitrile: 0.1% formic acid solution
was used as the solvent, and the peak distributions of various extracts were
detected by using a reverse-phase column with ultraviolet (UV) detection at
different wavelengths (210nm, 254nm, 269nm, 280nm and 365nm). Table 4.2
summarizes the distribution of the most characteristic peaks for Marantodes
pumilum (MP) and three different varieties of Ficus deltoidea plant extracts as
analysed by High Performance Liquid Chromatography (HPLC).

135
Table 4.2 The distribution of most characteristics peaks for Marantodes pumilum (MP) and three different varieties of Ficus deltoidea
plant extracts as analysed by High Performance Liquid Chromatography (HPLC). Results shown are representative of three independent
experiments.
Sample Extract Peak Region
tR 0 to tR 10 tR 11 to tR 20 tR 21 to tR 30 tR 31 to tR 40 tR 41 to tR 50 tR 51 to tR 60
Marantodes
pumilum
(MP)
n-Hexane tR 19 tR 29 tR 34, tR 36,
tR 38
tR 54, tR 56
Chloroform tR 10 tR 16, tR 19 tR 22, tR 27 tR 47, tR 50 tR 54, tR 56
Aqueous tR 2, tR 3 tR 14, tR 15
Ficus
deltoidea 1
(FD1)
n-Hexane tR 10 tR 16 tR 30
Chloroform tR 11, tR 16
Aqueous tR 10 tR 16
Ficus
deltoidea 2
n-Hexane tR 13, tR 14,
tR 16, tR 19
tR 27, tR 30 tR 32, tR 35,
tR 37
tR 56

136
(FD2) Chloroform tR 11, tR 16 tR 22, tR 24,
tR 27
tR 52, tR 56
Aqueous tR 12, tR 16,
tR 17
Ficus
deltoidea 3
(FD3)
n-Hexane tR 30, tR 32, tR 35 tR 59
Chloroform tR 11 tR 21, tR 22
Aqueous tR 15, tR 16

137
Figure 4.1 HPLC fingerprint of Ficus deltoidea 1 hexane extract.

138
Figure 4.2 HPLC fingerprint of Ficus deltoidea 1 chloroform extract.

139
Figure 4.3 HPLC fingerprint of Ficus deltoidea 1 aqueous extract.

140
Figure 4.4 HPLC fingerprint of Ficus deltoidea 2 hexane extract.

141
Figure 4.5 HPLC fingerprint of Ficus deltoidea 2 chloroform extract.

142
Figure 4.6 HPLC fingerprint of Ficus deltoidea 2 aqueous extract.

143
Figure 4.7 HPLC fingerprint of Ficus deltoidea 3 hexane extract.

144
Figure 4.8 HPLC fingerprint of Ficus deltoidea 3 chloroform extract.

145
Figure 4.9 HPLC fingerprint of Ficus deltoidea 3 aqueous extract

146
Figure 4.10 HPLC fingerprint of Marantodes pumilum hexane extract
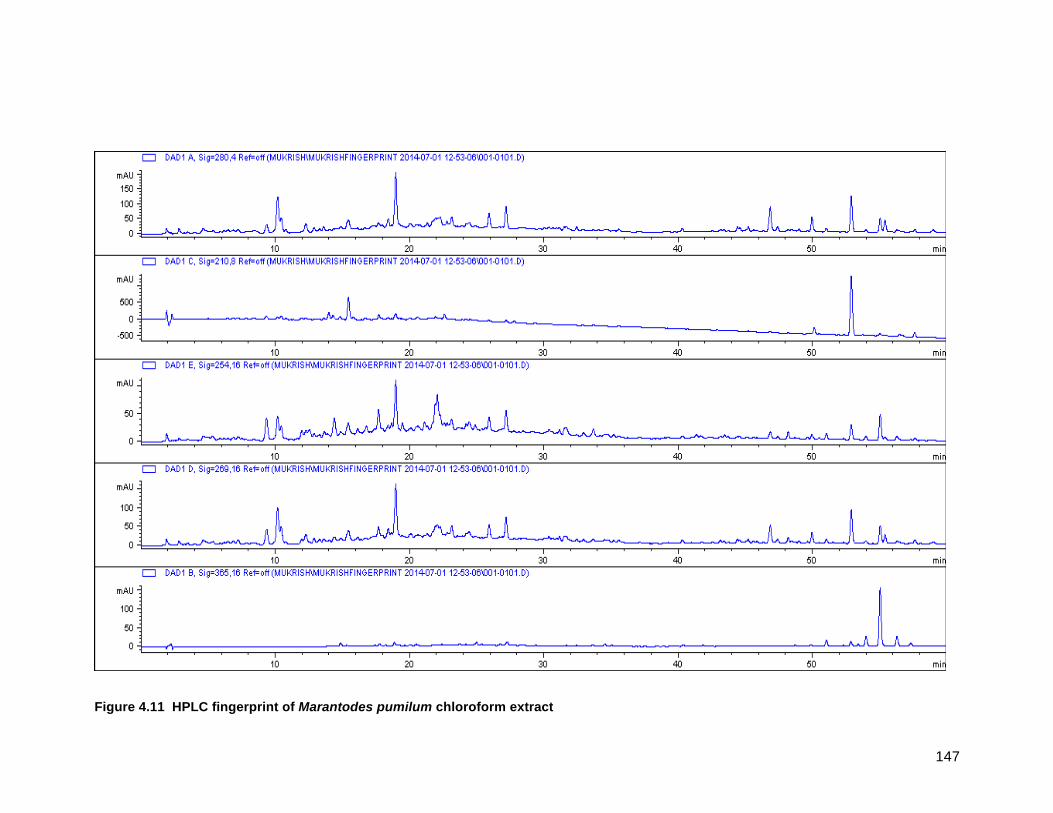
147
Figure 4.11 HPLC fingerprint of Marantodes pumilum chloroform extract

148
Figure 4.12 HPLC fingerprint of Marantodes pumilum aqueous extra

149
Chromatographic fingerprinting using HPLC mainly utilizes the ultraviolet
(UV) detection system; therefore, different compounds had their maximum
absorptions at specific wavelengths, which can affect the peak areas of the
same compounds. More than one wavelength was used in this study as different
compounds will be detected at different wavelengths and this will help in building
the full fingerprints of the plant. Chua, Lee et al. (2012) and Bunawan, Amin et
al. (2014) reported that the UV absorption for flavonoids and phenolic
compounds vary greatly according to their structures. Kumar and Pandey (2013)
and Barreca, Bellocco et al. (2012) have further supported this finding by
reporting that most flavones and flavonols exhibit two strong absorption bands;
Band I (320-385nm) which is attributed to the styrene-type π-system
represented the B ring absorption, while Band II (250-285nm) which is mostly
attributed by the dihydroxybenzoyl portion of the conjugated π-system of ring A
absorption. Apart from that, isoflavonoids also lack the structural presence of the
styrene-type π-system (B ring) thus causing a significant difference in the UV-
Vis absorption spectra when compared to flavones and flavonols. Therefore, by
comparing chromatograms recorded simultaneously at various wavelengths, it
will enable us to determine the proper wavelength for some analytes such as
flavonoids and terpenes as well as building a full fingerprint of the plant.
From the chromatographs, we can see that different varieties of Ficus
deltoidea extracts showed different phytochemical profiles at the same
wavelength. This indicates extreme variability of chemistry in these extracts
even though they are from the same species. Normally, we would expect plants
from the same species to have close or similar phytochemical profiles. However,
this is not the case for the 2 different varieties of Ficus deltoidea plants used in
this study (FD1 and FD2). The chromatographs also showed that, different parts
of Ficus deltoidea plant, aerial and roots, from the same species and variety
(FD2 and FD3) have different phytochemical constituents. Figure 4.1 to Figure
4.9 showed that in FD1 most of the peaks could only be detected at the more
150
polar phase between retention times - tR, 10 minute to 20 minute - and there
was nearly no peaks detected in the last 30 minutes of the chromatographs in all
three different extracts of FD1. However, FD2 showed different distribution of
phytochemical constituents according to the chromatographs as more peaks are
detected in both the polar phase and the non-polar phase in all three extracts of
FD2. This could suggest that FD2 has more phytochemical constituents when
compared to FD1. Figure 4.4 to Figure 4.6 also indicate that the distribution of
peaks varies greatly depending on the type of extract being analysed. More
peaks are detected between tR =20 to tR =40 in FD2 n-hexane extract, whereas
more peaks were detected after tR =40 in FD2 chloroform extracts. The FD2
aqueous extract only showed peaks in the first 20 minutes of the retention time
at which, more polar phytochemical constituents are normally detected. These
results demonstrate that different extracts in different solvents could greatly
influence the distribution of phytochemicals compounds in a plant. The
chromatographs for FD3 (Figure 4.7 to Figure 4.9) also showed extreme
variability in terms of the distribution of the phytochemical compounds
depending on the type of extracts being analysed. More peaks were detected
after tR =20 for the n-hexane extract of FD3, whereas for both aqueous and
chloroform extracts of FD3, peaks were only detected during the first 30 minutes
of the retention time with FD3 chloroform extracts showing more peak variability
in this region.
Figure 4.10 to Figure 4.12 show the distribution of phytochemical
constituents in Marantodes pumilum plant extracts. Similar to both FD2 and
FD3, MP plant extracts also demonstrate great variability in phytochemical
compound distribution, depending on the type of extracts being analysed. In MP
n-hexane extract, even though several peaks were seen between tR =20 to tR
=30, most peaks were detected after tR =30. Whereas peak distribution for MP
chloroform extract could be detected in two separate regions - the first is
between tR =10 to tR =30; and the second region is after tR =40. In the aqueous

151
extract of MP, peaks were only detected in the first 20 minutes of the retention
time. Once again, these results demonstrate that the distribution of the
phytochemical constituents in a plant could be influenced by the type of solvents
used for extraction as different solvents have different polarity - therefore
attracting phytochemical compounds based on their polarity. The HPLC
chromatographs suggested that different varieties of a plant that belong in the
same species may contain different chemical constituents, making HPLC
fingerprinting to be one of the most important and acceptable approaches for
quality evaluation of herbal preparation (Liang, Jin et al. 2009)

152
4.1.3 In vitro cytotoxic effects of plant extracts on different human Prostate Cancer cell lines
4.1.3.1 Effects of plant extracts on cells proliferation using sulfhorhodamine staining assay (SRB)
In this study, SRB assay was used to determine the effect of the plant
extracts on the proliferation of three prostate cancer cell lines, namely PC3,
DU145 and LNCaP cells. All cell lines were treated with n-hexane, chloroform
and aqueous extracts over a range of concentrations for 72 hours. The cytotoxic
effects of all plant extracts were investigated and the GI50 values were
determined.
From table 4.3, we can see that the most cytotoxic extract against all
three prostate cancer cell lines (PC3, DU145 and LNCaP) was the chloroform
extract of Marantodes pumilum with a GI50 value of less than 15 µg/mL. Both
chloroform extracts of FD1 and FD2 also showed promising GI50 values (lower
than 30 µg/mL) and therefore should also be considered for further mechanistic
studies. The chloroform extract of FD3 will not be considered for further studies
as the GI50 values for PC3 is more than 30 µg/mL.

153
4.1.3.2 Effects of plant extracts on cells viability using MTT (3-(4,5-dimethylthiazolyl-2)-2,5-diphenyltetrazolium bromide) assay
In this study, the MTT assay was used to determine the effects of the
plant extracts on the viability of two prostate cancer cell lines: DU145 and
LNCaP cells. All cell lines were treated with n-hexane, chloroform and aqueous
extracts over a range of concentrations for 72 hours. The cytotoxic effects of all
plant extracts were investigated and their G150 values were determined.
As shown in table 4.3, the most cytotoxic extract against the two prostate
cancer cell lines (DU145 and LNCaP) was the chloroform extract of Marantodes
pumilum with a GI50 value less than 15 µg/mL. The same pattern of cytotoxicity
was observed with the MTT assay for the chloroform extracts of MP, FD1 and
FD2 as their GI50 values were recorded to be below than 30 µg/mL when
compared to the results collected from the SRB assay. Therefore, these results
further validated the decision to choose the chloroform extracts of MP, FD1 and
FD2 for further mechanistic studies

154
Table 4.3 GI50 concentrations (µg/mL) of the n-hexane, chloroform and aqueous plant extracts determined for PC3, DU145, and
LNCaP cells as assessed by the MTT and SRB assays at 72 hours. Paclitaxel (0.01µM) was used as a reference drug. Each
result was obtained in three independent experiments and run in triplicate. *(P<0.05) as determined by un-paired t-test.
Plant Name and part
Extract Sample
Code
GI50 (µg/ml) based on SRB assay GI50 (µg/ml) based on
MTT assay
PC3 DU145 LNCaP DU145 LNCaP
Paclitaxel Pac 0.01*± 0.05
µM
0.01*± 0.06
µM
0.01*± 0.05
µM
0.01*± 0.04
µM
0.01*± 0.05
µM
Marantodes pumilum (Aerial)
n-hexane
Chloroform
Aqueous
MP (H)
MP (C)
MP(A)
20.2*± 0.5
14.3*± 0.3
>200
25.3*± 0.6
14.6*± 0.4
>200
26.7*± 0.8
13.2*± 0.2
>200
24.3*± 0.5
13.3*± 0.3
150.2*± 0.3
23.8*± 0.7
13.1*± 0.6
135.8*± 0.6
Ficus deltoidea 1 (FD1) (Aerial)
n-hexane
Chloroform
Aqueous
FD1 (H)
FD1 (C)
FD1 (A)
>200
23.2*± 0.2
>200
100*± 1.5
20.1*± 0.6
>200
>200
21.4*± 0.4
>200
96*± 1.3
19.3*± 0.3
>200
95*± 2.1
19.2*± 0.6
>200
Ficus deltoidea 2 (FD2) (Aerial)
n-hexane
Chloroform
Aqueous
FD2 (H)
FD2 (C)
FD2 (A)
58.4*± 1.2
29*± 0.3
>200
74.3*± 2.1
15*± 0.4
>200
>200
27*± 0.5
>200
52.1*± 1.5
14*± 0.6
>200
150.2*± 2.5
23*± 0.3
>200

155
Table 4.3 (Continues)
Plant Name
Extract Sample
Code
GI50 (µg/ml) based on SRB assay GI50 (µg/ml) based on
MTT assay
PC3 DU145 LNCaP DU145 LNCaP
Ficus deltoidea 3 (FD3) (Root)
n-hexane
Chloroform
Aqueous
FD3 (H)
FD3 (C)
FD3 (A)
>200
34.2 ± 3.4
>200
>200
30.3 ± 4.3
>200
175 ± 6
28.7 ± 5.2
51.3± 4.2
>200
28.3 ± 4.1
>200
175.2 ± 7.4
26.1 ± 4.1
48.3 ± 3.9

156
4.1.4 Morphological changes of LNCaP and PC3 cell lines after treated with active extracts of the plant extracts
Cell death could occur via two distinct forms known as apoptosis and
necrosis. Therefore, it is very important to determine the mode of cell death
induced by the active extracts of the plants. Apoptosis is a programmed cell
death characterized by the initial detachment and shrinkage of the cells,
followed by the extensive plasma membrane blebbing, and the formation of
apoptotic bodies that consist of cytoplasm with tightly packed cellular
organelles with or without nuclear fragments (Elmore 2007). In vivo, these
bodies will be subsequently phagocytosed by macrophages or adjacent cells
such as parenchymal cells and neoplastic cells thus preventing them from
going through lysis. However, when this process occurs in an in vitro
environment, these apoptotic bodies will ultimately swell and lyses due to the
absence of phagocytes and undergo secondary necrosis (Ho, Yazan et al.
2009). In this study, the morphology of the prostate cancer cell lines (LNCaP
and PC3) untreated and treated with the active extracts of Marantodes
pumilum and Ficus deltoidea was analysed using an EVOS® FL Imaging
System at 24, 48 and 72 hours. The characteristics of apoptosis such as cells
detachment from the substratum, cell shrinkage, nuclear condensation,
membrane blebbing and the formation of apoptotic bodies were detected in
the treated cells (Figure 4.19 to Figure 4.22). Reduction in the cell population
was very obvious when comparing between the untreated and the treated
cells (Figure 4.13 to Figure 4.18).
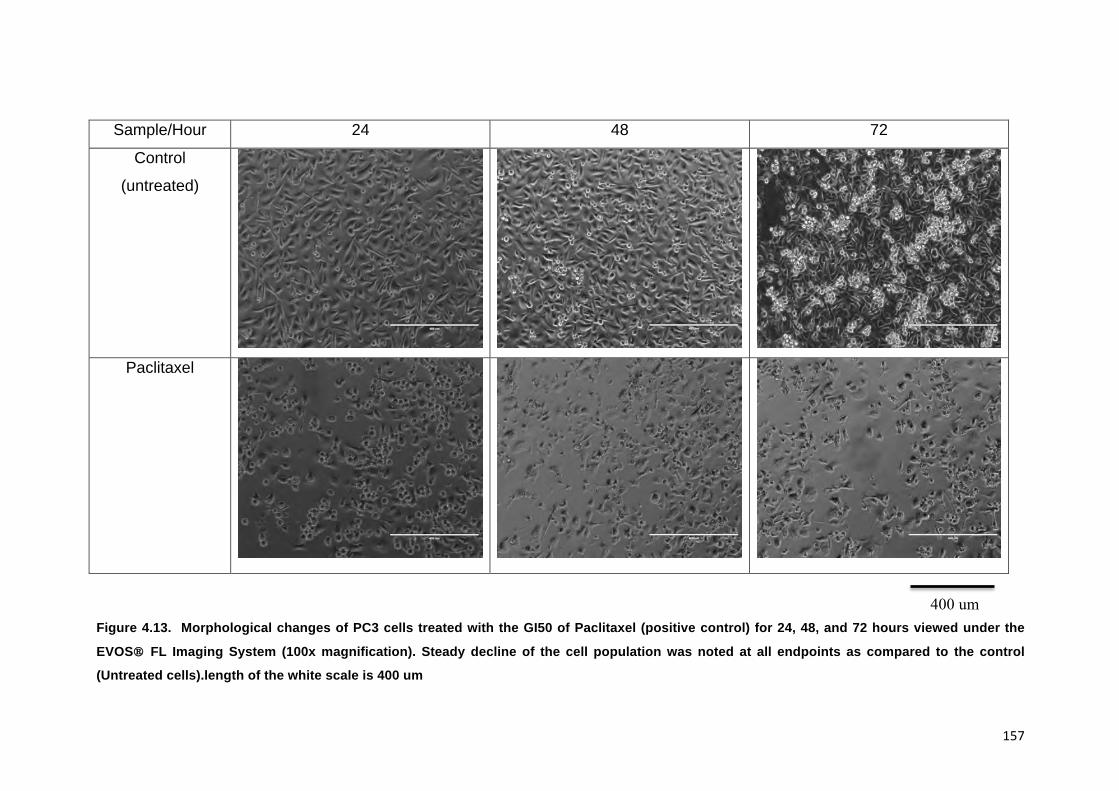
157
Sample/Hour 24 48 72
Control
(untreated)
Paclitaxel
Figure 4.13. Morphological changes of PC3 cells treated with the GI50 of Paclitaxel (positive control) for 24, 48, and 72 hours viewed under the
EVOS® FL Imaging System (100x magnification). Steady decline of the cell population was noted at all endpoints as compared to the control
(Untreated cells).length of the white scale is 400 um
400 um

158
Sample/Hour 24 48 72
MPc
MPh
Figure 4.14. Morphological changes of PC3 cells treated with the GI50 of MPc and MPh for 24, 48, and 72 hours viewed under the EVOS® FL
Imaging System (100x magnification). Steady decline of the cell population was noted at all endpoints as compared to the control (Untreated cells).
400um

159
Sample/Hour 24 48 72
FD1c
FD2c
Figure 4.15. Morphological changes of PC3 cells treated with the GI50 of FD1c and FD2c for 24, 48, and 72 hours viewed under the EVOS® FL
Imaging System (100x magnification). Steady decline of the cell population was noted at all endpoints as compared to the control (Untreated cells).
400um

160
Sample/Hour 24 48 72
Control
(untreated)
Paclitaxel
Figure 4.16. Morphological changes of LNCaP cells treated with the GI50 of Paclitaxel for 24, 48, and 72 hours viewed under the EVOS® FL
Imaging System (100x magnification). Steady decline of the cell population was noted at all endpoints as compared to the control (Untreated cells).
400um

161
Sample/Hour 24 48 72
MPc
MPh
Figure 4.17. Morphological changes of LNCaP cells treated with the GI50 of MPc and MPh for 24, 48, and 72 hours viewed under the EVOS® FL
Imaging System (100x magnification). Steady decline of the cell population was noted at all endpoints as compared to the control (Untreated cells).
400um

162
Sample/Hour 24 48 72
FD1c
FD2c
Figure 4.18. Morphological changes of LNCaP cells treated with the GI50 of FD1c and FD2c for 24, 48, and 72 hours viewed under the EVOS® FL
Imaging System (100x magnification). Steady decline of the cell population was noted at all endpoints as compared to the control (Untreated cells)
400um
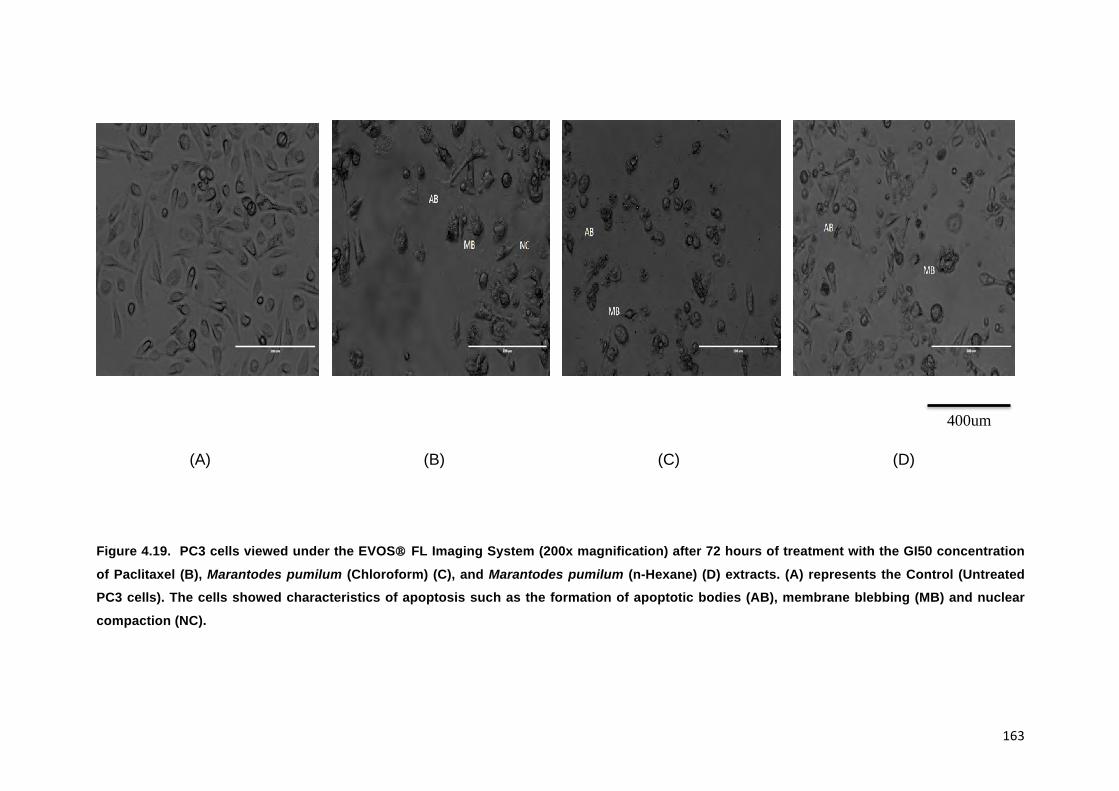
163
(A) (B) (C) (D)
Figure 4.19. PC3 cells viewed under the EVOS® FL Imaging System (200x magnification) after 72 hours of treatment with the GI50 concentration
of Paclitaxel (B), Marantodes pumilum (Chloroform) (C), and Marantodes pumilum (n-Hexane) (D) extracts. (A) represents the Control (Untreated
PC3 cells). The cells showed characteristics of apoptosis such as the formation of apoptotic bodies (AB), membrane blebbing (MB) and nuclear
compaction (NC).
400um

164
(A) (B) (C) (D)
Figure 4.20. LNCaP cells viewed under the EVOS® FL Imaging System (200x magnification) after 72 hours of treatment with the GI50
concentration of Paclitaxel (B), Marantodes pumilum (Chloroform) (C), and Marantodes pumilum (n-Hexane) (D) extracts. (A) represented the Control (Untreated LNCaP cells). The cells showed characteristics of apoptosis such as the formation of apoptotic bodies (AB), membrane
blebbing (MB) and nuclear compaction (NC).
400um

165
(A) (B) (C) (D)
Figure 4.21. PC3 cells viewed under the EVOS® FL Imaging System (200x magnification) after 72 hours of treatment with the GI50 concentration
of Paclitaxel (B), FD1 (Chloroform) (C), and FD2 (Chloroform) (D) extracts. (A) represents the Control (Untreated PC3 cells). The cells showed
characteristics of apoptosis such as the formation of apoptotic bodies (AB), membrane blebbing (MB) and nuclear compaction (NC).
400um

166
(A) (B) (C) (D)
Figure 4.22. LNCaP cells viewed under the EVOS® FL Imaging System (200x magnification) after 72 hours of treatment with the GI50
concentration of Paclitaxel (B), FD1 (Chloroform) (C), and FD2 (Chloroform) (D) extracts. (A) represents the Control (Untreated PC3 cells). The cells
showed characteristics of apoptosis such as the formation of apoptotic bodies (AB), membrane blebbing (MB) and nuclear compaction (NC).
400um

167
4.1.5 Effect of the active extracts of the plants on apoptosis of prostate cancer cell lines
4.1.5.1 DAPI staining
4’-6-Diamidino-2-phenylindole or DAPI is a dye that can be used as a
tool to visualize the nuclear changes that occur during apoptosis (Wang,
Martindale et al. 2000). During apoptosis, the condensation and fragmentation
of nuclei allow the apoptotic cells to be visualized using the fluorescence
microscopy technique - as DAPI is able to bind strongly and selectively to the
minor groove of adenine-thymine regions of the DNA, producing a fluorescent
blue colour that is directly proportional to the amount of DNA present. The
compromised apoptotic cell membrane will allow more DAPI to enter the cells
and stains a stronger blue colour. This study indicates that the number of
apoptotic cells were higher in the treated cells than the untreated cells (Figure
4.23 to Figure 4.26).

168
Samples Images Samples Images
Control
(untreated)
MPc
Paclitaxel MPh
Figure 4.23. Fluorescence image of PC3 cells stained with DAPI after 72 hours incubation with the active extracts of Marantodes pumilum and
Paclitaxel (Positive control). Apoptotic cells were represented by the blue fluorescence colour seen in the images. More apoptotic cells can be
seen in the cells treated with Paclitaxel and the active extracts of Marantodes pumilum.
400 um

169
Samples Images Samples Images
Control
(untreated)
MPc
Paclitaxel MPh
Figure 4.24. Fluorescence image of LNCaP cells stained with DAPI after 72 hours incubation with the active extracts of Marantodes pumilum and
Paclitaxel (Positive control). Apoptotic cells were represented by the blue fluorescence colour seen in the images. More apoptotic cells can be
seen in the cells treated with Paclitaxel and the active extracts of Marantodes pumilum.
400um

170
Samples Images Samples Images
Control
(untreated)
FD1c
Paclitaxel FD2c
Figure 4.25. Fluorescence image of PC3 cells stained with DAPI after 72 hours incubation with the active extracts of Ficus deltoidea and Paclitaxel
(Positive control). Apoptotic cells were represented by the blue fluorescence colour seen in the images. More apoptotic cells can be seen in the
cells treated with Paclitaxel and the active extracts of Ficus deltoidea.
400um

171
Samples Images Samples Images
Control
(untreated)
FD1c
Paclitaxel FD2c
Figure 4.26. Fluorescence image of LNCaP cells stained with DAPI after 72 hours incubation with the active extracts of Ficus deltoidea and
Paclitaxel (Positive control). Apoptotic cells were represented by the blue fluorescence colour seen in the images. More apoptotic cells can be
seen in the cells treated with Paclitaxel and the active extracts of Ficus deltoidea.
400um

172
4.1.5.2 Annexin V-FITC and Propidium Iodide staining
Up-regulation of anti-apoptotic protein expression and the inactivation
of pro-apoptotic proteins in most type of cancers have led to the unchecked
cellular growth of tumor, inability to respond to cellular stress, harmful
mutations and DNA damage. These cellular irregularities enable cells to
evade programmed cell death or commonly known as apoptosis and this has
been recognized as one of the six essentials alterations in cell physiology that
dictate the growth of tumor cells (Fesik 2005). Therefore, in cancer research it
is a favorable characteristic to have plant extracts or compound/s that could
induce cancer cell death through apoptosis rather than necrosis due to the
inflammatory response induced by the necrotic cells leading to the release of
chemoatractants to the surrounding tissues (Nicholson 2000).
In this study, the Annexin V-FITC Apoptosis detection kit is used to
evaluate the mode of cell death induced by the active plant extracts. The kit is
a combination of conjugated fluorescein isothiocynate (FITC) to Annexin V
and Propidium Iodide that can detect and discriminate apoptotic, necrotic and
dead cells. Annexin V has a high affinity to phosphatidylerine (PS) which is a
negatively charged phospholipid normally located in the cytosolic leaflet of the
plasma membrane lipid bilayer (Koopman, Reutelingsperger et al. 1994).
During early apoptosis, the redistribution of PS from the inner leaflet to the
outer leaflet will enable Annexin V to bind to it in the presence of physiological
concentration of Calcium ions (Ca2+) whereas the dead cells will be detected
by the binding of Propidium Iodide to the cellular DNA inside the cell (Moss,
Edwards et al. 1991).

173
The results showed that there was a significant increase (p<0.05) in
the population of LNCaP cells in the early apoptosis phase after the treatment
with Marantodes pumilum (27%) (Figure 4.27 & Figure 4.28) and Ficus
deltoidea (Figure 4.31 & Figure 4.32) (FD1: 35%, FD2: 16%) chloroform
extract when compared to the untreated cells (11%). LNCaP cells treated with
Marantodes pumilum n-Hexane extract also demonstrated a significant
increase (p<0.05) in the early apoptosis (20%), late apoptosis (or secondary
necrosis) and necrosis phases when compared to the untreated cells.
PC3 cells treated with Marantodes pumilum (Figure 4.29 & Figure 4.30)
(20%) and Ficus deltoidea (Figure 4.33 & Figure 4.34) (FD1: 29%, FD2:13%)
chloroform extract show a similar increasing trend (p<0.05) in the cell’s
population in the early apoptosis phase when compared to the untreated cells
(7%). Treatment with Marantodes pumilum n-Hexane (21%) extract caused a
significant increase (p<0.05) of the cell population in the early apoptosis
phase when compared to the untreated cells (7%). This shows an evasion of
apoptosis and is recognized to be one of the six hallmarks of cancer, failure to
activate apoptosis is regarded as one of the major obstacles to the successful
treatment of cancers with drugs (Kaufmann and Vaux 2003, Cummings, Ward
et al. 2004).

174
Control Campthotecin
Marantodes Pumilum chloroform Marantodes pumilum n-hexane
Figure 4.27. The dot plots of LNCaP cells after 6 hours treatment with the active
extracts of Marantodes pumilum as determined by Annexin V-FITC and PI staining. The
cells were treated with different active extracts for 6 hours. Results shown are
representative of three independent experiments.

175
Figure 4.28. The percentage (%) of cell distribution of LNCaP cells after 6 hours
treatment with the active extracts of Marantodes pumilum as determined by Annexin V-
FITC and PI staining. The cells were treated with different active extracts for 6 hours. *
p< 0.05 as compared to the untreated cells. Results shown are representative of three
independent experiments.

176
Control Campthotecin
Marantodes Pumilum chloroform Marantodes Pumilum n-Hexane
Figure 4.29. The dot plots of PC3 cells after 6 hours treatment with the active extracts
of Marantodes pumilum as determined by Annexin V-FITC and PI staining. The cells were treated with different active extracts for 6 hours. Results shown are
representative of three independent experiments.

177
Figure 4.30. The percentage (%) of cell distribution of PC3 cells after 6 hours treatment
with the active extracts of Marantodes pumilum as determined by Annexin V-FITC and
PI staining. The cells were treated with different active extracts for 6 hours. * p< 0.05 as
compared to the untreated cells. Results shown are representative of three
independent experiments.

178
Control Campthotecin
FD1 chloroform FD2 chloroform
Figure 4.31. The dot plots of LNCaP cells after 6 hours treatment with the active
extracts of Ficus deltoidea as determined by Annexin V-FITC and PI staining. The cells
were treated with different active extracts for 6 hours. Results shown are
representative of three independent experiments.
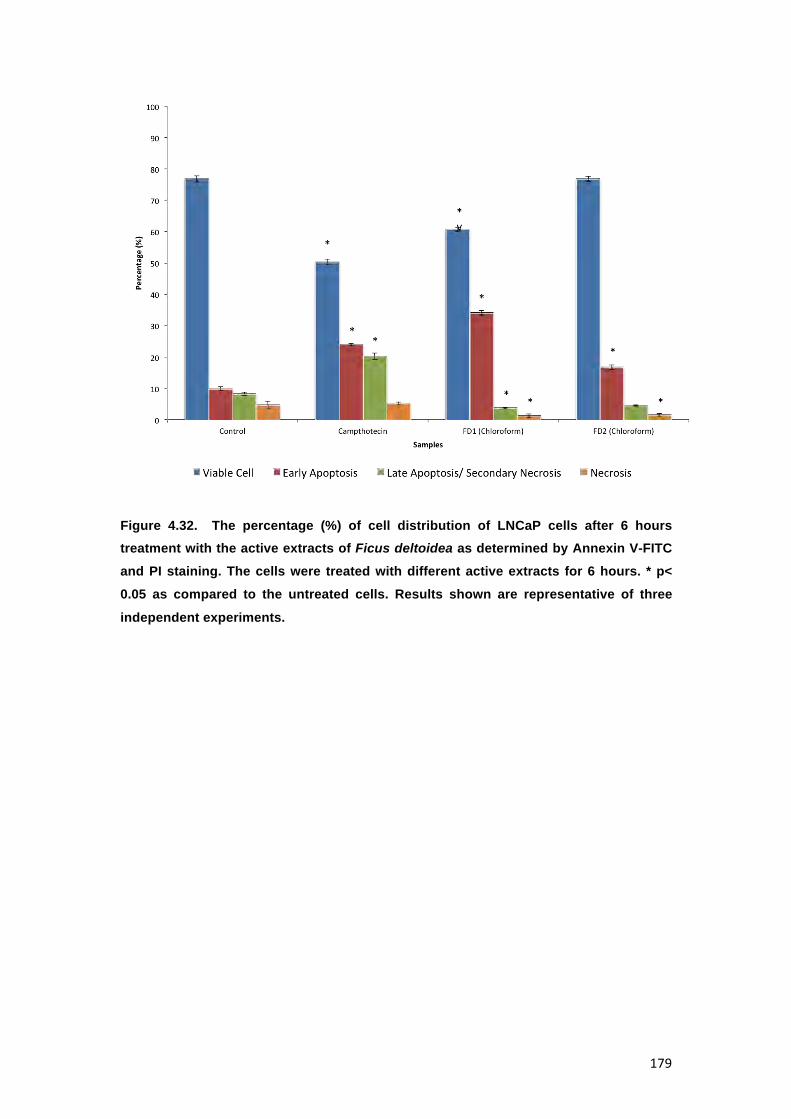
179
Figure 4.32. The percentage (%) of cell distribution of LNCaP cells after 6 hours treatment with the active extracts of Ficus deltoidea as determined by Annexin V-FITC
and PI staining. The cells were treated with different active extracts for 6 hours. * p<
0.05 as compared to the untreated cells. Results shown are representative of three
independent experiments.

180
Control Campthotecin
FD1 chloroform FD2 chloroform
Figure 4.33. The dot plots of PC3 cells after 6 hours treatment with the active extracts
of Ficus deltoidea as determined by Annexin V-FITC and PI staining. The cells were
treated with different active extracts for 6 hours. Results shown are representative of
three independent experiments.

181
Figure 4.34. The percentage (%) of cell distribution of PC3 cells after 6 hours treatment with the active extracts of Ficus deltoidea as determined by Annexin V-FITC and PI
staining. The cells were treated with different active extracts for 6 hours. * p< 0.05 as
compared to the untreated cells. Results shown are representative of three
independent experiments.

182
4.1.5.3 Caspase 3 and 7 activity
Apoptosis is a programmed cell death coordinated by members of the
caspase family (Walsh, Cullen et al. 2008). These caspases can be divided
into two distinct types, the initiator caspases (caspase-8, caspase-9, and
caspase-10). Initiator caspases are highly specific proteases that cleave and
activate proteins including the downstream caspases also known as the
effector caspases (caspase-3, caspase-6, and caspase-7). Effector caspases
are responsible for most of the proteolysis taking place during apoptosis
causing the cleavage of Poly ADP Ribose Polymerase 1 (PARP-1) and other
cellular proteins (Slee, Harte et al. 1999). In normal conditions, the primary
function of PARP-1 is to detect and repair DNA damage. However, in
caspase-mediated apoptotic cell death, the cleavage of several key proteins
that is required for cellular functioning and survival - including PARP-1 - is
very important. In fact, the cleavage of PARP-1 by caspases especially
caspase-3 is considered to be one of the important hallmarks of apoptosis
(Kaufmann, Desnoyers et al. 1993). The cleavage of PARP-1 by the caspases
will result in the formation of two specific fragments; an 89-kD catalytic
fragment and a 24-kD DBD (Lazebnik, Kaufmann et al. 1994). The formation
of these two fragments will irreversibly inhibit its function to detect and repair
DNA damage (Chaitanya, Alexander et al. 2010).
Both LNCaP (Figure 4.35 & 4.37) and PC3 (Figure 4.36 & 4.38) cells
treated with Marantodes pumilum and Ficus deltoidea chloroform extract
displayed a significant increase (p<0.01) in the activity of caspases 3 and 7
when compared to the untreated cells. LNCaP and PC3 cells treated with
Marantodes pumilum n-Hexane extract also showed a similar effect (p<0.05).
These findings further indicate that both plant extracts stimulate prostate
cancer cell death via apoptosis and that this process is mediated, at least in
part of the activation of caspases 3 and 7.

183
Figure 4.35. Caspase 3/7 activity in LNCaP cells treated with the active extracts of
Marantodes pumilum for 72 hours. The y-axis shows the luminescent signal subtracted
from a blank, which is proportional to the caspase activity. The error bars display the
standard error of mean (SEM) obtained from 3 independent experiments. Significance
compared to control, *(P<0.05),**(P<0.01) as determined by un-paired t-test.
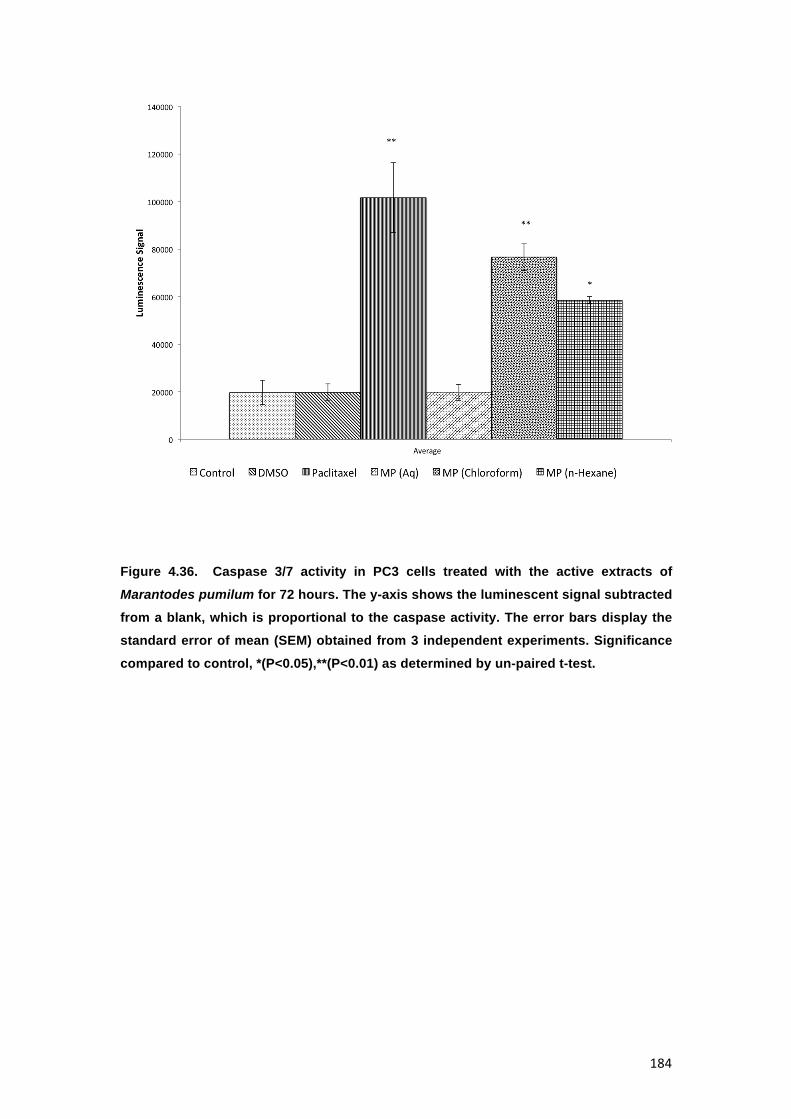
184
Figure 4.36. Caspase 3/7 activity in PC3 cells treated with the active extracts of
Marantodes pumilum for 72 hours. The y-axis shows the luminescent signal subtracted
from a blank, which is proportional to the caspase activity. The error bars display the
standard error of mean (SEM) obtained from 3 independent experiments. Significance
compared to control, *(P<0.05),**(P<0.01) as determined by un-paired t-test.
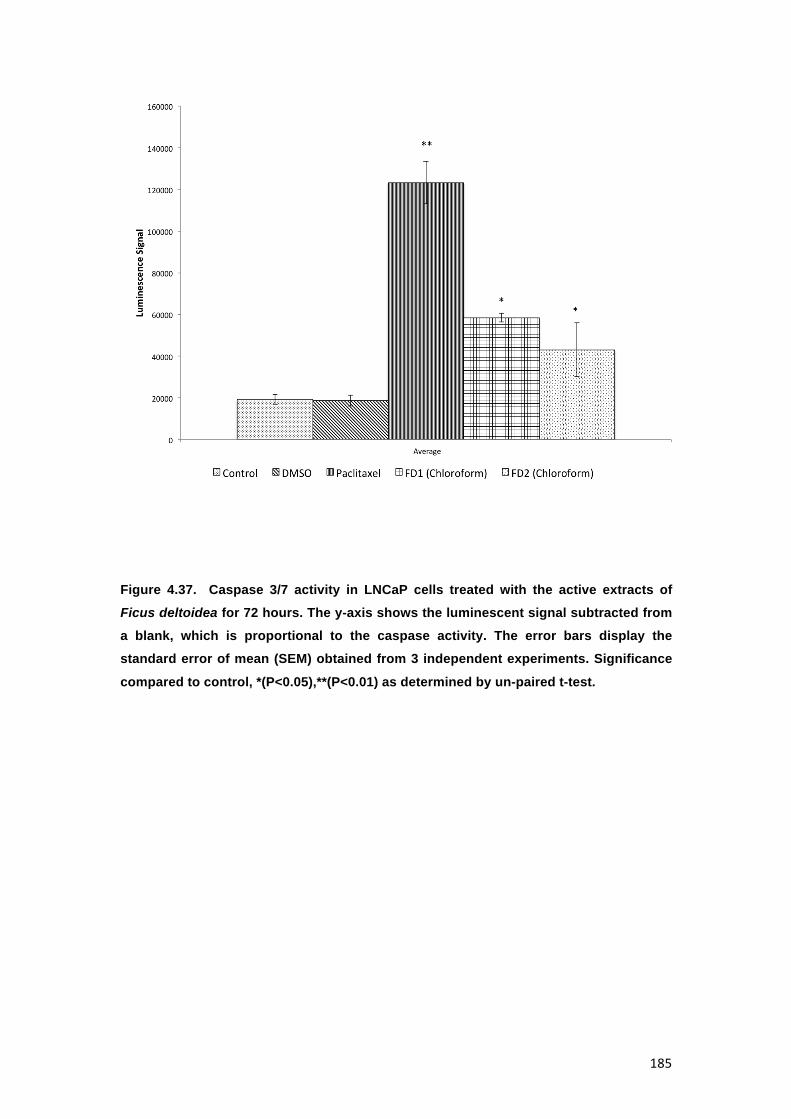
185
Figure 4.37. Caspase 3/7 activity in LNCaP cells treated with the active extracts of
Ficus deltoidea for 72 hours. The y-axis shows the luminescent signal subtracted from
a blank, which is proportional to the caspase activity. The error bars display the
standard error of mean (SEM) obtained from 3 independent experiments. Significance
compared to control, *(P<0.05),**(P<0.01) as determined by un-paired t-test.

186
Figure 4.38. Caspase 3/7 activity in PC3 cells treated with the active extracts of Ficus
deltoidea for 72 hours. The y-axis shows the luminescent signal subtracted from a
blank, which is proportional to the caspase activity. The error bars display the
standard error of mean (SEM) obtained from 3 independent experiments. Significance
compared to control, *(P<0.05),**(P<0.01) as determined by un-paired t-test.

187
4.1.5.4 MMP depolarization in active plant extracts treated PC3 cell line
In addition to its metabolic functions, mitochondria play a major role in
the management of other cellular functions like cell survival and death
(Galluzzi, Kepp et al. 2012). Mitochondrial changes, including variations in
mitochondrial membrane potential (Δψm), are the key events during drug-
mediated apoptosis (Zamzami, Marchetti et al. 1995). One of the distinctive
features of the early stage of apoptosis is the disruption of active
mitochondria, which includes changes in the mitochondrial membrane
potential and alterations to the oxidation-reduction potential of the
mitochondria. These changes are believed to be caused by the opening of the
mitochondrial permeability transition pore (PTP) that leads to the passage of
ions and small molecules (Ly, Grubb et al. 2003). Hence, to assess the effect
of the active plant extracts on mitochondrial activity, the mitochondrial
membrane potential (MMP) was studied using the cationic fluorescent probe
JC-1. This compound can selectively enter into the mitochondrion of cells, and
reversibly changes from red to green fluorescence as the mitochondrial
membrane potential decreases. By measuring such a shift in the fluorescence
emission by flow cytometry, MMP can be readily detected. As shown in Figure
4.39 to Figure 4.41, the active extracts of the plants increased the percentage
of mitochondrial membrane potential (MMP) depolarization significantly
(*p<0.05 and **p<0.01) in PC3 cell lines which indicate that the active extracts
of the plants induce cell death in human prostate cancer cells with the
involvement of mitochondrial membrane depolarization. These findings further
support previous results shown in section 4.1.5.3, which showed the
activation of caspases 3 and 7.

188
Control Campthotecin
Marantodes Pumilum (Chloroform) Marantodes Pumilum (n-Hexane)
Figure 4.39. Representative MMP profiles of flow cytometry for active plant extracts-
treated PC3 cells. Depolarization of mitochondrial membrane potential (MMP) of PC3
prostate cancer cell lines was induced by the active extracts of Marantodes pumilum
.PC3 cell lines were treated with the GI50 of the plant extracts for 6 hours. Results
shown are representative of three independent experiments.

189
FD1 (Choloroform) FD2 (Chloroform)
Figure 4.40. Representative MMP profiles of flow cytometry for active plant extracts-
treated PC3 cells. Depolarization of mitochondrial membrane potential (MMP) of PC3
prostate cancer cell lines was induced by the active extracts of Ficus deltoidea.PC3
cell lines were treated with the GI50 of the plant extracts for 6 hours. Results shown are representative of three independent experiments.
Figure 4.41. Quantification analysis of percentage MMP intensity in Figure 4.39 &
Figure 4.40. Data represented as means ± SEMs (n=3). *p<0.05 and **p<0.01 and
against control.

190
4.1.5.5 Nuclear DNA fragmentation
Nuclear DNA fragmentation is one of the important hallmarks of
apoptosis. This process involves the double-strand cleavage of nuclear DNA
at the linker regions between nucleosomes, which leads to the production of
oligonucleosomal fragments (Kerr, Winterford et al. 1994). The degradation of
the double-stranded nuclear DNA into oligonucleosomal fragments or
nucleosomal units is one of the best characterized biochemical features of
apoptotic cell death (Nagata 2000), as it enables the detection of apoptotic
cells by using the in-situ assays of DNA fragmentation called the Terminal
deoxynucleotidyl tranferase mediated biotin dUTP Nick End Labelling assay
(TUNEL). However, the interpretation of this assay must be carefully
assessed together with other morphological features of apoptotic cells
because single-strand DNA ends in cell nuclei are also present in necrotic
cells (Collins, Schandl et al. 1997).
In order to prevent the possible experimental bias, the results from this
study must be supported by other hallmarks of apoptosis such as the
activation of caspases and the up-regulation of pro-apoptotic proteins as well
as the down-regulation of anti-apoptotic proteins. In this study the TUNEL
assay was used to assess the effects of the active plant extracts on prostate
cancer cells’ nuclear DNA fragmentation. Figure 4.42 to Figure 4.44 show that
after 72 hours of treatment with active plant extracts, a more localized green
fluorescent (fluorescein-12-dUTP) colour can be detected, in the treated cells
as compared to the control. The localized green fluorescent label can only be
detected in apoptotic cells while the red Propidium Iodide stain will label both
apoptotic and non-apoptotic cells. These findings provide more evidence that
both Marantodes pumilum and Ficus deltoidea plant extracts induce prostate
cancer cell death via apoptosis.

191
Control
DNAse (Positive Control)
Figure 4.42. PC3 cells treated DNAse (positive control) and stained with DeadEnd™
Flurometric TUNEL system after 72 hours. Red fluorescence indicates healthy cells while green fluorescence shows fragmented nuclear DNA. Results shown are
representative of three independent experiments.

192
MPc
MPh
Figure 4.43. PC3 cells treated with Marantodes pumilum plant extracts and stained
with DeadEnd™ Flurometric TUNEL system after 72 hours. Red fluorescence indicates
healthy cells while green fluorescence shows fragmented nuclear DNA.

193
FD1c
FD2c
Figure 4.44. PC3 cells treated with Ficus deltoidea plant extracts and stained with
DeadEnd™ Flurometric TUNEL system after 72 hours. Red fluorescence indicates
healthy cells while green fluorescence shows fragmented nuclear DNA.

194
4.1.5.6 PC3 cell death via apoptosis (instrinsic pathway) based on Bax, Bcl-2 and Smac/DIABLO mRNA gene expression
Apoptosis is a programmed cell death that occurs through a highly
complex and sophisticated mechanism involving an energy dependent
cascade of molecular event. Research has indicated that there are two major
pathways for apoptosis: (1) extrinsic, also called ‘the death receptor pathway’;
and (2) intrinsic, otherwise known as the ‘mitochondrial-driven pathway’.
However, new findings by Igney and Krammer (2002) suggest that the two
pathways are linked and molecules in one pathway can influence the other. In
addition, new evidence suggests that there is an additional pathway that
involves T-cell mediated cytotoxicity and perforin-granzyme-dependent killing
of the cells (Martinvalet, Zhu et al. 2005). However all of these pathways show
important similarities in which they converge into the same terminal (or
execution) pathways and are initiated by the activation of caspase-3. This
results in DNA fragmentation, degradation of cytoskeletal and nuclear
proteins, cross-linking of proteins, formation of apoptotic bodies, expression of
ligands for phagocytic cells receptors and finally uptake by phagocytic cells
(Hengartner 2000).
The intrinsic signaling pathways involve a diverse array of non-
receptor-mediated stimuli that produce intracellular signals, which act directly
on targets within the cells and are driven by mitochondria. These stimuli may
act in either a positive or negative fashion; where negative signals involve the
absence of certain growth factors, hormones and cytokines without which will
trigger apoptosis and on the other hand positive signals include exposure to
radiation, toxins, hypoxia, hyperthermia, viral infections and free radicals
(Elmore 2007). All of these stimuli will cause disruption to the inner
mitochondrial membrane that lead to the opening of the mitochondrial
permeability transition (MPT) pore, loss of the mitochondrial transmembrane
potential and release of two main groups of pro-apoptotic proteins from the
intermembrane space to the cytosol (Saelens, Festjens et al. 2004). The first
group - which consists of cytochrome c, Smac/DIABLO and the serine

195
protease HtrA2/OMI - are responsible in the activation of the caspase-
dependent mitochondrial pathway (Du, Fang et al. 2000, Garrido, Galluzzi et
al. 2006), while the second group - consisting of the apoptosis-inducing factor
(AIF), endonuclease G and caspase-activated DNAse (CAD) - are
responsible for DNA fragmentation and condensation of peripheral nuclear
chromatin, which is a late event that occurs after the cell has committed to die
(Joza, Susin et al. 2001).
All these apoptotic mitochondrial events are controlled and regulated
by members of the Bcl-2 family of proteins (Cory and Adams 2002). The Bcl-2
family of proteins is responsible in maintaining the mitochondrial membrane
permeability and can either be pro-apoptotic (Bcl-10, Bax, Bak, Bid, Bad, Bim,
Bik and Blk) or anti-apoptotic (Bcl-2, Bcl-x, Bcl-XL, Bcl-XS, Bcl-w and BAG).
These proteins are very important and their balance (usually measured as the
ratio Bax/Bcl-2) will determine if the cell commits to apoptosis or aborts this
process. Therefore, in this study, we will look at the effects of the active plant
extracts on the expression of 3 different genes (Bax, Bcl-2, and
Smac/DIABLO), which play vital roles in the production of proteins that are
actively involved in the intrinsic pathway of apoptosis.
Figure 4.45 (summary in Table 4.4) shows that MPc is able to increase
the expression of Bax and Smac/DIABLO by 9-fold and 4-fold respectively,
while reducing the expression of Bcl-2 by more than 20-fold in a significant
manner. MPh also significantly stimulates the expression of both Bax and
Smac/DIABLO by 12-fold and 3-fold respectively, while inhibiting Bcl-2
expression by 7-fold. A similar trend was observed for both FD1c and FD2c
extracts as they significantly up-regulate the expression of Bax (FD1c: 2-fold,
FD2c: 2-fold) and Smac/Diablo (FD1c: 4-fold, FD2c: 2-fold) even though the
extent of gene expression stimulation was not as much as both MPc and
MPh. Both FD1c and FD2c also significantly down-regulated the expression of
Bcl-2 by 7 and 12-fold respectively. These findings suggest that all active

196
extracts of the plants increase the expression of pro-apoptotic genes and
reduce the expression of anti-apoptotic genes, which commit PC3 cells into
apoptosis by an increased production of pro-apoptotic proteins and reduced
production of anti-apoptotic proteins. Table 4.5 shows the summary of all the
investigations being carried out in order to determine the mode of cells death
induced by the active extracts of both Marantodes pumilum and Ficus
deltoidea plants and their respective results. Evidences from these studies
suggest that all active plant extracts induce prostate cancer cell death via
apoptosis.
Figure 4.45. Bcl-2, Bax and Smac/DIABLO mRNA gene expressions in PC3 cells treated with MNTC of the active plant extracts of Marantodes pumilum and Ficus
deltoidea after 96 hours. The genes expressions were determined as described in RT-
qPCR Conditions and Analysis. Data are mean ± SD; n=4 experiments. * P < 0.05, *** P<
0.001.

197
Table 4.4 mRNA gene expression analysis (Bax, Bcl-2 & Smac/DIABLO) in PC3 cells
treated with MNTC of the active plant extracts of Marantodes pumilum and Ficus
deltoidea after 96 hours. The genes expressions were determined as described in RT-
qPCR Conditions and Analysis where Control = 1. Data are mean ± SD; n=4
experiments. * P < 0.05, *** P< 0.001.
Sample Gene Fold expressions relative to Control in PC3 cells
MPc Bax 9***
Bcl-2 0.02***(> 20-Fold)
Smac/DIABLO 4***
MPh Bax 12***
Bcl-2 0.15*(7-Fold)
Smac/DIABLO 3*
FD1c Bax 2
Bcl-2 0.13*(7-Fold)
Smac/DIABLO 4***
FD2c Bax 2*
Bcl-2 0.09***(12-Fold)
Smac/DIABLO 2*

198
Table 4.5 Summary list of all the investigation carried out to determine the mode of death induced by the active extracts of both Marantodes
pumilum and Ficus deltoidea plants and their respective results.
Assay/Sample MPc MPh FD1c FD2c
Morphological
observation
(Characteristics of
apoptosis or necrosis)
Apoptosis (+)
Necrosis (−)
Apoptosis (+)
Necrosis (−)
Apoptosis (+)
Necrosis (−)
Apoptosis (+)
Necrosis (−)
DAPI staining Apoptotic cells visible Apoptotic cells visible Apoptotic cells visible Apoptotic cells visible
Annexin V-FITC
fluorocytometric
analysis
é Number of cells in
early apoptosis
compared to control
(untreated cells)
é Number of cells in
early apoptosis
compared to control
(untreated cells)
é Number of cells in
early apoptosis
compared to control
(untreated cells)
é Number of cells in
early apoptosis
compared to control
(untreated cells)

199
Table 4.5 (Continues)
Assay/Sample MPc MPh FD1c FD2c
Mitochondrial membrane
potential (MMP)
depolarization analysis
é MMP depolarization é MMP depolarization é MMP depolarization é MMP depolarization
Detection of Caspase 3/7 é Caspases 3/7
production
é Caspases 3/7
production
é Caspases 3/7
production
é Caspases 3/7
production
Nuclear DNA
fragmentation analysis
Nuclear DNA
fragmentation (+)
Nuclear DNA
fragmentation (+)
Nuclear DNA
fragmentation (+)
Nuclear DNA
fragmentation (+)
mRNA gene expression
analysis
é Pro-apoptotic genes
êAnti-apoptotic genes
é Pro-apoptotic genes
êAnti-apoptotic genes
é Pro-apoptotic genes
êAnti-apoptotic genes
é Pro-apoptotic genes
êAnti-apoptotic genes

200
4.1.6 Effect of the active extracts of the plants on the cell cycle of prostate cancer cell lines
The effects of the active extracts of Marantodes pumilum and Ficus
deltoidea on the cell cycle of LNCaP and PC3 cell lines were evaluated using
a flow cytometer. As shown in Figure 4.46 & Figure 4.48, there was a
significant increase (p<0.05) in the population of LNCaP cells at the G2M
phase as compared to the untreated cells when treated with the GI50 of both
Marantodes pumilum chloroform and n-Hexane extracts and Ficus deltoidea
extracts. The same trend was observed (Figure 4.47 & Figure 4.49) when the
PC3 cells were treated with the GI50 of both plant extracts. In addition,
treatment with the GI50 of both plant extracts also caused a significant
decrease in the population of both LNCaP and PC3 cells at G0/G1 phase
(p<0.05) while the percentages of cell population at the S phase remains
almost the same for both cell lines.
Cell cycle arrest enables DNA repair to occur thus preventing
replication of the damaged templates (Murray 2004). Cell cycle arrests
specifically at the G2M phase and it serves to prevent the cells from entering
the mitosis (M) phase with damaged genomic DNA. The transition of G2-
phase into M-phase is regulated by the activity of Cyclin B-cdc2 (CDK1)
complex (Al-Ejeh, Kumar et al. 2010). Cell cycle arrest at G2M phase
ultimately inactivates the Cyclin B-cdc2 complex via two parallel cascades.
The first cascade involves the phosphorylation of Chk kinases that inactivates
cdc25 - which prevents the activation of cdc2 - while the second cascade
involves the up-regulation of p53 proteins - which binds to and dissociates the
Cyclin B-cdc2 complex (Lukas, Lukas et al. 2004, Foster 2008). Nevertheless,
further studies need to be carried out in order to understand the actual
mechanisms on how the active extracts of Marantodes pumilum and Ficus
deltoidea induces cell cycle arrest at G2M phase. Apart from that, further
studies should be done in order to identify the phytochemicals responsible for
the activity.

201
Control Campthotecin
Marantodes Pumilum chloroform Marantodes Pumilum n-Hexane
Figure 4.46. Effect of the active extracts of Marantodes pumilum on the cell cycle of
LNCaP cells analysed by measuring DNA content using flow cytometer. The cells were
treated with the GI50 of the active extracts. *p<0.05 as compared to the untreated cells.
Paclitaxel treatment was used as positive control. Results shown are representatives
of three independent experiments.

202
Control Campthotecin
Marantodes Pumilum chloroform Marantodes Pumilum n-Hexane
Figure 4.47. Effect of the active extracts of Marantodes pumilum on the cell cycle of
PC3 cells analysed by measuring DNA content using flow cytometer. The cells were
treated with the GI50 of the active extracts. *p<0.05 as compared to the untreated cells.
Paclitaxel treatment was used as positive control. Results shown are representatives
of three independent experiments.

203
Control Campthotecin
FD1 chloroform FD2 chloroform
Figure 4.48. Effect of the active extracts of Ficus deltoidea on the cell cycle of LNCaP cells analysed by measuring DNA content using flow cytometer. The cells were treated
with the GI50 of the active extracts. *p<0.05 as compared to the untreated cells.
Paclitaxel treatment was used as positive control. Results shown are representatives
of three independent experiments.

204
Control Campthotecin
FD1 chloroform FD2 chloroform
Figure 4.49. Effect of the active extracts of Ficus deltoidea on the cell cycle of PC3
cells analysed by measuring DNA content using flow cytometer. The cells were treated
with the GI50 of the active extracts. *p<0.05 as compared to the untreated cells.
Paclitaxel treatment was used as positive control. Results shown are representatives
of three independent experiments.

205
4.1.7 Effect of the plant extracts on Arachidonic metabolism (ALOX-5)
As mentioned in section 2.1.4.4, the production of the 5-LOX enzyme
could also contribute to the growth of prostate cancer cells. This enzyme is
known to be encoded by the ALOX-5 gene. Ghosh and Myers (1997) reported
that the inhibition of 5-LOX would block the production of its metabolites and
triggers apoptosis in prostate cancer cells. This study was conducted to
investigate the effects of the active plant extracts of the mRNA gene
expression of the ALOX-5 gene. Figure 4.50 shows that only MPc was able to
inhibit the expression of ALOX-5 gene in a significant manner. The other 3
plant extracts were not able to have any significant effect on the expression of
the gene. This data is very interesting as it suggests that MPc was also able
to trigger PC3 cell death via apoptosis by inhibiting ALOX-5 gene expression
apart from activating the intrinsic pathway of apoptosis.
Figure 4.50. ALOX-5 mRNA gene expressions in PC3 cells treated with MNTC of the active plant extracts of Marantodes pumilum and Ficus deltoidea after 96 hours. The
genes expressions were determined as described in RT-qPCR Conditions and
Analysis. Data are mean ± SD; n=4 experiments. * P < 0.05, *** P< 0.001.

206
4.1.8 Inhibition of PC3 cells migration and invasion
Metastasis is responsible for 90% of cancer mortality rates. It
represents the major problem in the treatment of cancer, is indicative for poor
prognosis, and has dramatic effects on the survival of patients. Metastasis
involves multiple processes such as infiltrative growth through the
extracellular matrix (ECM), cell migration through blood or lymph vessels and
rise of distant colonies (Gupta and Massagué 2006) Migration is described as
any directed cell movement in the body. The ability to migrate allows cells to
change their position within tissues or different organs. Invasion on the other
hand, is defined as the penetration of tissue barriers, such as passing through
the basement membrane and infiltration into the underlying interstitial tissues
by malignant tumor cells.
Migration and invasion are clearly separated terms in experimental
biology as migration only involves the directed movement of cells on a
substrate such as basal membranes, ECM fibers, or plastic plates (2D
surfaces); whereas, invasion involves cell movement through a 3D matrix,
which is accompanied by a restructuring of the 3D environment (Friedl and
Wolf 2010). Despite the difficulties in defining different modes of migration, it
is a fact that the ability to migrate is a prerequisite to invade; a cell cannot
invade without migration but can move without invasion (Fackler and Grosse
2008).

207
4.1.8.1 Active extracts of the plants suppressed Migration of PC3 cells in Vitro
To investigate the effects of the active extracts of the plants on the
migration of PC3 cells, cells were treated with the maximum non-toxic
concentration (MNTC) for 72 hours and seeded in the 96 well plate (cell
exclusion zone assay). After 24, 48 and 72 hours of incubation, the migratory
activity of the cells were examined and the results are shown in Figure 4.36.
Throughout this study, the morphology of PC3 cells were monitored frequently
in order to make sure that the cells did not show any significant signs of cell
death as these will influence the outcome of this study. If a drug or an extract
has the ability to inhibit cancer cells migration, it could be detected by using
MNTC.
Figure 4.51 to Figure 4.53 show the inhibitory activity of the active
extracts of Marantodes pumilum, Ficus deltoidea plants and Paclitaxel
(positive control) on the migration of PC3 cells as viewed under EVOS® FL
Imaging System. Figure 4.54 indicates that, the active extracts of both plants -
Marantodes pumilum and Ficus deltoidea - at MNTC significantly inhibited the
migration of PC3 cells. This observation also indicates that the active extracts
of the plant suppressed the migration of PC3 cells in a time-dependent
manner. Both MPc and FD1c reduced the number of migrated cells by 50% at
every time point. To further validate the results of this study, another migration
study was conducted by using the transwell migration assay method (Boyden
Chamber). Results obtained from this experiment are shown in Figure 4.55.
After 24 hours of treatment with the active extracts of the plant, we can
clearly see that all active extracts of both plants showed significant inhibition
to the migration of the PC3 cells with MPc and FD1c reducing the number of
migrated cells by almost 60%. These results are in agreement with the
previous data obtained previously when conducting the cell migration study by

208
using the cell exclusion zone assay method. Thus, it seems quite likely that
MPc, MPh, FD1c and FD2c could inhibit PC3 cell migration.
In section 2.2.2, we have mentioned that chemokines such as CXCL12
can act as major regulators of cells trafficking and adhesion (Kyriakou, Rabin
et al. 2008). The binding of CXCL12 to its receptor, CXCR4, is said to initiate
divergent signalling pathways that lead to multiple responses including the
phosphorylation of MEK/ERK signalling cascade and the activation of NF-κB,
which is important for tumor cell progression and survival. Therefore, further
study needs to be conducted to get a better understanding on how the active
plant extracts suppress the migration of PC3 cells.

209
Sample/Hour 24 48 72
Control
Paclitaxel
Figure 4.51. Migration of PC3 cells treated with the MNTC of Paclitaxel for 24, 48, and 72 hours viewed under the EVOS® FL Imaging System.
Inhibition of migration can be clearly seen after treatment with Paclitaxel compared to the untreated cells. Results shown are representative of
three independent experiments.
1000 um
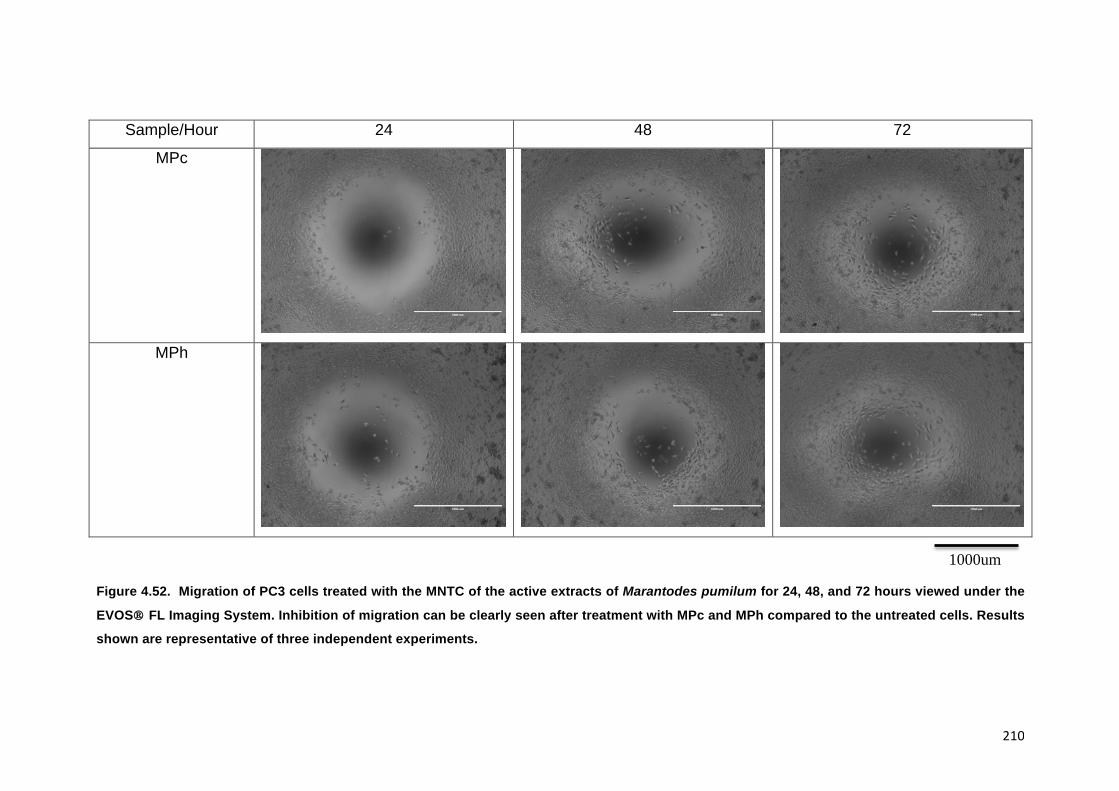
210
Sample/Hour 24 48 72
MPc
MPh
Figure 4.52. Migration of PC3 cells treated with the MNTC of the active extracts of Marantodes pumilum for 24, 48, and 72 hours viewed under the
EVOS® FL Imaging System. Inhibition of migration can be clearly seen after treatment with MPc and MPh compared to the untreated cells. Results
shown are representative of three independent experiments.
1000um

211
Sample/Hour 24 48 72
FD1c
FD2c
Figure 4.53. Migration of PC3 cells treated with the MNTC of the active extracts of Ficus deltoidea for 24, 48, and 72 hours viewed under the
EVOS® FL Imaging System. Inhibition of migration can be clearly seen after treatment with FD1c and FD2c compared to the untreated cells.
Results shown are representative of three independent experiments.
1000um

212
Figure 4.54. Oris™Cell Migration analysis: 5 x 10⁴ of PC3 cells were seeded per well
and allowed to adhere. Stoppers were then removed and the active extracts of both
Marantodes pumilum (MPc and MPh) and Ficus deltoidea (FD1c and FD2c) were added
to te wells, and the plate was incubated to permit cell migration. The cells were labelled
with CellTracker™ Green and the fluorescence quantified in the detection zone using a
Synergy HT BioTek plate reader. Results shown are representatives of three independent experiments, *p<0.05 and **p<0.01 and against control as analysed by the
Student’s t test.

213
Figure 4.55. CytoSelect Cell Migration analysis: Effects of the active extract of both
Marantodes pumilum (MPc and MPh) and Ficus deltoidea (FD1c and FD2c) plants on
the migration of the PC3 cells. PC3 cells were treated with the MNTC concentration of
MPc, MPh, FD1c and FD2c for 24 hours. Results shown are representatives of three
independent experiments, *p<0.05 and **p<0.01 and against control as analysed by the
Student’s t test.

214
4.1.8.2 Active extracts of the plants suppressed invasion of PC3 cells in vitro
Figure 4.56 shows the effect of the active extracts of the plants on PC3
cell invasion after 48 hours of treatment. All active extracts exhibited
significant inhibition on the invasion of the prostate cancer cells after 48 hours
of treatment. Both MPc and FD1c extracts reduced the number of invading
cells by more than two-fold when compared to control. These results indicate
that the active extracts of both plants are not only capable of inhibiting or
delaying PC3 cell migration but could also prevent cell invasion in a significant
way. As mentioned previously, the inhibition of both cell migration and
invasion could occur through MMP modulation. It is well known that: (1) the
derangement of ECM by MMPs play an initial key role in cell movement via
the alteration of cell-ECM interactions; and (2) MMPs breakdown the
basement membrane allowing cancer cells to migrate and invade.
Among MMPs, MMP-2 and MMP-9 play the most important role in
basement membrane type IV collagen degradation (Stetler-Stevenson 1990,
Giancotti and Ruoslahti 1999, Zeng, Cohen et al. 1999). In particular, MMP-2
expression is associated with tumor invasion, angiogenesis, metastasis and
recurrence (Wang, Wang et al. 2003, Komatsu, Nakanishi et al. 2004). It was
reposted that MMP-2 and MMP-9 are correlated with an aggressive, invasive
or metastatic tumor phenotype (Cockett, Murphy et al. 1997, Papathoma,
Zoumpourlis et al. 2001). It is well known that MMP inhibitors block
endothelial cell activities which are essential for new vessel development
leading to proliferation and invasion (Benelli, Adatia et al. 1993, Murphy,
Unsworth et al. 1993). Therefore, MMP-2 and MMP-9 are thought to be
therapeutic targets of anticancer drugs based on the degrading action of both
enzymes on gelatins, which are major components of the basement
membrane. As this is the first time that these active extracts are reported to
inhibit both the migration and invasion of prostate cancer cells (PC3), more
studies should be conducted in order to understand the actual mechanism
that led to this activity.

215
Figure 4.56. CytoSelect Cell Invasion analysis: Effects of the active extract of both
Marantodes pumilum (MPc and MPh) and Ficus deltoidea (FD1c and FD2c) plants on the invasion of the PC3 cells. PC3 cells were treated with the MNTC concentration of
MPc, MPh, FD1c and FD2c for 48 hours. Results shown are representatives of three
independent experiments, *p<0.05 and **p<0.01 and against control as analysed by the
Student’s t test.

216
4.1.8.3 VEGF-A, CXCR4 and CXCL12 mRNA Gene expression
This study was conducted to investigate the effects of the active plant
extracts on the mRNA gene expression of VEGF-A, CXCL12 and CXCR4.
Figure 4.57 shows that only FD1c was able to increase the expression of
CXCR4 by 2-fold significantly. However, for CXCL12 mRNA gene expression,
all plant extracts inhibit its expression in a significant manner. MPh reduced
the expression of CXCL12 by 16-fold while MPc, FD1c and FD2c reduced the
expression of the gene by more than 20-fold. Figure 4.57 also show that MPh
and FD1c were able to down-regulate the expression of VEGF-A by 7-fold
and 9-fold respectively in a significant manner. MPc inhibited the expression
of VEGF-A significantly by 20-fold. However, FD2c did not show any
significant effect on the mRNA gene expression. The significant inhibition of
the mRNA gene expression of both CXCL12 and VEGF-A by the active plant
extracts suggests an explanation on how these plant extracts were able to
suppress both migration and invasion as reported earlier. Table 4.6
summarizes the activity of the active extracts of both Marantodes pumilum
and Ficus deltoidea plant on the mRNA gene expression of CXCR4, CXCL12
and VEGF-A

217
Figure 4.57. CXCR4, CXCL12 and VEGF-A mRNA genes expression in PC3 cells
treated with MNTC of the active plant extracts of Marantodes pumilum and Ficus deltoidea after 96 hours. The genes expressions were determined as described in RT-
qPCR Conditions and Analysis. Data are mean ± SD; n=4 experiments. * P < 0.05, *** P<
0.001

218
Table 4.6 mRNA gene expression analysis (CXCR4, CXCL12 & VEGF-A) in PC3 cells
treated with MNTC of the active plant extracts of Marantodes pumilum and Ficus
deltoidea after 96 hours. The genes expressions were determined as described in RT-
qPCR Conditions and Analysis where Control = 1. Data are mean ± SD; n=4
experiments. * P < 0.05, *** P< 0.001.
Sample Gene Fold expressions relative to Control in PC3 cells
MPc CXCR4 1
CXCL12 0.003***(>20-Fold)
VEGF 0.05***(2-Fold)
MPh CXCR4 1
CXCL12 0.07*** (16-Fold)
VEGF 0.1*(7-Fold)
FD1c CXCR4 2*
CXCL12 0.01*** (>20-Fold)
VEGF 0.1*** (9-Fold)
FD2c CXCR4 1
CXCL12 0.003***(>20-Fold)
VEGF 1

219
4.1.9 Identification of the active fractions from the plant extracts
4.1.9.1 Fractionation of the plant extracts
Three plant extracts namely Marantodes pumilum choloroform extract
(MPc), Ficus deltoidea var. angustifolia (Miq) corner chloroform extract
(FD1c), and Ficus deltoidea Jack var. deltoidea chloroform extract (FD2c)
were chosen to be further fractionated using the method explained in 3.1.2
based on the GI50 values of each plant extracts obtained from cytotoxicity
studies with all 3 prostate cancer cell lines (PC3, DU145 and LNCaP). 140
fractions were collected for each plant extract and each fraction was
examined by a thin layer chromatography (TLC) (section 3.1.3). TLC is a
common analytical chromatography technique used to separate non-volatile
mixtures. In this study, this method is used to ascertain the presence of
different materials/compounds in fractions from column chromatography

220
Figure 4.58 TLC analysis of SEPHADEX of the MPc extract (fraction 4 to 68) viewed
under white light. T stands for total crude extract (crude extract of MPc).
Figure 4.59 TLC analysis of SEPHADEX of the MPc extract (fraction 4 to 68), viewed
under 254 nm wavelength. T stands for total crude extract (crude extract of MPc).
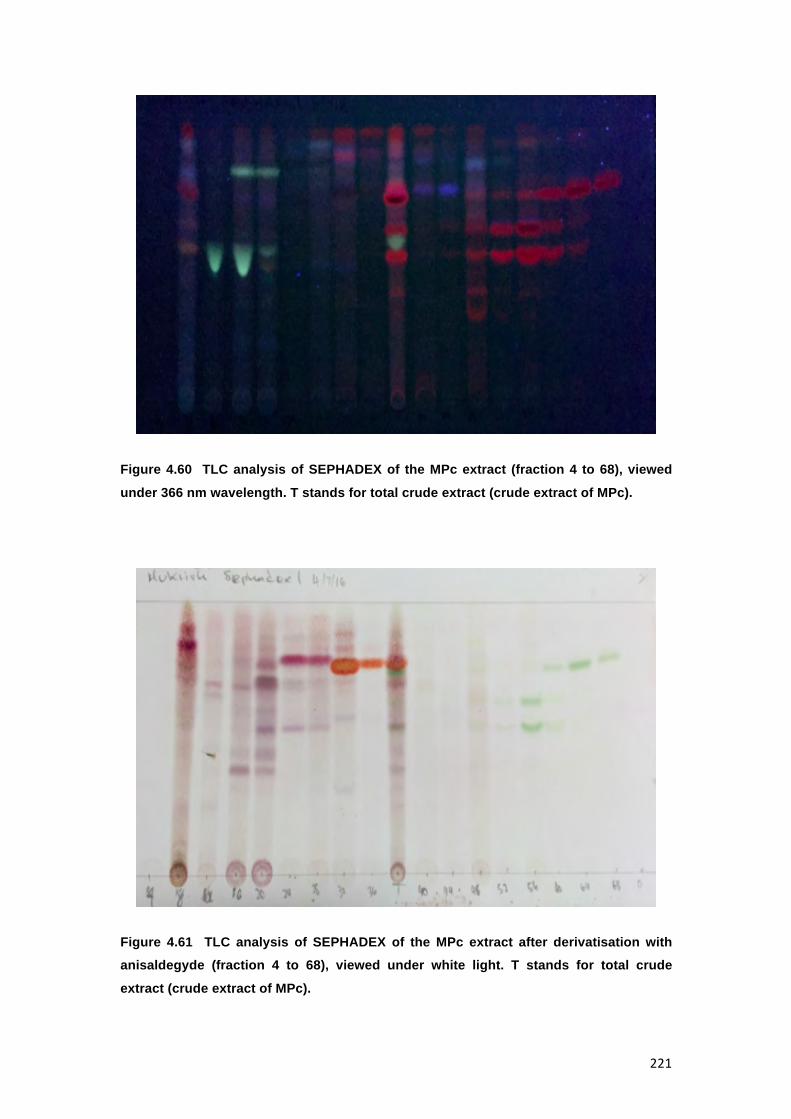
221
Figure 4.60 TLC analysis of SEPHADEX of the MPc extract (fraction 4 to 68), viewed
under 366 nm wavelength. T stands for total crude extract (crude extract of MPc).
Figure 4.61 TLC analysis of SEPHADEX of the MPc extract after derivatisation with
anisaldegyde (fraction 4 to 68), viewed under white light. T stands for total crude
extract (crude extract of MPc).
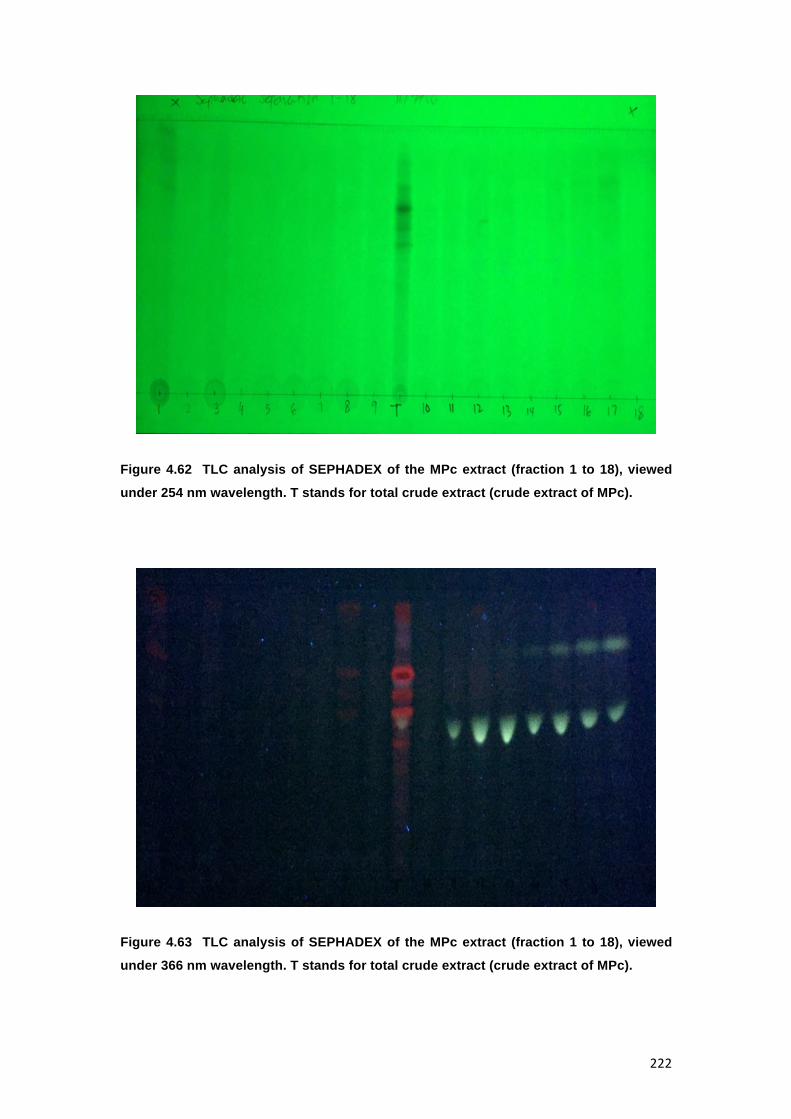
222
Figure 4.62 TLC analysis of SEPHADEX of the MPc extract (fraction 1 to 18), viewed
under 254 nm wavelength. T stands for total crude extract (crude extract of MPc).
Figure 4.63 TLC analysis of SEPHADEX of the MPc extract (fraction 1 to 18), viewed
under 366 nm wavelength. T stands for total crude extract (crude extract of MPc).

223
Figure 4.64 TLC analysis of SEPHADEX of the MPc extract after derivatisation with
anisaldegyde (fraction 1 to 18), viewed under white light. T stands for total crude
extract (crude extract of MPc).
Figure 4.65 TLC analysis of SEPHADEX of the MPc extract (fraction 19 to 36), viewed
under 254 nm wavelength. T stands for total crude extract (crude extract of MPc).

224
Figure 4.66 TLC analysis of SEPHADEX of the MPc extract (fraction 19 to 36), viewed
under 366 nm wavelength. T stands for total crude extract (crude extract of MPc).
Figure 4.67 TLC analysis of SEPHADEX of the MPc extract after derivatisation with
anisaldegyde (fraction 19 to 36), viewed under white light. T stands for total crude
extract (crude extract of MPc).

225
Based on the TLC profiles of MPc shown in Figures 4.58 to 4.67 the
eluates were then pooled into 7 major fractions (fraction 1, fraction 2-8,
fraction 10-13, fraction 15-17, fraction 21-24, fraction 27-29, fraction 30-33).
These fractions were subjected to another cytotoxicity study with PC3 cell
lines to determine their activity.

226
Figure 4.68 TLC analysis of SEPHADEX of the FD1c extract (fraction 16 to 33), viewed
under 254 nm wavelength. T stands for total crude extract (crude extract of FD1c).
Figure 4.69 TLC analysis of SEPHADEX of the FD1c extract (fraction 16 to 33), viewed
under 366 nm wavelength. T stands for total crude extract (crude extract of FD1c).
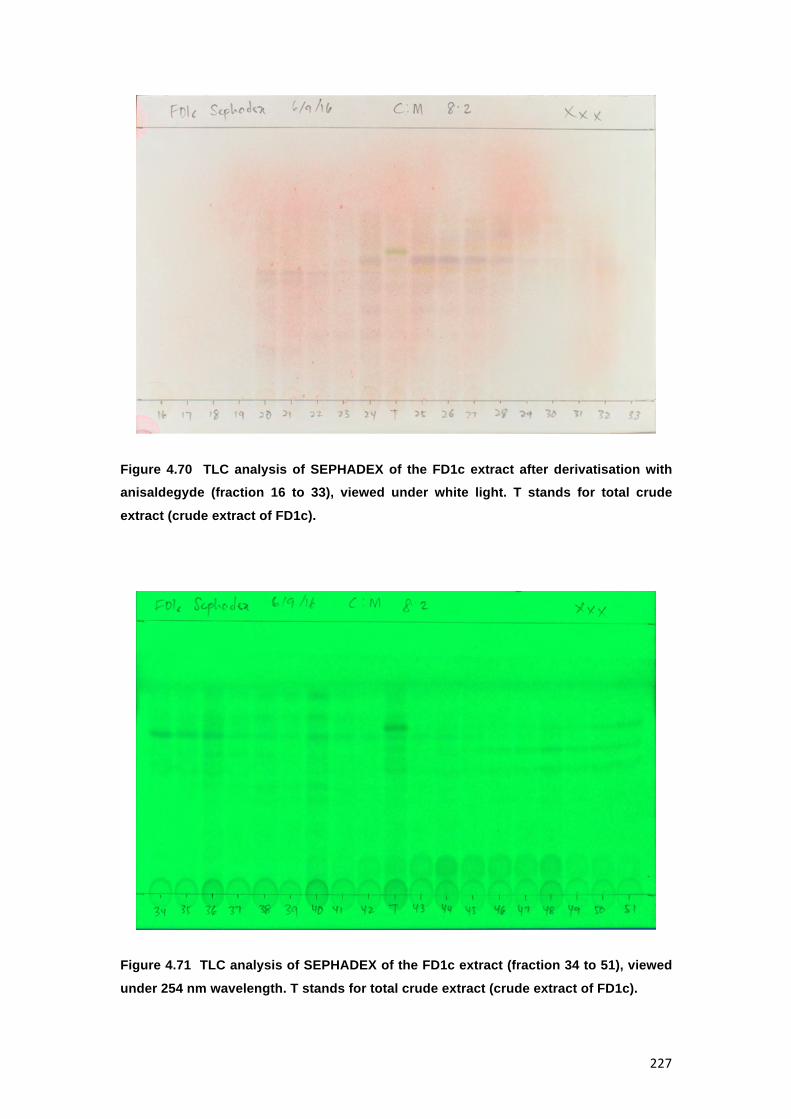
227
Figure 4.70 TLC analysis of SEPHADEX of the FD1c extract after derivatisation with
anisaldegyde (fraction 16 to 33), viewed under white light. T stands for total crude
extract (crude extract of FD1c).
Figure 4.71 TLC analysis of SEPHADEX of the FD1c extract (fraction 34 to 51), viewed
under 254 nm wavelength. T stands for total crude extract (crude extract of FD1c).
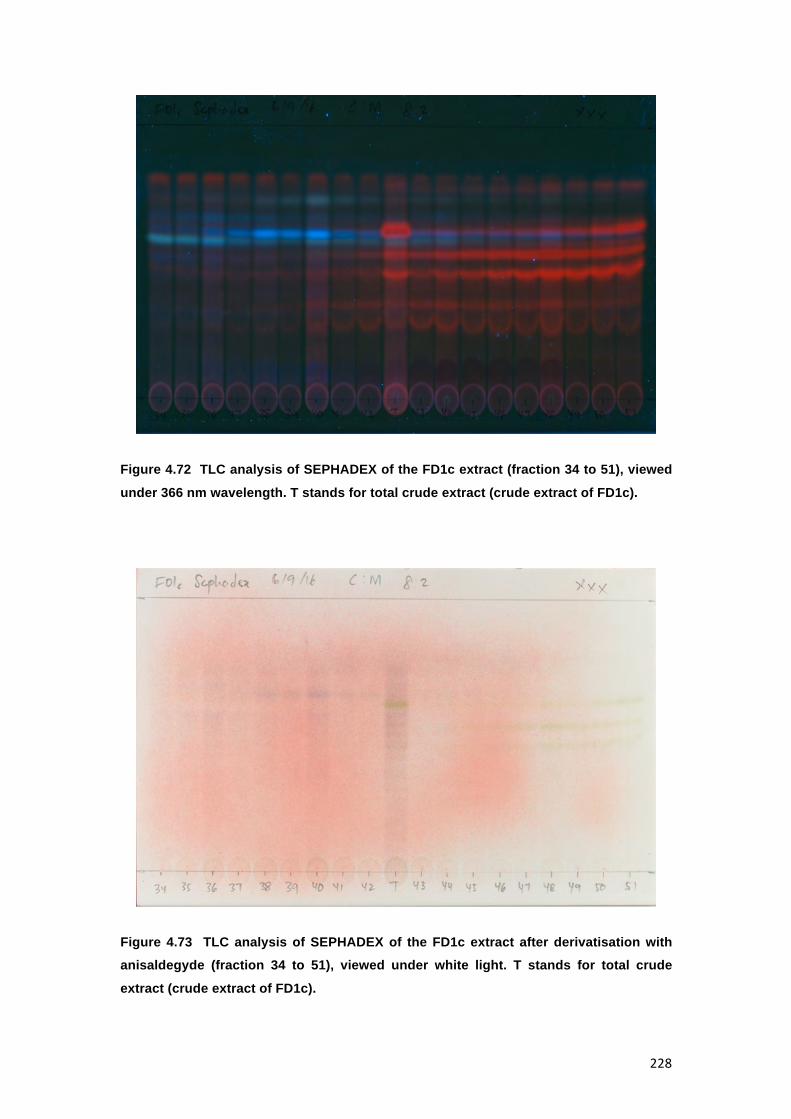
228
Figure 4.72 TLC analysis of SEPHADEX of the FD1c extract (fraction 34 to 51), viewed
under 366 nm wavelength. T stands for total crude extract (crude extract of FD1c).
Figure 4.73 TLC analysis of SEPHADEX of the FD1c extract after derivatisation with
anisaldegyde (fraction 34 to 51), viewed under white light. T stands for total crude
extract (crude extract of FD1c).

229
Based on the TLC profiles of FD1c shown in Figures 4.68 to 4.73 the
eluates were then pooled into 5 major fractions (fraction 20-23, fraction 24-30,
fraction 31-36, fraction 37-42, fraction 43-51). These fractions were subjected
to another cytotoxicity study with PC3 cell lines to determine their activity.
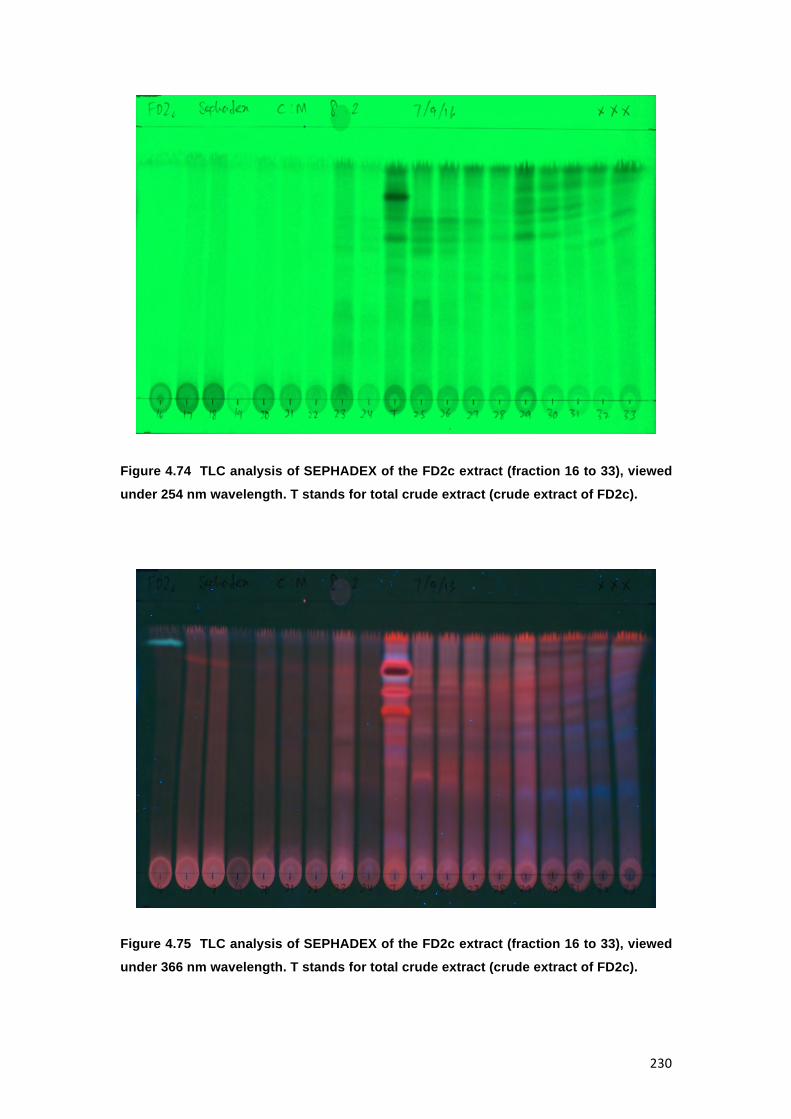
230
Figure 4.74 TLC analysis of SEPHADEX of the FD2c extract (fraction 16 to 33), viewed
under 254 nm wavelength. T stands for total crude extract (crude extract of FD2c).
Figure 4.75 TLC analysis of SEPHADEX of the FD2c extract (fraction 16 to 33), viewed
under 366 nm wavelength. T stands for total crude extract (crude extract of FD2c).

231
Figure 4.76 TLC analysis of SEPHADEX of the FD2c extract after derivatisation with
anisaldegyde (fraction 16 to 33), viewed under white light. T stands for total crude
extract (crude extract of FD2c).
Figure 4.77 TLC analysis of SEPHADEX of the FD2c extract (fraction 34 to 51), viewed
under 254 nm wavelength. T stands for total crude extract (crude extract of FD2c).
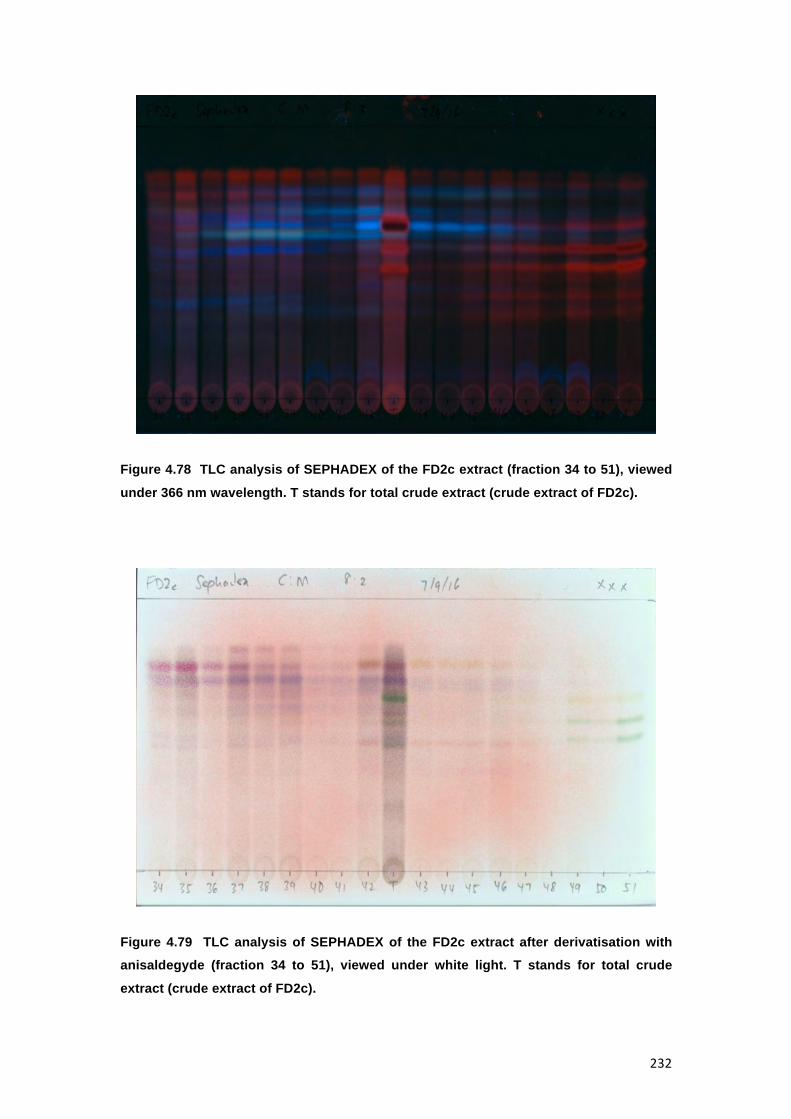
232
Figure 4.78 TLC analysis of SEPHADEX of the FD2c extract (fraction 34 to 51), viewed
under 366 nm wavelength. T stands for total crude extract (crude extract of FD2c).
Figure 4.79 TLC analysis of SEPHADEX of the FD2c extract after derivatisation with
anisaldegyde (fraction 34 to 51), viewed under white light. T stands for total crude
extract (crude extract of FD2c).

233
Based on the TLC profiles of FD2c shown in Figures 4.74 to 4.79 the
eluates were then pooled into 8 major fractions (fraction 16, fraction 17-22,
fraction 23-26, fraction 27-28, fraction 29-33, fraction 34-36, fraction 37-39,
fraction 40-45). These fractions were subjected to another cytotoxicity study
with PC3 cell lines to determine their activity.

234
4.1.9.2 Identification of the active fractions using SRB staining assay
Even though the main objective of this research is to produce
standardized extracts with chemopreventive properties, further extraction and
fractionation of the plant extracts is important in order to identify active
compounds that could be used for their standardization.
Size exclusion chromatography of the active plant extracts yielded 140
fractions. Based on the TLC profiles, the eluates were then pooled into 20
major fractions. These fractions were then tested for their cytotoxic activity
(SRB staining assay on PC3 cells) and their GI50 determined.
Figure 4.80 shows that out of the 20 major fractions being tested, only 4
fractions were observed to have better efficacy than their respective plant
extracts. These fractions were FD1c F30-33, FD1c F43-51, FD2c F29-33 and
FD2c F34-36. Table 4.7 shows the GI50 of each active fraction. The GI50
values for each fraction were significantly lower than their respective plant
extracts before further fractionation process was carried out (P< 0.05).
Therefore, these findings suggest that further extraction and fractionation
processes implied on the active plant extracts were able to increase their
efficacy.

235
Table 4.7 GI50 concentrations (µg/mL) of the active fractions from Marantodes
pumilum and Ficus deltoidea plant extracts determined for PC3 cells as assessed by SRB assays after 72 hours. Each result was obtained in three independent
experiments, which was run in triplicate.
Plant name Fraction
(Chloroform)
Sample Code GI50 (µg/ml)
with PC3
Marantodes pumilum (Blume) Kuntze (synonym Labisia pumila var. pumila)
Fraction 30-33 MPc F30-33 4.1 ± 0.3
Ficus deltoidea var. angustifolia (Miq.) Corner
Fraction 43-51 FD1c F43-51 12.3 ± 0.4
Ficus deltoidea Jack var. deltoidea
Fraction 29-33 FD2c F29-33 28.2 ± 0.2
Fraction 34-36 FD2c F34-36 24.2 ± 0.1

236
a)
b)
Figure 4.80. Dose-response curves of the effect of the extracts against PC3 cell line. a)
Effect of MPc fractions, b) Effect of FD1c and FD2c fractions on the viability of PC3 cell
line after 72 hours of exposure. All data represent the mean values and standard error
of mean (SEM) for the cytotoxic extracts after 72 hours of exposure. Each point was
obtained from three independent experiments, which was run in triplicate.

237
4.1.10 Effects of the active fractions of the plant extracts on mRNA genes expression
4.1.10.1 Apoptosis-related Gene expression (Bcl-2, Bax, Smac-Diablo, ALOX-5)
The 4 active fractions were further tested to investigate their mode of
action on PC3 prostate cancer cell lines. Table 4.8 shows that MPc F30-33
has significantly inhibited both Bcl-2 and ALOX-5 mRNA gene expression by
more than 20-fold and 3-fold respectively. MPc F30-33 also increased the
expression of Bax by 20-fold in a significant manner. Smac/DIABLO mRNA
gene expression was significantly stimulated by MPc F30-33 (50-fold), FD2c
F29-33 (5-fold), and FD2c F34-36 (4-fold). However, FD1c F43-51 did not
show any significant effect on the expression of Smac/DIABLO. This is
contradictory to the previous data in section 4.1.5.6, which show that the
active extract of FD1c significantly increased the expression of the gene by 4-
fold. This could happen due to the loss of active metabolite/s during the
fractionation process. Even though FD1c F43-51 showed better efficacy than
its active extracts, the loss of some bioactive component/s might lead to PC3
cell death through a different mode of action. Other active fractions showed a
similar trend in activity when compared to their active extracts but with better
efficacy. Therefore, these data suggest that the active fraction of the plant
extracts (MPc F30-33, FD2c F29-33, and FD2c F34-36) also induced PC3
prostate cancer cells death via apoptosis as observed with their active
extracts.

238
Table 4.8 mRNA gene expression analysis (Bax, Bcl-2 & Smac/DIABLO) in PC3 cells
treated with MNTC of the active fractions of Marantodes pumilum and Ficus deltoidea
after 96 hours (Apoptosis-related genes). The genes expressions were determined as
described in RT-qPCR Conditions and Analysis where Control = 1. Data are mean ±
SD; n=4 experiments. * P < 0.05, *** P< 0.001.
Sample Gene Fold expressions relative to Control in PC3
cells
MPc F30-33 Bax 20***
Bcl-2 0.02*** (20-Fold)
ALOX-5 0.3* (3-Fold)
Smac/DIABLO 54***
FD1c F43-51 Smac/DIABLO 1
FD2c F29-33 Smac/DIABLO 5***
FD2c F34-36 Smac/DIABLO 4*

239
4.1.10.2 Migration-related Gene expression (VEGF, CXCR4, CXCL12)
In this study we will investigate the effect of the active fractions of
mRNA gene expression related to cell migration and invasion. Table 4.9
shows that both MPc F30-33 and FD1c F43-51 have significantly down-
regulated the mRNA gene expression of VEGF by 22-fold and 4-fold
respectively, whereas both active fractions of the FD2c extract did not cause
any significant changes to the expression of VEGF. Even though none of the
active fractions significantly caused any changes to the expression of CXCR4,
all 4 of them had caused significant inhibition to the expression of CXCL12 by
more than 20-fold. These findings are similar to the previous results observed
with the active extracts of the plants but with greater efficacy. Therefore, the
active fractions of the plant extracts also inhibit PC3 prostate cancer cells
migration and invasion through similar mode of action.
Table 4.9 mRNA gene expression analysis (VEGF-A, CXCR4 & CXCL12) in PC3 cells
treated with MNTC of the active fractions of Marantodes pumilum and Ficus deltoidea
after 96 hours (Migration-related genes). The genes expressions were determined as
described in RT-qPCR Conditions and Analysis where Control = 1. Data are mean ±
SD; n=4 experiments. * P < 0.05, *** P< 0.001.
Sample Gene Fold expressions relative to Control in PC3 cells
MPc F30-33 VEGF-A 0.04***(22-Fold)
CXCR4 1
CXCL12 0.009***(>20-Fold)
FD1c F43-51 VEGF-A 0.3***(4-Fold)
CXCR4 1
CXCL12 0.02*(>20-Fold)
FD2c F29-33 VEGF-A 1
CXCR4 1
CXCL12 0.005***(>20-Fold)
FD2c F34-36 VEGF-A 1
CXCR4 2
CXCL12 0.005***(>20-Fold)

240
4.1.11 Specificity study using normal Human Dermal Fibroblast cells
This study is carried out in order to investigate the effect of the active
plant extracts on normal human cells. The results presented in this thesis
indicate that the active extracts of both Marantodes pumilum (MPc and MPh)
and Ficus deltoidea (FD1c and FD2c) and their active fractions (MPc F30-33,
FD1c F43-51, FD2c F29-33, and FD2c F34-36) show great potential in
prostate cancer cell inhibition by inducing cell death via apoptosis, causing
cellular arrest at G2M phase and significantly inhibiting both prostate cancer
cells migration and invasion.
However, all these activities would be useless if the active extracts also
exert toxic effect on normal human cells. Normal human dermal fibroblast
cells (HDFa) were used to ascertain the differential toxicity of the active
extracts. The results of this study are shown in Figure 4.81. We established
the Maximum Non-Toxic Concentrations of the extracts (MNTC) as the
concentration allowing 80% of the cell population to grow. The MNTC of both
MPc and MPh are about 200 µg/mL and the MNTC values for both FD1c and
FD2c are more than 200 µg/mL. All fractions but MPc F30-33 (≥ 100 µg/mL)
were observed to have MNTC values of more than 200 µg/mL. However,
considering the very low GI50 value of MPc F30-33 (4 µg/mL), this fraction is
still considered to show selective cytotoxicity. The remaining 3 active
fractions, FD1c F43-51, FD2c F29-33, and FD2c F34-36 were observed to
have MNTC value of more than 200 µg/mL. This information indicates that all
the active extracts of the plant as well as the active fractions show selectivity
and is specifically inhibiting PC3 cells line growth.

241
a)
b)
Figure 4.81. Effects of a) MPc, MPh, FD1c and FD2c, and b) MPc F30-33, FD1c F43-51,
FD2c F29-33, and FD2c F34-36 plants on the growth of HDFa cells as assessed by SRB
assays after 72 hours. Each result was obtained in three independent experiments,
which was run in triplicate.

242
4.1.12 Identification of the active principles from the plant extracts
4.1.12.1 Bioguided isolation of monounsaturated Alkyl Resorcinol from MPc F30-33 fraction
4.1.12.1.1 HPLC microfractionation of MPc F30-33
A high performance liquid chromatography (HPLC) microfractionation
was carried out for MPc F30-33 in order to investigate the separation of the
compounds and identify which fraction/s are responsible for the cytotoxic
activity against PC3 prostate cancer cell lines. Figure 4.82 shows HPLC
chromatogram of MPc F30-33. 4 different wavelengths were used in this study
including 254, 210, 270 and 330nm. The peaks distribution looks almost
similar in all investigated wavelengths, however the intensity of each peak is
different. Therefore, the scale on the Y-axis is different for each wavelength
due to different signal intensities. Based on the chromatograph shown in
Figure 4.82, 8 microfractions were collected from MPC F30-33 and all of
these microfractions were subjected to a cytotoxicity assay on PC3 cells using
SRB. The GI50 of each microfractions were calculated and Figure 4.83 shows
that only microfraction 5 was significantly cytotoxic (P <0.05) against PC3
cells with a GI50 value of 4 µg/mL. Therefore, microfraction 5 was analyzed
further in order to identify its bioactive compound that might be responsible for
the cytotoxic activity against prostate cancer cell lines.

243
Figure 4.82. HPLC chromatogram of MPc F30-33. 4 different wavelengths were used in this study including 254, 210, 270 and 330nm. The peaks
distribution looks almost similar in all investigated wavelengths, however the intensity of each peak is different. Therefore, the scale on the Y-axis
is different for each wavelength due to different signal intensities.

244
Figure 4.83. Overlay of the HPLC chromatogram of MPc F30-33 with their respective GI50. The GI50 concentrations (µg/mL) of the microfractions
determined for PC3 cells as assessed by the SRB assays at 72 hours. Paclitaxel (0.01µM) was used as a reference drug. Each result was obtained
in three independent experiments and run in triplicate.

245
4.1.12.1.2 Elucidation of microfraction no. 5
Compound MP-1, as shown in Figure 4.84, was isolated as a colorless
oil. In the IR spectrum shown in Figure 4.94, absorption bands for hydroxyl
was observed at 3380.75 cm-1, and for alkenyl at 1600.16 cm-1. The HRESI-
MS (Figure 4.86) of compound MP-1 exhibited a protonated molecular ion
[M+H]+ peak at m/z 402.2 (calcd. for C27H45O2+H, 401) which corresponded to
the molecular formula C27H45O2. The 1HNMR (Figure 4.87) spectrum gave
signals that are characteristic of resorcinol with unsaturated alkyl substituents
at the 5th position, 5-alkylresorcinol (AR). A singlet at δ5.87 ppm and
overlapped signals at δ6.02 ppm, form the aromatic part of the compound.
The 1HNMR spectrum exhibited resonances for the alkenyl side chain at
δ2.37 ppm (m), δ1.53 ppm (m), δ2.07 ppm (q, J=26.5, 13.5, 7), and δ5.45 ppm
(m), overlapped signals from δ1.21 ppm to δ2.37 ppm, and at δ0.87 ppm (m).
The 13CNMR spectrum (Figure 4.88) showed 6 resonances in the aromatic
region (δ100.8-δ157.9ppm). Inspection of key HMQC (Figure 4.90)
correlations showed two bond correlation between H at position 2 to C-1 and
C-3, H at position 4 to C-3, H at position 6 to C-1 and H at position 1’ to C-2
and C-5. HMBC (Figure 4.91) data showed three bond correlation between H
at position 4 to C-2, H at position 6 to C-2, and H at position 1’ to C-4; and
four bond correlation between H at position 4 to C-1’, H at position 6 to C-1’,
and H at position 1’ to C-6. The aliphatic chain has a double bond due to the
signals at δ5.45-δ5.53 ppm, which is a multiplet and integrated for 2H
revealed the presence of a double bond in the aliphatic chain. We did not
determine the position of the double bond in the aliphatic chain. Since the
structure of MP-1 is not yet fully elucidated, in an effort to validate the
structure of MP-1, a comparison is made to another 5-alkylresorcinol
compound namely 1-O-methyl-6-acetoxy-5-(pentadec-10Z-enyl)resorcinol
(Figure 4.85) isolated by Al-Mekhlafi, Shaari et al. (2012). Table 4.10 shows 1H and 13C NMR spectroscopic data for 1-O-methyl-6-acetoxy-5-(pentadec-
10Z-enyl)resorcinol measured in CDCL3. The spectroscopic data in Table
4.10 display similar peaks positioning for both C and H spectra especially in
the aromatic region and the location of the alkenyl side chain when compared

246
to the spectroscopic data of MP-1 in the same table with slight differences in
chemical shifts. The slight different in chemical shift is expected as different
solvents were used for NMR analysis. However, the C at position 6 in 1-O-
methyl-6-acetoxy-5-(pentadec-10Z-enyl)resorcinol corresponds to δ131.7 ppm
whereas the same C in MP-1 corresponds to δ108.4 indicating a huge
different in the chemical shift. This phenomenon can be explained due to the
fact that C at position 6 in 1-O-methyl-6-acetoxy-5-(pentadec-10Z-
enyl)resorcinol is attached to a stronger electron-withdrawing group thus
making it more deshielded. This comparison has further validated the
elucidated structure of MP-1.
Figure 4.84 Structure of MP-1
RHO
OH1
3
2 6
1' 14
5 2'
R=19:1

247
Table 4.10 1H and 13C NMR spectroscopic data for compound MP-1 measured in benzene-d6 and 1H and 13C NMR spectroscopic data for 1-O-
methyl-6-acetoxy-5-(pentadec-10Z-enyl)resorcinol measured in CDCL3. The spectroscopic data is put side by side so that the structure can be
easily compared, thus validating the structure of MP-1. The spectroscopic data for 1-O-methyl-6-acetoxy-5-(pentadec-10Z-enyl)resorcinol is
adapted from “Alkylresorcinols and cytotoxic activity of the constituents isolated from Labisia pumila” by N. A. Al-Mekhlafi, K. Shaari, F. Abas, R. Kneer, E. J. Jeyaraj, J. Stanslas, N. Yamamoto, T. Honda, and N. H. Lajis, 2012, Phytochemistry (2012) 80, 42-49. Copyright 2012 by Elsevier.
Adapted with permission.
MP-1 1-O-methyl-6-acetoxy-5-(pentadec-10Z-enyl)resorcinol
Position 1H 13C 2J 3J / 4J Position δH (J in Hz) δC
1 157.9 1 151.8
2 5.87 (s) 100.8 C-3, C-1 2 6.24 (d, J = 2.5 Hz) 98.4
3 157.9 3 154.3
4 6.02 (overlapped) 108.4 C-3 C-1’, C-2 4 6.18 (d, J = 2.5 Hz) 107.9
5 146.1 5 136.7
6 6.02 (overlapped) 108.4 C-1 C-1’, C-2 6 131.7
1’ 2.37 (m) 36.6 C-5, C-2’ C-4, C-6 1’ 2.39 (t, J = 7.5 Hz) 32.2
2’ 1.53 (m) 31.9 2’ 150 (m) 30.3
2.07 (q, J = 26.5, 13.5, 7) 28.0 3’-8’ 1.32-1.27 (m) 29.6-30.2
5.45 (m) 130.6 9’ 2.01 (m) 27.2
5.45 (m) 130.6 10’ 5.35 (m) 130.0

248
Table 4.10 (Continues)
MP-1 1-O-methyl-6-acetoxy-5-(pentadec-10Z-enyl)resorcinol
Position 1H 13C 2J 3J / 4J Position δH (J in Hz) δC
2.07 (q, J = 26.5, 13.5, 7) 27.7 11’ 5.35 (m) 130.0
1.21-2.37 (overlapped) 23.1-
30.6
12’ 2.01 (m) 27.2
21 0.87 (m) 14.6 13’-14’ 1.32-1.27 (m) 22.6
15’ 0.89 (t, J = 7.0 Hz) 14.3
2-OCH3 3.71 (s) 56.1
1-OCOCH3 2.32 (s) 170.3
1-OCOCH3 20.7

249
Figure 4.85 Structure of 1-O-methyl-6-acetoxy-5-(pentadec-10Z-enyl)resorcinol
OCH3
OH
O
OH3C
12
34
5
6
1'
2'10'11'15'

250
Figure 4.86 MP-1 ESI-MS result

251
Figure 4.87 1HNMR of MP-1 dissolved in benzene-d6 at 500MHz. The 1HNMR spectrum gave signals that are characteristic of resorcinol with unsaturated
alkyl substituents at the 5th position, 5-alkylresorcinol (AR). A singlet at δ5.87 ppm and overlapped signals at δ6.02 ppm, form the aromatic part of the compound.
The alkenyl side chain is identified at δ2.37 ppm (m), δ1.53 ppm (m), δ2.07 ppm (q, J=26.5, 13.5, 7), and δ5.45 ppm (m), overlapped signals from δ1.21 ppm to δ2.37
ppm, and at δ0.87 ppm (m).
1.01.52.02.53.03.54.04.55.05.56.06.57.0 ppm
1.26
31.
289
1.29
61.
304
1.31
11.
313
1.32
01.
325
1.33
41.
351
1.36
11.
377
1.39
21.
404
1.52
72.
066
2.08
02.
094
2.10
72.
119
2.36
72.
377
2.38
22.
392
2.40
7
3.89
9
5.45
35.
465
5.47
55.
486
5.49
65.
509
5.51
75.
529
5.87
76.
016
6.02
36.
027
3.19
26.012.1
0
4.14
2.08
1.76
2.63
1.00
2.03
Current Data ParametersNAME mhEXPNO 10PROCNO 1
F2 - Acquisition ParametersDate_ 20161011Time 15.55INSTRUM av500PROBHD 5 mm CPQNP 1H/PULPROG zg30TD 65536SOLVENT C6D6NS 16DS 2SWH 10330.578 HzFIDRES 0.157632 HzAQ 3.1719425 secRG 35.9DW 48.400 usecDE 6.00 usecTE 300.0 KD1 1.00000000 secTD0 1
======== CHANNEL f1 ========NUC1 1HP1 13.90 usecPL1 2.00 dBPL1W 6.41881752 WSFO1 500.1330885 MHz
F2 - Processing parametersSI 32768SF 500.1300575 MHzWDW EMSSB 0LB 0.30 HzGB 0PC 1.00

252
Figure 4.88 13CNMR of MP-1 dissolved in benzene-d6 at 500MHz

253
Figure 4.89 DEPT of MP-1 dissolved in benzene-d6 at 500MHz
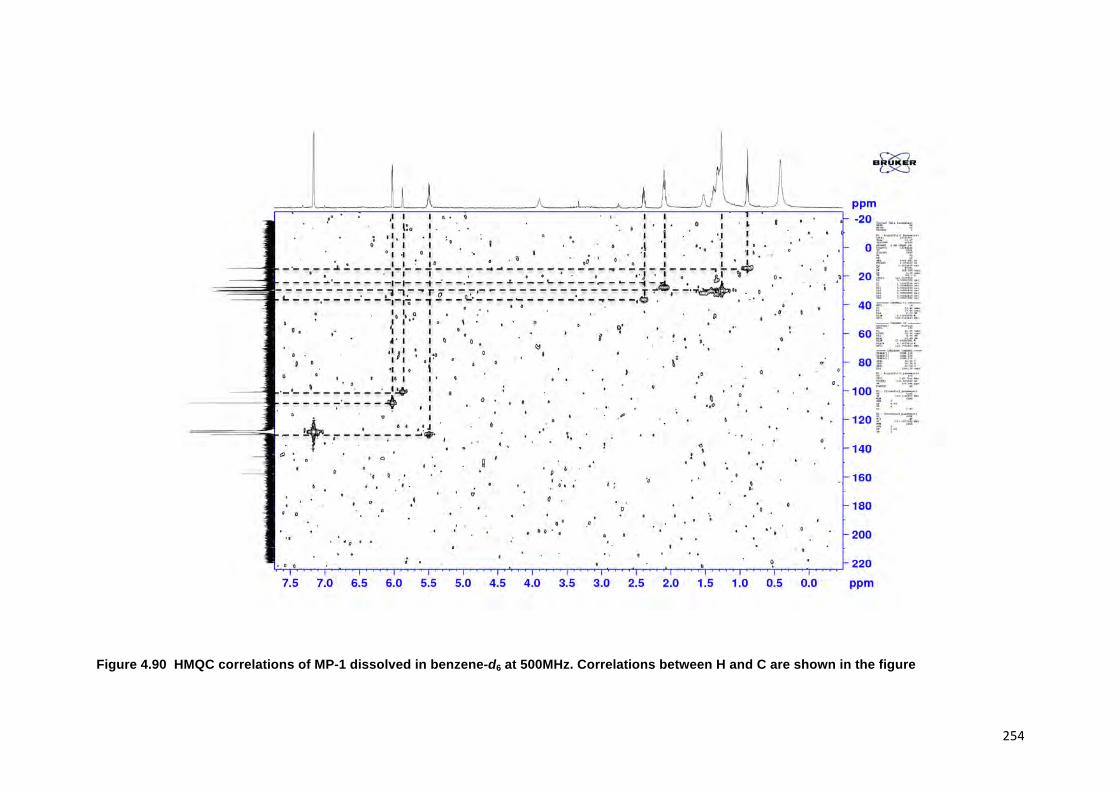
254
Figure 4.90 HMQC correlations of MP-1 dissolved in benzene-d6 at 500MHz. Correlations between H and C are shown in the figure

255
Figure 4.91 HMBC correlations of MP-1 dissolved in benzene-d6 at 500MHz. Correlations between H and C are shown in the figure.
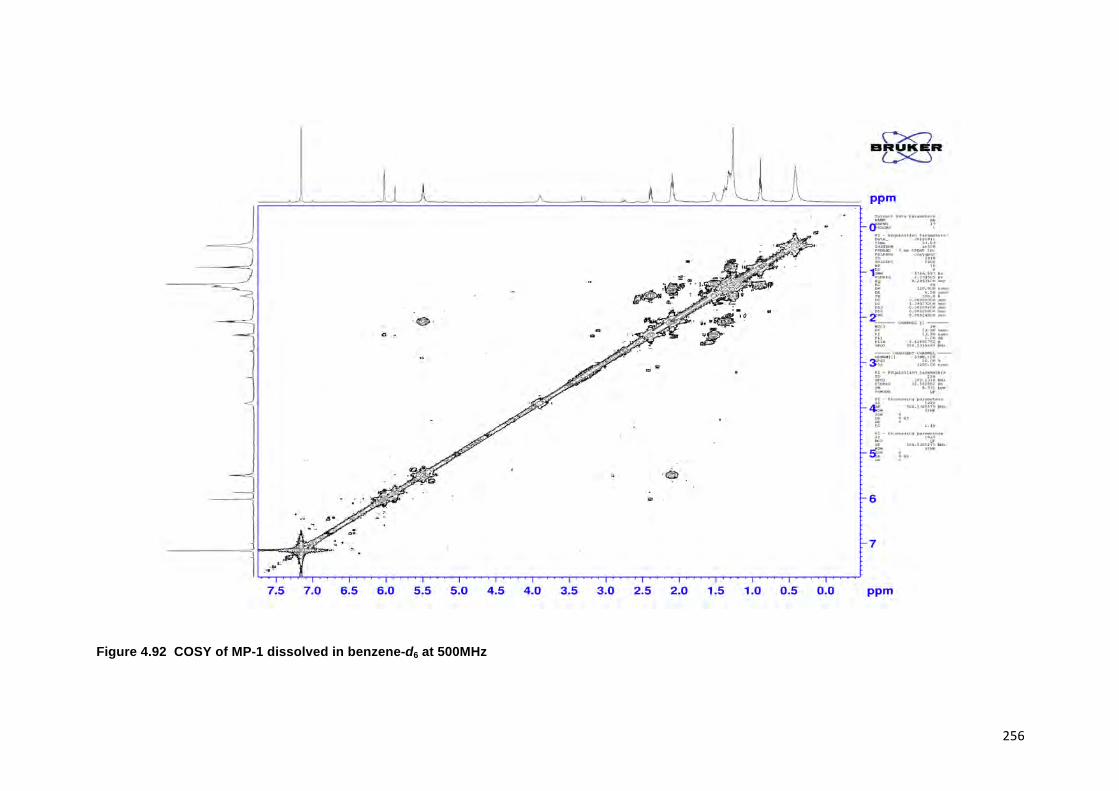
256
Figure 4.92 COSY of MP-1 dissolved in benzene-d6 at 500MHz

257
Figure 4.93 NOESY of MP-1 dissolved in benzene-d6 at 500MHz

258
Figure 4.94 Infrared spectra for MP-1

259
4.1.12.2 Dereplication of Isovitexin from FD1c F43-51, Lupeol, Moretenol from FD2c F29-33 and Oleanolic acid from FD2c F34-36 fractions
Previously, researchers have used the conventional methods, which
rely heavily on bioactivity-directed fractionation methodology in order to
identify, isolate and elucidate the bioactive lead compound from the crude
extracts. This process, which depends on the results of the bioassay to guide
the isolation, is often tedious, expensive, time consuming - and quite
frequently we may end up with disappointing outputs when isolating a
previously known and well characterized compound (Ghisalberti 1993, Alali
and Tawaha 2009). In order to tackle these issues, a procedure known as
dereplication has been used in natural products and phytochemistry research.
This procedure is able to discriminate between previously known compounds
and potential novel entities in a more efficient and rapid way while only
working at the level of crude extracts (Alali and Tawaha 2009).
Dereplication will prevent us from wasting important resources, as this
procedure will be oriented towards targeted isolation of compounds
presenting novel spectroscopic features. dereplication could also be a very
useful procedure that can be used to investigate the presence of known
compounds in a crude extracts or fractions in a quick and efficient way, thus
making it essential for natural product research (Constant and Beecher 1995,
Ackermann, Regg et al. 1996). In the dereplication method, hyphenated
techniques using UV spectroscopy and mass spectrometry coupled with the
use of natural products database are very important in order to determine the
identity of the active compound at the earliest possible stage of the discovery
process (Sedlock, Sun et al. 1992, Su, Rowley et al. 2002, Sarker and Nahar
2012). In this study, the Ultra High Performance Liquid Chromatography–
Electro Spray Ionization-Mass Spectrometry (UHPLC–ESI-MS) and Liquid
Chromatography-Photodiode Array Detection (LC-PDA) was used in order to
analyse the secondary metabolite constituents of the active fractions from
both FD1 and FD2 plants.

260
4.1.12.2.1 UHPLC-MS analysis of FD1c F43-51
FD1c F43-51 was active against PC3 cancer cell lines with a GI50
value of 12 µg/mL. The UHPLC-MS-ELSD-PDA profiles are shown in Figure
4.95. The shifts for the retention time (tR) of the 12 peaks in this
chromatogram (Figure 4.95) are due to the sequential four-channel detection
system. The universal ELSD detection method provides accurate data in
accessing the relative content of individual compounds in a mixture that may
not be UV active (Yang, Liang et al. 2014). Peaks 3a and 3b with tR 5.72 min
were present in the highest concentration, which accounts for 75.27% of the
total mass. The positive and negative-ion ESIMS detection procedures
showed different sensitivities (Table 4.11), with the positive mode producing a
strong total ion chromatogram (TIC) for all the compounds. Therefore, the
positive ESIMS and UV data were used to determine the structural
information of the compounds present. Peaks 3a and 3b gave the same
accurate mass of 433 and were dereplicated as Vitexin and Isovitexin
respectively (Figure 4.96). These two compounds are known constituents of
Ficus deltoidea (Bunawan, Amin et al. 2014). Peak 5 with tR 9.46 min was
also detected with a good concentration with 8.22% of total mass and it was
dereplicated as Brosimacutin (Figure 4.96). The other 10 compounds
(Compounds 1,2,4 and 6-12) were present in a very small concentration and
thus not considered to play a major role in the cytotoxic activity of FD1c F43-
51 fraction.
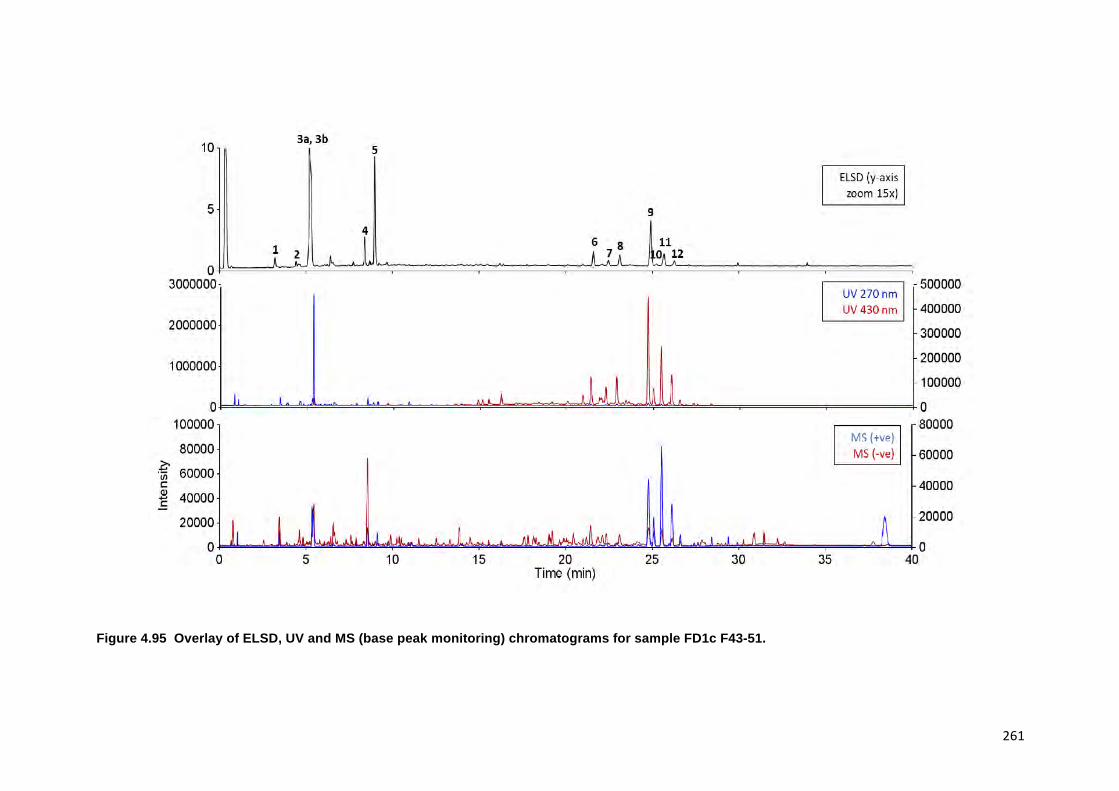
261
Figure 4.95 Overlay of ELSD, UV and MS (base peak monitoring) chromatograms for sample FD1c F43-51.

262
Table 4.11 MSI dereplication of FD1c F43-51 sample.

263
Isovitexin
Vitexin
Brosimacutin A
Figure 4.96 The chemical structure of isovitexin, vitexin and brosimacutin A.
O
OHO
OHO
HOOH
OHOH
OH
O
OHO
OH
OHHO
HOOH
O
OH
O
O
OH
HO
OH
HO

264
4.1.12.2.2 UHPLC-MS analysis of FD2c F29-33 and FD2c F34-36 fractions
FD2c F29-33 and FD2c F34-36 were active against PC3 cancer cell
lines with GI50 values of 28 µg/mL and 24 µg/mL respectively. The UHPLC-
MS-ELSD-PDA chromatogram in Figure 4.97 shows 6 peaks. For FD2c F29-
33, 4 major peaks were detected - peak 1 is similar to peak 3 - at tR 24.15
(peak 2), tR 24.42 (peak 3), tR 25.87 (peak 4) and tR 31.59 (peak 6). These
peaks correspond to 21.07% (peak 3 + peak 1), 20.09% (peak 2), 34.40%
(peak 4), and 31.59% (peak 6) of total mass respectively. ESIMS data shows
that these peaks gave accurate masses of 457, 425, 427 and 443 respectively
and were dereplicated as Oleanolic acid, Lupenone, Lupeol, Moretenol, and
Betulin (Figure 4.98).
For FD2c F34-36 fraction, 2 major compounds were dereplicated as
Oleanolic acid - at tR 24.42, which correspond to 73.33% (peak 1 + peak 3) of
total mass - and Lupenone at tR 24.15, and tR 27.77 - which correspond to
18.65% of total mass. Both Oleanolic acid and Lupenone gave accurate
masses of 457 and 425 respectively according to the ESIMS data (Table
4.12).

265
Figure 4.97 Overlay of ELSD, UV and MS (base peaks monitoring) chromatograms for samples FD2c F29-33 and FD2c F34-36.

266
Table 4.12 MSI dereplication of FD2c F29-33 and FD2c F34-36 samples.
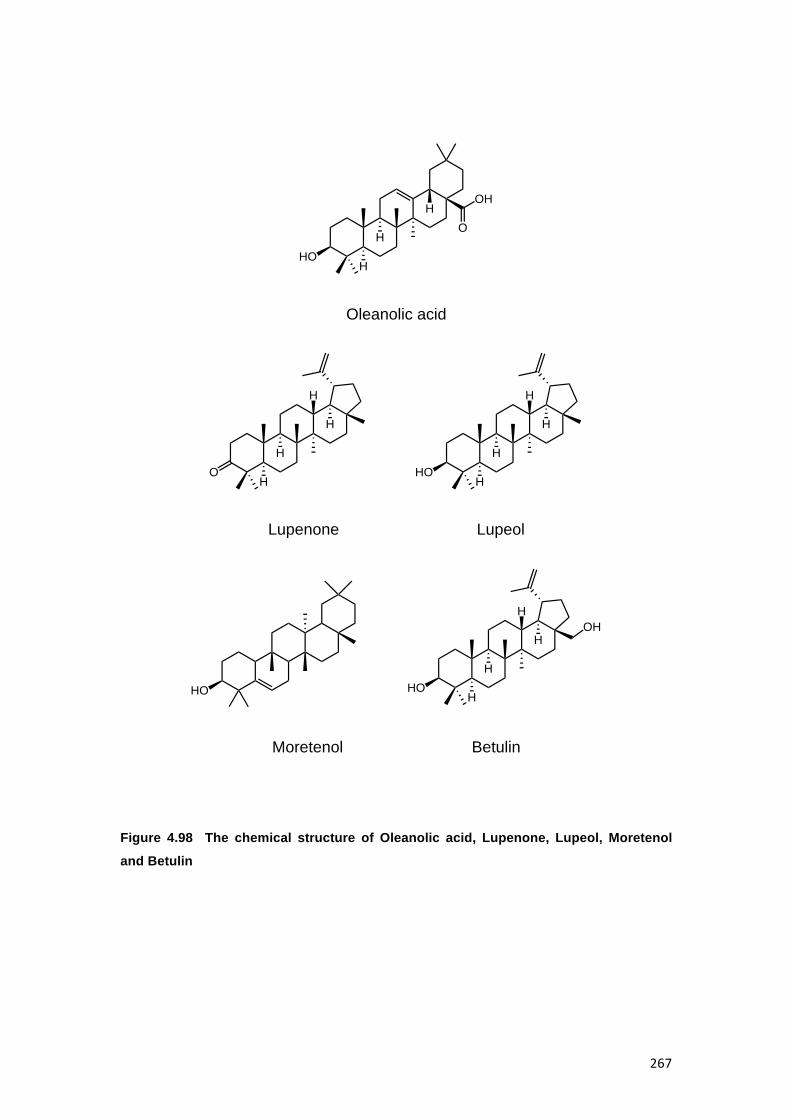
267
Oleanolic acid
Lupenone Lupeol
Moretenol Betulin
Figure 4.98 The chemical structure of Oleanolic acid, Lupenone, Lupeol, Moretenol
and Betulin
HOH
HO
OH
H
H
H
H
OH
H
H
H
HOH
HO HOH
OHH
H
H

268
4.1.12.3 Anti-proliferative activity of dereplicated compounds
Previously, LC-MS dereplication has identified isovitexin in the active
fraction of FD1c and oleanolic acid, betulin, and lupeol in the active fractions
of FD2c. This study was conducted to evaluate the cytotoxic activity of the
individual compounds identified through LC-MS dereplication method. SRB
staining assay was used for the purpose of this study.
Table 4.13 shows the GI50 of each compound. LC-MS dereplication
has identified isovitexin as one of the major compound in the active fraction of
FD1c, however the GI50 value for isovitexin is significantly (P< 0.05) higher
than its respective active fraction (GI50 = 12 µg/ml). Similar findings were
observed with the GI50 values for oleanolic acid, betulin and lupeol, which
were identified through LC-MS dereplication of the active fractions of FD2c.
The GI50 values for each of these compounds were significantly (P< 0.05)
higher than their respective active fractions (FD2c F29-33 = 28 µg/ml, FD2c
F34-36 = 24 µg/ml). These results indicated that the active fractions of both
FD1c and FD2c were more cytotoxic against PC3 cells than each of these
individual compounds.
In the case of FD1c, even though isovitexin was identified as the major
compounds in the active fraction, lower cytotoxic activity of the compound
against PC3 cells might suggest that the other minor compounds such as
brosimacutin and aurone flavonoids might have contributed to the more potent
cytotoxic activity of the active fraction. In the active fractions of FD2c,
oleanolic acid, betulin, and lupeol were dereplicated as the major compounds
in the active fraction. However, as mentioned earlier, none of these individual
compounds were shown to have better cytotoxic activity than their respective
active fractions. Once again, this could suggest that the more potent cytotoxic
activity of the active fractions of FD2c might be due to the additives or
synergistic effects of the compounds identified in the plant.

269
Table 4.13 GI50 concentrations (µg/mL) of the compounds identified through LC-MS
dereplication determined for PC3 cells as assessed by SRB assays after 72 hours. Each result was obtained in three independent experiments, which was run in
triplicate.
Compound Source of Identification GI50 (µg/ml) with PC3 cells
Isovitexin FD1c 43
Oleanolic Acid FD2c 34
Betulin FD2c 47
Lupeol FD2c 36
Table 4.14 and Table 4.15 below summarize all the investigations that
have been carried out for both the active extracts and the active fractions of
both Marantodes pumilum and Ficus deltoidea plants in this project.

270
Table 4.14 Summary of all the investigations carried out using the active extracts of Marantodes pumilum (n-hexane and chloroform) and Ficus
deltoidea (chloroform) plants. ‘é ’ Increased, ‘ê ’ Decreased ‘+’ characteristic detected, and ‘−‘ characteristic not detected
Assay/Sample MPc MPh FD1c FD2c
Morphological observation
(Characteristics of
apoptosis or necrosis)
Apoptosis (+)
Necrosis (−)
Apoptosis (+)
Necrosis (−)
Apoptosis (+)
Necrosis (−)
Apoptosis (+)
Necrosis (−)
DAPI staining Apoptotic cells visible Apoptotic cells visible Apoptotic cells visible Apoptotic cells visible
Annexin V-FITC
fluorocytometric analysis
é Number of cells in
early apoptosis
é Number of cells in
early apoptosis
é Number of cells in
early apoptosis
é Number of cells in
early apoptosis
Mitochondrial membrane
potential (MMP)
depolarization analysis
é MMP
depolarization
é MMP
depolarization
é MMP
depolarization
é MMP
depolarization
Detection of Caspase 3/7 é production of
Caspases 3/7
é production of
Caspases 3/7
éproduction of
Caspases 3/7
é production of
Caspases 3/7
Nuclear DNA
fragmentation analysis
+ + + +
’
Apop
tosi
s
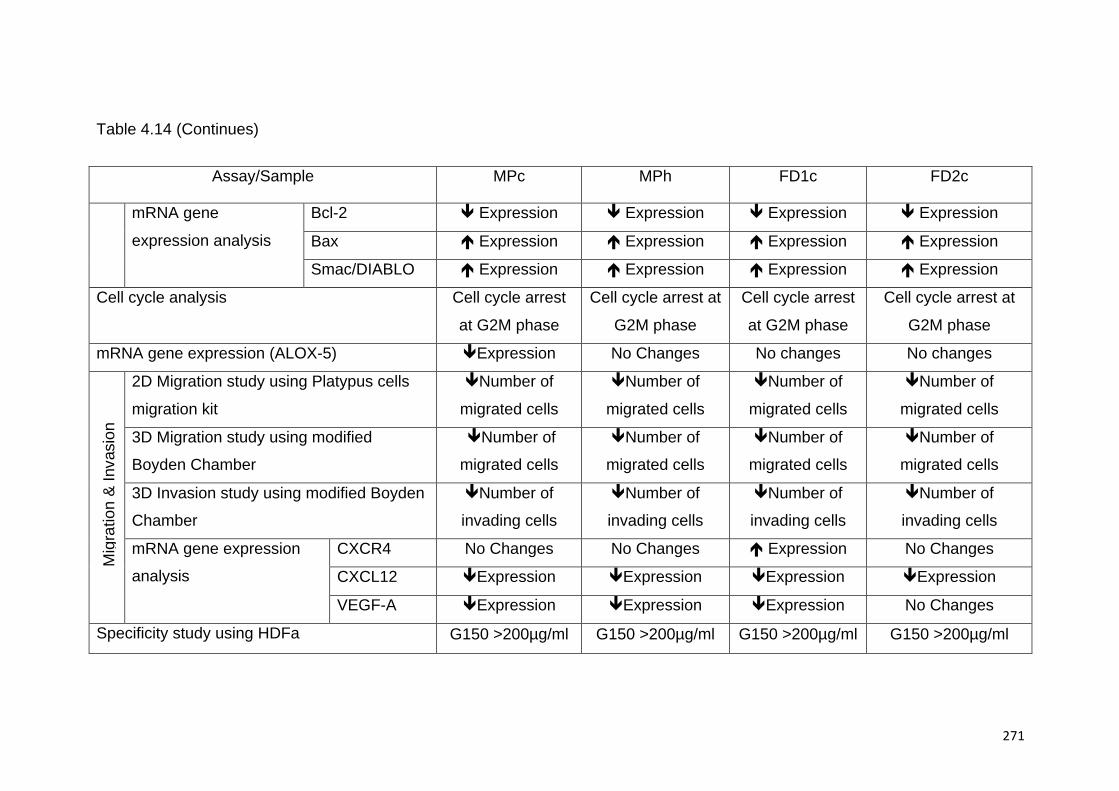
271
Table 4.14 (Continues)
Assay/Sample MPc MPh FD1c FD2c
mRNA gene
expression analysis
Bcl-2 ê Expression ê Expression ê Expression ê Expression
Bax é Expression é Expression é Expression é Expression
Smac/DIABLO é Expression é Expression é Expression é Expression
Cell cycle analysis Cell cycle arrest
at G2M phase
Cell cycle arrest at
G2M phase
Cell cycle arrest
at G2M phase
Cell cycle arrest at
G2M phase
mRNA gene expression (ALOX-5) êExpression No Changes No changes No changes
2D Migration study using Platypus cells
migration kit
êNumber of
migrated cells
êNumber of
migrated cells
êNumber of
migrated cells
êNumber of
migrated cells
3D Migration study using modified
Boyden Chamber
êNumber of
migrated cells
êNumber of
migrated cells
êNumber of
migrated cells
êNumber of
migrated cells
3D Invasion study using modified Boyden
Chamber
êNumber of
invading cells
êNumber of
invading cells
êNumber of
invading cells
êNumber of
invading cells
mRNA gene expression
analysis
CXCR4 No Changes No Changes é Expression No Changes
CXCL12 êExpression êExpression êExpression êExpression
VEGF-A êExpression êExpression êExpression No Changes
Specificity study using HDFa G150 >200µg/ml G150 >200µg/ml G150 >200µg/ml G150 >200µg/ml
Mig
ratio
n &
Inva
sion

272
Table 4.15 Summary of all the investigations carried out using the active fractions of Marantodes pumilum and Ficus deltoidea plants. ‘é ’
Increased, ‘ê ’ Decreased and ‘NA’ Not Available
.
Assay/Samples MPc F30-33 FD1c F43-51 FD2c F29-33 FD2c F34-36
mRNA gene
expression analysis
Bcl-2 êExpression NA NA NA
Bax é Expression NA NA NA
Smac/DIABLO é Expression é Expression é Expression é Expression
ALOX-5 êExpression
mRNA gene
expression analysis
CXCR4 No Changes No Changes No Changes No Changes
CXCL12 êExpression êExpression êExpression êExpression
VEGF-A êExpression êExpression No Changes No Changes
Specificity study using HDFa G150 >100µg/ml G150 >200µg/ml G150 >200µg/ml G150 >200µg/ml
Mig
ratio
n &
Inva
sion
Ap
opto
sis

273
4.2 Discussions
Approximately 90% of androgen-dependent prostate cancer is detected
in the local and regional stages, therefore the cure rate is very high as nearly
100% of men diagnosed and treated at this stage will be disease free after 5
years. However, many men die as therapy eventually fails when the disease
progresses to androgen-independent stage (Feldman and Feldman 2001).
This stage of prostate cancer is lethal and has the ability to progress and
metastasize. At present, there is no effective therapy that can be used for
men diagnosed with androgen-independent prostate cancer. There is a need
for chemopreventive products targeting middle-aged men in my country. This
is because treatment results are not sustainable for the local health system,
which does not cover all the population. Developing such a product from
traditional Malay medicinal plants would facilitate better compliance among
Malaysian patients as the use of traditional plants and herbs are culturally
embedded into the local lifestyle.
The three plants chosen for this study - namely Marantodes pumilum
(Blume) Kuntze (synonym Labisia pumila var. pumila), Ficus deltoidea var.
angustifolia (Miq.) Corner and Ficus deltoidea Jack var. deltoidea - have
shown promising cytotoxicity in a preliminary screening conducted at the start
of this study. In natural product research, crude extracts showing a GI50 value
of less than 100 µg/mL can be considered to be cytotoxic and selected for
further studies, with the most promising ones are those with a GI50 lower than
30 µg/mL (Ab Shukor, Merrina et al. 2008). In the preliminary screenings,
three different cell lines have been used (PC3, DU145 and LNCaP) - each
representing a different stage of prostate cancer: LNCaP cancer cell line
represents the androgen-dependent prostate cancer whereas PC3 and
DU145 cancer cell lines represent the androgen-independent prostate cancer
(Shafi, Yen et al. 2013). For mechanistic studies, our main focus turns onto
PC3 cells, which is a type of androgen-independent prostate cancer cell
overexpressing ALOX-5, thus allowing for the measurement of a wider array
of potential targets.

274
From my investigations, the data collected has shown that all of the
active plant extracts and their respective fractions were cytotoxic against all
three types of prostate cancer cell lines - including PC3 with a very low GI50
value. Al-Mekhlafi, Shaari et al. (2012) described the anti-proliferative
properties of Marantodes pumilum extracts against prostate cancer cells lines.
Here, the mechanistic details of such property are characterised in detail: the
active plant extracts induce apoptosis in PC3 cells via the intrinsic pathway,
as evidenced by the significant activation of caspases 3 and 7. This activation
is mediated –at least in part- by their ability to affect the mRNA gene
expression of Bax, Bcl-2, and Smac/DIABLO. These genes are responsible
for the production of their respective proteins, which play an important role in
the intrinsic pathway of apoptosis as depicted in Figure 4.99.
Figure 4.99 Effects of active plant extracts on the intrinsic pathway of apoptosis

275
However, MPc is also able to induce PC3 cell death via apoptosis in an
alternative way, namely the inhibition of mRNA gene expression of ALOX-5,
which is responsible for the production of LOX-5 enzyme. According to Ghosh
and Myers (1997), the inhibition of 5-LOX would block the production of its
metabolites triggering apoptosis in this prostate cancer cell line. In PC3 cells
treated with the active extracts of the plants, the cell population in the G0/G1
phase was reduced, whereas cell population in the G2/M phase was
increased significantly when compared to the untreated PC3 cells. These data
implied that the active plant extracts induced cell cycle arrest at G2/M phase.
Many other studies using compounds isolated from plants have reported a
similar activity in other types of cancer cell lines including prostate cancer,
where they exhibited an anti-proliferative activity such as: 8-O-β-
glucopyranoside isolated from Rumex japonicus Houtt against A549, (human
lung cancer cells) (Xie and Yang 2014); Scrophularia striata against Jurkat
tumor cells (T cell leukaemia) (Azadmehr, Hajiaghaee et al. 2013); and
Solanum nigrum against PC3 (prostate cancer cells) (Nawab, Thakur et al.
2012). Cell cycle arrest enables DNA repair to occur, thus preventing
replication of the damaged templates (Murray 2004) and cell cycle arrest
specifically at the G2M phase serves to prevent the cells from entering the
mitosis (M) phase with damaged genomic DNA.
In this study, all anti-proliferative plant extracts (MPc, FD1c and FD2c)
were observed to have significant inhibitory effect on the migration and
invasion of PC3 cancer cell lines. Further mechanistic studies showed that the
active plant extracts and their respective fractions (MPc F30-33, FD1c F43-
51, FD2c F29-33 and FD2c F34-36) were able to inhibit both PC3 cells
migration and invasion by modulating the CXCR4, CXCL12 and VEGF mRNA
gene expression. Recently, increasing evidence indicate that tumor
microenvironment including tumor-stromal cells interactions have a crucial
role in tumor initiation and progression (Guo, Wang et al. 2015). Singh, Singh
et al. (2004) reported that CXCL12-CXCR4 interactions were able to modulate
prostate cancer cell migration and invasion. CXCL12 is a type of chemokines
that bind to and activate a family of chemokine receptors (Vindrieux, Escobar

276
et al. 2009). CXCR4 is a type of chemokine receptor that consists of seven-
transmembrane receptors coupled to G protein (Ransohoff 2009). CXCL12
and chemokine receptors CXCR4 and CXCR7, are the key factors that link
between cancer cells and their microenvironment. Functional CXCR4 was
reported to be expressed by prostate cancer cell lines PC3 and LNCaP, as
well as normal prostate epithelial cells (PrEC). However, significantly higher
levels of CXCR4 were observed in the malignant cell lines such as PC3 and
LNCaP compared to the normal prostatic epithelial cells. Previous studies
conducted by Singh, Singh et al. (2004) shows that the number of malignant
prostate cancer cell lines that migrated in response to CXCL12 was
significantly higher than for cells not exposed to CXCL12 as chemoattractant.
Therefore, interruption to the level of CXCL12 and disruption to CXCL12-
CXCR4 litigation could possibly lead to the inhibition of prostate cancer cells
migration and invasion. All the active extract of the plants and their respective
fractions were able to down-regulate the CXCL12 mRNA gene expression
significantly. This might lead to the fall of the production of CXCL12
chemokines and thus inhibiting both PC3 cells migration and inhibition.
However, none of them were able to have any significant effect on the
expression of CXCR4.
Even though not all of the active extracts of the plants show any
significant effects on the mRNA gene expression of VEGF, two of the active
fractions namely MPc F30-33 and FD1c F43-51 had shown significant
inhibition to the expression of the gene. Vascular endothelial growth factor
(VEGF) is known to be a critical regulator of endothelial cell migration by
increasing endothelial cell permeability, stimulating proliferation, and
promoting migration of phosphatidylinositol-3-kinase and the small GTPase
Rac-1 (Soga, Connolly et al. 2009). Apart from that, VEGF also play a very
important role in the formation of new blood vessels from pre-existing
capillaries and venules - a process called angiogenesis. Overexpression of
VEGF is normally seen in cancer cells, as it is vital to help create the
microenvironment that would promote the growth of the cells. Therefore, by

277
reducing the expression of VEGF, the production of its protein will be
decreased and thus creating a microenvironment that is not suitable for the
cancer cells to migrate or invade.
Despite the cytotoxic effects of all the active plant extracts and their
respective fractions on prostate cancer cell lines, they showed specific
selectivity when tested with normal human dermal fibroblast cells (HDFa).
Extracts from these plants have been reported to be cytotoxic towards other
cancer cell lines but we cannot surmise from the available reports if these
extracts show any specific potency to one of them.
Bioguided isolation of MPc F30-33 revealed that the 5-alkylresorcinol
MP-1 was responsible for the cytotoxicity against PC3 prostate cancer cell
lines. Al-Mekhlafi, Shaari et al. (2012) isolated two similar cytotoxic
compounds against the same cell lines. They were identified as 1-O-methyl-6-
acetoxy-5-(pentadec-10Z-enyl)resorcinol and 1-O-methyl-6-acetoxy-5-
pentadecylresorcinol (see Figure 2). However, they did not study their
mechanism of action (Al-Mekhlafi, Shaari et al. (2012). Thus, this is the first
time a report on the mechanisms of the cytotoxic activity against prostate
cancer cell line (PC3) of an alkenylresorcinol isolated from Marantodes
pumilum. The activity of alkylresorcinol was first described by Anderson,
David et al. (1931), after extracting and isolating them from Ginkgo biloba.
More alkylresorcinols were subsequently isolated from higher plants and also
from bacteria, fungi, algae and mosses (Kozubek and Tyman 1999,
Zarnowski, Suzuki et al. 2000).
Alkylresorcinol compounds have been reported to show anti-parasitic,
anti-fungal, anti-microbial, anti-oxidants, and anti-cancer effects. Their various
biological activities have been reviewed comprehensively by Kozubek and

278
Tyman (1999). The cytotoxic activity of 5-alkylresorcinol compounds on
cancer cell lines have been reported on several studies previously such as
breast (Chuang and Wu 2007), colon (Al-Mekhlafi, Shaari et al. 2012),
leukemia (Arisawa, Ohmura et al. 1989), prostate (Chuang and Wu 2007, Al-
Mekhlafi, Shaari et al. 2012), liver (Filip, Anke et al. 2002) and human
squamous carcinoma (Buonanno, Quassinti et al. 2008). In this study we have
shown that MP-1 induced prostate cancer cell death via apoptosis instead of
necrosis.
In 2008, a resorcinolic lipid known as Climacostol, which is a natural
toxin isolated from the freshwater ciliated protozoan Climacostomum virens. It
effectively inhibits the growth of two tumor cell lines, human squamous
carcinoma (A431 cells) and human promyelocytic leukaemia (HL60 cells), in a
dose-dependent manner by inducing apoptosis (Buonanno, Quassinti et al.
2008). Another study conducted by Barbini, Lopez et al. (2006) showed that
after 24 hours of treatment with 5-alkylresorcinol, the hepatocellular
carcinoma cell lines showed the typical morphological characteristics of
apoptosis, DNA fragmentation and condensed and fragmented nuclei.
Arisawa, Ohmura et al. (1989) has reported the relationship between the
cytotoxicity to KB cells and the number of carbon of the side chain of an 5-
alkylresorcinol and according to this report, the cytotoxic activity was
positively correlated with the number of carbons of the side chain - increasing
from 5 to 13; longer side chains becoming detrimental to the effect. The same
report also concluded that hydroxylation at C1 and C3 carbons was a
structural requirement to enhance the cytotoxicity towards cancer cell lines.
Both C1 and C3 in MP-1 are hydroxylated. Of note, we have also
demonstrated that MP-1 inhibits both prostate cancer cell migration and
invasion. No similar report has been found after extensive literature search.
Therefore, this is the first time such activity has been documented for this
class of compound. MP-1 maybe used as marker for future standardization of
the extract and developed as nutraceuticals. However, before the
standardized active extracts could reach the market for human consumption,

279
they will have to go through different phases of development depending on
the regulatory requirements as mentioned in section 2.3.2. The development
of MP-1 as a chemoteraphy drug for prostate cancer would have to follow the
multiple phases set for drug development.
The LC-MS dereplication of active fractions of Ficus spp. identified
isovitexin in FD1c F43-51; oleanolic acid, moretenol, betulin, lupenone, and
lupeol in FD2c F29-33; and oleanolic acid, and lupenone in FD2c F34-36.
Both isovitexin and moretenol have been previously reported to be isolated
from Ficus deltoidea (Bunawan, Amin et al. 2014). However, this is the first
time that oleanolic acid, betulin, lupenone, and lupeol are identified in this
species. Oleanolic acid has been identified in Ficus microcarpa (Ao, Li et al.
2008), Ficus hispida Linn (Joseph and Raj 2011), and Ficus nervosa (Chen,
Cheng et al. 2010). Betulin was identified in Ficus foveolata (Somwong,
Suttisri et al. 2013), Ficus racemosa (Bopage), and Ficus carica L. (Oliveira,
Baptista et al. 2012). Lupenone was identified in Ficus pseudopalma (Ragasa,
Tsai et al. 2009), Ficus microcarpa (Kuo and Lin 2004), and Ficus sycomorus
(Ahmadu, Agunu et al. 2007). While, lupeol has been previously identified in
Ficus pseudopalma Blanco (Santiago and Mayor 2014), Ficus odorata (Tsai,
De Castro-Cruz et al. 2012), and Ficus polita Vahl (Kuete, Kamga et al. 2011).
All compounds have been reported to show cytotoxic activity against
cancer cell lines (Hwang, Chai et al. 2003, Peng, Fan et al. 2006, Jung, Kim
et al. 2007, Chaturvedi, Bhui et al. 2008, Yan, Huang et al. 2010). Despite
this, only lupeol (Saleem 2009), oleanolic acid (Deeb, Gao et al. 2010) and
betulin (Chintharlapalli, Papineni et al. 2007) were reported to have cytotoxic
activity against prostate cancer cell lines. We added to this list for the first
time, isovitexin, as one of the compound that play an important role in the
cytotoxic activity of Ficus deltoidea var. augustifolia against prostate cancer
cell line. This study also suggests that, moretenol and lupenone showed
cytotoxic activity against prostate cancer cell lines. Deeb, Gao et al. (2010)

280
also claimed that oleanolic acid was able to inhibit growth and induce
apoptosis in prostate cancer cells. Apart from that, another report by Saleem,
Kweon et al. (2005) stated that lupeol induced cell death via apoptosis in
androgen-sensitive prostate cancer cells. A study conducted by Liu, Bi et al.
(2016) demonstrated that lupeol inhibited gallbladder carcinoma cell invasion
by suppressing the EGFR/MMP-9 signaling pathway. However this study
showed that FD1c and FD2c were able to inhibit both prostate cancer cell
migration and invasion by modulating the VEGF-CXCR4-CXCL12 axis. None
of the compounds identified through the dereplication of FD1c and FD2c were
reported previously to show similar activity. However in this study only
differential mRNA gene expression of CXCR4, CXCL12 and VEGF-A was
carried out. Further investigations are needed to validate the findings. These
include western blotting and proteomic studies. Western blot study for
example will give information about the expression of the proteins linked with
CXCR4, CXCL12 and VEGF-A genes (Mahmood and Yang 2012).
The findings reported in this study establish a pharmacological
rationale and inform standardization methods to develop active extracts from
the two selected Malaysian Ficus deltoidea varieties into nutraceutical
applications that may be used as chemopreventives for prostate cancer. Here
the complexity and lack of novelty in chemical terms preclude any drug
development efforts.

281
Chapter 5
Conclusions and Future Work

282
5 Conclusions and Future Work
5.1 Conclusion
This study was conducted to investigate the potential of two species of
plants from Malaysia namely Marantodes pumilum (Blume) Kuntze (synonym
Labisia pumila var. pumila) and Ficus deltoidea L. against the growth of
prostate cancer cells. In order to achieve this objective, this study has been
divided into 3 major parts; 1) In vitro mechanistic studies using PC3 prostate
cancer cell lines, 2) Characterisation of the active extracts, bioguided isolation
and identification of bioactive compounds from the plants and 3) Effects of
cytotoxic fractions and principles on 2D migration and 3D invasion.
Firstly, this work has thoroughly characterized the in vitro mechanisms
by which the selected plants have a potential chemopreventative effect
against prostate cancer. The in vitro cytotoxic activity against both androgen
dependent (LNCaP), and non-androgen dependent (DU145 and PC3) human
prostate cancer cell lines. This activity is concentrated in the chloroform
extracts. The cytotoxic activity was 5 to 10 times more selective towards
prostate cancer cells when compared to normal human fibroblasts. Because
the non-androgen dependent prostate cancer is nowadays lacking efficient
clinical management we decided to carry out mechanistic studies using the
highly malignant PC3 cell line. It is now evident that all act by inducing
mitochondria-driven (intrinsic pathway) apoptosis characterized by Annexin V
expression, MMP depolarization, activation of caspases 3 and 7, and cell
cycle arrest at G2/M phase, thus leading to nuclear DNA fragmentation and
cell death. The extracts specifically modulate the expression of Bax, Bcl-2,
and Smac/Diablo genes, which encode the respective proteins, which
together will cause mitochondrial membrane permeabilization, thus
compromising cell viability. Additionally, MPc is able to down-regulate the

283
Alox-5 mRNA gene expression. It is known that PC3 cells are highly
dependent on Alox-5 activity (biosynthesis of leukotrienes) for survival.
Secondly, this study has revealed that the PC3 prostate cancer cells
inhibitory activity of Marantodes pumilum (Blume) Kuntze (MP) is mainly due
to the presence of a 5-alkenyl resorcinol. Therefore, this is the first time a
report on the mechanism of the cytotoxic activity against prostate cancer cell
lines (PC3) of an alkenylresorcinol isolated from Marantodes pumilum.has
been produced.
In the case of Ficus deltoidea var. angustifolia (FD1) the active fraction
is rich in flavonoids such as isovitexin. In the case of Ficus deltoidea var.
deltoidea (FD2), the active fraction consists of a mixture of terpenes including
oleanolic acid, moretenol, betulin, lupenone and lupeol. This is the first time
that oleanolic acid, betulin, lupenone, and lupeol were identified in this plant
species. In addition, no other report has demonstrated the important role
played by isovitexin in the cytotoxic activity of Ficus deltoidea var. augustifolia
against prostate cancer cell line. Regardless the phytochemical differences,
both active fractions are able to modulate the expression of Bax, Bcl-2, and
Smac/Diablo genes, thus mirroring the crude extracts mechanism of action.
However, we cannot rule out that other fractions may also contribute to the
overall pro-apoptotic effect of the crude and/or chloroform extract without
being endowed with significant direct cytotoxic activity.
In the last part of this study, the effects of cytotoxic extracts on 2D
migration and 3D invasion were tested by exclusion assays and modified
Boyden chamber, respectively. All active plant extracts inhibited both
migration and invasion of PC3 cells (MPc; P<0.01, FD1c and FD2c; P<0.05).
These effects were accompanied by a very significant down-regulation of both

284
VEGF-A and CXCL-12 gene expressions but not CXCR4 by 2 of the active
plant extracts (MPc, and FD1c) and all of their active fractions (MPc F30-33
and FD1c F43-51) respectively. These results, for the first time, have
demonstrated that MP-1, FD1c and FD2c were able to inhibit both prostate
cancer cells migration and invasion. For the case of MP-1, this is the first time
such activity has been documented for this class of compound. The
modulation of the CXCL12-CXCR4 axis plays important role in cancer cells
metastasis whilst inhibition of the VEGF-A gene expression could eventually
impair cancer cells angiogenesis. However, since only differential mRNA
genes expression study was conducted that lead to these findings, more
investigations including western blotting and proteomic studies need to be
carried out in order to validate and confirm the findings.
In summary, evidence gathered in this study suggests a role for
interaction of MPc, FD1c and FD2c in three of the Hallmarks of Cancer in PC3
cells; apoptosis by activating of the intrinsic pathway, inhibition of both
migration and invasion by modulating the CXCL12-CXCR4 axis, and inhibiting
angiogenesis by modulating VEGF-A expression. The promising results seen
in this study warrant further investigation of these plants for a role in the
treatment of prostate cancer.
5.2 Future Work
The findings from this study shows promising potential for the
development of herbal preparations for prostate health. To this end no further
work would be needed because food supplements are not regulated as
medicines and only reasonable safety data needs to be provided. However
from a manufacturing point of view more work needs to be done to
understand if the plants are consistently synthesizing the phytochemicals
profile that is involved in the cytotoxic activity year after year and if their
geographical precedence is influencing it.

285
Second, from an academic point of view, it would be highly interesting to
see if our in vitro data would translate into in vivo effects as it is by no means
a good representative of how complex the cells in the human body worked. In
vitro models do not take into account the interactions that occur when cells go
through the oncogenic and metastatic process. Therefore, the use of in vivo
model is very important as cancer cell lines do not and cannot recapitulate the
disease processes that occur in living tissues. Mouse and mice models are
often used for prostate cancer research. Significant reduction of the tumor
size is expected after the treatment with the bioactive compounds from
Marantodes pumilum (Blume) Kuntze (synonym Labisia pumila var. pumila)
and Ficus deltoidea L. plants.
Third, the use of Next Generation Sequencing-based approaches have
become very popular recently in the field of medicine. NGS-based
approaches have been used in genetic diagnosis, building disease network,
pharmacogenomics and drug discovery. One of the predominant use of NGS
is by using its RNA-sequencing platform to profile gene expression levels in
normal or mutant cells and identify differentially expressed transcripts among
group of samples. NGS could also be used to investigate the effect of plant
extracts or their active principle on the gene expression profile in specific cells
or tissues.
Lastly, it is not yet known whether the identified/dereplicated active
principles do directly interact with the therapeutic targets described in this
thesis as being the basis of the pro-apoptotic effects of the extracts and
fractions.

286
5.2.1 Future Phytochemical studies of the plants
The plant materials used in this study were mostly collected from farms
in southern Malaysia. Since these plants also grow wildly in different parts of
the country, it is also interesting to conduct a study, which involves the
collection of similar plant materials that grow in the wild or in farms from
different part of Malaysia. This study is important as we can develop complete
phytochemical profiles, make comparison of these profiles and gain better
understanding on the distribution of the phytochemicals available in these
plants and whether they are affected by external factors such as locations,
weather conditions or the way they are planted.
In Malaysia, Marantodes pumilum and Ficus deltoidea plants can be
found growing wildly in the lowland and hill forests at an altitude of 300 to 700
meters in several states such as Kedah, Perak, Negeri Sembilan, Johor,
Pahang, Terengganu and Kelantan. In the last 5 years, some local
biotechnology companies have started to do contract farming for several well-
known plant species in Malaysia including Marantodes pumilum and Ficus
deltoidea. These agricultural lands or farms are located in different part of
peninsular Malaysia including Desaru, Kota Tinggi, Parit Raja, and Dungun. In
this study, plant samples will be collected from different part of Malaysia for
both farmed and wildly growing plants. These plant samples will be dried and
extracted using the same method before phytochemical profiles analysis is
carried out using HPLC and mass spectrometry. This analysis will provide
vital information regarding the distribution of phytochemicals available in the
plant and whether the ways they are planted or geographical location affect
the profiles. In addition, this study would also tell us whether the plants are
consistently synthesizing the phytochemicals involved in the cytotoxic activity
year after year and if their geographical precedence is influencing it.

287
5.2.2 In vivo study using Prostate cancer xenograft model
As mentioned earlier, in vivo study is a very important step in drug
discovery. Data from this thesis shows the promising in vitro activity of the
plant extracts, therefore in vivo study using a suitable model must be carried
out to see the effect of the active plant extracts on a more complicated
organism model such as mice. Non-obese diabetic severe combined
immunodeficiency (NOD-SCID) mice (males; 6–8 weeks old; body weight,
23–25 g) will be chosen and are bred in the animal facility at Universiti Sains
Malaysia, housed in sterile micro-isolator cages under specific pathogen-free
conditions with controlled temperature (20–21 °C) and humidity (50–60%).
Daily light cycles will be regulated with 12 hours light and 12 hours dark.
Cages will be completely changed once or twice a week. Animals are handled
under sterile conditions. The maximum tolerated dose of the plant extracts will
be determined using conventional methodology. Animal care and experiments
will be carried out in accordance with the guidelines of the Universiti Sains
Malaysia ethical and animal care council.
The mice used in this experiment will be transplanted with the LTL-
313H, PTEN-deficient, metastatic and PSA-secreting, patient-derived prostate
cancer tissue line (Choi, Gout et al. 2012) and maintained as grafts under
renal capsules of male NOD-SCID mice supplemented with testosterone
(Watahiki, Wang et al. 2011). Tumors will be harvested 10 weeks after
grafting and pieces of tumor tissue (2.5 × 2.5 × 1.25 mm3) are grafted under
the renal capsules of 36 testosterone-supplemented male mice (6 groups; 6
mice/group; 4 grafts/mouse). The grafts are expected to have 100%
engraftment rate with an average tumor volume doubling time of 13–15 days.
The rise in the plasma PSA levels of the mice will be used as an indicator for
tumor growth. When the level of plasma PSA reaches 12 ng PSA/ml, i.e.
equivalent to tumor volumes of 30–50 mm3, the mice will be randomly
distributed into 6 groups and treated with the active plant extracts orally. The
mice will be euthanized after 3 weeks and tumor volumes will be measured
using callipers and tissue sections prepared for histopathological analysis.

288
Tumor growth of treated animals relative to untreated animals will be used as
a measure of antitumor activity using the following formula;
T/C = (treated tumor volume3wks − treated tumor volume0wks):(control tumor
volume3wks – control tumor volume0wks) × 100%, with T/C > 0 indicating tumor
growth and T/C < 0 indicating tumor shrinkage. Tumor growth
inhibition = 100% − T/C.
5.2.3 Transcriptomics using Next Generation Sequencing (NGS)
Next generation sequencing-based transcriptome analysis (RNA
sequencing) has enabled the profiling of global patterns of expression of
distinct RNA species including mRNA, miRNA, IncRNA and tRNA. These
RNA species are important as they perform unique functions in a cell or tissue
during the development of disease or pathogenesis (Chaitankar, Karakülah et
al. 2016). A process called temporal transcriptome, which involved the
profiling of normal and mutant cells, could help in identifying genetic changes
that lead to cellular dysfunction and elucidate gene networks associated with
homeostasis and disease (Lander 2011). Dramatic reduction in cost and
increased throughput of screening has led to the widespread use of NGS in
genomic analysis.
The use of NGS technology to profile gene expression level and
identify differentially expressed transcripts among group of samples could
provide important information about the effect of a certain drug or plant
extracts on the gene expression in normal or mutant cells. The genomic data
collected from NGS will lead to systemic level approaches for quantitative
analysis of the dynamic interplay of molecules within a specific cells or
tissues. With this in mind, we have collaborated with UCL Genomic to use the
Illumina MiSeq facility available at their disposal to investigate the effect of the
active plant extracts on the gene expression profile in PC3 cells. Table 5.2

289
below showed the results for the differential gene expression in PC3 cells
when cells treated with MPc was compared with untreated cells (Control).
Figure 5.1 showed the MA plot where Robust Multiarray Average (RMA)
normalized data of all the possible comparisons between the pairwise log2
intensities of the samples. This study will be completed once the effect of the
active principles, which are isolated and identified in the plant, on the gene
expression profile in PC3 has been done in the future. This study will be
carried out in collaboration with Malaysia Genome Institute and once the
study is completed the results will be published as soon as possible.
Table 5.1 Differential gene expression in PC3 cells analysed using Illumina MiSeq RNA
sequencing
Annotation Gene Count 26,364
Assessed Gene Count 12,710
Differentially Expressed Gene Count 9,238
Figure 5.1 MA plot showing the RMA normalised data of all the possible comparisons
between the pairwise log2 intensities of the samples

290
5.2.4 In silico studies of selected phytochemicals
We have characterised for the first time, the mechanism of actions that
lead to PC3 cancer cells death and inhibition of PC3 cells migration, invasion
and angiogenesis by the bioactive compounds isolated and identified from
MP, FD1 and FD2 plants through in vitro mechanistic studies. However, we
have yet to characterize the interactions between the active compounds with
the therapeutic targets. The effects of these compounds are normally initiated
by direct interactions with target proteins. In silico docking techniques can be
used to generate a three-dimensional (3D) structure of the protein and
investigate their interactions at molecular level. Docking software such as
Autodock, GOLD and Glide can be used for this study (Verdonk, Cole et al.
2003, Friesner, Murphy et al. 2006, Morris, Huey et al. 2009). This will enable
us to understand the complementarity at the molecular level of a ligand
(bioactive compound) and a protein target.
These are some of the studies that need to be conducted before the
output of this study can be used for human application. Data collected from
these studies will provide more information and contribute towards future
development of these active plant extracts.

291
Chapter 6
References

292
6 References
Ab Shukor, N. A., A. Merrina, J. Stanslas and S. Subramaniam (2008). "Cytotoxic potential on breast cancer cells using selected forest species found in Malaysia." International Journal of Cancer Research 4(3): 103-109.
Abdullah, N., S. Karsani and N. Aminudin (2008). "Effects of Ficus Deltoidea Extract on the Serum Protein Profile of Simultaneously Hypertensive Rats (SHR)." Journal of Proteomics & Bioinformatics (JPB) 2: 143-143.
Abdullah, Z., K. Hussain, Z. Ismail and R. M. Ali (2009). "Anti-inflammatory activity of standardised extracts of leaves of three varieties of Ficus deltoidea." Asian J Pharm Clin Res 1(3): 100-105.
Ackermann, B. L., B. T. Regg, L. Colombo, S. Stella and J. E. Coutant (1996). "Rapid analysis of antibiotic-containing mixtures from fermentation broths by using liquid chromatography-electrospray ionization-mass spectrometry and matrix-assisted laser desorption ionization-time-of-flight-mass spectrometry." Journal of the American Society for Mass Spectrometry 7(12): 1227-1237.
Adlercreutz, H. (2002). "Phyto-oestrogens and cancer." The lancet oncology 3(6): 364-373.
Aggarwal, B. B. and S. Shishodia (2006). "Molecular targets of dietary agents for prevention and therapy of cancer." Biochemical pharmacology 71(10): 1397-1421.
Ahmadu, A., A. Agunu, J. Enhimidu, P. Magiatis and A. Skaltsounis (2007). "Antibacterial, anti-diarrheal activity of Daniellia oliveri and Ficus sycomorus and their constituents." Planta Medica 73(09): P_172.
Aiuti, A., M. Tavian, A. Cipponi, F. Ficara, E. Zappone, J. Hoxie, B. Peault and C. Bordignon (1999). "Expression of CXCR4, the receptor for stromal cell‐derived factor‐1 on fetal and adult human lymphohematopoietic progenitors." European journal of immunology 29(6): 1823-1831.
Akhir, N. A. M., L. S. Chua, F. A. A. Majid and M. R. Sarmidi (2011). "Cytotoxicity of aqueous and ethanolic extracts of Ficus deltoidea on human ovarian carcinoma cell line." Br J Med Med Res 1(4): 397-409.
Al-Ejeh, F., R. Kumar, A. Wiegmans, S. Lakhani, M. Brown and K. Khanna (2010). "Harnessing the complexity of DNA-damage response pathways to improve cancer treatment outcomes." Oncogene 29(46): 6085-6098.
Al-Mekhlafi, N. A., K. Shaari, F. Abas, R. Kneer, E. J. Jeyaraj, J. Stanslas, N. Yamamoto, T. Honda and N. H. Lajis (2012). "Alkenylresorcinols and cytotoxic activity of the constituents isolated from Labisia pumila." Phytochemistry 80: 42-49.

293
Alali, F. Q. and K. Tawaha (2009). "Dereplication of bioactive constituents of the genus hypericum using LC-(+,−)-ESI-MS and LC-PDA techniques: Hypericum triquterifolium as a case study." Saudi Pharmaceutical Journal 17(4): 269-274.
Alberts, B., A. Johnson, J. Lewis, M. Raff, K. Roberts and P. Walter (2002). Molecular Biology of the Cell, New York: Garland Science.
Albrecht, D. S., E. A. Clubbs, M. Ferruzzi and J. A. Bomser (2008). "Epigallocatechin-3-gallate (EGCG) inhibits PC-3 prostate cancer cell proliferation via MEK-independent ERK1/2 activation." Chemico-biological interactions 171(1): 89-95.
Algire, G. H. (1943). "An adaptation of the transparent-chamber technique to the mouse."
Algire, G. H., H. W. Chalkley, F. Y. Legallais and H. D. Park (1945). "Vascular reactions of normal and malignant tissues in vivo. I. Vascular reactions of mice to wounds and to normal and neoplastic transplants." Journal of National Cancer Institute 6: 73-85.
American Cancer Society, U. (2016, March 11, 2016). "Survival Rates for Prostate Cancer." Retrieved 16/2/2017, 2017, from https://www.cancer.org/cancer/prostate-cancer/detection-diagnosis-staging/survival-rates.html.
American Institute for Cancer Research (AICR). (2014). "Prostate Cancer: Facts." Retrieved 14/9/2014, from http://www.aicr.org/learn-more-about-cancer/prostate-cancer/.
Anderson, H., N. David and C. Leake (1931). "Oral Toxicity of Certain Alkyl Resorcinols in Guinea Pigs and Rabbits.∗." Proceedings of the Society for Experimental Biology and Medicine 28(6): 609-612.
Andriole, G. L., D. G. Bostwick, O. W. Brawley, L. G. Gomella, M. Marberger, F. Montorsi, C. A. Pettaway, T. L. Tammela, C. Teloken, D. J. Tindall, M. C. Somerville, T. H. Wilson, I. L. Fowler and R. S. Rittmaster (2010). "Effect of Dutasteride on the Risk of Prostate Cancer." New England Journal of Medicine 362(13): 1192-1202.
Antonarakis, E., B. Trock, Z. Feng, E. Humphreys, M. Carducci, A. Partin, P. Walsh and M. Eisenberger (2009). The natural history of metastatic progression in men with PSA-recurrent prostate cancer after radical prostatectomy: 25-year follow-up. ASCO Annual Meeting Proceedings.
Ao, C., A. Li, A. A. Elzaawely, T. D. Xuan and S. Tawata (2008). "Evaluation of antioxidant and antibacterial activities of Ficus microcarpa L. fil. extract." Food Control 19(10): 940-948.
Arisawa, M., K. Ohmura, A. Kobayashi and N. Morita (1989). "A cytotoxic constituent of Lysimachia japonica Thunb.(Primulaceae) and the structure-activity

294
relationships of related compounds." Chemical and pharmaceutical bulletin 37(9): 2431-2434.
Arora, M., S. Sharma and A. Baldi (2013). "Comparative insight of regulatory guidelines for probiotics in USA, India and Malaysia: A critical review." International Journal of Biotechnology for Wellness Industries 2(2): 51-64.
Azadmehr, A., R. Hajiaghaee and M. Mazandarani (2013). "Induction of apoptosis and G2/M cell cycle arrest by Scrophularia striata in a human leukaemia cell line." Cell Proliferation 46(6): 637-643.
Ballacchino, D. (2015). "The Prostate
." Retrieved 16/2/17, 2017, from http://prostatearteryembolization.org/prostate-artery-embolization/the-prostate/.
Barbini, L., P. Lopez, J. Ruffa, V. Martino, G. Ferraro, R. Campos and L. Cavallaro (2006). "Induction of apoptosis on human hepatocarcinoma cell lines by an alkyl resorcinol isolated from Lithraea molleoides." World journal of gastroenterology 12(37): 5959.
Barnes, P. M., E. Powell-Griner, K. McFann and R. L. Nahin (2004). Complementary and alternative medicine use among adults: United States, 2002. Seminars in integrative medicine, Elsevier.
Barreca, D., E. Bellocco, C. Caristi, U. Leuzzi and G. Gattuso (2012). Flavonoids and furocoumarins in Bergamot, Myrtle-leaved orange and sour orange juices: Distribution and properties. Emerging trends in dietary components for preventing and combating disease–ACS symposium series, American Chemical Society.
Battegay, E. J., J. Rupp, L. Iruela-Arispe, E. H. Sage and M. Pech (1994). "PDGF-BB modulates endothelial proliferation and angiogenesis in vitro via PDGF beta-receptors." The Journal of Cell Biology 125(4): 917-928.
Bayne, C. W., F. Donnelly, M. Ross and F. K. Habib (1999). "Serenoa repens (Permixon®): A 5α‐reductase types I and II inhibitor—new evidence in a coculture model of BPH." The Prostate 40(4): 232-241.
Benelli, R., R. Adatia, B. Ensoli, W. G. Stetler-Stevenson, L. Santi and A. Albini (1993). "Inhibition of AIDS-Kaposi's sarcoma cell induced endothelial cell invasion by TIMP-2 and a synthetic peptide from the metalloproteinase propeptide: implications for an anti-angiogenic therapy." Oncology research 6(6): 251-257.
Bent , S., C. Kane , K. Shinohara , J. Neuhaus , E. S. Hudes , H. Goldberg and A. L. Avins (2006). "Saw Palmetto for Benign Prostatic Hyperplasia." New England Journal of Medicine 354(6): 557-566.
Bent, S. and R. Ko (2004). "Commonly used herbal medicines in the United States: a review." The American journal of medicine 116(7): 478-485.

295
Berg, C. (2003). "Flora Malesiana precursor for the treatment of Moraceae 3: Ficus subgenus Ficus." Blumea-Biodiversity, Evolution and Biogeography of Plants 48(3): 529-550.
Blandin, A.-F., G. Renner, M. Lehmann, I. Lelong-Rebel, S. Martin and M. Dontenwill (2015). "β1 Integrins as Therapeutic Targets to Disrupt Hallmarks of Cancer." Frontiers in Pharmacology 6: 279.
Bonnar-Pizzorno, R. M., A. J. Littman, M. Kestin and E. White (2006). "Saw palmetto supplement use and prostate cancer risk." Nutrition and cancer 55(1): 21-27.
Bopage, N. "Investigation on wound healing activity of bark of Ficus racemosa and “Seetodaka” oil using Scratch Wound Assay (SWA)." Chemistry in Sri Lanka ISSN 1012-8999: 18.
Bostwick, D. G., W. H. Cooner, L. Denis, G. W. Jones, P. T. Scardino and G. P. Murphy (1992). "The association of benign prostatic hyperplasia and cancer of the prostate." Cancer 70(S1): 291-301.
Bramson, H. N., D. Hermann, K. W. Batchelor, F. W. Lee, M. K. James and S. V. Frye (1997). "Unique preclinical characteristics of GG745, a potent dual inhibitor of 5AR." Journal of Pharmacology and Experimental Therapeutics 282(3): 1496-1502.
Brawley, O. W. (2002). "The Potential for Prostate Cancer Chemoprevention." Reviews in Urology 4(Suppl 5): S11-S17.
Bubendorf, L., J. Kononen, P. Koivisto, P. Schraml, H. Moch, T. C. Gasser, N. Willi, M. J. Mihatsch, G. Sauter and O.-P. Kallioniemi (1999). "Survey of Gene Amplifications during Prostate Cancer Progression by High-Throughput Fluorescence in Situ Hybridization on Tissue Microarrays." Cancer Research 59(4): 803-806.
Bunawan, H., N. M. Amin, S. N. Bunawan, S. N. Baharum and N. Mohd Noor (2014). "Ficus deltoidea Jack: A Review on Its Phytochemical and Pharmacological Importance." Evidence-Based Complementary and Alternative Medicine 2014: 8.
Bunawan, H., N. M. Amin, S. N. Bunawan, S. N. Baharum and N. Mohd Noor (2014). "Ficus deltoidea Jack: A Review on Its Phytochemical and Pharmacological Importance." Evidence-Based Complementary and Alternative Medicine 2014.
Buonanno, F., L. Quassinti, M. Bramucci, C. Amantini, R. Lucciarini, G. Santoni, H. Iio and C. Ortenzi (2008). "The protozoan toxin climacostol inhibits growth and induces apoptosis of human tumor cell lines." Chemico-Biological Interactions 176(2–3): 151-164.
Burkill, I. H. and M. Haniff (1930). Malay Village Medicine: Prescriptions Collected by, University Press.
Cancer Research UK, U. K. (2016). "Prostate Cancer statistics." Retrieved 16/2/2017, 2017, from http://www.cancerresearchuk.org/health-professional/cancer-statistics/statistics-by-cancer-type/prostate-cancer - heading-Zero.

296
Candé, C., F. Cecconi, P. Dessen and G. Kroemer (2002). "Apoptosis-inducing factor (AIF): key to the conserved caspase-independent pathways of cell death?" Journal of Cell Science 115(24): 4727.
Cao, Y., H. Chen, L. Zhou, M.-K. Chiang, B. Anand-Apte, J. A. Weatherbee, Y. Wang, F. Fang, J. G. Flanagan and M. L.-S. Tsang (1996). "Heterodimers of Placenta growth factor/vascular endothelial growth factor endothelial activity, tumor cell expression, and high affinity binding to Flk-1/KDR." Journal of Biological Chemistry 271(6): 3154-3162.
Carmeliet, P. (2003). "Angiogenesis in health and disease." Nat Med 9(6): 653-660.
Carmeliet, P. (2005). "VEGF as a Key Mediator of Angiogenesis in Cancer." Oncology 69(suppl 3)(Suppl. 3): 4-10.
Carson, J. P., M. Behnam, J. N. Sutton, C. Du, X. Wang, D. F. Hunt, M. J. Weber and G. Kulik (2002). "Smac is required for cytochrome c-induced apoptosis in prostate cancer LNCaP cells." Cancer research 62(1): 18-23.
Casimiro, S., T. A. Guise and J. Chirgwin (2009). "The critical role of the bone microenvironment in cancer metastases." Mol Cell Endocrinol 310(1-2): 71-81.
Chaitankar, V., G. Karakülah, R. Ratnapriya, F. O. Giuste, M. J. Brooks and A. Swaroop (2016). "Next generation sequencing technology and genomewide data analysis: Perspectives for retinal research." Progress in Retinal and Eye Research 55: 1-31.
Chaitanya, G. V., J. S. Alexander and P. P. Babu (2010). "PARP-1 cleavage fragments: signatures of cell-death proteases in neurodegeneration." Cell Communication and Signaling : CCS 8: 31-31.
Challand, S. and M. Willcox (2009). "A clinical trial of the traditional medicine Vernonia amygdalina in the treatment of uncomplicated malaria." The Journal of Alternative and Complementary Medicine 15(11): 1231-1237.
Chan, J., E. Elkin, S. Silva, J. Broering, D. Latini and P. Carroll (2005). "Total and specific complementary and alternative medicine use in a large cohort of men with prostate cancer." Urology 66(6): 1223-1228.
Chang, Y.-x., X.-p. Ding, J. Qi, J. Cao, L.-y. Kang, D.-n. Zhu, B.-l. Zhang and B.-y. Yu (2008). "The antioxidant-activity-integrated fingerprint: an advantageous tool for the evaluation of quality of herbal medicines." Journal of Chromatography A 1208(1): 76-82.
Chaturvedi, P. K., K. Bhui and Y. Shukla (2008). "Lupeol: connotations for chemoprevention." Cancer letters 263(1): 1-13.
Chen, L. W., M. J. Cheng, C. F. Peng and I. S. Chen (2010). "Secondary metabolites and antimycobacterial activities from the roots of Ficus nervosa." Chemistry & biodiversity 7(7): 1814-1821.

297
Chen, Y.-C., J. H. Page, R. Chen and E. Giovannucci (2008). "Family history of prostate and breast cancer and the risk of prostate cancer in the PSA era." The Prostate 68(14): 1582-1591.
Cher, M. L., G. S. Bova, D. H. Moore, E. J. Small, P. R. Carroll, S. S. Pin, J. I. Epstein, W. B. Isaacs and R. H. Jensen (1996). "Genetic Alterations in Untreated Metastases and Androgen-independent Prostate Cancer Detected by Comparative Genomic Hybridization and Allelotyping." Cancer Research 56(13): 3091-3102.
Chiang, Y.-M., J.-Y. Chang, C.-C. Kuo, C.-Y. Chang and Y.-H. Kuo (2005). "Cytotoxic triterpenes from the aerial roots of< i> Ficus microcarpa</i>." Phytochemistry 66(4): 495-501.
Chiang, Y.-M. and Y.-H. Kuo (2002). "Novel Triterpenoids from the Aerial Roots of Ficus m icrocarpa." The Journal of organic chemistry 67(22): 7656-7661.
Chinni, S. R., S. Sivalogan, Z. Dong, X. Deng, R. D. Bonfil and M. L. Cher (2006). "CXCL12/CXCR4 signaling activates Akt‐1 and MMP‐9 expression in prostate cancer cells: the role of bone microenvironment‐associated CXCL12." The Prostate 66(1): 32-48.
Chintharlapalli, S., S. Papineni, S. K. Ramaiah and S. Safe (2007). "Betulinic Acid Inhibits Prostate Cancer Growth through Inhibition of Specificity Protein Transcription Factors." Cancer Research 67(6): 2816.
Chmelar, R., G. Buchanan, E. F. Need, W. Tilley and N. M. Greenberg (2007). "Androgen receptor coregulators and their involvement in the development and progression of prostate cancer." International Journal of cancer 120(4): 719-733.
Choi, S. Y. C., P. W. Gout, C. C. Collins and Y. Wang (2012). "Epithelial immune cell-like transition (EIT): a proposed transdifferentiation process underlying immune-suppressive activity of epithelial cancers." Differentiation 83(5): 293-298.
Chokkalingam, A. P., O. Nyrén, J. E. Johansson, G. Gridley, J. K. McLaughlin, H. O. Adami and A. W. Hsing (2003). "Prostate carcinoma risk subsequent to diagnosis of benign prostatic hyperplasia." Cancer 98(8): 1727-1734.
Chua, L. S., S. Y. Lee, N. Abdullah and M. R. Sarmidi (2012). "Review on< i> Labisia pumila</i>(Kacip Fatimah): Bioactive phytochemicals and skin collagen synthesis promoting herb." Fitoterapia 83(8): 1322-1335.
Chuang, T.-H. and P.-L. Wu (2007). "Cytotoxic 5-alkylresorcinol metabolites from the leaves of Grevillea robusta." Journal of natural products 70(2): 319-323.
Cockett, M. I., G. Murphy, M. Birch, J. O'Connell, T. Crabbe, A. Millican, I. Hart and A. Docherty (1997). Matrix metalloproteinases and metastatic cancer. Biochemical Society Symposium.
Cogliano, V. J., R. Baan, K. Straif, Y. Grosse, B. Lauby-Secretan, F. El Ghissassi, V. Bouvard, L. Benbrahim-Tallaa, N. Guha, C. Freeman, L. Galichet and C. P. Wild

298
(2011). "Preventable Exposures Associated With Human Cancers." JNCI Journal of the National Cancer Institute 103(24): 1827-1839.
Collins, J. A., C. A. Schandl, K. K. Young, J. Vesely and M. C. Willingham (1997). "Major DNA Fragmentation Is a Late Event in Apoptosis." Journal of Histochemistry & Cytochemistry 45(7): 923-934.
Colombel, M., F. Symmans, S. Gil, K. M. O'Toole, D. Chopin, M. Benson, C. A. Olsson, S. Korsmeyer and R. Buttyan (1993). "Detection of the apoptosis-suppressing oncoprotein bc1-2 in hormone-refractory human prostate cancers." Am J Pathol 143(2): 390-400.
Conley-LaComb, M. K., A. Saliganan, P. Kandagatla, Y. Q. Chen, M. L. Cher and S. R. Chinni (2013). "PTEN loss mediated Akt activation promotes prostate tumor growth and metastasis via CXCL12/CXCR4 signaling." Molecular cancer 12(1): 85.
Constant, H. L. and C. W. Beecher (1995). "A method for the dereplication of natural product extracts using electrospray HPLC/MS." Natural Product Letters 6(3): 193-196.
Coppens, P., M. F. Da Silva and S. Pettman (2006). "European regulations on nutraceuticals, dietary supplements and functional foods: a framework based on safety." Toxicology 221(1): 59-74.
Cory, S. and J. M. Adams (2002). "The Bcl2 family: regulators of the cellular life-or-death switch." Nature Reviews Cancer 2(9): 647-656.
Cragg, G. M. and D. J. Newman (2005). "Plants as a source of anti-cancer agents." Journal of Ethnopharmacology 100(1): 72-79.
Cummings, J., T. H. Ward, M. Ranson and C. Dive (2004). "Apoptosis pathway-targeted drugs—from the bench to the clinic." Biochimica et Biophysica Acta (BBA)-Reviews on Cancer 1705(1): 53-66.
Curtis Nickel, J., D. Shoskes, C. G. Roehrborn and M. Moyad (2008). "Nutraceuticals in Prostate Disease: The Urologist’s Role." Reviews in Urology 10(3): 192-206.
D'Amico, A., K. Cote, M. Loffredo, A. Renshaw and D. Schultz (2002). "Determinants of prostate cancer-specific survival after radiation therapy for patients with clinically localized prostate cancer." Journal of clinical oncology 20(23): 4567-4573.
Deeb, D., X. Gao, H. Jiang, B. Janic, A. S. Arbab, Y. Rojanasakul, S. A. Dulchavsky and S. C. Gautam (2010). "Oleanane triterpenoid CDDO-Me inhibits growth and induces apoptosis in prostate cancer cells through a ROS-dependent mechanism." Biochemical Pharmacology 79(3): 350-360.
Delbridge, A. R. D., S. Grabow, A. Strasser and D. L. Vaux (2016). "Thirty years of BCL-2: translating cell death discoveries into novel cancer therapies." Nat Rev Cancer 16(2): 99-109.

299
Denmeade, S. R., X. S. Lin and J. T. Isaacs (1996). "Role of programmed (apoptotic) cell death during the progression and therapy for prostate cancer." The prostate 28(4): 251-265.
Deveraux, Q. L., N. Roy, H. R. Stennicke, T. Van Arsdale, Q. Zhou, S. M. Srinivasula, E. S. Alnemri, G. S. Salvesen and J. C. Reed (1998). "IAPs block apoptotic events induced by caspase‐8 and cytochrome c by direct inhibition of distinct caspases." The EMBO journal 17(8): 2215-2223.
Dias, S., K. Hattori, B. Heissig, Z. Zhu, Y. Wu, L. Witte, D. J. Hicklin, M. Tateno, P. Bohlen and M. A. Moore (2001). "Inhibition of both paracrine and autocrine VEGF/VEGFR-2 signaling pathways is essential to induce long-term remission of xenotransplanted human leukemias." Proceedings of the National Academy of Sciences 98(19): 10857-10862.
Diel, I. (1994). Historical remarks on metastasis and metastatic bone disease. Metastatic Bone Disease, Springer: 1-11.
DiSalvo, J., M. L. Bayne, G. Conn, P. W. Kwok, P. G. Trivedi, D. D. Soderman, T. M. Palisi, K. A. Sullivan and K. A. Thomas (1995). "Purification and characterization of a naturally occurring vascular endothelial growth factor· placenta growth factor heterodimer." Journal of Biological Chemistry 270(13): 7717-7723.
Du, C., M. Fang, Y. Li, L. Li and X. Wang (2000). "Smac, a mitochondrial protein that promotes cytochrome c–dependent caspase activation by eliminating IAP inhibition." Cell 102(1): 33-42.
Eberhart, C. E., R. J. Coffey, A. Radhika, F. M. Giardiello, S. Ferrenbach and R. N. Dubois (1994). "Up-regulation of cyclooxygenase 2 gene expression in human colorectal adenomas and adenocarcinomas." Gastroenterology 107(4): 1183-1188.
Edwards, J. and J. Bartlett (2005). "The androgen receptor and signal‐transduction pathways in hormone‐ refractory prostate cancer. Part 2: androgen‐ receptor cofactors and bypass pathways." BJU international 95(9): 1327-1335.
Egeblad, M. and Z. Werb (2002). "New functions for the matrix metalloproteinases in cancer progression." Nat Rev Cancer 2(3): 161-174.
Ekert, P. G., J. Silke, C. J. Hawkins, A. M. Verhagen and D. L. Vaux (2001). "DIABLO promotes apoptosis by removing MIHA/XIAP from processed caspase 9." The Journal of cell biology 152(3): 483-490.
Ellis, L., Y. Takahashi, C. Fenoglio, K. Cleary, C. Bucana and D. Evans (1998). "Vessel counts and vascular endothelial growth factor expression in pancreatic adenocarcinoma." European journal of cancer 34(3): 337-340.
Elmore, S. (2007). "Apoptosis: a review of programmed cell death." Toxicologic pathology 35(4): 495-516.

300
Engl, T., B. Relja, D. Marian, C. Blumenberg, I. Müller, W.-D. Beecken, J. Jones, E. M. Ringel, J. Bereiter-Hahn and D. Jonas (2006). "CXCR4 chemokine receptor mediates prostate tumor cell adhesion through α5 and β3 integrins." Neoplasia 8(4): 290-301.
Epstein, J. I. and M. Herawi (2006). "Prostate needle biopsies containing prostatic intraepithelial neoplasia or atypical foci suspicious for carcinoma: implications for patient care." The Journal of urology 175(3): 820-834.
Fachal, L., A. Gómez-Caamaño, C. Celeiro-Muñoz, P. Peleteiro, A. Blanco, A. Carballo, J. Forteza, Á. Carracedo and A. Vega (2011). "BRCA1 mutations do not increase prostate cancer risk: Results from a meta-analysis including new data." The Prostate 71(16): 1768-1779.
Fackler, O. T. and R. Grosse (2008). "Cell motility through plasma membrane blebbing." The Journal of cell biology 181(6): 879-884.
Feldman, B. J. and D. Feldman (2001). "The development of androgen-independent prostate cancer." Nat Rev Cancer 1(1): 34-45.
Ferlay, J., I. Soerjomataram, M. Ervik and e. al. (2013). GLOBOCAN 2012 v1.0, Cancer Incidence and Mortality Worldwide: IARC CancerBase No. 11 [Internet], Lyon, France: International Agency for Research on Cancer.
Ferrara, N. (1999). "Molecular and biological properties of vascular endothelial growth factor." Journal of Molecular Medicine 77(7): 527-543.
Ferrara, N. (2001). "Role of vascular endothelial growth factor in regulation of physiological angiogenesis." American Journal of Physiology-Cell Physiology 280(6): C1358-C1366.
Ferrara, N. (2002). "Role of vascular endothelial growth factor in physiologic and pathologic angiogenesis: Therapeutic implications." Seminars in Oncology 29(6, Supplement 16): 10-14.
Ferrara, N. (2004). "Vascular endothelial growth factor: basic science and clinical progress." Endocrine reviews 25(4): 581-611.
Ferrara, N., K. Carver-Moore, H. Chen and M. Dowd (1996). "Heterozygous embryonic lethality induced by targeted inactivation of the VEGF gene." Nature 380(6573): 439.
Ferrara, N. and T. Davis-Smyth (1997). "The biology of vascular endothelial growth factor." Endocrine reviews 18(1): 4-25.
Ferrara, N., H.-P. Gerber and J. LeCouter (2003). "The biology of VEGF and its receptors." Nat Med 9(6): 669-676.

301
Ferrara, N. and W. J. Henzel (1989). "Pituitary follicular cells secrete a novel heparin-binding growth factor specific for vascular endothelial cells." Biochemical and biophysical research communications 161(2): 851-858.
Ferrara, N., K. J. Hillan, H.-P. Gerber and W. Novotny (2004). "Discovery and development of bevacizumab, an anti-VEGF antibody for treating cancer." Nature reviews Drug discovery 3(5): 391-400.
Ferrer, F. A., L. J. Miller, R. I. Andrawis, S. H. Kurtzman, P. C. Albertsen, V. P. Laudone and D. L. Kreutzer (1997). "Vascular Endothelial Growth Factor (VEGF) Expression in Human Prostate Cancer: In Situ and in Vitro Expression of VEGF by Human Prostate Cancer Cells." The Journal of Urology 157(6): 2329-2333.
Fesik, S. W. (2005). "Promoting apoptosis as a strategy for cancer drug discovery." Nature Reviews Cancer 5(11): 876-885.
Fidler, I. J. (2002). "The organ microenvironment and cancer metastasis." Differentiation 70(9-10): 498-505.
Fidler, I. J. (2003). "The pathogenesis of cancer metastasis: the 'seed and soil' hypothesis revisited." Nat Rev Cancer 3(6): 453-458.
Filip, P., T. Anke and O. Sterner (2002). "5-(2′-Oxoheptadecyl)-resorcinol and 5-(2′ -oxononadecyl)-resorcinol, cytotoxic metabolites from a wood-inhabiting basidiomycete." Zeitschrift für Naturforschung C 57(11-12): 1004-1008.
Fizazi, K., M. Carducci, M. Smith, R. Damião, J. Brown, L. Karsh, P. Milecki, N. Shore, M. Rader, H. Wang, Q. Jiang, S. Tadros, R. Dansey and C. Goessl (2011). "Denosumab versus zoledronic acid for treatment of bone metastases in men with castration-resistant prostate cancer: a randomised, double-blind study." The Lancet 377(9768): 813-822.
Folkman, J. (1971). "Tumor angiogenesis: therapeutic implications." New england journal of medicine 285(21): 1182-1186.
Folkman, J. (1990). "What is the evidence that tumors are angiogenesis dependent?" CancerSpectrum Knowledge Environment 82(1): 4-6.
Folkman, J. and M. Klagsbrun (1987). "Angiogenic factors." Science 235: 442-448.
Foster, I. (2008). "Cancer: A cell cycle defect." Radiography 14(2): 144-149.
Fraser, M., V. Y. Sabelnykova, T. N. Yamaguchi, L. E. Heisler, J. Livingstone, V. Huang, Y.-J. Shiah, F. Yousif, X. Lin, A. P. Masella, N. S. Fox, M. Xie, S. D. Prokopec, A. Berlin, E. Lalonde, M. Ahmed, D. Trudel, X. Luo, T. A. Beck, A. Meng, J. Zhang, A. D’Costa, R. E. Denroche, H. Kong, S. M. G. Espiritu, M. L. K. Chua, A. Wong, T. Chong, M. Sam, J. Johns, L. Timms, N. B. Buchner, M. Orain, V. Picard, H. Hovington, A. Murison, K. Kron, N. J. Harding, C. P’ng, K. E. Houlahan, K. C. Chu, B. Lo, F. Nguyen, C. H. Li, R. X. Sun, R. de Borja, C. I. Cooper, J. F. Hopkins, S. K. Govind, C. Fung, D. Waggott, J. Green, S. Haider, M. A. Chan-Seng-

302
Yue, E. Jung, Z. Wang, A. Bergeron, A. D. Pra, L. Lacombe, C. C. Collins, C. Sahinalp, M. Lupien, N. E. Fleshner, H. H. He, Y. Fradet, B. Tetu, T. van der Kwast, J. D. McPherson, R. G. Bristow and P. C. Boutros (2017). "Genomic hallmarks of localized, non-indolent prostate cancer." Nature 541(7637): 359-364.
Freshney, R. (2005). Culture of animal cells: a manual of basic techniques Wiley-Liss: New York.
Friedl, P. and K. Wolf (2010). "Plasticity of cell migration: a multiscale tuning model." The Journal of cell biology 188(1): 11-19.
Friesel, R. E. and T. Maciag (1995). "Molecular mechanisms of angiogenesis: fibroblast growth factor signal transduction." The FASEB Journal 9(10): 919-925.
Friesner, R. A., R. B. Murphy, M. P. Repasky, L. L. Frye, J. R. Greenwood, T. A. Halgren, P. C. Sanschagrin and D. T. Mainz (2006). "Extra precision glide: Docking and scoring incorporating a model of hydrophobic enclosure for protein− ligand complexes." Journal of medicinal chemistry 49(21): 6177-6196.
Fulda, S. and K. Debatin (2006). "Extrinsic versus intrinsic apoptosis pathways in anticancer chemotherapy." Oncogene 25(34): 4798-4811.
Fulda, S., W. Wick, M. Weller and K.-M. Debatin (2002). "Smac agonists sensitize for Apo2L/TRAIL-or anticancer drug-induced apoptosis and induce regression of malignant glioma in vivo." Nature medicine 8(8): 808-815.
Fürstenberger, G., P. Krieg, K. Müller-Decker and A. J. R. Habenicht (2006). "What are cyclooxygenases and lipoxygenases doing in the driver's seat of carcinogenesis?" International Journal of Cancer 119(10): 2247-2254.
Galluzzi, L., O. Kepp, C. Trojel-Hansen and G. Kroemer (2012). "Mitochondrial control of cellular life, stress, and death." Circulation research 111(9): 1198-1207.
Ganesan, A. (2008). "The impact of natural products upon modern drug discovery." Current opinion in chemical biology 12(3): 306-317.
Garrido, C., L. Galluzzi, M. Brunet, P. Puig, C. Didelot and G. Kroemer (2006). "Mechanisms of cytochrome c release from mitochondria." Cell Death & Differentiation 13(9): 1423-1433.
Geldof, A. (1996). "Models for cancer skeletal metastasis: a reappraisal of Batson's plexus." Anticancer research 17(3A): 1535-1539.
Gerber, G. S. and J. M. Fitzpatrick (2004). "The role of a lipido‐sterolic extract of Serenoa repens in the management of lower urinary tract symptoms associated with benign prostatic hyperplasia." BJU international 94(3): 338-344.
Ghisalberti, E. L. (1993). Detection and isolation of bioactive natural products, CRC Press, Boca Raton.

303
Ghosh, J. (2008). "Targeting 5-lipoxygenase for prevention and treatment of cancer." Current Enzyme Inhibition 4(1): 18-28.
Ghosh, J. and C. E. Myers (1997). "Arachidonic Acid Stimulates Prostate Cancer Cell Growth: Critical Role of 5-Lipoxygenase." Biochemical and Biophysical Research Communications 235(2): 418-423.
Giancotti, F. G. and E. Ruoslahti (1999). "Integrin signaling." Science 285(5430): 1028-1033.
Gillette, J. M., A. Larochelle, C. E. Dunbar and J. Lippincott-Schwartz (2009). "Intercellular transfer to signalling endosomes regulates an ex vivo bone marrow niche." Nature cell biology 11(3): 303-311.
Giovannucci, E., Y. Liu, E. A. Platz, M. J. Stampfer and W. C. Willett (2007). "Risk factors for prostate cancer incidence and progression in the health professionals follow-up study." International Journal of Cancer 121(7): 1571-1578.
Goldmann, W. H., A. L. Sharma, S. J. Currier, P. D. Johnston, A. Rana and C. P. Sharma (2001). "Saw palmetto berry extract inhibits cell growth and Cox-2 expression in prostatic cancer cells." Cell Biology International 25(11): 1117-1124.
Gonzalgo, M. L. and W. B. Isaacs (2003). "Molecular pathways to prostate cancer." The Journal of urology 170(6): 2444-2452.
Green, D. R. and G. Kroemer (2004). "The Pathophysiology of Mitochondrial Cell Death." Science 305(5684): 626.
Guo, F., R. Nimmanapalli, S. Paranawithana, S. Wittman, D. Griffin, P. Bali, E. O'Bryan, C. Fumero, H. G. Wang and K. Bhalla (2002). "Ectopic overexpression of second mitochondria-derived activator of caspases (Smac/DIABLO) or cotreatment with N-terminus of Smac/DIABLO peptide potentiates epothilone B derivative–(BMS 247550) and Apo-2L/TRAIL–induced apoptosis." Blood 99(9): 3419-3426.
Guo, F., Y. Wang, J. Liu, S. Mok, F. Xue and W. Zhang (2015). "CXCL12/CXCR4: a symbiotic bridge linking cancer cells and their stromal neighbors in oncogenic communication networks." Oncogene.
Guo, Q., X. Tian, A. Yang, Y. Zhou, D. Wu and Z. Wang (2014). "Orientin in Trollius chinensis Bunge inhibits proliferation of HeLa human cervical carcinoma cells by induction of apoptosis." Monatshefte für Chemie-Chemical Monthly 145(1): 229-233.
Gupta, G. P. and J. Massagué (2006). "Cancer metastasis: building a framework." Cell 127(4): 679-695.
Habib, F. K., M. Ross, C. KH Ho, V. Lyons and K. Chapman (2005). "Serenoa repens (Permixon®) inhibits the 5α‐reductase activity of human prostate cancer cell lines without interfering with PSA expression." International journal of cancer 114(2): 190-194.

304
Hadijah, H., A. Normah, S. Ahmad Tarmizi and M. Aida (2007). Cholesterol lowering effect of mas cotek tea in hypercholesterolemic rats. The 2nd International conference of east-west perspective of functional food science, Kuala Lumpur.
Hanahan, D. and R. A. Weinberg (2000). "The hallmarks of cancer." cell 100(1): 57-70.
Hanahan, D. and R. A. Weinberg (2011). "Hallmarks of cancer: the next generation." cell 144(5): 646-674.
Haraldsdottir, S., H. Hampel, L. Wei, C. Wu, W. Frankel, T. Bekaii-Saab, A. de la Chapelle and R. M. Goldberg (2014). "Prostate cancer incidence in males with Lynch syndrome." Genet Med 16(7): 553-557.
Harwell, J. (1982). "Plants used against cancer." A. Surucy. 1JOydcL 34.
He, Y., K.-i. Kozaki, T. Karpanen, K. Koshikawa, S. Yla-Herttuala, T. Takahashi and K. Alitalo (2002). "Suppression of Tumor Lymphangiogenesis and Lymph Node Metastasis by Blocking Vascular Endothelial Growth Factor Receptor 3 Signaling." Journal of the National Cancer Institute 94(11): 819-825.
Healthfavo. (2014, June 1st 2014). "Prostate Cancer Metastasis." Retrieved 16/2/2017, 2017, from http://healthfavo.com/prostate-cancer-metastasis.html.
Hemminki, K. and B. Chen (2005). "Familial association of prostate cancer with other cancers in the Swedish Family-Cancer Database." The Prostate 65(2): 188-194.
Hengartner, M. O. (2000). "The biochemistry of apoptosis." Nature 407(6805): 770-776.
Hicklin, D. J. and L. M. Ellis (2005). "Role of the Vascular Endothelial Growth Factor Pathway in Tumor Growth and Angiogenesis." Journal of Clinical Oncology 23(5): 1011-1027.
Hida, T., Y. Yatabe, H. Achiwa, H. Muramatsu, K.-i. Kozaki, S. Nakamura, M. Ogawa, T. Mitsudomi, T. Sugiura and T. Takahashi (1998). "Increased expression of cyclooxygenase 2 occurs frequently in human lung cancers, specifically in adenocarcinomas." Cancer research 58(17): 3761-3764.
Hill, B. and N. Kyprianou (2004). "Effect of permixon on human prostate cell growth: lack of apoptotic action." The Prostate 61(1): 73-80.
Ho, K., L. S. Yazan, N. Ismail and M. Ismail (2009). "Apoptosis and cell cycle arrest of human colorectal cancer cell line HT-29 induced by vanillin." Cancer epidemiology 33(2): 155-160.
Holmgren, L., M. S. O'Reilly and J. Folkman (1995). "Dormancy of micrometastases: Balanced proliferation and apoptosis in the presence of angiogenesis suppression." Nat Med 1(2): 149-153.

305
Hong, W. K. and S. M. Lippman (1994). "Cancer chemoprevention." Journal of the National Cancer Institute. Monographs(17): 49-53.
Hughes, C., A. Murphy, C. Martin, O. Sheils and J. O’Leary (2005). "Molecular pathology of prostate cancer." Journal of Clinical Pathology 58(7): 673.
Hussain, M., M. Banerjee, F. H. Sarkar, Z. Djuric, M. N. Pollak, D. Doerge, J. Fontana, S. Chinni, J. Davis and J. Forman (2003). "Soy isoflavones in the treatment of prostate cancer." Nutrition and cancer 47(2): 111-117.
Hwang, B. Y., H.-B. Chai, L. B. Kardono, S. Riswan, N. R. Farnsworth, G. A. Cordell, J. M. Pezzuto and A. D. Kinghorn (2003). "Cytotoxic triterpenes from the twigs of Celtis philippinensis." Phytochemistry 62(2): 197-201.
Hwang, D., J. Byrne, D. Scollard and E. Levine (1998). "Expression of cyclooxygenase-1 and cyclooxygenase-2 in human breast cancer." Journal of the National Cancer Institute 90(6): 455-460.
Ibrahim, M. H. and H. Z. Jaafar (2011). "Photosynthetic capacity, photochemical efficiency and chlorophyll content of three varieties of Labisia pumila Benth. exposed to open field and greenhouse growing conditions." Acta Physiologiae Plantarum 33(6): 2179-2185.
Ide, A. G., N. H. Baker and S. L. Warren (1939). "Vascularization of the Brown Pearce rabbit epithelioma transplant as seen in the transparent ear chamber." American Journal of Roentgenology 42: 891-899.
Igney, F. H. and P. H. Krammer (2002). "Death and anti-death: tumour resistance to apoptosis." Nature Reviews Cancer 2(4): 277-288.
Iguchi, K., N. Okumura, S. Usui, H. Sajiki, K. Hirota and K. Hirano (2001). "Myristoleic acid, a cytotoxic component in the extract from Serenoa repens, induces apoptosis and necrosis in human prostatic LNCaP cells." The prostate 47(1): 59-65.
International Agency for Research on Cancer (IARC). (2014). "EPIC Study." Retrieved 15/9/2014, from http://epic.iarc.fr/research/cancerworkinggroups/prostatecancer.php.
Isenberg, J. S. and J. E. Klaunig (2000). "Role of the Mitochondrial Membrane Permeability Transition (MPT) in Rotenone-Induced Apoptosis in Liver Cells." Toxicological Sciences 53(2): 340-351.
Jamal, J. A., P. Houghton, S. Milligan and I. Jantan (2003). "The Oestrogenis and cytotoxic effects of the extracts of Labisia pumila var. alata and Labisia pumila var. pumila in vitro."
Jia, L., Y. Patwari, S. M. Kelsey, S. M. Srinivasula, S. G. Agrawal, E. S. Alnemri and A. C. Newland (2003). "Role of Smac in human leukaemic cell apoptosis and proliferation." Oncogene 22(11): 1589-1599.

306
Johns, L. E. and R. S. Houlston (2003). "A systematic review and meta-analysis of familial prostate cancer risk." BJU International 91(9): 789-794.
Joseph, B. and S. J. Raj (2011). "Pharmacognostic and phytochemical properties of Ficus carica Linn–An overview." International Journal of PharmTech Research 3(1): 8-12.
Joza, N., S. A. Susin, E. Daugas, W. L. Stanford, S. K. Cho, C. Y. Li, T. Sasaki, A. J. Elia, H.-Y. M. Cheng and L. Ravagnan (2001). "Essential role of the mitochondrial apoptosis-inducing factor in programmed cell death." Nature 410(6828): 549-554.
Jung, G. R., K. J. Kim, C. H. Choi, T. B. Lee, S. I. Han, H. K. Han and S. C. Lim (2007). "Effect of Betulinic Acid on Anticancer Drug‐Resistant Colon Cancer Cells." Basic & clinical pharmacology & toxicology 101(4): 277-285.
Kaipainen, A., J. Korhonen, T. Mustonen, V. Van Hinsbergh, G.-H. Fang, D. Dumont, M. Breitman and K. Alitalo (1995). "Expression of the fms-like tyrosine kinase 4 gene becomes restricted to lymphatic endothelium during development." Proceedings of the National Academy of Sciences 92(8): 3566-3570.
Katiyar, C., A. Gupta, S. Kanjilal and S. Katiyar (2012). "Drug discovery from plant sources: An integrated approach." Ayu 33(1): 10-19.
Kaufmann, S. H., S. Desnoyers, Y. Ottaviano, N. E. Davidson and G. G. Poirier (1993). "Specific proteolytic cleavage of poly (ADP-ribose) polymerase: an early marker of chemotherapy-induced apoptosis." Cancer research 53(17): 3976-3985.
Kaufmann, S. H. and D. L. Vaux (2003). "Alterations in the apoptotic machinery and their potential role in anticancer drug resistance." Oncogene 22(47): 7414-7430.
Kelloff, G. J., R. Lieberman, V. E. Steele, C. W. Boone, R. A. Lubet, L. Kopelovitch, W. A. Malone, J. A. Crowell and C. C. Sigman (1999). "Chemoprevention of prostate cancer: concepts and strategies." European urology 35(5-6): 342-350.
Kerr, J. F., C. M. Winterford and B. V. Harmon (1994). "Apoptosis. Its significance in cancer and cancer therapy." Cancer 73(8): 2013-2026.
Kicinski, M., J. Vangronsveld and T. S. Nawrot (2011). "An epidemiological reappraisal of the familial aggregation of prostate cancer: a meta-analysis." PLoS One 6(10): e27130.
Kim, C. H. and H. E. Broxmeyer (1999). "SLC/exodus2/6Ckine/TCA4 induces chemotaxis of hematopoietic progenitor cells: differential activity of ligands of CCR7, CXCR3, or CXCR4 in chemotaxis vs. suppression of progenitor proliferation." Journal of leukocyte biology 66(3): 455-461.
Kingston, D. G. (2005). "Taxol and its analogs." Anticancer agents from natural products 2.

307
Klagsbrun, M. and P. A. D'Amore (1991). "Regulators of angiogenesis." Annual review of physiology 53(1): 217-239.
Koga, H., S. Sakisaka, M. Ohishi, T. Kawaguchi, E. Taniguchi, K. Sasatomi, M. Harada, T. Kusaba, M. Tanaka and R. Kimura (1999). "Expression of cyclooxygenase‐ 2 in human hepatocellular carcinoma: Relevance to tumor dedifferentiation." Hepatology 29(3): 688-696.
Komatsu, K., Y. Nakanishi, N. Nemoto, T. Hori, T. Sawada and M. Kobayashi (2004). "Expression and quantitative analysis of matrix metalloproteinase-2 and-9 in human gliomas." Brain tumor pathology 21(3): 105-112.
Koopman, G., C. Reutelingsperger, G. Kuijten, R. Keehnen, S. Pals and M. Van Oers (1994). "Annexin V for flow cytometric detection of phosphatidylserine expression on B cells undergoing apoptosis." Blood 84(5): 1415-1420.
Kozubek, A. and J. H. P. Tyman (1999). "Resorcinolic Lipids, the Natural Non-isoprenoid Phenolic Amphiphiles and Their Biological Activity." Chemical Reviews 99(1): 1-26.
Krajewska, M., S. Krajewski, J. I. Epstein, A. Shabaik, J. Sauvageot, K. Song, S. Kitada and J. C. Reed (1996). "Immunohistochemical analysis of bcl-2, bax, bcl-X, and mcl-1 expression in prostate cancers." Am J Pathol 148(5): 1567-1576.
Kramer, N., A. Walzl, C. Unger, M. Rosner, G. Krupitza, M. Hengstschlager and H. Dolznig (2013). "In vitro cell migration and invasion assays." Mutat Res 752(1): 10-24.
Kuete, V., J. Kamga, L. P. Sandjo, B. Ngameni, H. M. Poumale, P. Ambassa and B. T. Ngadjui (2011). "Antimicrobial activities of the methanol extract, fractions and compounds from Ficus polita Vahl.(Moraceae)." BMC complementary and alternative medicine 11(1): 6.
Kumar, S. and A. K. Pandey (2013). "Chemistry and biological activities of flavonoids: an overview." The Scientific World Journal 2013.
Kuo, Y. H. and H. Y. Lin (2004). "Two novel triterpenes from the leaves of Ficus microcarpa." Helvetica chimica acta 87(5): 1071-1076.
Kyriakou, C., N. Rabin, A. Pizzey, A. Nathwani and K. Yong (2008). "Factors that influence short-term homing of human bone marrow-derived mesenchymal stem cells in a xenogeneic animal model." Haematologica 93(10): 1457-1465.
Lander, E. S. (2011). "Initial impact of the sequencing of the human genome." Nature 470(7333): 187-197.
Lazebnik, Y. A., S. H. Kaufmann, S. Desnoyers, G. Poirier and W. Earnshaw (1994). "Cleavage of poly (ADP-ribose) polymerase by a proteinase with properties like ICE." Nature 371(6495): 346-347.

308
Lee, J. Y., D. H. Kang, D. Y. Chung, J. K. Kwon, H. Lee, N. H. Cho, Y. D. Choi, S. J. Hong and K. S. Cho (2014). "Meta-analysis of the relationship between CXCR4 expression and metastasis in prostate cancer." The world journal of men's health 32(3): 167-175.
Lee, M. M., J. S. Chang, B. Jacobs and M. R. Wrensch (2002). "Complementary and alternative medicine use among men with prostate cancer in 4 ethnic populations." American Journal of Public Health 92(10): 1606-1609.
Li, R., M. Younes, T. M. Wheeler, P. Scardino, M. Ohori, A. Frolov and G. Ayala (2004). "Expression of vascular endothelial growth factor receptor-3 (VEGFR-3) in human prostate." The Prostate 58(2): 193-199.
Liang, X.-m., Y. Jin, Y.-p. Wang, G.-w. Jin, Q. Fu and Y.-s. Xiao (2009). "Qualitative and quantitative analysis in quality control of traditional Chinese medicines." Journal of Chromatography A 1216(11): 2033-2044.
Lin, J. P., J. S. Yang, J. J. Lin, K. C. Lai, H. F. Lu, C. Y. Ma, R. Sai‐Chuen Wu, K. C. Wu, F. S. Chueh and W. Gibson Wood (2012). "Rutin inhibits human leukemia tumor growth in a murine xenograft model in vivo." Environmental toxicology 27(8): 480-484.
Liu, M., Hai, A, Huang, AT (1993). "Cancer epidemiology in the Far East--contrast with the United States." Oncology (Williston Park) 6(7): 99-110.
Liu, Y., T. Bi, G. Shen, Z. Li, G. Wu, Z. Wang, L. Qian and Q. Gao (2016). "Lupeol induces apoptosis and inhibits invasion in gallbladder carcinoma GBC-SD cells by suppression of EGFR/MMP-9 signaling pathway." Cytotechnology 68(1): 123-133.
Lowe, F. C. and J. C. Ku (1996). "Phytotherapy in treatment of benign prostatic hyperplasia: a critical review." Urology 48(1): 12-20.
Lu-Yao, G. L., P. C. Albertsen, D. F. Moore, W. Shih, Y. Lin, R. S. DiPaola, M. J. Barry, A. Zietman, M. O'Leary, E. Walker-Corkery and S.-L. Yao (2009). "Outcomes of Localized Prostate Cancer Following Conservative Management." JAMA : the journal of the American Medical Association 302(11): 1202-1209.
Lukas, J., C. Lukas and J. Bartek (2004). "Mammalian cell cycle checkpoints: signalling pathways and their organization in space and time." DNA repair 3(8): 997-1007.
Ly, J. D., D. Grubb and A. Lawen (2003). "The mitochondrial membrane potential (Δψm) in apoptosis; an update." Apoptosis 8(2): 115-128.
Mahmood, T. and P.-C. Yang (2012). "Western Blot: Technique, Theory, and Trouble Shooting." North American Journal of Medical Sciences 4(9): 429-434.
Mann, J. (2002). "Natural products in cancer chemotherapy: past, present and future." Nat Rev Cancer 2(2): 143-148.

309
Martinez-Ruiz, G., V. Maldonado, G. Ceballos-Cancino, J. P. R. Grajeda and J. Melendez-Zajgla (2008). "Role of Smac/DIABLO in cancer progression." Journal of Experimental & Clinical Cancer Research : CR 27(1): 48-48.
Martinvalet, D., P. Zhu and J. Lieberman (2005). "Granzyme A induces caspase-independent mitochondrial damage, a required first step for apoptosis." Immunity 22(3): 355-370.
Mashimo, T., M. Watabe, S. Hirota, S. Hosobe, K. Miura, P. J. Tegtmeyer, C. W. Rinker-Shaeffer and K. Watabe (1998). "The expression of the KAI1 gene, a tumor metastasis suppressor, is directly activated by p53." Proc Natl Acad Sci U S A 95(19): 11307-11311.
McCaffrey, T. A., L. A. Agarwal and B. B. Weksler (1988). "A rapid fluorometric DNA assay for the measurement of cell density and proliferation in vitro." In vitro cellular & developmental biology 24(3): 247-252.
McDonnell, T. J., P. Troncoso, S. M. Brisbay, C. Logothetis, L. W. K. Chung, J.-T. Hsieh, S.-M. Tu and M. L. Campbell (1992). "Expression of the Protooncogene bcl-2 in the Prostate and Its Association with Emergence of Androgen-independent Prostate Cancer." Cancer Research 52(24): 6940-6944.
Min, J., A. Zaslavsky, G. Fedele, S. K. McLaughlin, E. E. Reczek, T. De Raedt, I. Guney, D. E. Strochlic, L. E. MacConaill and R. Beroukhim (2010). "An oncogene-tumor suppressor cascade drives metastatic prostate cancer by coordinately activating Ras and nuclear factor-[kappa] B." Nature medicine 16(3): 286-294.
Mohammed, S. I., D. W. Knapp, D. G. Bostwick, R. S. Foster, K. N. M. Khan, J. L. Masferrer, B. M. Woerner, P. W. Snyder and A. T. Koki (1999). "Expression of cyclooxygenase-2 (COX-2) in human invasive transitional cell carcinoma (TCC) of the urinary bladder." Cancer Research 59(22): 5647-5650.
Mohan, S., A. Bustamam, S. Ibrahim, A. S. Al-Zubairi, M. Aspollah, R. Abdullah and M. M. Elhassan (2011). "In vitro ultramorphological assessment of apoptosis on CEMss induced by linoleic acid-rich fraction from typhonium flagelliforme tuber." Evidence-Based Complementary and Alternative Medicine 2011.
Mongiat-Artus, P., M. Peyromaure, P. Richaud, J. P. Droz, M. Rainfray, C. Jeandel, X. Rebillard, J. L. Moreau, J. L. Davin, L. Salomon and M. Soulié (2009). "Recommandations pour la prise en charge du cancer de la prostate chez l’homme âgé : un travail du comité de cancérologie de l’association française d’urologie." Progrès en Urologie 19(11): 810-817.
Monks, A., D. Scudiero, P. Skehan, R. Shoemaker, K. Paull, D. Vistica, C. Hose, J. Langley, P. Cronise and A. Vaigro-Wolff (1991). "Feasibility of a high-flux anticancer drug screen using a diverse panel of cultured human tumor cell lines." Journal of the National Cancer Institute 83(11): 757-766.

310
Morote, J., I. de Torres, C. Caceres, C. Vallejo, S. Schwartz and J. Reventos (1999). "Prognostic value of immunohistochemical expression of the c-erbB-2 oncoprotein in metastasic prostate cancer." International Journal of Cancer 84(4): 421-425.
Morris, G. M., R. Huey, W. Lindstrom, M. F. Sanner, R. K. Belew, D. S. Goodsell and A. J. Olson (2009). "AutoDock4 and AutoDockTools4: Automated Docking with Selective Receptor Flexibility." Journal of computational chemistry 30(16): 2785-2791.
Morrissey, C. and R. G Watson (2003). "Phytoestrogens and prostate cancer." Current drug targets 4(3): 231-241.
Morton, R. A., C. M. Ewing, A. Nagafuchi, S. Tsukita and W. B. Isaacs (1993). "Reduction of E-Cadherin Levels and Deletion of the α-Catenin Gene in Human Prostate Cancer Cells." Cancer Research 53(15): 3585-3590.
Mosmann, T. (1983). "Rapid colorimetric assay for cellular growth and survival: application to proliferation and cytotoxicity assays." Journal of immunological methods 65(1-2): 55-63.
Moss, S. E., H. C. Edwards and M. J. Crumpton (1991). Diversity in the annexin family. Novel calcium-binding proteins, Springer: 535-566.
Müller, A., B. Homey, H. Soto, N. Ge, D. Catron, M. E. Buchanan, T. McClanahan, E. Murphy, W. Yuan and S. N. Wagner (2001). "Involvement of chemokine receptors in breast cancer metastasis." Nature 410(6824): 50-56.
Murphy, A. N., E. J. Unsworth and W. G. Stetler‐Stevenson (1993). "Tissue inhibitor of metalloproteinases‐2 inhibits bFGF‐induced human microvascular endothelial cell proliferation." Journal of cellular physiology 157(2): 351-358.
Murray, A. W. (2004). "Recycling the cell cycle: cyclins revisited." Cell 116(2): 221-234.
Nagata, S. (2000). "Apoptotic DNA fragmentation." Experimental cell research 256(1): 12-18.
National Cancer Registry, M. o. H. M. (2011). Malaysia National Cancer Registry Report 2007. M. o. H. M. National Cancer Registry. Kuala Lampur, Malaysia: .
Nawab, A., V. S. Thakur, M. Yunus, A. A. Mahdi and S. Gupta (2012). "Selective cell cycle arrest and induction of apoptosis in human prostate cancer cells by a polyphenol-rich extract of Solanum nigrum." International Journal of Molecular Medicine 29(2): 277-284.
Newman, D. J. and G. M. Cragg (2012). "Natural products as sources of new drugs over the 30 years from 1981 to 2010." Journal of natural products 75(3): 311-335.
Nicholson, D. W. (2000). "From bench to clinic with apoptosis-based therapeutic agents." Nature 407(6805): 810-816.

311
Northern Ireland Cancer Registry. "Prostate Cancer Statistics." Retrieved 18/9/2014, from http://www.qub.ac.uk/research-centres/nicr/CancerData/OnlineStatistics/Prostate/.
Nupponen, N. and T. Visakorpi (1999). "Molecular biology of progression of prostate cancer." European urology 35(5-6): 351-354.
Nupponen, N. N., L. Kakkola, P. Koivisto and T. Visakorpi (1998). "Genetic Alterations in Hormone-Refractory Recurrent Prostate Carcinomas." The American Journal of Pathology 153(1): 141-148.
Ochwang’i, D. O., C. N. Kimwele, J. A. Oduma, P. K. Gathumbi, J. M. Mbaria and S. G. Kiama (2014). "Medicinal plants used in treatment and management of cancer in Kakamega County, Kenya." Journal of ethnopharmacology 151(3): 1040-1055.
Oliveira, A. P., P. Baptista, P. B. Andrade, F. Martins, J. A. Pereira, B. M. Silva and P. Valentão (2012). "Characterization of Ficus carica L. cultivars by DNA and secondary metabolite analysis: Is genetic diversity reflected in the chemical composition?" Food research international 49(2): 710-719.
Paavonen, K., P. Puolakkainen, L. Jussila, T. Jahkola and K. Alitalo (2000). "Vascular endothelial growth factor receptor-3 in lymphangiogenesis in wound healing." The American journal of pathology 156(5): 1499-1504.
Paget, S. (1889). "The distribution of secondary growths in cancer of the breast." The Lancet 133(3421): 571-573.
Paller, C. J. and E. S. Antonarakis (2011). "Cabazitaxel: a novel second-line treatment for metastatic castration-resistant prostate cancer." Drug Design, Development and Therapy 5: 117-124.
Papathoma, A. S., V. Zoumpourlis, A. Balmain and A. Pintzas (2001). "Role of matrix metalloproteinase‐9 in progression of mouse skin carcinogenesis." Molecular carcinogenesis 31(2): 74-82.
Park, J. E., H. H. Chen, J. Winer, K. A. Houck and N. Ferrara (1994). "Placenta growth factor. Potentiation of vascular endothelial growth factor bioactivity, in vitro and in vivo, and high affinity binding to Flt-1 but not to Flk-1/KDR." Journal of Biological Chemistry 269(41): 25646-25654.
Peng, J., G. Fan and Y. Wu (2006). "Preparative isolation of four new and two known flavonoids from the leaf of Patrinia villosa Juss. by counter-current chromatography and evaluation of their anticancer activities in vitro." Journal of Chromatography A 1115(1): 103-111.
Perimenis, P., A. Galaris, A. Voulgari, M. Prassa and A. Pintzas (2016). "IAP antagonists Birinapant and AT-406 efficiently synergise with either TRAIL, BRAF, or BCL-2 inhibitors to sensitise BRAFV600E colorectal tumour cells to apoptosis." BMC cancer 16(1): 624.

312
Petrylak, D., C. Petrylak, M. H. A. Tangen, P. Hussain, J. Lara, M. Jones, P. Taplin, D. Burch, C. Berry, M. Moinpour, M. Kohli, E. Benson, D. Small, E. D. Raghavan and Crawford (2004). "Docetaxel and Estramustine Compared with Mitoxantrone and Prednisone for Advanced Refractory Prostate Cancer." The New England journal of medicine 351(15): 1513-1520.
Picard, J. C., A.-R. Golshayan, D. T. Marshall, K. J. Opfermann and T. E. Keane (2012). "The multi-disciplinary management of high-risk prostate cancer." Urologic Oncology: Seminars and Original Investigations 30(1): 3-15.
Pienta, K. J. and D. Bradley (2006). "Mechanisms underlying the development of androgen-independent prostate cancer." Clinical Cancer Research 12(6): 1665-1671.
Pignon, J.-C., B. Koopmansch, G. Nolens, L. Delacroix, D. Waltregny and R. Winkler (2009). "Androgen receptor controls EGFR and ERBB2 gene expression at different levels in prostate cancer cell lines." Cancer research 69(7): 2941-2949.
Poste, G. (1980). "The pathogenesis of cancer metastasis." Nature 283: 139-146.
Pound, C. and Pound (1999). "Natural History of Progression After PSA Elevation Following Radical Prostatectomy." JAMA: the Journal of the American Medical Association 281(17): 1591.
Pravettoni, A., O. Mornati, P. Martini, M. Marino, A. Colciago, F. Celotti, M. Motta and P. Negri-Cesi (2007). "Estrogen receptor beta (ERbeta) and inhibition of prostate cancer cell proliferation: studies on the possible mechanism of action in DU145 cells." Molecular and cellular endocrinology 263(1): 46-54.
Rådmark, O., O. Werz, D. Steinhilber and B. Samuelsson (2007). "5-Lipoxygenase: regulation of expression and enzyme activity." Trends in Biochemical Sciences 32(7): 332-341.
Ragasa, C. Y., P.-w. Tsai and C.-C. Shen (2009). "Terpenoids and sterols from the endemic and endangered Philippine trees, Ficus pseudopalma and Ficus ulmifolia." Philipp J Sci 138(2): 205-209.
Ransohoff, R. M. (2009). "Chemokines and chemokine receptors: standing at the crossroads of immunobiology and neurobiology." Immunity 31(5): 711-721.
Renehan, A. G., M. Zwahlen, C. Minder, S. T. O'Dwyer, S. M. Shalet and M. Egger "Insulin-like growth factor (IGF)-I, IGF binding protein-3, and cancer risk: systematic review and meta-regression analysis." The Lancet 363(9418): 1346-1353.
Rickman, D. S., H. Beltran, F. Demichelis and M. A. Rubin (2017). "Biology and evolution of poorly differentiated neuroendocrine tumors." Nature Medicine 23(6): 664-673.
Ridley, A. J., M. A. Schwartz, K. Burridge, R. A. Firtel, M. H. Ginsberg, G. Borisy, J. T. Parsons and A. R. Horwitz (2003). "Cell Migration: Integrating Signals from Front to Back." Science 302(5651): 1704-1709.

313
Roddam, A. W., N. E. Allen, P. Appleby, T. J. Key, L. Ferrucci, H. B. Carter, E. J. Metter, C. Chen, N. S. Weiss, A. Fitzpatrick, A. W. Hsing, J. V. Lacey, K. Helzlsouer, S. Rinaldi, E. Riboli, R. Kaaks, J. A. Janssen, M. F. Wildhagen, F. H. Schröder, E. A. Platz, M. Pollak, E. Giovannucci, C. Schaefer, C. P. Quesenberry, J. H. Vogelman, G. Severi, D. R. English, G. G. Giles, P. Stattin, G. Hallmans, M. Johansson, J. M. Chan, P. Gann, S. E. Oliver, J. M. Holly, J. Donovan, F. Meyer, I. Bairati and P. Galan (2008). "Insulin-like Growth Factors, Their Binding Proteins, and Prostate Cancer Risk: Analysis of Individual Patient Data from 12 Prospective Studies." Annals of internal medicine 149(7): 461-W488.
Roehrborn, C. G., P. Boyle, D. Bergner, T. Gray, M. Gittelman, T. Shown, A. Melman, R. B. Bracken, R. deVere White and A. Taylor (1999). "Serum prostate-specific antigen and prostate volume predict long-term changes in symptoms and flow rate: results of a four-year, randomized trial comparing finasteride versus placebo." Urology 54(4): 662-669.
Roodman, G. D. (2012). "Genes associate with abnormal bone cell activity in bone metastasis." Cancer and Metastasis Reviews 31(3-4): 569-578.
Roudier, M. P., C. Morrissey, L. D. True, C. S. Higano, R. L. Vessella and S. M. Ott (2008). "Histopathological assessment of prostate cancer bone osteoblastic metastases." The Journal of urology 180(3): 1154-1160.
Roussi, F., F. Guéritte and J. Fahy (2012). "The vinca alkaloids." Anticancer agents from natural products: 177-198.
Rowlands, M.-A., D. Gunnell, R. Harris, L. J. Vatten, J. M. P. Holly and R. M. Martin (2009). "Circulating insulin-like growth factor (IGF) peptides and prostate cancer risk: a systematic review and meta-analysis." International journal of cancer. Journal international du cancer 124(10): 2416-2429.
Rubens, R. (1998). "Bone metastases—the clinical problem." European Journal of Cancer 34(2): 210-213.
Rubin, C. and Rubin (1998). "The Genetic Basis of Human Cancer." Annals of Internal Medicine 129(9): 759.
Ryan, S., M. A. Jenkins and A. K. Win (2014). "Risk of Prostate Cancer in Lynch Syndrome: A Systematic Review and Meta-analysis." Cancer Epidemiology Biomarkers &amp; Prevention 23(3): 437.
Saelens, X., N. Festjens, L. V. Walle, M. Van Gurp, G. van Loo and P. Vandenabeele (2004). "Toxic proteins released from mitochondria in cell death." Oncogene 23(16): 2861-2874.
Saleem, M. (2009). "Lupeol, a novel anti-inflammatory and anti-cancer dietary triterpene." Cancer letters 285(2): 109-115.
Saleem, M., M.-H. Kweon, J.-M. Yun, V. M. Adhami, N. Khan, D. N. Syed and H. Mukhtar (2005). "A novel dietary triterpene Lupeol induces fas-mediated apoptotic

314
death of androgen-sensitive prostate cancer cells and inhibits tumor growth in a xenograft model." Cancer Research 65(23): 11203-11213.
Sandhu, G. S., K. G. Nepple, Y. S. Tanagho and G. L. Andriole (2013). Prostate cancer chemoprevention. Seminars in oncology, Elsevier.
Sankar, S., N. Mahooti-Brooks, L. Bensen, T. L. McCarthy, M. Centrella and J. A. Madri (1996). "Modulation of transforming growth factor beta receptor levels on microvascular endothelial cells during in vitro angiogenesis." Journal of Clinical Investigation 97(6): 1436-1446.
Santiago, L. A. and A. B. R. Mayor (2014). "Lupeol: an antioxidant triterpene in Ficus pseudopalma Blanco (Moraceae)." Asian Pacific journal of tropical biomedicine 4(2): 109-118.
Sarker, S. D. and L. Nahar (2012). "Hyphenated techniques and their applications in natural products analysis." Natural Products Isolation: 301-340.
Schantz, M. M., M. Bedner, S. E. Long, J. L. Molloy, K. E. Murphy, B. J. Porter, K. Putzbach, C. A. Rimmer, L. C. Sander and K. E. Sharpless (2008). "Development of saw palmetto (Serenoa repens) fruit and extract standard reference materials." Analytical and bioanalytical chemistry 392(3): 427-438.
Scher, H. I. and C. L. Sawyers (2005). "Biology of progressive, castration-resistant prostate cancer: directed therapies targeting the androgen-receptor signaling axis." Journal of Clinical Oncology 23(32): 8253-8261.
Sedlock, D. M., H. H. Sun, W. F. Smith, K. Kawaoka, A. M. Gillum and R. Cooper (1992). "Rapid identification of teleocidins in fermentation broth using HPLC photodiode array and LC/MS methodology." Journal of Industrial Microbiology & Biotechnology 9(1): 45-52.
Senger, D. R., S. J. Galli, A. M. Dvorak, C. A. Perruzzi, V. S. Harvey and H. F. Dvorak (1983). "Tumor cells secrete a vascular permeability factor that promotes accumulation of ascites fluid." Science 219(4587): 983-985.
Shafi, A. A., A. E. Yen and N. L. Weigel (2013). "Androgen receptors in hormone-dependent and castration-resistant prostate cancer." Pharmacology & therapeutics 140(3): 223-238.
Shen, M. M. and C. Abate-Shen (2010). "Molecular genetics of prostate cancer: new prospects for old challenges." Genes & development 24(18): 1967-2000.
Shi, X., M. Sun, H. Liu, Y. Yao and Y. Song (2013). "Long non-coding RNAs: a new frontier in the study of human diseases." Cancer letters 339(2): 159-166.
Shibuya, M., S. Yamaguchi, A. Yamane, T. Ikeda, A. Tojo, H. Matsushime and M. Sato (1990). "Nucleotide sequence and expression of a novel human receptor-type tyrosine kinase gene (flt) closely related to the fms family." Oncogene 5(4): 519-524.

315
Singareddy, R., L. Semaan, M. K. Conley-LaComb, J. S. John, K. Powell, M. Iyer, D. Smith, L. K. Heilbrun, D. Shi and W. Sakr (2013). "Transcriptional regulation of CXCR4 in prostate cancer: significance of TMPRSS2-ERG fusions." Molecular Cancer Research 11(11): 1349-1361.
Singh, S., U. P. Singh, W. E. Grizzle and J. W. Lillard (2004). "CXCL12–CXCR4 interactions modulate prostate cancer cell migration, metalloproteinase expression and invasion." Laboratory investigation 84(12): 1666-1676.
Skehan, P., R. Storeng, D. Scudiero, A. Monks, J. McMahon, D. Vistica, J. T. Warren, H. Bokesch, S. Kenney and M. R. Boyd (1990). "New colorimetric cytotoxicity assay for anticancer-drug screening." Journal of the National Cancer Institute 82(13): 1107-1112.
Slee, E. A., M. T. Harte, R. M. Kluck, B. B. Wolf, C. A. Casiano, D. D. Newmeyer, H.-G. Wang, J. C. Reed, D. W. Nicholson, E. S. Alnemri, D. R. Green and S. J. Martin (1999). "Ordering the Cytochrome c–initiated Caspase Cascade: Hierarchical Activation of Caspases-2, -3, -6, -7, -8, and -10 in a Caspase-9–dependent Manner." The Journal of Cell Biology 144(2): 281-292.
Soga, N., J. O. Connolly, M. Chellaiah, J. Kawamura and K. A. Hruska (2009). "Rac regulates vascular endothelial growth factor stimulated motility." Cell communication & adhesion.
Somwong, P., R. Suttisri and A. Buakeaw (2013). "New sesquiterpenes and phenolic compound from Ficus foveolata." Fitoterapia 85: 1-7.
Sowter, H., A. Corps, A. Evans, D. Clark, D. Charnock-Jones and S. Smith (1997). "Expression and localization of the vascular endothelial growth factor family in ovarian epithelial tumors." Laboratory investigation; a journal of technical methods and pathology 77(6): 607-614.
Sporn, M. B. and D. L. Newton (1979). Chemoprevention of cancer with retinoids. Federation proceedings.
Springfield, E., P. Eagles and G. Scott (2005). "Quality assessment of South African herbal medicines by means of HPLC fingerprinting." Journal of ethnopharmacology 101(1): 75-83.
Srinivasula, S. M., R. Hegde, A. Saleh, P. Datta, E. Shiozaki, J. Chai, R.-A. Lee, P. D. Robbins, T. Fernandes-Alnemri and Y. Shi (2001). "A conserved XIAP-interaction motif in caspase-9 and Smac/DIABLO regulates caspase activity and apoptosis." Nature 410(6824): 112-116.
Stamatiou, K., A. Alevizos, E. Agapitos and F. Sofras (2006). "Incidence of impalpable carcinoma of the prostate and of non‐malignant and precarcinomatous lesions in Greek male population: An autopsy study." The Prostate 66(12): 1319-1328.

316
Stetler-Stevenson, W. G. (1990). "Type IV collagenases in tumor invasion and metastasis." Cancer and Metastasis Reviews 9(4): 289-303.
Stoner, E. (1994). "Three-year safety and efficacy data on the use of finasteride in the treatment of benign prostatic hyperplasia." Urology 43(3): 284-294.
Su, Q., K. G. Rowley and N. D. Balazs (2002). "Carotenoids: separation methods applicable to biological samples." Journal of Chromatography B 781(1): 393-418.
Sun, X., G. Cheng, M. Hao, J. Zheng, X. Zhou, J. Zhang, R. S. Taichman, K. J. Pienta and J. Wang (2010). "CXCL12/CXCR4/CXCR7 Chemokine Axis and Cancer Progression." Cancer metastasis reviews 29(4): 709-722.
Sun, Y. X., A. Schneider, Y. Jung, J. Wang, J. Dai, J. Wang, K. Cook, N. I. Osman, A. J. Koh‐Paige and H. Shim (2005). "Skeletal localization and neutralization of the SDF‐1 (CXCL12)/CXCR4 axis blocks prostate cancer metastasis and growth in osseous sites in vivo." Journal of Bone and Mineral Research 20(2): 318-329.
Sun, Y. X., J. Wang, C. E. Shelburne, D. E. Lopatin, A. M. Chinnaiyan, M. A. Rubin, K. J. Pienta and R. S. Taichman (2003). "Expression of CXCR4 and CXCL12 (SDF‐1) in human prostate cancers (PCa) in vivo." Journal of cellular biochemistry 89(3): 462-473.
Taichman, R. S., C. Cooper, E. T. Keller, K. J. Pienta, N. S. Taichman and L. K. McCauley (2002). "Use of the Stromal Cell-derived Factor-1/CXCR4 Pathway in Prostate Cancer Metastasis to Bone." Cancer Research 62(6): 1832.
Tan, M. H. E., J. Li, H. E. Xu, K. Melcher and E.-l. Yong (2015). "Androgen receptor: structure, role in prostate cancer and drug discovery." Acta Pharmacol Sin 36(1): 3-23.
Tannock, I. F., D. Osoba, M. R. Stockler, D. S. Ernst, A. J. Neville, M. J. Moore, G. R. Armitage, J. J. Wilson, P. M. Venner, C. M. Coppin and K. C. Murphy (1996). "Chemotherapy with mitoxantrone plus prednisone or prednisone alone for symptomatic hormone-resistant prostate cancer: a Canadian randomized trial with palliative end points." Journal of Clinical Oncology 14(6): 1756-1764.
Taylor, B. S., N. Schultz, H. Hieronymus, A. Gopalan, Y. Xiao, B. S. Carver, V. K. Arora, P. Kaushik, E. Cerami and B. Reva (2010). "Integrative genomic profiling of human prostate cancer." Cancer cell 18(1): 11-22.
Terman, B. I., M. Dougher-Vermazen, M. E. Carrion, D. Dimitrov, D. C. Armellino, D. Gospodarowicz and P. Böhlen (1992). "Identification of the KDR tyrosine kinase as a receptor for vascular endothelial cell growth factor." Biochemical and biophysical research communications 187(3): 1579-1586.
Thelen, M. (2001). "Dancing to the tune of chemokines." Nature immunology 2(2): 129-134.

317
Thompson, D., D. F. Easton and t. B. C. L. Consortium (2002). "Cancer Incidence in BRCA1 Mutation Carriers." Journal of the National Cancer Institute 94(18): 1358-1365.
Tomisawa, M., T. Tokunaga, Y. Oshika, T. Tsuchida, Y. Fukushima, H. Sato, H. Kijima, H. Yamazaki, Y. Ueyama and N. Tamaoki (1999). "Expression pattern of vascular endothelial growth factor isoform is closely correlated with tumour stage and vascularisation in renal cell carcinoma." European Journal of Cancer 35(1): 133-137.
Trottier, G., P. J. Bostrom, N. Lawrentschuk and N. E. Fleshner (2010). "Nutraceuticals and prostate cancer prevention: a current review." Nat Rev Urol 7(1): 21-30.
Tsai, P.-W., K. A. De Castro-Cruz, C.-C. Shen, C.-T. Chiou and C. Y. Ragasa (2012). "Chemical constituents of Ficus odorata." Pharmaceutical Chemistry Journal 46(4): 225-227.
Tsukamoto, S., H. Akaza, M. Onozawa, T. Shirai and Y. Ideyama (1998). "A five‐alpha reductase inhibitor or an antiandrogen prevents the progression of microscopic prostate carcinoma to macroscopic carcinoma in rats." Cancer 82(3): 531-537.
Tucker, O. N., A. J. Dannenberg, E. K. Yang, F. Zhang, L. Teng, J. M. Daly, R. A. Soslow, J. L. Masferrer, B. M. Woerner and A. T. Koki (1999). "Cyclooxygenase-2 expression is up-regulated in human pancreatic cancer." Cancer research 59(5): 987-990.
Uchio, E. and Uchio (2010). "Impact of Biochemical Recurrence in Prostate Cancer Among US Veterans." Archives of internal medicine 170(15): 1390.
Umbas, R., J. A. Schalken, T. W. Aalders, B. S. Carter, H. F. M. Karthaus, H. K. Schaafsma, F. M. J. Debruyne and W. B. Isaacs (1992). "Expression of the Cellular Adhesion Molecule E-Cadherin Is Reduced or Absent in High-Grade Prostate Cancer." Cancer Research 52(18): 5104-5109.
Uyub, A. M., I. N. Nwachukwu, A. A. Azlan and S. S. Fariza (2010). "In-vitro antibacterial activity and cytotoxicity of selected medicinal plant extracts from Penang Island Malaysia on metronidazole-resistant-Helicobacter pylori and some pathogenic bacteria."
Vaux, D. L. and S. J. Korsmeyer (1999). "Cell death in development." Cell 96(2): 245-254.
Veeresham, C. (2012). "Natural products derived from plants as a source of drugs." Journal of Advanced Pharmaceutical Technology & Research 3(4): 200-201.
Velcheti, V., S. Karnik, S. F. Bardot and O. Prakash (2008). "Pathogenesis of Prostate Cancer: Lessons from Basic Research." The Ochsner Journal 8(4): 213-218.
318
Verdonk, M. L., J. C. Cole, M. J. Hartshorn, C. W. Murray and R. D. Taylor (2003). "Improved protein–ligand docking using GOLD." Proteins: Structure, Function, and Bioinformatics 52(4): 609-623.
Verhagen, A. M., P. G. Ekert, M. Pakusch, J. Silke, L. M. Connolly, G. E. Reid, R. L. Moritz, R. J. Simpson and D. L. Vaux (2000). "Identification of DIABLO, a mammalian protein that promotes apoptosis by binding to and antagonizing IAP proteins." Cell 102(1): 43-53.
Vichai, V. and K. Kirtikara (2006). "Sulforhodamine B colorimetric assay for cytotoxicity screening." Nat Protoc 1(3): 1112-1116.
Vickers, A. (2004). "Alternative cancer cures:“Unproven” or “disproven”?" CA: a cancer journal for clinicians 54(2): 110-118.
Vindrieux, D., P. Escobar and G. Lazennec (2009). "Emerging roles of chemokines in prostate cancer." Endocrine-related cancer 16(3): 663-673.
Visakorpi, T., A. H. Kallioniemi, A.-C. Syvänen, E. R. Hyytinen, R. Karhu, T. Tammela, J. J. Isola and O.-P. Kallioniemi (1995). "Genetic Changes in Primary and Recurrent Prostate Cancer by Comparative Genomic Hybridization." Cancer Research 55(2): 342-347.
Volm, M., R. Koomägi and J. Mattern (1997). "Prognostic value of vascular endothelial growth factor and its receptor Flt‐1 in squamous cell lung cancer." International journal of cancer 74(1): 64-68.
Walczak, H. and P. H. Krammer (2000). "The CD95 (APO-1/Fas) and the TRAIL (APO-2L) Apoptosis Systems." Experimental Cell Research 256(1): 58-66.
Walsh, J. G., S. P. Cullen, C. Sheridan, A. U. Lüthi, C. Gerner and S. J. Martin (2008). "Executioner caspase-3 and caspase-7 are functionally distinct proteases." Proceedings of the National Academy of Sciences 105(35): 12815-12819.
Walsh, P. C. (2010). Chemoprevention of prostate cancer, Mass Medical Soc.
Wang, B., D. T. Hendricks, F. Wamunyokoli and M. I. Parker (2006). "A Growth-Related Oncogene/CXC Chemokine Receptor 2 Autocrine Loop Contributes to Cellular Proliferation in Esophageal Cancer." Cancer Research 66(6): 3071-3077.
Wang, F. (2006). "Culture of animal cells: A manual of basic technique, fifth edition." In Vitro Cellular & Developmental Biology - Animal 42(5): 169-169.
Wang, M., T. Wang, S. Liu, D. Yoshida and A. Teramoto (2003). "The expression of matrix metalloproteinase-2 and-9 in human gliomas of different pathological grades." Brain tumor pathology 20(2): 65-72.
Wang, X., J. L. Martindale and N. J. Holbrook (2000). "Requirement for ERK activation in cisplatin-induced apoptosis." Journal of Biological Chemistry 275(50): 39435-39443.

319
Warren, R. S., H. Yuan, M. R. Matli, N. A. Gillett and N. Ferrara (1995). "Regulation by vascular endothelial growth factor of human colon cancer tumorigenesis in a mouse model of experimental liver metastasis." Journal of Clinical Investigation 95(4): 1789.
Watahiki, A., Y. Wang, J. Morris, K. Dennis, H. M. O'Dwyer, M. Gleave, P. W. Gout and Y. Wang (2011). "MicroRNAs associated with metastatic prostate cancer." PloS one 6(9): e24950.
Watkins Bruner, D., D. Moore, A. Parlanti, J. Dorgan and P. Engstrom (2003). "Relative risk of prostate cancer for men with affected relatives: Systematic review and meta-analysis." International Journal of Cancer 107(5): 797-803.
Welsh Cancer Intelligence and Surveillance Unit. "Cancer Statistics." Retrieved 18/9/2014, from http://www.wcisu.wales.nhs.uk/cancer-statistics.
Werz, O. and D. Steinhilber (2006). "Therapeutic options for 5-lipoxygenase inhibitors." Pharmacology & Therapeutics 112(3): 701-718.
Wolfesberger, B., I. Walter, C. Hoelzl, J. G. Thalhammer and M. Egerbacher (2006). "Antineoplastic effect of the cyclooxygenase inhibitor meloxicam on canine osteosarcoma cells." Research in veterinary science 80(3): 308-316.
Wynder, E. L., Y. Fujita, R. E. Harris, T. Hirayama and T. Hiyama (1991). "Comparative epidemiology of cancer between the united states and japan. A second look." Cancer 67(3): 746-763.
Xie, Q.-C. and Y.-P. Yang (2014). "Anti-proliferative of physcion 8-O-β -glucopyranoside isolated from Rumex japonicus Houtt. on A549 cell lines via inducing apoptosis and cell cycle arrest." BMC complementary and alternative medicine 14(1): 1.
Yan, M., B. A. Parker, R. Schwab and R. Kurzrock (2014). "HER2 aberrations in cancer: Implications for therapy." Cancer Treatment Reviews 40(6): 770-780.
Yan, S.-l., C.-y. Huang, S.-t. Wu and M.-c. Yin (2010). "Oleanolic acid and ursolic acid induce apoptosis in four human liver cancer cell lines." Toxicology in vitro 24(3): 842-848.
Yang, J., Q. Liang, M. Wang, C. Jeffries, D. Smithson, Y. Tu, N. Boulos, M. R. Jacob, A. A. Shelat, Y. Wu, R. R. Ravu, R. Gilbertson, M. A. Avery, I. A. Khan, L. A. Walker, R. K. Guy and X.-C. Li (2014). "UPLC-MS-ELSD-PDA as A Powerful Dereplication Tool to Facilitate Compound Identification from Small Molecule Natural Product Libraries." Journal of natural products 77(4): 902-909.
Yang, P., C. A. Cartwright, J. I. N. Li, S. Wen, I. N. Prokhorova, I. Shureiqi, P. Troncoso, N. M. Navone, R. A. Newman and J. Kim (2012). "Arachidonic acid metabolism in human prostate cancer." International Journal of Oncology 41(4): 1495-1503.

320
Yoshiji, H., D. E. Gomez, M. Shibuya and U. P. Thorgeirsson (1996). "Expression of vascular endothelial growth factor, its receptor, and other angiogenic factors in human breast cancer." Cancer Research 56(9): 2013-2016.
Yuan, X., C. Cai, S. Chen, S. Chen, Z. Yu and S. P. Balk (2014). "Androgen receptor functions in castration-resistant prostate cancer and mechanisms of resistance to new agents targeting the androgen axis." Oncogene 33(22): 2815-2825.
Zakaria, M. and M. A. Mohd (2010). Traditional Malay medicinal plants, ITBM.
Zakaria, Z. A., M. K. Hussain, A. S. Mohamad, F. C. Abdullah and M. R. Sulaiman (2012). "Anti-Inflammatory Activity of the Aqueous Extract of Ficus Deltoidea." Biological Research For Nursing 14(1): 90-97.
Zamzami, N., P. Marchetti, M. Castedo, C. Zanin, J.-L. Vayssiere, P. X. Petit and G. Kroemer (1995). "Reduction in mitochondrial potential constitutes an early irreversible step of programmed lymphocyte death in vivo." The Journal of experimental medicine 181(5): 1661-1672.
Zarnowski, R., Y. Suzuki, Y. Esumi and S. J. Pietr (2000). "5-n-Alkylresorcinols from the green microalga Apatococcus constipatus." Phytochemistry 55(8): 975-977.
Zeng, X., Z. Hu, Z. Wang, J. Tao, T. Lu, C. Yang, B. Lee and Z. Ye (2014). "Upregulation of RASGRP3 expression in prostate cancer correlates with aggressive capabilities and predicts biochemical recurrence after radical prostatectomy." Prostate cancer and prostatic diseases 17(2): 119-125.
Zeng, Z.-S., A. M. Cohen and J. G. Guillem (1999). "Loss of basement membrane type IV collagen is associated with increased expression of metalloproteinases 2 and 9 (MMP-2 and MMP-9) during human colorectal tumorigenesis." Carcinogenesis 20(5): 749-755.
Zheng, S.-Y., Y. Li, D. Jiang, J. Zhao and J.-F. Ge (2012). "Anticancer effect and apoptosis induction by quercetin in the human lung cancer cell line A-549." Mol Med Report 5(3): 822-826.
Zhou, Y., Y. E. Liu, J. Cao, G. Zeng, C. Shen, Y. Li, M. Zhou, Y. Chen, W. Pu and L. Potters (2009). "Vitexins, nature-derived lignan compounds, induce apoptosis and suppress tumor growth." Clinical Cancer Research 15(16): 5161-5169.
Zöller, B., X. Li, J. Sundquist and K. Sundquist "Familial transmission of prostate, breast and colorectal cancer in adoptees is related to cancer in biological but not in adoptive parents: A nationwide family study." European Journal of Cancer 50(13): 2319-2327.
Zubrod, C. G. (1984). "Origins and development of chemotherapy research at the National Cancer Institute." Cancer treatment reports 68(1): 9-19.

321
Chapter 7
Appendix

322
7 Appendix
Appendix 1
Chairman: Prof. Dr. Rudolf Bauer Karl-Franzens-Universität Graz Institut für Pharmazeutische Wissenschaften -Pharmakognosie Universitätsplatz 4 8010 Graz, Austria Tel.: +43-(0)316-380 8700 Fax: +43-(0)316-380 9860 [email protected]
http://www.plantsforhealth.org/
Mr. Mohd Mukrish bin Mohd Hanafi
Department of pharmaceutical and
biological chemistry
UCL School of Pharmacy
29-39 Brunswick Square
WC1N 1AX, London
United Kingdom
1st Research Award of the Foundation Plants for Health
13.09.2016
Dear Mr. Mohd Mukrish bin Mohd Hanafi,
Thank you very much for your application for the 1st Research Award of the Foundation Plants for Health.
We are happy to inform you, that among several excellent applications, your and one other proposal have
been selected by the Board of the Foundation Plants for Health for the Research Award of the Foundation
Plants for Health in 2016.
By the award, the foundation Plants for Health wants to provide start-up funds, which help to develop projects
leading to promising developments in the area of medicinal plant and natural product research including the
search for innovative lead compounds, exciting product ideas and novel pharmacological, clinical and other
approaches in medicinal plant and natural product research. The grant is intended to support visits of
collaborative labs for performing experiments or learning innovative techniques.
The foundation Plants for Health will provide you a research subsidy of 1.500 € to initiate a research
collaboration with Prof Jean-Luc Wolfender of University of Geneva in order to gain more understanding and
learn new methods and techniques in plant metabolomics research.
Please contact our treasurer Dr. Bernd Röther at [email protected] to arrange transfer of the money.
We are expecting you to report to the foundation about the outcome of your collaborative research until 31st
of August 2017, and to present results at the GA meeting in Basel.
Wishing you a successful project!
Best regards,
Prof. Dr. Rudolf Bauer
Chairman of the Foundation Plants for Health