in vitro measurement of drug efficiency index to aid early lead optimization
TRANSCRIPT

RESEARCH ARTICLE
In Vitro Measurement of Drug Efficiency Index to AidEarly Lead Optimization
KLARA VALKO,1 ELISABETTA CHIARPARIN,2 SHENAZ NUNHUCK,1 DINO MONTANARI3
1Analytical Chemistry, Platform Technology and Science, GlaxoSmithKline, Stevenage, UK
2Astex Therapeutics, Cambridge, UK
3Aptuit (Verona) Srl, Verona, Italy
Received 13 April 2012; revised 26 July 2012; accepted 3 August 2012
Published online in Wiley Online Library (wileyonlinelibrary.com). DOI 10.1002/jps.23305
ABSTRACT: The concepts of drug efficiency (Deff) and Drug Efficiency Index (DEI) have beenrecently introduced as useful parameters to optimize the absorption, distribution, metabolism,elimination/excretion, and toxicity properties and in vivo efficacy potential of molecules dur-ing lead optimization and at pre-clinical stages. The available free drug concentration relativeto dose depends on the compound’s bioavailability, clearance, and the nonspecific binding toproteins and phospholipids. In this paper, we have demonstrated, using the data of over 115known drug molecules, that the nonspecific binding can be determined in vitro very efficientlyusing biomimetic high-performance liquid chromatography measurements. DEI can thereforebe estimated from in vitro measurements. The data show that high in vitro DEI values can beassociated with lower efficacious dose. A strategy is described of how to use the DEI parameterduring early lead optimization. An example is given to highlight the advantages of optimiz-ing on DEI value rather than on potency alone. In order to facilitate the in silico compounddesign, correlation between in vitro DEI and in silico ligand efficiency parameters such asligand lipophilicity efficiency has been revealed, suggesting the potential use of these efficiency-related parameters across lead optimization. © 2012 Wiley Periodicals, Inc. and the AmericanPharmacists Association J Pharm SciKeywords: ADME; biomimetics; HPLC (high-performance/pressure liquid chromatography);log P; protein binding; phospholipids; tissue partition; drug-like properties
INTRODUCTION
Traditionally, at early stages of the drug discoveryprocess, medicinal chemistry has been focused ondesigning compounds with high affinity to the tar-get of interest. The importance of physicochemicalproperties such as size, polar surface area, lipophilic-ity, and solubility besides potency has also beenrecognized.1–5 It is more and more accepted thatpotency alone should not drive compound progres-sion. Recently, several ligand efficiency parametershave been introduced6–9 that relate potency (Kd orrelated pXC50) to size, lipophilicity, or polar surface
Additional Supporting Information may be found in the onlineversion of this article. Supporting Information
Dino Montanari’s present address is H. Lundbeck A/S, Valby,Denmark.
Correspondence to: Klara Valko (Telephone: +44-1438-76-3309;Fax: +44-1438-76-3352; E-mail: [email protected])Journal of Pharmaceutical Sciences© 2012 Wiley Periodicals, Inc. and the American Pharmacists Association
area. These efficiency parameters help to design com-pounds that bind to the target by maximizing thespecific interaction within the binding site while min-imizing hydrophobic forces. The ligand efficiency pa-rameters are higher for compounds that have highpotency with lower molecular weight and lipophilic-ity. The ligand lipophilicity efficiency (LLE) has beenrecently introduced9 as a normalization of the potencyby the drug lipophilicity obtained from calculated oc-tanol–water partition coefficient (clog P). It is arguedthat the most ligand efficient compounds have thehighest probability to be specific binders, therefore,reducing the chances of compound’s binding to otherproteins and/or to other major components of the body.The drug efficiency (Deff) has been defined as the freebiophase concentration at the site of action relativeto dose10 measured in vivo during animal pharma-cokinetic (PK) studies. Deff concept suggests maximiz-ing the in vivo free concentration at the site of ac-tion. When a drug is administered orally, absorption,
JOURNAL OF PHARMACEUTICAL SCIENCES 1

2 VALKO ET AL.
clearance, and various permeability barriers may re-duce the available free concentration at the site ofaction. Another major contributor for the reducedfree concentration is the compound’s nonspecific bind-ing to proteins and phospholipids. The effect of thenonspecific binding can be described by the unboundvolume of distribution (Vdu), which relates the freeplasma concentration to the dose.11 As it is difficult todefine the time point and the site of action where thefree concentration of the active molecules should bedetermined, Braggio et al.10 have defined the maxi-mum Deff (Deff max) derived from the steady-state Vdu.This requires the determination of the free plasmaconcentration relative to dose. The Deff max, which isthe reciprocal value of the Vdu, can be considered asthe best case scenario when the compound’s bioavail-ability is 100%, and no active transport and/or per-meability barriers impact the free biophase concen-tration. The Vdu is obtained by dividing the volumeof distribution with the unbound fraction of the drugin plasma, thus it accounts for both the plasma pro-tein binding and the tissue binding. Known drugmolecules have high Deff, typically above 1% of theadministered dose is available at the site of action.The Deff parameter has been suggested to be used to-gether with the potency for drug candidate ranking.12
More recently,12 the sum of the potency and the log-arithmic value of in vivo Deff (log Deff) termed as theDrug Efficiency Index (DEI) has been suggested forcompound’s ranking. It has been shown that the DEIis proportional to the ratio of the occupied and unoc-cupied receptors per unit of dose.12 Compounds withslightly lower potency but better in vivo Deff may havehigher DEI values and may achieve the same receptoroccupancy in vivo with smaller dose. Drug moleculesadministered at low dose are less likely to show un-wanted side effects or safety issues.13 It has beenshown that compounds with high DEI values requirelower dose. When the in vivo Deff is 100%, it meansthat the DEI is two units higher than the pXC50.When the Deff is less than 1%, the logarithmic valuebecomes negative, which means that the DEI valuesbecome smaller than the pXC50 value, indicating theloss of potency in vivo.
Although the ligand efficiency parameters are ob-tained from the in vitro potency and some simple cal-culated parameter, such as molecular weight and cal-culated octanol–water partition coefficient (clog P),the estimation of Deff requires in vivo experiments,which makes it more resource intensive to obtain DEIvalues for large number of compounds. Therefore,we introduce the concept of in vitro Deff max, whichpredicts the nonspecific binding of the compound invivo. The in vitro determined Deff max is the maxi-mum we can achieve in vivo and it refers to the freeplasma concentration relative to dose. The Deff maxvalue does not take into account the loss of com-
pound during oral absorption, restricted permeabil-ity, or active transport processes; however, it accountsfor a compound’s nonspecific binding to the majorcomponents in plasma and tissues, such as proteinsand phospholipids. We have developed several high-performance liquid chromatography (HPLC)-basedmeasurements of biomimetic partition coefficients.Thus, HPLC-based protein binding and phospholipidbinding measurements can be used to estimate theVdu and tissue binding.14,15 The Vdu is in principlethe reciprocal value of Deff max thus the same predic-tive model has been used in this study to estimatethe Deff max in vitro. Using the literature related to invivo Deff and potency data of known drugs, the possi-bility of estimating Deff max in vitro is investigated inthis paper. We have analyzed the in vitro potency, theefficacious clinical dose, and in vivo Deff data of 115known drug molecules for which we have determinedthe in vitro Deff. The aim of the study was to investi-gate the correlation of the in vitro DEImax with in vivoDEImax and in vivo DEI values and to demonstrate theadvantages of using the DEI data obtained from invitro experiments during lead optimization. The com-parison of in vitro/in silico ligand efficiency data wasalso important to see how the ligand efficiency param-eters relate to the DEI. Here, we investigate whetherthe in vitro DEI can close the gap between LLE andin vivo DEI. The relationships between DEI obtainedfrom in vitro measurements and other calculated andmeasured physicochemical data have also been inves-tigated to assess the benefits of using the suggestedin vitro DEImax values for compounds ranking duringearly lead optimization.
EXPERIMENTAL
The investigated compounds were either known drugmolecules obtained from commercial sources or in-house project compounds that passed the in-house liq-uid chromatography–mass spectrometry quality con-trol test (purity is above 90%).
All biomimetic HPLC measurements were carriedout on Agilent 1100 HPLC instrument equipped withautosampler and diode array UV detector (AgilentTechnologies, Ltd., Wokingham, Berkshire, UK).
The determination of compound binding to humanserum albumin (HSA) has been carried out by re-tention time measurements using immobilized HSAHPLC columns obtained from Chiral TechnologiesLtd., Illkirch, France. The column dimensions were50 × 3 mm2. The mobile phase was 50 mM ammoniumacetate buffer (pH 7.4) and HPLC-grade 2-propanol.The mobile phase flow rate was 1.8 mL/min applying2.5 min 2-propanol gradient up to 30%. From 2.5 to4.5 min, the 2-propanol concentration in the mobilephase was kept at 30%. From 4.5 to 4.6 min, the 2-propanol concentration was decreased to zero percent
JOURNAL OF PHARMACEUTICAL SCIENCES DOI 10.1002/jps

IN VITRO MEASUREMENT OF DRUG EFFICIENCY INDEX TO AID EARLY LEAD OPTIMIZATION 3
Table 1. Definition of the Drug Efficiency Parameters Studied
Term Definition
In vivo Deff = 100 × free biophase concentration/doseDose given by oral administration, biophase concentration is determined at various time points.
In vivo Deff max = 100 × free plasma concentration/dose = 100/Vdu (Vdu is the unbound steady-state volume of distribution)It is derived from the steady-state free plasma concentration after intravenous administration of the dose in
appropriate intervals to develop the steady-state plasma concentration. The so-obtained steady-state volume ofdistribution has been divided by the unbound fraction of the drug in plasma.
In vivo DEI = pXC50 + log(in vivo Deff)In vivo DEImax = pXC50 + log(in vivo Deff max)In vitro Deff max = 100/10log Vdu = 100/10(0.23 × log K
HSA+0.43 × log K
IAM−0.72)
Obtained from biomimetic HPLC measurements of HSA and IAM binding using the published unbound volume ofdistribution model17: (log Vdu = 0.23 × log KHSA+ 0.43 × log KIAM−0.72)
In vitro DEImax = pXC50 + log(in vitro Deff max)LLE = pXC50 − clog P
and kept like that until the end of the gradient runwhich was 6 min. A calibration set of compounds hasbeen analyzed first for which plasma protein bindingdata were available. The calculation of the HSA bind-ing data expressed as log K(HSA) and %HSA bindinghas been carried out as described previously.16
The determination of compound binding to immobi-lized artificial membrane (IAM) has been carried outby retention time measurements on IAM column ob-tained from Regis Technologies, Inc., Morton Grove,IL, USA. The column dimensions were 150 × 4.5 mm2
packed with IAM DD2 stationary phase. The IAMphase mimics the chemically bonded phosphatidyl-cholin. The mobile phase flow rate was 2 mL/min.Acetonitrile gradient was applied with 50 mM ammo-nium acetate buffer at pH 7.4. The acetonitrile gradi-ent was achieved by increasing the acetonitrile con-centration from zero percent to 70% in 2.5 min. Theacetonitrile concentration is kept at 70% from 2.5 to3 min, and then reduced to zero in 0.3 min. The col-umn is re-equilibrated with 100% 50 mM ammoniumacetate buffer (pH 7.4) until the end of the run time,which is 5 min. Using the calibration set of compoundsand their CHI IAM data previously published,17 thegradient retention times of the compounds are con-verted to log kIAM values using the equation as logkIAM = 0.046 × CHI IAM + 0.42. In order to obtainlog K values that have linear relationship to the oc-tanol–water (log P) values, the log KIAM values areobtained as exp(log kIAM). In order to match the logKIAM scale to the log P scale, we applied the follow-ing constant that was obtained by plotting the exp(logkIAM) values of acetophenone homolog series up to theoctanophenone, in the function of their log P values:0.29 as slope and 0.72 as intercept.17
The clog P values were calculated using Daylightsoftware (Daylight Chemical Information System,Inc., Laguna, Niguel, CA, USA).
In vivo data of known drugs listed in Table 1were obtained from various databases.18 The Deff hasbeen calculated from the literature data as discussedbelow.10
THEORY
The DEI has been defined12 as the sum of the pXC50and the log Deff.
It has been published and discussed12 that DEI val-ues are equivalent to the receptor occupancy per unitof dose, as shown by Eqs. 1–4. Equation 1 defines thereceptor engagement (% occupancy, RO%).
RO% = [Drug]Biophase
Kd + [Drug]Biophase× 100 (1)
where Kd is the dissociation constant of the drugmolecule with the receptor measured in vitro.[DRUG]Biophase refers to the free concentration of thedrug at the site of action. Equation 2 shows the ex-pression for receptor occupancy per unit of dose (RO%/Dose).
RO%Dose
= [Drug]Biophase/DoseKd + [Drug]Biophase
× 100 (2)
The Deff is defined10 by Eq. 3 and it is a dimension-less number when we consider 1 mL of biophase beingequal to 1 g bodyweight. Then, we can introduce Eq.3 to Eq. 2 to obtain Eq. 4.
Deff = [Drug]Biophase (mg/mL)[Dose] (mg/g)
× 100 (3)
RO%Dose
= Deff
Kd + [Drug]Biophase(4)
Taking the logarithmic values of both side of Eq. 4and by rearranging it, we can obtain Eq. 5 publishedby Montanari et al.12 The negative logarithm of theKd can be approximated by the more commonly usedpIC50 or pEC50 values as a measure of potency (citedhere as pXC50).
It can be seen from Eq. 5 that the DEI (the sumof the log Deff and pXC50) is proportional to the
DOI 10.1002/jps JOURNAL OF PHARMACEUTICAL SCIENCES

4 VALKO ET AL.
logarithmic value of the proportion of the occupiedand unoccupied receptors per unit of dose.
DEI = log Deff + pXC50
= log(RO%)
100 − (RO%)+ 2 − log (Dose) (5)
The expression of RO%/(100 − RO%) basically isequivalent to the proportion of the occupied and unoc-cupied receptors. According to the free drug hypoth-esis discussed in details by Smith et al.,19 the freeplasma concentration is equivalent to the free con-centration of the compound in tissues, when no per-meability barrier or active transporters are presentto prevent the equilibrium. Applying the free plasmaconcentration in Eq. 3 gives the Deff max shown by Eq.6 that can be achieved in vivo on the basis of the freeplasma concentration.
Deff max = [Drug]free plasma (mg/mL)[Dose] (mg/g)
× 100 (6)
Deff max values are much easier to derive from clin-ical data of known drugs. It can be calculated fromthe steady-state volume of distribution (Vdss) and thefraction unbound in plasma (fu) using Eq. 7.
Deff max = 100 × f u
Vdss= 100
Vdu(7)
The Vdss can be considered as the dose divided bythe total plasma concentration. The Vdu is the dose di-vided by the free plasma concentration. It also meansthat the maximum achievable Deff is proportional tothe reciprocal value of the Vdu. Therefore, we haveused the same published model to estimate Deff max aswas used to estimate Vdu
15 (see Eq. 8).
Invitro log Deff max
= 2 − log (0.23 × log KHSA + 0.43 × log KIAM − 0.72)
(8)
where log KHSA = exp(log kHSA) and log KIAM =0.29 × exp(log kIAM) + 0.70 as described previously.17
The published17Vdu model has been developed usingsteady-state human volume of distribution data af-ter intravenous (i.v.) administration. The model wasbuilt on 70 known drug molecules and tested on an-other 60. The correlation coefficient (r2) was 0.84, andthe error was 0.32 log Vdu.
The fu and the steady-state volumes of distribu-tion data of the known drugs were available in theliterature.15,17,18,20 The in vivo Deff data were ob-tained by careful evaluation of the PK data and tissuebinding data at the receptor site obtained from vari-ous databases described in Ref. 18. The lipophilicity
was calculated using the clog P program from Day-light Chemical Information System, Inc. The LLE wascalculated as the difference between pXC50 and clogP.5 Table 1 contains the definitions and expressionsof the various Deff and DEI values.
RESULTS
The investigated drug molecules, target class, pXC50values, in vivo Deff, in vivo Deff max, as well as the invivo DEI and in vivo DEImax data calculated from thedata available in the public domain18 can be found inthe Supporting Information. The in vivoDeff max datawere obtained from the fu, the Vdss, and the mini-mum average single dose for a nominal 70 kg human.Thus, the in vivo Deff max data include the loss of dosedue to less than 100% oral absorption. Table 2 showsthe measured HSA and IAM binding and the derivedin vitro Deff max data using Eq. 8 as well as the calcu-lated lipophilicity (clog P). The in vitro DEImax datahave been calculated using the pXC50 values from thesupporting information. The in vitro Deff max data arederived from the model of Vdu, which was calculatedfrom the Vdss data of known drugs after i.v. adminis-tration, thus it does not contain the loss of compoundsdue to less than 100% absorption.
Figure 1 shows the plot of the pXC50 values andthe in vivo DEI values of the known drug molecules.The in vivo Deff of compounds in every investigatedtarget class has very similar average values. In gen-eral, the Deff is over 1%, so most of the compounds lieon the right side of the line of unity. When a programteam agree on the target potency, they need to selectcompounds with the highest Deff to get the highestpossible DEI, which means higher receptor engage-ment per unit of dose in vivo.
Figure 1 also illustrates that compounds withhigher DEI values generally correspond to lower av-erage dose (size of the marker is proportional to thelogarithmic value of the daily dose), which is not nec-essarily the case for the in vitro potency. The relation-ship between the dose and DEI values can be seenin Figure 2. Figure 2 illustrates the good trend be-tween the dose and binned in vivo DEI values. Figure1 is only a visualization tool for chemists to be ableto clearly see that the DEI value is higher or lowerthan the pXC50. It does not intend to show correlation,rather illustrating that the DEI scale can be used asequivalent to the pXC50 scale.
The correlation between the in vivo Deff and Deff maxreveals that the free drug hypothesis is valid and nosignificant active transport and permeability barriermodify the free concentration in plasma and at thesite of action.
Figure 3 shows the plot of the logarithmic val-ues of the in vivo Deff and Deff max. The line of unityshows that as it can be expected the in vivo Deff
JOURNAL OF PHARMACEUTICAL SCIENCES DOI 10.1002/jps

IN VITRO MEASUREMENT OF DRUG EFFICIENCY INDEX TO AID EARLY LEAD OPTIMIZATION 5
Table 2. The Measured Biomimetic HPLC-based HSA and IAM Binding Data and the Estimated In Vitro Deff max Data and In VitroDEImax Values for the Investigated Known Drug Molecules
Generic Name Log K(HSA) Log K(IAM) In Vitro Deff max In Vitro Log Deff max In Vitro DEImax LLE CLog P
Abacavir 0.71 1.87 60.9 1.78 8.93 5.54 1.61Acebutolol HCl 0.73 1.69 72.1 1.86 8.62 5.05 1.71Acrivastine 1.92 2.78 13.2 1.12 9.58 7.00 1.46Albuterol sulfate 0.58 1.67 79.6 1.90 9.30 7.34 0.06Alfuzosin 1.08 2.96 17.6 1.25 8.89 5.09 2.55Alosetron HCl 1.60 2.78 15.8 1.20 8.50 5.56 1.74Amitriptyline HCl 2.49 6.40 0.308 −0.51 5.64 1.30 4.85Amlodipine besylate 3.00 8.43 0.033 −1.48 7.24 5.29 3.43Amprenavir 2.18 2.76 11.6 1.06 8.98 4.63 3.29Anastrozole 1.19 2.13 36.9 1.57 9.39 6.35 1.48Aprepitant 3.90 3.81 1.66 0.22 10.14 5.32 4.60Aripiprazole 4.31 6.07 0.153 −0.82 8.88 4.39 5.31Bendroflumethiazide 1.51 3.05 12.7 1.10 4.54 1.71 1.73Bezafibrate 3.29 2.19 10.8 1.03 5.55 0.82 3.70Bicalutamide 3.90 3.31 2.66 0.42 6.52 3.39 2.71Bupropion HCl 1.55 3.31 9.7 0.99 7.25 3.05 3.21Buspirone HCl 1.86 2.99 11.2 1.05 8.67 5.44 2.19Caffeine 0.64 1.32 108 2.03 6.77 4.78 −0.04Candesartan cilexetil 4.53 3.90 1.07 0.03 10.55 3.44 7.08Carbamazepine 1.64 2.47 20.6 1.31 5.91 2.22 2.38Celecoxib 4.08 4.00 1.24 0.09 8.61 4.15 4.37Cetirizine HCl 2.33 3.64 4.63 0.67 9.19 6.44 2.08Cilostazol 2.48 3.12 6.97 0.84 7.54 3.17 3.53Citalopram hydrobromide 1.49 4.95 2.12 0.33 8.67 5.21 3.13Clomipramine HCl 3.17 7.70 0.06 −1.22 6.64 1.94 5.92Clonidine HCl 0.78 2.06 48.9 1.69 10.15 7.03 1.43Dapsone 1.82 2.17 25 1.40 6.22 3.93 0.89Desipramine HCl 2.14 5.86 0.619 −0.21 6.56 2.30 4.47Desloratadine 2.34 6.23 0.39 −0.41 8.99 5.57 3.83Diflunisal 5.19 2.59 2.57 0.41 4.65 −0.16 4.40Diphenhydramine HCl 1.39 3.08 13.3 1.12 9.24 4.67 3.45Dofetilide 1.21 2.82 18.8 1.27 8.77 5.51 1.99Domperidone 2.77 4.06 2.43 0.39 10.21 5.55 4.27Donepezil HCl 2.15 3.78 4.45 0.65 8.82 3.57 4.60Doxazosin mesylate 2.83 3.31 4.79 0.68 10.68 6.47 3.53Duloxetine HCl 3.16 9.58 0.01 −2.00 5.55 3.29 4.26Ebastine 5.08 7.37 0.029 −1.54 6.11 0.71 6.94Efavirenz 4.16 4.44 0.777 −0.11 8.81 5.19 3.73Eplerenone 0.75 1.96 54.8 1.74 8.84 6.63 0.48Escitalopram oxalate 1.19 6.07 0.86 −0.07 6.46 3.40 3.13Fenofibrate 4.28 4.63 0.607 −0.22 4.52 −0.49 5.23Fexofenadine HCl 1.57 2.74 16.6 1.22 8.49 5.31 1.96Finasteride 2.34 3.44 5.55 0.74 8.02 4.27 3.01Fluoxetine HCl 2.70 6.29 0.305 −0.52 8.07 4.02 4.57Flurbiprofen 4.95 2.09 4.77 0.68 6.88 2.45 3.75Fluvoxamine maleate 1.49 5.25 1.59 0.20 8.50 5.28 3.03Furosemide 2.96 2.24 12.4 1.09 6.09 3.10 1.90Glimepiride 4.50 2.63 3.61 0.56 5.94 1.42 3.96Glipizide 3.54 1.93 12 1.08 6.60 2.95 2.57Granisetron HCl 1.41 4.44 3.57 0.55 10.44 8.18 1.72Guanabenz acetate 2.29 4.95 1.36 0.13 8.37 5.26 2.98Guanfacine HCl 1.84 5.20 1.37 0.14 7.74 6.23 1.37Haloperidol 2.14 4.19 3.04 0.48 10.48 6.15 3.85Hydrochlorothiazide 0.91 1.72 63.3 1.80 6.50 5.07 −0.37Imipramine HCl 2.15 4.33 2.63 0.42 6.97 1.51 5.04Indapamide 1.58 2.70 17.1 1.23 5.47 1.28 2.96Indometacin 5.22 2.37 3.16 0.50 6.98 2.30 4.18Irbesartan 3.65 2.27 8.18 0.91 10.21 3.26 6.04Isradipine 3.20 3.58 3.05 0.48 7.08 2.68 3.92Itraconazole 4.14 3.66 1.67 0.22 4.41 −1.80 5.99Ketoconazole 3.22 3.72 2.62 0.42 5.07 1.02 3.64Ketoprofen 4.82 2.28 4.3 0.63 8.26 4.87 2.76
(Continued)
DOI 10.1002/jps JOURNAL OF PHARMACEUTICAL SCIENCES
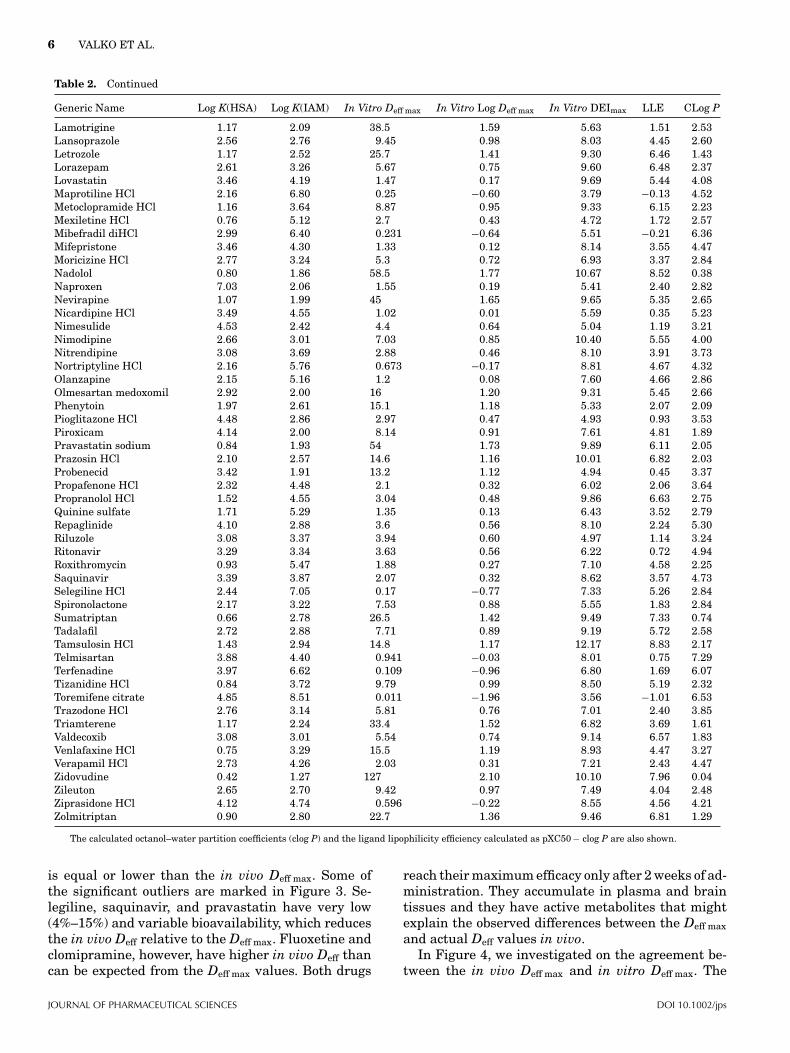
6 VALKO ET AL.
Table 2. Continued
Generic Name Log K(HSA) Log K(IAM) In Vitro Deff max In Vitro Log Deff max In Vitro DEImax LLE CLog P
Lamotrigine 1.17 2.09 38.5 1.59 5.63 1.51 2.53Lansoprazole 2.56 2.76 9.45 0.98 8.03 4.45 2.60Letrozole 1.17 2.52 25.7 1.41 9.30 6.46 1.43Lorazepam 2.61 3.26 5.67 0.75 9.60 6.48 2.37Lovastatin 3.46 4.19 1.47 0.17 9.69 5.44 4.08Maprotiline HCl 2.16 6.80 0.25 −0.60 3.79 −0.13 4.52Metoclopramide HCl 1.16 3.64 8.87 0.95 9.33 6.15 2.23Mexiletine HCl 0.76 5.12 2.7 0.43 4.72 1.72 2.57Mibefradil diHCl 2.99 6.40 0.231 −0.64 5.51 −0.21 6.36Mifepristone 3.46 4.30 1.33 0.12 8.14 3.55 4.47Moricizine HCl 2.77 3.24 5.3 0.72 6.93 3.37 2.84Nadolol 0.80 1.86 58.5 1.77 10.67 8.52 0.38Naproxen 7.03 2.06 1.55 0.19 5.41 2.40 2.82Nevirapine 1.07 1.99 45 1.65 9.65 5.35 2.65Nicardipine HCl 3.49 4.55 1.02 0.01 5.59 0.35 5.23Nimesulide 4.53 2.42 4.4 0.64 5.04 1.19 3.21Nimodipine 2.66 3.01 7.03 0.85 10.40 5.55 4.00Nitrendipine 3.08 3.69 2.88 0.46 8.10 3.91 3.73Nortriptyline HCl 2.16 5.76 0.673 −0.17 8.81 4.67 4.32Olanzapine 2.15 5.16 1.2 0.08 7.60 4.66 2.86Olmesartan medoxomil 2.92 2.00 16 1.20 9.31 5.45 2.66Phenytoin 1.97 2.61 15.1 1.18 5.33 2.07 2.09Pioglitazone HCl 4.48 2.86 2.97 0.47 4.93 0.93 3.53Piroxicam 4.14 2.00 8.14 0.91 7.61 4.81 1.89Pravastatin sodium 0.84 1.93 54 1.73 9.89 6.11 2.05Prazosin HCl 2.10 2.57 14.6 1.16 10.01 6.82 2.03Probenecid 3.42 1.91 13.2 1.12 4.94 0.45 3.37Propafenone HCl 2.32 4.48 2.1 0.32 6.02 2.06 3.64Propranolol HCl 1.52 4.55 3.04 0.48 9.86 6.63 2.75Quinine sulfate 1.71 5.29 1.35 0.13 6.43 3.52 2.79Repaglinide 4.10 2.88 3.6 0.56 8.10 2.24 5.30Riluzole 3.08 3.37 3.94 0.60 4.97 1.14 3.24Ritonavir 3.29 3.34 3.63 0.56 6.22 0.72 4.94Roxithromycin 0.93 5.47 1.88 0.27 7.10 4.58 2.25Saquinavir 3.39 3.87 2.07 0.32 8.62 3.57 4.73Selegiline HCl 2.44 7.05 0.17 −0.77 7.33 5.26 2.84Spironolactone 2.17 3.22 7.53 0.88 5.55 1.83 2.84Sumatriptan 0.66 2.78 26.5 1.42 9.49 7.33 0.74Tadalafil 2.72 2.88 7.71 0.89 9.19 5.72 2.58Tamsulosin HCl 1.43 2.94 14.8 1.17 12.17 8.83 2.17Telmisartan 3.88 4.40 0.941 −0.03 8.01 0.75 7.29Terfenadine 3.97 6.62 0.109 −0.96 6.80 1.69 6.07Tizanidine HCl 0.84 3.72 9.79 0.99 8.50 5.19 2.32Toremifene citrate 4.85 8.51 0.011 −1.96 3.56 −1.01 6.53Trazodone HCl 2.76 3.14 5.81 0.76 7.01 2.40 3.85Triamterene 1.17 2.24 33.4 1.52 6.82 3.69 1.61Valdecoxib 3.08 3.01 5.54 0.74 9.14 6.57 1.83Venlafaxine HCl 0.75 3.29 15.5 1.19 8.93 4.47 3.27Verapamil HCl 2.73 4.26 2.03 0.31 7.21 2.43 4.47Zidovudine 0.42 1.27 127 2.10 10.10 7.96 0.04Zileuton 2.65 2.70 9.42 0.97 7.49 4.04 2.48Ziprasidone HCl 4.12 4.74 0.596 −0.22 8.55 4.56 4.21Zolmitriptan 0.90 2.80 22.7 1.36 9.46 6.81 1.29
The calculated octanol–water partition coefficients (clog P) and the ligand lipophilicity efficiency calculated as pXC50 − clog P are also shown.
is equal or lower than the in vivo Deff max. Some ofthe significant outliers are marked in Figure 3. Se-legiline, saquinavir, and pravastatin have very low(4%–15%) and variable bioavailability, which reducesthe in vivo Deff relative to the Deff max. Fluoxetine andclomipramine, however, have higher in vivo Deff thancan be expected from the Deff max values. Both drugs
reach their maximum efficacy only after 2 weeks of ad-ministration. They accumulate in plasma and braintissues and they have active metabolites that mightexplain the observed differences between the Deff maxand actual Deff values in vivo.
In Figure 4, we investigated on the agreement be-tween the in vivo Deff max and in vitro Deff max. The
JOURNAL OF PHARMACEUTICAL SCIENCES DOI 10.1002/jps

IN VITRO MEASUREMENT OF DRUG EFFICIENCY INDEX TO AID EARLY LEAD OPTIMIZATION 7
Figure 1. The plot of pXC50 and in vivo DEI (sized according to logarithm of daily dose,shape according to therapeutic class). The line represents pXC50 = DEI, which means that thelog Deff = 0.
Figure 2. The box plot of the binned DEI values (bins:less than 5, between 5 and 7, between 7 and 9, and above 9)and the average dose of the compounds in the bin. HigherDEI values go with lower average dose.
correlation coefficient is 0.66, which is acceptable, al-though there are some significant outliers. Selegiline,ebastine, and duloxetine show higher in vivo Deff max
values than we could expect from their phospholipidand albumin binding data. These drugs reach thesteady-state plasma concentration very slowly, theyall bind strongly to "-1-glycoprotein and they showinteractions with P-glycoprotein that might explaintheir slow distribution from the plasma compartmentto the tissue compartment.
It is important to note that we have not developedany new model in this paper, we only used the pub-lished model15 for the Vdu estimation, which has beendeveloped on a different set of known drug molecules.Therefore, this set can be considered also as a testset for the published model. It was found that al-though phospholipid binding is the dominant fac-tor in the Vdu, the albumin binding significantly im-proved the correlation. Taking into account that thisis a test set and the in vitro measurements accountfor only the two major types of nonspecific bindingthat reduces the free concentration, namely the albu-min and the phospholipid binding, the agreement isacceptable.
The data illustrate that compound’s binding to al-bumin type of proteins and phospholipids reduce theavailable free concentration at the site of action. Thequestion arose whether the albumin or the phospho-lipid binding influences the Deff max most. Figure 5shows the plot of the in vivo Deff max values in thefunction of albumin and phospholipid binding. The ef-fect of the phospholipid binding on the Deff max seems
DOI 10.1002/jps JOURNAL OF PHARMACEUTICAL SCIENCES

8 VALKO ET AL.
Figure 3. The plot of the logarithmic value of the in vivo drug efficiency (Deff) and maximumdrug efficiency (Deff max). The line represents the best fit (slope: 0.75, intercept: 0.28, r2 = 0.55).
very straightforward, higher than log kIAM = 5 val-ues significantly reduce the Deff max values, whereasthe HSA binding has variable effect on it. This canbe explained by the fact that the volume of the tis-sues is much larger than the plasma volume; there-fore, tissue binding modeled by the IAM binding isthe dominant factor. High HSA binding does not nec-essarily mean low Deff max, especially if it is due tothe presence of negative charge. Negatively chargedcompounds do not bind very strongly to phosphatidyl-choline, so they have small log KIAM values. The shapeand color code in Figure 5 show the acid/base charac-ter of compound. We can see that negatively chargeddrugs show stronger albumin binding, whereas posi-tively charged drugs show strong phospholipid bind-ing. We have already pointed out previously that themajor difference between the phospholipid and albu-min binding16 is their sensitivity toward the positiveand negative charge. As the Deff is proportional to thesum of the two types of binding, the presence andthe type of charge do not have significant impact onit. Therefore, chemistry efforts should concentrate re-ducing the lipophilicity of the neutral form of the drug.Reducing only the log D (distribution coefficient) byintroducing charge will not result in increased Deff.
Figure 6 demonstrates how the in vivo Deff max valuescorrelate with clog P and clog D, supporting the as-sumption that the lipophilicity of the nonionized formof the molecules has to be considered for altering theDeff max.
The early lead optimization process is often basedon potency or ligand efficiency. Therefore, it is in-teresting to examine the trend between LLE andin vitro DEImax values as these can be obtained veryearly during the lead optimization process for a largenumber of compounds. Figures 7a and 7b show theplot of in vivo and in vitro DEImax and LLE. As allterms include the pXC50 value, we can expect rea-sonably good correlation. Figures 7a and 7b clearlydemonstrate that the lipophilicity of the compoundis dominantly responsible for the nonspecific bind-ing to albumin and phospholipids that results in thereduction of the in vivo available free concentration.Tarcsay et al.21 have nicely demonstrated that com-pounds with optimized LLE parameter had generallybetter absorption, distribution, metabolism, elimina-tion/excretion (ADME) properties as well, highlight-ing the importance of the clog P parameter as a mea-sure of the nonspecific binding of the compounds.However, the measured albumin and phospholipid
JOURNAL OF PHARMACEUTICAL SCIENCES DOI 10.1002/jps

IN VITRO MEASUREMENT OF DRUG EFFICIENCY INDEX TO AID EARLY LEAD OPTIMIZATION 9
Figure 4. The plot of in vivo Deff max and the in vitro Deff max. The line represents the unitywhen the in vivo log Deff max equals in vitro log Deff max (r2 = 0.66).
binding is a more precise measure of the nonspecificbinding than clog P. As a consequence, the in vivoDEImax shows stronger correlation with the in vitroDEImax (r2 = 0.919) than with LLE (r2 = 0.75). Theexplanation for the lower correlation with LLE canbe that the calculated lipophilicity does not includeany steric and shape effects and it may differ frommeasured values for new drug discovery compounds.Another advantage of using the biomimetic HSA andIAM binding data for efficiency calculations is thatthe knowledge of the albumin and phospholipid bind-ing of the compounds help the structure design pro-cess. There is a different structure–property relation-ship between albumin and phospholipid binding. Forexample, negatively charged, aromatic compoundsbind more to albumin and less to phospholipids,whereas positively charged, long and flat-shapedmolecules bind strongly to phospholipids. Table 3shows the r2 values between the various efficiencyparameters.
On the basis of the presented data, the followingstrategy may be used for successful lead optimizationprocess. At the beginning of a drug discovery program,the program team agrees on a target product profilethat includes the target potency (among other prop-erties). At the early stages of hit to lead optimization,
it is common to focus only on the readily availablehigh throughput in vitro potency (pXC50), and thesubsequent optimization is carried out only on thepotent compounds. Such a subsequent optimizationprocedure limits the chemical space, and often poten-tial good compounds are discarded. The ligand effi-ciency and the DEI values are more appropriate foroptimization as they indicate the expected potencyin vivo. Our suggestion is to rank compounds first onthe ligand efficiency parameters, preferably the LLE,which is the difference between pXC50 and clog P. Bymeasuring the HSA and phospholipid binding of thecompounds using biomimetic HPLC measurements,calculate the in vitro DEI and use that parameter forcompound prioritization. When the DEI values arehigh, the receptor occupancy in vivo expected to behigh relative to dose. Retrospective analyses of projectcompounds and selected candidate molecules showedthat though the potency of many compounds was inthe desired region, only a few compounds showed goodDEI and they were the ones that showed good in vivoprofile as well. Figure 8 shows the pXC50 and DEIdata for the known drugs and a set of project com-pounds. Figure 8 shows a typical visualization toolfor chemists to compare the pXC50 scale with the DEIscale and it is not intended to show correlation. Most
DOI 10.1002/jps JOURNAL OF PHARMACEUTICAL SCIENCES

10 VALKO ET AL.
Figure 5. The plot of in vivo Deff max in the function of the albumin (a) and phospholipid(b) binding of compounds. (Marker shape and color according to the acid/base character: redsquare, acid; blue circle, base; green diamond, neutral; lilac triangle, zwitterion.)
JOURNAL OF PHARMACEUTICAL SCIENCES DOI 10.1002/jps

IN VITRO MEASUREMENT OF DRUG EFFICIENCY INDEX TO AID EARLY LEAD OPTIMIZATION 11
Figure 6. The plots of the in vivo log Deff max in the function of clog P (a) and ACD log D (b),respectively. (Marker shape and color according to the acid/base character: red square, acid;blue circle, base; green diamond, neutral; lilac triangle, zwitterion.)
DOI 10.1002/jps JOURNAL OF PHARMACEUTICAL SCIENCES

12 VALKO ET AL.
Figure 7. The plots of the in vivo DEImax with LLE (a) and in vitro DEImax (b).
JOURNAL OF PHARMACEUTICAL SCIENCES DOI 10.1002/jps

IN VITRO MEASUREMENT OF DRUG EFFICIENCY INDEX TO AID EARLY LEAD OPTIMIZATION 13
Table 3. The Correlation Coefficients Between the Various Efficiency Parameters
In VivoLog Deff
In Vivo LogDeff max
In VitroLog Deff max CLog P ACD Log D
In VivoDEImax
In VitroDEImax LLE
In vivo log Deff 1.00In vivo log Deff max 0.55 1.00In vitro log Deff max 0.33 0.64 1.00Clog P 0.32 0.49 0.54 1.00ACD log D 0.25 0.31 0.27 0.47 1.00In vivo DEImax 0.01 0.06 0.66 0.05 0.02 1.00In vitro DEImax 0.01 0.06 0.11 0.07 0.03 0.92 1.00LLE 0.07 0.07 0.18 0.41 0.18 0.75 0.76 1.00
of the known drugs are on the right side of the line ofunity that demonstrates that the DEI value is higherthan the pXC50. The candidate molecules (red stars)are on the right side of the straight line, which meansthat the Deff max is above 1%. The candidate moleculesshowed the best in vivo PK/pharmacodynamic profile,suggesting that compounds with the highest DEI val-ues have better ADME properties too.
It is also important to point out again that thein vitro Deff data show better correlation with theclog P values than with the clog D values (the lip-ophilicity of the ionized form of the molecules) asit is demonstrated in Figure 6. This is becausethe presence of charge causes a decrease in thecompound’s lipophilicity in octanol–water system,while considering the biomimetic binding proper-ties, negative charge increases the binding to al-bumin, whereas positive charge increases the phos-pholipid binding. It means that the sum of the two
types of binding does not decrease in the presence ofcharge.
Optimizing the DEI values instead of the potencyearly in the lead optimization process guides chemistto synthesize potent molecules without increasingtheir lipophilicity and nonspecific binding ability toalbumin and phospholipids (the major components inplasma and tissues). Compounds with high DEI val-ues are more likely efficacious in vivo with lower dose.However, high DEI value does not guarantee goodoral absorption and low clearance that are also im-portant contributors for the required efficacious dose.When the clearance is high, the required dose has tobe administered more frequently to keep the free con-centration level above the minimum required levelfor optimum target engagement. The maximum Deffconcept excludes the impact of the clearance as it ismodeled by the Vdu. The Vdu for which the model hasbeen developed15 was calculated from the human Vdss,
Figure 8. The pXC50 and DEI plot of known drugs (green circle) and project compounds(yellow square). Selected candidates are marked as red stars.
DOI 10.1002/jps JOURNAL OF PHARMACEUTICAL SCIENCES
14 VALKO ET AL.
which was defined as the volume independent fromthe clearance.21,22,23 When the in vivo Deff is deter-mined, the free concentration can relate to the steady-state free concentration after repeated dose, or thefree concentration at that time point after administra-tion that is required from the drug based on its dosingregimen. The biomimetic albumin and phospholipidbinding measurements refer also to a dynamic equi-librium and obviously cannot model the time courseof the drug distribution in the body. Therefore, for theappropriate characterization of a candidate molecule,the metabolism and clearance have to be optimizedas well. The ranking and optimization to DEI is moreefficient than the sequential optimization of potency,physicochemical properties, and other ADME prop-erties, and it may rescue good compounds from be-ing discarded because of relatively low potency. Thein vitro DEImax cannot take into account permeabilityproblems or the distortion of the steady-state equilib-rium process by active transporters. Transporter is-sues have to be identified early on using other in vitroscreens. The biomimetic HPLC property measure-ments of drug discovery compounds are inexpensive,fast, and accurate enough to be used for early pri-oritization of compounds and saving time, resources,and research animals. The revealed binding informa-tion can be used to predict the in vivo distributionof compounds such as volume of distribution,17Vdu,15
and Deff.
CONCLUSIONS
It has been demonstrated that the DEI can be used torank drug candidates for progression.12 Compoundswith slightly lower potency but good in vivo Deff (highDEI) need smaller dose to achieve the same receptoroccupancy in vivo. In this paper, we have introducednew in vitro Deff and DEI (in vitro DEImax) param-eters derived from HPLC-based experiments. Usinga previously published model15 for the estimation ofVdu, we expressed the in vitro Deff max as its reciprocalvalue estimated from the sum of a compound’s non-specific binding to albumin and phosphatidylcholine.The possibility to obtain in vitro DEI values earlyin the drug discovery process using high throughputbiomimetic HPLC measurements enables chemists toestimate compounds in vivo behavior much earlier. Ithas been demonstrated using the data of 115 knowndrugs that higher DEI values can be associated withlower clinical dose.
The above-mentioned relationship can be used torank and optimize compounds using in vitro assays(pXC50, HSA binding, and IAM partition). In vitroDEI showed similar trend to LLE, supporting the ideaof using LLE and in vitro DEI consecutively in com-pound progression during lead optimization. The newin vitro DEI parameter applied in early lead optimiza-
tion process increases our understanding of the gapbetween in silico and in vivo assays and reduces thenumber of animal experiments.
ACKNOWLEDGMENTS
The authors are very grateful to Phil Jeffrey and Pe-ter Eddershaw for their constructive criticisms andadvice during the preparation of the manuscript.
REFERENCES
1. Lipinski CA, Lombardo F, Dominy BW, Feeney PJ. 2001. Ex-perimental and computational approaches to estimate solu-bility and permeability in drug discovery and developmentsettings. Adv Drug Deliv Rev 46:3–26.
2. Veber DF, Johnson SR, Cheng HY, Smith BR, Ward KW,Kopple KD. 2002. Molecular properties that influence theoral bioavailability of drug candidates. J Med Chem 45:2615–2623.
3. Vande Waterbeemd H, Smith DA, Beaumont K, Walker DK.2001. Property-based design: Optimization of drug absorptionand pharmacokinetics. J Med Chem 44:1313–1333.
4. Bade R, Chan H-F, Reynisson J. 2010. Characteristics ofknown drug space. Natural products, their derivatives andsynthetic drugs. Eur J Med Chem 45:5646–5652.
5. Leeson PD, Empfield JR. 2010. Reducing the risk of drug at-trition associated with physicochemical properties. Ann RepMed Chem 45:393–407.
6. Hopkins AL, Groom CR. 2004. Ligand efficiency: A useful met-ric for lead selection. Drug Discov Today 9:430–431.
7. Rees DC, Congreve MC, Murray CW, Carr R. 2004. Fragment-based lead discovery. Nat Rev Drug Discov 3:660–672.
8. Abad-Zapatero C, Metz JT. 2005. Ligand efficiency indices asguidepost for drug discovery. Drug Discov Today 10:464–469.
9. Leeson PD, Springthorpe B. 2007. The influence of drug-likeconcepts on decision-making in medicinal chemistry. Nat RevDrug Discov 6:881–890.
10. Braggio S, Montanari D, Rossi T, Ratti E. 2010. Drug effi-ciency: A new concept to guide lead optimization programstowards the selection of better clinical candidates. Exp OpinDrug Discov 5:609–618.
11. Stepensky D. 2011. Use of unbound volumes of drug distribu-tion in pharmacokinetic calculations. Eur J Pharm Sci42:91–98.
12. Montanari D, Chiarparin E, Gleeson MP, Braggio S, LonghiR, Valko K, Rossi T. 2011. Application of drug efficiency indexin drug discovery: A strategy towards low therapeutic dose.Expert Opin Drug Discov 6:913–920.
13. Hughes JD, Blagg J, Price DA, Bailey S, DeCrescenzo GA, De-vraj RV, Ellsworth E, Fobia YM, Gibbs ME, Gilles RW, GreeneN, Huang E, Krieger-Burke T, Loesel J, Wager T, Whiteley L,Zhang Y. 2008. Physicochemical drug properties associatedwith in vivo toxicological outcomes. Bioorg Med Chem Lett18:4872–4875.
14. Valko K. 2004. Application of high-performance liquid chro-matography based measurements of lipophilicity to model bi-ological distribution. J Chromatogr A 1037:299–310.
15. Valko KL, Nunhuck SB, Hill AP. 2011. Estimating un-bound volume of distribution and tissue binding by in vitroHPLC-based human serum albumin and immobilized artifi-cial membrane-binding measurements. J Pharm Sci 100:849–862.
16. Valko K, Nunhuck S, Bevan C, Abraham MH, Reynolds DP.2003. Fast gradient HPLC method to determine compoundsbinding to human serum albumin. Relationships with octanol/
JOURNAL OF PHARMACEUTICAL SCIENCES DOI 10.1002/jps

IN VITRO MEASUREMENT OF DRUG EFFICIENCY INDEX TO AID EARLY LEAD OPTIMIZATION 15
water and immobilized artificial membrane lipophilicity. JPharm Sci 92:2236–2248.
17. Hollosy F, Valko K, Hersey A, Nunhuck S, Keri Gy, BevanC. 2006. Estimation of volume of distribution in humans fromhigh throughput HPLC-based measurements of human serumalbumin binding and immobilized artificial membrane parti-tioning. J Med Chem 49:6958–6971.
18. Source of in vivo data pXC50 and drug efficiency data:Drugdex, Martindales, PDR, Index Nominium, PubMed,RXList databases.
19. Smith DA, Kerns EH. 2010. The effect of plasma protein bind-ing on in vivo efficacy: Misconceptions in drug discovery. NatRev Drug Discov 9:929–939.
20. Lombardo R, Obach RS, Di Capua FM, Bakken GA, Lu J,Potter DM, Gao F, Miller MD, Zhang Y. 2006. Hybrid mixturediscriminant analysis-random forest computational model forthe prediction of volume of distribution of drugs in human. JMed Chem 49:2262–2267.
21. Tarcsay A, Nyıri K, Keseru Gy. 2012. Impact of lipophilic effi-ciency on compound quality. J Med Chem 55:1252–1260.
22. Benet LZ, Galeazzi RL. 1979. Noncompartmental determina-tion of the volume of distribution in steady-state. J Pharm Sci68:1071–1074.
23. Benet LZ. ( 2010) Clearance (nee Rowland) concepts: Adowndate and an update. J Pharmacokinet Pharmacodyn37:529–539.
DOI 10.1002/jps JOURNAL OF PHARMACEUTICAL SCIENCES