in uenceoftheverticalsupportsti … · in uenceoftheverticalsupportsti nessonthedynamicbehaviorof...
TRANSCRIPT

Influence of the Vertical Support Stiffness on the Dynamic Behavior ofHigh-Speed Railway Bridges
Rui Afonso TavaresInstituto Superior Tecnico, Lisboa, Portugal
Kungliga Tekniska Hogskolan, Stockholm, Sweden
Abstract
When designing a bridge, the modelling of the soil and the soil-structure interaction is commonly far from reality.Furthermore, the studies undertaken by the European Rail Research Institute (ERRI) point out that it is essentialto model the support conditions, if realistic predictions of the dynamic behavior are to be made. When a bridge issubjected to the loads of a high-speed train, the dynamic response of the structure is, obviously, influenced by thesoil beneath the foundations and surrounding the bridge. The magnitude of that influence was studied, namely fromthe analysis of the variations obtained for the eigenfrequencies, displacements and accelerations.
As a first approach to the problem, a theoretical analysis of two common railway bridges from the Bothnia Line(the new Swedish high-speed line) was made. Afterwards, as a case study, another railway bridge was analyzed usingthe Finite Element Method. The results obtained with this method were compared with data measured in situ, tovalidate the model. Theoretical estimation of the support stiffness and model updating were also performed.
The results obtained with the updated Finite Element model were found to be very satisfactory. The findings suggestthat models with stiff supports can greatly underestimate the maximum responses of high-speed railway bridges andmay not be reliable. Furthermore, it was concluded that simple 2D beam models are able to simulate reasonablywell the behavior of real bridges. With the help of field measurements and model updating, these simulations can beincreasingly accurate, and particulary meaningful for structures under constant monitoring.
Key words: bridge dynamics, mechanical vibration, resonance, vertical support stiffness, high-speed railway bridges
1. Introduction
Nowadays, in modern societies, the need to movepeople and goods is growing fast, both in numberof transactions and in traveled distance. Therefore,transport infrastructures are being built all over theworld, to cope with the market claim. In the case ofrailway transportation with trains running at high-speed, the risk of resonance in the structures is large,and assessment of vibration problems in the high-speed railway bridge is required during its design,
Email address: [email protected] (Rui
Afonso Tavares).
to guarantee the safety of the crossing train. There-fore, performing dynamic analysis that investigatesresonance of the bridge induced by the bridge-traininteraction constitutes an essential element of thedesign.
The first publications about the dynamic behav-ior of bridges came from the mid-nineteenth century,following the works of Willis [1] in investigating thecollapse of the Chester rail bridge, over the river Dee,in England, 1847, the first case of collapse of a rail-way bridge in history. In the beginning of the 20th
century, the theoretical view of Timoshenko [2] gavea complete solution for the problem of the dynamicbehavior of a prismatic bar acted upon by a mov-
Preprint submitted to DECivil November 19, 2007

ing harmonic pulsating force moving with a constantvelocity. The publication of Inglis [3], also providedextremely important basis for the study of the dy-namic behavior of high-speed railway bridges. Laterin the 20th century, the investigations in that fieldfrom Ladislav Fryba [4–6] have greatly developedthe knowledge on the subject. In Fryba [6] the struc-tural responses(displacement, bending moment andacceleration) of a simply supported beam to a trainpassing at constant speed are described, based onthe Euler-Bernoulli beam theory.
He Xia, from the Beijing Jiaotong University,has investigated, both analytically and experimen-tally, the dynamic phenomena occurring in bridgescrossed by high-speed trains [7–12]. Kwark et al.[13] presents a study of the amplified dynamic re-sponses of bridges crossed by the Korean high-speedtrain. Oscarsson [14] took the next step by studyingproperties such as rail pad stiffness, ballast stiffness,dynamic ballast-subgrade mass and sleeper spac-ing, and their influence on the dynamic behavior ofthe vehicle-bridge interaction.
In the Iberian Peninsula, the research abouthigh-speed railway effects have been particularyintensive in the Faculdade de Engenharia da Uni-versidade do Porto, with the work of professors RuiCalcada and Raimundo Delgado, and in the Uni-versidad Politecnica de Madrid, through professorsJose Ma Goicolea and Felipe Gabaldon Castillo.After the first approach of dos Santos [15] in 1994,the work of Delgado and dos Santos [16] started thediscussion in Portugal about the high-speed traineffects on structures, even though the rail traffic inthe country could not achieve high-speeds.
At the same time, the group of phenomena influ-encing the dynamic behavior of structures while in-teracting with the soil, induced by the applicationof loads in the system has been studied by many re-searchers. Investigation in this field and the estima-tion of the support stiffness as a function of the dy-namic proprieties of the soil was deeply studied byRichart and Lysmer in the decade of 1960 [17, 18],giving very important contribution on the subjectfor the scientific community. In 1962, Barkan [19]had already suggested one expression to calculatethe vertical spring stiffness for rigid rectangular foot-ings resting on elastic half-space. Before that, Tim-oshenko [20] had derived the vertical spring stiffnessif the rigid footing was circular, also resting on elas-tic half-space. In the beginning of the 21th century,George Gazetas [21, 22] studied the dynamic inter-action of spread footings and pile groups, suggest-
ing expressions, not only for the static stiffness, butalso for the frequency dependent stiffness. Gazetasconcluded that the presence of bedrock at shallowdepth, rather than having natural soil deposits ex-tending to practically infinite depth as the homo-geneous half-space implies, modifies the static stiff-ness. Particularly sensitive to variations in the depthof the bedrock is the vertical stiffness.
When designing a bridge, the modelling of the soiland the soil-structure interaction is commonly farfrom reality. Furthermore, the studies undertaken bythe European Rail Research Institute (ERRI) andCommittee D214 [23] point out that it is essential tomodel the support conditions, if realistic predictionsof the dynamic behavior are to be made. Hereby, theimportance of the accurate estimation of the verti-cal support stiffness, on the dynamic behavior of thebridge, is the subject of this paper. When a bridge issubjected to the loads of a high-speed train, the dy-namic response of the structure is, obviously, influ-enced by the soil beneath the foundations and sur-rounding the supports. The magnitude of that influ-ence is going to be studied, namely from the analysisof the variations obtained for the eigenfrequencies,displacements and accelerations. Greater attentionwill be given to the effect that changes in the verti-cal support stiffness have on the dynamic behaviorof structures subjected to loads travelling at a speedthat induces the resonant response.
The research was carried out at the Departmentof Structural Engineering, Structural Design andBridges, at the Royal Institute of Technology (KTH)in Stockholm, Sweden.
2. Theoretical Behavior of Simple Bridges
In this chapter, a theoretical analysis of two com-mon railway bridges will be done. One single spanand one double span composite bridges from theBothnia Line (the new Swedish High Speed Railway)will be used for the study. No comparison with ex-perimental measurements will be made at this stage.
2.1. Single span bridge
The Banafjal bridge is a 42 m long, simply sup-ported bridge, which carries one ballasted track.The bridge is a composite structure, with an ordi-nary reinforced concrete deck supported by two steelbeams. The Finite Element (FE) model of the bridgewas developed using Abaqus FE graphical inter-
2
face, with the pre-processor Brigade 1 . The cross-section of the single span beam model was a gen-eralized profile with the properties of the Banafjalbridge. The supports were, initially, considered stiffto study its dynamic behavior and so that the re-sults could be compared with the analytical solu-tion. The dynamic loads were added in the DynamicLive Load module of Brigade, where the HSLM-A1 (see [24]) was already defined. The damping wasconsidered as direct damping (see Hibbitt et al. [25]for more information on the subject) and equal forall the structure. The value chosen was ξ = 0, 5%,according to [26].
The study on the single span bridge started witha convergence study on important parameters. Theresults show, on one hand, that accurate values forthe displacement could be found with only 5 bend-ing modes and a time step of 0.02 s. On the otherhand, 32 bending modes and a time step of 0.002were essential to get convergence for accelerations.The reason for this is that the displacement is dom-inated by the lower modes, while the maximum ac-celerations have greater contributions from highermodes.
To validate the Finite Element Method (FEM)solution, the responses obtained from the FE modelwere compared with the analytical solution basedon Fryba’s equations (see [6]). The agreement wasvery good, both at crawling speed (5 km/h) and atresonant speed (155 km/h).
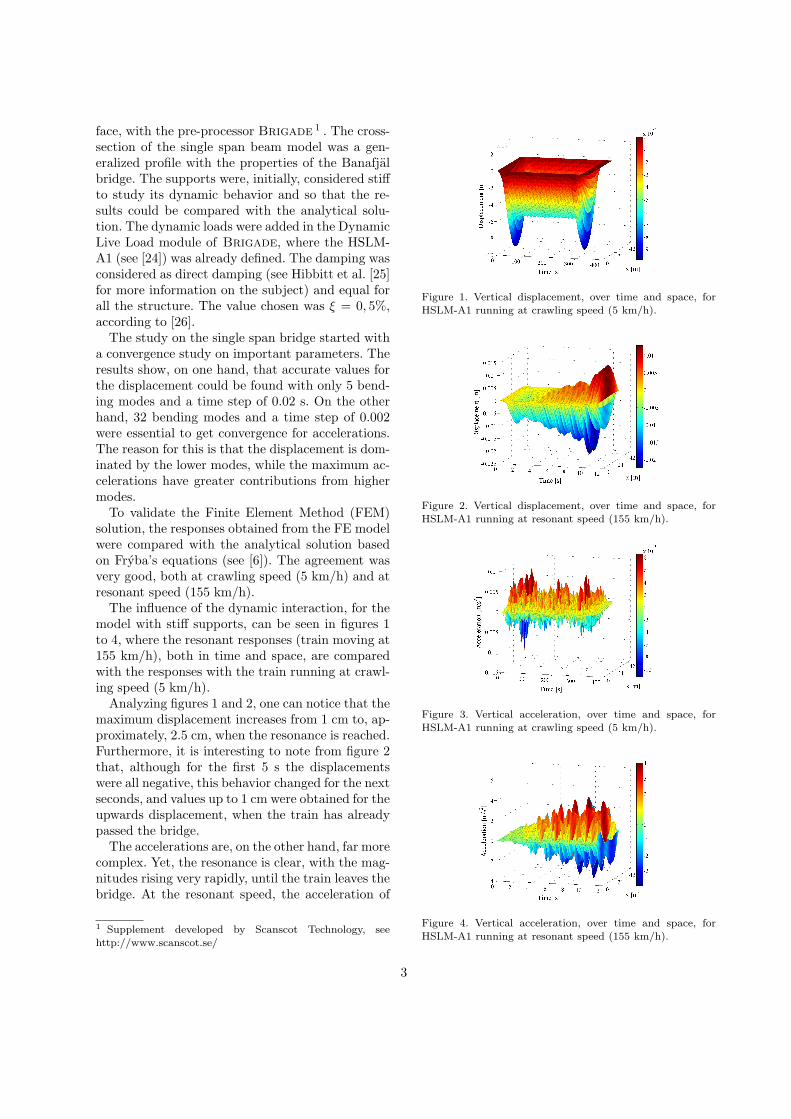
The influence of the dynamic interaction, for themodel with stiff supports, can be seen in figures 1to 4, where the resonant responses (train moving at155 km/h), both in time and space, are comparedwith the responses with the train running at crawl-ing speed (5 km/h).
Analyzing figures 1 and 2, one can notice that themaximum displacement increases from 1 cm to, ap-proximately, 2.5 cm, when the resonance is reached.Furthermore, it is interesting to note from figure 2that, although for the first 5 s the displacementswere all negative, this behavior changed for the nextseconds, and values up to 1 cm were obtained for theupwards displacement, when the train has alreadypassed the bridge.
The accelerations are, on the other hand, far morecomplex. Yet, the resonance is clear, with the mag-nitudes rising very rapidly, until the train leaves thebridge. At the resonant speed, the acceleration of
1 Supplement developed by Scanscot Technology, see
http://www.scanscot.se/
Figure 1. Vertical displacement, over time and space, for
HSLM-A1 running at crawling speed (5 km/h).
Figure 2. Vertical displacement, over time and space, forHSLM-A1 running at resonant speed (155 km/h).
Figure 3. Vertical acceleration, over time and space, for
HSLM-A1 running at crawling speed (5 km/h).
Figure 4. Vertical acceleration, over time and space, for
HSLM-A1 running at resonant speed (155 km/h).
3

the bridge deck rises up to 4 m/s2, and it wouldbe greater for longer trains. This peak acceleration,around 0.4g, can cause destabilization of the ballast,as it is higher than the valued recommended in theERRI D214 reports [27]: ault=3.5 m/s2 for bridgeswith ballast.
To study the sensitivity of the structural response,the vertical support stiffness was varied accordingto the values found to provide changes in the behav-ior of the structure: from 1 · 108 N/m for soft clays,and 1 ·1011 N/m, for foundation on solid bedrock orpile groups. To achieve that effect on the FE model,the stiff boundary conditions at the end of the beamwere replaced by non-homogeneous boundary con-dition, representing the soil-foundation interaction.With the decrease of the vertical stiffness at theend supports, the bending frequencies started to de-crease. Figure 5 shows the effect of the supports stiff-ness on the eigenfrequencies.
Infinite 1E11 1E10 5E9 1E9 5E8 1E80
0.25
0.5
0.75
1
Support stiffness [N/m]
Nor
mal
ized
fre
quen
cy
1st mode2nd mode3rd mode4th mode5th mode6th mode7th mode8th mode9th mode10th mode
Figure 5. Effect of the end supports vertical stiffness inthe bending frequencies of the first ten bending modes of
vibration of the Banafjal bridge.
To study the variation of the resonant speed andof the maximum displacement, trials were run inAbaqus/Brigade, for different vertical supportstiffness. Usually, the resonant speed is mainly afunction of the 1st eigenfrequency of the structure.Therefore, with the highest variations of the 1st
eigenfrequency starting for vertical stiffness lowerthan 1 · 109 N/m, the highest variations on the res-onant speed were expected for lower stiffness. Thetrials were divided in groups of two, to make thepresentation of the results clear. The response forthe model with infinite support stiffness is shown inall figures, for the purpose of comparison. The max-imum displacement of the beam, at mid-span, forthe HSLM-A1 running at different speeds is shownin figures 6 to 8.
One interesting fact obtained from the plots isthat, for a vertical stiffness of 5 · 108 N/m in thesupports (figure 8), resonance effects are not ob-
100 150 200 250 300−0.025
−0.02
−0.015
−0.01
Train speed [km/h]
Dis
plac
emen
t [m
]
Infinite1E11 N/m1E10 N/m
Figure 6. Maximum downwards displacement of the beam,as function of the train speed.
100 150 200 250 300−0.025
−0.02
−0.015
−0.01
Train speed [km/h]D
ispl
acem
ent [
m]
Infinite5E9 N/m1E9 N/m
Figure 7. Maximum downwards displacement of the beam,
as function of the train speed.
100 150 200 250 300−0.06
−0.05
−0.04
−0.03
−0.02
−0.01
Train speed [km/h]
Dis
plac
emen
t [m
]
Infinite5E8 N/m1E8 N/m
Figure 8. Maximum downwards displacement of the beam,as function of the train speed.
0 5 10 15−0.06
−0.04
−0.02
0
0.02
0.04
Time [s]
Dis
plac
emen
t [m
]
Infinite5E8 N/m1E8 N/m
Figure 9. Vertical displacement at mid-span, for HSLM-A1
running at resonant speed.
4

served. In fact, the maximum displacement at reso-nant speed, for stiffness of 5 · 108 and 1 · 109 N/m,is lower than the displacement with stiff supports.This fact was surprising and its reasons should be in-vestigated in future studies. The same behavior canbe seen in figure 9, where the displacement of a pointat mid-span is shown, for the HSLM-A1 runningat resonant speed. On one hand, when the verticalsupport stiffness decreases to 1 · 108 N/m, the dis-placement rises more than double, when comparedto the stiff support model. On the other hand, thedisplacement, for a stiffness of 5 · 108 N/m, is lessthan the displacement with stiff supports. Table 1summarizes the results.Table 1Maximum displacement at mid-span, for different support
stiffness.
Support Maximum displacement [cm]
stiffness [N/m] Crawling speed Resonant speed
∞ 0.99 2.29
1 · 1011 0.99 2.28
1 · 1010 0.99 2.25
5 · 109 1.00 2.18
1 · 109 1.08 1.79
5 · 108 1.15 1.28
1 · 108 1.83 5.64
2.2. Double span bridge
The bridge over Logdealv is a two span compositebridge along the Bothnia Line. The concrete deckis supported by two steel girders, connected to eachother by transversal steel beams, weighting 0.2 N/m.Each of the girders is composed of 4 different beamcross-sections, with variations in cross-sectional areaand moment of inertia. The structure was modeledas a double span beam, supported at the ends and atthe middle node. The bending stiffness of the beamwas assumed to be twice the bending stiffness ofone girder, the same happening with the area. Thedamping was considered as direct damping (see Hi-bbitt et al. [25] for more information on the subject)and equal for all the structure. The value chosen wasξ = 0, 5%, according to [26].
From the convergence study undertaken, it waspossible to conclude that mesh elements of 2 m wereshort enough to get convergent results for displace-ments and accelerations. The influence of the ele-ment size on the eigenfrequencies was found to be
negligible. The same was inferred for the influenceof the time step and number of modes on the dis-placements. 10 modes and a time step of 0.02 s werefound to be good enough. However, to ensure theconvergence of the accelerations, a time step of 0.005s was used and 40 modes were considered.
After the analysis of the results provided by thestudy of the single span bridge, it was decided toperform the sensitivity study on the double spanbridge only for stiffness varying between 5 ·1010 and5 · 108 N/m, since this interval of values providedvery interesting results in the first study. Therefore,it was settled to run 9 trials on the bridge. Each trialis identified by the case number, and the cases aredefined in table 2.
Table 2Definition of the cases for the study.
Center column End supports stiffness [N/m]
stiffness [N/m] 5 · 1010 5 · 109 5 · 108
5 · 1010 Case 1 Case 2 Case 3
5 · 109 Case 4 Case 5 Case 6
5 · 108 Case 7 Case 8 Case 9
Table 2 is organized as a matrix. For instance, case4 has a vertical stiffness of 5 · 109 N/m for the maincolumn and 5 · 1010 N/m for the end supports. Themodel with infinite stiffness both in the end supportsand in the center column is referred to as case 0.
Regarding the eigenfrequencies, it was seen thatlarge differences occur when the stiffness of the endsupports decrease to 5 · 108 N/m.
0 1 2 3 4 5 6 7 8 90
5
10
15
20
25
30
35
40
Case
Freq
uenc
y [H
z]
Figure 10. Effect of the vertical support stiffness on thefrequencies of the first ten modes of vibration of the Logdealvbridge.
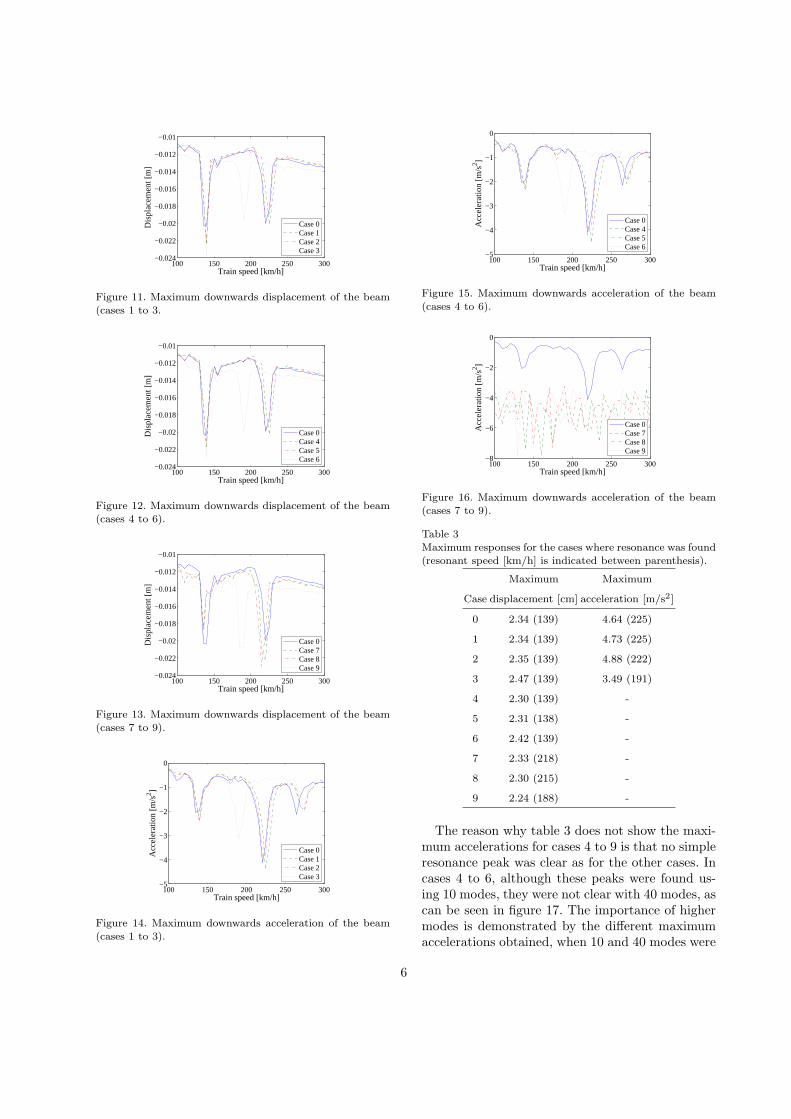
Changes in maximum displacement and maxi-mum acceleration were obvious. Table 3 shows themaximum values obtained for displacement andacceleration, with the HSLM-A1 running at reso-nance, whenever resonant speed was found.
5
100 150 200 250 300−0.024
−0.022
−0.02
−0.018
−0.016
−0.014
−0.012
−0.01
Train speed [km/h]
Dis
plac
emen
t [m
]
Case 0Case 1Case 2Case 3
Figure 11. Maximum downwards displacement of the beam
(cases 1 to 3.
100 150 200 250 300−0.024
−0.022
−0.02
−0.018
−0.016
−0.014
−0.012
−0.01
Train speed [km/h]
Dis
plac
emen
t [m
]
Case 0Case 4Case 5Case 6
Figure 12. Maximum downwards displacement of the beam(cases 4 to 6).
100 150 200 250 300−0.024
−0.022
−0.02
−0.018
−0.016
−0.014
−0.012
−0.01
Train speed [km/h]
Dis
plac
emen
t [m
]
Case 0Case 7Case 8Case 9
Figure 13. Maximum downwards displacement of the beam
(cases 7 to 9).
100 150 200 250 300−5
−4
−3
−2
−1
0
Train speed [km/h]
Acc
eler
atio
n [m
/s2 ]
Case 0Case 1Case 2Case 3
Figure 14. Maximum downwards acceleration of the beam
(cases 1 to 3).
100 150 200 250 300−5
−4
−3
−2
−1
0
Train speed [km/h]
Acc
eler
atio
n [m
/s2 ]
Case 0Case 4Case 5Case 6
Figure 15. Maximum downwards acceleration of the beam
(cases 4 to 6).
100 150 200 250 300−8
−6
−4
−2
0
Train speed [km/h]A
ccel
erat
ion
[m/s2 ]
Case 0Case 7Case 8Case 9
Figure 16. Maximum downwards acceleration of the beam
(cases 7 to 9).
Table 3Maximum responses for the cases where resonance was found
(resonant speed [km/h] is indicated between parenthesis).
Maximum Maximum
Case displacement [cm] acceleration [m/s2]
0 2.34 (139) 4.64 (225)
1 2.34 (139) 4.73 (225)
2 2.35 (139) 4.88 (222)
3 2.47 (139) 3.49 (191)
4 2.30 (139) -
5 2.31 (138) -
6 2.42 (139) -
7 2.33 (218) -
8 2.30 (215) -
9 2.24 (188) -
The reason why table 3 does not show the maxi-mum accelerations for cases 4 to 9 is that no simpleresonance peak was clear as for the other cases. Incases 4 to 6, although these peaks were found us-ing 10 modes, they were not clear with 40 modes, ascan be seen in figure 17. The importance of highermodes is demonstrated by the different maximumaccelerations obtained, when 10 and 40 modes were
6

150 200 250
−8
−6
−4
−2
0
2
Train speed [km/h]
Acc
eler
atio
n [m
/s2 ]
Case 4 (40 modes)Case 5 (40 modes)Case 6 (40 modes)Case 4 (10 modes)Case 5 (10 modes)Case 6 (10 modes)
Figure 17. Maximum downwards acceleration of the beam
with different number of modes (cases 4 to 6 with speed step
of 5 km/h).
considered.One can see the influence the vertical stiffness of
the supports has on the responses of the bridge, es-pecially on the maximum accelerations. When thestiffness of the end supports decreases, the accelera-tion drops from almost 4.9 m/s2 to 3.5 m/s2 (case 3).The influence of the main column stiffness is not thatevident. For cases 1 to 2, the decrease of the maxi-mum acceleration is only around 3%. Large changesin the displacement, due to the supports stiffness,can also be seen, especially from cases 2 to 3 and 5to 6.
3. Case Study: The Sagan Bridge
In this chapter, one railway bridge will be ana-lyzed using the FE program Abaqus with a pre-processing unit for the dynamic live loads: Brigade,with special empathize to the influence of the verti-cal support stiffness. The results obtained from theFEM will be compared with data measured in situ,to validate the model. Theoretical estimation of thesupport stiffness and model updating will also beperformed.
The structure is a three-span post-tensioned con-crete girder bridge, carrying one ballasted track. Themain span is 26 m long and the two side spans are18.5 m long. Between the short columns and theembankments, on both sides, there is a span of 2.2m. Therefore, the total length of the bridge is 67.4m. To simulate the behavior of the bearings, joinswere used to constrain the interaction between the
main columns and the beam. The short columnswere modeled as supports and, therefore, no connec-tors were necessary.
The interaction of the structure with the soil was,initially, considered stiff. The behavior of the bridge-embankment interaction was discussed and it wasdecided to restrain only the vertical displacementon the end of the beam. The rotation and longitu-dinal displacement were permitted because it wasbelieved that the facing walls of the embankmentwere not thick enough to constrain the correspond-ing degrees-of-freedon.
The bending stiffness of the short columns wasconsidered infinite, since the longitudinal forces werenot believed to be strong enough to change the be-havior of the structure. Thus, the longitudinal dis-placement at the short columns supports was locked.The foundation of the main columns was believed tobe stiff enough to restrain the longitudinal displace-ment, and that degree of freedom (DOF) was alsolocked. The rotation of those foundations probablyallow some rotation. However, it was decided not toinclude rotational springs in this study. Therefore,the rotation at the lower end of the columns was re-strained.
The model was meshed with Timoshenko beamelements of 0.3 m on the main beam and 1 m onthe columns. The interpolations functions used werelinear. The damping was considered as direct damp-ing and equal for the whole model. The value cho-sen was ξ = 1%, according to [26]. The loads of theGrona Taget 2 were used to define a new train in theDynamic Live Load model of Brigade. The loadmodel was then run over the structure, at differentspeeds.
For the measured data, the instrumentation of thebridge consisted of (see figure 19):– Four accelerometers, placed on the edges of the
beam and were later used to determine the eigen-frequencies.
– Four Linear Variable Differential Transformers(LVDTs), used to measure the vertical displace-ment of the first span, the longitudinal displace-ment over one of the bearings at the first supportand the rotation at the first support.The displacements were obtained from the
LVDTs, for the Grona Taget passing, approxi-mately at 230 km/h. The rotation over the eastbearing was calculated, based on the displacement
2 Information about the test train available at
http://gronataget.se/
7

Figure 18. The Sagan bridge, view from northwest (a column belonging to an older bridge behind the studied bridge can be
seen in the middle).
Figure 19. Position of the accelerometers and LVDTs.
registered at east and west of the bearing and thedistance between the LVDTs. The eigenfrequencieswere identified using the Peak Picking Method (in-formation about this method and the identificationof the mode shapes can be found in Ulker [28]).
To study the behavior of the modeled structureand the influence of the vertical support stiffness,and afterwards compare the numerical responsewith the measured values, all vertical supports werereplaced by springs, and their stiffness varied.
For footings lying on an homogeneous stratumwith height H, over a bedrock, the expression for thevertical support stiffness, Kz, suggested by Gazetas[22], is:
Kz =2GL1 − ν
(0.73 + 1.54
(B
L
)0.75)·
·(
1 +B/H
0.5 +B/L
)(1)
where B and L represent the semi-width and semi-length of the circumscribed rectangle, L>B.
The soil supporting the foundations is a rock sub-
tract partially covered by sand. It was assumed thatthe density of the water, ρw, is 1000 kg/m3, the com-pact density of sand, ρs, 2650 kg/m3 and the voidratio, e, 0.5. The effective density [kg/m3] was ob-tained using formula 2 for dry material and 3 forsaturated material:
ρ =ρs
1 + e= 1767 (2)
ρ =e · ρw + ρs
1 + e= 2100 (3)
The shear modulus, G, is:
G = ρ · c2s (4)
The shear wave velocity in the soil, cs, was as-sumed as 250 m/s and the height of the soil layerabove the rock subtract 0.8 m. Hence, using formula4 and 1, respectively, the shear modulus for satu-rated soil,G, was estimated as 1.31 ·108 and the ver-tical stiffness of the supports, Kz, 1.1 · 1010. There-fore, the theoretical vertical stiffness of the maincolumns and short columns supports was roughlyestimated as 1 · 1010 N/m. For the end supports,to simulate the influence of the bridge-embankmentinteraction, a stiffness of 1 · 109 N/m was assumed.A new model was made using these stiffness (des-ignated by model 2) and its eigenfrequencies werecompared with the eigenfrequencies obtained fromthe model with stiff supports (designated by model1) and with the measured frequencies. Figure 20shows that relation.
The resemblance between the experimental valuesand the numerical values of the model with springs(model 2) is clear, on what concerns the first fre-
8

1 2 32.5
5
7.5
10
12.5
Mode
Freq
uenc
y [H
z]
MeasuredModel 1Model 2
Figure 20. Frequencies of the first three modes of vibration
of the Sagan bridge (model 1 and 2).
quencies. In fact, the values are lower, but that isprobably due to an unprecise estimation of impor-tant properties such as the modulus of elasticity, E,of the material. Hence, it was decided to increasethe E to 42 GPa increasing, therefore, the bendingstiffness of the beam. After this, the frequencies forthe first modes became very close to the measuredvalues (figure 21). However, due to the very low stiff-ness of the end supports, the nodes at the beam endsshow large displacements, whenever a new train axleenters the bridge (see figure 23), demonstrating thatthe model should be updated. For model 1, with stiffsupports, no changes were made to the modulus ofelasticity, since it would stiffen the structure evenmore, thus reducing the, already too low, displace-ments. These displacements will be compared in fig-ures 22 to 25, illustrating why the bending stiffnesswas not changed for model 1.
Using knowledge of model updating and theknow-how provided by previous studies on thebridge, a 3rd model was proposed. That model (des-ignated by model 3) had the following properties:- Modulus of elasticity: 42 GPa;- End supports stiffness: 3 · 109 N/m;- Short columns stiffness: 2 · 1010 N/m;- Main columns stiffness: 1 · 1010 N/m.
The vertical support stiffness values were reason-able, considering the results obtained with equa-tion 1. Moreover, recent experimental studies under-taken on the Sagan bridge columns by PhD StudentMahir Ulker, from the Division of Structural Designand Bridges of KTH, for estimating the support stiff-ness, suggested a stiffness around 9 · 109 N/m, veryclose to the values adopted for model 2 and 3. How-ever, the experimental method used for that calcula-tion needs further investigation and validation (seeUlker [29]).
The influence of the updating on the frequenciesof the first ten modes of vibration is shown in fig-
ure 21. Table 4 shows the eigenfrequencies of thedifferent models and between parenthesis the rela-tions between them and the measured frequencies.The displacements of the FE models were comparedwith the measured values and are shown in figures22 to 24.
1 2 32.5
5
7.5
10
12.5
Mode
Freq
uenc
y [H
z]
MeasuredModel 1 (E=32 GPa)Model 2 (E=42 GPa)Model 3 (E=42 GPa)
Figure 21. Frequencies of the first and three modes of vibra-
tion of the Sagan bridge (with the updated model).
Table 4
Frequencies [Hz] of the first ten modes of vibration with thepercentages, comparing with the measured values, between
parenthesis (with the updated model).
Measured Model 1 Model 2 Model 3
(E=32 GPa) (E=42 GPa) (E=42 GPa)
5.78 (100%) 5.34 (92%) 5.66 (98%) 5.78 (100%)
9.74 (100%) 11.10 (114%) 9.82 (101%) 10.53 (108%)
10.40 (100%) 12.45 (120%) 10.76 (103%) 11.40 (110%)
- 17.90 17.70 17.72
- 23.23 26.44 26.61
- 31.21 26.61 26.90
- 33.24 27.63 28.46
- 35.28 32.42 33.08
- 42.49 41.78 42.76
- 48.21 48.51 48.68
One can see that the eigenfrequencies for model2, with E=42 GPa, are very close to the measuredfrequencies, confirming the idea that the modulus ofelasticity of the concrete was initially assumed toolow. The 3rd model has eigenfrequencies 8 to 10%higher than the measured, but, as can be seen in fig-ures 22 to 25, the displacements and the rotationsshow very good accuracy. The maximum displace-ment at mid-span 1 was only 1% higher than thedisplacement registered with the LVDT and the ro-tation at east bearing was 4% lower (see table 5).
From the analysis of the displacement at mid-span1 (figure 22), it is possible to see that all the models
9

0 0.5 1 1.5 2 2.5−6
−4
−2
0
2
4x 10
−4
Time [s]
Dis
plac
emen
t [m
]
MeasuredModel 1 (E=32 GPa)Model 2 (E=42 GPa)Model 3 (E=42 GPa)
Figure 22. Vertical displacement at mid-span of span 1 (see figure 19).
0 0.5 1 1.5 2 2.5−6
−4
−2
0
2x 10
−5
Time [s]
Dis
plac
emen
t [m
]
MeasuredModel 1 (E=32 GPa)Model 2 (E=42 GPa)Model 3 (E=42 GPa)
Figure 23. Vertical displacement over east bearing (east).
0 0.5 1 1.5 2 2.5−15
−10
−5
0
5x 10
−5
Time [s]
Dis
plac
emen
t [m
]
MeasuredModel 1 (E=32 GPa)Model 2 (E=42 GPa)Model 3 (E=42 GPa)
Figure 24. Vertical displacement over east bearing (west).
0 0.5 1 1.5 2 2.5−10
−5
0
5x 10
−5
Time [s]
Rot
atio
n [r
ad]
MeasuredModel 1 (E=32 GPa)Model 2 (E=42 GPa)Model 3 (E=42 GPa)
Figure 25. Rotation over bearing.
10

Table 5Maximum responses for the 3 models (between parenthesis are the percentages, comparing with the measured values).
Rotation over Displacement at Displacement over Displacement over
bearing [10−3 rad] mid-span 1[mm] bearing (east) [mm] bearing (west) [mm]
Measured 0.06(100%) 0.46(100%) 0.02(100%) 0.08(100%)
Model 1 0.02(34%) 0.39(85%) 0.01(25%) 0.02(26%)
Model 2 0.09(141%) 0.53(117%) 0.05(216%) 0.11(148%)
Model 3 0.06(96%) 0.46(101%) 0.02(103%) 0.07(95%)
show reasonable agreement with the measured val-ues. For model 1, with stiff supports, the displace-ments are lower, as expected. The opposite happensfor model 3, with the less stiff supports.
The displacements over the bearing (figures 23and 24) are 10 times lower than the observed dis-placement at mid-span, and show greater sensitiv-ity whenever a train axle enters the bridge. Model1 shows almost no displacement, implying that amodel with stiff supports does not correctly simu-late the behavior of the structure. For model 2, thecomputed displacements are higher than the exper-imental and show very high variations for the eastLDVT. As it was said before, the reason for this isbelieved to be that the very low stiffness of the endsupports leave the ends of the beam too loose, con-trary to what happens in reality. The rotation overthe bearing (figure 25) is, once again, very low formodel 1 and model 2 shows values greater than themeasured. However, model 3 shows perfect agree-ment, the same happening for the displacements. Ta-ble 5 shows the maximum responses of the structure,for different support conditions. Between parenthe-sis are the percentages, comparing with the mea-sured values.
The first conclusion from the results is that amodel with stiff supports may not show the actualbehavior of the real structure. The values of thefrequencies obtained from the model with stiff sup-ports and, even more important, the relation be-tween them, are far from the measured. Moreover,the maximum vertical displacement for the modelwith stiff supports (model 1) was approximately be-tween 70% and 15% lower than the measured values.
With this case study is was shown that, on onehand, a model with stiff supports may not be reli-able if realistic predictions of the dynamic behav-ior are to be made. On the other hand, that witha simple 2D beam model it is possible to simulatereasonably well the behavior of the structure. Fur-thermore, with the help of field measurements and
model updating, these simulations can be increas-ingly accurate.
However, one should be conscious of the modellingsimplifications made to the structure. The bridge-embankment interaction clearly represents an elas-tic rotational spring at the end of the bridge deck,that was not accounted for in the model. Rotationalsprings are also more accurate to simulate the in-teraction at the lower end of the columns, insteadof locking the rotational DOFs. More investigationabout this subject should be done. Moreover, a 2Dbeam analysis does not take into account transver-sal or torsional modes of vibration. This fact is notso harmful because the bridge is transversally sym-metrical, with a single track, but a 3D analysis of thebridge should be made. Furthermore, the vehicle-structure interaction and the distribution of the axleloads through the ballast were neglected, the samehappening with the flexibility/stiffness of the bear-ings. The track-ballast bed may also give some ex-tra stiffness to the structure, that was not accountedfor. Studies on these questions seem very interestingand should be undertaken in the future. Neverthe-less, the results of the study were found to be verysatisfactory and hopefully helpful for future investi-gations on the subject.
4. Conclusions
The work undertaken has presented the influenceof vertical support stiffness on the behavior of high-speed railway bridges. Theoretical and numericalstudies on two common bridges: one single spansimply supported bridge and one double span con-tinuous composite bridge on the Bothnia Line, wereconducted. For the simply supported bridge, theexact responses proposed by Fryba [6] for an Euler-Bernoulli beam were used, and compared with theresults obtained form the FEM. For the doublespan bridge, no analytical results were extracted,and only FEM was used in the study. From the two
11

studies undertaken, the following conclusions canbe made:– Filtering at a cut-off frequency of 20 Hz may not
identify critical behaviors. Even the value of 30 Hzor 2 times the frequency of the first mode of vibra-tion, suggested in the D214 reports; [27], seemstoo low to include relevant contributions of highermodes of vibration for the acceleration response;
– The influence of the vertical stiffness of the sup-ports on the eigenfrequencies is very large, andmost of all, the relation between the frequencieschange significantly for different support stiffness;
– Increasing the vertical stiffness of the supportsmoves the resonance peaks to higher speeds, pos-sibly outside the speed range of the train, decreas-ing the probability of resonant behavior of thestructure;
– Flexible supports bring the resonance peaks tolower speeds, but increase the mass participation.Furthermore, mode shapes change and new rigidbody modes can occur;
– Large settlements may occur at the supports withlow vertical support stiffness, when loaded sys-tematically with train axles, resulting in openingof cracks in the concrete and fatigue related prob-lems;
– Accelerations may be greatly underestimated by amodel with stiff supports, which may mislead thedesigner to think that the bridge-track is stableand follows the ERRI recommendations on bridgedeck accelerations [27]. This can, afterwards, in-stigate ballast and track destabilization, when thestructure is at service and loaded with high-speedtrains;
– Train resonant speeds are highly influenced bythe stiffness of the supports. Using a simple for-mula, designers are able to check the train speedat which resonance effects may occur. Moreover,increasing the stiffness of the structure and of thesupports, the resonant speeds can be altered;
– Resonance speeds may become more difficultto distinguish, if the stiffness of the supports istoo low, due to the greater influence that highermodes (both bending modes and rigid bodymodes) have on the structural behavior;
– Most of all, it should be mandatory to model thestiffness of the supports when designing or study-ing HSR bridges.In the 2nd part of the study, an investigation
was conducted to investigate the agreement of theFE models with experimental records. The Saganbridge, a three-span post-tensioned concrete girder
bridge, carrying one ballasted track was used asa case study. Studies on how sensitive were theeigenfrequencies, displacements and accelerations,to changes in the supports stiffness were performed.From the results, one can conclude:– Models with stiff supports can greatly underesti-
mate the maximum responses of HSR bridges andmay not be reliable if realistic predictions of thedynamic behavior are to be made;
– The formulas suggested by Lysmer and Richart[17], Richard et al. [18] and Gazetas et al. [21,22] give reasonably accurate estimations for thevertical stiffness of the supports;
– Model updating is a very useful tool for designersand researchers. Powerful algorithms have alreadybeen implemented for computer aided model up-dating, with reasonable results, speeding the up-dating process;
– Very simple 2D beam models are able to simulatereasonably well the behavior of real structures.Furthermore, with the help of field measurementsand model updating, these simulations can be in-creasingly accurate, and particulary meaningfulfor structures under constant monitoring.The results obtained with the updated FE model
were found to be very satisfactory. Nevertheless, oneshould be aware of the simplifications in the model.Moreover, a 2D analysis may excessively underesti-mate the complexity of the structure, and providemisleading results, especially for bridges carryingmore than one track.
Acknowledgments
The research presented in this paper was carriedout at the Department of Structural Engineering,Structural Design and Bridges, at the Royal Insti-tute of Technology (KTH) in Stockholm, Sweden.The study was conducted under the supervisionof Associate Professor Raid Karoumi and PhDStudent Mahir Ulker, to whom I am very grateful.
References
[1] R. Willis. Appendix to the report of the commis-sioners appointed to inquire into the applicationof iron to railway structures. Stationery office,London, 1849.
[2] S.P. Timoshenko. Vibration Problems in Engi-neering. D. Van Nostrand Company, New York,1928.
12

[3] C.E. Inglis. A mathematical teatrise on vibra-tions in railway bridges. Cambridge UniversityPress, Cambridge, 1934.
[4] Ladislav Fryba. Vibration of solids and struc-tures under moving loads. Noordhoff Interna-tional Publishing, Groningen, 1972.
[5] Ladislav Fryba. Dynamics of Railway Bridges.Thomas Telford, Prague, 1996.
[6] Ladislav Fryba. A rough assessment of rail-way bridges for high-speed trains. EngineeringStructures, Volume 23, Issue 5:548–556, 2001.
[7] H. Xia and N. Zhang. Dynamic analysis of rail-way bridge under high-speed trains. Comput-ers & Structures, Volume 83, Issues 23-24:1891–1901, 2005.
[8] H. Xia, Y.L. Xu, and T.H.T. Chan. Dynamicinteraction of long suspension bridges with run-ning trains. Journal of Sound and Vibration,Volume 237:263–280, 2000.
[9] H. Xia, G. De Roeck, H.R. Zhang, andN. Zhang. Dynamic analysis of train-bridgesystem and its application in steel girder rein-forcement. Computers & Structures, Volume79, Issues 20-21:1851–1860, 2001.
[10] H. Xia, G. De Roeck, and J. Maeck N. Zhang.Experimental analysis of a high-speed railwaybridge under Thalys trains. Journal of Soundand Vibration, Volume 268:103–113, 2003.
[11] H. Xia, N. Zhang, and G. De Roeck. Dynamicanalysis of high-speed railway bridge under ar-ticulated trains. Computers & Structures, Vol-ume 81, Issues 26-27:2467–2478, 2003.
[12] H. Xia, N. Zhang, and R. Gao. Experimen-tal analysis of railway bridge under high-speedtrains. Journal of Sound and Vibration, Volume282, Issues 1-2:517–528, 2005.
[13] J.W. Kwark, E.S. Choi, Y.J. Kim, B.S. Kim,and S.I. Kim. Dynamic behavior of two-span continuous concrete bridges under mov-ing high-speed train. Computers & Structures,Volume 82, Issues 4-5:463–474, 2004.
[14] Johan Oscarsson. Dynamic train-track inter-action: variability attributable to scatter in thetrack properties. Vehicle System Dynamics,Volume 37, Issue 1:59–79, 2007.
[15] Sara Maria dos Santos. ComportamentoDinamico de Pontes Ferroviarias em Vias deAlta Velocidade (in Portuguese). M.Sc. Thesis,Universidade do Porto, Porto, Portugal, 1994.
[16] R. Moreno Delgado and S.M. dos Santos. Mod-elling of railway bridge-vehicle interaction onhigh-speed tracks. Computers & Structures,
Volume 63, Issue 3:511–523, 1997.[17] J. Lysmer and F. E. Richart. Dynamic response
of footings to vertical loading. Journal of theSoil Mechanics and Foundations Division, Vol-ume 92, Number 1:65–91, 1966.
[18] F.E. Richard, R.D. Woods, and J.R. Hall. Vi-bration of soil and foundations. Prentice Hall,New Jersey, 1970.
[19] D.D. Barkan. Dynamics of bases and founda-tions. McGraw Hill Co., New York, 1962.
[20] S.P. Timoshenko. Theory of Elasticity.McGraw-Hill Book Co., New York, 1934.
[21] George Gazetas, Ke Fan, Amir Kaynia, andEduardo Kausel. Dynamic interaction factorsfor floating pile groups. Journal of Geotechni-cal Engineering, Volume 117, Number 10:1531–1548, 1991.
[22] George Gazetas, George Mylonakis, Sissy Niko-laou, and Andre Chauncey. Development ofAnalysis and Design Procedures for SpreadFootings. University of Buffalo, New York,2002.
[23] UIC-ERRI Committee D214. Report 4. Train-bridge interaction, 1999.
[24] CEN. EC1 - Actions on Structures. Part 2:Traffic Load on Bridges (prEN 1991-2). Brus-sels, 2003.
[25] Hibbitt, Karlsson, and Sorensen. Abaqus User’sManual. Pawtucket, 2006.
[26] UIC-ERRI Committee D214. Report 3. Rec-ommendations for calculating damping in railbridge decks, 1999.
[27] UIC-ERRI Committee D214. Report 8. Con-firmation of values against experimental data.Part A: Rig tests to investigate ballast be-haviour on bridges due to high acceleration lev-els - Confirmation of the acceleration limit forthe ballast. Part B: Comparison of calculationsand measurements using simplified models ofrail bridges - Confirmation of the validity of thecalculated values, 1999.
[28] Mahir Ulker. The Dynamic Response of twoConcrete Railway Bridges during the testing ofGrona Taget. Royal Institute of Technology,Stockholm, Sweden, 2007.
[29] Mahir Ulker. Measuring the Dynamic Stiffnessof Bridge Column Foundations. Royal Instituteof Technology, Stockholm, Sweden, 2007.
13