in this together - young...
TRANSCRIPT

IN THIS TOGETHER:
The Hidden Cost of Young Adult Unemployment
January 2014
a policy brief by: Rory O’Sullivan, Konrad
Mugglestone, and Tom Allison

IN THIS TOGETHER
2
About Young Invincibles
Young Invincibles is a non-partisan, non-profit organization that seeks to amplify the voices of young
Americans and expand opportunity for our genera-tion. Young Invincibles engages in education, policy
analysis, and advocacy around the issues that matter most to this demographic. Young Invincibles primarily
focuses on health care, education and economic op-portunity for young adults, and works to ensure that
the perspectives of young people are heard wherever decisions about our collective future are being made.
AcknowledgementsThe authors would like to thank Dr. Anthony Carnevale,
Dr. Jeff Strohl and the Georgetown Center for Education and the Workforce for their generous assistance in the develop-
ment of this report. We also would like to thank the following people for their thoughtful comments, edits, and assistance: Dr. Michael Hanmer, Aaron Smith, Jen Mishory, Reid Setzer,
Portia Boone, Christina Postolowski, Jacob Wallace, and Bri-an Burrell. Finally, we would like to thank Ellen Qualls, Julian
Aldana, Jessica Adair, Colin Seeberger, Katherine Schaller, and RaeAnn Roca-Pickett for their extraordinarily hard work
in graphic design, communications, and outreach. Without any of you, this project would not have been possible.

The Hidden Cost of Young Adult Unemployment
together, invincible 3
Table of ContentsForeword ... 4
Key Findings ... 5
The Cost to the Nation: What We Found ... 6
The Cost to the States: What We Found ... 9
Policy Recommendations ... 11
End Notes ... 14
Appendix A ... 16
Appendix B ... 18 � Table B.1: Foregone Federal Income Taxes Per Unemployed 18- to 24-Year-
Old ... 18
� Table B.2: Foregone Federal Income Taxes Per Unemployed 25- to 34-Year-Old ... 20
� Table B.3: Foregone FICA Taxes Per Unemployed 18- to 24-Year-Old ... 22
� Table B.4: Foregone FICA Taxes Per Unemployed 25- to 34-Year-Old ... 24
� Table B.5: Foregone State Income Taxes Per Unemployed 18- to 24-Year-Old ... 26
� Table B.6: Foregone State Income Taxes Per Unemployed 25- to 34-Year-Old ... 28
� Table B.7: Welfare Savings Per Employed 18- to 24-Year-Old ... 30
� Table B.8: Welfare Savings Per Employed 25- to 34-Year-Old ... 32
� Table B.9: Unemployment Insurance Savings Per Employed 18- to 24-Year-Old ... 34
� Table B.10: Welfare Savings Per Employed 25- to 34- Year-Old ... 36
� Table B.11: State Share of Young Adult Unemployment’s Cost to the Federal Government ... 38
� Table B.12: Cumulative Costs of Young Adult Unemployment to State Governments ... 40
� Table B.13: Federal and State Tax Losses Per State Taxpayer ... 42

IN THIS TOGETHER
4
Foreword
Dear Reader:
As the director of the Center on Education and the Workforce at Georgetown University, I first met Rory O’Sullivan and his team at Young Invincibles as we began the research for Failure to Launch, a report that examined young adults’ delayed launch of their careers and adult lives over the past three decades. We worked together in partnership with Generations United and The Generations Initiative, led by Hilary Pennington, in a broad effort to examine how generational issues play out in different arenas of our economy and society.
Since its inception, Young Invincibles has provided an authentic and credible voice for young adults across the country. At a time when young people are facing a mountain of new challenges in college, the labor market, and the home, their new report, In This Together, lays clear how much our failure to provide young people with good jobs is costing our economy and the public each year at the federal and state level. Their findings are staggering: severely high youth unemployment costs $9 billion in tax revenue each year at the federal and state level.
In This Together is a call to action for the national public, and the message shouldn’t be taken lightly. How we tackle the problems facing today’s youth has enormous implications for what the rest of the 21st century will look like in the U.S. Their policy proposals represent the opening of a national dialogue about how to address our current youth employment crisis.
Sincerely,
Dr. Anthony Carnevale Director The Georgetown University Center on Education and the Workforce

The Hidden Cost of Young Adult Unemployment
together, invincible 5
Key Findings
Throughout the deepest recession and the slow-est recovery since World War II, young adults in America have walked an exceptionally difficult road. The cohort of “Millennials” aged 18 to 34 have now seen double-digit unemployment rates for over 70 consecutive months, or almost six years. The youngest workers, aged 16 to 24, are even worse off, with unemployment rates well over twice the national average—at 15 percent versus an average for the full working population of 7.3 percent.1 Moreover, we have made little progress toward recovery.
In prior downturns, the employment rate for young adults nearly reached pre-recession levels within 5 years.2 In the Great Recession, young adult employment had not even recovered halfway by the same point. A quarter of all job losses for young adults came after the Great Recession was offi-cially over.3 The lack of jobs has driven many discouraged young people from the labor force altogether. A recent re-port by Opportunity Nation estimates that 5.8 million young adults are nei-ther working nor in school.4
The best evidence warns that lack of work experience now will lead to dis-mal consequences for these jobless young people down the road in the form of repressed wages, decreased employment, and reduced productiv-ity.5 By one calculation, young Ameri-cans aged 20 to 24 will lose about $21.4 billion in earnings over the next 10 years. That’s roughly $22,000 less per person than they could have ex-
pected had they not suffered through the reces-sion.6
However, our generation’s challenges extend beyond each individual’s struggle, or even this generation’s struggle: the young adult unem-ployment crisis affects everyone. Every year of historically high young adult unemployment means lower tax revenue and higher safety net expenditures for federal and state governments. Taxpayers of all generations bear the burden.
To quantify this problem, Young Invincibles cal-culated the average monetary cost passed on to
Figure 1
Breakdown of the Cost of Youth Unemployment (18- to 24-year-olds)

IN THIS TOGETHER
6
the taxpayer due to high youth unemployment. Building upon our previous research into the re-pressed job market for young workers, we find that the costs are too high to ignore. Chronically high young adult unemployment places heavy burdens not just on young people, but also on taxpayers of all ages. We estimate:
� COST PER WORKER: On average, one un-employed 18- to 24-year-old will cost his or her federal and state government over $4,100 annually in forgone tax revenue paid and safety net benefits paid out. One un-
employed 25- to 34-year-old represents nearly $9,900 annually in foregone tax revenue and benefits received.7 The over-whelming majority of these costs derive from lost tax revenue, not from services delivered.
� ADDING IT ALL UP: The total an-nual cost of severely high unemployment rates for 18- to 34-year-olds on the fed-eral and state governments is almost $8.9 billion annually.
� COST TO INDIVIDUAL TAX-PAYER: If those costs were passed on directly to the taxpayer, high young adult unemployment would add an extra $53 to every American taxpayer’s annual federal tax bill. The cost is higher when including state income tax losses.
� MISSED OPPORTUNITIES: If we consider the more than 3.4 million jobs that simply don’t exist due to the reces-sion, the total cumulative cost of jobless-ness for 18- to 34- year-olds borne by federal and state governments is over $25 billion annually. This represents an average annual cost of over $171 per tax-payer.
The Cost to the Nation: What We Found
Jonea, a 26-year-old from Maryland, stopped pursuing an associate degree because her moth-er was diagnosed with breast cancer. When her mother passed, she took online courses through the Art Institute of Pittsburgh, but had to stop attending when the costs became prohibitive. Despite having experience working at a Giant grocery store, she has been unable to find work
Figure 2
Breakdown of the Cost of Youth Unemployment (25- to 34-year-olds)

The Hidden Cost of Young Adult Unemployment
together, invincible 7
in retail. Routinely, potential employers told her she was either over- or under-qualified. To make matters worse, Jonea applied for unemploy-ment benefits after leaving Giant, but she was lost in the system and never heard back. Her story is only one example of the millions of hard-working young people who lack options for basic economic security.
Individual unemployment carries a huge person-al cost. It means reduced opportunities, greater anxiety, and dreams deferred or even denied. Scale that up to a generation, and it creates bil-lions of dollars in economic losses.
Cost per worker
If the moral price of high young adult unemploy-ment does not move our policymakers to action, then the social cost should. We estimate the price of young adult unemployment by combin-ing foregone federal income taxes (after credits) and Federal Insurance Contribution Act (FICA) taxes with increased expenditures on unemploy-ment insurance and welfare programs (See Ap-pendix A for our detailed Methodology). On av-erage, we calculate that one unemployed 18- to 24-year-old will cost the federal and respec-tive state government over $4,100 annually in forgone tax revenue and benefits received. The costs to government grow as unemployed individuals age. On average, we estimate each unemployed 25- to 34-year-old will cost his or her federal and state government a staggering $9,875 annually. Putting that in perspective, the average tuition and fees for an in-state resi-dent at a public college during the 2013-2014 school year was $8,093.8 In any given year, we lose more money on unemployed young people than it would cost to invest in sending them to an in-state public university. Given lower unem-ployment and higher wages for college gradu-
ates,9 paying for young adult unemployment is an inefficient allocation of taxpayer dollars.
Importantly, lost tax revenue, not safety net benefit costs, drive the social cost of young adult unemployment. We estimate that the federal government loses over $3,200 in po-tential income taxes and FICA taxes per 18- to 24-year-old, and almost $7,000 per 25- to 34-year-old. Unemployment benefits make up a smaller portion, with even less coming from welfare payments. On average, an unemployed 18- to 24-year-old is estimated to receive only around $280 more in these benefits a year. This limited social safety net accounts for less than 7 percent of the cost of their unemployment. The remainder is lost tax revenue.
This should come as no surprise. Eligibility for unemployment insurance, a significant vehicle protecting workers from economic downturns, is based on wages earned and time employed. Younger workers who generally earn less dur-ing their budding careers qualify for few bene-fits. Furthermore, recent high school or college
Cost of Youth Unemployment
Figure 3

IN THIS TOGETHER
8
graduates looking for work will, in many cases, receive no benefit at all.
Because unemployed 25- to 34-year-olds are more likely to have had an established career be-fore unemployment and thus higher wages, an unemployed person in this age group receives an average of over $1,800 in social insurance bene-fits. Of this number, the vast majority (~$1,700) comes from unemployment insurance.
Adding it all up
Our next step was to add up the individual costs of young adult unemployment to arrive at an aggregate cost. If the United States were to re-duce its young adult unemployment rates to pre-recession levels (9.63 percent and 6.56 percent for 18- to 24-year-olds and 25- to 34-year-olds, respectively), it would need to create about 1 million jobs for 18- to 24-year-olds, and another nearly 500,000 jobs for 25- to 34-year-olds. In other words, assuming no increase in the labor force size, we are 1.5 million jobs short of where we would need to be to reach 2007 young adult unemployment rates (remember that this ex-cludes the many young people who have left the job market – we will get to that soon).
Multiplying the missing jobs by the average cost of each unemployed young person, we estimate that the total annual cost of severely high unem-ployment for 18- to 34-year-olds on the federal
and state governments is almost $8.9 billion an-nually. The federal government bears the brunt of the burden, totaling almost $7.8 billion out of the $8.9 billion annual total. The bulk of this comes from forgone federal income taxes and FICA taxes paid by employed young Americans. Losses absorbed by the states account for the remaining $1.1 billion, which we will analyze in the following section.
Cost per taxpayer
Approximately 146 million individual income tax returns were filed for fiscal year 2012. If the $7.8 billion federal burden were placed di-rectly on the taxpayers, it would cost an extra $53 per federal taxpayer. This ignores the ad-ditional $1.1 billion burden imposed by state governments. When factoring in state taxation, the average burden placed directly on the pub-lic is over $60 per American taxpayer. Depend-ing on the states’ tax system, this amount could be higher or lower. Table 1 shows the estimated cumulative cost of these lost jobs, calculated by multiplying these values with our estimated cost per young adult.
Missed opportunities
However, as we noted in the introduction, mere-ly focusing on the labor force misses a huge de-mographic of young people: those not working and not in school. Often referred to as “discon-nected” or “opportunity youth,” these young
Cohorts Federal Cost State Cost Total Cost
18- to 24-year-olds $3.59 billion $573 million $4.16 billion
25- to 34-year-olds $4.21 billion $528 million $4.74 billion
18- to 34-year-olds $7.80 billion $1.1 billion $8.90 billion
Average cost per taxpayer $53.32 $7.53 $60.84
Table 1: Costs of High Youth Unemployment Rates in America

The Hidden Cost of Young Adult Unemployment
together, invincible 9
people face some of the greatest challenges of anyone in our generation. Moreover, the prob-lem pre-dates the Great Recession as young people never really recovered their employment levels from the 2001 “dot-com” crash. Defining this population poses challenges, however. So in order to estimate the cost of young people who are not in the labor force, we calculated a cost for all of those who had left the job market once the recession hit.
In November 2007, 63.8 percent of all 18- to 24-year-olds and 79.1 percent of 25- to 34-year-olds were employed. By March 2013, these numbers had dropped to 54.6 percent and 75.4 percent, respectively. Putting this in perspective, had the economy maintained its pre-recession levels of employment, more than 3.4 million additional Millennials would be em-ployed. If these were all full-time positions, they would represent more than $25 billion annually in net losses to federal and state governments. Should these costs be passed
directly to American taxpayers, we estimate that each and every taxpayer would be liable for about $171 a year, or around $110 on top of our estimated costs related to high unem-ployment rates. While some of these jobs may have been part-time, these estimated annual costs are still astronomical.
The Cost to States: What We Found
While every American taxpayer will share the $53 per year in federal costs, not all states carry the same burden from young adult unemploy-ment. The annual loss of $1.1 billion in state tax-es across all states is certainly enormous. How-ever, differences in young adult unemployment rates, as well as differences in average wages, state tax rates, and minimum wages (among other factors) can make the situation even more extreme in some locations. When considering the total amount a state loses relative to other
Figure 4

IN THIS TOGETHER
10
states, population size must also be taken into account alongside these other factors. Figure 4 shows the worst 10 states for total state tax losses, all of which are estimated to lose $50 mil-lion or more annually. Unsurprisingly, California is first on the list, but it also has the largest pop-ulation in the country by far. New York, Illinois, and Pennsylvania also boast large populations. However, significantly less populous states such as North Carolina, Georgia, New Jersey, Ala-bama and Kentucky round out the top 10. The southern states have shockingly high young adult unemployment rates, despite relatively low state tax rates.
When we divide these estimated cumulative losses by the number of tax returns filed within the state, the picture changes dramatically. This roughly controls for state population, project-ing how much each taxpayer within any given state pays above the $53 cost we estimated ev-ery American taxpayer is already facing. Figure 5 shows these results, and as one can see, the worst five states for this per-taxpayer cost are
all southern states.
We provide in Appendix B comprehensive lists of our estimates for all 50 states, including lists capturing cumulative federal costs, cumula-tive state costs, per taxpayer costs, and per unemployed young adult costs for both 18- to 24-year-olds and 25- to 34-year-olds.
Despite generally lower state tax rates, taxpay-ers in southern states face the largest per tax-payer costs due to the severely high young adult unemployment rates. Residents in Kentucky, Alabama, and North Carolina all see about $27 more on their state tax bill every year, piling on another 50 percent to the increased federal tax burden.
States bearing high costs of young adult unem-ployment aren’t just limited to the Southern United States. Due to differences in wages, tax structure, and living costs, a number of states face significant losses per unemployed young adult. Oregon, Massachusetts, Washington DC,
Figure 5

The Hidden Cost of Young Adult Unemployment
together, invincible 11
New York, Virginia, and Hawaii all face losses of more than $1,000 per unemployed 18- to 24-year-old. Similarly, DC and New York face losses of almost $3,000 per 25- to 34-year-old. Furthermore, Oregon, California, Connecticut and Massachusetts all face estimated costs be-tween $1,600 and $2,000 per unemployed 25- to 34-year-old. Interestingly, many of the states facing the highest per-young adult costs are not the same as those with the highest per taxpayer costs, demonstrating there are numerous incen-tives for different states to deal with this crisis.
Policy Recommendations
Fortunately, young people, and the country, do not have to continue to pay the price for ignor-ing high young adult unemployment. There are a number of proven solutions that can help get our generation, and the future of our economy, back on track. They fall into two basic categories: first, we must reconnect young people to the workforce to prevent more long-term damage to our generation’s economic future. Second, we must improve our generation’s skills generally to avoid a historic unemployment crisis down the road. These recommendations can both help to fulfill the promise of the American dream for this generation and deliver a return on investment for taxpayers, one that will ultimately grow the economy for everyone.
First, we see expansions of paid service as es-sential to reconnecting young adults to the labor force. Service offers young people the oppor-tunity to learn valuable skills while aiding com-munities in need. Ramping up AmeriCorps -- a program that currently offers only 82,500 posi-tions yet receives more than 500,000 applicants a year -- is a demonstrable way to fill the young adult jobs gap.10 AmeriCorps is the largest na-
tional service program in the country, and for every dollar spent on national service, American society receives nearly $2.50 in benefits.11 Ad-ditionally, AmeriCorps alumni enjoy better job prospects and higher wages than young adults who have not participated.12
Additionally, Young Invincibles proposes rein-stating the Youth Opportunity Grant (YOG) pro-gram. Congress defunded YOG in 2005, despite later evidence that communities with YOGs had significant success reconnecting at-risk youth to the workforce compared to communities with-out grants.13 With over 5.8 million young peo-ple who are neither working nor in school, the country needs a plan targeted at this population. YOG established centers in high-poverty areas, staffed with counselors providing training in life skills and community service in order to improve employment rates. Though there remain several ways to improve the program, it created more than 23,500 internship opportunities, placed more than 46,000 young people in jobs, and provided training to almost 23,500 participants for its 5-year, $1 billion price tag.14 Considering each at-risk youth costs taxpayers $170,740 over their lifetime, YOG, if reinstated, would pay for itself.15
However, the expansion of national service and reinstatement of YOG alone will not solve young adult unemployment. We need a plan that bet-ter prepares all young people with the skills they need upon entering the workforce. Work-based learning experiences such as apprenticeships and internships offer a great opportunity to do this.
Young Invincibles strongly supports expanding the Department of Labor’s Registered Appren-ticeships program. RAs provide potential work-

IN THIS TOGETHER
12
ers with a combination of hands-on work and classroom instruction in order to train them in vital technical skills, all while getting paid. Reg-istered Apprenticeships are extraordi-narily profitable for the federal government, resulting in $50 in government revenue for every federal dollar invested, an eye-open-ing 5,000% return-o n - i nv e s t m e n t . 1 6 The RA program is profitable for busi-ness as well- with researchers finding that every dollar in-vested in an appren-tice returns $1.40 to the employer.17 It is no wonder that 97 percent of sponsoring organizations would recommend RAs to other companies.18 If the Department of Labor expanded the RA program by 600,000, it could add an extra $74.4 billion in social benefits to the economy over the lifetime of each gradu-ating class.
Despite the success of RAs, not all companies or young people will find the longer time frame attractive. In order to provide a shorter-term al-ternative for students, we propose establishing a new “Career Internship” standard, combining a long-term internship with a school-approved employer. Schools would need to ensure that employers offer valuable training and experi-ence beyond clerical work. The positions would pay at least minimum wage, but require a mini-mum number of hours a week in order to earn high school or college credit. There would also be a component to allow out-of-school youth
the opportunity to participate. The program would provide necessary workplace experience to young people while giving employers an op-
portunity to evaluate and retain future employees.
Drexel University’s Coop-erative Learning Pro-
gram already imple-ments a similar and successful model. The money earned by the student could be used to help make college more affordable. In-
deed, at Drexel, the average six-month sal-
ary of students working in the program is greater
than $16,000.19 Further-more, participants could deter-
mine if the career is an optimal fit for their expectations and skillset. Finally, establish-ing a standard for internships would provide a low-cost incentive for employers to improve their existing internship programs. Similar to how the organic food label encourages farm-ers to go organic through positive recognition, the “career internship” label could be something that employers could market to consumers and potential employees as a sign of corporate re-sponsibility.
Finally, moving beyond the scope of what gov-ernment can do, employers across America stand to benefit from creating roles within their organizations for more Millennial workers. We know intuitively this generation is adept at employing the latest technology and increas-ing productivity. We know this generation has
These recommendations
can both help to fulfill the promise of the American
dream for this generation and deliver a return on investment
for taxpayers, one that will ultimately grow the
economy for everyone.
The Hidden Cost of Young Adult Unemployment
together, invincible 13
learned collaboration and an inclusive approach. Polls20 show we are entrepreneurial in our think-ing, in part because we doubt institutions will be able to keep their commitments to us in years to come and we have become more creative and self-reliant as a result. These are all qualities that 21st century businesses and organizations need more of to innovate and grow. So hire a Millennial! We're all in this together.

IN THIS TOGETHER
14
1. Young Invincibles’ analysis of “Current Population Sur-vey,” Bureau of Labor Statistics, US Census Bureau, accessed November 8, 2013, http://younginvincibles.org/2013/11/young-invincibles-statement-on-octo-ber-jobs-report/.
2. O’Sullivan and Mugglestone, How the Great Recession is the Worst for Millennials in Six Graphs (Washington, DC: Young Invincibles, 2013), 9, accessed November 20, 2013, http://younginvincibles.org/wp-content/uploads/2013/07/How-the-Great-Recession-is-the-Worst-for-Millennials-in-Six-Graphs.pdf.
3. Ibid.
4. Opportunity Nation, The Opportunity Index 2012 (Bos-ton: 2013), accessed November 20, 2013, http://oppor-tunityindex.org/national-trends/.
5. Mroz and Savage, “The Long Term Effects of Youth Un-employment,” The Journal of Human Resources 41, no. 2 (2006): 259–293; Lisa Kahn, “The Long Term Labor Market Consequences of Graduating from College in a Bad Economy,“ Labor Economics 17, no. 2 (2010): 303–316.
6. Sarah Ayres, The High Cost of Youth Unemployment (Wash-ington, DC: The Center for American Progress, 2013), accessed November 20, 2013, http://www.american-progress.org/issues/labor/report/2013/04/05/59428/the-high-cost-of-youth-unemployment/.
7. Comparison to a young adult who has a full-time (i.e. 40-hour-a-week) job throughout the entire year.
8. Frohlich, Sauter and Hess, “States with the most and least affordable colleges,” USA Today, October 30, 2013, accessed November 20, 2013, http://www.usa-today.com/story/money/personalfinance/2013/10/30/states-affordable-colleges/3312451/.
9. Bureau of Labor Statistics, Earnings and Unemployment Rates by Educational Attainment (Washington, DC: US Department of Labor, 2013), accessed November 20, 2013, http://www.bls.gov/emp/ep_chart_001.htm.
10. Young Invincibles, Young American Ideas Book: 12 Solu-tions to Help Get Our Generation Back on Track (Washing-ton, DC: 2012), 6, accessed November 20, 2013, http://
younginvincibles.org/wp-content/uploads/2012/08/Young-American-Ideas-Book.pdf.
11. Clive Belfield, The Economic Value of National Service (Washington, DC: Voices for National Service and Civic Enterprises for the Franklin Project at The Aspen Insti-tute, 2013), 14, accessed December 26, 2013, http://www.aspeninstitute.org/sites/default/files/content/docs/pubs/FranklinProject_EconomicValue_final.pdf.
12. Kramer, O’Sullivan and Burrell, A Fight For the Fu-ture: Education, Job Training, and the Fiscal Showdown (Washington, DC: Young Invincibles and the Nation-al Priorities Project, 2012), 7, accessed November 20, 2013, http://younginvincibles.org/wp-content/uploads/2012/11/11-14-12-KS-1.pdf.
13. Dan Ryan, Youth Opportunity Grant Initiative: Impact and Synthesis Report (Washington, DC: United States De-partment of Labor, 2007), 18-88, accessed December 9, 2013, http://wdr.doleta.gov/research/FullText_Docu-ments/YO%20Impact%20and%20Synthesis%20Re-port.pdf.
14. Linda Harris, Learning from the Youth Opportunity Expe-rience: Building Delivery Capacity in Distressed Communi-ties (Washington, DC: Center for Law and Social Policy, 2006), 3, accessed November 20, 2013, http://www.clasp.org/admin/site/publications_archive/files/0193.pdf.
15. Belfield, Levin and Rosen, The Economic Value of Oppor-tunity Youth (Washington, DC: Civic Enterprises, 2012), 2, accessed November 20, 2013, http://files.eric.ed.gov/fulltext/ED528650.pdf.
16. “Fact Sheet on Registered Apprenticeships,” US Depart-ment of Labor, accessed November 22, 2013, http://www.doleta.gov/oa/pdf/fsback.pdf.
17. California Division of Apprenticeship Standards, Ap-prenticeship: Employer Benefits, Roles and Responsibilities (San Francisco: Department of Industrial Relations), ac-cessed November 20, 2013, http://www.dir.ca.gov/das/ApprenticeshipEmployerBenefitsRolesandResponsi-bilities.pdf.
18. Lerman, Eyster and Chambers, The Benefits and Chal-lenges of Registered Apprenticeships: The Sponsors’ Per-
End Notes
The Hidden Cost of Young Adult Unemployment
together, invincible 15
spective (Washington, DC: The Urban Institute Center on Labor, Human Services, and Population, 2009), 16, accessed November 20, 2013, http://www.mass.gov/lwd/docs/dat/benefitschallengesregisteredapprentice-ship-508.pdf.
19. “Co-operative Education,” Drexel University, accessed November 20, 2013, http://www.drexel.edu/difference/co-op/.
20. “State of Young America: The Poll,” DEMOS and Young Invincibles, accessed December 26, 2013, http://www.demos.org/state-of-young-america.
21. For research that supports a similar methodology see: Sum, Khatiwada and Palma, Vanishing Work Among U.S. Teens, 2000-10: What a Difference a Decade Makes! Four Million Missing Workers in June 2010 (Boston: Center for Labor Market Studies at Northeastern Univer-sity, 2010), accessed November 20, 2013, http://www.northeastern.edu/clms/wp-content/uploads/Vanish-ing_Work_Among_US_Teens.pdf.
22. Raphael and Winter-Ebmer, “Identifying The Effect of Unemployment on Crime,” Journal of Law and Economics 44, no. 1 (2001): 259-283.
IN THIS TOGETHER
16
Appendix A: Methods
To estimate the cost of persistent young adult unemployment, Young Invincibles examined pooled 2010-2012 data gathered from the March Annual and Social Economic Supplement of the Current Population Survey (CPS) -- a sur-vey of households conducted by the US Census Bureau. The over 52,000 18- to 24-year-old respondents and over 78,000 25- to 34-year-old respondents were then analyzed across five dependent variables: federal tax liability after credits, state tax liability after credits, FICA tax liability, “welfare” program benefits received, and unemployment benefits received.
It is easy to perceive employment as binary – one is either employed or unemployed. How-ever, over the course of any given year, many young adults may be employed for only a few months, or for fewer than 40 hours a week. A person who was employed for only 20 weeks of the year for only 30 hours a week should not be considered to be employed to the same degree as someone who worked full time for the entire year. To account for this, Young Invincibles devel-oped a variable to capture employment status on a scale. We considered someone as fully em-ployed when they held a job for the entire year, reporting a full-time, 40 hour a week schedule. Should someone work more or less, our mea-sure of employment captures and accounts for that difference.
Using controls for potential differences in in-come related to gender, race, school enroll-ment status, and state of residency, we calcu-lated the average difference between young adults who were employed full-time for the en-tire year against young adults who were in the labor market but could not find a job. Then we
calculated the number of young adult jobs the country would need to recreate in order to re-duce the 18- to 24-year-old unemployment rate and the 25- to 34-year-old unemployment rate to peak employment rates in November 2007 – the month directly before the Great Recession struck. These unemployment rates for 18- to 24-year-olds and 25- to 34-year-olds are 9.63 percent and 6.56 percent, respectively. While still high, they represent the most recent young adult unemployment rates in a healthy economy. Using these values, we estimated the cumula-tive cost of spiking young adult unemployment during the recession.
After calculating the cumulative costs of unem-ployment, we took this analysis one step further. Employment rates do not capture the large num-ber of young adult jobs that disappeared when the Great Recession occurred. Millennials left the labor market in droves as jobs became scarce, even as their overall population increased. Mil-lions are neither working nor in school, which could lead to disastrous consequences for those individuals and for the country. These losses are often ignored because these young people are not considered within the labor force. Estimates of disconnected or opportunity youth vary wide-ly, so we decided to calculate the number of jobs that should have existed in a healthy economy had the Employment-Population ratio remained at the same level as it was directly before the recession in November 2007. Therefore, we capture the even higher costs that often are not considered when looking solely at the unem-ployment rate.21
Our methods are conservative for several rea-sons and therefore may understate the true cost of abnormally high young adult unemployment to society. First, we use November 2007 as our

The Hidden Cost of Young Adult Unemployment
together, invincible 17
baseline unemployment rate. We recognize that it is unrealistic to expect full young adult em-ployment, but even this rate leaves millions of young adults out in the cold. Young adults have had chronically high unemployment rates for some time, but in recent years these rates have only become worse. In the late ‘90s and early 2000s, the 18- to 24-year-old unemployment rate was consistently below 10%, getting below 8% in 2000 (we set 9.63% as our baseline). For 25- to 34-year-olds, the same time period was marked with unemployment rates below 4% (we set 6.56% as our baseline). These rates do not account for losses in the labor force over this same time period.
Secondly, we do not calculate the losses over time due to repressed wages. As previously noted, a Center for American Progress study finds that young adults who experience long-term un-employment face significantly repressed wages, which will only cost the federal government more tax revenue for years to come.
Thirdly, we do not estimate the loss to the econ-omy in consumer spending. Getting hundreds of thousands of young adults back to work means hundreds of thousands of consumers with mon-ey in their pockets.
Finally, we do not even begin to quantify the so-cial costs of enormous numbers of young adults without jobs. Health care costs associated with young adults without employer-based health in-surance may get passed on to the government or to Americans in the form of higher premiums. Furthermore, high unemployment is correlated with higher crime rates, resulting in a need for greater prison, court, and law-enforcement expenditures.22 These costs can be difficult to quantify, but impact all Americans even further.
IN THIS TOGETHER
18
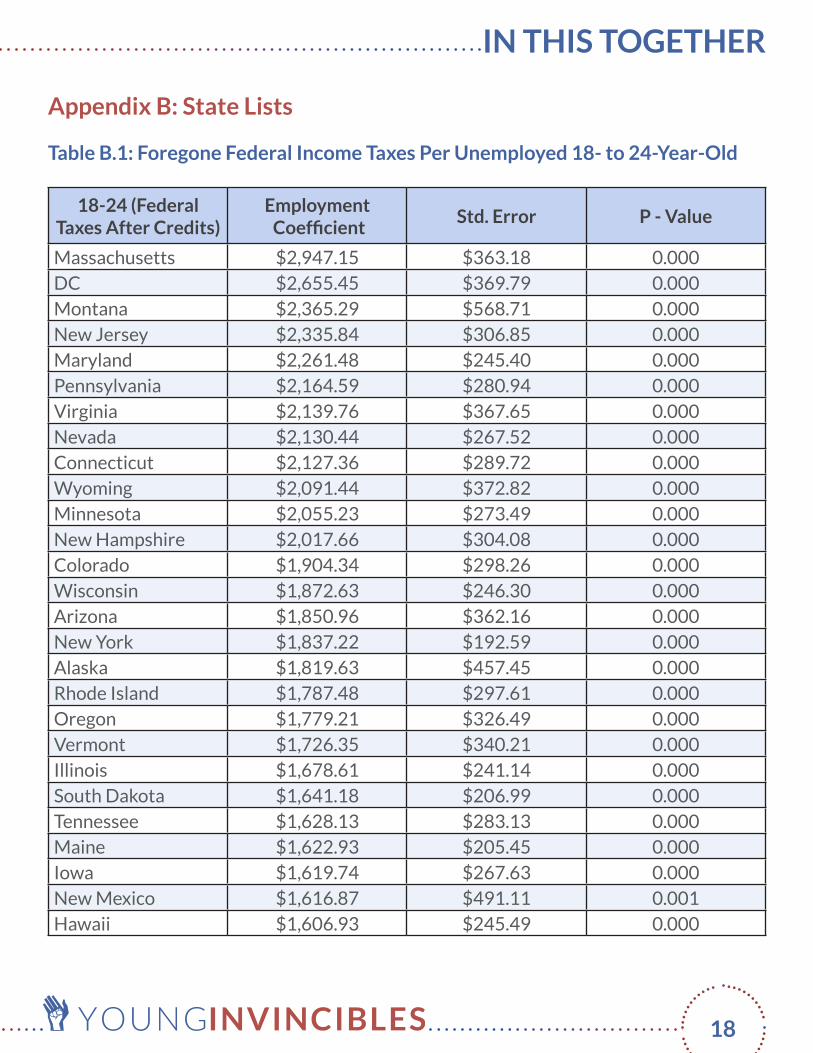
Appendix B: State Lists
Table B.1: Foregone Federal Income Taxes Per Unemployed 18- to 24-Year-Old
18-24 (Federal Taxes After Credits)
Employment Coefficient
Std. Error P - Value
Massachusetts $2,947.15 $363.18 0.000
DC $2,655.45 $369.79 0.000
Montana $2,365.29 $568.71 0.000
New Jersey $2,335.84 $306.85 0.000
Maryland $2,261.48 $245.40 0.000
Pennsylvania $2,164.59 $280.94 0.000
Virginia $2,139.76 $367.65 0.000
Nevada $2,130.44 $267.52 0.000
Connecticut $2,127.36 $289.72 0.000
Wyoming $2,091.44 $372.82 0.000
Minnesota $2,055.23 $273.49 0.000
New Hampshire $2,017.66 $304.08 0.000
Colorado $1,904.34 $298.26 0.000
Wisconsin $1,872.63 $246.30 0.000
Arizona $1,850.96 $362.16 0.000
New York $1,837.22 $192.59 0.000
Alaska $1,819.63 $457.45 0.000
Rhode Island $1,787.48 $297.61 0.000
Oregon $1,779.21 $326.49 0.000
Vermont $1,726.35 $340.21 0.000
Illinois $1,678.61 $241.14 0.000
South Dakota $1,641.18 $206.99 0.000
Tennessee $1,628.13 $283.13 0.000
Maine $1,622.93 $205.45 0.000
Iowa $1,619.74 $267.63 0.000
New Mexico $1,616.87 $491.11 0.001
Hawaii $1,606.93 $245.49 0.000

The Hidden Cost of Young Adult Unemployment
together, invincible 19
National Average $1,599.32 $43.96 0.000Washington $1,597.89 $318.49 0.000
California $1,596.38 $143.87 0.000
Delaware $1,586.47 $253.14 0.000
Kansas $1,554.90 $300.85 0.000
Texas $1,539.13 $159.56 0.000
Mississippi $1,518.36 $506.60 0.003
Alabama $1,510.91 $503.51 0.003
North Dakota $1,463.08 $326.58 0.000
Georgia $1,451.67 $278.38 0.000
Nebraska $1,404.10 $264.14 0.000
West Virginia $1,386.66 $666.66 0.039
Kentucky $1,326.65 $291.25 0.000
Ohio $1,204.07 $185.87 0.000
Florida $1,187.58 $175.26 0.000
Utah $1,159.70 $307.95 0.000
Michigan $1,128.16 $187.16 0.000
Louisiana $1,090.02 $289.45 0.000
Missouri $1,003.23 $233.80 0.000
Indiana $986.45 $339.73 0.004
Arkansas $949.00 $298.49 0.002
South Carolina $925.34 $251.04 0.000
North Carolina $914.19 $198.35 0.000
Idaho $753.35 $261.14 0.004
Oklahoma $516.58 $264.02 0.051

IN THIS TOGETHER
20
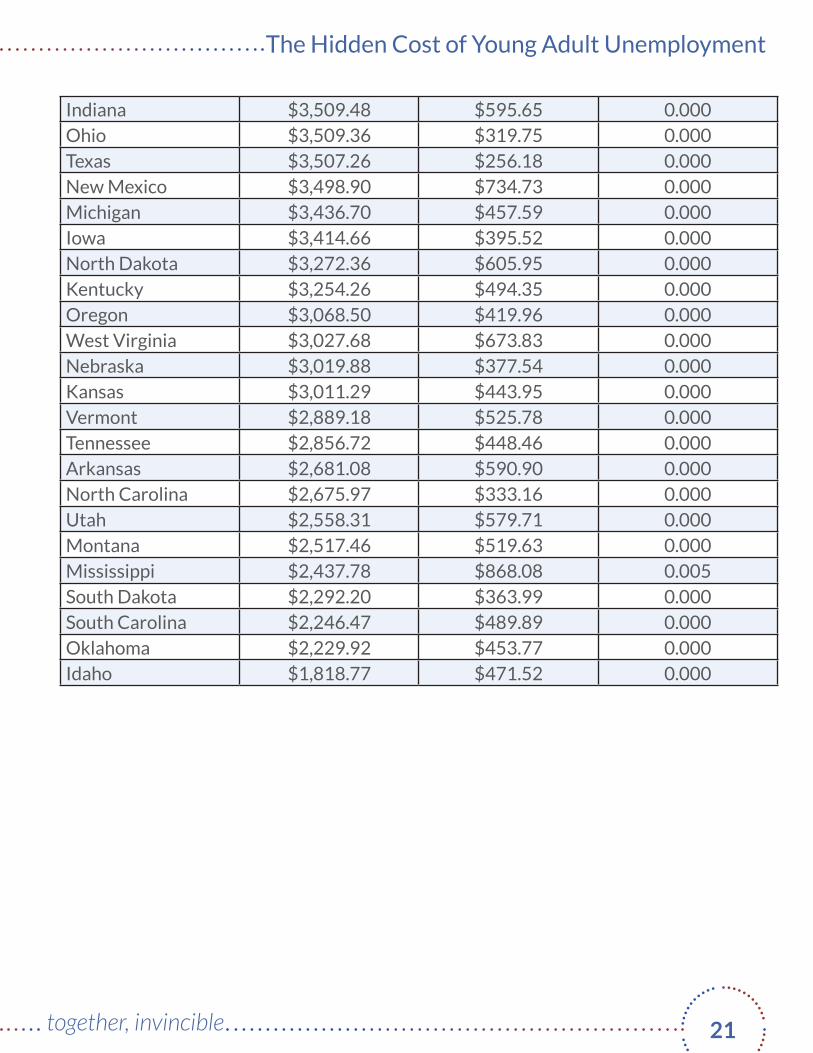
Table B.2: Foregone Federal Income Taxes Per Unemployed 25- to 34-Year-Old
25-34 (Federal Taxes After Credits)
Employment Coefficient
Std. Error P - Value
DC $8,530.27 $806.58 0.000
Massachusetts $7,417.26 $1,054.73 0.000
Maryland $6,804.55 $687.72 0.000
New York $6,656.34 $505.47 0.000
Connecticut $6,405.76 $730.12 0.000
New Jersey $5,223.09 $548.44 0.000
New Hampshire $5,200.32 $503.53 0.000
California $5,169.95 $282.05 0.000
Virginia $5,054.48 $668.60 0.000
Alabama $4,704.98 $1,236.01 0.000
Arizona $4,551.13 $480.79 0.000
Pennsylvania $4,349.67 $482.14 0.000
Georgia $4,265.46 $488.91 0.000
Illinois $4,234.30 $503.44 0.000
National Average $4,225.35 $86.97 0.000Colorado $4,135.50 $528.48 0.000
Rhode Island $4,129.77 $441.81 0.000
Maine $4,108.20 $506.86 0.000
Delaware $4,082.33 $503.53 0.000
Wisconsin $4,033.48 $496.95 0.000
Nevada $4,017.90 $496.75 0.000
Minnesota $3,919.39 $394.17 0.000
Alaska $3,769.04 $528.64 0.000
Florida $3,699.35 $311.13 0.000
Hawaii $3,692.82 $646.84 0.000
Wyoming $3,681.83 $550.50 0.000
Louisiana $3,655.80 $733.16 0.000
Washington $3,584.37 $621.32 0.000
Missouri $3,555.54 $673.18 0.000
The Hidden Cost of Young Adult Unemployment
together, invincible 21
Indiana $3,509.48 $595.65 0.000
Ohio $3,509.36 $319.75 0.000
Texas $3,507.26 $256.18 0.000
New Mexico $3,498.90 $734.73 0.000
Michigan $3,436.70 $457.59 0.000
Iowa $3,414.66 $395.52 0.000
North Dakota $3,272.36 $605.95 0.000
Kentucky $3,254.26 $494.35 0.000
Oregon $3,068.50 $419.96 0.000
West Virginia $3,027.68 $673.83 0.000
Nebraska $3,019.88 $377.54 0.000
Kansas $3,011.29 $443.95 0.000
Vermont $2,889.18 $525.78 0.000
Tennessee $2,856.72 $448.46 0.000
Arkansas $2,681.08 $590.90 0.000
North Carolina $2,675.97 $333.16 0.000
Utah $2,558.31 $579.71 0.000
Montana $2,517.46 $519.63 0.000
Mississippi $2,437.78 $868.08 0.005
South Dakota $2,292.20 $363.99 0.000
South Carolina $2,246.47 $489.89 0.000
Oklahoma $2,229.92 $453.77 0.000
Idaho $1,818.77 $471.52 0.000
IN THIS TOGETHER
22
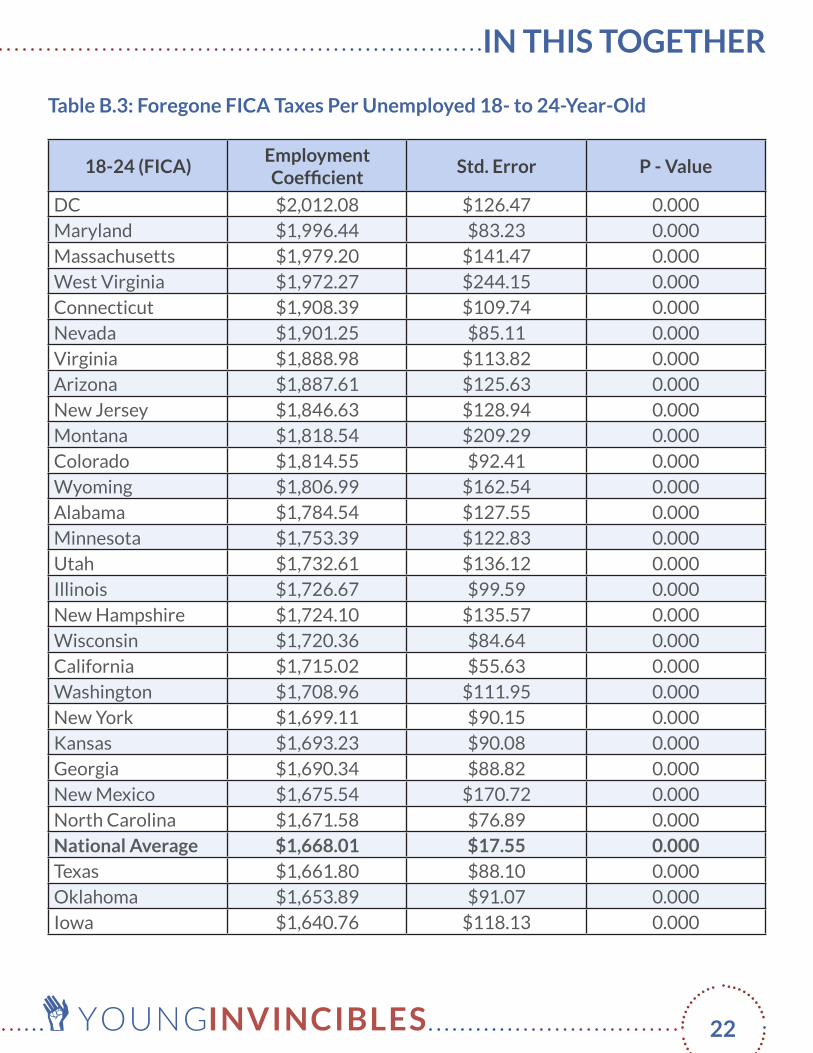
Table B.3: Foregone FICA Taxes Per Unemployed 18- to 24-Year-Old
18-24 (FICA)Employment Coefficient
Std. Error P - Value
DC $2,012.08 $126.47 0.000
Maryland $1,996.44 $83.23 0.000
Massachusetts $1,979.20 $141.47 0.000
West Virginia $1,972.27 $244.15 0.000
Connecticut $1,908.39 $109.74 0.000
Nevada $1,901.25 $85.11 0.000
Virginia $1,888.98 $113.82 0.000
Arizona $1,887.61 $125.63 0.000
New Jersey $1,846.63 $128.94 0.000
Montana $1,818.54 $209.29 0.000
Colorado $1,814.55 $92.41 0.000
Wyoming $1,806.99 $162.54 0.000
Alabama $1,784.54 $127.55 0.000
Minnesota $1,753.39 $122.83 0.000
Utah $1,732.61 $136.12 0.000
Illinois $1,726.67 $99.59 0.000
New Hampshire $1,724.10 $135.57 0.000
Wisconsin $1,720.36 $84.64 0.000
California $1,715.02 $55.63 0.000
Washington $1,708.96 $111.95 0.000
New York $1,699.11 $90.15 0.000
Kansas $1,693.23 $90.08 0.000
Georgia $1,690.34 $88.82 0.000
New Mexico $1,675.54 $170.72 0.000
North Carolina $1,671.58 $76.89 0.000
National Average $1,668.01 $17.55 0.000Texas $1,661.80 $88.10 0.000
Oklahoma $1,653.89 $91.07 0.000
Iowa $1,640.76 $118.13 0.000

The Hidden Cost of Young Adult Unemployment
together, invincible 23
Indiana $1,640.17 $115.84 0.000
Pennsylvania $1,638.87 $88.10 0.000
Rhode Island $1,635.28 $95.05 0.000
Kentucky $1,634.83 $121.62 0.000
Mississippi $1,633.29 $155.18 0.000
Oregon $1,630.17 $99.20 0.000
Arkansas $1,595.52 $114.46 0.000
Delaware $1,586.47 $253.14 0.000
Hawaii $1,582.42 $79.82 0.000
Idaho $1,558.63 $147.97 0.000
Louisiana $1,528.54 $149.89 0.000
Alaska $1,520.29 $181.85 0.000
Maine $1,515.83 $99.38 0.000
Florida $1,504.42 $58.66 0.000
South Dakota $1,498.39 $99.57 0.000
Tennessee $1,476.62 $127.98 0.000
Vermont $1,468.96 $101.86 0.000
Michigan $1,450.66 $78.08 0.000
Nebraska $1,441.79 $130.06 0.000
Missouri $1,412.31 $80.70 0.000
North Dakota $1,404.49 $165.72 0.000
South Carolina $1,336.14 $101.19 0.000
Ohio $1,330.31 $91.70 0.000

IN THIS TOGETHER
24
Table B.4: Foregone FICA Taxes Per Unemployed 25- to 34-Year-Old
25-34 (FICA)Employment Coefficient
Std. Error P - Value
Massachusetts $3,273.50 $177.39 0.000
DC $3,221.37 $156.88 0.000
Connecticut $3,180.40 $159.52 0.000
Maryland $3,146.36 $123.98 0.000
California $3,089.99 $59.88 0.000
New Jersey $3,052.75 $119.70 0.000
New Hampshire $3,043.64 $119.44 0.000
New York $2,963.57 $100.89 0.000
Rhode Island $2,950.74 $154.07 0.000
Virginia $2,868.21 $144.57 0.000
Nevada $2,844.33 $118.04 0.000
Michigan $2,837.52 $98.89 0.000
Pennsylvania $2,799.38 $105.35 0.000
Arizona $2,776.73 $140.60 0.000
Wisconsin $2,733.05 $124.34 0.000
Illinois $2,731.23 $108.45 0.000
National Average $2,722.87 $19.56 0.000Wyoming $2,721.03 $122.06 0.000
Washington $2,714.93 $143.33 0.000
Florida $2,696.09 $74.00 0.000
West Virginia $2,687.59 $168.56 0.000
Colorado $2,680.36 $130.44 0.000
Minnesota $2,676.90 $111.22 0.000
Indiana $2,662.98 $164.20 0.000
Alabama $2,616.03 $133.76 0.000
Ohio $2,606.20 $98.09 0.000
Georgia $2,581.98 $97.56 0.000
Arkansas $2,569.91 $144.12 0.000
Kentucky $2,565.01 $128.20 0.000

The Hidden Cost of Young Adult Unemployment
together, invincible 25
Delaware $2,547.37 $131.57 0.000
Texas $2,535.21 $67.03 0.000
Alaska $2,519.04 $170.12 0.000
New Mexico $2,515.40 $184.02 0.000
Oregon $2,512.67 $142.60 0.000
Iowa $2,473.36 $117.28 0.000
Tennessee $2,471.42 $102.60 0.000
Maine $2,460.74 $161.44 0.000
Utah $2,427.89 $133.23 0.000
Missouri $2,426.84 $137.55 0.000
Nebraska $2,399.67 $158.81 0.000
North Carolina $2,351.30 $109.33 0.000
Vermont $2,345.79 $184.49 0.000
Idaho $2,330.01 $124.63 0.000
Kansas $2,328.88 $151.07 0.000
Hawaii $2,306.88 $137.66 0.000
Louisiana $2,224.10 $221.63 0.000
North Dakota $2,218.49 $182.25 0.000
Oklahoma $2,199.50 $133.54 0.000
South Dakota $2,137.91 $141.42 0.000
South Carolina $2,088.07 $161.63 0.000
Mississippi $2,081.85 $186.19 0.000
Montana $2,029.72 $285.75 0.000

IN THIS TOGETHER
26
Table B.5: Foregone State Income Taxes Per Unemployed 18- to 24-Year-Old
18-24 (State Taxes After Credits)
Employment Coefficient
Std. Error P - Value
Delaware $1,782.10 $97.36 0.000
Oregon $1,413.37 $118.63 0.000
Massachusetts $1,252.88 $104.32 0.000
DC $1,137.81 $128.98 0.000
New York $1,124.55 $95.88 0.000
Virginia $1,069.75 $93.99 0.000
Hawaii $1,044.15 $86.19 0.000
Kentucky $999.65 $84.29 0.000
Montana $979.27 $166.65 0.000
Wisconsin $953.49 $90.65 0.000
Alabama $888.71 $86.77 0.000
Minnesota $850.77 $88.16 0.000
Indiana $847.27 $100.44 0.000
Georgia $837.34 $72.61 0.000
North Carolina $827.96 $78.47 0.000
Illinois $825.83 $52.71 0.000
Iowa $817.03 $81.20 0.000
Maine $757.26 $79.58 0.000
Kansas $754.82 $92.42 0.000
Colorado $752.57 $71.59 0.000
Maryland $744.08 $63.48 0.000
West Virginia $743.28 $180.12 0.000
Pennsylvania $733.55 $43.39 0.000
Michigan $703.24 $49.32 0.000
Connecticut $671.90 $92.88 0.000
Rhode Island $633.09 $79.46 0.000
Mississippi $604.87 $107.45 0.000
Utah $571.68 $108.76 0.000
National Average $566.62 $12.05 0.000

The Hidden Cost of Young Adult Unemployment
together, invincible 27
Nebraska $552.63 $72.17 0.000
Vermont $550.42 $86.31 0.000
New Jersey $513.97 $62.40 0.000
Idaho $480.25 $107.92 0.000
Oklahoma $469.12 $85.36 0.000
California $451.11 $44.46 0.000
Missouri $445.66 $62.85 0.000
Arizona $430.98 $44.16 0.000
South Carolina $409.80 $61.74 0.000
Ohio $364.38 $39.49 0.000
Louisiana $361.50 $44.15 0.000
North Dakota $217.59 $43.77 0.000
Arkansas $140.26 $63.22 0.027
Alaska $0.00 $0.00 0.000
Florida $0.00 $0.00 0.000
Nevada $0.00 $0.00 0.000
South Dakota $0.00 $0.00 0.000
Texas $0.00 $0.00 0.000
Washington $0.00 $0.00 0.000
Wyoming $0.00 $0.00 0.000
New Hampshire* N/A 0.143
New Mexico* N/A 0.463
Tennessee* N/A 0.810
* NOTE: Estimates unavailable due to lack of statistical significance.
IN THIS TOGETHER
28
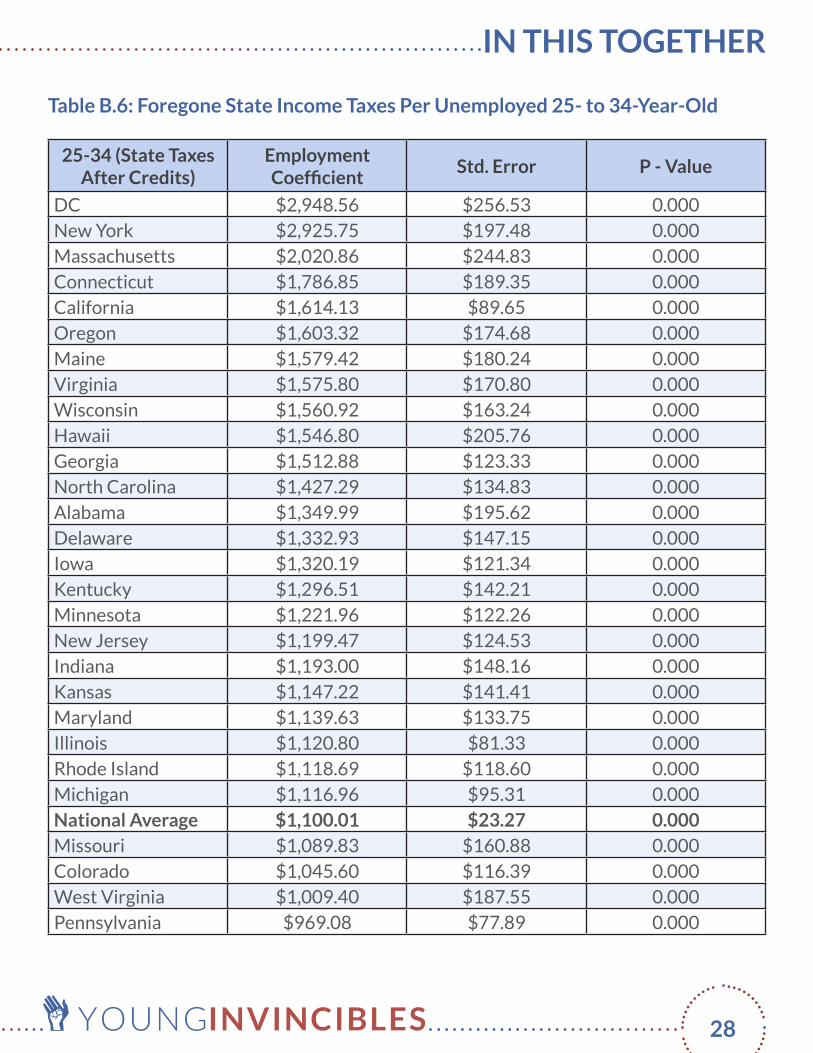
Table B.6: Foregone State Income Taxes Per Unemployed 25- to 34-Year-Old
25-34 (State Taxes After Credits)
Employment Coefficient
Std. Error P - Value
DC $2,948.56 $256.53 0.000
New York $2,925.75 $197.48 0.000
Massachusetts $2,020.86 $244.83 0.000
Connecticut $1,786.85 $189.35 0.000
California $1,614.13 $89.65 0.000
Oregon $1,603.32 $174.68 0.000
Maine $1,579.42 $180.24 0.000
Virginia $1,575.80 $170.80 0.000
Wisconsin $1,560.92 $163.24 0.000
Hawaii $1,546.80 $205.76 0.000
Georgia $1,512.88 $123.33 0.000
North Carolina $1,427.29 $134.83 0.000
Alabama $1,349.99 $195.62 0.000
Delaware $1,332.93 $147.15 0.000
Iowa $1,320.19 $121.34 0.000
Kentucky $1,296.51 $142.21 0.000
Minnesota $1,221.96 $122.26 0.000
New Jersey $1,199.47 $124.53 0.000
Indiana $1,193.00 $148.16 0.000
Kansas $1,147.22 $141.41 0.000
Maryland $1,139.63 $133.75 0.000
Illinois $1,120.80 $81.33 0.000
Rhode Island $1,118.69 $118.60 0.000
Michigan $1,116.96 $95.31 0.000
National Average $1,100.01 $23.27 0.000Missouri $1,089.83 $160.88 0.000
Colorado $1,045.60 $116.39 0.000
West Virginia $1,009.40 $187.55 0.000
Pennsylvania $969.08 $77.89 0.000

The Hidden Cost of Young Adult Unemployment
together, invincible 29
South Carolina $960.95 $136.27 0.000
Montana $924.57 $167.43 0.000
Ohio $911.61 $79.69 0.000
Nebraska $889.84 $109.10 0.000
Mississippi $875.38 $176.70 0.000
Idaho $817.86 $163.31 0.000
Vermont $793.85 $145.29 0.000
Utah $775.63 $171.68 0.000
Arizona $663.01 $59.72 0.000
Oklahoma $570.14 $94.04 0.000
Arkansas $490.47 $136.64 0.000
Louisiana $485.21 $76.58 0.000
North Dakota $453.69 $72.37 0.000
New Mexico $312.23 $86.05 0.000
Alaska $0.00 $0.00 0.000
Florida $0.00 $0.00 0.000
Nevada $0.00 $0.00 0.000
South Dakota $0.00 $0.00 0.000
Texas $0.00 $0.00 0.000
Washington $0.00 $0.00 0.000
Wyoming $0.00 $0.00 0.000
New Hampshire* N/A 0.158
Tennessee* N/A 0.258
* NOTE: Estimates unavailable due to lack of statistical significance.

IN THIS TOGETHER
30
Table B.7: Welfare Savings Per Employed 18- to 24-Year-Old
18-24 (Welfare)Employment Coefficient
Std. Error P - Value
New Hampshire -$24.37 $13.86 0.079
Pennsylvania -$42.47 $21.79 0.052
National Average -$43.94 $4.93 0.000Washington -$44.80 $20.71 0.031
Michigan -$57.14 $29.69 0.055
New Jersey -$59.06 $34.61 0.088
Oregon -$70.35 $40.48 0.083
Connecticut -$74.81 $43.36 0.085
California -$75.82 $18.86 0.000
Missouri -$78.36 $36.46 0.032
New York -$85.15 $40.99 0.038
Indiana -$93.94 $35.24 0.008
South Dakota -$94.79 $44.62 0.034
Wisconsin -$95.32 $56.89 0.094
Minnesota -$96.94 $34.45 0.005
Maine -$99.73 $37.56 0.008
Nebraska -$103.87 $56.81 0.068
Ohio -$104.12 $36.51 0.004
Kansas -$138.26 $56.18 0.014
Arkansas* N/A 0.135
Delaware* N/A 0.145
Virginia* N/A 0.146
New Mexico* N/A 0.148
Maryland* N/A 0.162
Illinois* N/A 0.173
Idaho* N/A 0.177
Florida* N/A 0.182
Arizona* N/A 0.183
Vermont* N/A 0.189

The Hidden Cost of Young Adult Unemployment
together, invincible 31
North Carolina* N/A 0.190
Tennessee* N/A 0.226
Oklahoma* N/A 0.232
Kentucky* N/A 0.242
Nevada* N/A 0.243
South Carolina* N/A 0.261
Massachusetts* N/A 0.263
West Virginia* N/A 0.268
DC* N/A 0.297
Utah* N/A 0.318
Georgia* N/A 0.412
North Dakota* N/A 0.464
Alabama* N/A 0.489
Rhode Island* N/A 0.571
Louisiana* N/A 0.609
Texas* N/A 0.646
Montana* N/A 0.701
Iowa* N/A 0.731
Colorado* N/A 0.801
Alaska* N/A 0.839
Hawaii* N/A 0.885
Mississippi* N/A 0.912
Wyoming* N/A 0.915
* NOTE: Estimates unavailable due to lack of statistical significance.

IN THIS TOGETHER
32
Table B.8: Welfare Savings Per Employed 25- to 34-Year-Old
25-34 (Welfare)Employment Coefficient
Std. Error P - Value
Texas -$15.53 $6.93 0.025
Illinois -$30.83 $11.68 0.008
Nebraska -$41.71 $24.12 0.084
Nevada -$43.08 $20.01 0.032
Georgia -$44.30 $20.21 0.029
Colorado -$45.14 $18.43 0.014
Alabama -$45.78 $24.06 0.058
Tennessee -$50.94 $26.92 0.059
North Dakota -$53.96 $25.92 0.038
Oklahoma -$54.64 $31.80 0.086
West Virginia -$58.47 $31.70 0.066
South Dakota -$66.78 $30.59 0.029
Kentucky -$74.39 $30.22 0.014
Maryland -$76.10 $33.50 0.023
Connecticut -$84.26 $36.04 0.020
New Hampshire -$84.70 $39.04 0.030
Kansas -$86.75 $35.69 0.015
Minnesota -$87.25 $27.96 0.002
Indiana -$91.44 $43.67 0.037
National Average -$91.53 $5.96 0.000Missouri -$92.42 $42.91 0.031
Wisconsin -$93.14 $49.33 0.059
Pennsylvania -$98.75 $30.85 0.001
Michigan -$100.39 $37.93 0.008
New York -$108.86 $25.92 0.000
New Jersey -$115.42 $49.26 0.019
Delaware -$118.72 $61.81 0.055
Virginia -$120.45 $46.78 0.010
Massachusetts -$123.13 $65.71 0.061

The Hidden Cost of Young Adult Unemployment
together, invincible 33
Rhode Island -$150.45 $55.57 0.007
Washington -$160.41 $48.98 0.001
Vermont -$189.90 $83.82 0.024
California -$233.97 $28.92 0.000
Ohio -$242.78 $52.84 0.000
DC -$294.71 $67.60 0.000
Iowa* N/A 0.101
Oregon* N/A 0.101
Hawaii* N/A 0.105
Montana* N/A 0.105
New Mexico* N/A 0.111
Arkansas* N/A 0.127
Idaho* N/A 0.135
Wyoming* N/A 0.204
Alaska* N/A 0.240
Utah* N/A 0.243
Arizona* N/A 0.249
Maine* N/A 0.265
North Carolina* N/A 0.267
Florida* N/A 0.343
Louisiana* N/A 0.609
Mississippi* N/A 0.858
South Carolina* N/A 0.928
* NOTE: Estimates unavailable due to lack of statistical significance.

IN THIS TOGETHER
34
Table B.9: Unemployment Insurance Savings Per Employed 18- to 24-Year-Old
18-24 (Unemployment
Benefits)
Employment Coefficient
Std. Error P - Value
Texas -$115.41 $43.01 0.007
Florida -$122.35 $67.81 0.071
Wisconsin -$170.23 $100.19 0.090
North Carolina -$219.77 $74.10 0.003
New York -$222.34 $82.40 0.007
National Average -$235.98 $20.31 0.000Pennsylvania -$236.88 $130.11 0.069
Massachusetts -$256.96 $116.65 0.028
Maine -$267.87 $94.20 0.005
New Jersey -$270.90 $144.99 0.062
Michigan -$295.60 $131.56 0.025
Arizona -$302.96 $151.43 0.046
Iowa -$306.98 $170.31 0.072
Illinois -$307.64 $125.84 0.015
South Carolina -$311.64 $156.30 0.047
New Mexico -$317.33 $148.24 0.033
Ohio -$323.48 $126.98 0.011
Minnesota -$336.56 $119.75 0.005
California -$349.77 $62.63 0.000
Georgia -$379.37 $152.52 0.013
Indiana -$399.49 $193.27 0.039
Connecticut -$469.67 $177.86 0.008
Nevada -$471.76 $267.94 0.079
Oregon -$582.21 $246.44 0.019
Hawaii -$703.55 $252.88 0.006
Nebraska* N/A 0.107
Wyoming* N/A 0.108
Kansas* N/A 0.113

The Hidden Cost of Young Adult Unemployment
together, invincible 35
Missouri* N/A 0.132
Virginia* N/A 0.133
Alabama* N/A 0.134
Idaho* N/A 0.144
Delaware* N/A 0.150
Washington* N/A 0.155
Tennessee* N/A 0.171
South Dakota* N/A 0.244
West Virginia* N/A 0.248
Mississippi* N/A 0.276
New Hampshire* N/A 0.289
North Dakota* N/A 0.429
Vermont* N/A 0.470
Colorado* N/A 0.557
Alaska* N/A 0.597
Maryland* N/A 0.621
Rhode Island* N/A 0.682
DC* N/A 0.710
Louisiana* N/A 0.728
Utah* N/A 0.807
Oklahoma* N/A 0.826
Montana* N/A 0.844
Kentucky* N/A 0.860
Arkansas* N/A 0.905
* NOTE: Estimates unavailable due to lack of statistical significance.

IN THIS TOGETHER
36
Table B.10: Welfare Savings Per Employed 25- to 34-Year-Old
25-34 (Unemployment
Benefits)
Employment Coefficient
Std. Error P - Value
Nevada -$2,865.03 $439.55 0.000
Pennsylvania -$2,668.40 $337.05 0.000
Michigan -$2,498.26 $317.21 0.000
Oregon -$2,448.50 $391.50 0.000
Delaware -$2,441.04 $455.49 0.000
New Jersey -$2,384.78 $381.14 0.000
Rhode Island -$2,380.25 $422.79 0.000
Indiana -$2,319.24 $388.26 0.000
Washington -$2,137.80 $400.48 0.000
Maine -$2,124.85 $411.00 0.000
South Carolina -$2,096.43 $358.98 0.000
California -$2,085.23 $155.49 0.000
Kansas -$2,063.63 $466.64 0.000
Minnesota -$2,019.93 $315.87 0.000
North Carolina -$1,994.42 $305.97 0.000
Illinois -$1,982.60 $243.25 0.000
Wisconsin -$1,958.23 $330.07 0.000
Hawaii -$1,930.84 $358.27 0.000
New York -$1,899.29 $243.65 0.000
West Virginia -$1,843.06 $523.52 0.000
Arkansas -$1,834.76 $459.71 0.000
Montana -$1,798.06 $519.34 0.001
Arizona -$1,757.57 $400.01 0.000
National Average -$1,736.14 $48.43 0.000Iowa -$1,674.13 $302.54 0.000
Ohio -$1,650.99 $270.88 0.000
Idaho -$1,621.45 $316.77 0.000
Connecticut -$1,593.73 $313.39 0.000

The Hidden Cost of Young Adult Unemployment
together, invincible 37
Vermont -$1,502.33 $340.75 0.000
Colorado -$1,469.99 $260.11 0.000
Alabama -$1,456.57 $355.96 0.000
Kentucky -$1,420.84 $303.33 0.000
Massachusetts -$1,418.81 $299.12 0.000
Tennessee -$1,400.45 $303.38 0.000
Florida -$1,359.46 $200.18 0.000
Texas -$1,301.57 $148.75 0.000
Missouri -$1,280.47 $314.18 0.000
New Mexico -$1,211.86 $407.97 0.003
Georgia -$1,208.12 $215.45 0.000
Wyoming -$1,114.56 $266.56 0.000
New Hampshire -$1,062.46 $277.22 0.000
Alaska -$1,019.33 $200.98 0.000
Virginia -$1,017.66 $236.70 0.000
Utah -$906.00 $171.13 0.000
Maryland -$878.73 $188.08 0.000
Oklahoma -$844.62 $253.59 0.001
Nebraska -$834.17 $194.73 0.000
Louisiana -$789.49 $248.14 0.002
Mississippi -$650.39 $211.29 0.002
DC -$523.08 $154.64 0.001
North Dakota -$521.68 $169.67 0.002
South Dakota -$397.47 $118.38 0.001

IN THIS TOGETHER
38
Table B.11: State Share of Young Adult Unemployment’s Cost to the Federal Gov-ernment
18-34 Federal Cost California $1,561,329,964.10
New Jersey $514,279,570.08
North Carolina $441,925,441.20
Michigan $439,647,897.72
Pennsylvania $435,370,434.95
Georgia $407,202,282.65
Illinois $336,441,242.14
Florida $295,988,845.02
Massachusetts $273,397,226.60
Alabama $268,929,211.35
Nevada $267,993,764.83
Tennessee $266,981,626.14
Texas $251,076,842.21
Indiana $249,069,726.59
New York $227,487,978.21
Kentucky $184,062,510.82
Maryland $177,988,664.23
Connecticut $171,594,915.61
Mississippi $125,276,682.72
Colorado $116,277,645.33
Arizona $100,283,016.09
Arkansas $99,948,140.17
Ohio $97,200,362.57
Washington $94,453,209.05
Oregon $90,405,582.89
South Carolina $84,486,797.09
Missouri $77,344,147.31
Wisconsin $76,916,117.31
Rhode Island $63,101,584.97

The Hidden Cost of Young Adult Unemployment
together, invincible 39
Oklahoma $60,371,175.89
Maine $49,724,233.16
West Virginia $49,116,413.10
Kansas $45,233,317.71
Louisiana $38,634,022.06
Idaho $38,018,149.11
New Mexico $34,304,546.63
Virginia $22,570,857.30
New Hampshire $15,602,016.29
Montana $9,933,098.97
Delaware $8,728,136.93
Alaska $8,339,670.54
DC $3,784,067.97
Vermont $973,412.51
Minnesota $309,857.00
Wyoming -$206,352.27
Hawaii -$8,259,338.15
North Dakota -$18,200,018.10
South Dakota -$22,684,430.45
Nebraska -$55,925,556.14
Utah -$68,244,765.72
Iowa -$68,869,422.35

IN THIS TOGETHER
40
Table B.12: Cumulative Costs of Young Adult Unemployment to State Governments
18-34 State Cost California $219,205,299.15
North Carolina $114,582,622.44
Georgia $82,600,621.46
New York $67,459,178.45
Illinois $65,128,107.92
Michigan $64,921,175.37
New Jersey $57,823,980.99
Alabama $56,684,031.81
Pennsylvania $52,190,680.14
Kentucky $50,763,026.48
Massachusetts $46,808,483.64
Indiana $44,679,570.37
Oregon $27,946,969.01
Connecticut $26,984,756.81
Mississippi $23,086,624.91
Maryland $21,692,427.06
Wisconsin $19,749,449.17
Colorado $18,887,172.42
South Carolina $13,439,025.74
Missouri $11,565,494.44
Arizona $11,414,244.31
Ohio $11,258,583.13
Maine $9,598,012.02
Kansas $9,509,216.02
Virginia $9,054,048.44
Delaware $8,376,570.17
West Virginia $7,984,804.27
Rhode Island $7,722,984.93
Oklahoma $6,627,946.07

The Hidden Cost of Young Adult Unemployment
together, invincible 41
Arkansas $6,610,050.12
Idaho $5,894,355.83
Louisiana $4,978,723.76
Montana $3,407,719.40
DC $1,013,419.50
New Mexico $502,548.67
Vermont $44,076.05
Alaska $0.00
Florida $0.00
Nevada $0.00
New Hampshire $0.00
South Dakota $0.00
Tennessee $0.00
Texas $0.00
Washington $0.00
Wyoming $0.00
Minnesota -$675,993.87
North Dakota -$1,369,655.19
Hawaii -$1,723,798.60
Nebraska -$8,549,468.90
Utah -$9,263,160.67
Iowa -$12,678,081.47

IN THIS TOGETHER
42
Table B.13: Federal and State Tax Losses Per State Taxpayer
18-34 State Cost Per State Taxpayer
Kentucky $80.46
Alabama $80.38
North Carolina $80.20
Delaware $72.74
Georgia $71.62
Mississippi $71.27
Oregon $69.30
Connecticut $68.82
Maine $68.57
Rhode Island $68.39
Indiana $68.18
Massachusetts $67.80
Michigan $67.25
New Jersey $66.71
California $66.26
Illinois $63.99
West Virginia $63.44
Idaho $62.17
Pennsylvania $61.78
Colorado $61.20
Maryland $61.01
New York $60.53
Kansas $60.51
Wisconsin $60.46
Montana $60.45
South Carolina $59.80
Arkansas $58.70
Missouri $57.58
Oklahoma $57.45

The Hidden Cost of Young Adult Unemployment
together, invincible 43
Arizona $57.44
DC $56.42
Louisiana $55.79
Virginia $55.72
Ohio $55.37
New Mexico $53.87
Vermont $53.46
Alaska $53.32
Florida $53.32
Nevada $53.32
New Hampshire $53.32
South Dakota $53.32
Tennessee $53.32
Texas $53.32
Washington $53.32
Wyoming $53.32
Minnesota $53.32
Hawaii $53.32
North Dakota $53.32
Utah $53.32
Iowa $53.32
Nebraska $53.32

1411 K St. NW, Suite 400Washington, DC 20005
younginvincibles.org