in the vacuum ultraviolet dissertation - digital …/67531/metadc500339/m2/1/high... · in the...
TRANSCRIPT
Ao,/a
ELECTRIC DICHROISM SPECTROSCOPY
IN THE VACUUM ULTRAVIOLET
DISSERTATION
Presented to the Graduate Council of the
North Texas State University in Partial
Fulfillment of the Requirements
For the Degree of
DOCTOR OF PHILOSOPHY
By
Gary C. Causley, B. S.
Denton, Texas
May, 1978
Causley, Gary C., Electric Dichroism Spectroscopy
in the Vacuum Ultraviolet. Doctor of Philosophy
(Chemistry), May, 1978, 165 pp., 17 tables, 18 illus-
trations, bibliography, 68 titles.
When a molecule, which possess a permanent dipole
moment is exposed to an intense electric field, its
absorption spectrum may be altered. These alterations
are manifest as shifts in energy and as changes in band
shape and intensity. The electric dichroism of absorption
bands can be used to probe the excited state that is
formed when a molecule undergoes a transition. The
properties that may be investigated include transition
polarization, excited state dipole moment and mean
polarizability, and field-induced mixing of symmetrically-
equivalent excited states. The theoretical model and
experimental devices that have been developed to determine
these properties are presented and discussed.
Electrochromism and electric linear dichroism spectral
studies are discussed for electric field strengths up to
1.5 x 10⁵ volts/cm. Electrochromism is the differential
absorption by a molecule in a modulated electric field
using incident radiation of either random or fixed
polarization. Electric linear dichroism is a differential
absorption by a molecule in a strong static electric field
using linearly polarized radiation, which is modulated
between 00 and 900 with respect to the electric field.
Using these spectral techniques, several excited state
studies have been completed and are described in the
present work.
In order to test the equipment, the '*+wr, B2 +A1
transition in aniline was studied. This excited state has
been previously characterized using excited state Stark
field effects on resolved rotational structure. The
results of the medium resolution electrochromism spectra
of this band confirm the applicability, accuracy and limits
of the experimental methods. In the preliminary studies,
it was also found that the effects of the arc suppressor
gas, sulfur hexafluoride, were greater than originally
estimated. This fact led to an in-depth study of the
effects of this gas on electric dichroism spectra for
pressures of 3 to 12 atmospheres. The results of this
study are presented in detail.
With the validity and variations of the technique
tested, studies were undertaken to characterize the second
singlet excitation of several aldehydes and ketones. A
series of simple cyclic ketones is one of the groups of
compounds studied. The results of the work show the
transition in question to be polarized perpendicular to
the ground state dipole moment change in cyclobutanone,
cyclopentanone, cyclohexanone and cycloheptanQne. The
dipole moment changes upon excitation are found to be 1.44,
1.63, 4.30 and 4.92 Debye, respectively, away from the
oxygen end of the molecules. The size of the dipole
moment changes and mean polarizability changes support the
perpendicular B2 +A 1 , 3-1lnb-2 molecular Rydberg assignment
for the second singlet state of these molecules.
A second study involving formaldehyde, acetaldehyde
and acetone in the same excited state gave results for
formaldehyde and acetone similar to those of the cyclic
compounds, but surprising differences were obtained for
acetaldehyde. Acetaldehyde electric dichroism spectra,
on the other hand, seem to indicate that the transition
in question is polarized parallel to the dipole moment,
Al+A1 . This interpretation of the data was rejected.
Instead, it is believed that there is a large dipole moment
axial shift in the plane of the molecule, which might be
expected in a Rydberg state.
The data, taken in total, and its combination with
other existing evidence, adds credence to the assignment
of the second excited singlet of aldehydes and ketones to
be extravalent, accompanied by relatively large delocali-
zation of electronic charge, and polarized in-planiie and
perpendicularly to the C-0 axis.
TABLE OF CONTENTS
TABLES . .. . . . . . . . . . . . . . .
ILLUSTRATIONS . ... 0 .0. . . . .
I. INTRODUCTION . . . . . . . . . . . . .
II. PRELIMINARY ELECTROCHROMISM STUDIES . .
III. THE EFFECT OF SULFUR HEXAFLUORIDE ARCSUPPRESSOR GAS ON ELECTRIC FIELDSPECTROSCOPY . . . . . . . . . . . .
IV. ELECTRIC FIELD SPECTROSCOPY OF SOMESMALL CYCLIC KETONES.. . . . . . .
V. ELECTRIC FIELD SPECTROSCOPY OFFORMALDEHYDE, ACETALDEHYDE ANDACETONE
VI. SUMMARY AND DIRECTIONS FOR FUTURE STUDY
APPENDIX
1
. . 24
. . 43
. . 65
. . 101
. . 139
A. THE COEFFICIENTS OF ELECTROCHROMISM ANDELECTRIC LINEAR DICHROISM . . . . .
B. PRELIMINARY ELECTROCHROMISM STUDY . .
C. GROUP CHARACTER TABLES FOR C2v and Cs
BIBLIOGRAPHY................... ........ ..
146
155
160
161
iii
LIST OF
LIST OF
Chapter
Page
iv
vi
LIST OF TABLES
Table Page
I. Pressure Data for Aniline . . . . . . . . . . 55
II. Pressure Data for Cyclopentanone . . . . . . 56
III. Pressure Data for Acetone . . . . . . . . . . 57
IV. Linear Least Squares Fitting Results ofPressure Data . . . . . . . . . . . . . . 61
V. Compilation of Data for the Cyclic Ketones. . 69
VI. Experimental Coefficients forCyclobutanone . . . . . . . . . . . . . . 76
VII. Solution Sets for the Cyclic Ketones . . . . 77
VIII. Experimental Coefficients forCyclopentanone . . . . . . . . . . . . . . 83
IX. Experimental Coefficients forCyclohexanone . . . . . . . . . . . . . . 89
X. Experimental Coefficients forCycloheptanone . . . . . . . . . . . . . . 90
XI. Calculated Excited State Parameters forthe Cyclic Ketones . . . . . . . . . . . . 91
XII. Compilation of Data for Formaldehyde,Acetaldehyde and Acetone . . . . . . . . . 104
XIII. Experimental Coeffcients for Acetone . . . . 118
XIV. Solution Sets for Acetone and Acetaldehyde. . 119
XV. Experimental Coefficients forAcetaldehyde .......................... 129
iv
LIST OF TABLES, Continued
Table Page
XVI. Calculated Excited State Parameters forFormaldehyde, Acetaldehyde, andAcetone . . . . . . . . . . . . . . . . . . 136
XVII. Definition of Description of Symbols . .... 147
V
LIST OF ILLUSTRATIONS
Figure Page
1. Schematic of the Electric LinearDichroism Spectrometer . . . . . . . . . . 14
2. Schematic of the ElectrochromismSpectrometer . . . . . . . . . . . . . . . 16
3. Absorption and Electrochromism Spectra ofthe Second Singlet of Formaldehyde . . . . 34
4. Example of the Sulfur HexafluoridePressure Effect on the Second Singletof Cyclopentanone . . . . . . . . . . . . 54
5. Plot of Electrochromism CoefficientsVersus Sulfur Hexafluoride Pressure . . . 59
6. Absorption Spectra of the Second Singletof Cyclic Ketones . . . . . . . . . . . . 68
7. Absorption and Electrochromism Spectraof the Second Singlet of Cyclobutanone . . 75
8. Absorption and Electric Dichroism Spectraof the Second Singlet ofCyclopentanone . . . . . . . . . . . . . . 81
9. Absorption and Electric Dichroism Spectraof the Second Singlet of Cyclohexanone . . 86
10. Absorption and Electric Dichroism Spectraof the Second Singlet of Cycloheptanone. . 88
11. Plot of Electric Linear Dichroism SignalVersus Electric Field Strength Squared . . 107
12. Absorption and Random Polarized LightElectrochromism Spectra of the SecondSinglet of Acetone . .. . . .......... 112
vi
LIST OF ILLUSTRATIONS, Continued
Figure Page
13. Absorption and Zero Degree PolarizedLight Electrochromism Spectra of theSecond Singlet of Acetone . . . . . . . . . 114
14. Absorption and Electric Linear DichroismSpectra of the Second Singlet ofAcetone . . . . . . . . . . . . . . . . . . 116
15. Absorption and Random Polarized LightElectrochromism Spectra of the SecondSinglet of Acetaldehyde . . . . . . . . . . 124
16. Absorption and Zero Degree PolarizedLight Electrochromism Spectra of theSecond Singlet of Acetaldehyde . . . . . . 126
17. Absorption and Electric Linear DichroismSpectra of the Second Singlet ofAcetaldehyde. . ....... ....... 128
18. Vector Diagram of the Ground and ExcitedState Dipole Moments of Acetaldehyde . . . 133
vii
CHAPTER I
INTRODUCTION
The characterization of a particular state of a mole-
cule is a primary goal of any physical study of matter.
One of the most important and fundamental physical
measurements that can be made is that of the electric
dipole moment. The permanent electric moment of a molecule
is related to the total electronic distribution. The
knowledge of this distribution allows a great number of
chemical properties of a substance to be predicted. The
value of this moment for the ground states of gases is
most accurately determined by studying the Stark splitting
of rotational transitions (1). For molecules in solution,
the ground state dipole moment is obtained through measure-
ment of their permittivities (2). Measurement of the
electric dipole moment by these methods involves the use
of an external electric field which leads to the induction
of an electric moment within a molecule. The induced moment
is a result of the polarizability of the electrons within
this molecule. The polarizability is a fundamental, but
generally thought less important, physical property that
can give insight into the nature of compounds being
investigated.
1
2
When molecules in their ground states are exposed to
photons of sufficient energy to cause the absorption of
this radiation, an excited state is achieved in a finite
fraction of the total assemblage, Upon absorption and
excited state formation, there is a movement of charge
resulting from the interaction of the electrons and
photons. The determination of the new values of polariz-
ability and electric dipole moment, which results from
the movement of charge, is as important for the excited
state as it is for the ground state. Besides the
information concerning electron distribution in the
excited state, there is information concerning the exci-
tation process to be gained, so that it also might be
better understood.
Obtaining excited state information is, unfortunately,
not an easy task. The primary reason is that the lifetime
of the electronic excited state is quite short; therefore,
the total number of molecules in a particular excited state
is usually small. This necessitates the use of extra-
ordinary detection systems to observe a change in any
physical property as the result of perturbations by an
external electric field. One such experiment is the
excited state Stark field study, where the splitting and
shifting of highly resolved rotational lines of electronic
absorption bands are measured (3). Stark studies are
3
limited, however, to molecules in the gas phase or mole-
cular crystals which possess rotational spacings larger
than the electric perturbation energy. This is the case
primarily for diatomic and small polyatomic molecules.
For larger molecules, the experiments which have been
attempted include electrochromism (4), electric linear
dichroism (5) and solvatochromism (6). All three effects
are due to changes in the optical absorbance of a molecule
in an external electric field. Electrochromism may be
defined as the differential absorption of a molecule in a
strong modulated electric field using incident radiation
of either fixed or random polarization. Conversely,
electric linear dichroism is a differential absorption of
a molecule in a strong static electric field using
linearly polarized radiation which is modulated between 0*
and 900 with respect to the electric field. Finally,
solvatochromism is the change in the absorption of a mole-
cule as the result of different solvent environments.
Electrochromism and electric linear dichroism of
gaseous samples in the vacuum ultraviolet spectral region
are the principal subjects of this treatise. Both tech-
niques and their respective theoretical models have been
developed and utilized to study the second singlet excited
state of a number of aldehydes and ketones. The nature
of the excited state formed in this transition is a
4
highly disputed subject in the literature. One of the
purposes of the present work is to give new information
concerning this excited state, including the symmetry,
electric dipole moment, and polarizability. The com-
pounds studied include simple cyclic ketones and the series
of formaldehyde, acetaldehyde and acetone. In addition,
a study of the effects of the arc suppressor gas, sulfur
hexafluoride, on electric field spectra is given. The
results of this particular study are related to the
phenomenon of solvatochromism. Each study will be dis-
cussed in turn, but first a foundation of basic
theoretical and experimental fundamentals of electro-
chromism and electric linear dichroism will be presented.
Theoretical Aspects
The theory of the effects of strong electric field
on absorption spectra is the subject of a number of recent
publications (7-11). In general, when a molecule which
possesses a permanent non-zero dipole moment is in the
presence of a large electric field, its electronic
absorptions may show several changes. These variations
include intensity fluctuations, shifts in energy and
changes in band width. They are the results of a differ-
ential energy shift of ground and excited state when the
field is on, change in the total absorption probability
due to orientation of molecules in the field, and
5
field-induced perturbations of the transition dipole
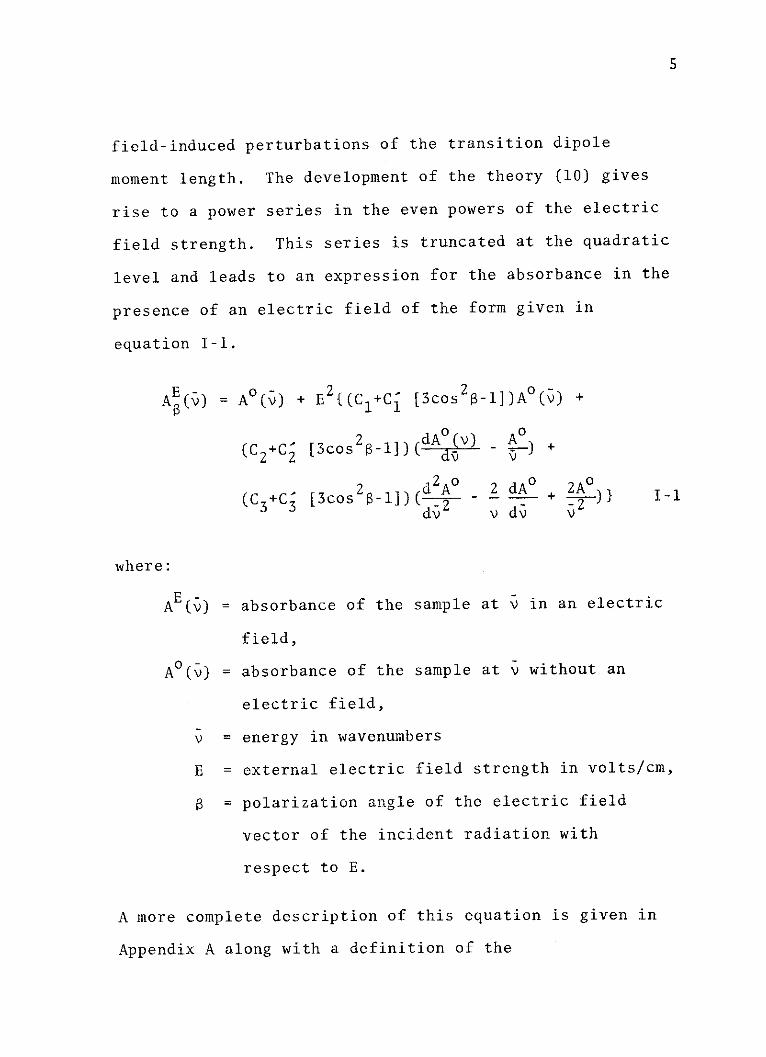
moment length. The development of the theory (10) gives
rise to a power series in the even powers of the electric
field strength. This series is truncated at the quadratic
level and leads to an expression for the absorbance in the
presence of an electric field of the form given in
equation I-1.
A (v) = A 0 (v) + E2{(C 1+C' [3cos2 -l])A (v) +
2 dA0 (v) A0(C2+C2 [3cos 2-l])(d- - - ) +
2 d2A0 2dA 2A(C3+C3 [3cos 2-1])(-2 ~~d- + -2-1
3 dv v dv v
where:
AE(v) = absorbance of the sample at v in an electric
field,
A (v) = absorbance of the sample at v without an
electric field,
v = energy in wavenumbers
E = external electric field strength in volts/cm,
= polarization angle of the electric field
vector of the incident radiation with
respect to E.
A more complete description of this equation is given in
Appendix A along with a definition of the
6
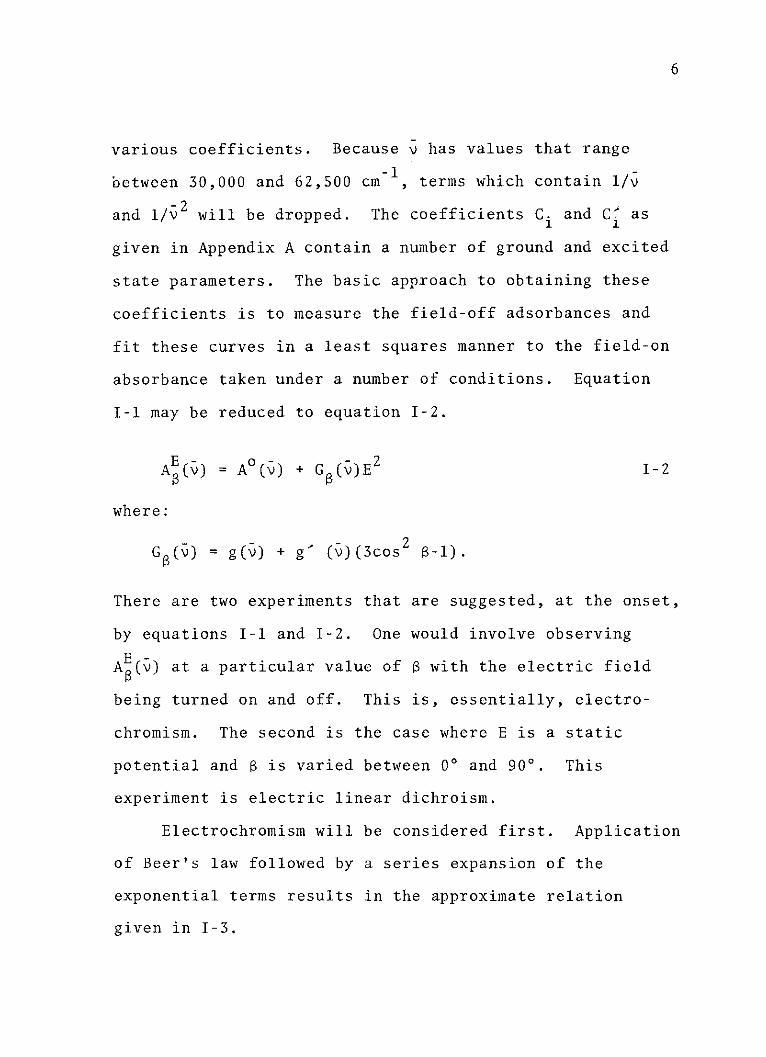
various coefficients. Because v has values that range
between 30,000 and 62,500 cm-1 , terms which contain 1/v
and 1/v2 will be dropped. The coefficients C. and C as
given in Appendix A contain a number of ground and excited
state parameters. The basic approach to obtaining these
coefficients is to measure the field-off adsorbances and
fit these curves in a least squares manner to the field-on
absorbance taken under a number of conditions. Equation
1-1 may be reduced to equation 1-2.
AE(v) = A (v) + G (v)E2 I-2
where:
Ge(v) = g(v) + g' (v)(3cos2 3-l).
There are two experiments that are suggested, at the onset,
by equations I-1 and 1-2. One would involve observing
Ac(v) at a particular value of R with the electric field
being turned on and off. This is, essentially, electro-
chromism. The second is the case where E is a static
potential and S is varied between 0* and 90*. This
experiment is electric linear dichroism.
Electrochromism will be considered first. Application
of Beer's law followed by a series expansion of the
exponential terms results in the approximate relation
given in 1-3.
7
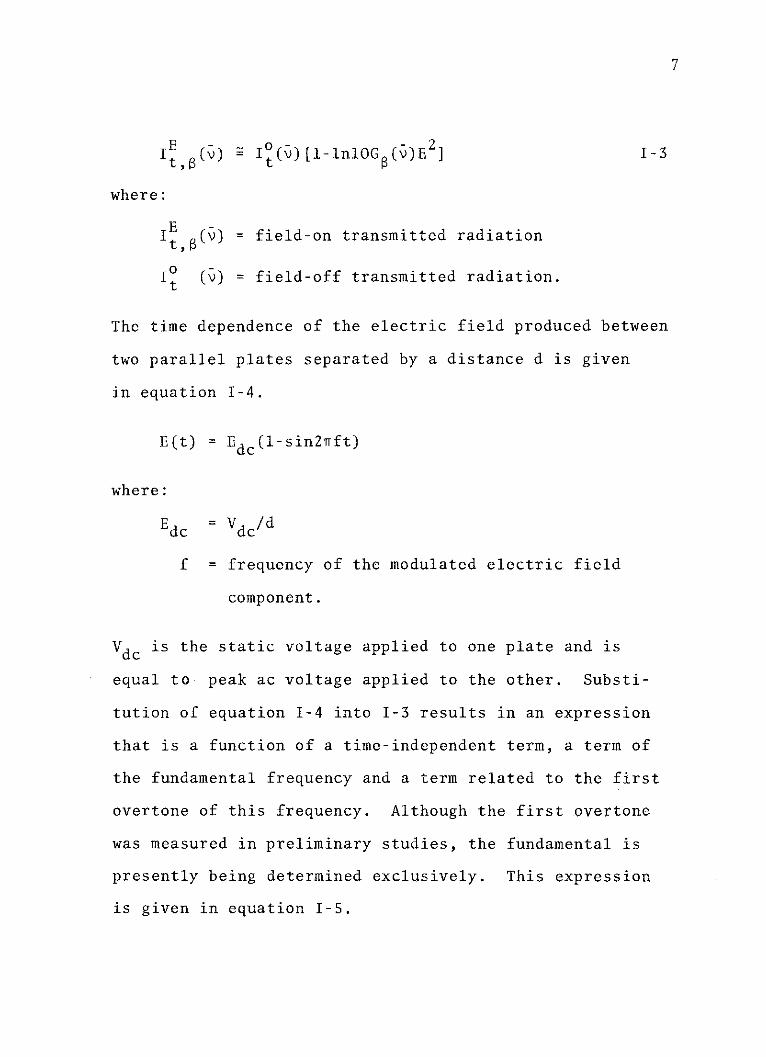
It (v) ~It(v) [1-1n1OG (v)E2] I-3
where:
It (v) = field-on transmitted radiation
I (v) = field-off transmitted radiation.
The time dependence of the electric field produced between
two parallel plates separated by a distance d is given
in equation 1-4.
E(t) = Edc(l-sin2ft)
where:
Edc dc/d
f = frequency of the modulated electric field
component.
Vdc is the static voltage applied to one plate and is
equal to peak ac voltage applied to the other. Substi-
tution of equation 1-4 into 1-3 results in an expression
that is a function of a time-independent term, a term of
the fundamental frequency and a term related to the first
overtone of this frequency. Although the first overtone
was measured in preliminary studies, the fundamental is
presently being determined exclusively. This expression
is given in equation I-S.
8
If,(v) = 2I"(V)ln1OEdcG (sin27Tft) I-5
In this form, phase sensitive detection may be used to
analyze the equation. Using the ac electric field as a
reference to the fundamental frequency, the root-mean-
square value of If (v) may be obtained. This divided by
I gives a modulated field spectrum that is proportional
to G (v), which contains the coefficients of interest times
their respective zero-field absorbances. The 0 dependence
of equation I-S gives rise to two different types of
electrochromism spectra which might be obtained. That is,
the type where Q is fixed at a predetermined angle with
respect to the electric field and the incident beam is
plane polarized, and the type where the incident beam is
nonpolarized radiation. The second type, which is the
electrochromism spectroscopy that was first attempted,
necessitates the evaluation of equation 1-5 for all possible
values of 3. This is discussed in previously cited
references. The different experiments yield different
values for the coefficients of the field-off absorbance
and derivatives. These values are given in Appendix A.
The net result is that, for a molecule in the C2v point
group, the polarization of the transition dipole moment
with respect to the ground state dipole moment (either
parallel or perpendicular) may be determined. For example,
9
if a transition were thought to be B2 + A1 , perpendicular,
its electrochromism spectrum would show a decrease in the
value of the third coefficient when taken with 0 (with
respect to the electric field) polarized light versus the
random polarization spectrum. The opposite would be the
case for a parallel transition such as an A1 -+ A1 excitation.
In addition to this important verification of excited state
symmetry, the absolute value of the electric dipole moment
change upon excitation may be obtained, as well as other
excited state properties which have heretofore been
unknown for the types of transitions studied in the work
presently under consideration.
From equations I-1 and 1-2, a second experiment is
suggested by the cos 2 terms. If the electric field could
be fixed at a static potential, the molecules aligned in
the field, as in a crystal, would exhibit a linear
dichroism. By then modulating the angle of the photon's
plane of polarization between 0 and 90*, a difference
spectrum could be obtained. This type of modulation is
easily achieved by the use of a photoelastic modulator
which, by stressing an isotropic bar of calcium fluoride,
produces this modulation at 50,000 Hertz (Hz). To good
approximation, the angle of polarization of the output of
such a device is given in equation 1-6.
10
= sin 2ft. 1-6
where:
f = frequency of modulation (50,000 Hz.)
The combination of equation 1-2 and 1-3 followed by substi-
tution of 1-6, gives an expression for the transmitted
radiation given in equation 1-7.
=01(-)2 -+2 -
It (v) =It(v) {1-lnl0Edcg (v) + lnlOEdcg()
-31nl0Edcg'(v) [cos 2 (Tsin 2ift)]} 1-7
2 TrExpansion of the cos (-sin2Trft) term gives a power series
in the even harmonics of the 50,000 Hertz fundamental
modulation. With a phase sensitive detector set in the
2f (i.e., first overtone) mode, all other time-dependent
harmonics and frequency-independent terms are rejected
and equation 1-7 reduces to 1-8.
It () t-I (v)lnlOEdcg(v) [1.42cos(4Trft)] I-8
The values of g'(v) are given in Appendix A. The results
of an analysis of the electric linear dichroism spectra
and the coefficients obtained from curve fitting give
verification of previously determined properties. For
example, the sign of the third coefficient gives the
11
polarization of a transition in a C2v molecule; its magni-
tude determines the dipole moment change. In addition,
previously unavailable information regarding the sign of
this dipole moment change can be obtained from electric
linear dichroism.
Together, the three types of spectra coupled with
other experimental techniques give a much needed, highly
quantitative probe with which to investigate excited
states. As each series of compounds is discussed in the
following chapters, the specifics concerning quantitative
measurements of each excited state parameter will be
addressed.
Experimental Aspects
The spectrometer used in the electric field studies
has gone through three basic developmental stages. The
earliest version of the spectrometer has been described
completely in the literature (10-12). A copy of the
last of these references is included in Appendix B. The
second stage of the development involved a number of
minor modifications to the original design. These changes
included the construction of heavy duty vacuum feedthroughs
used in the electric field cell. These feedthroughs are
7.6 cm ceramic spacers with metal to ceramic sealed collars
which are silver soldered into copper pipe fittings.
12
It was also found that the use of spacers to move the
photomultiplier tube away from the cell reduced noise
significantly. Additionally, analog-to-digital conversion
became possible in this stage of development due to the
acquisition of a Fabri-Tex 1070 signal averaging system.
The major experimental difference between this second stage
work and earlier studies was the use of the fundamental
of the electric field modulated spectrum rather than the
first overtone. The advantage in this technique is that
the fundamental signal is four times more intense than
the first overtone. The use of the fundamental, however,
necessitated the determination of the dependence of the
baseline shift (which is due to the modulated inter-
ference by the field on the photomultiplier tube) on the
total intensity of incident radiation (IO). By changing
the exit slits of the monochromator, thus changing the
intensity of the incident beam, this variation was found
to be negligible. Nearly all of the random polarization
electrochromism spectra were obtained with this device.
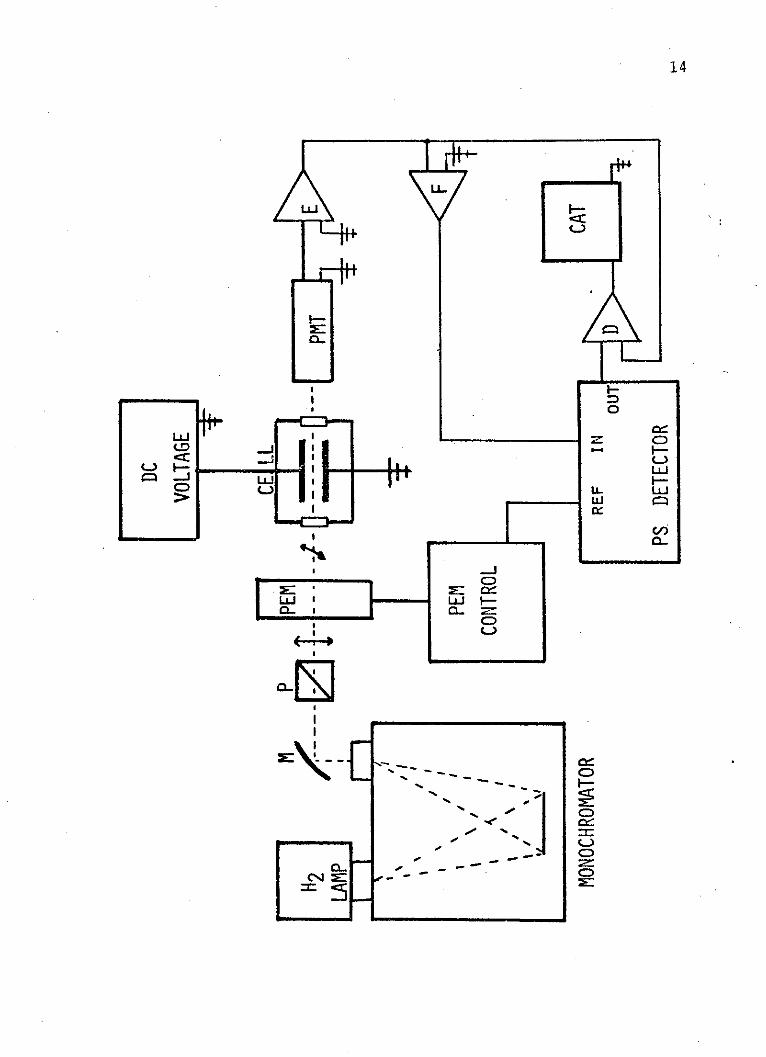
In order to obtain electric linear dichroism spectra,
a new spectrometer was designed so that all three types
of spectra be obtained with a minimum of difficulty. The
general schematic of the new device, in the electric
linear dichroism mode, is shown in Figure 1. Figure 2
shows the same device as it is set up when electrochromism
13
Figure 1. Schematic representation of theexperimental apparatus as it isarranged for the acquisition ofelectric linear dichroism spectra.
M = spherical surface mirror
P = Wollaston prism polarizer
PEM = photoelastic modulator
PMT = photomultiplier tube
E = electrometer
F = bandpass filter
PS = phase sensitive
D = divider
CAT = analog-to-digital converter
LL
LU
-w
'A
C 3
-wf
F .W t----
i
W -
LUH-
!-1i1
14
LU
s "mop dom do OP I
O
LO
Z
L)U
C/)
I . ,
15
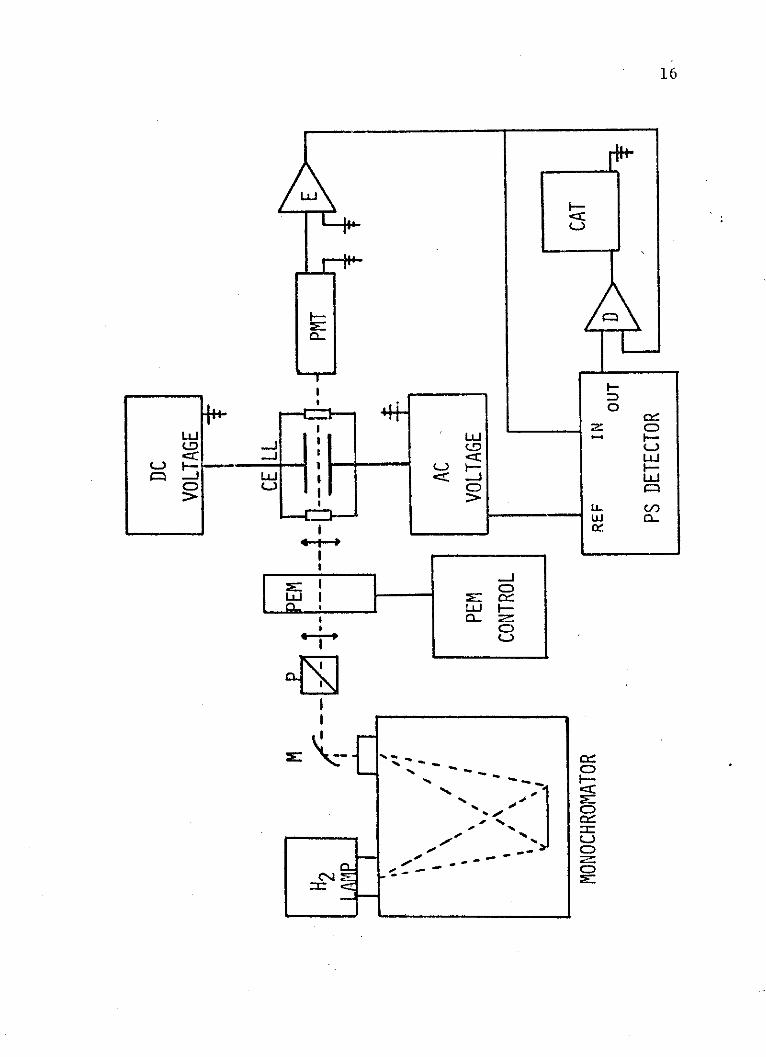
Figure 2. Schematic representation ofexperimental apparatus as itis arranged for the acquisitionof electrochromism spectra.
M = spherical surface mirror
P = Wollaston prism polarizer
PEM = photoelastic modulator
PMT = photomultiplier tube
E = electrometer
PS = phase sensitive
D = divider
CAT = analog-to-digital converter
LUJ
-. J
VU
0-
a - - '-
+- -
III :%A~~~
16
LL
C,(G I-'
L-
H
0
Ec
'LLJ(D
LcJ
C,.LLw.
Wc
LId-
f /
(-)
r
Kim
17
is measured. As in previous designs, the optical train
begins with a Hinteregger window-less hydrogen discharge
lamp as a source. The monochromator is a McPherson model
RS225. This is a 1 meter normal incidence monochromator
equipped with a 1200 line/mm monopartite grating, which
has a dispersion of 0.83 nm/mm. Following the mono-
chromator, at an angle of 450 with respect to the emergent
beam, is a spherical surface mirror (M) with a radius of
curvature of 0.25 meters from Acton Research Corporation.
It is coated with aluminum and magnesium fluoride for high
reflectivity in the vacuum ultraviolet spectral region.
This mirror is so placed as to focus the beam of light
at the center of the cell. Following the mirror is a
Wollaston prism polarizer (P) from Karl Lambrecht
Corporation made of air contacted magnesium fluoride
prisms. The polarizer is rotated so that the beam which
passes through the cell is plane polarized at 00 with
respect to the electric field and 450 with respect to the
next optical element, the photoelastic modulator (PEM).
This device, which is purchased from Morvue Electronic
Systems, shifts the polarization of the incident beam
between 0* and 900, and is essentially a time-dependent
half-wave retardation plate. The retardation is the result
of stress applied to a calcium fluoride plate. When the
modulator is off, the 0* polarized beam passes through
18
this plate unchanged. Next is the electric field cell.
One plate is always connected to a high voltage positive
dc power supply. The other plate is either grounded or
connected to a high voltage negative dc source when the
spectrometer is in the electric linear dichroism mode
(Figure 1). When electrochromism studies are underway,
this plate is connected to a high voltage ac source (Figure
2), thus applying the modulated electric field component.
The frequency of the field modulation is 72 Hertz. The
maximum ac (peak-to-peak) or dc electric field that has
been produced with this device is 250,000 volts/cm.
Following the cell is a quartz faced 9635QB photomultiplier
tube (PMT) from EMI Gemcon Incorporated, which detects
the output photon flux. This entire system is run in a
vacuum which is maintained at 10-6 Torr. This gives the
spectrometer a working range of 600 to 165 nm.
The electronics of this system begins with current-to-
voltage conversion of the photomultiplier output. An
electrometer is used for this conversion, the output of
which is a large dc component with approximately a 0.01
percent modulated signal embedded in the noise of the
phototube. This signal is a 73 Hertz modulation for the
electrochromism experiment and 100,000 Hertz for the elec-
tric linear dichroism studies. The noise is approximately
10 per cent of the total signal, and thus, great care must
19
be taken in the measurement of the ac component. To accom-
plish this task, bandpass filtration (F) and phase
sensitive (PS) detection are employed. The lock-in
amplifier used is a model 391 from Ithaco Electronics,
which is referenced to either the photoelastic modulator
control (for electric linear dichroism, Figure 1) or to
the ac high voltage source (for electrochromism, Figure 2).
The output of the lock-in is the root-mean-square voltage
of the ac component and is sent to the divider (D) as the
numerator. The denominator is the dc component of the
electrometer output. The divider output, which is IE /1
is then sent to an X-Y recorder and/or the analog-to-digital
converter. The electrometers, filters and divider were
constructed from components by Analog Devices Incorporated
and Radio Corporation of America. After minor modifi-
cation, a McPherson model 782 logarithmic ratiometer is
used to obtain zero-field absorbance data. The output of
the ratiometer is also sent to an analog differentiator,
the output of which is converted to dA0 /dv.
The coefficients discussed in the theoretical section
are evaluated by fitting the experimentally determined
IE (v)/I (v) values to the zero-field absorbance and its
derivatives. In the preliminary studies, this method
was used. A disadvantage to this method lies in the fact
that values of d2A (v)/dv were generated numerically and
20
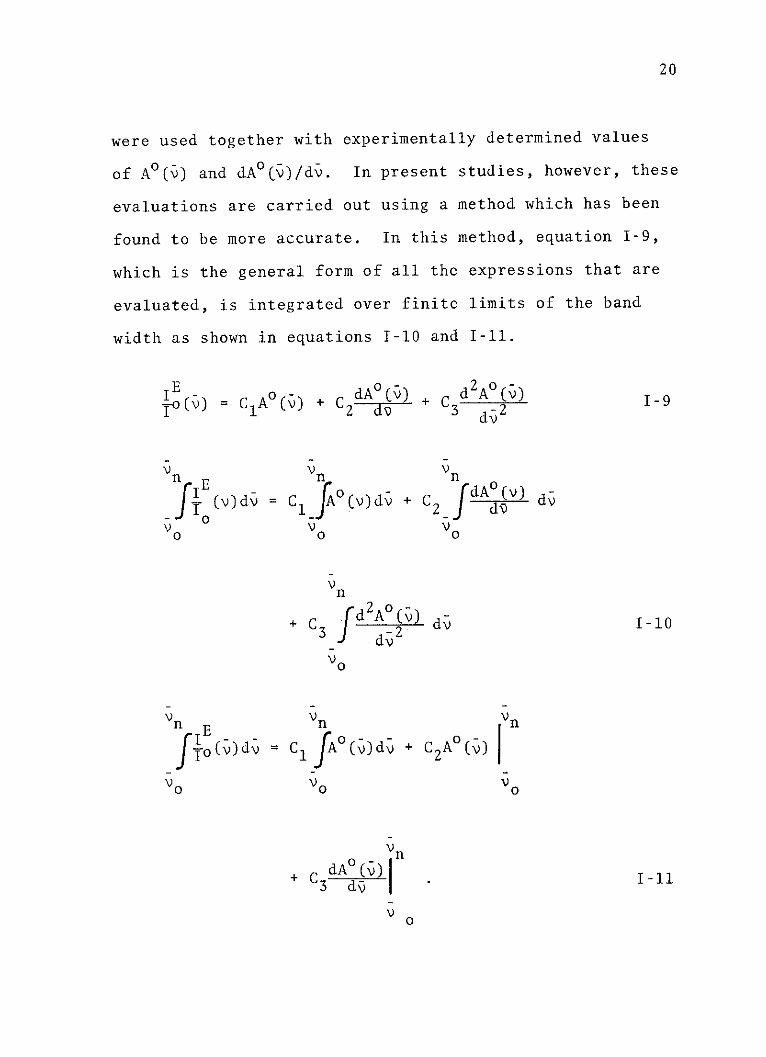
were used together with experimentally determined values
of A0 (v) and dA (v)/dv. In present studies, however, these
evaluations are carried out using a method which has been
found to be more accurate. In this method, equation 1-9,
which is the general form of all the expressions that are
evaluated, is integrated over finite limits of the band
width as shown in equations I-10 and I-11.
(o )= CA() + CdA0 (v) + C 3 d2 AO(v) I _ 9
Io(v) 1 (v) 2 3 dv 2 '-
Vn vn vn
E(v)d = CJ (v)dv + C2 dA v) dv
O2 J
+ C3 d 2A (v) dv I-10
Vn Vn vn
O(v) d= ClfA()d\ + C2 A0(v)
V0 V0 Vo
Vn
+ c dA"V) Vnd1-11
V30
21
Experimentally, IE (v)/I(V), A (v) and dA (v)/dv are still
determined as in previous work, but the integrals as
described in equation I-11 are determined using the Simpson
1/3 rule numerical integration. The data are smoothed
using a five point smoothing polynomial, and then fit using
the linear least square technique to give the various
coefficients. A variety of methods were tested for a
guassian band shape with the coefficients given represen-
tative values. The Simpson 1/3 integration method was
found to be the most accurate. In these test-fits, as in
the experiments, 70 to 90 points are used in determining
the values of the coefficients.
As with the theoretical aspects, the specifics such
as sources for compounds, pressures and other experiment
details will be brought forth as each individual study
is discussed.
Electric Field Studies
In the following chapters a description of the studies
and the results of these investigations are given, beginning
with the preliminary work on the electrochromism spectrum
of the *+r transition of aniline and the first electro-
chromism results on the second singlet of formaldehyde.
The work on aniline confirmed the applicability of the
theoretical model, and the results of the formaldehyde
study represent the first new data to be published from
22
the present investigation (13). In the third chapter,
the effects of the arc suppressor gas, sulfur hexafluoride,
are presented. The primary results of this study show
that presence of this 'solvent' gas increases the local
electric field that the 'solute' molecules experience;
and that the Lorentz local field corrections (8), which
are often made for solvent environments, are not large
enough to account for this change. The subject of the
fourth chapter is the electrochromism and electric linear
dichroism spectra of the second singlet of cyclobutanone,
cyclopentanone, cyclohexanone and cycloheptanone. The
results support the assignment of this transition as (n,3s)
molecular Rydberg. The fifth chapter is devoted to the
electrochromism and electric linear dichroism study of
formaldehyde, acetaldehyde and acetone. This work supple-
ments initial results for formaldehyde and brings to light
some unusual results for acetaldehyde that indicate a large
change in dipole moment size and direction for the second
singlet excited state. The final chapter is a conclusion
and summation of results for the excited states considered
and a compilation of suggested new directions for electric
field studies in the vacuum ultraviolet spectral region.
23
CHAPTER BIBLIOGRAPHY
1. Townes, C. H. and Schawlow, A. L., "Microwave Spectro-scopy," McGraw-Hill, New York, New York, 1955.
2. Btttcher, C. J. F., "Theory of Electric Polarisation,"Elsevier, Amsterdam, Holland, 1952.
3. VanVleck, J. H., "Electric and Magnetic Susceptibili-ties," Oxford University Press, London, England,and New York, New York, 1932.
4. Platt, J. R., J. Chem. Phys., 34, 862 (1961).
5. Dt3rr, F., Angew. Chem. Internat. Edit., 5, 478 (1966).
6. Reichardt, C., Angew. Chem. Internat. Edit., 4, 29(1965).
7. Liptay, W., "Dipole Moments and Polarizabilities ofMolecules in Excited States," Excited States, Vol.I, edited by Edward C. Lim (New York, 1974), pp.129-229.
8. Labhart, H., "Electrochromism," Advances in ChemicalPhysics, Vol. XIII, editedby I. PrIgogine(New York, 1967), pp. 179-204.
9. Yamaoka, Kimamu and Charney, Elliot, J. Amer. Chem.Soc., 94, 8963 (1972).
10. Scott, John D. and Russell, B. R., J. Chem. Phys.,63, 3243 (1975).
11. Scott, John D., "Properties of Molecular Rydberg States,"unpublished doctoral thesis, Department ofChemistry, North Texas State University, Denton,Texas, 1974.
12. Causley, G. C., Scott, John D. and Russell, B. R.,Rev. Sci. Instrum., 48, 264 (1977).
13. Causley, G. C. and Russell, B. R., J. Chem. Phys.,in press.
CHAPTER II
PRELIMINARY ELECTROCHROMISM STUDIES
This chapter is centered about work which, although
preliminary in nature, has resulted in publications (1,2).
The studies to be discussed here are the electrochromism
spectrum of the Tr*+--Tr, B2 +A 1 transition of aniline and the
electrochromismspectrum of the second singlet, B2 A1
transition of formaldehyde.
Aniline
Introduction
The initial work of Scott (1,3) resulted in the
construction of the first type of electrochromism spectro-
photometer referred to in the previous chapter and
described in Appendix B. At the outset of the present
work, it was determined that this device should be tested
by investigating a transition of a compound which had
been studied by another method. To this end, the electro-
chromism spectrum of the w*-+, B 2 +A band of aniline was
recorded. This absorption is found at 293.8 nm and has
been studied by Lombardi using optically excited state
Stark field spectroscopy on the resolved rotational levels
24
25
of this band to determine the excited state dipole change
(4,5). In his first study, Lombardi found the absolute
value of the dipole moment change for aniline in the
B2 (Tr*Tr) state to be 10.85 0.151 D. The study of the
rotational fine structure of this transition also yielded
the result that the molecule is contracted along its long
axis. This fact is used as evidence to support the
existence of a quinoid-like resonance structure in this
excited state. This evidence, along with other data, led
Lombardi to the conclusion that the sign of the dipole
moment change was such that it resulted in an increase in
dipole moment with the positive end of this dipole at the
nitrogen of aniline. In Lombardi's second work on aniline,
the dipole moment was determined to be 2.45 0.10 D. This
represents a slightly larger change of 0.92 0.10 D from
the ground state value, 1.53 D. In his second study,
Lombardi also discusses the existence of a very near
Tr*+n or a+-Tr state of B2 symmetry. Results of the elec-
trochromism studies of aniline support Lombardi's
assertions.
Results and Discussion
The initial results of studies of this band CAppendix
B), using the first electrochromism spectrometer and the
first numerical method, were satisfactory for the prediction
26
of the dipole moment change to the point where the error
bars of the two values overlap. More recent studies of
this band in aniline, using the newer equipment design and
numerical analysis technique discussed earlier, have
yielded more reliable and consistent results.
When the study of aniline was undertaken, the prin-
cipal goal was to obtain a value of the dipole moment
change, and to compare that value to the value obtained by
Lombardi. The assignment of the transition as B2+Al
polarized perpendicular to the ground state dipole moment,
which lies on the C2 axis of aniline, was not questioned (6).
With the assumption that the transition is perpendicular,
the theoretical values of the coefficients may be simpli-
fied. For random polarized electrochromism spectra, these
coefficients are shown in Appendix A. The results of the
least squares analysis gave these experimental coefficients:
C = -(4.8 2.4) x 10-3
C2 = +(7.4 4.0) x 10-2 cm~
Cexp = -(1.92 0.23) cm-2
Relating the value of C3xp to its theoretical counterpart
yields a dipole moment change of (1.18 0.071 D. This value
is closer to the 0.92 D value of Lombardi, but is still
relatively high. This fact has been partially accounted
for by a pressure effect of the arc suppressor gas used
27
in the experiments. This effect will be discussed in
detail in Chapter III. The net result of this effect is
that the observed dipole moment change is increased approxi-
mately 9% in the presence of 3 atmospheres of sulfur hexa-
fluoride. Extrapolation to zero atmospheres of suppressor
gas yields a dipole moment change of 11.07 0.071 D.
It is fortunate that the C3 coefficient is not related
to as many parameters as the other two coefficients. This
allows the computation of the dipole moment change, if the
orientation of transition dipole moment with respect to this
change is known. However, C1 and C2 , as noted in Appendix
A, are by no means simple. It is clear that in order to
evaluate them, additional experiments must be completed.
In addition to their complexity, the reproducibility of
these coefficients is generally poor. The reason for this
problem is both numerical and experimental. Numerically,
the value of C1 is four to five orders of magnitude smaller
than C3 . C2 is two to three orders of magnitude smaller
than C3 . This results in difficulty when applying the
least squares criterion, where errors are manifest in the
coefficients according to size. This coupled with poor
signal-to-noise which often accompanies this experiment,
has made analysis of these values difficult. In spite
of these problems, attempts to analyze the first two coef-
ficients have been made for some of the compounds which have
been studied. Throughout the dissertation, these attempts
will be discussed.
28
In the case of aniline, C1 and C2 are larger than would
be predicted. This could be the result of the value of
the direct-field-dependence term, R , being very large.
This term, like R(2), is a vector quantity which results
from field-dependent mixing of the excited state being
studied with other states of the same symmetry. A nearby
state of B2 symmetry was predicted by Lombardi. The
high value of the C1 coefficient supports this assertion.
Many of the variables of C1 may be calculated or estimated,
and none is sufficiently large to explain the magnitude of
this coefficient, except the perturbation terms. The
further analysis of aniline has been hampered by the fact
that the random field electrochromism spectrum of this com-
pound is weak. Attempts to measure the zero degree
polarized electrochromism spectrum were not successful due
to a decreased signal to noise ratio. This reduction of
signal, although a detriment to the further evaluation of
C1 and C2 , is additional proof that this transition is
B2 +A 1 perpendicular. If the transition were polarized
parallel to the ground state dipole moment, the electro-
chromism signal would have been enhanced, not reduced.
As will be shown in the following chapters, this may not
always be true, but for a molecule which is in the C2 v
point group, it is definite evidence of the transition
polarization.
29
The investigation of aniline provides proof that the
technique is capable of yielding transition polarization
and dipole moment change. With these tools, the investi-
gation was expanded to include the study of the second
singlet state of formaldehyde.
Formaldehyde
Introduction
The excited states of formaldehyde have been of recent
experimental and theoretical interest (7-18). The F*+n,
1A2-1A 1 transition which occurs in the near ultraviolet
at ca. 300 nm has been studied quite extensively. Included
in the numerous papers on this system are those wherein the
excited state dipole moment is reported for formaldehyde
in this state. Both static field splitting of rotational
lines (19-21) and alternating electric field studies
(22-24) have been completed. The accepted value of the
dipole moment in the A2 (n,r*) state (20) is 1.56 0.07 D,
which is reduced from the ground state value (25) of
2.33 0.02 D. At this time, there appears to be little
doubt with respect to this assignment and to the nature
of this excited state.
This is not the case for the next major absorption in
the spectrum which occurs at 57,170 cm~ (174.9 nm). This
absorption has been assigned to a large number of possible
30
transitions, both extravalent and intravalent of a variety
of symmetries. Work by Barnes and Simpson (26) and Johnson
and Simpson (27) on similar transitions in alkyl ketones
has shown this transition to be polarized perpendicularly
to the bonding axis and in the molecular plane. This fact
supports the o*+n, B2 +A 1 or 3s*-n, B2 -A1 assignments for
this band. Earlier theoretical studies indicated this
excited state to be B2 (n,c*) in concurrence with Simpson
et al.; but, more recently, ab initio calculations show
this state to be quite extravalent indicating the B2 (n,3s)
molecular Rydberg assignment to be correct. Experimental
evidence over the years has been somewhat mixed (28),
but the case for the Rydberg assignment has recently been
gaining strength. A number of experimental observations
in support of the Rydberg assignment are given by Moule
and Walsh (7) in their recent review on the ultraviolet
spectra and excited states of formaldehyde. These
observations include:
(1) The transition of interest has a term value of
30,588 cm~ with respect to the first ionization period.
This term value yields a quantum defect value of 1.1 which
is characteristic of a first ns Rydberg transition, and
matches very closely the theoretical value of the quantum
defect calculated by Miller (18) for the 3sa1 orbital.
Indeed, Allison and Walsh (29) showed that this transition
31
is included in an ns Rydberg series, which converges on
the first ionization potential at 10.88 eV.
(2) The vibrational structural of the absorption in
question is much like that observed for the photoelectron
spectrum of the 2 B2 ion state (30). Like the photoelec-
tron spectrum of 10.8 eV, the vacuum ultraviolet spectrum
at 174.9 nm shows a structure which is predominantly a
sharp 0-0 transition. In addition, the adjoining vibra-
tional spacings in both spectra are quite similar. This
result is expected if the upper orbital is extravalent
and nonbonding as might be possible for the 3s Rydberg
orbital.
(3) If the transition at 174.9 nm were cs*n, B2A1 ,
a long progression of the symmetric v2 vibration should be
seen. No observation of this type has been made.
One additional pertinent experimental result is the
sensitivity of similar bands in other aldehydes and ketones
to high pressure and solvent environments. Robin (28)
in his work on these and other compounds has shown that
the structure and intensity of Rydberg absorption bands
can be greatly altered by high pressure (ca. 100 atmos-
pheres of an inert gas) or solvents, where intravalent
transitions show little change in these environments.
the bands in question are almost completely removed from
their respective spectra under these conditions. This fact
supports the assignment as 3s-n, B2 A1 .
32
In order to provide new information for the 174.9 nm
band of formaldehyde, the gas phase random polarized light
electrochromism spectrum was obtained. Analysis of the
data indicates that the dipole moment is greatly changed
upon excitation in this region of the spectrum. The change
observed is 2.66 0.14 D. This is thought to support the
Rydberg assignment. In addition, the zero degree fixed
polarized light electrochromism spectroscopy was attempted.
Although a good recorded spectrum was never obtained, the
results of this study add new evidence that the transition
in question is polarized perpendicular to the ground state
dipole moment and; therefore, perpendicular to the C2 axis
of formaldehyde. This is strong evidence in favor of the
B2+ assignment, a fact that was not previously confirmed
specifically for this compound.
Results and Discussion
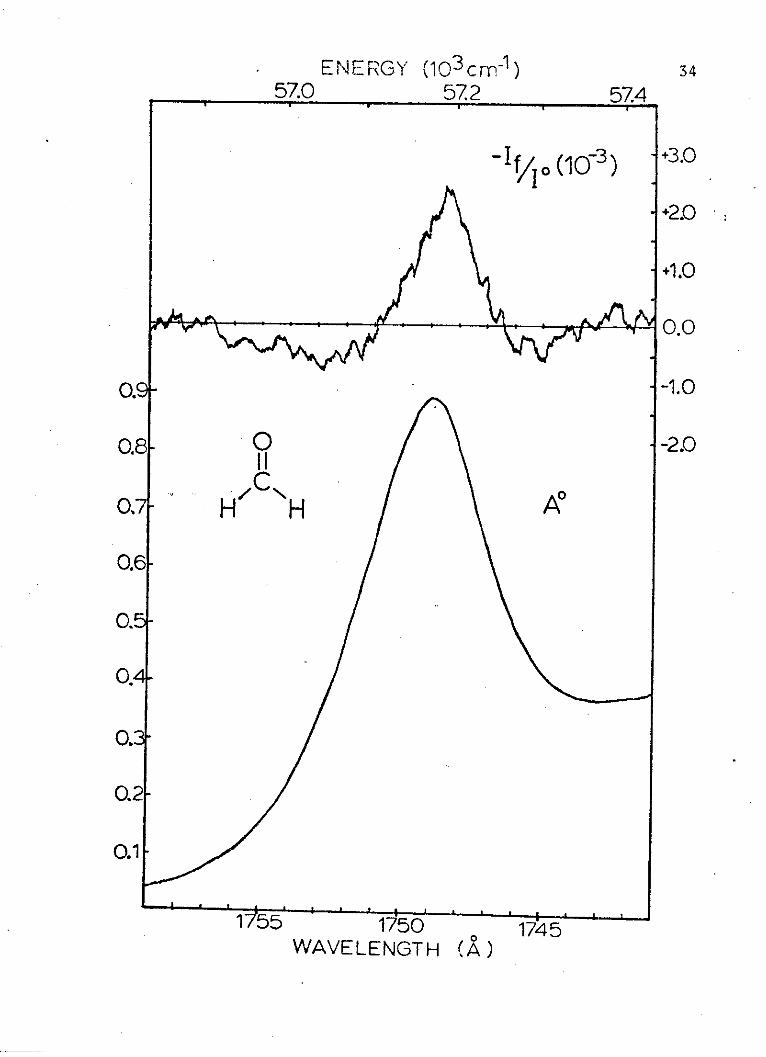
Representative absorption and modulated spectra of
the formaldehyde 174.9 nm band are shown in Figure 3.
The spectra were measured several times, and the final
averages of the experimental coefficients and their
standard deviations are:
CeXp = +(3.3 1.4) x 10-4
Cx = -(5.0 2.4) x 10-2 cm1
CeXp = -(9.71 1.05) cm-2
33
Figure 3. The absorbance (A*) and the randompolarized light electrochromism spectrum (-I /I)of the 0-0 component of the 174.9 nm band of formal-dehyde.
" ENEFRGY (103cm-1) 3457.0 57.2 57.4
-f 03 ) +3.0
+2.0
+1.0
0.0
0.8 0 2.0
C A0,7 H H A
0.6
0.5
0.4
0.3-
0.2
0.1
I*1 55 1750 1745WAVELENGTH (A)
35
Using the ground state value of the dipole moment and
equations A-2 and A-11, a theoretical value of the first
coefficient, minus the R and S perturbation terms, is
calculated to be 1.9 x 10-S. The deviation of the experi-
mental value from the theoretical value of this coefficient
is observed here as in the study of aniline. Assuming the
asymmetric polarizability and the R(2) (l) and S(2)
perturbation terms to be small compared to the R(1) term,
a fact which is supported by the relative sizes of the
coefficients of these values, reduced forms of the coeffi-
cient for the random polarized light electrochromic effect
can be derived. These values for a perpendicularly
polarized transition are given in equations II-1 through I1-3.
Cexp = -2.62 R(1) + 3.52 x 10⁻⁶ P2 1-_1 g g
Cexp = 1.32 x 10⁻² a- + 9.10 x 10~4 bg
+ 546 R (1)a 11-2
C = -1.37 a2 11-3
This set of equations will be used to calculate a, b
and R(. The calculation of the absolute value of the
dipole moment change (a) is straightforward. This value
is 12.66 0.141 D. This change is not as large as that pre-
dicted for this transition by Harding and Goddard in their
recent ab initio study of formaldehyde (13). The change
predicted by Harding and Goddard is 5.43 D, where
36
electron density has moved from the oxygen end of the
molecule to the hydrogens. The change determined from
the experimental data is not as large as predicted, but
when included with the aforementioned experimental results,
supports the assertion that the character of this transition
is predominantly Rydberg. For intravalent states the dipole
moment changes have been predicted to be much smaller.
This was observed for the A2 + A1 (Tr*+n) excitation, where
the change is 0.77 D. Unfortunately, it appears that a
prediction of the B2 (n,1r*) dipole moment has not been pub-
lished, in spite of the large number of papers available
dealing with the subject. However, this lacking is to
be expected in the more recent calculations, which found
that this state could be dissociative. The large dipole
moment change predicted for the Rydberg excitation, on
the other hand, is supposedly the result of delocalization
of positive charge on to the hydrogens, which gives rise
to a concomitant stabilization of the Rydberg orbital
over this charge.
With the value of the dipole moment change and the
estimated value of R found to be -5.3 x 10⁻⁵ esu cm/erg
from equation II-1; an approximate value of b, the mean
polarizability change, may be calculated by solving for b
in equation 11-2. The value for this change is:
37
03b = -(63 27) A
for a positive value of the dipole moment change, which is
assumed to be correct. The deviation is very large based
on the deviations of the coefficients C1 and C2 , but this
calculated value demonstrates the order of magnitude of
the change in mean polarizability, which has a ground state
value (3) of 2.8 A3' The excited state value is calculated
03to be ca. 66 27 A (a = aex - b). Upon excitation to a
large diffuse orbital, such as the 3sa1 Rydberg orbital,
a large change in polarizability might be expected.
Unfortunately, there is no theoretical value of the excited
state mean polarizability available, and since the calculated
value has such high uncertainty, it is presented here only
as additional data.
As in the study of aniline, attempts to measure the
zero degree polarized light electrochromism spectrum of
formaldehyde were not successful. A recorded spectrum
could not be obtained, but the observed reduction of inten-
sity is good evidence in support of a perpendicular,
B2 +A 1 assignment. It will be shown in Chapters IV and V
that, for strong signals, this type of variation can be
used quantitatively to determine polarization angles with
respect to the change in dipole moment. In the present
study, more qualitative deduction must suffice. In
addition, because of the weak signal of formaldehyde,

38
electric linear dichroism studies were not undertaken as
this spectrum is expected to be approximately one-fifth
the zero degree polarized light electrochromism signal
intensity.
Conclusion
The evidence presented here, when combined with other
experimental results, generally supports the assignment
of the 174.9 nm band of formaldehyde as Rydberg in charac-
ter, but the agreement between theory and experiment is
only fair. Additionally, this assignment still leaves the
question of the location of the B2 *A 1 (a*+n) transition
unanswered. Based on the size of the field-induced pertur-
bations discussed earlier, which result from mixing of
excited states of the same symmetry, it is thought to occur
in this energy region. The spectra of acetone, acetalde-
hyde and many other aldehydes and ketones, when observed
either in solvents or under high pressure, show a broad
diffuse structure under the sharper Rydberg transition.
However, the assignment of this band as c*+n is not
supported by recent calculations (16,17), which put the
a*+n at a much higher energy. An additional effect that
might be involved is the apparent mixing of the 3s+-n and
3pn Rydbergs which has been noted for cyclic and symmetric
ketones (32-34). It has been suggested that the location
39
of the a*+--n and this effect are related (35). Work on
the higher lying Rydbergs will add new insight into these
problems, and it is felt that the determination of excited
state properties is very important to their solution.
40
CHAPTER BIBLIOGRAPHY
1. Causley, G. C., Scott, John D. and Russell, B. R.,Rev. Sci. Instrum., 48, 264 (1977).
2. Causley, G. C. and Russell, B. R., J. Chem. Phys., inpress.
3. Scott, John D. and Russell, B. R., J. Chem. Phys., 63,
3243 (1975).
4. Lombardi, J. R., J. Chem. Phys., 50, 3780 (1969).
5. Lombardi, J. R., J. Chem. Phys., 56, 2278 (1972).
6. Christoffersen, J., Hollas, J. M. and Kirby, G. H.,Mol. Phys., 16, 441 (1969).
7. Moule, D. C. and Walsh, A. D., Chem. Rev., 75, 67(1975), and references therein.
8. Lessard, C. R. and Moule, D. C., J. Mol. Spectroscopy,60, 343 (1976).
9. Mental, J. E. and Gentieu, E. P., J. Chem. Phys., 555471 (1971).
10. Weiss, M. J., Kuyatt, G. E. and Mielczarek, S., J. Chem.
Phys., 54, 4147 (1971).
11. Chutjian, A., J. Chem. Phys., 61, 4279 (1974).
12. Harding, L. B. and Goddard III, W. A., J. Amer. Chem.Soc., 97, 6293 (1975).
13. Harding, L. B. and Goddard III, W. A., J. Amer. Chem.Soc., 99, 677 (1977).
14. Whitten, J. L. and Hackmeyer, M., J. Chem. Phys., 51,5584 (1969).
15. Whitten, J. L., J. Chem. Phys., 56, 5458 (1972).
16. Buenker, R. J. and Peyerimhoff, S. D., J.' Chem. Phys.,53, 1368 (1970).
41
17. Peyerimhoff, S. D., Buenker, R. J., Kammer, W. E.
and Hsu, H., Chem. Phys. Letters, 8, 129 (1971).
18. Miller, K. J., J. Chem. Phys., 62, 1759 (1975).
19. Freeman, D. E. and Klemperer, W., J. Chem. Phys., 40,604 (1964).
20. Freeman, D. E. and Klemperer, W., J. Chem. Phys., 45,52 (1966).
21. Lombardi, J. R., Freeman, D. E. and Klemperer, W., J.Chem. Phys., 46, 2746 (1967).
22. Buckingham, A. D. and Ramsay, D. A., J. Chem. Phys., 42,3721 (1965).
23. Bridge, N. J., Haner, D. A. and Dows, D. A., J. Chem.Phys., 44, 3128 (1966).
24. Bridge, N. J., Haner, D. A. and Dows, D. A., J. Chem.Phys., 48, 4196 (1968).
25. Kondon, K. and Oka, T., J. Phys. Soc. Jap., 15, 307(1960).
26. Barnes, E. E. and Simpson, W. T., J. Chem. Phys., 39,670 (1963).
27. Johnson, Jr., W. C. and Simpson, W. T., J. Chem. Phys.,48, 2168 (1968).
28. Robin, M. B., "Higher Excited States of PolyatomicMolecules" (Academic Press, New York, 1974), Vol.II and references therein.
29. Allison, K. and Walsh, A. D., Chemical Institute ofCanada Symposium, Ottawa 1957.
30. Baker, A. D., Baker, C., Brundle, C. R. and Turner,D. W., Int. J. Mass Spectrosc. Ion Phys., 1, 285(1968) .
31. Hurdis, E. C. and Smyth, C. P., J. Amer. Chem. Soc., 65,89 (1943).
32. Udvarhazi, A. and El-Sayed, M. A., J. Chem. Phys., 42,3335 (1965).
42
33. Holdsworth, R. S. and Duncan, A. B. F., Chem. Rev., 41,
311 (1947).
34. Ito, H., Nogato, Y., Matsuzaki, S. and Kuboyama, A.,
Bull. Chem. Soc. Jap., 42, 2453 (1969).
35. Lucazeau, G. and Sandorfy, C., J. Mol. Spectrosc.,35, 214 (1970).
CHAPTER III
THE EFFECT OF SULFUR HEXAFLUORIDE
ARC SUPPRESSOR GAS ON ELECTRIC
FIELD SPECTROSCOPY
Introduction
The differential absorption of radiation by a molecule
resulting from the presence of a large electric field is
known as electrochromism. This effect has been discussed
previously (1-5), both theoretically and experimentally.
The measurement of this phenomenon involves the use of
relatively high electric field strengths (105 to 106
volts/cm). These field strengths result from large poten-
tials maintained over short distances. It is because of this
that arcing and corona formation within experimental
electric field cells must be suppressed. In order to
accomplish this, the compound being studied in the gas
phase at about 100 microns of pressure must be surrounded
by a "solvent" gas with the proper dielectric properties
and in sufficient quantity (at least 2.7 atmospheres for
105 volts/cm field) to minimize the deleterious effects of
discharge. Ideally, the solvent gas would have no effect
on the measured electrochromism signal, but this is not
usually the case. Accordingly, a study of the suppressor
43
44
gas that is employed in these studies, sulfur hexafluoride,
was undertaken. Not only is the effect of this gas
important to the present studies, but the question of the
effects of solvents used in liquid phase electrochromism
may be better understood through a study such as this.
In general, the internal electric field of a polarizable
medium is not equal to the external laboratory electric
fielddue to the interactions of the molecules of this
medium with the field. There are basically. two theoretical
approaches to determining the true electric field that a
solute molecule would experience in a polarizable medium.
Both of these models have been addressed extensively in
the literature (3-5). The correction for the internal
field, as developed by Debye (6), is based solely on the
induced dipole moment in the polarizable medium and gives
rise to the Lorentz field expression for the electric field.
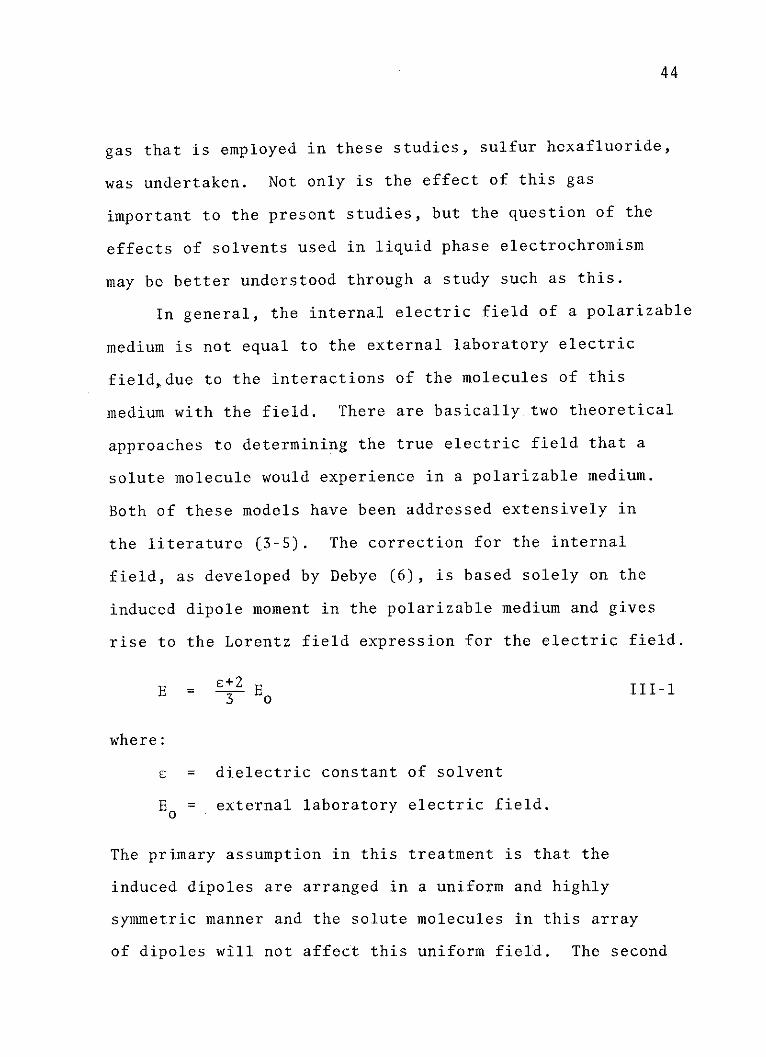
E = E+2 E III-13
where:
E = dielectric constant of solvent
E = external laboratory electric field.
The primary assumption in this treatment is that the
induced dipoles are arranged in a uniform and highly
symmetric manner and the solute molecules in this array
of dipoles will not affect this uniform field. The second
45
approach to the true electric field a molecule in solution
experiences was introduced by Onsager (7). This theory
is based on the idea that the total electric field should
be considered as the result of point dipoles which are
present in cavities within the solvent. For these vacancies
alone, neglecting all other interactions, the effective
electric field is:
BEff = 2c+1 o 2
In addition to the cavity field resulting from the external
electric field, there is a reaction field that results
from the interaction of the dipole moment of the solute
with the solvent, so that the total field for the ground
state may be expressed as:
E = B +1E1II-3Tot Eff Re
The reaction field (Ee) for a spherical vacancy (7,8) is
described in equation 111-4.
E = 2(c-l) II_4
Re r3(2c+1) g
where:
r = radius of the cavity
P' = total electric dipole moment of the soluteg
(both permanent and induced) in the ground
state.
46
The total electric dipole moment is dependent both on
the permanent and induced dipole moment.
y' = v' +c a E III-5g g *g Re
where:
a = polarizability of the ground state.
Combination of equations 111-3 and 111-5, assuming V' = ygg
and letting
f - 2(s-l)f3r (2c+1)
then,
EE = B + fy . III-6Tot Eff g-
Similarly, for the excited state, there is a cavity field
and a reaction field such that,
ETot EEff +BeRe1-
ERe, the reaction field for the excited state is dependent
on both ground state and excited state dipole moments and
polarizabilities of the solute and their effect on the
solvent. Assuming again, that the polarizability effects
are small compared to the permanent dipole moment terms,
the total electric field for the excited state can be
shown to be (9),
47
ETot = Eff + fg + f'(y -f ) 111-8Tt Ef g e g
where:
_ 2(n2-)
r3 (2n2+1)
n = refractive index at the wavelength of the
solute absorbance.
Both the f and f' terms contain the inverse of the cavity
radius. It is proposed that this radius is inversely pro-
portional to the solvent gas pressure effect seen in the
present studies. This relation would give rise to an
expression for the total electric field, both in the ground
state and excited state, that would increase as solvent
gas pressure in increased.
The purpose of this study is to test the applicability
of the Lorentz local field expression and the Onsager
reaction field model. To accomplish this, a random polarized
light electrochromism study of three compounds was com-
pleted for sulfur hexafluoride pressures from 2.7 to 12
atmospheres. Aniline, cyclopentanone and acetone were the
compounds chosen for the study. Their selection was
based primarily on their symmetry and transitions. The
aniline Tr*+.rr, B2 +A 1 transition, cyclopentanone 3s_+n, B2 +A1
transition and the acetone 3sn, B2 +A1 transition are
the specific excitations studied. The polarizations of
these transitions are now all known (10-12), which allows
48
the simplification of the theoretical expressions for
the electrochromic effect. In these studies, the general
formula for this effect is given in equation 111-9
(references 1 to 5).
f-Ir-dv = C fA (v)dv + C 2 j dA ) dv
+ C3 fd2 A0 (v) dv 111-93 dv
The coefficients (C.) are all dependent on the electric
field strength squared, within the framework of the
approximations of the theory of the electrochromic effect.
The discussion will be centered about the pressure sensi-
tivity of C3 where,
S 2 2 1n10 4 (Eg P-Be 12C3 ~h 2 2 30 Tot g Tot e)III-l0
This coefficient was chosen because it is the largest,
least complex and most reproducible. Substitution of 111-6
and 111-8 into III-10 gives,
(C 3 ) =1.172 x 10- [EEff(g(uge) + fyg(u -pe)
-f'(ye-g )ye]. III-11
Rearrangement with (p -pe) = a gives,
49
(C 3 )
5 = [EEff a + (fu + f pu) a]. 111-121.172 x 10
Since f and f' are dependent on the reciprocal of the
cavity radius and thus related to the pressure of the solvent
gas, a plot of this pressure against the adjusted C3 should
give a nearly straight line with intercept equal to the
absolute value of the dipole moment change times EEff
(EEff = E0 at zero atmospheres of sulfur hexafluoride).
The slope should be proportional to the dipole moment change
as well as a complex term involving f and f'. On the other
hand, if the Lorentz field correction is correct, adjusting
the field strength such that,
E = E +2 , 111-13
where c is the dielectric constant of the solvent gas at
a given pressure, gives a rise to a slope proportional to
the dipole moment change (a), such that
C2
3 - = aE, 111-141.172 x 10O
over the experimental pressure range. As will be shown in
the following discussion, the data support the Onsager
treatment.
50
Experimental
The electrochromism spectrometer used in the experiments
has been completely described previously (13,14), along
with the method of data manipulation employed in obtaining
the electrochromism coefficients. Other than the variation
of pressure and choice of sample, all experimental variables
were kept constant.
The samples were all obtained commercially at the
highest purity available, degassed and purified by vacuum
techniques described in the literature (15). The samples
were put into the electric field cell at approximately
100 microns. After the sample had equilibrated in the
cell, sulfur hexafluoride was added slowly to a pressure
of approximately 2.7 atmosphere. This is the minimum pres-
sure necessary for corona suppression. After a few hours
of equilibration, the spectra could be taken. This was
followed by the addition of more sulfur hexafluoride,
equilibration and so on. The maximum pressure used was
12 atmosphere, due to the decrease in signal intensity and
pressure limitations of the cell. The dc electric field
strength used was 1.00 x l05 volts/cm. Maintaining
stability and monitoring all electronic drift is essential
in obtaining reliable data.
51
Results and Discussion
The three samples studied all gave pressure-dependent
electrochromism spectra for the transitions in question.
The compounds studied were chosen primarily because they
are all in the C2v point group. This assures that the orien-
tation of the molecules is along a symmetry axis. Addi-
tionally, the choice of transitions insures that the
pressure effect is not an effect peculiar to any particular
type of transition. The aniline band, which is found at
293.8 nm has been assigned as the 1f*+T, B2 +A1 intravalent
transition (10). The polarization of this transition with
respect to the ground state dipole moment has been veri-
fied in the present studies. Similarly, the polarization
(B2 +Al) has been determined for the other two bands studied.
The 199.8 and 195.1 nm bands of cyclopentanone and acetone,
which are both the second singlet excitations of their
respective compounds, are thought to be the 3s+n Rydberg
extravalent transitions (17). This assignment has strong
support from the data of the present studies (11,12).
This work leads to the conclusion that these transitions
are both perpendicularly oriented with respect to the
ground state dipole moment. In addition, the dipole
moment changes in these excited states are sufficiently
large to support the extravalent assignment.
52
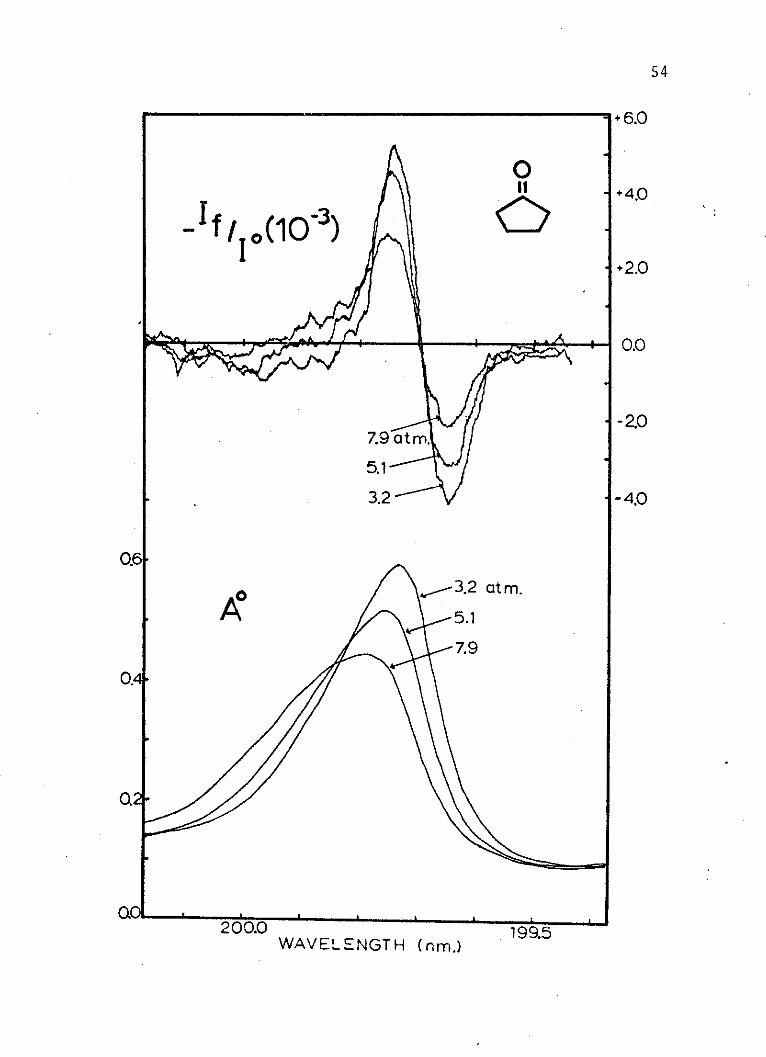
An example of the absorption and electrochromism
spectra that result at a number of solvent gas pressures
is given for the cyclopentanone 3s*-n, B2 +A 1 transition
in Figure 4. Tables I through III list the experimental
pressures and the corresponding values of the third elec-
trochromism coefficients for aniline, cyclopentanone and
acetone, respectively.
To test the Lorentz field correction, the value of
the dielectric constant must be known for each pressure.
The equation which describes this nearly linear relation
in the pressure region of interest, which is the result
of a least squares fit to National Bureau of Standards
(16) data is:
e = 2.55 x 10⁻³ P + 1.00. III-15
This equation, when substituted in equation 111-13, allows
the prediction of the electric field effect, within the
framework of the Lorentz field correction. The predicted
slope of this effect on the adjusted C3 coefficient is
8.4 x 10B4 E 0 a, where a is the dipole moment change of the
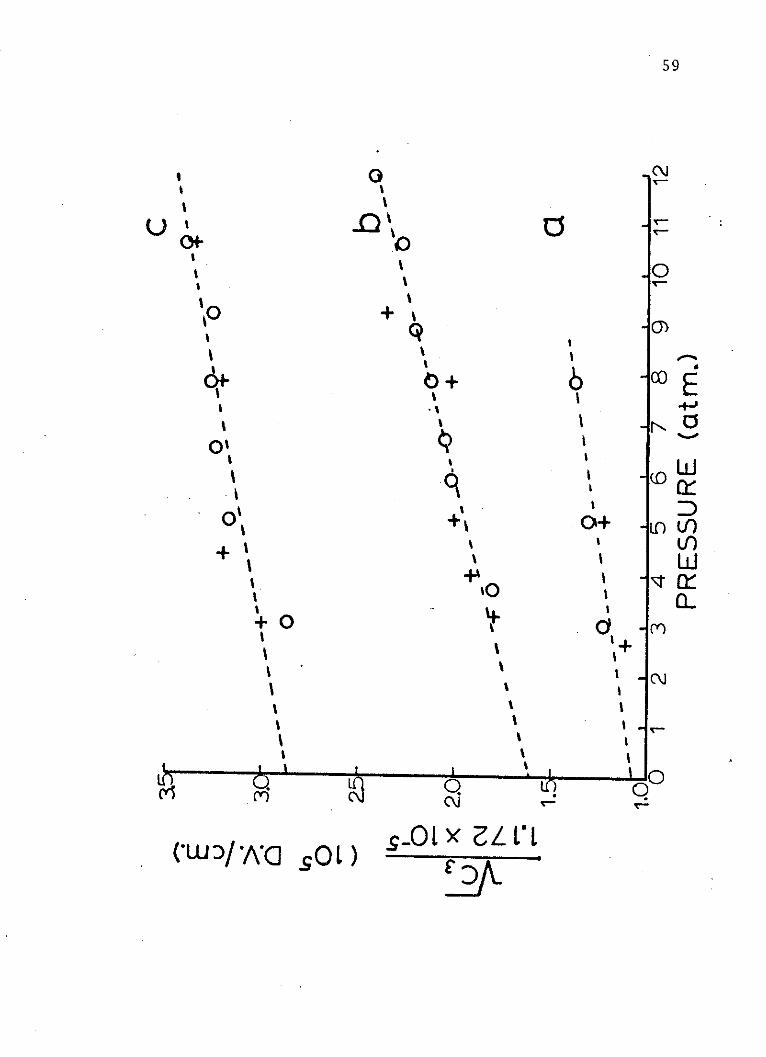
solute upon excitation. Figure 5, which is a plot of
pressure of sulfur hexafluoride against the square root
of the adjusted third electrochromism coefficients for
each compound, shows that this is not 'the case. These data
lead to the conclusion that the Lorentz field correction
53
Figure 4. An example of the effects ofincreasing sulfur hexafluoride solvent gas pressureon the absorption and electrochromism spectra of thecyclopentanone 199.8 nm band.
54
+6.0
- f 10)100+2.0
0.0
7.9 at m. -.
5,1
3.2 -4.0
0.6
A3.2 at m.
5.1
7.9
0.4
0.
200.0 1995WAVELENGTH (nm.)
.
PRESSURE
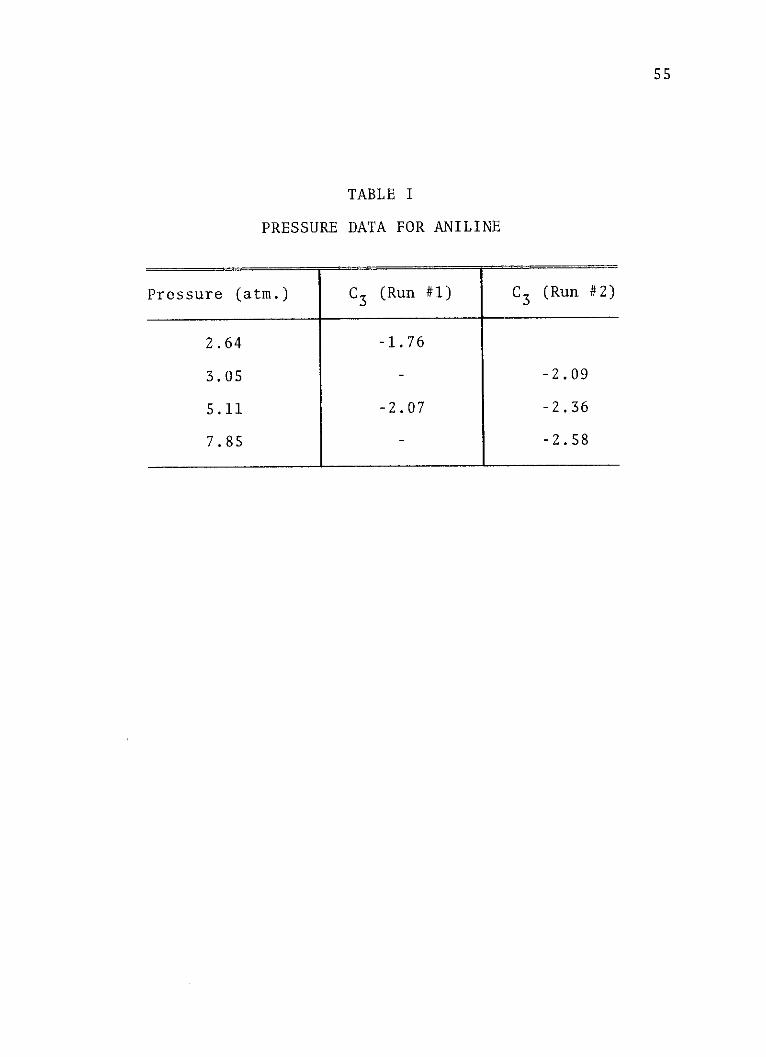
TABLE I
DATA FOR ANILINE
Pressure (atm.) C3 (Run #1) C3 (Run #2)
2.64 -1.76
3.05 - -2.09
5.11 -2.07 -2.36
7.85 - -2.58
55
56
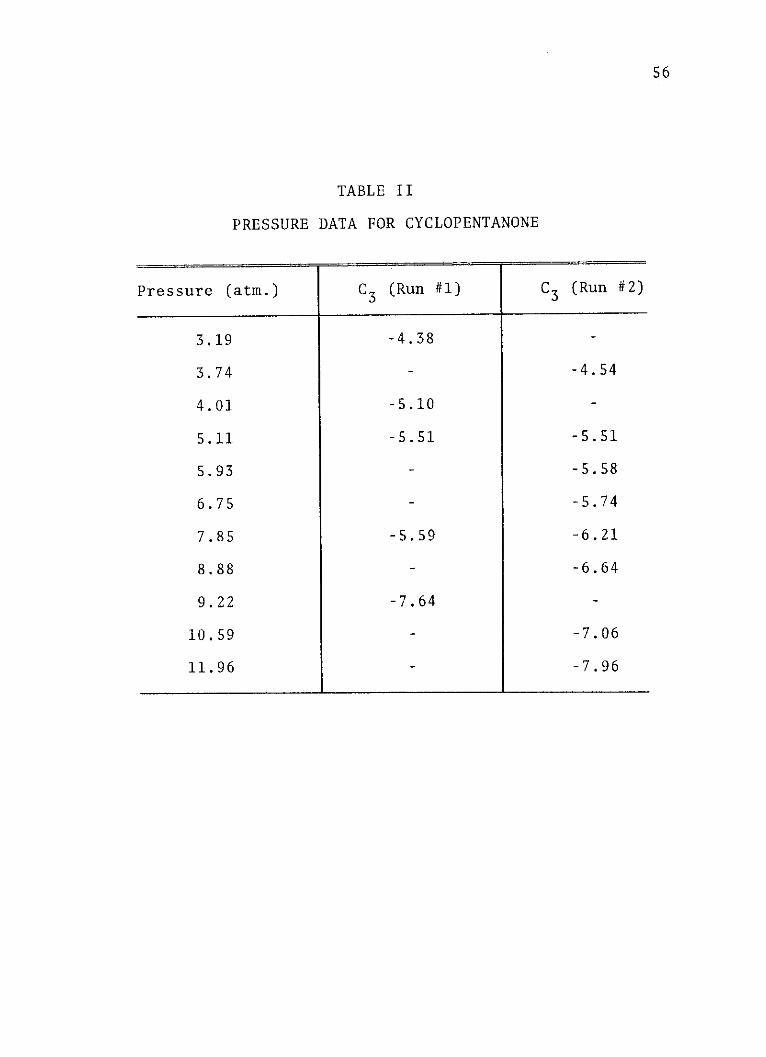
TABLE II
PRESSURE DATA FOR CYCLOPENTANONE
Pressure (atm.) C3 (Run #1) C3 (Run #2)
3.19 -4.38
3.74 - -4.54
4.01 -5.10 -
5.11 -5.51 -5.51
5.93 - -5.58
6.75 - -5.74
7.85 -5.59 -6.21
8.88 - -6.64
9.22 -7.64 -
10.59 - -7.06
11.96 - -7.96
57
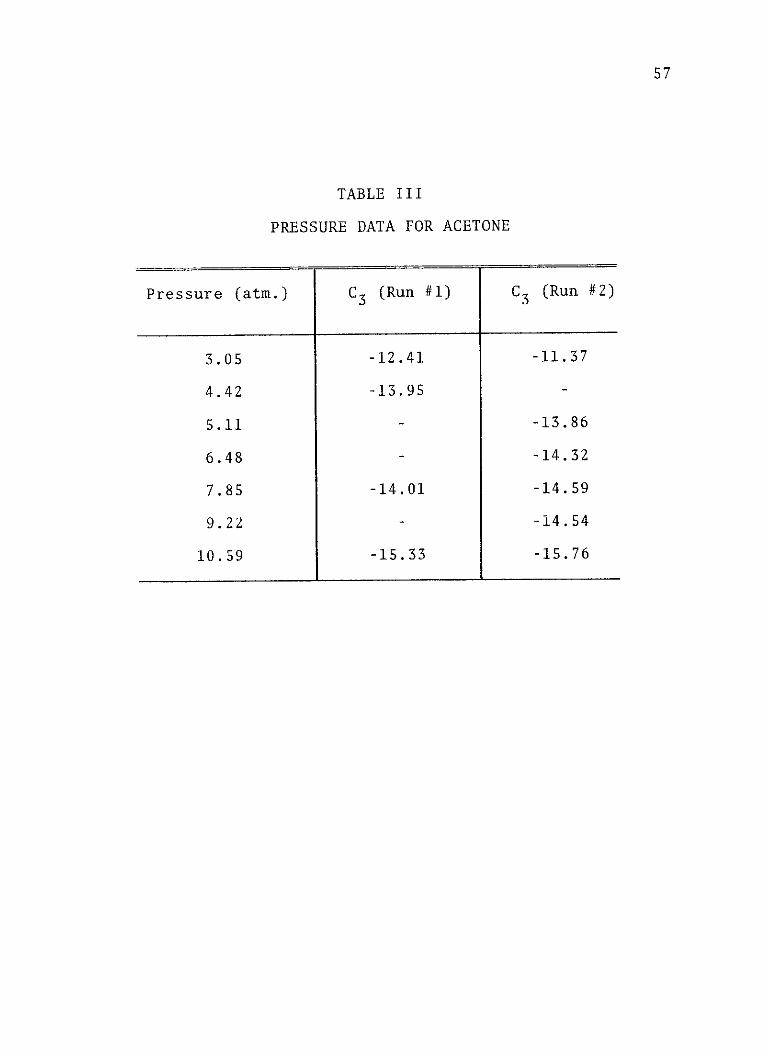
TABLE III
PRESSURE DATA FOR ACETONE
Pressure (atm.) C3 (Run #1) C3 (Run #2)
3.05 -12.41 -11.37
4.42 -13.95 -
5.11 - -13.86
6.48 - -14.32
7.85 -14.01 -14.59
9.22 - -14.54
10.59 -15.33 -15.76
58
Figure 5. A plot of the adjusted values of theC3 electrochromism coefficient (Debye-volt/cm.)versus the pressure (atmospheres) of sulfur hexa-fluoride arc suppressor gas for (a) aniline, (b)cyclopentanone and (c) acetone. Run #1 (+) andRun #2 (o).
59
0 c-
++ %C)
o + o+o.E'tI6
0O+ O+ 10(1)
I- x' uJ'
(0 1
44
C~CM
(w. y sL) Q.LxzLL'L
60
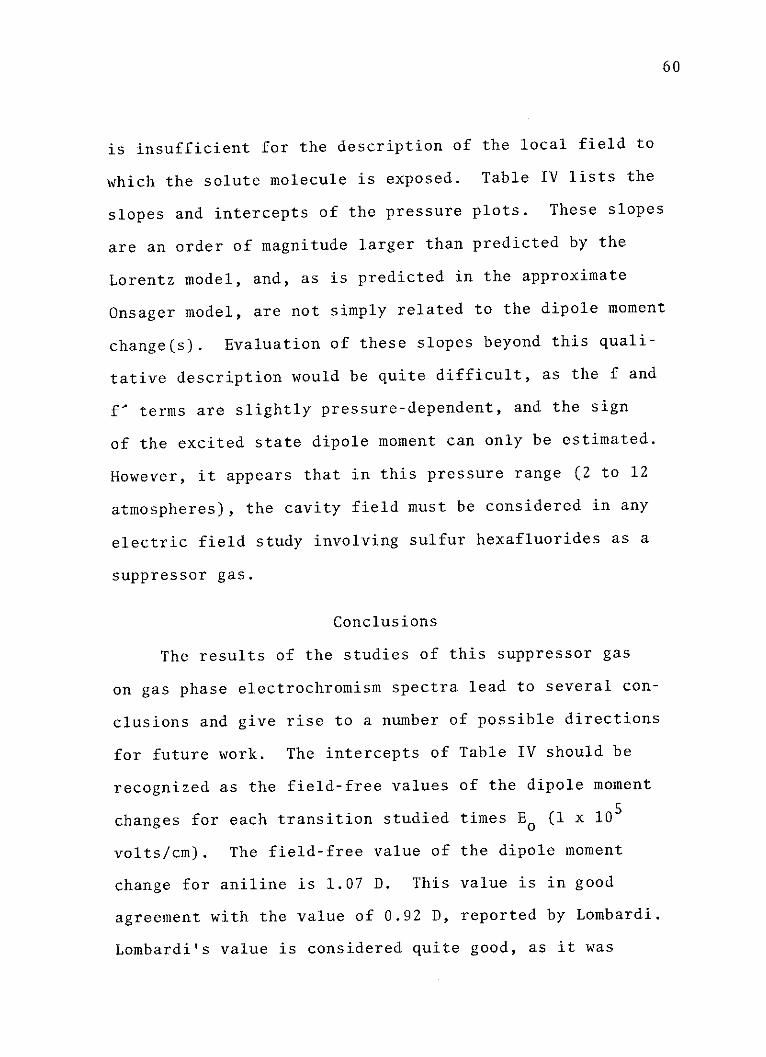
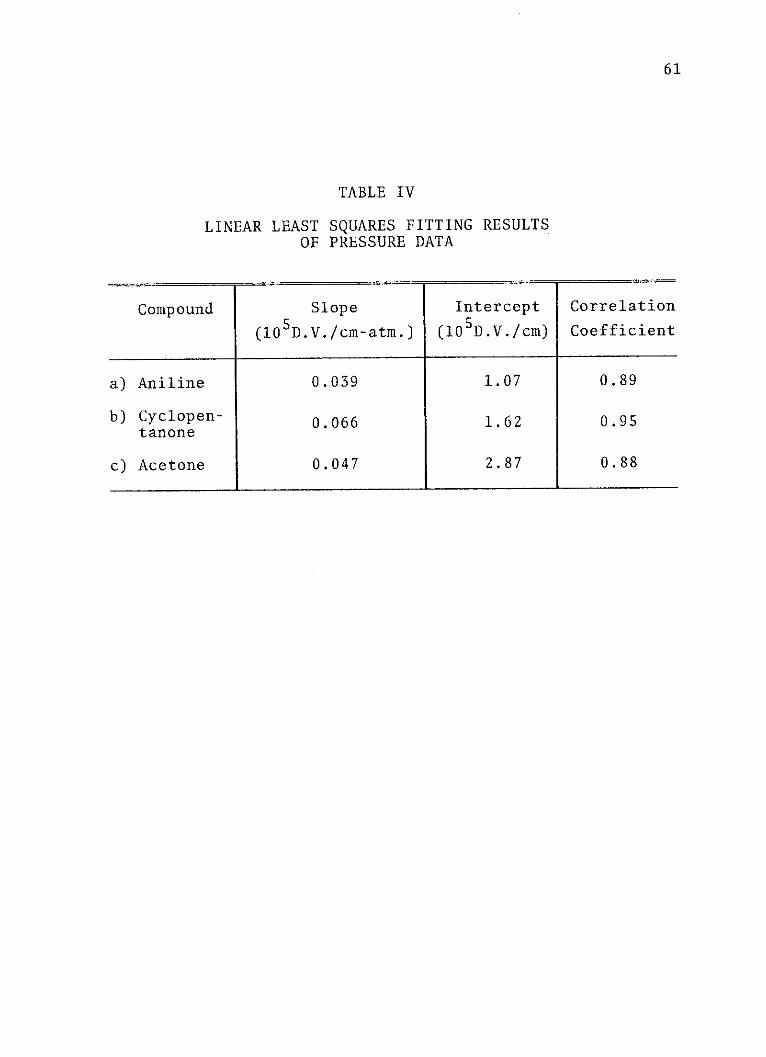
is insufficient for the description of the local field to
which the solute molecule is exposed. Table IV lists the
slopes and intercepts of the pressure plots. These slopes
are an order of magnitude larger than predicted by the
Lorentz model, and, as is predicted in the approximate
Onsager model, are not simply related to the dipole moment
change(s). Evaluation of these slopes beyond this quali-
tative description would be quite difficult, as the f and
f' terms are slightly pressure-dependent, and the sign
of the excited state dipole moment can only be estimated.
However, it appears that in this pressure range (2 to 12
atmospheres), the cavity field must be considered in any
electric field study involving sulfur hexafluorides as a
suppressor gas.
Conclusions
The results of the studies of this suppressor gas
on gas phase electrochromism spectra lead to several con-
clusions and give rise to a number of possible directions
for future work. The intercepts of Table IV should be
recognized as the field-free values of the dipole moment
changes for each transition studied times E0 (1 x 10⁵
volts/cm). The field-free value of the dipole moment
change for aniline is 1.07 D. This value is in good
agreement with the value of 0.92 D, reported by Lombardi.
Lombardi's value is considered quite good, as it was
61
TABLE IV
LINEAR LEAST SQUARES FITTING RESULTSOF PRESSURE DATA
Compound Slope Intercept Correlation
(105D.V./cm-atm.) (105D.V./cm) Coefficient
a) Aniline 0.039 1.07 0.89
b) Cyclopen- 0.066 1.62 0.95tanone
c) Acetone 0.047 2.87 0.88
62
obtained by studying the optical Stark field effect on
resolved rotational lines in this excited state. In an
earlier electrochromism study (13), a value of 1.25 D
was reported. This higher value was obtained at a solvent
gas pressure of 4.4 atmospheres. The lower value deter-
mined here is encouraging. At the time of the first
experiments, the magnitude of the solvent gas effect was
thought to be negligible. While this effect is not
extremely large (approximately 4% per atmosphere of
suppressor gas) at lower pressures, it is large enough to
warrant consideration when determining excited state
properties.
The pressure studies have indicated that, if the
true local field cannot be obtained by applying the
Lorentz correction for the relatively low pressures of
the present study, then the Lorentz correction is ques-
tionable in solution phase electric field spectroscopy.
This has also been demonstrated in studies of the shifts
in absorption maxima (9) as a function of solvent environ-
ment (solvatochromism).
The present study represents a small beginning. The
possibilities for future work include studies of different
suppressor gases and studies at higher pressures, leading
eventually to liquid phase investigations. The most
important future studies, using the pressure dependence of
63
electric field spectra, may be those investigating the
interaction forces between gases in excited states. A
parameter such as the dipole moment change would serve as
an excellent experimental probe of these interactions.
64
CHAPTER BIBLIOGRAPHY
1. Platt, J. R., J. Chem. Phys., 34, 862 (1962).
2. Yamaoka, Kiwamu and Charney, Elliot, J. Amer. Chem.Soc., 94, 8963 (1972).
3. Liptay, W., "Dipole Moments and Polarizabilities ofMolecules in Excited States," Excited States,Vol. I, edited by C. Lim (New York, 1974), pp.129-229.
4. Liptay, W., Z. Naturforsch., 20a, 272 (1965).
5. Labhart, H., "Electrochromism," Advances in ChemicalPhysics, Vol. XIII, edited by I. Prigogine (NewYork, 1967), pp. 179-204.
6. Debye, P., Physik. Z., 13, 97 (1912).
7. Onsager, L., J. Amer. Chem. Soc., 58, 1486 (1936).
8. Liptay, W., Ber. Bunsenges. Phys. Chem., 80, 207 (1976).
9. Liptay, W., Angew. Chem. Internat. Edit., 8, 177 (1969).
10. Lombardi, J. R., J. Chem. Phys., 50, 3780 (1969).
11. Causley, G. C. and Russell, B. R., to be published.
12. Causley, G. C. and Russell, B. R., to be published.
13. Causley, G. C., Scott, John D. and Russell, B. R., Rev.Sci. Instrum., 48, 264 (1977).
14. Causley, G. C. and Russell, B. R., J. Chem. Phys.,
in press.
15. Iverson, A. A. and Russell, B. R., Spectrochim. Acta,Part A, 29, 715 (1973).
16. Birnbaum, G. and Maryott, A. A., JANAF ThermochemicalTables NSRDS-NBS, No. 37, (Washington, 1971).
17. Robin, M. B., "Higher Excited States of PolyatomicMolecules", Vol. 2, Academic Press, New York,
N. Y., 1974, pp. 75-106.
CHAPTER IV
ELECTRIC FIELD SPECTROSCOPY OF SOME SMALL
CYCLIC KETONES
To aid in the assignment and characterization of the
transition to the second excited single state of cyclo-
butanone, cyclopentanone, cyclohexanone and cycloheptanone,
the electric field spectra have been obtained for the 0-0
component of these absorptions which occur at 203.1, 199.8,
197.3, and 195.9 nm, respectively,. in the vacuum ultra-
violet spectra region. The spectra of these compounds
have been of interest in the literature over the years
(1-5), partially because of the importance of the ketone
functional group, and also because of the interesting
anomalies which are associated with their spectroscopy.
The second singlet transition is, in itself, one of these
anomalies. The assignment of this transition in each
compound is not clear. The assignments have been numerous
(6), but recently, as in the case of the similar band
in formaldehyde (7), the assignment is thought to be
B2+Al, where the nonbonding b2 electrons are excited to
an orbital of a1 symmetry. The nature of the a1 orbital
is the major question in this assignment. The a*(C-0)
orbital, or the 3sa1 molecular Rydberg orbital, are two
65
66
likely possibilities. A complete discussion of the cur-
rently available data regarding these transitions has
been published (6). The purpose of this study is to
present new data for this excited state of these compounds
in the gas phase, using the previously described methods
of random and zero degree polarized light electrochromism,
and electric linear dichroism spectroscopy. The excited
state parameters which are of particular importance are
the polarization of the transition moment with respect to
the ground state dipole moment, the excited state dipole
moment change, the amount (if any) of angular shift of the
excited state dipole with respect to the ground state
moment, and the excited state polarizability. As will be
shown, the polarization and dipole moment of the excited
state are determined readily in this study; however, the
angles between the various moments and the polarizability
are more difficult quantities to obtain. The primary
reason for this is uncertainty in the experimental coeffi-
cients that are related to these parameters, but attempts
at determining these quantities have met with limited
success.
The absorptions in question are shown in Figure 6.
This figure shows the entire envelope for these bands,
but the current discussion is centered about the 0-0
component only. Table V is the compilation of pertinent
67
Figure i. The absorption spectra of the second
singlet of cyclobutanone, cyclopentanone, cyclo-hexanone, and cycloheptanone.
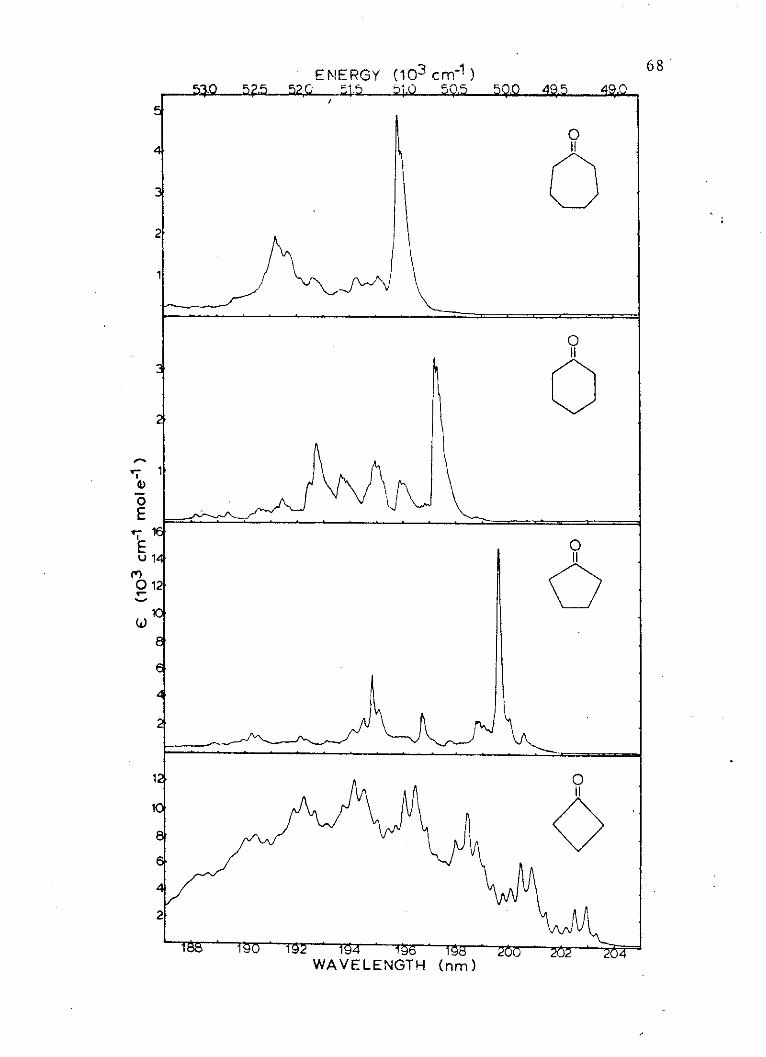
ENERGY (103 cm-1) 68530 52.5 52,0 51.5 5 . 5 , 4 4.
04
2
1
02
u1 O
m(12
10
21
18 ' 190 192 '194 196 ' 198 '200 2 2WAVELENGTH (nm)
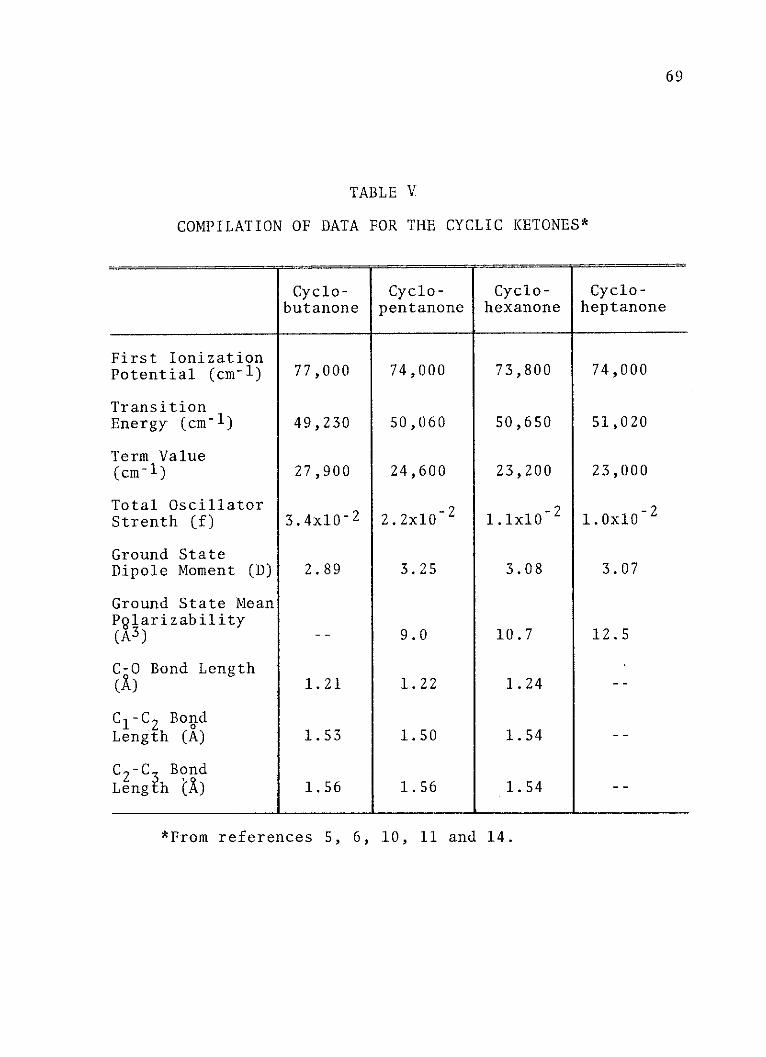
69
TABLE V
COMPILATION OF DATA FOR THE CYCLIC KETONES*
Cyclo- Cyclo- Cyclo- Cyclo-butanone pentanone hexanone heptanone
First IonizationPotential (cm-1 ) 77,000 74,000 73,800 74,000
TransitionEnergy (cm~ 1 ) 49,230 50,060 50,650 51,020
Term Value(cm-1) 27,900 24,600 23,200 23,000
Total Oscillator -2-2 -2Strenth (f) 3.4x10⁻² 2.2x10 2 1.1x10 1.0x10
Ground StateDipole Moment (D) 2.89 3.25 3.08 3.07
Ground State MeanPglarizability(A 3 ) -- 9.0 10.7 12.5
C-0 Bond Length(X) 1.21 1.22 1.24 --
C1 -C2 BondLength (A) 1.53 1.50 1.54 --
C2 -C3 BondLength () 1.56 1.56 1.54 --
*From references 5, 6, 10, 11 and 14.
70
data for this transition in each compound, excusing the
results from the electric field studies. The results of
the current study, when added to the existing information
for this transition, generally supports the B2+A1,
3sa1 --nb 2 molecular Rydberg assignment. In addition, there
is a great deal of evidence suggesting a nearby state of
B2 symmetry, which gives rise to large perturbations in
two of the three experimentally determined coefficients.
Finally, there are no data contained herein that conflict
with the previously discussed assignment of the second singlet
of formaldehyde, which appears to have a similar origin (7).
Experimental
The spectrometer in the various experimental configur-
ations gave the three types of spectra needed for each
compound, although the electric linear dichroism of cyclo-
butanone did not give results that could be used quanti-
tatively due to a poor signal-to-noise ratio. The specific
uncertainties in each measurement will be given in the
discussion section. The field strengths employed for each
type of spectroscopy vary. Both types of electrochromism
spectra were obtained with a modulated electric field
intensity of 200,000 volts/cm (peak-to-peak). The electric
linear dichroism spectra were obtained with a static field
of 150,000 volts/cm. The upper limits of electric field

71
strength were determined by testing the linearity of the
spectral results with respect to the electric field
squared (E2
It has been shown previously that the intensity of the
electric field effect is somewhat dependent on the amount
of sulfur hexafluoride arc suppressor gas that is present
in the cell (8). In order to maintain continuity for the
different spectra, all data reported here were obtained
at a suppressor gas pressure of 3.05 atmospheres. This is
the minimum amount of suppressor gas necessary to eliminate
corona discharge in the cell. This pressure gives rise to
small errors in the values of the evaluated coefficients,
but, in general, these errors are small compared to the
overall uncertainty in the experiments.
The samples were obtained commercially at the highest
purity available. Additionally, they were purified by a
vacuum distillation technique which has been described
previously in the literature (9).
Results
The general approach is to obtain the six possible
coefficients (C. and C' for i = 1 to 3 from Appendix A).1 1
With the absorption curves and electric field spectra,
a least squares fit gives a set of experimental coeffi-
cients for each type of effect studied. Then, taking
these experimental coefficients and solving the systems of
72
simultaneous equations that results from considering them
in pairs, yields the six needed coefficients. In theory,
only two of three possible spectral studies are needed to
generate these coefficients, but having all three types of
spectra allows multiple solutions, which makes it possible
to determine standard deviations and uncertainty between
the different experiments. This method was employed except
in the case of cyclobutanone. Whenever a signal-to-noise
ratio of less than 3 was obtained for any given spectrum,
the calculated coefficients were considered only in a
qualitative manner. This is the case for the cyclobutanone
electric linear dichroism spectrum. Coefficients from
this spectrum, therefore, could not be used in the multiple
solution method used for the other compounds. In any case,
a set of C. and Ci coefficients can still be generated, but
they are less reliable. In obtaining these various coeffi-
cients, complex terms containing a multitude of ground and
excited state parameters are simplified, and the desired
excited state properties may be calculated. In all cases,
since excited state geometries are not known, the general
form of the equations for the theoretical coefficients
were used (See Appendix A).
Cyclobutanone
An example of the random polarized light electro-
chromism spectrum of 0-0 component of the second singlet
73
of cyclobutanone is given in Figure 7. The zero degree
polarized light electrochromism spectrum is similar in
sign, but weaker than the random polarized light spectrum.
Using the values of the experimental coefficients (Cxp)
for the two types of electrochromism (Table VI), three sets
of simultaneous equations result. These equations are
given here with all constants multiplied into the expressions
so as to give C1 and C' as unitless quantities, C2 and C'
-lan1 -2 2in cm ,and C3 and C3 in cm . The value of (3cos 2-l)
is 0.5 for random polarized light electrochromism and
2.0 for the zero degree polarized light spectra. This
results is equations of the general form:
-2C. - C = Ciexp (random)1 1 1
-2C. - 4C' = Cixp (zero degree)1 1 1
Solution of the sets of equations gives the values for the
six coefficients shown in Table VII.
With the values of C3 and C' from Table VII, and
equations A-6 and A-7 from Appendix A, the absolute value
of the change in dipole moment (a) is calculated to be
1.44 0.03 Debye and the value of the angle between this
change and the transition moment is caulcuated as either
770 or 1030* 5*. As will be shown in a later section,
this calculated angle is clear evidence in favor of an
B+A perpendicular transition with respect to the ground
74
Figure 7. Examples of the absorption (A* and
and random polarized light electrochromism (-I PE/1 o)
spectra of the 0-0 component of the second singletof cyclobutanone.
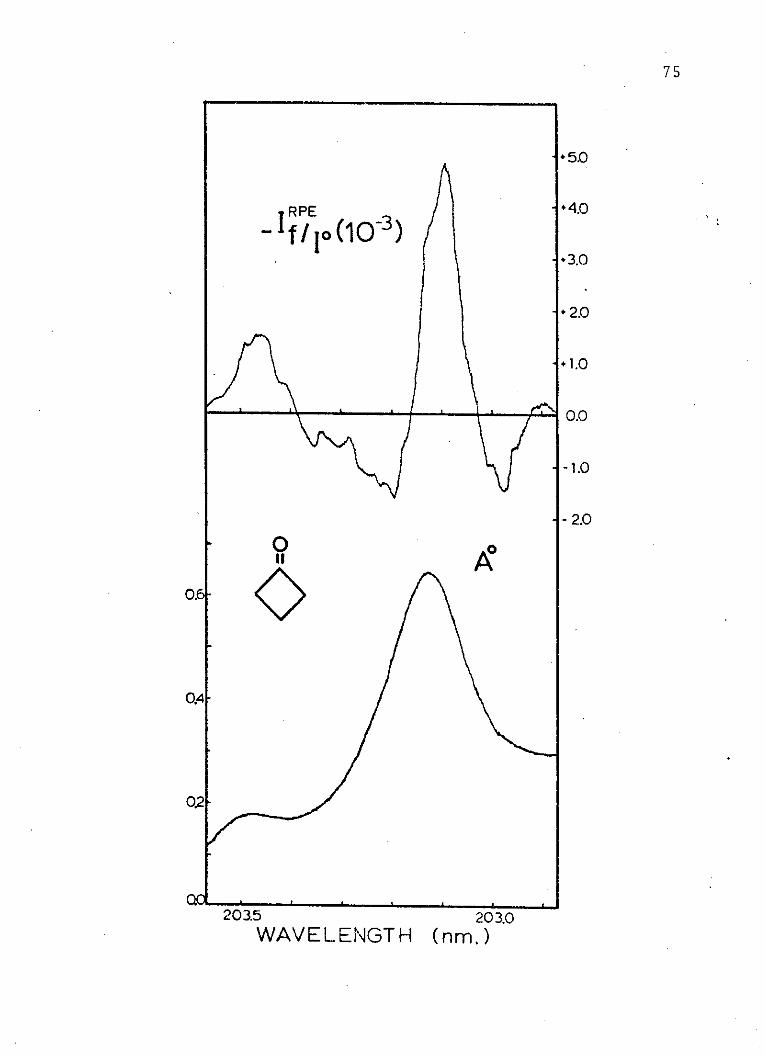
PE
/Io (10~ ) ,
r
9 o
r
r
M
203.5WAVELENGTH
20 3.0(nm.)
75
+5.0
+4.0
.3.0
+ 2.0
+1.0
0.0
-1.0
-2.0
0.6
0,4
02
Qa
L _ ia l 1 L I
A I\ w
IR
N
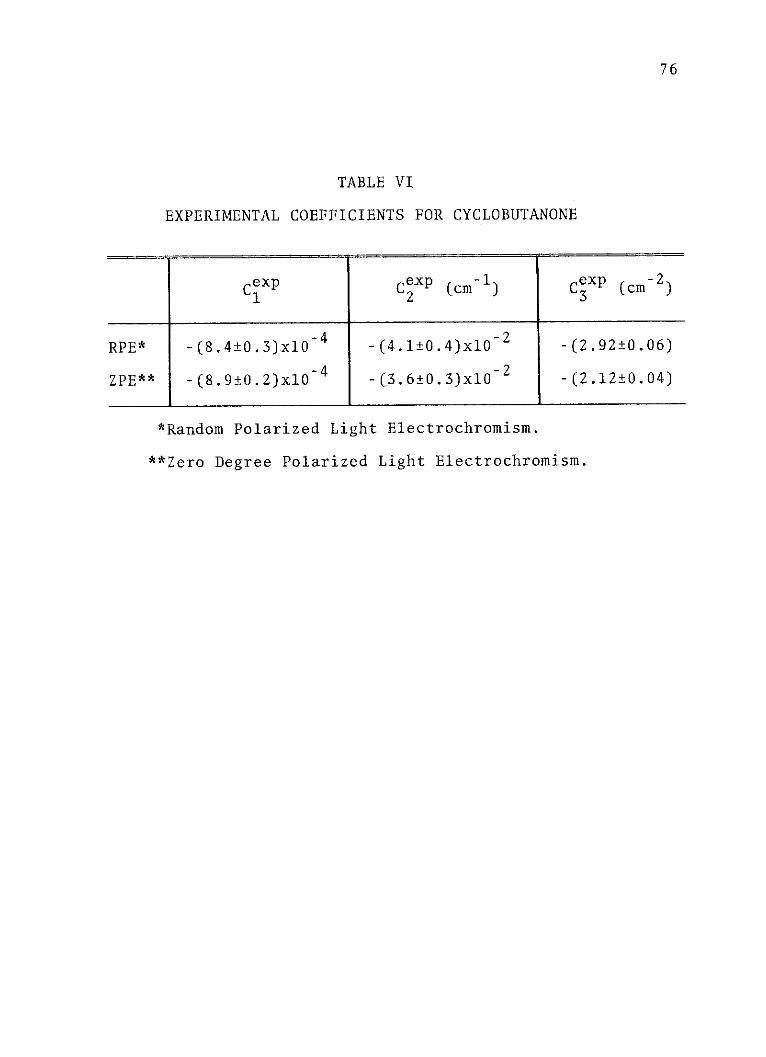
76
TABLE VI
EXPERIMENTAL COEFFICIENTS FOR CYCLOBUTANONE
Cexp C E(cm-1) )C (cm -2
RPE* -(8.4 0.3)x10-4 -(4.1 0.4)x10-2 -(2.92 0.06)
ZPE** -(8.9 0.2)x104 -(3.6 0.3)x10-2 -(2.12 0.04)
*Random Polarized Light Electrochromism.
**Zero Degree Polarized Light Electrochromism.
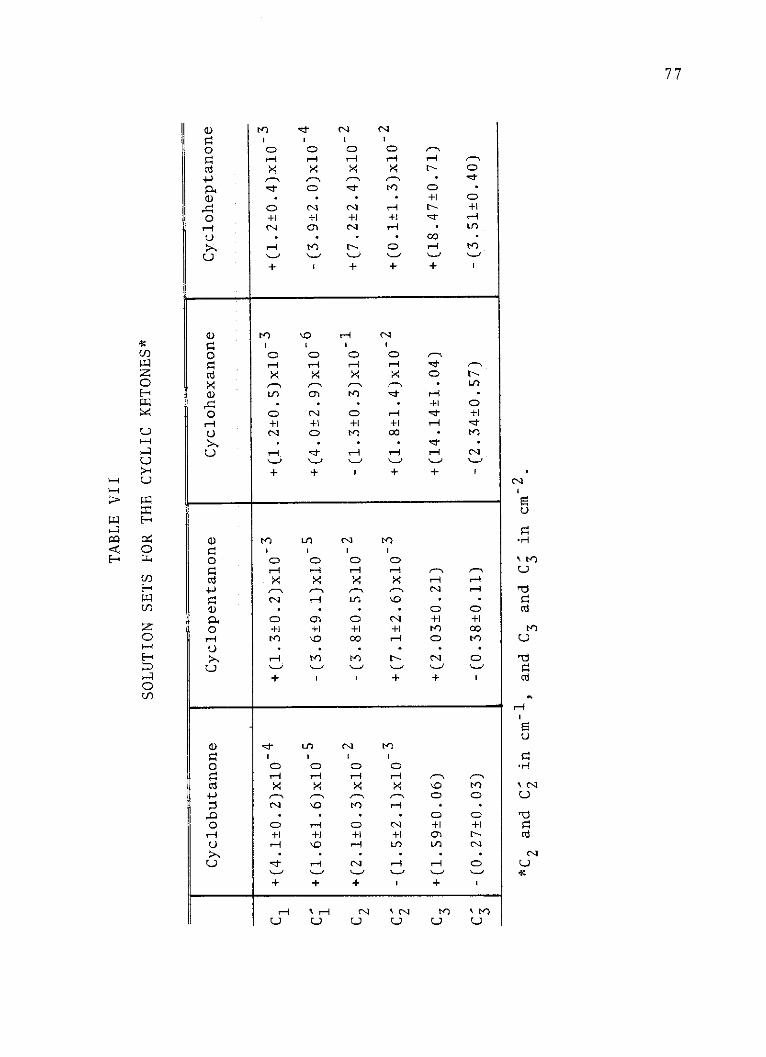
Mn d NC) O OC
4 r, r1
+1 +1 +1
+ 1 +
Mi-8
o+1
+"1i-HCl
+!
r+
+
i-H
+1+
0
L a+1'-0
t -H
+1
i-H
C)
+1
08o
.)
0o
+1
M O8- I- +l
* +1 0S+1+1 'i:j i-
+ +
-+1
0+ - _I
N-H *
_ Cl3 iCH
C +1 +1+1 M 00
r- Cl 0SN O
+ + 1
41 d L1 ) N M
o O O O
S8 8 8 8 \ te+. r, r-, r,-4 r, 4
,.O . \O 1" r 1
o O O N +1 +1r4 +1 +1 +1 +1 0 t-U r' -{ r\ Lr tj N
U 'l rH r- 4
+ + + I +
U UUU U U
77
a)
ar4
0i-HU
__________ .4
a)
0
C
0
U
U
______-__-___- --_
a)0
0V-U
U
C!)
z0H
U
U
~H U
w H
*~~ 0H w
H
z)
0
H
0U)
E
U
U
U
it-
U
N
U
rdUcd
U
78
state dipole moment. Additional support for the assignment
of this transition as perpendicular is found in the quali-
tative results from analysis of the electric linear dichro-
ism spectrum, where the value of C expis calculated to be
positive in sign. The positive value of C3 (+0.2) from
this spectrum can only be obtained for the values of ma.
which approach zero, which corresponds to angles approaching
90* between the transition moment and the dipole moment
change.
With the calculated values of C1 and C2, the change
in polarizability, the R(1) direct-field-dependent
perturbation term, and the sign of the dipole moment change
can be determined.
C = 1.46 R)p + 6.03 x 10⁴ S(l)1g
C2 = -7.33 x 10⁻³ a - 4.6 x 10⁴ b
-3.03 x 10² R al)
Two essential assumptions must be made at this point in
order to obtain these parameters. The vector quantities
must be considered as scalars and the value of S () must
be assumed small compared to R(1). The first assumption
is correct if the changes in dipole moment lie principally
on the C2 axis. Based on the near C2 v symmetry of this
molecule (10), this is not unreasonable. Since S(1) is a
79
second order perturbation term, it is thought to be small
compared to the first order term and is neglected. Solving
for R(1 from C1 , a value of 9.7 x 10⁻⁵ esu'cm/erg is
obtained. Substitution of this value into the expression
for C2 gives:
- 5.1 x 10⁻² a - 4.6 x 10⁴ b = 2.1 x 10⁻²
With this equation, the question of the sign of a is clari-
fied. If the dipole moment change (a = g - p ) is
negative, a value of the mean polarizability change
(b = a g - a ) of +120 A3 is calculated. This is notgex
reasonable, as it implies a negative mean polarizability03
in the excited state (a < 9.0 A ) (11). Conversely,
a positive dipole moment change of 1.44 Debye gives a
mean polarizability change of -200 A3. This value, although
quite large, has the expected sign. This approach used
here to evaluate the experimental parameters for cyclo-
butanone will be employed similarly for the other compounds
of the series.
Cyclopentanone
The electric field spectra of the second singlet
excitation in cyclopentanone is more intense than that of
cyclobutanone. Examples of electrochromism and electric
linear dichroism spectra are given in Figure 8. Since the
electric linear dichroism spectra of this compound have a
80
Figure 8. Examples of the absorption (A*),random polarized light electrochromism (-IPE/Io)
and electric linear dichroism CID/ 10) spectra
of the 0-0 component of the second singlet ofcyclopentanone.
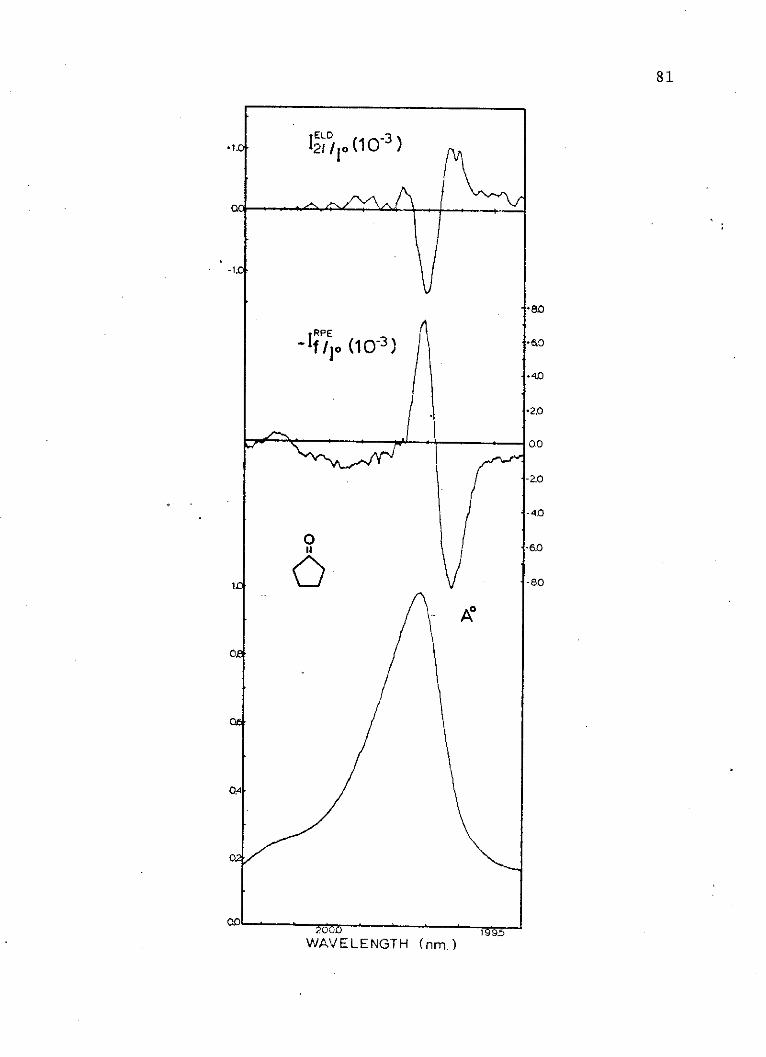
kq./
ELDf~ /oo (10~-)
PE
(
-%1/o (10~3);
0
l
A0
WAVELENGTH (nm.)
.of
81
1.0,
.,r -
_
/'1 N .
y
s 1
vv, .
1 995
I kv-...rvI
"8.
*60
+4.0
+2.0
0.0
-2.0
-4.0
-6.0
-8.0
82
higher signal-to-noise ratio and give consistent values
of experimental coefficients, they will be included in the
determination of C. and C'. Table VIII'lists all the averaged1 1
experimental coefficients. Inclusion of this data gives
three combinations of three pairs of simultaneous equations.
The average values of C. and Ci that are determined from
this solution set are given in Table VII. Beginning with
C3 and C', the absolute value of a is found to be 1.63 +
0.09 Debye, and the angle between dipole moment change and
transition moment is found to be 81* 12* or 980 +120,
depending on the sign of mha. As in cyclobutanone, this
data supports a perpendicular polarization for the tran-
sition moment with respect to the ground state dipole
moment, and suggests that the ring may be puckered slightly
in the excited state. As in the case of cyclobutanone,
the value of R can be obtained from C1 and substitution
into C2 gives the mean polarizability change. These values
are 2.7 x 10 esu-cm/erg and -290 180 A3, respectively.
Cyclohexanone and Cycloheptanone
The results for the last two compounds in the series
will be given together as their spectra are similar, and
the method for handling the data is the same in both
cases. There is a large increase in the electric field
effect in these two compounds compared to the smaller cyclic
ketones. This is partly due to a large increase in dipole
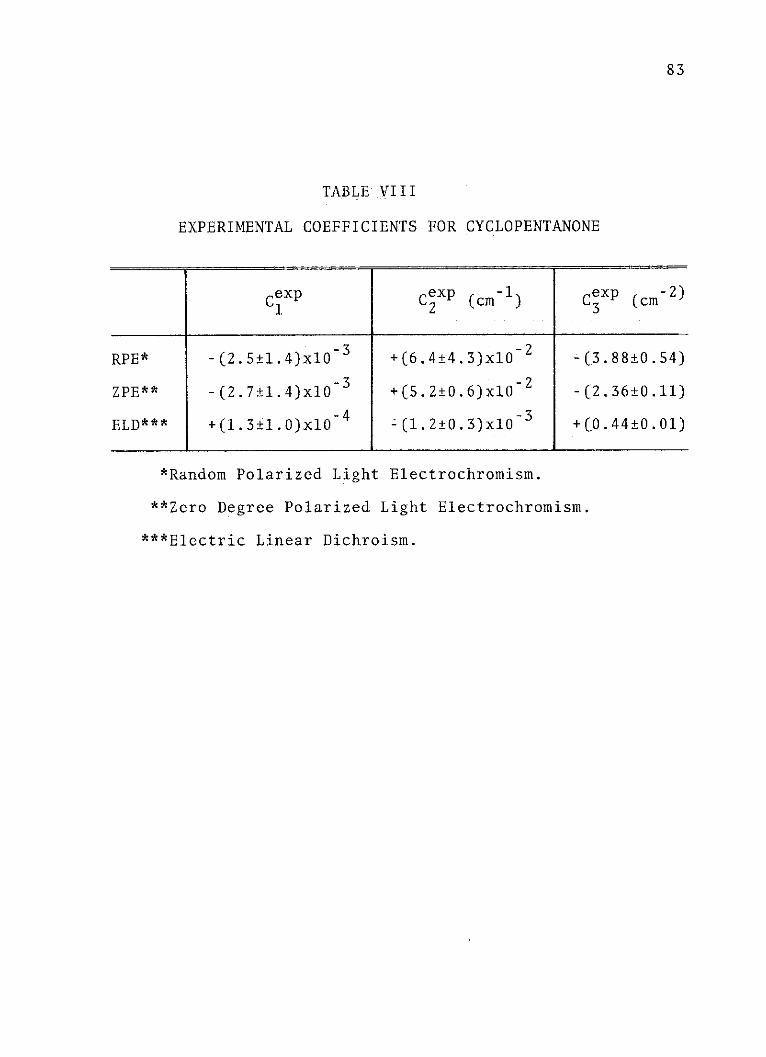
83
TABLE VIII
EXPERIMENTAL COEFFICIENTS FOR CYCLOPENTANONE
Cexp C XP (cm1 ) C XP (cm-2 )
RPE* -(2.5 1.4)x10- 3 +(6.4 4.3)x10-2 -(3.88 0.54)
ZPE** -(2.7 1.4)x10-3 +(5.2 0.6)x10-2 -(2.36 0.11)
ELD*** +(1.3 1.0)x10~- 4 (1.2 O.3)x1O-3 +(0.44 0.01)
*Random Polarized Light Electrochromism.
**Zero Degree Polarized Light Electrochromism.
***Electric Linear Dichroism.
84
moment change. Examples of electrochromism and electric
linear dichroism spectra for cyclohexanone and cyclo-
pentanone are given in Figures 9 and 10. The zero degree
polarized light electrochromism spectra are not shown here,
because they are very similar to the random polarized light
spectra, only reduced in intensity. Tables IX and X give
the average experimental coefficients that will be used in
the solution set, and Table III gives the results of these
calculations. The values of Ci and Ci, used as they were
previously, gives values of a, b, R amd the angle between
transition moment and dipole moment change for each com-
pound. These values, along with the results for cyclo-
butanone and cyclopentanone, are compiled in Table XI.
Discussion and Conclusions
The analysis of the data gives rise to a number of
observations for this series of compounds and for the
carbonyl chromophore in general. One of the most important
of these is the fact that this transition in all of the
compounds appears to be polarized perpendicularly with
respect to the ground state dipole moment. The angles
between the dipole moment change and the transition moment
are all very near 90 . This fact gives strong support for
an B+A type transition. The relation of this angle to the
direction of the transition moment is clear cut for mole-
cules that have C2 v symmetry, where the net electric dipole

85
Figure 9. Examples of the absorption (A*),random polarized light electrochromism (-IRE /jo)and electric linear dichroism (ID/io) spectra ofthe 0-0 component of the second singlet of cyclo-hexanone.
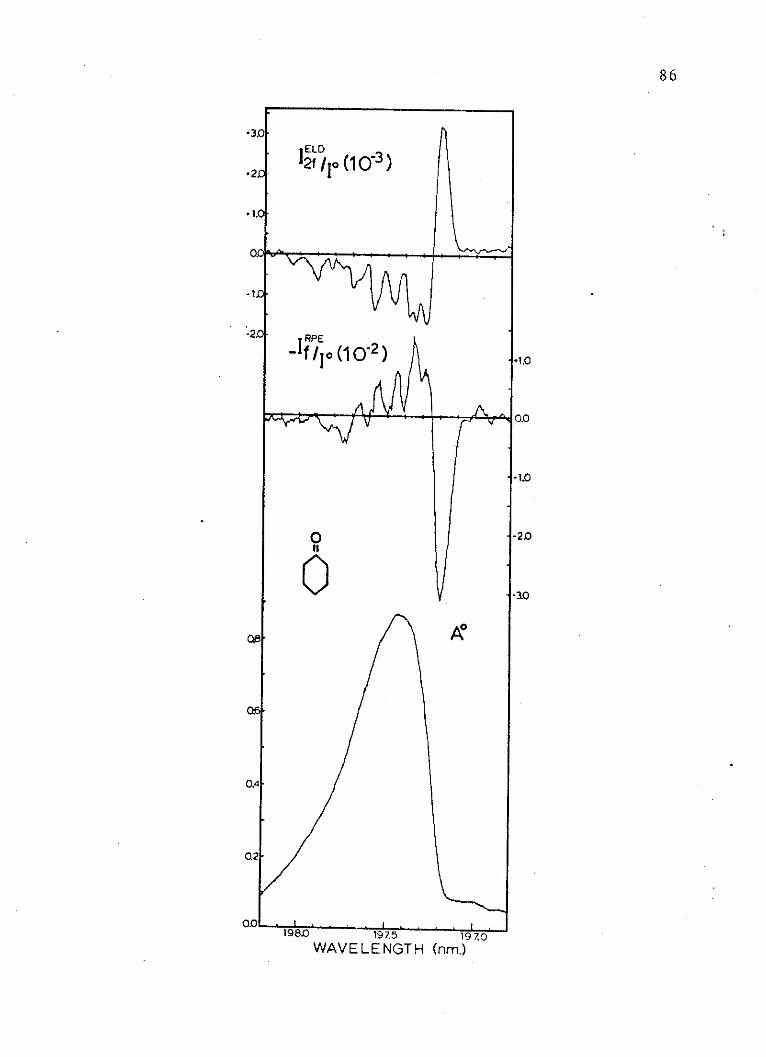
VW '.
0
v
A*
198 . 197.5 197.0WAVELENGTH (nm.)
86
-1.0
-30
0.6
Q2
" A ELD
2f / 1o(10~)
loc
-2. RPE
- f / o(10-2)~
87
Figure 10. Examples of the absorption (A ),random polarized light electrochromism (-igPE/iQ)
and electric linear dichroism (JED/IQ) spectra ofthe 0-0 component of the second singlet of cyclo-heptanone.
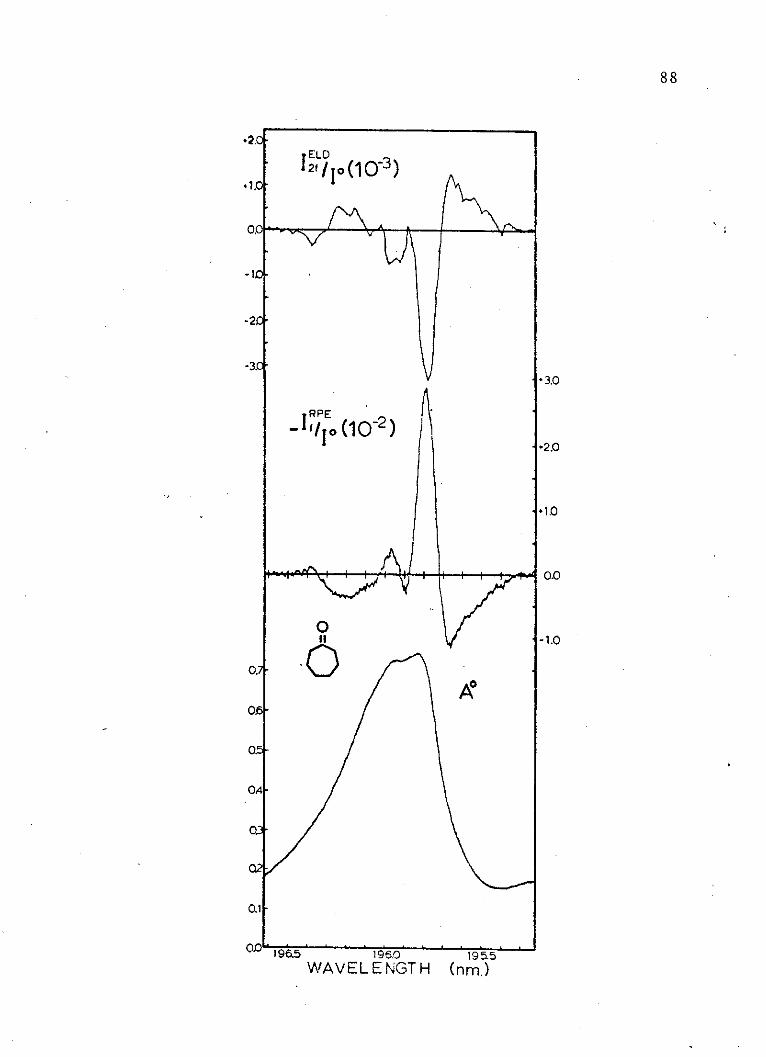
tEL D
f0\A
-2)
1AI_.11
-U
Q.1-
19WL0WAVELENGTH
.2.0
* 1.0
88
-3.+3.0
+2.0
;1.0
0.0
-1.0
o.7
01
OA
0.
Q2
0.o -195.5
(nm.)Nw~ 1965
- . , x r +._ r.
-V VF '
I.-
-- f--4 -- --- __S_-1-- i - L -i -
PrTo "
1L Alk K , e t I
T'rTF '_7__'
N tlNk
-l/o (1
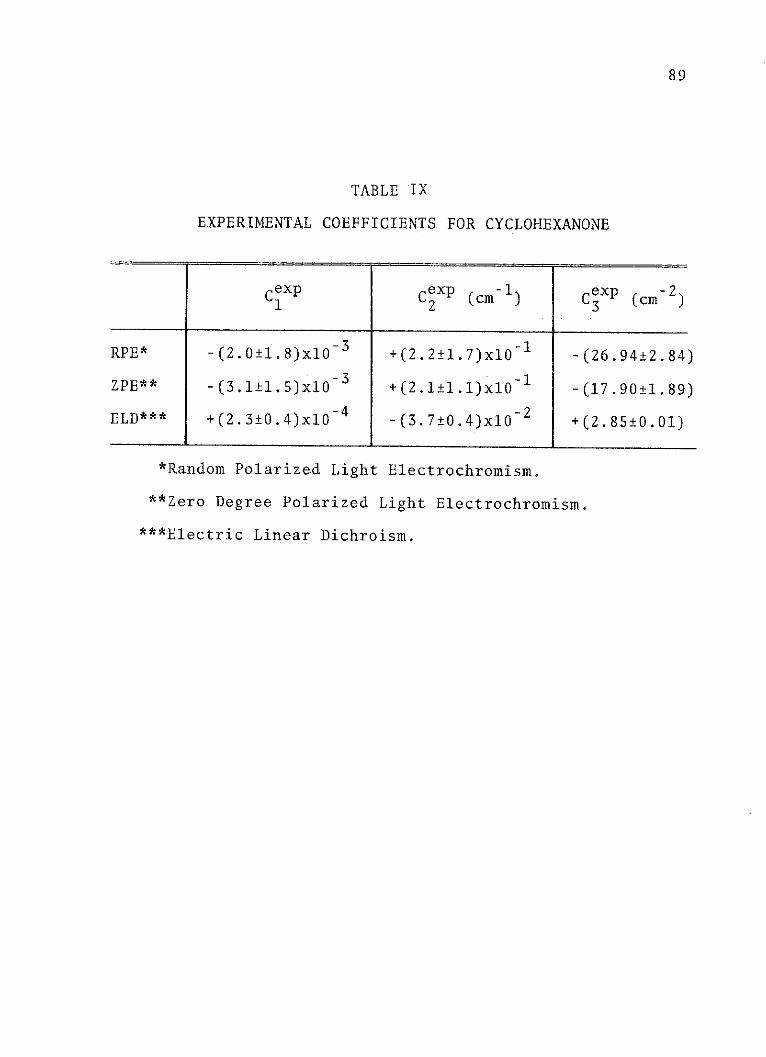
89
TABLE IX
EXPERIMENTAL COEFFICIENTS FOR CYCLOHEXANONE
Ci C (cm-l) C3xp (cm2)
RPE* -(2.0 1.8)x10-3 +(2.2 1.7)x10 1 -(26.94 2.84)
ZPE** -(3.1 1.5)x10- 3 +(2.1 1.1)x10 -(17.90 1.89)
ELD*** +(2.3 0.4)x10-4 -(3.7 0.4)x10-2 +(2.85 0.01)
*Random Polarized Light Electrochromism.
**Zero Degree Polarized Light Electrochromism.
***Electric Linear Dichroism.

90
TABLE X
EXPERIMENTAL COEFFICIENTS FOR CYCLOHEPTANONE
CX C (m-1) CXP (cm-2
RPE* -(1.7 1.9)x10 3 -(1.2 1.1)x10O -(34.12 4.16)
ZPE** -(1.2 0.5)x10 3 - (1.7 0.4)x10O -(22.22 1.20)
ELD*** +(7.2 3.6)x104 +(9.9 7.0)x10-3 +(4.66 0.73)
*Random Polarized Light Electrochromism.
**Zero Degree Polarized Light Electrochromism.
***Electric Linear Dichroism.
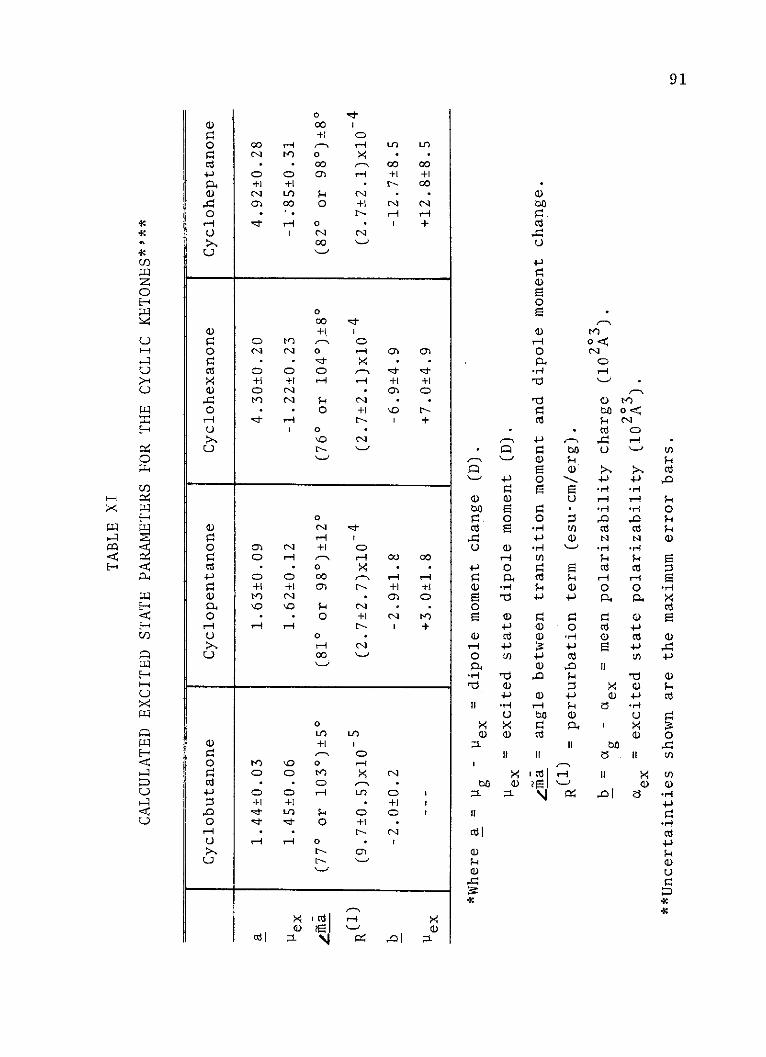
000
+100 rH -N M 0
.- 000 0 0)+1 +1
L L(S 00 0
d- r-. 0I N
00
000+1,
) M _
N N 0
+) +Claa o 0
" 0
N-
C)
_ 00 00i- +1 +1" c- 00
N "+1 N N
N- i +-
C)i- On) as8 - -
- +1 +1- a o
N -+1 0 t-N- I +
vl
-IC
IC
zH
U
CQ
C-)
I-
U
U
H
C
HW WJ.
HH
H
H
H
U-
U-
0
07 N +1
" s 0C) c; 00+1 +1 C-tM N
S * 0
i-H00
0In)+1
V) 0 0O Mo
* . C)0" C;) i-H+1 +1dj- Ifd- ter- 0
r-1 -
N-
C)i-H 00 008 . -
N- +1 +1- 0) 0
N - -+1 N 1-"N- I +
Nl
IC) OC)
O +1
C) C
+1 ++- -l
- I0OZ
cdI xc ji-H nf
a)0
0
U
C)
91
-4.
a)0
a)0
U
4.i
baC
a
ai-H
0
4d
0
0PH
ld
-p
rd
U)
-p
a)
-p
a)
+)
i-H
00
II
9
0
c
11
o
4) Mb o T
c o
i-H i-H
cd c~N N
o o
O )cd 4-
cm -) cd. 4)
8 a
-HU
I 8
b a )Z3 It
-4
a)
00
U
-p)
0E
a)
-H
a)
.
b
U
Ti)9
a)
a)
0-1
-p
a)
II
a)0
9
0U.HU
a)0
O0U
L-
4--
0
-H
a)
-p
-p0
a
). ,
UH
0E
E
C3
0
a)8
a)
-p
a)
0U)
a)a
b4 4) 2 v
|S4it
a)
lit
8 )
-p
'H
-)
U
4Ci
92
moment must lie along a symmetry axis. For molecules in
this or higher order point groups, the angle in question
can only be 0* for a parallel transition or 900 for a
perpendicular transition. For the lower point groups,
however, the net dipole moment may be moved away from its
equilibrium position in the ground state upon excitation,
and give misleading results. In the present work, unless
the molecules are badly folded in the excited state, this
is not the case. In the excited state in question, the
dipole moment is thought to lie along an axis very near
the ground dipole moment, with the transition polarized
nearly perpendicularly to this axis. The small deviations
from the 90 extreme for these perpendicular transitions
are thought to indicate a slight increase in puckering
of the molecules in the second singlet excited state.
This deformation is only conjectured, as the angles calcu-
lated have sufficient uncertainty to make these relatively
small deviations from 900 somewhat questionable.
The dipole moment change (a) is the next excited
state parameter to consider. From Table XI, the values
show an increase in the dipole moment change as the
ring size is increased. The change is thought to be
positive, that is, away from the oxygen. This is based
on the calculations of mean polarizability change, which
give meaningless values of this change when the dipole
93
is assumed to increase towards the oxygen end of the
molecule. With positive values of a, the excited state
dipole moments can be calculated and are given in Table
XI. The movement of electronic charge away from the oxygen
in the excited state is much greater in cyclohexanone
and cycloheptanone compared to the smaller ring systems.
Comparison with other experimental data (given in Table V)
shows that this large difference in dipole moment correlates
with the structure of the molecules (10, 12-15). The
larger systems which are less constrained than the smaller,
rigid cyclobutanone and cyclopentanone have greater charge
delocalization in the excited state. In the constrained
rings, the C1 -C2 bond distance has been found to be shorter
than the other carbon-carbon distances (12,13). Addi-
tionally, the 2B2 ion states of cyclobutanone and cyclo-
pentanone are higher in energy, indicating partial bonding
character (involving the a framework of these molecules)
for the oxygen b2 electrons. These electrons are thought
to be those excited in the transitions in question. The
extent of the involvement of these electrons in the a
bonding framework of the molecule has been related by the
correlation of the 2B2 ionization potential and carbonyl
stretching frequencies in the ground state (16,17), where
increased ionization potential is linearly related to
increased v"C-0 stretching frequency. The molecules that
94
gain ring stabilization from charge delocalization would
not be expected to give up much electron density to the
positive hole that forms upon excitation. For the sake of
discussion, assume that the transition in question here is
the 3s molecular Rydberg transition. The dipole moment
of a molecule in an s Rydberg state would depend greatly on
the location of the positive hole left in the core. The
data suggest that, if the transition is the B2+A1, 3s
Rydberg, the positive charge of the core is more localized
at the oxygen for the small rings. This is in agreement
with the aforementioned data. In cyclohexanone and cyclo-
heptanone, there appears to be a great deal more accomo-
dation for the positive charge (formed at the oxygen) on
the rest of the molecule. These assertions depend on
whether or not the Rydberg assignment is correct.
The new data, presented here, does not rule out other
possible assignments, except those which are A1 +A1 parallel.
The work completed on the electrochromism spectra of for-
maldehyde (7), along with pressure studies (6), term value
arguments (6), and the most recent theoretical studies
of this transition in formaldehyde (18) and acetone (19),
support the 3s Rydberg assignment as the correct one.
The data presented here in no way disagree with this
assignment and give some additional evidence in support
of it. The size of both the dipole moment change and
95
polarizability generally support an extravalent assignment.
The recent ab initiocalculations for acetone (19) and for-
maldehyde (18) in this excited state show very large dipole
moment changes on the order of those observed in cyclo-
hexanone and cycloheptanone, and in the direction away
from the oxygen as is suggested by the data. The observed
large values of polarizability change are also thought to
be the result of the extravalency of the second singlet
transition, where population of the large molecular 3s
Rydberg orbital would be expected to increase polarizability.
The data suggests that the increase is greater for those
molecules with the largest dipole moment change. This is in
concurrence with the idea that the Rydberg orbital is more
localized in cyclobutanone and cyclopentanone. Considering
all the currently available data, the 3s Rydberg assignment is
favored for the absorptions studied here. There is also
some evidence that this region of the spectrum of each
compound may be occupied by another weaker absorption.
This possibility is considered next in the light of the
present work.
When the second singlet of acetaldehyde or acetone
is studied under high pressure (6) (approximately 100
atmospheres of neutral gas), in solid films (6) or in
solution (20), the sharp absorption is greatly diminished,
and reveals a weak underlying absorption. It has been
96
suggested that this is the result of the.a*-0+n,
B2{A1 transition. The data in the present study cannot
verify this assignment, but there is strong evidence
suggesting a nearby state of the proper symmetry so as to
make the R perturbation term the predominant factor
in the C1 electrochromism coefficient. Admittedly, the
uncertainties in th.e values of this coefficient are very
high, which is the result of the relative size of Cexp
compared to the other experimental coefficients. However,
the sign and order of magnitude of this coefficient are
consistent. R , as described by Liptay (21), is a com-
plex perturbation term that is dependent on the interaction
of excited state configurations, and results in a change
in the transition moment length for the absorption being
studied when an electric field is applied. It is con-
ceivable that this perturbation is the result of mixing of
the 3sa1 Rydberg and the aC 0 n states, as both have B2
symmetry. Underlying weak absorptions have also been sug-
gested as the source of an anomalous intensity exchange
that occurs between the second and third bands in the spec-
tra of the cyclic ketones (2). In this exchange, the
intensity of the second singlet appears to be lost to the
next higher energy transition as the ring size increases.
The trade-off of intensity is thought to occur between
two underlying a*+n transitions. This type of exchange
97
has been noted for other ketones as well (22,23). The
data here would support the presence of such an absorption
in this energy region. Future studies of the Rydberg
states of ketones will shed more light on these mixing
processes.
In summary, the results of the analysis of electric
field spectra give the first clear indication of the per-
pendicular polarization of the second singlet excitation
in cyclobutanone, cyclopentanone, cyclohexanone and cyclo-
heptanone. The dipole moment changes appear to be away
from the oxygen, and related to the constraint of the mole-
cule as a result of bonding requirements, where rigid
structure and high symmetry produce lower dipole moment
change in these cyclic ketones. The size of the dipole
moment change and polarizability lends some support to
an extravalent assignment (3s Rydberg). The size of
field-induced perturbations of the transition moment length
suggest the presence of a nearby underlying state of the
same symmetry as the second excited singlet state. The
observed dipole moment change, as related to structure and
symmetry for an extravalent transition, may indicate a
solution to one of the questions that has existed concerning
the energies of first molecular Rydbergs. Many first
molecular Rydberg transitions give term values that are
indicative of atomic-like excited states, where the
98
Rydberg electron is essentially localized about its origin,
while others are clearly related to another part of the
molecule. It has been suggested that the Rydberg excitation
is a charge-transfer transition (6). A great deal of
evidence supports this assertion, primarily in the corre-
lation of the term values of many molecules. The present
work suggests a mechanism for this charge-transfer through
the delocalization of the positive core charge and concomi-
tant relocation of the Rydberg electron about this charge,
the net result being a charge-transfer transition con-
trolled to some extent by the molecule's ability to distribute
positive charge. Low symmetry seems to play a major role
in the delocalization of positive core charge. For this
type of excited state, molecules with high rotational
symmetry would be predicted to have small dipole moment
changes, and the Rydberg term values indicative of a
localized atomic-like transition. This has been found to
be the case of preliminary studies of hydrogen iodide and
methyliodide, where the dipole moment change upon
excitation to the 3s molecular Rydberg state are quite
small and the term values suggest localization of the
Rydberg electron at the halogen (6). Work concerning the
Rydberg states of molecules with a high degree of symmetry
is ongoing.
99
CHAPTER BIBLIOGRAPHY
1. Prugger, H. and D3rr, F., Z. Electrochem., 64, 425 (1960).
2. Horwood, J. F. and Williams, J. R., Spectrochim. Acta.19, 1351 (1963).
3. Udvarhazi, A. and El-Sayed, M. A., J. Chem. Phys., 42,3335 (1965).
4. Whitlock, R. F. and Duncan, A. B. F., J. Chem. Phys. 55,218 (1971).
5. Svendsen, E. Norby and Vala, Martin T., Acta Chem. Scand.,26, 3475 (1972).
6. Robin, M. B., "Higher Excited States of Polyatomic Mole-cules", Vol. 2, Academic Press, New York, N. Y.,1974, pp. 75-106.
7. Causley, G. C. and Russell, B. R., J. Chem. Phys., inpress.
8. Causley, G. C. and Russell, B. R., to be published.
9. Iverson, A. A. and Russell, B. R., Spectrochim. Acta,Part A, 29, 715 (1973) .
10. Sharpen, L. H. and Laurie, V. W., J. Chem. Phys., 49,221 (1968).
11. Le Fdvre, C. G., Le Fevre, R. J. W. and Rao, B. P.,J. Chem. Soc., 1959, 2340.
12. Kim, H. and Gwinn, W. D., J. Chem. Phys., 51, 1815(1969).
13. Ohnishi, Y. and Kozima, K., Bull. Chem. Soc. Jap., 41,1323 (1968).
14. Geise, H. F. and Mijlhoff, F. C., Recl. Trav. Chim.Pays-Bas, 90, 577 (1971).
15. Ledaal, T., Tetrahedron Letters, 6, 651 (1968).
100
16. Chadwick, D., Frost, D. C. and Weiler, L., TetrahedronLetters, 47, 4543 (1971).
17. Cook, U., Can. J. Chem., 39, 31 (1961).
18. Harding, L. B. and Goddard III, W. A., J. Amer. Chem.
Soc., 99, 677 (1977).
19. Hess, B., Bruna, P. J., Buenker, R. J. and Peyerimhoff,S. D., Chem. Phys., 18, 267 (1976).
20. Scheibe, G., Povenz, F. and Linstrbm, C. F., Z. Phys.Chem., B20., 283 (1933).
21. Liptay, W., Z. Naturforsch., 20a, 272 (1965).
22. Holdsworth, R. S. and Duncan, A. B. F., Chem. Rev., 41,31 (1947).
23. Ito, H., Nagata, Y., Matsuzaki, S. and Kuboyama, A.,Bull. Chem. Soc. Japan, 42, 2453 (1969).
CHAPTER V
ELECTRIC FIELD SPECTROSCOPY OF FORMALDEHYDE,
ACETALDEHYDE AND ACETONE
The second singlet excitation in the electronic
absorption spectra of aldehydes and ketones has received
a variety of assignments. Recently, a study of this
absorption in formaldehyde gave tentative support to the
B2*A 1 , 3sa+nb2 assignment for this transition rather than
to any of the other suggested assignments, although the
B2*-A, a*+n was not completed ruled out (1). In this
earlier work, the random polarized light electrochromism
spectra of the 174.9 nm band was reported. A large dipole
moment change (_a = g -e ) of 2.66 Debye, which is thought
to be positive in sign, indicates that the dipole moment .of
this excited state in formaldehyde is pointed away from the
oxygen. The ground state dipole moment is reported to be
2.33 Debye toward the oxygen (2). This large change in
dipole moment and the observed large change in the mean
03
polarizability (b = 60A3), along with a great deal of
other evidence (3,4), favor the extravalent assignment
(see CHAPTER II).
The construction of a new electric field spectrometer
(6) has allowed the acquisition of two different types
101
102
of spectra. Electrochromism spectra, using plane polarized
light fixed at zero degrees with respect to the electric
field and electric linear dichroism spectra, can now be
obtained. The origin of all three types of spectra and the
theoretical expressions and dependencies have been given in
the literature (6-10). A brief description of the electric
field effect is given in Appendix A. In addition to this
description, the general approach to the experiment is
discussed. By obtaining at least two of the three possible
spectra that can be observed with the spectrometer in its
current configuration and then fitting the electric field
spectra to the absorbance data, the values of the coeffi-
cients C. and Ci (i = 1 to 3) can be determined by solving1 1
systems of simultaneous equations (See Appendix A). From
these coefficients, excited state parameters are calculated.
The parameters which can be determined for molecules that
possess a principal rotation axis are the polarization of
transition moment with respect to the ground state dipole
moment, the dipole moment and mean polarizability change
that occur upon excitation, and the extent of field-
dependent-perturbation of the transition moment (R(1)).
The latter two properties are generally determined with
less certainty. Excited state parameters are more diffi-
cult to determine for molecules that do not possess
axial symmetry. In molecules of lower symmetry, various
103
moments are not restricted to symmetry axes, and it is
possible that the net dipole moment may have an angular
shift away from the equilibrium position of the ground
state. This shift may occur without a change in equili-
brium geometry and would give the molecule different
orientational character in the excited state. This will
be particularly important in the electric field studies
of acetaldehyde which does not have a rotational axis of
symmetry.
It is a natural extension of the initial work on the
second singlet excitation of formaldehyde to include
studies of this band in two other unique compounds, acetal-
dehyde and acetone. They are unique in the fact that each
is the smallest of its kind (i.e., aliphatic aldehydes
and ketones). Additionally, the effect of symmetric
or asymmetric distribution of substituents about the car-
bonyl group can be determined in these small compounds,
as formaldehyde and acetone are C2v, and acetaldehyde is
essentially Cs. Experimental data for this series of
compounds, excluding the electric field results, are com-
piled in Table XII.It will be purpose of this chapter to
report the gas phase electric field spectra of the
absorption in question for this series and to present the
results that have been obtained from the analysis of this
data. These results substantiate earlier findings and
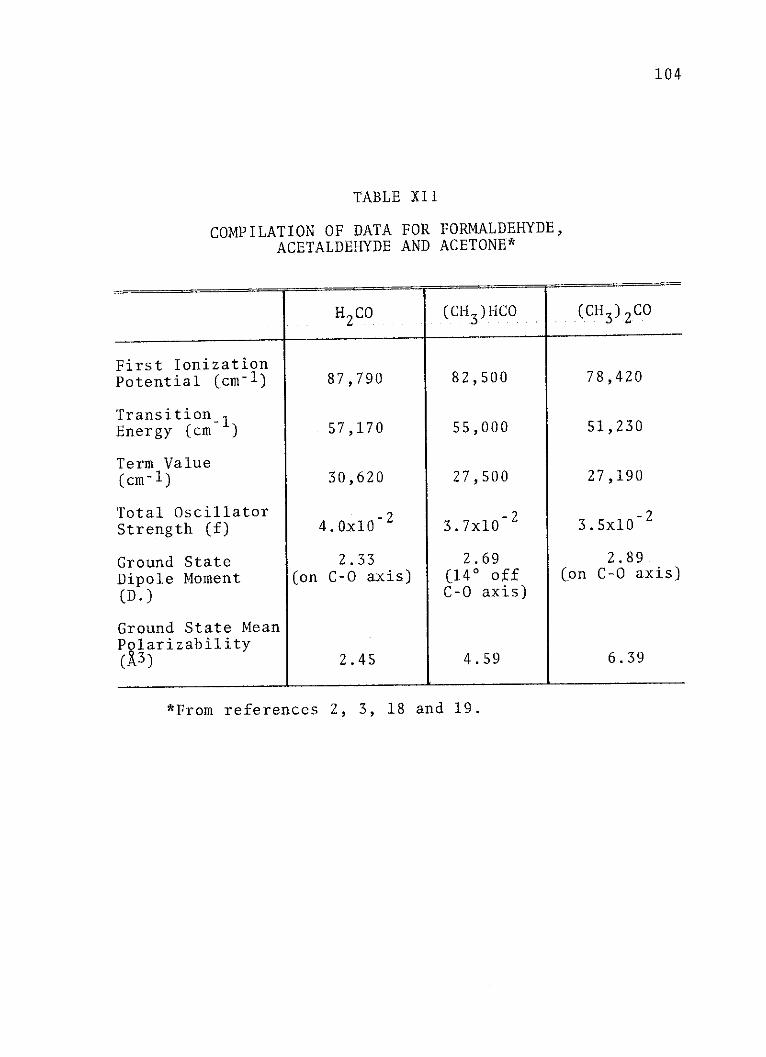
104
TABLE XII
COMPILATION OF DATA FOR FORMALDEHYDE,ACETALDEHYDE AND ACETONE*
H2CO (CH 3 )HCO (CH3)2C
First IonizationPotential (cm-1) 87,790 82,500 78,420
TransitionEnergy (cm ) 57,170 55,000 51,230
Term Value(cm-1) 30,620 27,500 27,190
Total OscillatorStrength (f) 4.0x10^ 3.7x10 2 3.5x10Z
Ground State 2.33 2.69 2.89Dipole Moment (on C- 0axis) (14 o ff (on C-O axis)(D.) C-0 axis)
Ground State MeanPolarizability(X3) 2.45 4.59 6.39
*From references 2, 3, 18 and 19.
105
give additional evidence in favor of the B2+A1 , 3s-fn
assignment in formaldehyde and acetone, and similarly
support the A'+A', 3s-n assignment in acetaldehyde for the
second singlet excitation.
Experimental
The instrument used to obtain the spectra and those
methods employed in sample purification have been described
previously (1,6,11-13). All spectra reported herein were
obtained with 3.05 atmospheres of sulfur hexafluoride
arc suppressor gas present in the cell. At this pressure,
increases in the electrochromism coefficients have been
observed (14), but they are small compared to the overall
uncertainty of the technique and will, therefore, be
neglected. All samples were obtained commercially at the
highest purity available. The electric field strength
(Edc) for electrochromism spectra was maintained at 105
volts/cm. Higher field strengths were employed for elec-
tric linear dichroism spectra, because they are inherently
weaker than electrochromism spectra. In order to use
higher field strength, the linearity of the electric
linear dichroism effect with respect to E had to be tested.
A plot of I2f/I*, for an intense peak in the electric linear
dichroism spectrum of acetaldehyde, against static electric
field strength squared, is given in Figure 11. In this
plot a noticeable nonlinearity begins above a field
106
Figure 11. Plot of electric linear dichroism signalIELD/I) against .the static electric field strength
squared (Ed) for acetaldehyde is 181.85 nm. Thesolid line is the linear least squ res fit to the dataup to a field strength of 1.5 x 10 volts/cm.
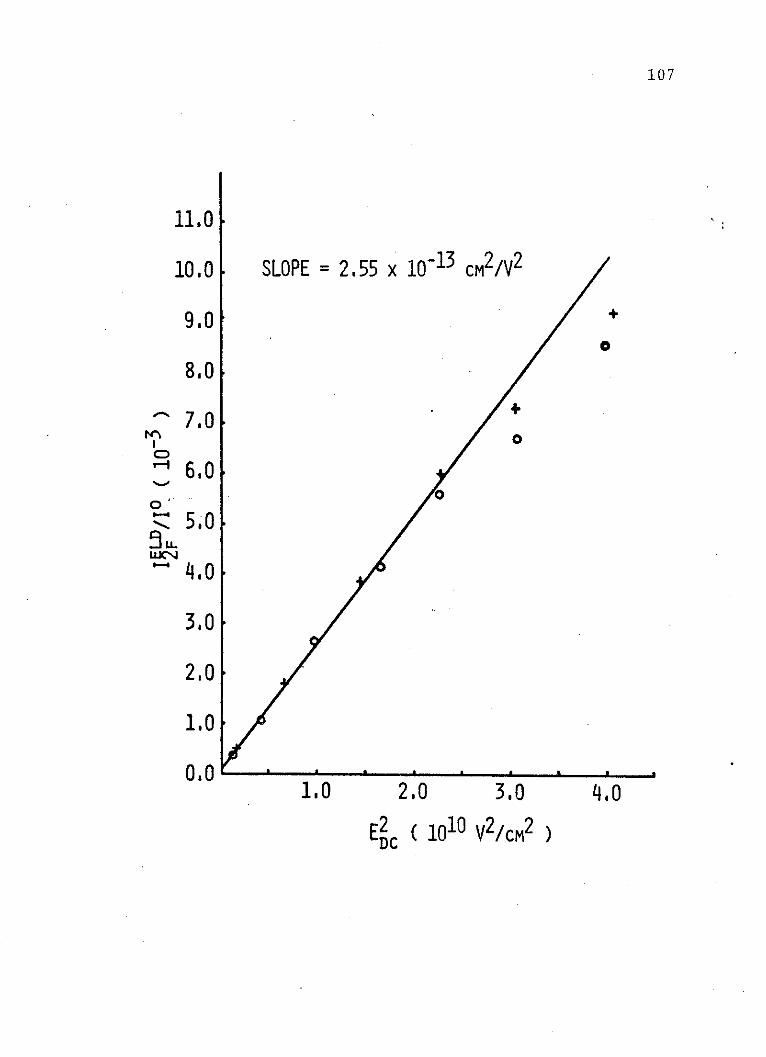
11,0
10.0
9,0
8,0
7,0
C 5.06' .O
WCv4
3.0
2.0
110
0.02.0 3.0
E2 ( 1010 V2/cM2 )DC
107
SLOPE = 2.55 x io-13 cM2/V2
0
t
0
0
1.0 4,0,.
- - sI
108
strength of 1.5 x 10⁵ volts/cm. This nonlinearity is
caused by higher order electric field terms which have
been dropped in the drivation of the theoretical expres-
sions used to describe electrochromism and electric linear
dichroism. Up to 1.5 x 10⁵ volts/cm, a linear corre-
lation of 0.999 was obtained. The result of a linear
least squares fit to this data is also shown in Figure 1
(solid line). As a result of this test, no electric
linear dichroism spectra were taken above the critical
field strength. In all cases, spectral coefficients
(CexP) were normalized to 105 volts/cm for easy compari-
son and use in the solutions for the C. and C
coefficients.
Results and Discussion
Formaldehyde
The formaldehyde second excited singlet exhibits a
very weak electrochromism spectrum relative to the other
compounds in this series. It is weak enough to prohibit
the acquisition of its electric linear dichroism spec-
trum. This is also true for the electrochromism spectrum
where the incident photons are polarized at zero degrees
with respect to the electric field. This is unfortunate,
because no additional information to that which has been
given can be obtained without additional spectra, except
109
for the resolution of one assumption that was made in the
original study of this molecule (1). It was necessary in
that work to assume that the transition had a perpendicular
moment with respect to the ground state dipole moment,
which was substantiated by the work of Simpson and others
on much higher molecular weight ketones (15,16). The fact
that zero degree polarized light electrochromism spectra
cannot be obtained is good evidence in support of an
assignment of the transition moment being perpendicular to
the ground state dipole. As seen in equations A-8 through
A-13, a perpendicular orientation causes the total intensity
of the electric field effect to be reduced in zero degree
polarized light compared to the random polarized light
effect. This is the experimental observation. With the
transition moment assigned as perpendicular, the reduced
form of the electrochromism equations (A-ll through A-13)
may be used, as was the case in the earlier study. With
no assumption involving transition moment orientation,
some degree of uncertainty that existed in the calculated
excited state parameters is removed. Until additional
spectra can be obtained, however, the values of these
parameters remain questionable, because of assumptions
that have been made regarding the size of some excited
state parameters. These assumptions include: R (1)is
considered equal to R(2) for a C2 v molecule (17); and
110
that S (1), S(2), (am-a) and (bm-b) can be neglected.
In the remaining studies the number of assumptions is
generally reduced, because the primed and unprimed coeffi-
cients can be determined with all three electric field
spectra available.
Acetone
The electric field studies of acetone will be con-
sidered next, as this compound, like formaldehyde, is C2v.
Unlike formaldehyde, however, the electric field effect
in acetone is relatively intense, and all three types of
spectra have been obtained. Examples of these are given
in Figures 12 through 14. Two features that are immediately
evident are the reduction in size of the signal for the
zero degree polarized light electrochromism spectrum
(Figure 13) compared to the random polarized light spec-
trum (Figure 12), and the reversal of sign of the electric
linear dichroism spectrum (Figure 14). Note that the
electrochromism spectra are recorded as the negative of
If/I . This negative sign arises from the fact that the
fundamental of the modulated intensity is obtained (A-17
through A-20), which gives a negative sign that is not
found in the electric linear dichroism spectra. Thus, if
a reversal in the spectra is observed, such as in, acetone,
it is the result of a reversal of the sign of the
coefficients (C xP), when the spectra are recorded as
111
Figure 12. The absorption (A*) and random polarizedlight electrochromism (-If/I0 ) spectra of the secondsinglet of acetone.
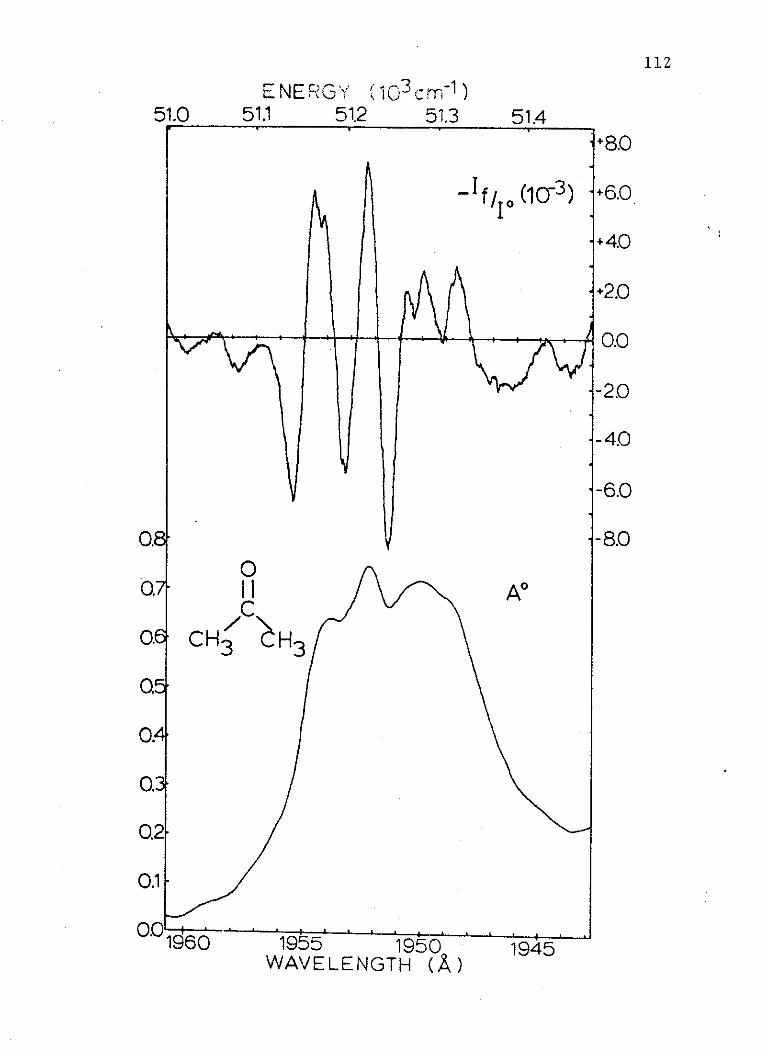
5 NE1GY 1 3 m~1 )51.1 51.2 51.351.0
51.4
-If/ (10C3)
iAA
0II A0
/C-CH 3 OH3
Q5
0.4
o0.2
0.11
1960 1955 1950 1945WAVELENGTH (A)
j
+8.0
+6.0
+4.0
+2.0
0.0
-2.0
-4.0
112
& . ---a. - .1""""
iN--- -% 4 ,
Ai i 1 11Jim I T aF=k i i i
51.4
r
.7
113
Figure 13. The absorption (A*) and zero degree
polarized electrochromism (-If/I*) spectra of thesecond singlet of acetone.
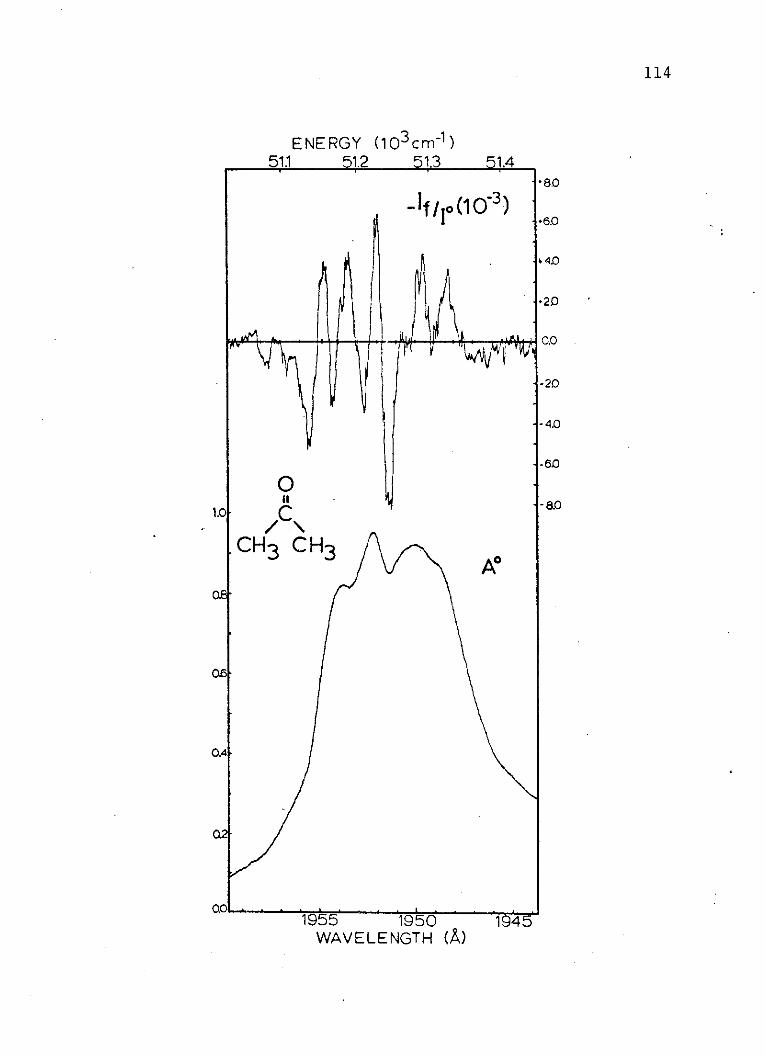
114
ENERGY (10 3 cm~1 )51.1 51.2 513 51.4
8.0
- .I(10~3)+60
. X40
"20
0.0
\-J-20
-4.0
-6
0
CH 3 CH3
0
0.4
1955 1950 1945WAVELENGTH (A)
115
Figure 14. The absorption (A*) and electric lineardichroism (12f/I0 ) spectra of the second singletof acetone.
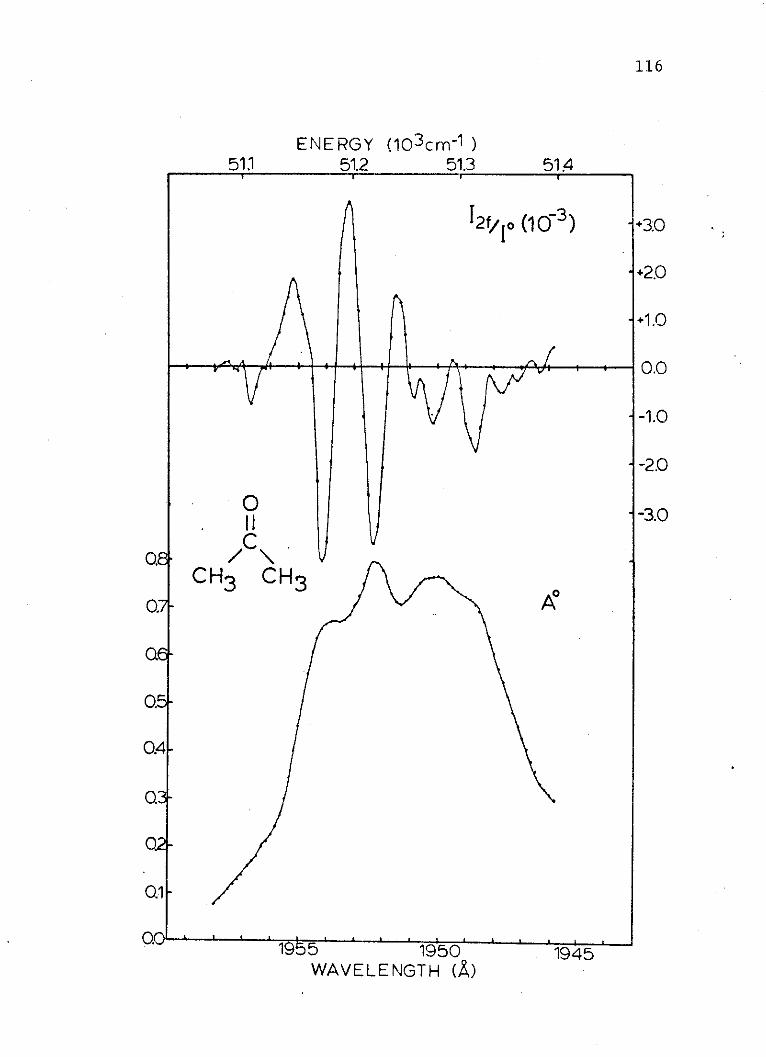
116
ENERGY (1O 3 cm-1 )511 51.2 51.3 51.4
I2f/ o(10-3) +3.0
-+20
+1.0
-1.0
-2.0
0.
CH3 CHI
0.7.A0.Q
Q
0.4 -
Q3 -
Q2 -
0.1W
0019 5 1950 1945IWAVELENGTH (194
117
shown in Figure 1-2 to 1.4. These two observations give
support to a perpendicular orientation of the transition
moment with respect to the ground state dipole moment.
One unusual feature of the acetone spectra is the apparent
increased number of maxima in the zero polarized light
spectrum compared to its random polarized light counterpart.
This would indicate a fairly large change in at least one
of the experimental coefficients. Table XIII lists these
coefficients that have been obtained from a linear least
squares fits of integrated electric field spectra and
field-off absorbances. With these coefficients, a set of
simultaneous equations can be written.
- 2.0 C. - 1.0 C' = Cixp (random polarized light)i 1 1
- 2.0 C. - 4.0 C' = Cixp (zero degree polarizedlight)
-1.42 C' = Cixp (electric linear dichroism)1 1
Solving the three possible combinations of these equations
and then averaging, gives the six types of coefficients
(C. and C' for i = 1 to 3). The solution set for the1 1
acetone spectra is given in Table XIV with their experi-
mental uncertainties. With these values, excited state
parameters may be determined. The general equations,
A-6 and A-7, may be used to calculate the angle between
transition moment and dipole moment change, which should
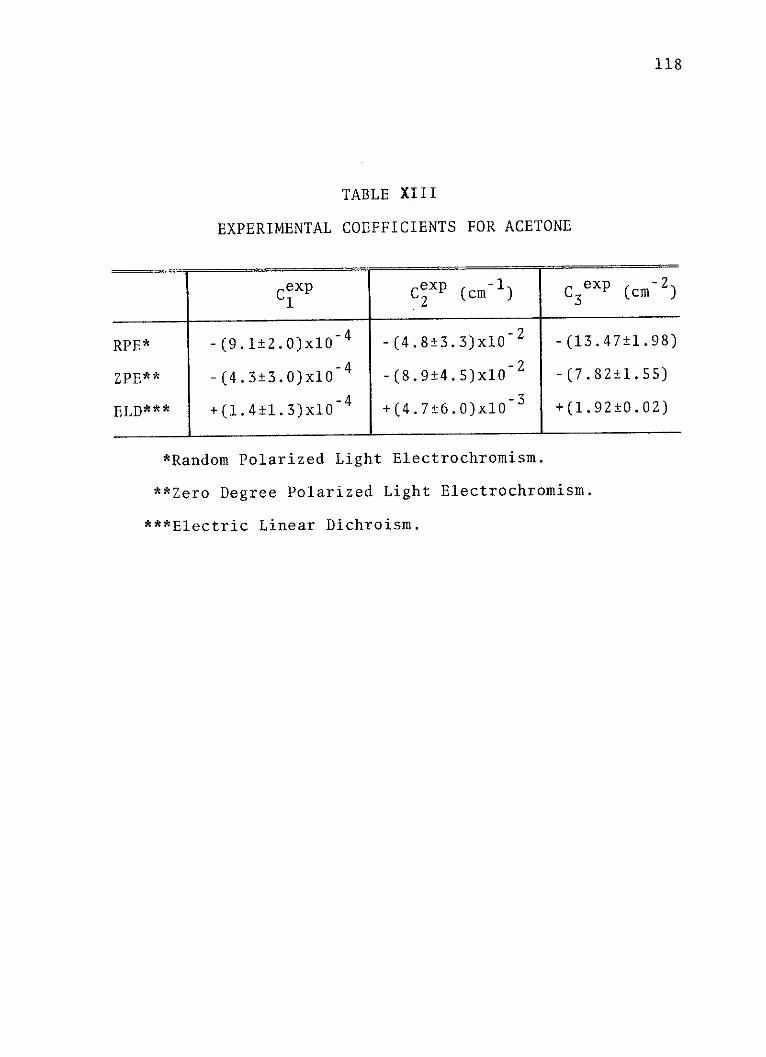
118
TABLE XIII
EXPERIMENTAL COEFFICIENTS FOR ACETONE
Cexp Cexp (cm 1 ) C3exp (cm-2)
RPE* -(9.1 2.0)x10~4 -(4.8 3.3)x10-2 -(13.47 1.98)
ZPE** -(4.3 3.0)x10 -(8.9 4.5)x10 -(7.82 1.55)
ELD*** +(1.4 1.3)x104 +(4.7 6.0)x10-3 +(1.92 0.02)
*Random Polarized Light Electrochromism.
**Zero Degree Polarized Light Electrochromism.
***Electric Linear Dichroism.
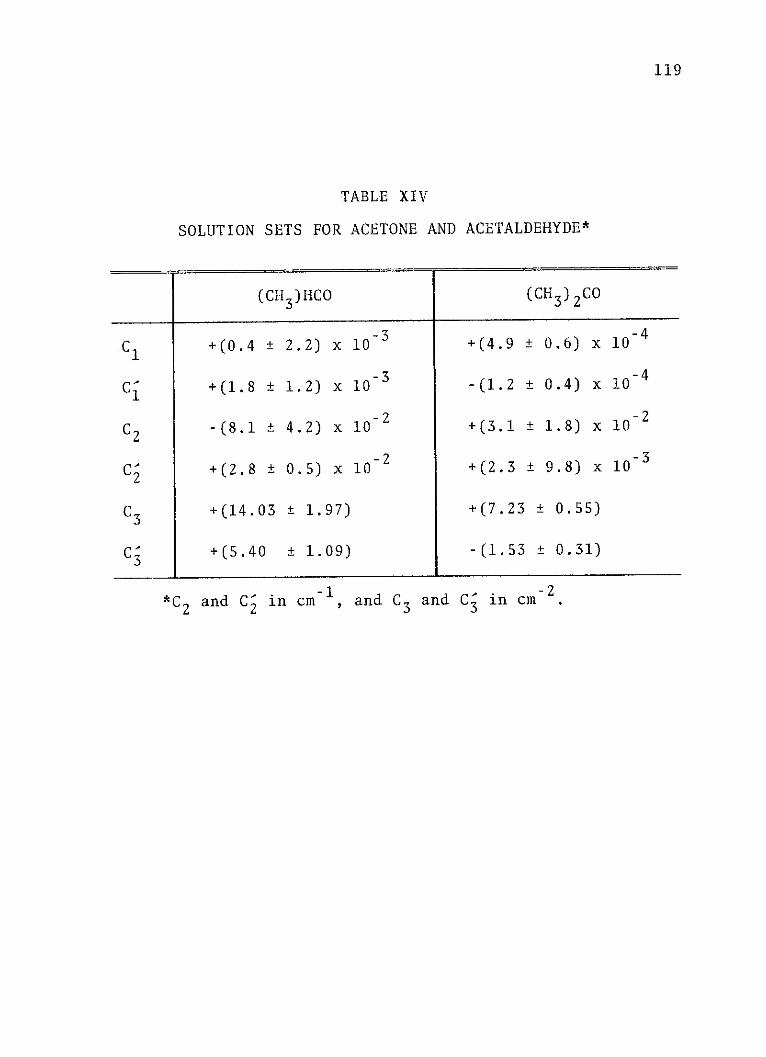
119
TABLE XIV
SOLUTION SETS FOR ACETONE AND ACETALDEHYDE*
(CH3)HCO
4- t
+(04 2.2) x
+(1.8 1.2) x
-(8.1 4.2) x
+(2.8 0.5) x
10-3
lo-2
+(14.03 1.97)
+(5.40 1.09)
(CH3) 2C0
+(4.9 0.6) x 10-"
-(1.2 0.4) x 10- 4
+ . 1.8) 10-2
+(2.3 9.8) x
+(7.23 t0.55)
-(1.53 0.31)
C1
C'Ci
C2
C'2
C3
C'3
__ __ _-__ _ __ __ _-2___
and C in cm 1 , and C3 and C' in cm-.
120
be 900 for a perpendicular transition, assuming the molecule
does not drastically change its shape in the excited state.
Using C3 and C' from Table XIV, the value of the square of
the dipole moment change, a2 , and the vector product,
(mai)2, can be determined. These values are 9.48 1.24 D.
and -0.18 0.23. The dipole moment change is 13.08
0.20|D., but the value of (ma)2 is a small negative number.
This results from the fact that its value is very near
zero (calculated as negative due to experimental error).
For this vector product to be near zero, the value of the
angle between the dipole moment change and the transition
moment must necessarily be near 90*. Since the dipole
moment lies in the C-0 axis and changes in dipole will be
along this axis, a transition moment perpendicular to the
C-0 axis is strongly supported by these data. Whether
the transition is in-plane perpendicular (B2-A), or out-
of-plane perpendicular (B1*-A1 ), will remain a question
until the spectra of acetaldehyde are analyzed. As will
be shown, there is evidence from the acetaldehyde data
in favor of the B2 -A1 transition. With the above stated
results for acetone, the reduced expressions for C1 and
C2 (Appendix A) may be used in conjunction with their
respective experimental values (Table XIV) to solve for
R(1),b, and the sign of a. The uncertainty of C1 and C2
is rather high, which is the result of their small size
121
and poor signal-to-noise ratios in the experimental data.
This is a difficulty inherent in this type of study. It
must be assumed at this point that the second order per-
turbation term, S(l), may be neglected. It should be much
smaller than R(1, which is calculated from C1 and equation
A-2. A value of (1.2 0.3) x 10~4 esu-cm/erg is obtained.
The R(1 term results from field-dependent-perturbation
of the transition moment length as a function of configura-
tional mixing of nearby states with the proper symmetry
to interact. Substitution of this value into equation A-4
gives:
- 5.6 x 10⁻²a - 4.6 x 10~4b = 3.1 x 10⁻²
In solving the above expression for mean polarizability
change (b = ag-a ), a positive value of the dipole momentgex03
change (a) gives a reasonable result of 440 140 A3
where a negative a generates a value of b that indicates
negative polarizability in the excited state, which is
nonsense. Thus, this supports the assertion that the
electron density is moved away from the oxygen end of the
molecule, resulting in a net dipole moment of -0.19
0.23 Debye in the excited state. This is also thought
to be the case in formaldehyde. The uncertainty is high
in the calculated value of mean polarizability change,
but the order of its magnitude is comparable to the
122
formaldehyde change and is somewhat indicative of an
extravalent excitation. The excited state parameters cal-
culated here and the comparisons between these results
and those from the other compounds will be addressed
again in the conclusions section.
Acetaldehyde
When the spectra of acetaldehyde were first recorded,
they were found to be quite different. The signal for
the electric field effect is very intense. It is the
strongest signal that has been recorded thus far. Another,
more unusual, observation involved the polarization of the
transition. Seen in Figures 15 to 17 the random polarized
light spectrum (Figure 15) is less intense than the zero
polarized light spectrum (Figure 16) and the electric linear
dichroism trace (Figure 17) is the same sign as both the
electrochromism spectra. These observations are manifest
in the experimental coefficients for the three spectra,
which are compiled in Table XV. At the onset, it would
appear that the second singlet of acetaldehyde is
polarized parallel to the ground state dipole moment and
is totally different in origin from the other compounds
studied. This is probably not the case. It seems unlikely
that, with so much evidence in favor of a perpendicular
transition, that the aliphatic aldehyde transition would
be so drastically different (i.e., A1--A1 ). Instead, it is
123
Figure 15. The absorption (A*) and randompolarized light electrochromism (-If/I*) spectraof the second singlet of acetaldehyde.
I., . ,, 2 141111, No NO 11
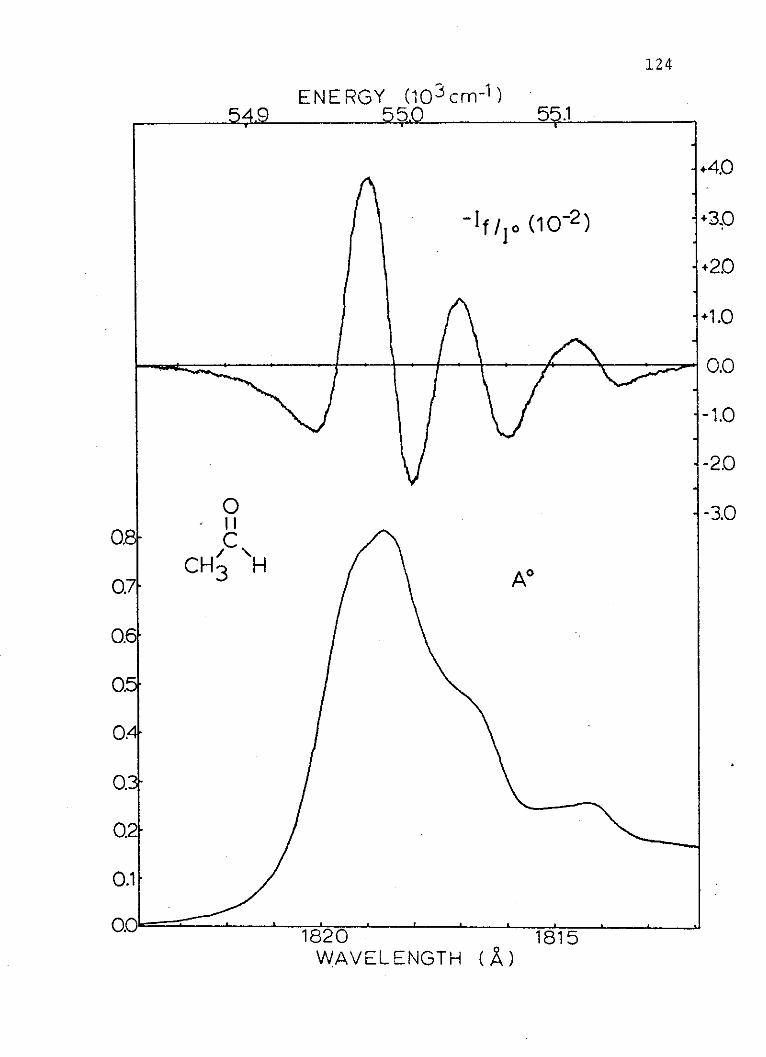
124
ENERGY (10Qcm- 1 )54.9 5 .p 55.1
+4.0
-10/ (10-2) +3.0
+20
+1.0
0.0
-2.0
-- 3.00.- C
CH3 H
0.7
0.
0.5
0.02
0.1
1820 1815WAVELENGTH (A )
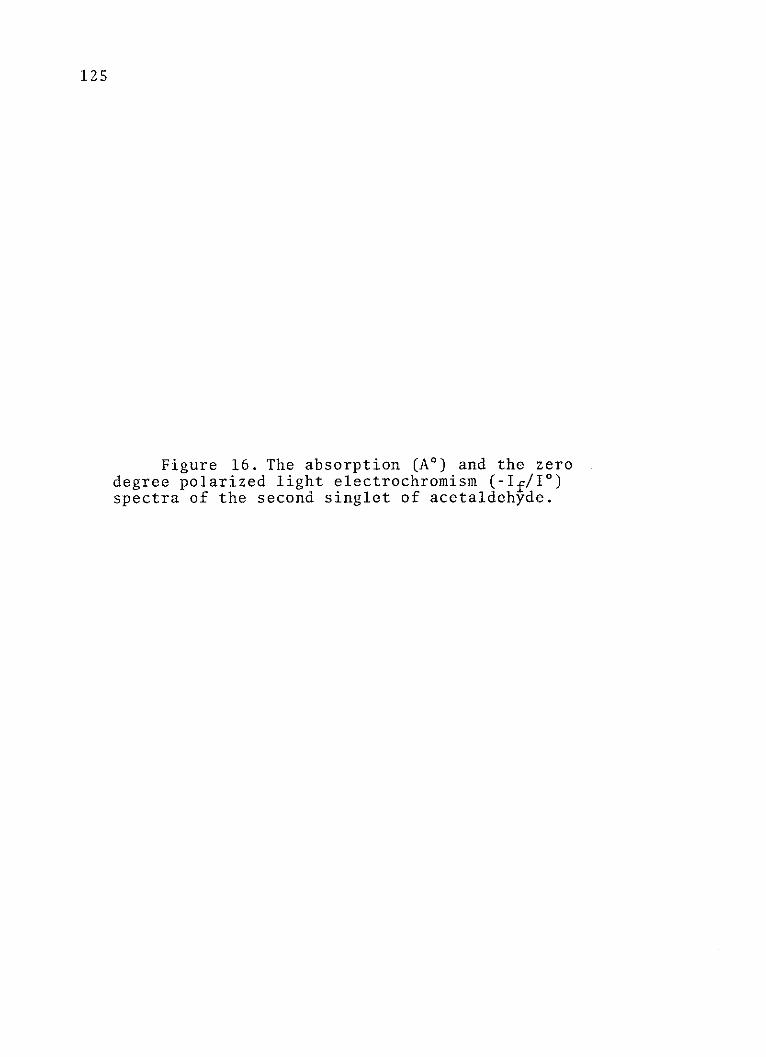
125
Figure 16. The absorption (A*) and the zerodegree polarized light electrochromism (-If/I*)spectra of the second singlet of acetaldehyde.
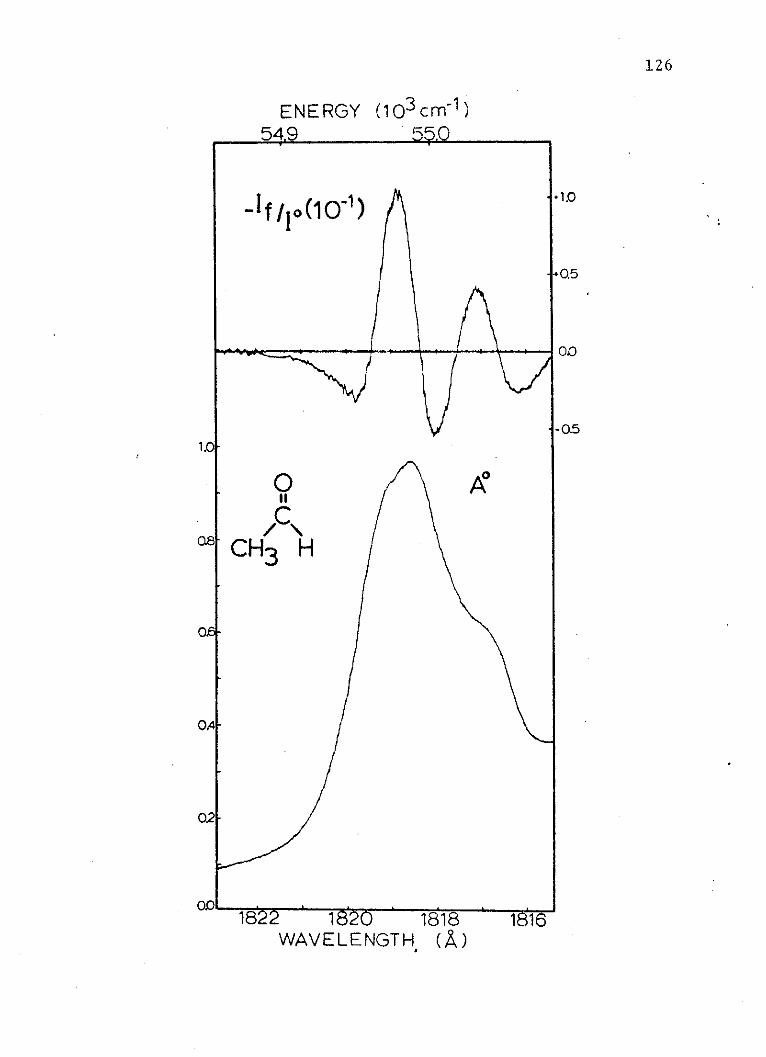
126
ENERGY (103 cm-1)549 >,
f.-/1 (1 O 1) +1.0
+05
0.0
1.0
o A*II
CoCH 3 H
o
0A
0.2
0.0
WAVELENGTH (A)

127
Figure 17. The absorption (A*) and electriclinear dichroism (I7f/I*) spectra of the secondsinglet of acetaldehyde.
ENERGY55.0
(103 cm 1 )
12f/ o(102)
4 / 3hr rrirr~ri~r r ~r rr i--I
A p-1
WAVELENGTH (A)1815
54.9
128
N -- 55.1
+1.5
+1.0
+0.5
0.0
-0.5
-1.0CCH 3 H
1.2
1.
0.
0.6
0.
0.
0.01O2 V
55.1
\.A.4 ,
I I II'
a

129
TABLE XV
EXPERIMENTAL COEFFICIENTS FOR ACETALDEHYDE
Cexp Cex (cm~') C03X (cm-2)
RPE* -(1.1 1.1)xO3 +(8.7 4.6)x10-2 -(31.57 1.32)
ZPE** +(8.7 5.7)x10-3 +(6.6 1.1)x10-2 -(51.56 1.44)
ELD*** +(1.7 0.3)x10-3 -(6.9 0.5)x10-2 -(6.78 0.26)
*Random Polarized Light Electrochromism.
**Zero Degree Polarized Light Electrochromism.
***Electric Linear Dichroism.
130
felt that the excited state dipole moment is shifted from
its equilibrium position in the ground state, which is
reported to be 140 off the C-0 axis in plane between
the H-C-O angle. With all three spectra for the acetalde-
hyde band, this difference can be studied more closely.
Just as in the acetone study, the general equations were
used and the average value of the six coefficients (Ci and
C') were obtained by solving the simultaneous equations
previously shown. The solution set is given in Table III.
The values of C3 and C', when analyzed, give a value of
the dipole moment change of 4.28 0.29 Debye and an angle
between this change and the transition moment of 90 or 171*,
depending on the sign of mia. The most important point that
can be determined from these values is that the transition
moment appears to be polarized in the plane of the molecule.
The molecule, in its ground state, is in the Cs point group,
where the reflection plane is the molecular plane. This
results in the transitions of this molecule being polarized
either in the plane of the molecule or perpendicular to
it, assuming the molecule does not distort in the excited
state. If the transition in question was out-of-plane,
and produced no great amount of distortion, any change
in dipole moment would necessarily be perpendicular to this
transition, because the net dipole moment of any nondis-
torted state of acetaldehyde would be expected to lie
131
in the molecular plane. If the in-plane parallel transi-
tion is ruled out because of the evidence presented for
formaldehyde and acetone, which favor only a perpendicular
transition, then what is left is a transition that is
polarized in-plane and perpendicular to the C-0 axis.
Figure18 is a vector diagram of the ground state
moment (solid line) and the possible excited state dipole
moments (dashed line calculated with positive a and dotted
line calculated with negative a), which are determined
graphically from a and the possible angles between a and M
for a perpendicular in-plane transition. There are four
possible solutions. Those which are obtained with -a will
not be considered, because in no study of this transition
in other carbonyl compounds (1,6) has the dipole moment
change been found to be toward the oxygen, which is implied
when a is negative (a = Pg-P ). Assuming a is positive,
two vectors remain (dashed lines) in Figure18 that are
possible for the excited state dipole. One is essen-
tially the result of the movement of electronic charge
toward the methyl group, and the other results from a
similar movement of electrons toward the hydrogen. There
is some reason to suspect that this moment will point
in the direction of the methyl group. In terms of the
molecular orbitals, the in-plane electrons, which are
thought to be excited, reside in a relatively nonbonding
132
Figure 18. A vector diagram of the ground state
dipole moment (solid line), the two possible excitedstate dipole moments determined from a negative a
(dotted lines) and the two possible excited state
dipole moments determined from a positive a (dashedlines). The circled value is thought to be the
correct excited state dipole moment.
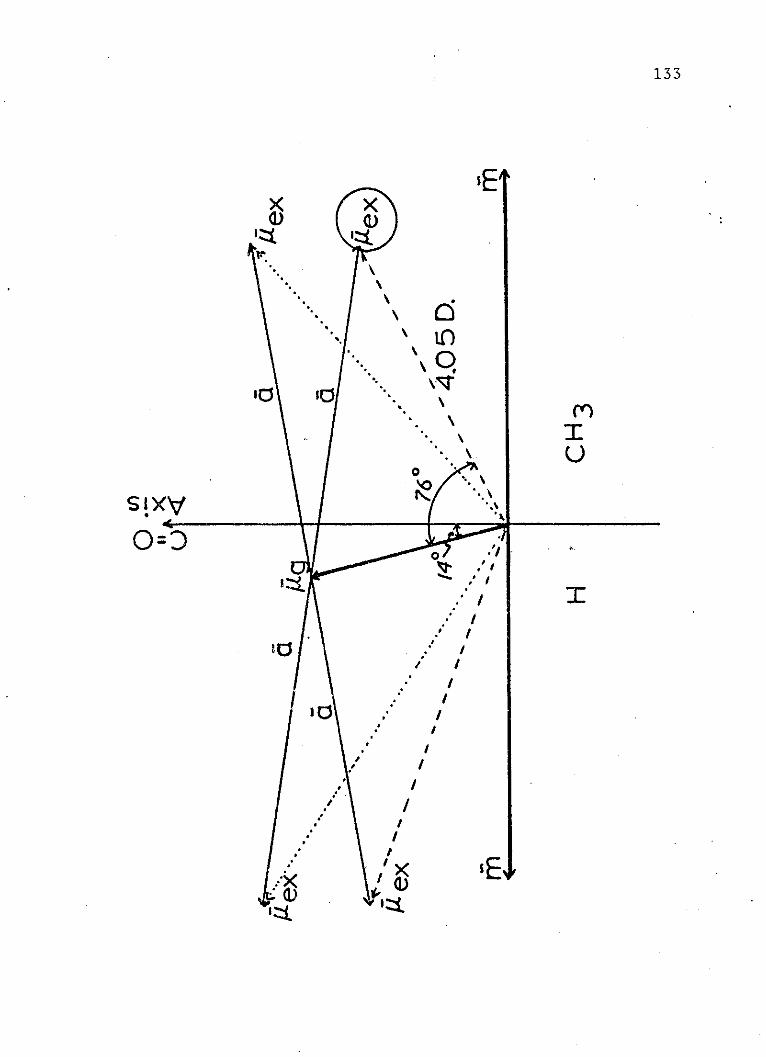
X XL0 0
'-.
C5 0 -- A
"
.
-
"
- /
*. /
'I
.- ' /j
'" '
133
IC)O
*O
spv4-:
U
AL
'0
134
orbital localized on the oxygen. The two suspected upper
orbitals (3s and a00-) would both have large components
involving the methyl groups which results from the parti-
cipation of the in-plane 2s and 2_,y atomic orbitals of
the methyl carbon. Excitation to either of these would
point the net dipole moment in the direction of the
methyl group. The term values would also indicate that
the methyl group is playing a key role in the stabilization
of the excited state. The term values (Table V) are nearly
identical for acetone and acetaldehyde, ~27,000 cm- , where-
as this value in formaldehyde is -30,600 cm~1. The higher
value has been pointed out by Robin (3) to be more hydro-
gen-like in terms of orbital penetration by the excited
electron. In fact, it has been shown by Robin that these
term values support an 3s-n molecular Rydberg transition,
that has a high degree of methyl group participation as
the result of charge transfer. There is nothing in the
present study that disagrees with Robin's findings or
with those of Simpson and others (15,16), who first
assigned the transition moment as in-plane perpendicular.
Because of the Cs symmetry of acetaldehyde, the vector
products of C1 and C2 cannot be reduced to scalars as in
the molecules that are C2v. This makes the calculation
of R(1 ) and b very difficult. Without the direction of
R(1), the value of a cannot be calculated, and therefore,
135
neither can b. In molecules that possess axial symmetry
(e.g., C2 ), the dipole moment and the change in this
moment are colinear, and the angle between R(1 and these
moments are equal. This does not appear to be the case
in acetaldehyde. It is clear from the size of the experi-
mental coefficients, however, that as in formaldehyde and
acetone, these terms will be quite large. Beyond this,
their values remain obscure.
Conclusion
A compilation of the results of electric field spec-
tra for the second singlet in formaldehyde, acetaldehyde,
and acetone are given in Table XVI. This transition in
these compounds can be characterized as resulting in large
dipole moment changes, which also change in the direction
of the net dipole moment in acetaldehyde. These large
changes in electronic distribution are accompanied by
large changes in polarizability. These observations,
toether with the apparent in-plane perpendicular moment
of this transition with respect to the ground state dipole
moment, are thought to support the assignment of the
excitation as nonbonding in-plane p on oxygen to 3s
molecular Rydberg.
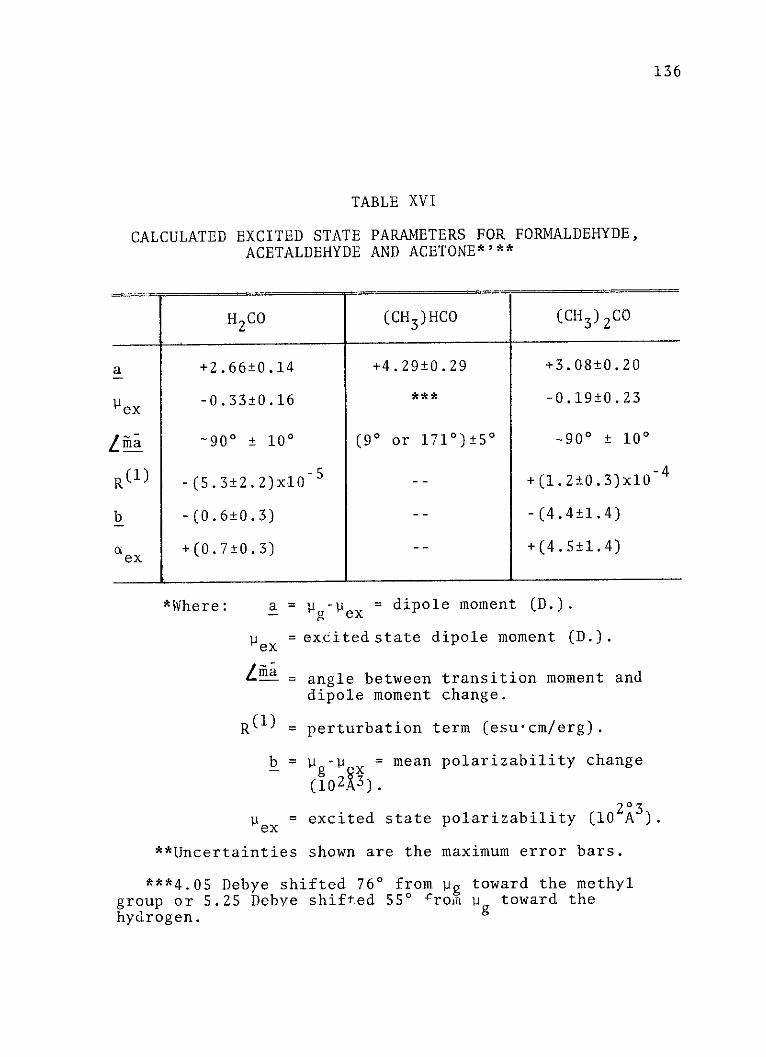
136
TABLE XVI
CALCULATED EXCITED STATE PARAMETERS FOR FORMALDEHYDE,ACETALDEHYDE AND ACETONE*'**
H 2 CO (CH 3 )HCO (CH3)2C0
a +2.66 0.14 +4.29 0.29 +3.08 0.20
e -0.33 0.16 *** -0.19 0.23
L m90 * 100 (90 or 171*) 5* ~90* 100
R(1) -(5.3 2.2)x10 5 -- +(1.2 0.3)x10- 4
b -(0.6 0.3) -- -(4.4 1.4)
ex +(0.7 0.3) -- +(4.5 1.4)
*Where: a = yg -ex = dipole moment (D.).
e = excited state dipole moment (D.).
L3A = angle between transition moment anddipole moment change.
R(1= perturbation term (esu-cm/erg).
b = -P = mean polarizability change
(10 23) .
ex = excited state polarizability (10203
**Uncertainties shown are the maximum error bars.
***4.05 Debye shifted 760 from Pg toward the methyl
group or 5.25 Debye shifted 550 rom u toward thehydrogen.
137
CHAPTER BIBLIOGRAPHY
1. Causley, G. C. and Russell, B. R., J. Chem. Phys., inpress.
2. Kondo, K. and Oka, T., J. Phys. Soc. Ja., 15, 307(1960).
3. Robin, M. B., "Higher Excited States of PolyatomicMolecules," Vol. 2, Academic Press, New York,N.Y., 1974, pp. 75-106.
4. Harding, L. B. and Goddard III, W. A., J. Amer. Chem.Soc., 99, 677 (1977).
5. Hess, B., Bruna, P. J., Buenker, R. J. and Peyerimhoff,
S. D., Chem. Phys., 18, 267 (1976).
6. Causley, G. C. and Russell, B. R., to be published.
7. Liptay, W., "Dipole Moments and Polarizabilities ofMolecules in Excited States," Excited States,Vol. I, edited by C. Lim (New York, 1974),pp. 129-229.
8. Liptay, W., Ber. Bunsenges. Phys. Chem., 80, 207(1976).
9. Labhart, H., "Electrochromism," Advances in ChemicalPhysics, Vol. XIII, edited by I. Prigogine(New York, 1967), pp. 179-204.
10. Yamaoka, K. and Charney, E., J. Amer. Chem. Soc., 94,8963 (1972).
11. Scott, John D. and Russell, B. R., J. Chem. Phys., 63,3243 (1975).
12. Causley, G. C., Scott, John D. and Russell, B. R.,Rev. Sci. Instrum., 48, 264 (1977).
13. Iverson, A. A. and Russell, B. R., Spectrochim. Acta,Part A, 29, 715 (1973).
14. Causley, G. C. and Russell, B. R., to be published.
138
15. Barnes, E. E. and Simpson, W. T., J. Chem. Phys., 39,670 (1963).
16. Johnson, Jr., W. B. and Simpson, W. T., J. Chem. Phys.,48, 2168 (1968).
17. Liptay, W., Z. Naturforsch., 20a, 272 (1965).
18. Kilb, R. W., Lin, C. C. and Wilson, Jr., E. B., J.Chem. Phys., 26, 1695 (1957).
19. Applequist, J., Carl, J. R. and Fung, K. K., J. Amer.Chem. Soc., 94, 2952 (1972).
CHAPTER VI
SUMMARY AND DIRECTIONS FOR FUTURE STUDY
Summary
When the first vacuum ultraviolet electrochromism
spectrometer was built, it was hoped that it would allow
the characterization of excited states within the frame-
work of some essential assumptions. This device,
however, only allowed the acquisition of excited state
dipole moment change, and then, only for molecules
with a principal rotation axis. It is also necessary in
this type of study to assume the transition moment orien-
tation and size of a number of other terms which are not
well understood. The development of variable angle
electrochromism and electric linear dichroism spectrometric
methods has resulted in the alleviation of many of these
restrictions. By obtaining two or more electric field
spectra, the polarization of the transition and the value
of the dipole moment change upon excitation can be deter-
mined directly for molecules with a principal rotation
axis. This information is, by far, the most important to
be gained. With it, assignment of the transition being
studied can be made with more objectivity.
139
140
Recently, theoreticians have turned their attention
to higher energy excited state studies, employing sophis-
ticated ab initio calculations, to determine energies and
wave functions for these states in small polyatomic
molecules. It is a certainty that the need for experi-
mental values of excited state properties exists for
comparison, and for evaluation of both theory and experi-
ment. In the current work, the agreement between the most
recent theoretical results and experimental results is
fair. In terms of the assignment of the excited state
symmetry, the experiment and theory are in complete
agreement. The values of the dipole moments in the
excited states studied in formaldehyde and acetone, how-
ever, differ by a factor of about two, where the theoretical
values are larger than those given here. Although there
is numerical disagreement, the order of magnitude and
direction of dipole moment change, along with the agreement
in excited state symmetry, align theory and experiment in
favor of an assignment of 3sa1 -nb2 , B2 +Al for the second
excited singlets of formaldehyde and acetone. The results
for these two molecules support similar assignments of the
second singlet in the other compounds considered in these
studies. Along with the observed polarization angles
and dipole moment changes, all of the molecules studied
appear to have relatively large polarizability changes
141
upon excitation. This is believed to be the result of the
population of an extravalent orbital. Unfortunately,
this parameter is determined with less certainty than the
aforementioned excited state properties.
For molecules that do not possess axial symmetry,
the experiments yield less information, because angular
relationships of some of the excited state properties are
now known. However, the excited state dipole moment and
the angular change of the orientation of the net dipole
moment can be determined. In the work presented here, this
has led to the conclusion that the polarization of the
second singlet of ketones and aldehydes is in the plane of
the molecule. This fact also supports the 3sn molecular
Rydberg assignment.
Finally, the pressure studies, which were begun simply
to check an assumption about the effects of the arc
suppressor gas used in experiments, yielded some interesting
results. The Lorentz model of a dielectric medium is often
applied as a correction for the effects of solvent environ-
ment in a variety of experiments, including liquid phase
electrochromism spectroscopy. The work here would indicate
that this is not correct. If the Lorentz model is insuf-
ficient to describe the observed phenomena at relatively
low gas pressures (less than 15 atmospheres), then it should
not fair well in solution phase work. This work involving
142
sulfur hexafluoride has led to the conclusion that the
Onsager model is more realistic and should be applied to
systems where the local field about a molecule may affect
experimental results. In the present work, the results
indicate that this is the case for electrochromism and
electric linear dichroism spectroscopy. Therefore,
spectra are obtained at the lowest possible pressures and
comparison are made only between spectra recorded at the
same "solvent" gas pressure.
Future Studies
The electric dichroism spectroscopy of Rydberg states
is essentially at the threshhold. From this point, there
are a number of possible extensions of the present work.
One of the most needed studies would involve the charac-
terization of Rydberg states of different orbital symmetry,
particularly the first p type molecular Rydbergs. The
dipole moments have been predicted theoretically for a
limited number of molecules in these states. These pre-
dictions cannot be verified by conventional spectroscopy.
The next question involving Rydberg states is the relation
of the charge-transfer character of the Rydberg transition
with respect to substituents. The present work could be
extended to include a variety of substituents and
chromophores, with the goal of providing information about
143
the location of electron density in Rydberg excited states
and how this relates to the energies of these states.
Both of the studies suggested here are also needed for
molecules in higher point groups, where degeneracies exist.
Electric field studies would give new information about
such phenomena as spin-orbit coupling in excited states.
Preliminary work of this nature on methyliodide and hydrogen
iodide has already begun. The most difficult extension
of the present work would be the study of the excited
states of molecules with no electric dipole moment in
their ground states. Many terms would be dropped from
the theoretical expressions and the effect would be
greatly decreased, but those spectra that might be obtained
would result from only polarizability (induced dipolar
effects) and/or excited state dipole moments. Work of
this type would be a consequence of the consideration of
degenerate systems.
Another challenging question to answer involves the
electric field effects on vibrational components of an
excited state. In all of the work completed to date,
only the 0-0 bands were considered. It has been conjec-
tured that vibrationally excited states will give the
same dipole moment changes as the 0-0 components. This
may be true for simple excitations, where degeneracies do
not exist and the vibrational motion is harmonic.
144
In molecules where vibronic interactions are strong and
electronic and vibrational wave functions are badly
mixed, this may not be true. Electric dichroism spectro-
scopy offers a way to gain new knowledge concerning these
basic effects in both extravalent and intravalent excited
states.
Investigation of intravalent states is, in itself, an
area for expansion of electric field studies. The intra-
valent excited states are generally more chemically important
due to larger quantum yields in their photochemistry and
easy accessibility in conventional spectrometric systems.
The Rydberg state is more nonbonding in character and less
likely to give rise to photochemical reactions. The
electronic distribution in the intravalent excited state
would give new insight into reaction mechanisms for photo-
lytic processes. The difficulty in this work would be
decreased signal intensity due to the broadness of most
intravalent absorptions. Signal-to-noise ratios
presently encountered in this type of work would have to
be increased, so that weak signals could be detected.
The pressure effects discussed in Chapter III offer
a possibility for additional research. The nature of
the interaction of gases at various pressures can be probed
effectively with electric dichroism spectroscopy. The
reasons for anomalous behavior of mixed gases and liquids
145
may be discovered in studies like the one completed here
for sulfur hexafluoride. Additionally, on a practical
level, the need for effective low pressure arc suppressor
gases has been demonstrated. Work involving new gas
mixtures used to this end would be beneficial to the
spectroscopy and of interest commercially, where there
exists a need for new highly non-conductive materials.
The use of sulfur hexafluoride in high voltage equipment
is evidence of this interest.
The suggested studies given here could be accomplished
with the existing equipment. Because there are so many
possibilities for additional work, it would appear that the
types of vacuum ultraviolet electric dichroism spectroscopy,
described herein, have a good future and will provide years
of interesting research into the fundamental properties
of the excited states of polyatomic molecules in a region
of their spectra not normally available to the conventional
spectroscopist.
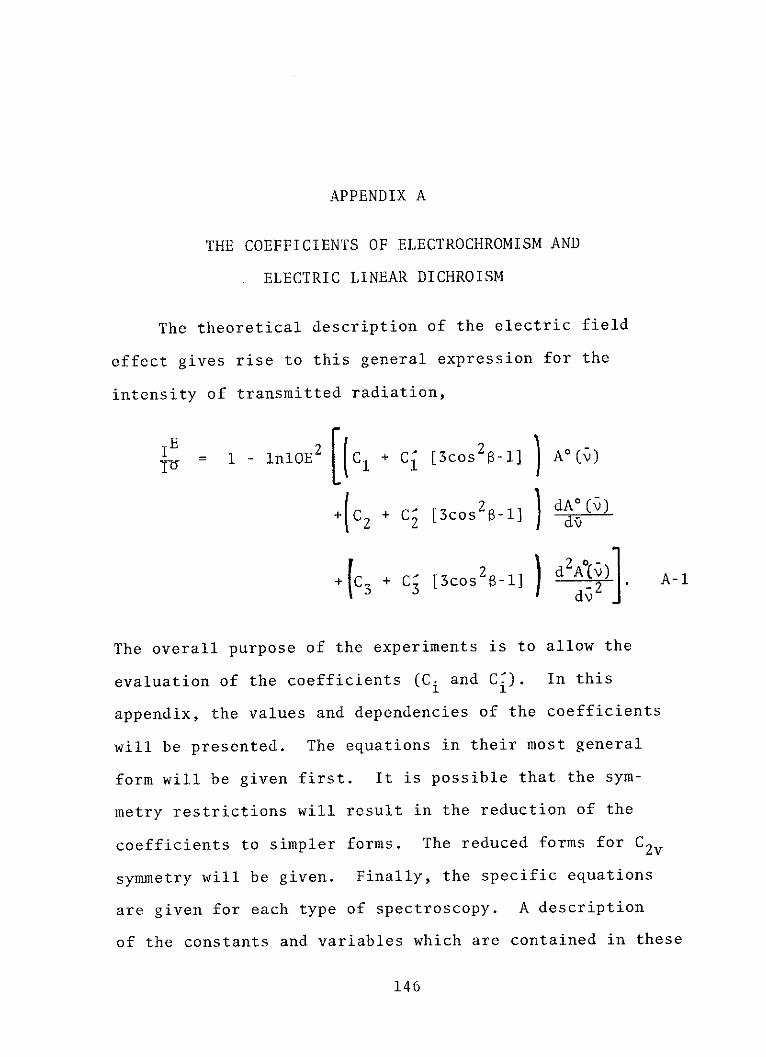
APPENDIX A
THE COEFFICIENTS OF ELECTROCHROMISM AND
ELECTRIC LINEAR DICHROISM
The theoretical description of the electric field
effect gives rise to this general expression for the
intensity of transmitted radiation,
= 1 - lnlOE2 C1 + C' [3cos 2 -1] A*()
+(C2 + C2 [3cos2 -1] ) dA (v)+ 3+C' [3cos2 ')1 d-A2 . A-l
3 3L ldv 2
The overall purpose of the experiments is to allow the
evaluation of the coefficients (Ci and Ci). In this
appendix, the values and dependencies of the coefficients
will be presented. The equations in their most general
form will be given first. It is possible that the sym-
metry restrictions will result in the reduction of the
coefficients to simpler forms. The reduced forms for C2 v
symmetry will be given. Finally, the specific equations
are given for each type of spectroscopy. A description
of the constants and variables which are contained in these
146
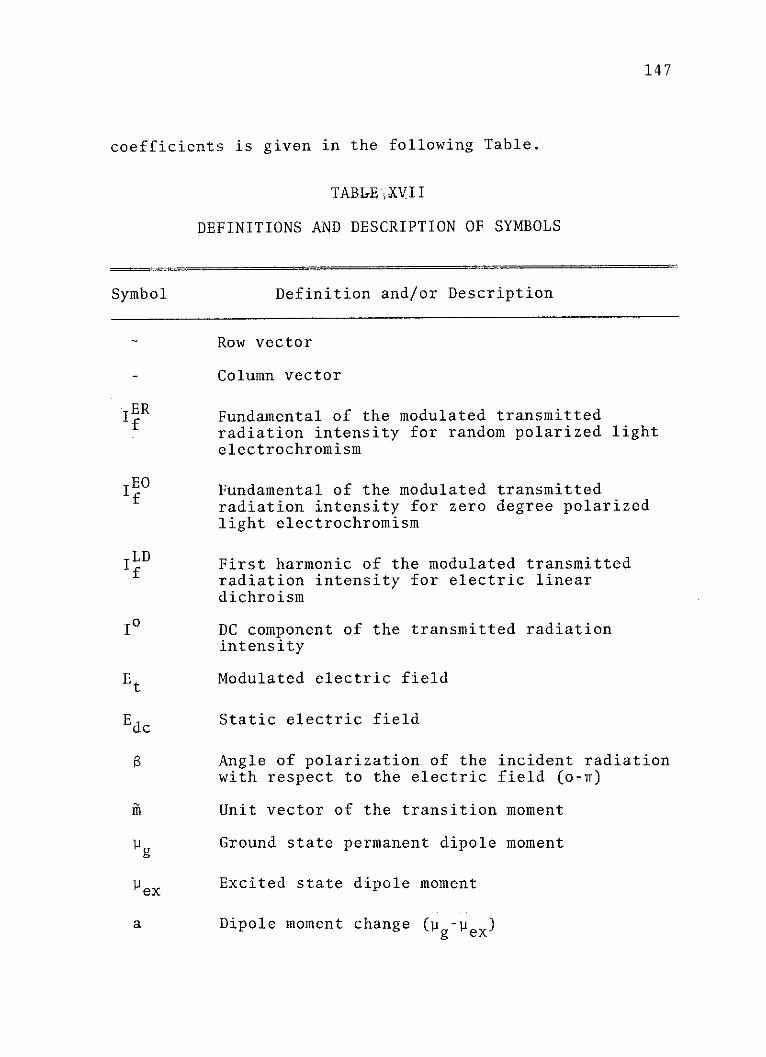
147
coefficients is given in the following Table.
TABLE)(XVII
DEFINITIONS AND DESCRIPTION OF SYMBOLS
Symbol Definition and/or Description
Row vector
- Column vector
IER Fundamental of the modulated transmittedradiation intensity for random polarized light
electrochromism
IE0 Fundamental of the modulated transmittedradiation intensity for zero degree polarizedlight electrochromism
ILD First harmonic of the modulated transmittedradiation intensity for electric lineardichroism
10 DC component of the transmitted radiationintensity
Et Modulated electric field
Edc Static electric field
Angle of polarization of the incident radiationwith respect to the electric field (o-7r)
i Unit vector of the transition moment
g Ground state permanent dipole moment
SexExcited state dipole moment
a Dipole moment change (u -y ex)
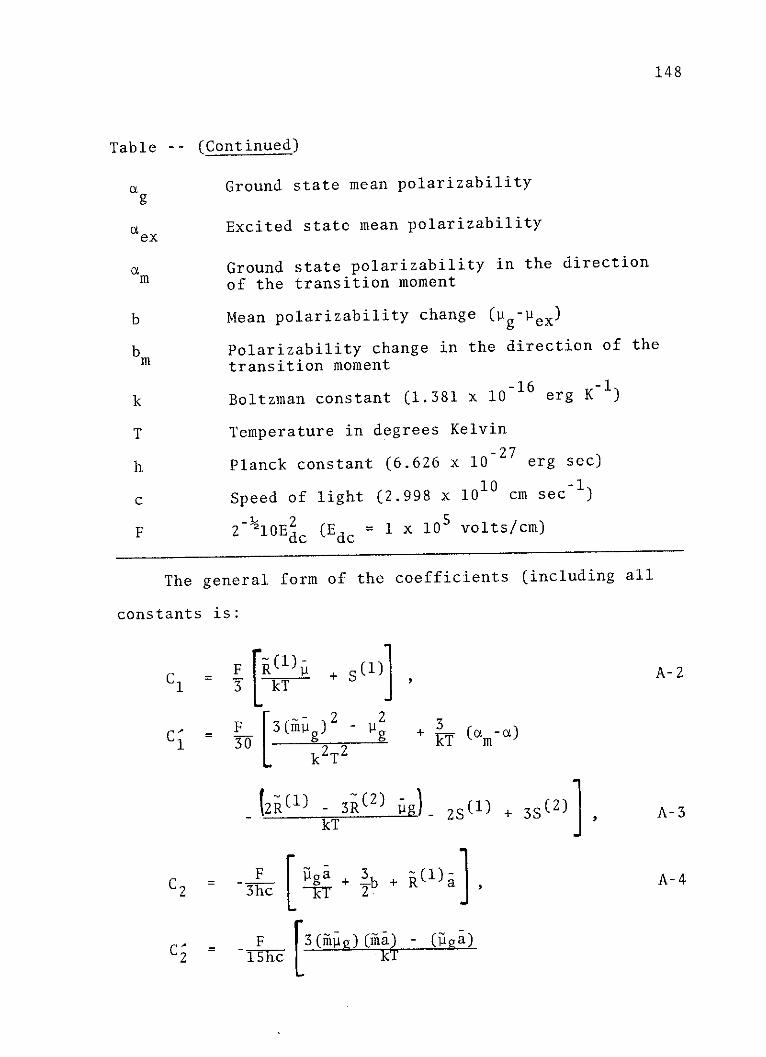
148
Table -- (Continued)
a Ground state mean polarizability
aex Excited state mean polarizability
a Ground state polarizability in the directionm of the transition moment
b Mean polarizability change (l g-ex)
b Polarizability change in the direction of the
m transition moment
k Boltzman constant (1.381 x 10⁻¹⁶ erg K1)
T Temperature in degrees Kelvin
h Planck constant (6.626 x 10⁻²⁷ erg sec)
c Speed of light (2.998 x 1010 cm sec~ )
F 2~ 10Edc (Edc = 1 x 10⁵ volts/cm)
The general form of the coefficients (including all
constants is:
[_ F R) + S (l)]A-2C1 3 kT
F [3;+ (~-x1T-
30 L k2T 2)m
_t2Rl) - 3R(2) - 2(1) + 3S(2)] A-3kT
C2 = hc ~g + 3b + R()aA-4
_ CF [3(~g)(i) - (iaig)C2 ~ ~hc kT
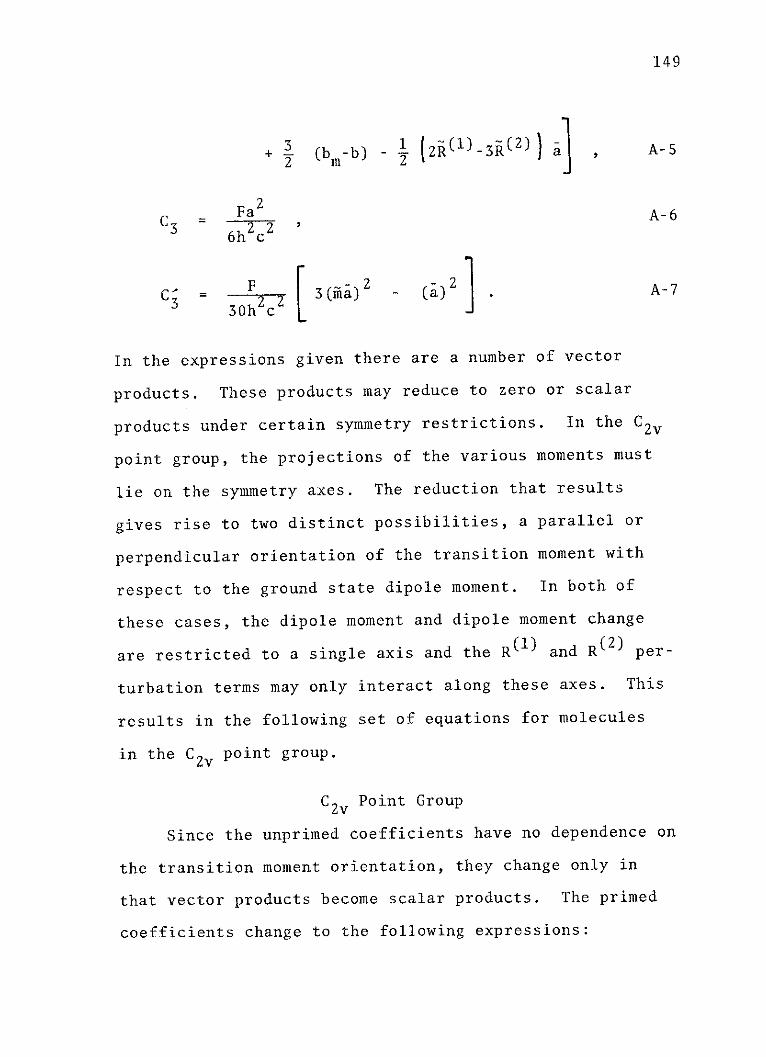
149
+ 3 (b-b) - 1 (2R ()-3R(2)) a , A-52 m2
C = Fa A-6C3 - 2 2'
6h c
C' = 3(ma)2 - (a2 .A-7
In the expressions given there are a number of vector
products. These products may reduce to zero or scalar
products under certain symmetry restrictions. In the C2v
point group, the projections of the various moments must
lie on the symmetry axes. The reduction that results
gives rise to two distinct possibilities, a parallel or
perpendicular orientation of the transition moment with
respect to the ground state dipole moment. In both of
these cases, the dipole moment and dipole moment change
are restricted to a single axis and the R( and R(2) per-
turbation terms may only interact along these axes. This
results in the following set of equations for molecules
in the C2 v point group.
C2 v Point Group
Since the unprimed coefficients have no dependence on
the transition moment orientation, they change only in
that vector products become scalar products. The primed
coefficients change to the following expressions:
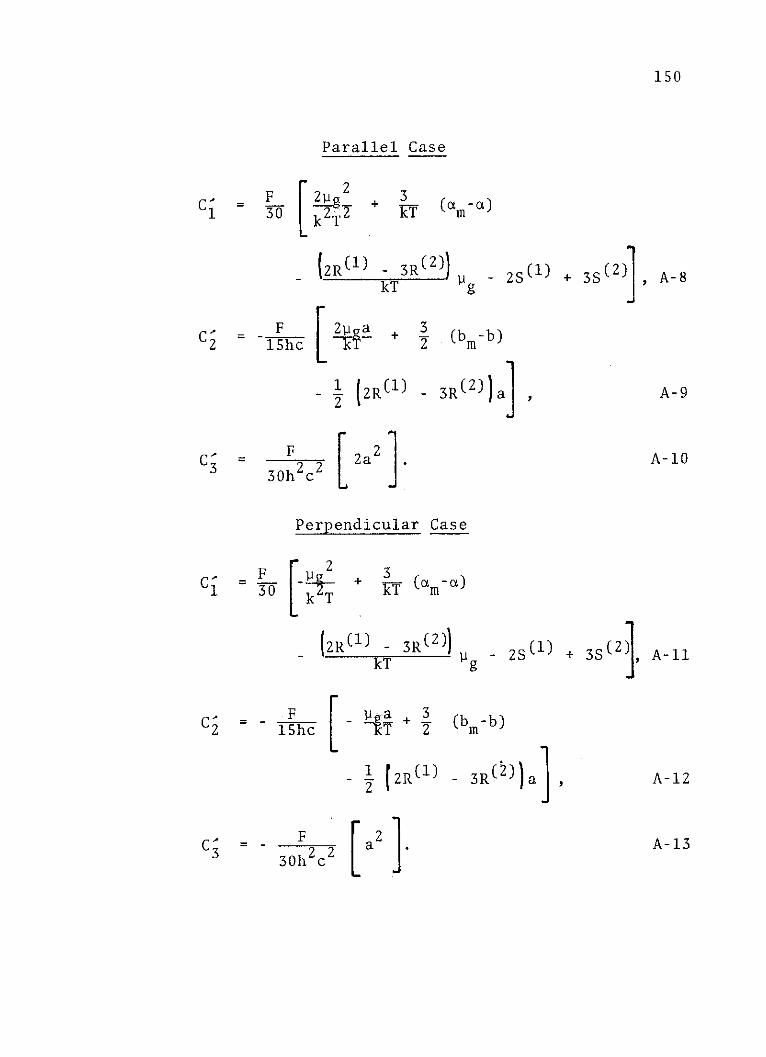
150
Parallel Case
[ 1 2
+ 3(am-a)
(2R(1 - 3R(2)kT g
F2 =y 15 hc F21a a + 3
2
2S ( +3S(2)j, A-8
(b-b)
- R (1) - 3R(2)) a ,
C = F
3 30h2c22a2].
Perpendicular Case
_ (2R(') - 3R(2))kT g
~T + 3
- 2S( 1 + 3S(2)]
(b-b)
- 1 (2R(') - 3R(2) a ,
a2]
C'
A-9
A-10
Ci = - 2 + 3i-T Cay a
S Shc IA-1l
F
30h c2
A-12
A-13
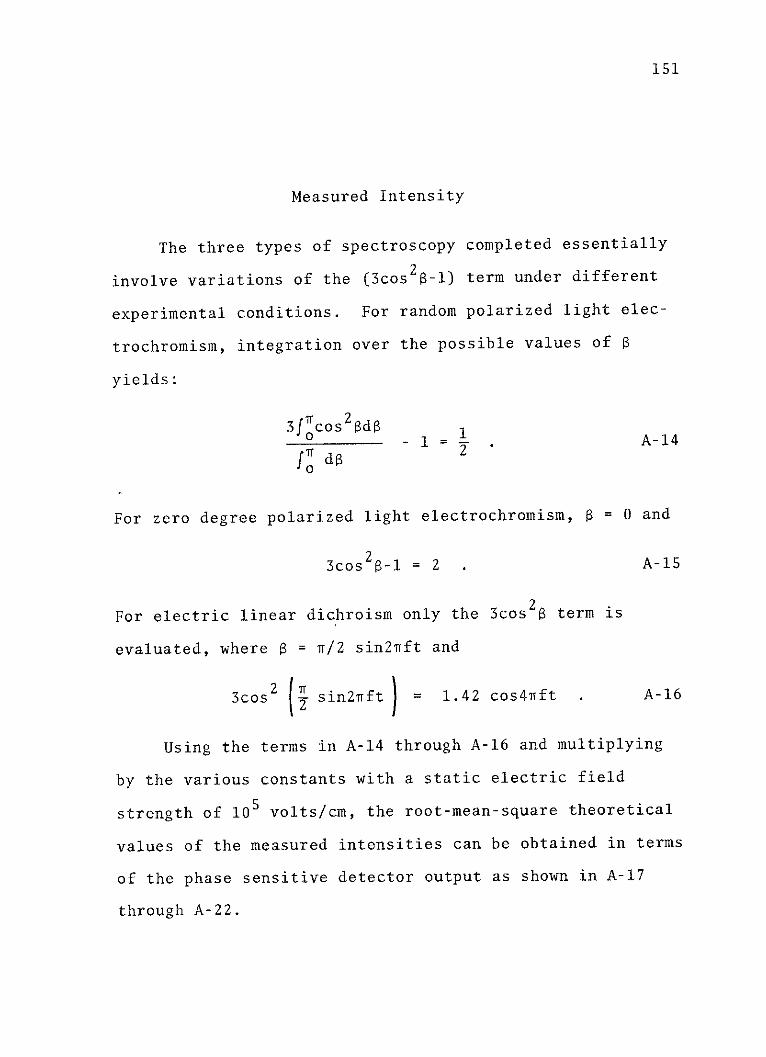
151
Measured Intensity
The three types of spectroscopy completed essentially
involve variations of the (3cos2t-l) term under different
experimental conditions. For random polarized light elec-
trochromism, integration over the possible values of Q
yields:
3focos 2 3d. -1 = 1 A-14
fo d
For zero degree polarized light electrochromism, f = 0 and
3cos2 -l = 2 . A-15
For electric linear dichroism only the 3cos2 term is
evaluated, where = /2 sin2'rft and
3cos2 (Z sin2Trft = 1.42 cos4Trft . A-16
Using the terms in A-14 through A-16 and multiplying
by the various constants with a static electric field
strength of 105 volts/cm, the root-mean-square theoretical
values of the measured intensities can be obtained in terms
of the phase sensitive detector output as shown in A-17
through A-22.
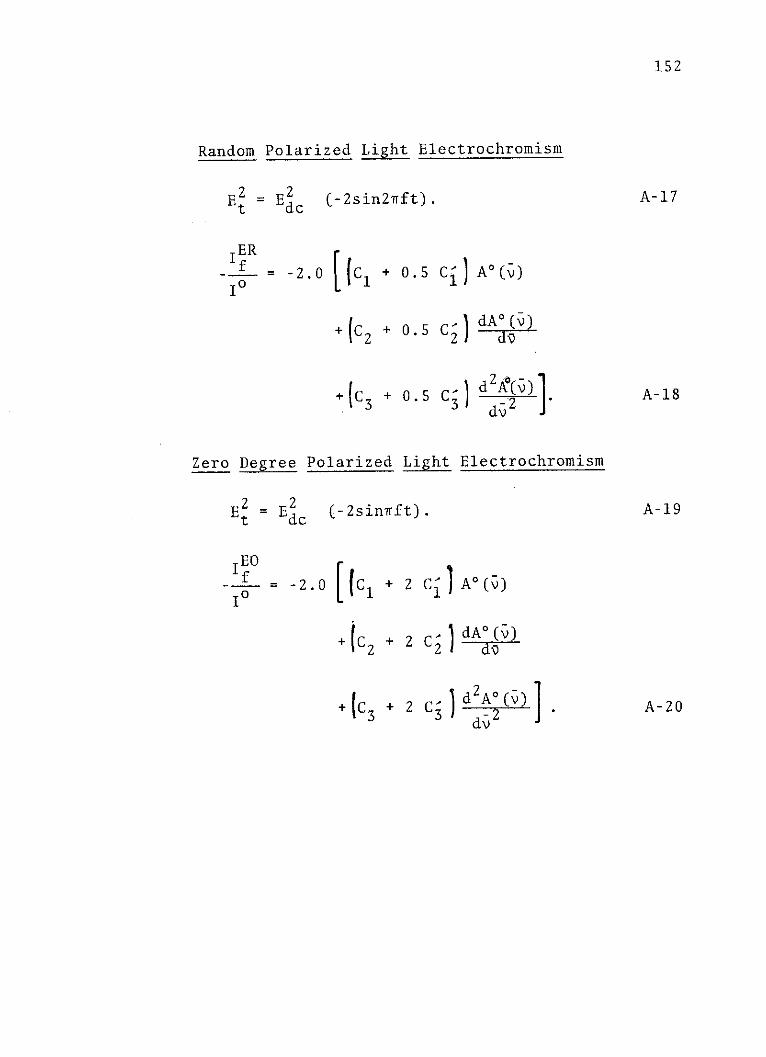
152
Random Polarized Light Electrochromism
A-17E2 = Ea (-2sin2nft).
[(CiER
- = -2.0f + 0.5 c") A*(v)
(C2 + 0.5 C2)
+ (C3
dA0 (v)
+ 0.5 C) d 2 A-18
Zero Degree Polarized Light Electrochromism
Et = Edc (-2sinnft).
EO
-__ = -2.0 [Ci + 2 C'1A(v)
+ (C2
+ (C3
A-19
dA 0 (v)+ 2 C'
+ 2 C3 d2A*(] .2dv
A-20
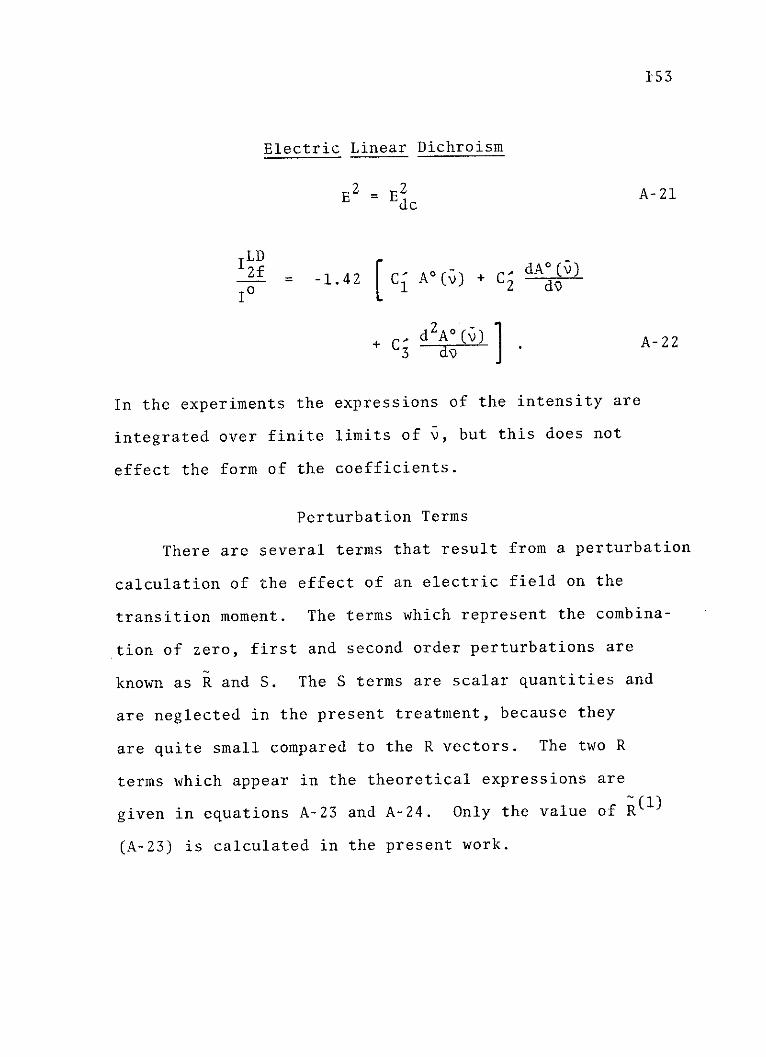
153
Electric Linear Dichroism
E2-= E2 A-21dc
LD
I 2f dA* (v)o = -1.42 C' AO(V) + C2 dv
+ C' d 2 A*(v) 1A-223 d \
In the experiments the expressions of the intensity are
integrated over finite limits of v, but this does not
effect the form of the coefficients.
Perturbation Terms
There are several terms that result from a perturbation
calculation of the effect of an electric field on the
transition moment. The terms which represent the combina-
tion of zero, first and second order perturbations are
known as R and S. The S terms are scalar quantities and
are neglected in the present treatment, because they
are quite small compared to the R vectors. The two R
terms which appear in the theoretical expressions are
given in equations A-23 and A-24. Only the value of
(A-23) is calculated in the present work.
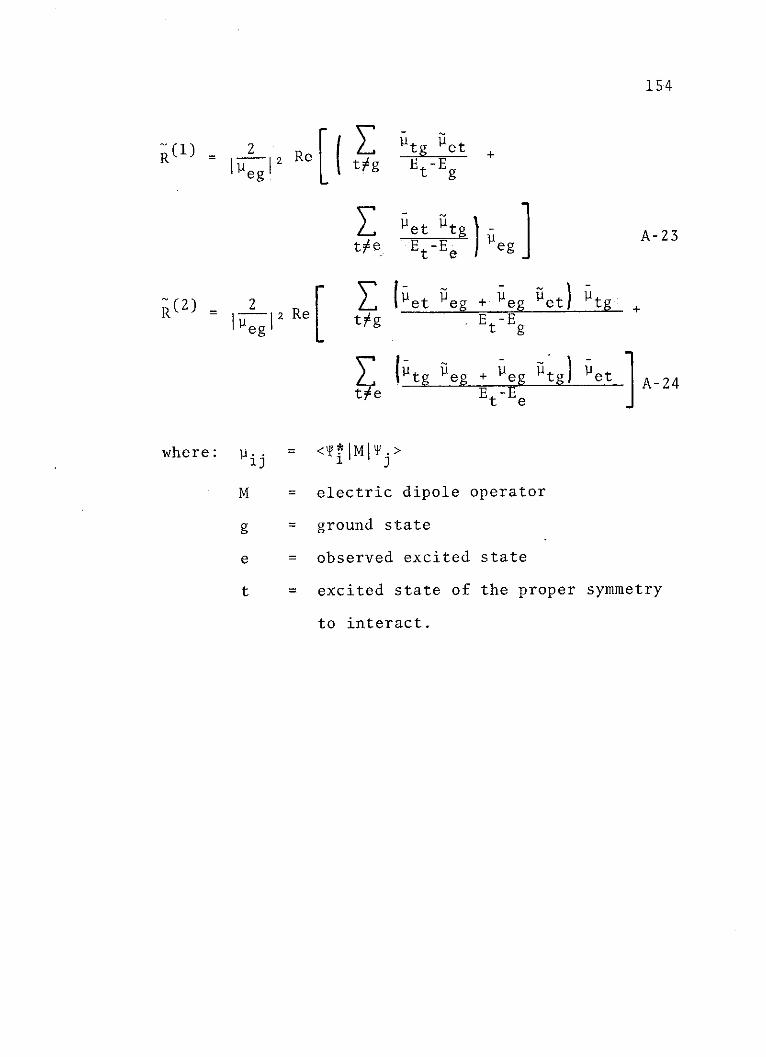
154
~(l) ReR 1 = I 2 Re
Peg
(2) _ e eR -pe 2 Re
where: p..1J
M
g
e
t
ztag
t ie
tag
t e
Ptg etE -Et g
et tg -
Et-E ) egA-23
et Peg + Peg et tg +Et-Etg
(tg 1eg +tegt et A-24
Et-Ee m
=<T* MI.>1
= electric dipole operator
= ground state
= observed excited state
= excited state of the proper symmetry
to interact.
APPENDIX B
PRELIMINARY ELECTROCHROMISM STUDY
The following is a copy of a publication which resulted
from preliminary electrochromism studies. In the paper,
the first gas phase electrochromism spectrometer designed
for use in the vacuum ultraviolet is described. Only
random polarized light electrochromism is discussed and
the numerical method has since been modified, but it repre-
sents an initial effort and marks the beginning of the
present work. The first electrochromism results for the
aniline Tr*+r, B2 +Al transition are given and compared to
results obtained using high resolution Stark field spec-
troscopy.
155
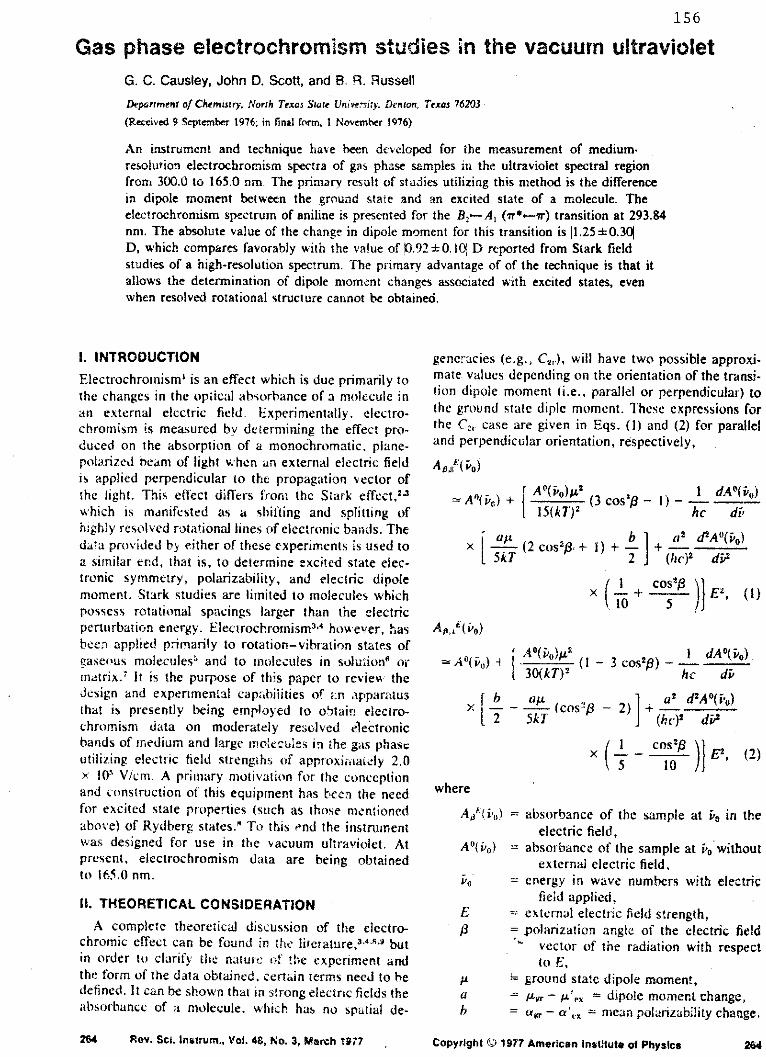
156
Gas phase electrochromisrn studies in the vacuum ultravioletG. C. Causley, John D. Scott, and B. R. Russell
Department of Chemistry. North Texas State Univeni:y. Denton. Texas 76203
(Received 9 September 1976; in final form, 1 November 1976)
An instrument and technique have been developed for the measurement of medium-resolution electrochromism spectra of gas phase samples in the ultraviolet spectral regionfrom 300.0 to 165.0 nm. The primary result of studies utilizing this method is the differencein dipole moment between the ground state and an excited state of a molecule. Theelectrochromism spectrum of aniline is presented for the B2.-A, (ir*+-7r) transition at 293.84nm. The absolute value of the change in dipole moment for this transition is 11.25+0.30D, which compares favorably with the value of 0.92 0.10 D reported from Stark fieldstudies of a high-resolution spectrum. The primary advantage of of the technique is that itallows the determination of dipole moment changes associated with excited states, evenwhen resolved rotational structure cannot be obtained.
I. INTRODUCTIONElectrochromism' is an effect which is due primarily tothe changes in the optical absorbance of a molecule inan external electric field. Experimentally. electro-chromism is measured by determining the effect pro-duced on the absorption of a monochromatic. plane-polarized beam of light when an external electric fieldis applied perpendicular to the propagation vector ofthe light. This effect differs front the Stark effect, 2 awhich is manifested as a shifting and splitting ofhighly resolved rotational lines of electronic bands. Thedata provided by either of these experiments is used toa similar end, that is, to determine excited state elec-tronic symmetry, polarizability, and electric dipolemoment. Stark studies are limited to molecules whichpossess rotational spacings larger than the electricperturbation energy. Electrochromism3'4 however, hasbeen applied primarily to rotation-vibration states ofgaseous molecules and to molecules in solu ion" ormatrix.7 It is the purpose of this paper to review thedesign and experimental capabilities of an apparatusthat is presently being employed to obtain electro-chromism data on moderately resolved electronicbands of medium and large moecutes in the gas phaseutilizing electric field strengths of approxiz1 iately 2.0x 10 V/cm. A primary motivation for the conceptionand construction of this equipment has been the needfor excited state properties (such as those mentionedabove) of Rydberg states." To this end the instrumentwas designed for use in the vacuum ultraviolet. Atpresent, electrochromism data are being obtainedto 165.0 nm.
1I. THEORETICAL CONSIDERATIONA complete theoretical discussion of the electro-
chromic effect can be found in the literature, 3 "4 butin order to clarify the nature of the experiment andthe form of the data obtained, certain terms need to bedefined. It can be shown that in strong electric fields theabsorbance of a molecule. which has no spatial de-
264 Rev. Sci. instrum., Vol. 48, No. 3, March 1977
generacies (e.g., C21), will have two possible approxi-mate values depending on the orientation of the transi-tion dipole moment (i.e., parallel or perpendicular) tothe ground state diple moment. These expressions forthe C2, case are given in Eqs. (1) and (2) for paralleland perpendicular orientation, respectively,
AggE( i's
A9 A_(te) +r A '(yo)p2((3 cos/ - -)---d- (w15(kT) 2 he di'
[- j osP ]d2ap b rigd&A*(v0)x _(2 Cos 2 + () + )
+ - (kT 2 (kT1he di
SI cos*x _- _ E2, (
10
40AU ~"I dA (vu)
w e30(kT)2 he di
b i abso a t d2Ai(it)X - - --- .- (cos -#3 - 2) + --._.2 5ket (he)2 d
/5 10sg
where
A/b)=absorbance of the sample at a 3 in the
electric field,A0 ( i') = absorbance of the sample at i'0 without
external electric field,=energy in wave numbers with electric
field applied,E external electric field strength,p = polarization angle of the electric field
vector of the radiation with respectto E,
. i= ground state dipole moment,a = y, - s" = dipole moment change,h = X, - a, = mean polarizability change.
Copyright ) 1977 American Institute of Physics 264
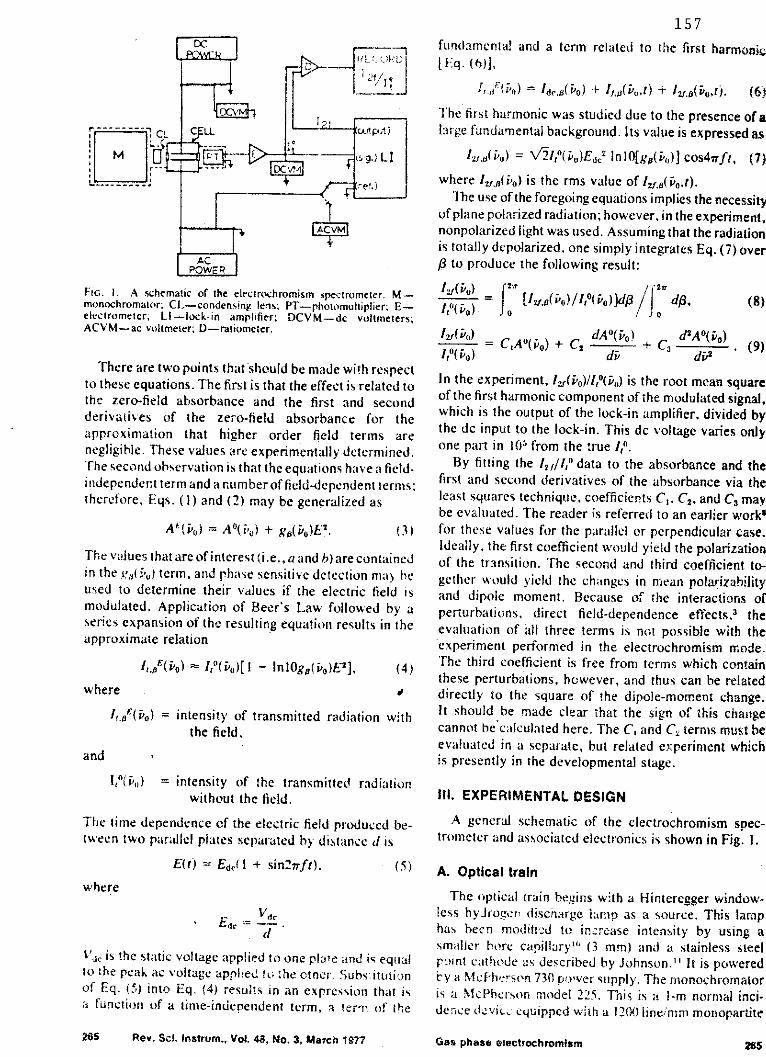
Dc
iLiJ~ CL CELL ouipAt)
L. 'et.
ACPOWER
FIG. 1. A schematic of the electrochromism spectrometer. M-monochromator; CL-condensing leis; PT- photomultiplier; E-electrometer; LI-lock-in amplifier; DCVM--dc voltmeters;ACVM-ac voltmeter; D-ratiometer.
There are two points that should be made with respectto these equations. The first is that the effect is related tothe zero-field absorbance and the first and secondderivatives of the zero-field absorbance for theapproximation that higher order field terms arenegligible. These values are experimentally determined.The second observation is that the equations have a field-independent term and a number of field-dependent terms;therefore, Eqs. (1) and (2) may be generalized as
AA(i 0 ) =A(i) + ge(i')E2 . (3)
The values that are of interest (i.e., a and h) are containedin the g(,o) term, and phase sensitive detection ma beused to determine their values if the electric field ismodulated. Application of Beer's Law followed by aseries expansion of the resulting equation results in theapproximate relation
,J(i0) 1(i)[ -lnlOg8(i 0)E2), (4)
where d
I.J() = intensity of transmitted radiation withthe field,
and
= intensity of the transmitted radiationwithout the field.
The time dependence of the electric field produced be-tween two parallel plates separated by distance d is
E(t) = Ed(.(l + sin27rft), (5)
where
Vrie
V is the static voltage applied to one plate and is equalto the peak ac voltage apph:ed to the otner. Substitutionof Eq. (') into Eq. (4) results in an expression that isa function of a time-independent term, a term of the
265 Rev. SO. Instrum., Vol. 48, No. 3, March 1977
157
fundamental and a term related to the first harmonic[q. (6)J,
1, d) = 3(to) + I .U('0,t) + (.i0,z). (6)
The first harmonic was studied due to the presence of alarge fundamental background. Its value is expressed as
12f.,f b) = \/2fiJ((I)EaC2 InlO[g(5,)] cos47rft, (7)
where J2, 3 (i'o) is the rms value of l2f.u('ot).The use of the foregoing equations implies the necessity
of plane polarized radiation; however, in the experiment,nonpolarized light was used. Assuming that the radiationis totally depolarized, one simply integrates Eq. (7) overp to produce the following result:
Ir * -- o J2,((') - f~ a 2l It(ord d , (8)
Iy( o) - dA (vo) d2 (p )= C,A() + C2 dA(') + C d.)(9)le"(vo) d b
In the experiment, 12,(io)/I,0 (io) is the root mean squareof the first harmonic component of the modulated signal,which is the output of the lock-in amplifier, divided bythe de input to the lock-in. This dc voltage varies onlyone part in l05 from the true f,0.
By fitting the I2/I, data to the absorbance and thefirst and second derivatives of the absorbance via theleast squares technique, coefficients C,. C2, and C3 maybe evaluated. The reader is referred to an earlier work'for these values for the parallel or perpendicular case.Ideally, the first coefficient would yield the polarizationof the transition. The second and third coefficient to-gether would yield the changes in mean polavizabilityand dipole moment. Because of the interactions ofperturbations, direct field-dependence effects,3 theevaluation of all three terms is not possible with theexperiment performed in the electrochromism mode.The third coefficient is free from terms which containthese perturbations, however, and thus can be relateddirectly to the square of the dipole-moment change.It should be made clear that the sign of this changecannot he calculated here. The C, and C2 terms must beevaluated in a separate, but related experiment whichis presently in the developmental stage.
Ill. EXPERIMENTAL DESIGN
A general schematic of the electrochromism spec-trometer and associated electronics is shown in Fig. 1.
A. Optical train
The optical train begins with a Hinteregger window-less hyJroge[ discharge lamp as a source. This lamphas been modticd to increase intensity by using asmaller bore capillary'{ (3 mm) and a stainless steelpoint cat rode as described by Johnson." It is powerediy a McPherson 730 po'ver supply. The monochromatoris a McPherson model 225. This is a 1-m normal inci-dence devie equipped with a 1200 line/mm monopartite
Gas phase eiectrochromism 25

158
grating blazed at 1500 A and has a dispersion of 8.3 A!mm. Following the exit slit of the monochromator is afocusing CaF2 cylindrical lens from Frank Cooke, Inc.It is held in a 10-cm-diam aluminum housing which isevacuated by the monochromator pumpiig system. Thelight beam emergent from the rns is passed between theplates of the eiectrochromism cell (described odow).The transmitted radiation is detected by an Emitronics(EMI) 9635 QB quartz-faced photomultiplier tube. Thetube housing is evacuated by the monochromator purnp-ing system, thus eliminating the need for a scintillator.The power supply for the photomultiplier is a HarnnerElectronics Co. model N-4035 dc pover supp!v. it isimportant to note the danger to the photomtultipliertube if the pressure in the vacuum system is allowed torise with a voltage still applied to the tube base. Arc-ing will occur at approximately I Torr with the inevitabledestruction of this relatively expensive tube. The tubeis spaced 17.8 cm from the cell to reduce the field effects.
B. Electrochromism cell
A cross section of the cell used is shown in Fig. 2. It issimilar in design to the cell of Boyd, Brannon, andGailer.' 2 It is a hollow aluminum tube, 10 cm indiameter, with 1.27-cm-thick walls. The plates arepolished stainless steel at a separation of 0.160 cm. Theyare mounted on Plexiglas holders and designed suchthat no spacers are used between the plates. Care wastaken to remove any sharp points or edges to minimizethe possibility of arcing. To the same end, samples arenecessarily run in the presence of approximately 3.5-7kg cm 2 of ultrapure SF6 (from Matheson), which elimi-nates arcing and minimizes corona to field strengths of2.5 x 10 V/cm. It has been found to be best to draw theSF6 from the liquid phase and to bring the SF pressureup over an extended period of time, stepping the pres-sure up 0.35-0.7 kg cm 2 at a time, thus allowing evenmixing of sample and SF6 . As shown in Fig. 2, specialattention was given to seals so that the cell would becapable of maintaining high vacuums as well as highpressures. The windows are 3.18-mm-thick quartz (uvgrade) from ESCO. They are 254 cm in diameter andin the present configuration give the cell a total pressurerange of from 1.0 x 10 Torr to 28 kg cm 2. The high-voltage feedthroughs are 7.6 cm ceramic spacers withmetal to ceramic sealed collars which are silver solderedinto copper pipe fittings. Teflon pipe tape is used to as-sure vacuum tight seals. To minimize th': possibility ofarcing on the exterior of the cell between the feed-throughs and the cell housing, the entire arrangementcan be placed in a plastic bag filled with I atm of SF6.
C. Electronics
The high-voltage dc source is a simple half-waverectified source with L-section .C filtration. The acsource utilizes a Hewlett-Packard model 200C1 sine-wave generator, the output of which is amplified by aSouthwest Technical Products "Tiger" 80 W amplifier.
266 Rev. SO.I. Instrum., Vol. 48. No. 3, March 1977
w p -!4w p
ph pr
f t--
FIG. 2. Crass-sectionat di-gram of the sample ceU. t--high - voltage-high- vacuumfeedthroughs; g--gas inlet:ph-lexiglas plate holders;p-stainless steel plates;s--the platcholder screws; w-optical windows; r-threaded window retainerrings:o-O-rings: wp- win-dow plates which bolt to thecell body.
This signal is then stepped up by a 1:400 transformerfrom the Universal Transformer Co., Wylie, TX. A simi-lar transformer is used in the dc source. By droppingthe large voltages (both ac and dc) to ground across largeprecision resistors and measuring the voltage dropacross a very small fraction of the total resistance, thefield strengths could be monitored. In addition, thevalues of the voltages were measured directly. The dehigh voltage is measured with the Fluke model 80K-40high-voltage probe. The ac voltage is checked with anITT Jennings model 13200 vacuum capacitance voltagedivider. The use of the high-voltage divider allows thefield strength to be known to -1%.
The experiment is generally run in two parts. The firststep is the aquisition of zero-field values of A, dA/di'and 2A/Iv2. After minor modification, the McPhersonmodel 782 logarithmic ratiometer is used to obtain ab-sorbance data. The output of the ratiometer is also sentto an electronic differentiator, the output of which isconverted to dA/d. The dA/d' 2 data are numericallygenerated. The second part of the experiment involvesthe measurement of I..I,1. To this end, the output fromthe phototube (with the field on) is fed to an electrometerfor current to voltage conversion. The resulting voltageis sent (1) to the denominator of a divider circuit and(2) to the input of an Ithaco model 391A lock-in amplifierwhich is referenced in the 2f mode to the relativelysmall ac voltage mentioned above. The lock-in output isthe numerator input of the divider circuit. The outputof this circuit is recorded on a Houston model 2000X- Y plotter. The various operational amplifiers, elec-trometers, and integrated circuits used to build the ancil-lary equipment were purchased from Analog Devices,Inc. The final output has a typical signal-to-noise ratioof 6:1. Attempts have been made to filter the signalfurther, but inevitably have led to signal attenuation.This problem has led to the use of numerical techniquesto refine the data. In this case, a three-point smoothingpolynomial has been applied to the data before finalfitting is attempted.
IV. RESULTS
The electrochromism spectrum of the r* -r,B;-- A, band of aniline was recorded and studied so thatthe system might he tested. The absorption is found at293.84 nm and has been studied by' lombardi using theoptical Stark effect to determine excited state dipolemoment change.'-" In his first study,' 3 Lombardi foundthe absolute value of the dipole moment change for
Gas phase electrochromism 266
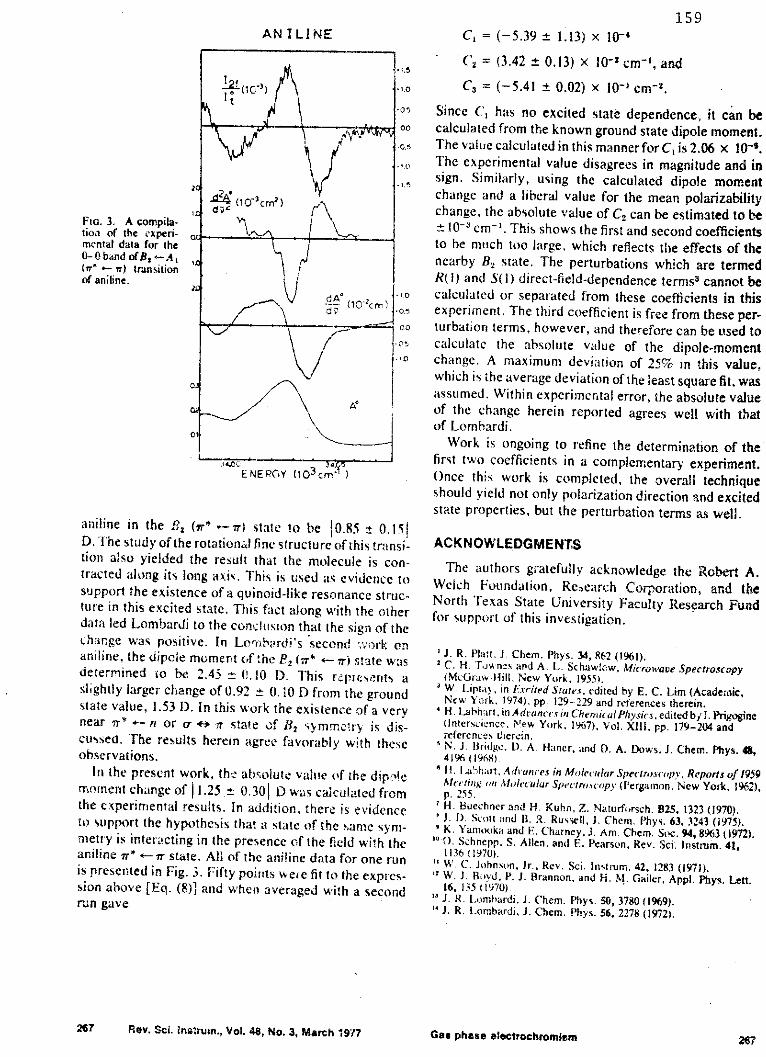
ANILINE
It
1 ?0
(10 3 cm2 )1.a
Ii*
:1
"'.S
. c
ENEPOY (103 Cm- )
aniline in the B2 (r'* - r) state to be 10.85 t 0.15|D. 1 he study of the rotational fine structure of this transi-tion also yielded the result that the molecule is con-tracted along its long axis. This is used as evidence tosupport the existence of a quinoid-like resonance struc-ture in this excited state. This fact along with the otherdata led Lombardi to the conclusion that the sign of thechange was positive. In Lormbiard 's second ;work onaniline, the dipole moment of the P2 (-r* +- 7r) state wasdetermined to be 2.43 . 10 D. This r epesents aslightly larger change of 0.92 -0.10 D from the groundstate value, 1.53 D. In this work the existence of a verynear 7* +- n or r +H : state of B 2 syrnrcmry is dis-cussed. The results herein agree favorably with theseobservations.
hi the present work, the absolute value of the dip }emoment change of 11.25 . 0.301 D was calculated fromthe experimental results. In addition, there is evidenceto support the hypothesis that a state of the same sym-metry is interacting in the presence of the field with theaniline rr*+- state. All of the aniline data for one runis presented in Fig. 3. Fifty points were fit to the expres-sion above [Eq. (8)] and when averaged with a secondrun gave
FIo. 3. A compila-tion of the experi-mental data for the0-0 band of B2--A,
- transitionof aniline.
3 J. R. Lombardi, J. Chem. Phys. 50, 3780 (199)." J. R. Lornbardi, J. Chem. Phys. 56, 2278 (1972).
267 Rev. Sc. in rumn., Vol. 48, No. 3, March 1977? Gas phase electrochromlsm
159C, = (-5.39 1.13) x 104
C2 = (3.42 0.13) x 10-2 cm', and
C3 = (-5.41 0.02) x 10' cm-2.
Since C, has no excited state dependence, it can becalculated from the known ground state dipole moment.The value calculated in this manner for C, is 2.06 x 10.The experimental value disagrees in magnitude and insign. Similarly, using the calculated dipole momentchange and a liberal value for the mean polarizabilitychange, the absolute value of C2 can be estimated to be
10 3 cm'. This shows the first and second coefficientsto be much too large, which reflects the effects of thenearby 82 state. The perturbations which are termedR(l) and S(1) direct-field-dependence terms3 cannot becalculated or separated from these coefficients in thisexperiment. The third coefficient is free from these per-turbation terms, however, and therefore can be used tocalculate the absolute value of the dipole-momentchange. A maximum deviation of 25% in this value,which is the average deviation of the least square fit, wasassumed. Within experimental error, the absolute valueof the change herein reported agrees well with thatof Lombardi.
Work is ongoing to refine the determination of thefirst two coefficients in a complementary experiment.Once this work is completed, the overall techniqueshould yield not only polarization direction and excitedstate properties, but the perturbation terms as well.
ACKNOWLEDGMENTS
The authors gr atefully acknowledge the Robert A.Welch Foundation, Research Corporation, and theNorth Texas State University Faculty Research Fundfor support of this investigation.
J. R. Platt, J. Chem. Phys. 34, 862 (1961).2 C. H. Townes and A. L. Schawkcw, Microwave Spectroscopy
(McGraw Hill, New York. 1955).W Lipiay. in Excited States, edited by E. C. Lin (Academic,New Yo rk, 1974), pp. 129- 229 and references therein.H . Labhrt in Advances in Chemical Physics, edited by I. Prigogine(lntersienc. New York, 1947), Vol. Xlii, pp. 179-204 andreferences Ltherein.
' N. J. Bridge. e. A. Haner, and D. A. Dows, J. Chem. Phys. 48,41% (1968).
" 1. I .aWhart, Aduances in Molecular Spec trscS tpV, Reports of 1959ee inug on ,Mol(ecular Spe'ctro scopy ((Pergamon, New York. 1962),
p. 255.H. Buechner and H. Kuhn, Z. Naturfursch. B25, 1323 (1970).J. ). Scott and B, R. Russell, J. Chem. Phys. 63. 3243 (1975).K. Yamooka and F. Charney, J. Am. Chem. Soc. 94, 8963 (1972).
iO 0. Schnepp. S. Allen. and E. Pearson, Rev. Sci. iristrum. 41,1136 (1970)." W C. Johnson, Jr., Rev. Sci. Instrurn. 42, 1283 (1971).
" W. J. BOyd, P. J. Brannon, and H. M. GailCr, Appl. Phys. Lett.16, 135 (1970).
WA I
I
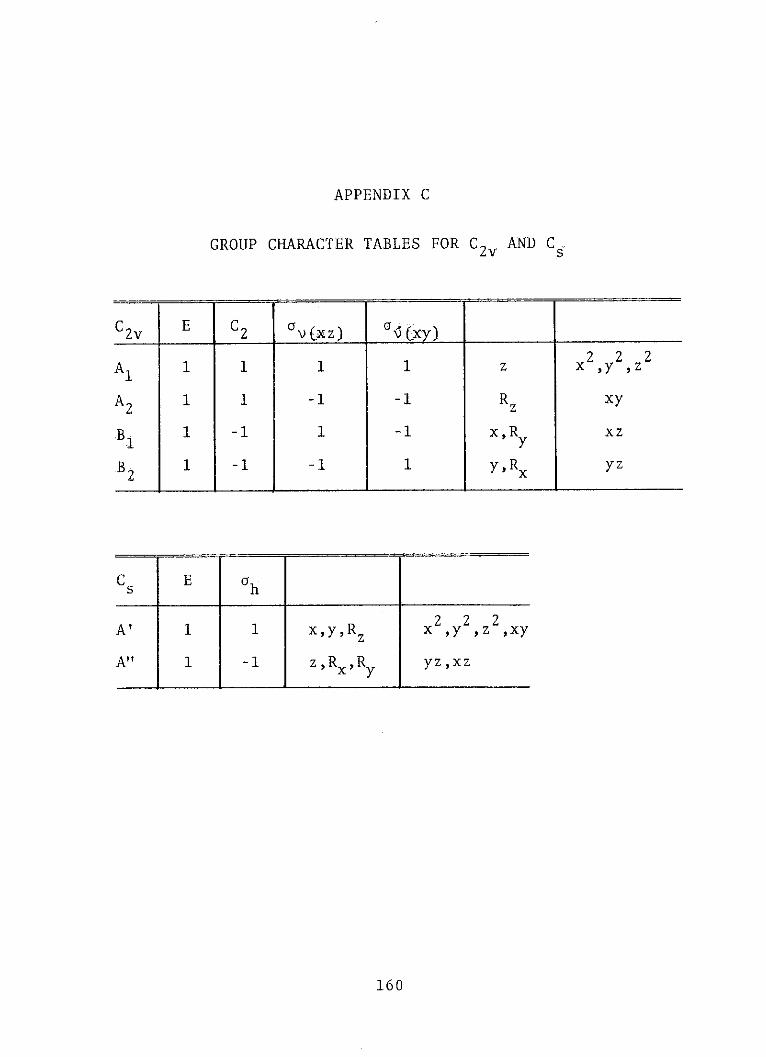
APPENDIX C
GROUP CHARACTER TABLES FOR C2v AND C
C2v E C2 &v(xz) v6xy)
2 2 2A 1 1 1 1 z x ,y ,z1
A2 1 1 -1 -1 Rzxy
B 1 -1 1 -1 x,R xzy
B 1 -1 -1 1 y,Rx yz2
Cs B h
A' 1 1 x,y,Rz x 2,y 2,z ,xy
A" 1 -1 z,Rx,R yz,xz
160
BIBLIOGRAPHY
Books
Bttcher, C. J. F., Theory of Electric Polarization,Amsterdam, Holland, Elsevier, 1952.
Labhart, H., "Electrochromism," Advances in ChemicalPhysics, Vol.. XIII, edited by I. Prigogine,New York, Interscience Publishers, Inc., 1967.
Liptay, W., "Dipole Moments and Polarizabilities ofMolecules in Excited Electronic States,"Excited States, Vol. I, edited by Edward C. Lim,New York, Academic Press, 1974.
Robin, M. B., Higher Excited States of Polyatomic Molecules,2 volumes, New York, Academic Press, 1974.
Townes, C. G. and A. L. Schawlow, Microwave Spectroscopy,New York, McGraw-Hill, 1955.
Van Vleck, J. H., Electric and Magnetic Susceptibilities,London, England and New York, Oxford University Press,1932.
Articles
Applequist, J., J. R. Carl and K. K. Fung, J. Amer. Chem.Soc., 94, 2952-2960 (1972).
Baker, A. D., C. Baker, C. R. Brundle and D. W. Turner,Int. J. Mass Spectrosc. Ion Phys., 1, 285-301 (1968).
Barnes, E. E. and W. T. Simpson, J. Chem. Phys., 39,670-675 (1963).
Bridge, N. J., D. A. Haner and D. A. Dows, J. Chem. Phys.,44, 3128-3130 (1966).
, J. Chem. Phys.,
48, 4196-4210 (1968).
Buckingham, A. D. and D. A. Ramsay, J. Chem. Phys., 42,3721-3722 (1965).
161
162
Buenker, R. J. and S. D. Peyerimhoff, J. Chem. Phys., 53,1368-1384 (1970).
Causley, G. C., John D. Scott and B. R. Russell, Rev. Sci.Instrum., 48, 264-267 (1977).
Chadwick, D., D. C. Frost and L. Weiler, Tetrahedron Letters,47, 4543-4545 (1971).
Christoffersen, J., J. M. Hollas and G. H. Girby, Mol. Phys.16, 441-452 (1969).
Chutjian, A., J. Chem. Phys., 61, 4279-4284 (1974).
Cook, D., Can. J. Chem., 39, 31-38 (1961).
Debye, P., Physik. Z., 13, 97-100 (1912).
Dbrr, F., Angew. Chem. Internat. Edit., 5, 478-495 (1966).
Freeman, D. E. and W. Klemperer, J. Chem. Phys., 40, 604-
605 (1964).
, J. Chem. Phys., 45, 52-57,(1966).
Geise, H. J. and F. C. Mijlhoff, Recd. Tray. Chim. Pays-Bas,
90, 577-583 (1971).
Harding, L. B. and W. A. Goodard III, J. Amer. Chem. Soc.,
97, 6293-6299 (1975).
J. Amer. Chem. Soc.,
99, 677-683 (1977).
Hess, B., P. J. Bruna, R. J. Buenker and S. D. Peyerimhoff,Chem. Phys., 18, 267-280 (1976).
Holdsworth, R. S. and A. B. F. Duncan, Chem. Rev., 41,311-316 (1947).
Horwood, J. F. and J. R. Williams, Spectrochim. Acta,19, 1351-1362 (1963).
Hurdis, E. C. and C. P. Smyth, J. Amer. Chem. Soc., 65,89-96 (1943).
Ito, H., Y. Nagato, S. Matsuzaki and A. Kuboyama, Bull.Chem. Soc. Jap., 42, 2453-2459 (1969).
163
Iverson, A. A. and B. R. Russell, Spectrochim. Acta, Part A,29, 715-723 (1973).
Johnson Jr., W. C. and W. T. Simpson, J. Chem. Phys. 48,2168-2174 (1968).
Kilb, R. W., C. C. Lin and E. B. Wilson, Jr., J. Chem. Phys.,26, 1695-1703 (1957).
Kim, H. and W. D. Gwinn, J. Chem. Phys., 51, 1815-1819 (1969).
Kondon, K. and T. Oka, J. Phys. Soc. Jap., 15, 307-314
(1960).
Ledaal, T., Tetrahedron Letters, 6, 651-656 (1968).
Le Fevre, C. and R. J. W. be Fevre and B. P. Rao, J. Chem.Soc., 2340-2344 (1959).
Lessard, C. R. and D. C. Moule, J. Mol. Spectrosc. 60,343-347 (1976).
Liptay, W., Z. Naturforsch., 20a, 272-289 (1965).
, Angew. Chem. Internat. Edit., 8, 177-188 (1969).
, Ber. Bunsenges. Phys. Chem., 80, 207-217 (1976).
Lombardi, J. R., J. Chem. Phys., 50, 3780-3783 (1969).
, J. Chem. Phys., 56, 2278-2281 (1972).
, D. E. Freeman and W. Klemperer, J. Chem.
Phys., 46, 2746-2749 (1967).
Lucazeau, G. and C. Sandorfy, J. Mol. Spectrosc. 35, 214-
231 (1970).
Mentall, J. E. and E. P. Gentieu, J. Chem. Phys., 55,5471-5479 (1971).
Miller, K. J., J. Chem. Phys., 62, 1759-1768 (1975).
Moule, D. C. and A. D. Walsh, Chem. Rev., 75, 67-84 (1975).
Ohnishi, Y. and K. Kozima, Bull. Chem. Soc. Jap., 41,1323-1325 (1968).
Onsager, L., J. Amer. Chem. Soc., 58, 1467-1493 (1936).

164
Peyerimhoff, S. D., R. J. Buenker, W. E. Kammer and H. Hsu,Chem. Phys. Letters, 8, 129-135 (1971).
Platt, J. R., J. Chem. Phys., 34, 862-863 (1961).
Prugger, H. and F. Dbrr, Z. Electrochem., 64, 425-430(1960).
Reichardt, C., Angew. Chem. Internat. Edit., 4, 29-40(1965).
Scheibe, G., F. Povenz and C. F. Linstrbm, Z. Phys. Chem.B20, 283-304 (1933).
Scott, John D. and B. R. Russell, J. Chem. Phys., 63, 3243-3255 (1975).
Scharpen, L. H. and V. W. Laurie, J. Chem. Phys., 49,221-228 (1968).
Svendsen, E. Norby and Martin T. Vala, Acta Chem. Scand. 26,3475-3482 (1972).
Udvarhazi, A. and M. A. El-Sayed, J. Chem. Phys., 42, 3335-3336 (1965).
Weiss, M. J., G. E. Kuyatt and S. Mielczarek, J. Chem.Phys., 54, 4147-4150 (1971).
Whitlock, R. F. and A. B. F. Duncan, J. Chem. Phys., 55,218-224 (1971).
Whitten, J. L., J. Chem. Phys., 56, 5458-5466 (1972).
, and M. Hackmeyer, J. Chem. Phys., 51,5584-5596 (1969).
Yamaoka, K. and E. Charney, J. Amer. Chem. Soc., 94,8963-8974 (1975).
Public Documents
Birnbaum, G. and A. A. Maryott, JANAF Thermochemical TablesNSRDS-NBS, No. 37, (Washington, 1971).
165
Unpublished Materials
Allison, K. and A. D. Walsh, unpublished paper read atthe Chemical Institute of Canada Symposium, Ottawa,
1957.
Causley, G. C. and B. R. Russell, "Eectric Dipole Moment
and Polarizability of the 1749 A, 'B Excited State
of Formaldehyde," manuscript accepte for publication
by the Journal of Chemical Physics, 1978.
Scott, John D., "Properties of Molecular Rydberg States,"
unpublished doctoral thesis, Department of Chemistry,North Texas State University, Denton, Texas, 1974.