in situ reduction and oxidation of nickel from solid …orbit.dtu.dk/files/4470863/aicha.pdf ·...
TRANSCRIPT

General rights Copyright and moral rights for the publications made accessible in the public portal are retained by the authors and/or other copyright owners and it is a condition of accessing publications that users recognise and abide by the legal requirements associated with these rights.
• Users may download and print one copy of any publication from the public portal for the purpose of private study or research. • You may not further distribute the material or use it for any profit-making activity or commercial gain • You may freely distribute the URL identifying the publication in the public portal
If you believe that this document breaches copyright please contact us providing details, and we will remove access to the work immediately and investigate your claim.
Downloaded from orbit.dtu.dk on: Sep 12, 2018
In situ Reduction and Oxidation of Nickel from Solid Oxide Fuel Cells in aTransmission Electron Microscope
Faes, Antonin; Jeangros, Quentin; Wagner, Jakob Birkedal; Hansen, Thomas Willum; Van Herle, Jan;Brisse, Annabelle; Dunin-Borkowski, Rafal E.; Hessler-Wyser, AïchaPublished in:E C S Transactions
Link to article, DOI:10.1149/1.3205743
Publication date:2009
Document VersionPublisher's PDF, also known as Version of record
Link back to DTU Orbit
Citation (APA):Faes, A., Jeangros, Q., Wagner, J. B., Hansen, T. W., Van Herle, J., Brisse, A., ... Hessler-Wyser, A. (2009). Insitu Reduction and Oxidation of Nickel from Solid Oxide Fuel Cells in a Transmission Electron Microscope. E CS Transactions, 25(2), 1985-1992. DOI: 10.1149/1.3205743

In situ Reduction and Oxidation of Nickel from Solid Oxide Fuel Cells in a Transmission Electron Microscope
A. Faesa,b, Q. Jeangrosa, J. B. Wagnerc, T. W. Hansenc
J. Van herleb, A. Brissed, R. Dunin-Borkowskic, A. Hessler-Wysera
a Interdisciplinary Centre for Electron Microscopy
Ecole Polytechnique Fédérale de Lausanne (EPFL), CH-1015 Lausanne, Switzerland b Laboratory of Industrial Energy Systems, EPFL, CH-1015 Lausanne, Switzerland
c Center for Electron Nanoscopy Technical University of Denmark, DK-2800 Lyngby, Denmark
d European Institute for Energy Research Emmy-Noether-Strasse 11, Karlsruhe, Germany
Environmental transmission electron microscopy was used to characterize in situ the reduction and oxidation of nickel from a Ni/YSZ solid oxide fuel cell anode support between 300-500°C. The reduction is done under low hydrogen pressure. The reduction initiates at the NiO/YSZ interface, then moves to the center of the NiO grain. At higher temperature the reduction occurs also at the free NiO surface and the NiO/NiO grain boundaries. The growth of Ni is epitaxial on its oxide. Due to high volume decrease, nanopores are formed during reduction. During oxidation, oxide nanocrystallites are formed on the nickel surface. The crystallites fill up the nickel porosity and create an inhomogeneous structure with remaining voids. This change in structure causes the nickel oxide to expand during a RedOx cycle.
Introduction
Solid oxide fuel cells (SOFC) are efficient devices for the electrochemical conversion of a large variety of fuels into electricity (1). The standard SOFC design is based on an electrolyte-supporting anode composed of yttria stabilized zirconia (YSZ) and nickel oxide (NiO). NiO is reduced in situ into metallic nickel during the first use of the fuel cell. This reaction increases the anode porosity due to volume contraction between NiO and Ni, induces high electrical conductivity of the support and sufficient electrochemical activity of the anode due to high nickel activity for H2 oxidation. The reduction procedure is important as it can influence the anode support conductivity (2) and strength (3).
Oxidation of the nickel phase can occur during SOFC stack operation due to air
leakage through the sealing, lack of fuel, high fuel utilization, or a shut down without protection gas. The important expansion during oxidation produces stress in the YSZ backbone and may lead to the formation of cracks in the thin electrolyte (4-7). The reason why reoxidized nickel does not occupy the same volume as in the original structure is controversially presented in the literature. The first approach proposes the coarsening of the nickel phase during fuel cell utilization at high temperature (700 to 900°C) as the main reason of the detrimental effect of nickel reoxidation (8, 9). Others indicated a
ECS Transactions, 25 (2) 1985-1992 (2009)10.1149/1.3205743 © The Electrochemical Society
1985Downloaded 30 Jun 2010 to 192.38.67.112. Redistribution subject to ECS license or copyright; see http://www.ecsdl.org/terms_use.jsp

porosity in nickel oxide after reoxidation due to the outward diffusion of Ni trough NiO (10), the size and volume of porosity being influenced by the cermet reoxidation temperature (7). As some groups demonstrate expansion of the anode support after consecutive RedOx cycles (without the nickel coarsening step) (6, 7), the first hypothesis can not be self-sufficient.
In situ characterization can yield interesting observations during the reaction, like
crystallographic changes using time resolved X-ray diffraction (TRXRD) (11) and high energy TRXRD using a synchrotron source (12). In situ microstructural changes have been observed using an environmental scanning electron microscope (ESEM) (13). This study showed a shrinkage of the Ni phase during NiO reduction. The microstructure of the NiO depended on the temperature of reoxidation; at low temperature the particles stay spherical but at higher temperature the original Ni particles separate into different NiO grains. In situ environmental transmission electron microscopy (ETEM) used in the present work can give information on micro and nanostructures as well as local composition and crystallographic analysis. Time resolved ETEM observation is a powerful tool to understand the reaction processes during reduction and oxidation in the electro-catalytic field.
Experimental
The observed sample is a standard anode supported thin electrolyte from HTceramix SA® (Switzerland). This sample was fabricated by co-casting electrolyte (4-5 µm) and anode (about 200 µm) tapes. The anode is composed of nickel oxide and YSZ and the electrolyte is dense 8YSZ. A TEM lamella of the NiO-YSZ anode was extracted in situ from the sample using a lift-out technique with a FEI QuantaTM dual beam SEM/focused ion beam (FIB) equipped with a micromanipulator. The lamella was glued on a stainless steel grid with platinum deposition. Thinning down of the TEM sample to 80 nm was achieved with a FEI HeliosTM dual beam SEM/FIB.
TEM in situ observations were done in a FEI TitanTM equipped with an
environmental cell (E-cell). This microscope is operated at 300 kV with a field emission gun and is equipped with a monochromator and Cs image aberration corrector. EDX detector and a Gatan Image filter are used for analytical characterization. The in situ reduction was done in 1.4 mbar H2. The temperature was ramped between 300°C and 500°C with a 10°C increment every 5 min. The oxidation was done in 3.2 mbar O2 from 250°C to 500°C using the same temperature ramp as for the reduction.
Results and Discussion Reduction
Some characteristic images acquired during the in situ reduction of the composite anode are shown in Figure 1. The reduction of NiO starts at around 320°C as indicated by the arrow in Figure 1c. The texture of the grain boundary from Figure 1a to Figure 1c varies a little (the texture of the interface changes due to porosity apparition). This can be seen in a clearer way in Figure 1d. From 410 to 430°C, the reduction of NiO takes place
ECS Transactions, 25 (2) 1985-1992 (2009)
1986Downloaded 30 Jun 2010 to 192.38.67.112. Redistribution subject to ECS license or copyright; see http://www.ecsdl.org/terms_use.jsp

Figure 1. Sequence of bright field micrographs of the YSZ/NiO composite reduction under 1.4 mbar H2 with plateaus of 5 min. every 10°C, (a) As prepared sample at 300°C, (b) map of NiO (dark grey) and YSZ (light grey) phases as a visual indication, (c) 320°C, (d) 400°C, (e) 440°C and (f) 500°C.
(a) (b)
(c) (d)
(e) (f)
NiO
YSZ
ECS Transactions, 25 (2) 1985-1992 (2009)
1987Downloaded 30 Jun 2010 to 192.38.67.112. Redistribution subject to ECS license or copyright; see http://www.ecsdl.org/terms_use.jsp

also directly on the free surface. The reduction of nickel oxide to metallic nickel leaves a nanoporosity due to the volume contraction of more than 40% (7). Such nanoporosities were observed by Waldbillig et al. in ex situ reduction of a TEM lamella (14). The porous nanostructure further evolves under the microscope between 440°C and 500°C (Figure 1e and f). This can be due to nickel coarsening but also to the continuation of reduction of remaining NiO.
It is interesting to note that the reduction starts from the YSZ/NiO interface. Figure
1b shows a superimposed map of NiO (dark grey) and YSZ (light grey) phases on the bright field image (this map is an indication to distinguish the different phase grains). The NiO/NiO grain boundaries are reduced only later, when the reduction also takes place on the free surface. Diffraction patterns (DP) were obtained during reduction, as presented in Figure 2. Ni grows epitaxially on the nickel oxide, shown by the satellite spots of Figure 2b (14). These satellite spots are due to double diffraction by metallic nickel and nickel oxide. Both nickel and nickel oxide are cubic but with different lattice parameters (dNi,111=0.204 nm and dNiO,111=0.241 nm (15)). The DP of not fully reduced nickel oxide leads to small satellite spots. When the reduction is completed, NiO satellite spots on the DP are absent.
Figure 2. Diffraction pattern from a NiO grain in [110] zone axis during reduction under 1.4 mbar H2, (a) at 300°C and (b) 480°C.
Figure 3 schematizes the process of NiO reduction of a YSZ/NiO grain interface (view of the cross section or thickness of a TEM lamella). Up to 300°C, the nickel oxide is stable. Then the reduction process initiates at the YSZ interface from where it proceeds to the center of the grain. The adsorption of hydrogen may be energetically more favorable on stabilized zirconia than on defect free NiO. YSZ can act as a transmitter of hydrogen active species (16). As the reduction is autocatalytic the reaction proceeds to the center of the NiO grain. Above 410°C onwards, the reduction occurs also at the free surface of nickel oxide. During the reduction process, the nanopores size increases due to the continuous volume contraction. Even at 480°C, some nickel oxide remains, as shown by the satellite spot in the DP (Figure 2b). At 500°C, some of the pores combine to transverse channels through the TEM lamella. Gaseous transport during reduction may
T = 300°C
10nm-1
(a) (b)
(000) (-111)
(002)(1-11)
(2-20)
Double diffraction spots
T = 480°C
10nm-1
NiO(-111) Ni(-111) (000)
ECS Transactions, 25 (2) 1985-1992 (2009)
1988Downloaded 30 Jun 2010 to 192.38.67.112. Redistribution subject to ECS license or copyright; see http://www.ecsdl.org/terms_use.jsp

then occur through such nanochannels, which drastically increase the tortuosity of the support.
After reduction at these conditions, only little contraction of the grains is observed;
the volume decrease is principally compensated by formation of nanoporosities. Generally, a small porosity appears at the interface of two different nickel grains. As the gap is small, electrical conductivity should remain sufficient. If these nickel nanopores coalesce at higher temperature, the gap may increase and cause the anode electrical conductivity to drop.
Figure 3. YSZ/NiO interface during reduction of NiO (presented as a cross section view of the TEM lamella). Between 320°C and 340°C the reduction of NiO starts at the interface and leaves nanoporosities in the nickel. Between 410 and 430°C the reduction also starts on the free NiO surface. Nickel oxide remains up to 480°C (as shown by satellite spots in DF of Figure 2b). The nickel nanostructure coarsens until 500°C. Oxidation
In Figure 4, the in situ reoxidation of the anode is shown. Only a small selection of bright field images is presented. Microstructural changes start to be visible at around 350°C during in situ nickel reoxidation. The oxide grows at the nickel surface and the nanoporosity slowly closes back (see sequence in Figure 4). The nickel oxide grows as polynanocrystallites (small black dots in bright field shown by the arrows in Figure 5b). Ex situ re-oxidation of a TEM lamella also showed polycrystalline nickel oxide (14). The texture of nickel oxide grains is not homogeneous and seems to contain remaining porosity. This remaining porosity causes nickel oxide to expand during a reduction and oxidation (RedOx) cycle. This is well demonstrated in Figure 5. The two NiO grains adjacent to the pore expand into it showing the volume increase of the NiO phase during the RedOx cycle. The nickel oxide surface after oxidation (shown by the circle in Figure 5b) is hilly and serrated, which could be due to the polycrystalline structure and shows
ECS Transactions, 25 (2) 1985-1992 (2009)
1989Downloaded 30 Jun 2010 to 192.38.67.112. Redistribution subject to ECS license or copyright; see http://www.ecsdl.org/terms_use.jsp

the rugged nanostructure of a NiO grain after a RedOx cycle compared to its smooth original. This is another reason for expansion of nickel oxide during RedOx cycling.
Figure 4. Sequence of bright field micrographs of the YSZ/Ni composite oxidation under 3.2 mbar O2 with plateaus of 5 min. every 10°C (a) sample at 270°C, (b) 350°C, (c) 390°C and (d) 500°C.
Nickel oxide reorganization demonstrates the irreversibility of a RedOx cycle on the
SOFC anode microstructure. As the NiO nanocrystallites rearrangement is slow at those temperatures, the YSZ backbone can withstand the tensile stress, but in case of re-oxidation at higher temperature the reaction is so fast that no nanocrystallite rearrangement and no stress accommodation can occur. As a final remark, it is important to note that the TEM lamella thickness (100 nm) is about 100 times smaller than its width. The TEM sample can therefore differ in some points from a bulk anode material as it exposes more free surface and the NiO growth can be out of the lamella plane.
(a) (b)
(c) (d)
(a) (b)
ECS Transactions, 25 (2) 1985-1992 (2009)
1990Downloaded 30 Jun 2010 to 192.38.67.112. Redistribution subject to ECS license or copyright; see http://www.ecsdl.org/terms_use.jsp
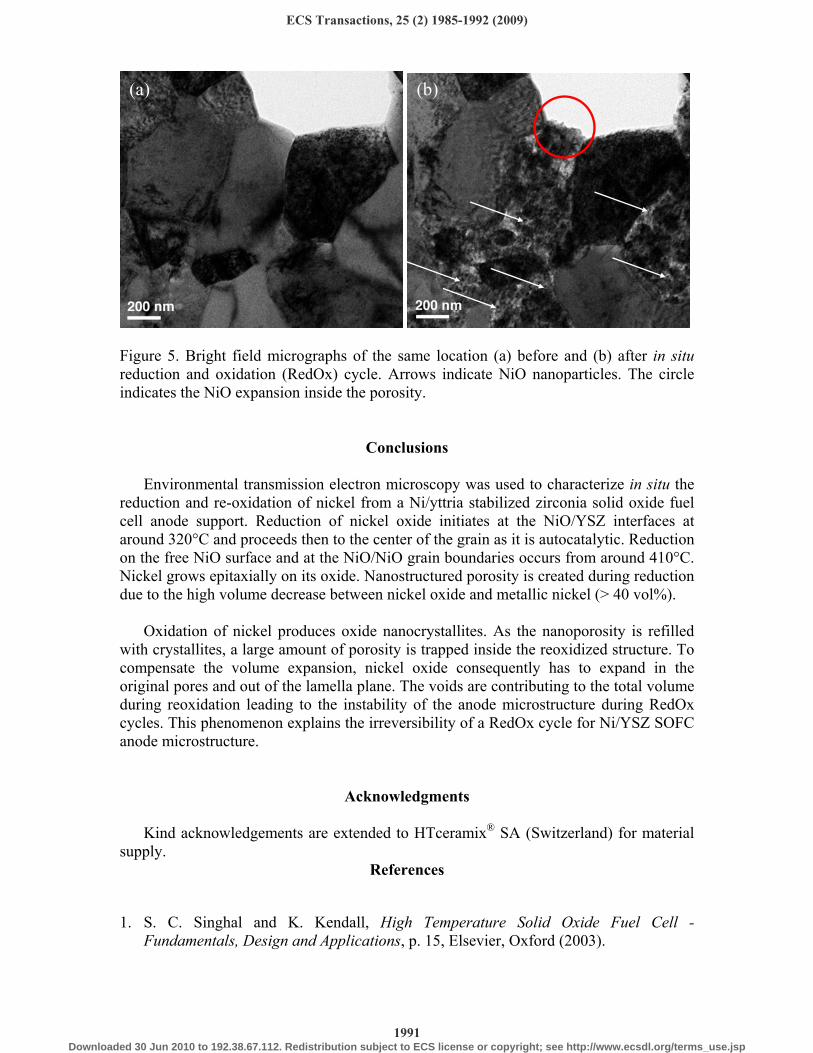
Figure 5. Bright field micrographs of the same location (a) before and (b) after in situ reduction and oxidation (RedOx) cycle. Arrows indicate NiO nanoparticles. The circle indicates the NiO expansion inside the porosity.
Conclusions Environmental transmission electron microscopy was used to characterize in situ the
reduction and re-oxidation of nickel from a Ni/yttria stabilized zirconia solid oxide fuel cell anode support. Reduction of nickel oxide initiates at the NiO/YSZ interfaces at around 320°C and proceeds then to the center of the grain as it is autocatalytic. Reduction on the free NiO surface and at the NiO/NiO grain boundaries occurs from around 410°C. Nickel grows epitaxially on its oxide. Nanostructured porosity is created during reduction due to the high volume decrease between nickel oxide and metallic nickel (> 40 vol%).
Oxidation of nickel produces oxide nanocrystallites. As the nanoporosity is refilled
with crystallites, a large amount of porosity is trapped inside the reoxidized structure. To compensate the volume expansion, nickel oxide consequently has to expand in the original pores and out of the lamella plane. The voids are contributing to the total volume during reoxidation leading to the instability of the anode microstructure during RedOx cycles. This phenomenon explains the irreversibility of a RedOx cycle for Ni/YSZ SOFC anode microstructure.
Acknowledgments
Kind acknowledgements are extended to HTceramix® SA (Switzerland) for material supply.
References
1. S. C. Singhal and K. Kendall, High Temperature Solid Oxide Fuel Cell - Fundamentals, Design and Applications, p. 15, Elsevier, Oxford (2003).
(a) (b)
ECS Transactions, 25 (2) 1985-1992 (2009)
1991Downloaded 30 Jun 2010 to 192.38.67.112. Redistribution subject to ECS license or copyright; see http://www.ecsdl.org/terms_use.jsp

2. L. Grahl-Madsen, P. H. Larsen, N. Bonanos, J. Engell, and S. Linderoth, J. Mater. Sci., 41, 1097 (2006).
3. A. Faes, H. Lund-Frandsen, M. Pihlatie, A. Kaiser, and D. R. Goldstein, J. Fuel Cell Sci. Tech., Accepted (2009).
4. M. Cassidy, G. Lindsay, and K. Kendall, J. Power Sources, 61, 189 (1996).
5. D. Sarantaridis, and A. Atkinson, Fuel Cells, 7, 246 (2007).
6. M. Pihlatie, A. Kaiser, P. H. Larsen, and M. Mogensen, ECS Trans., 7, 1501 (2007).
7. A. Faes, A. Nakajo, A. Hessler-Wyser, D. Dubois, S. Modena, A. Brisse, and J. Van herle, J. Power Sources, In Press, (2009), DOI: 10.1016/j.jpowsour.2008.12.118.
8. T. Klemensoe, Relationships between structure and performance of SOFC anodes, PhD thesis, Technical University of Danemark, Risoe National Laboratory, p. 30, Roskilde (2005).
9. T. Klemensoe and M. Mogensen, J. Am. Ceram. Soc., 90, 3582 (2007).
10.D. Sarantaridis, R. J. Chater and A. Atkinson, J. Electrochem. Soc., 155, B467 (2008).
11. A. R. Rojas, H. E. Esparza-Ponce, L. Fuentes, A. Lopez-Ortiz, A. Keer and J. Reyes-Gasga, J. Phys. D: Appl. Phys., 38, 2276 (2005).
12. A. Hagen, H. F. Poulsen, T. Klemensoe, R. V. Martins, V. Honkimki, T. Buslaps and R. Feidenshans, Fuel Cells, 6, 361 (2006).
13. T. Klemensoe, C. C. Appel and M. Mogensen, Electrochem. Solid-State Lett., 9, 403 (2006).
14. D. Waldbillig, A. Wood and D. G. Ivey, J. Power Sources, 145, 206 (2005).
15. E. C. Dickey, V. P. Dravid, P. D. Nellist, D. J. Wallis, S. J. Pennycook and A. Revcolevschi, Microsc. Microanal., 3, 443 (1997).
16. M. Pospisil and P. Kanokova, J. Therm. Anal. Calorim., 58, 77 (1999).
ECS Transactions, 25 (2) 1985-1992 (2009)
1992Downloaded 30 Jun 2010 to 192.38.67.112. Redistribution subject to ECS license or copyright; see http://www.ecsdl.org/terms_use.jsp