in-situ measurements of friction and bearing correlated ... · in-situ measurements of friction and...
TRANSCRIPT
IN-SITU MEASUREMENTS OF FRICTION AND BEARING CORRELATED WITH INSTRUMENTED PILE TESTS
By
George W. Perdue Research Assistant
and
Harry M. Coyle Associate Research Engineer
Research Report Number 125-4
Bearing Capacity for Axially Loaded Piles Research Study Number 2-5-67-125
Sponsored by The Texas Highway Department
In Cooperation with the U.S. Department of Transportation Federal Highway Administration
June 1970
TEXAS TRANSPORTATION INSTITUTE Texas A&M University
College Station, Texas
The op1n1ons, findings, and conclusions expressed in this report are those of the authors and not necessarily those of the Federal Highway Administration.
;;

ABSTRACT
This study involved a series of field tests conducted with a
recently developed in-situ testing device. The in-situ testing
device was used to measure values of skin friction and point bearing
taken during soil sampling operations. The test procedure was
adapted for use with a standard core drilling rig. All load
measurements were made at the ground surface.
The in-situ measured values of skin friction and potnt bearing
taken during sampling operations were compared with measured values
of skin friction and point bearing taken from two full-scale
instrumented test piles .. All tests were conducted at one test site
in a clay soil.. It was necessary to develop adjustment factors to
correct for the size and shape effects. The adjustment factors were
correlated with the plasticity index of the soil.
iii

SUMMARY
This test program was conducted during the third year of a
five-year study on uBearing Capacity for Axi.ally Loaded Piles. 11 A
test procedure was developed so that in-situ measurements of friction
and bearing could be made during sampling operations in medium to
firm clays. The procedure involved the use of standard drilling
rig equipment with a load-measuring device at the ground surface.
The in-situ measurements of friction and bearing were compared
with corresponding values from several instrumented pile tests.
Adjustment factors were deve 1 oped to correct for size and shape
effects between the load-measuring device and the full-scale piles.
It was possible to correlate the adjustment factors with the plasticity
index of the soil.
iv
IMPLEMENTATION STATEMENT
This is a technical progress report which presents the
results of a test program conducted using a newly developed device
for making in-situ measurements. These measurements of friction
and bearing were made in medium to firm clays during sampling
operations. The test procedure is acceptable for use with
standard drilling rig equipment.
This study is considered preliminary in nature because measure
ments were made at one test site in one soil. Additional field
tests in conjunction with fully instrumented test piles would be
required for further verification of the results obtained in this
study. Additional tests, particularly in very soft and very stiff
soils, would be necessary in order to make the procedure applicable
in all soils. A separate research study involving in-situ
determination of soil strength in all soils is recommended.
v
TABLE OF CONTENTS
INTRODUCTION . . . . . . • . • . •
Nature of the Problem ••.... Present Status of the Question Objectives ••.•••.•.•.
IN-SITU TESTING EQUIPMENT
General •...•.•• Load Measuring Device • . . . • . Loading Equipment . • • Load Recording Equipment Calibration ...•....
FIELD TEST PILE INSTRUMENTATION
Genera 1 . . . • . • . . . . Instrumentation •...
SOIL DATA AT TEST SITES
Soi 1 Profile . Soil Properties .
TEST PROCEDURE . .
Genera 1 . . • . . . • . . In-Situ Test Procedure In-Situ Test Series .•......... Instrumented Pile Test Procedure
ANALYSIS OF TEST RESULTS •.•
Genera 1 . . . . . . . . . . Instrumented Pile Test Data . In-Situ Friction Test Data In-Situ Bearing Test Data •.•. Correlation with Soil Properties
vi
. . .
Page
1
1 2 4
4
4 5 5 7
10
10
10 12
16
• • • • 16 19
20
20 20 21 22
27
27 28 30 41 42

CONCLUSIONS AND RECOMMENDATIONS
Conclusions .... . Recommendations ... .
Page
46
46 48
APPENDIX I.--REFERENCES . . . . . . . . . . . . 49
APPENDIX !I.--NOTATION .......•............ 50
APPENDIX III.--STATIC LOAD TEST DATA FOR INSTRUMENTED TEST PILES 1 & 2 • . • • • • • • • • • • • - • • • • • · • • • • • • 51
APPENDIX IV .--LOAD DISTRIBUTION VERSUS DEPTH CURVES 58
APPENDIX V.--LOAD-SETTLEMENT CURVES . . . . . . . . . 65
APPENDIX VI.--PROCEDURE AND EXAMPLE PROBLEM FOR ESTIMATING THE BEARING CAPACITY OF A PILE. . • • . 72
Procedure . . . • . • • • . . Example Problem • • . . . . .
vii
72 73
LIST OF TABLES
Page
TABLE 1.--TEST DESIGNATION AND DESCRIPTION--TEST SERIES I .. 24
TABLE 2.--TEST DESIGNATION AND DESCRIPTION--TEST SEREIS II .. 25
TABLE 3.--TEST DESIGNATION AND DESCRIPTION--TEST SERIES III . 26
TABLE 4.--SERIES 1, FRICTION DATA--PILE 1--IMMEDIATE STATIC LOAD TEST . . . . . • . . . . . . . • . . . . . . • 32
TABLE 4A.--SERIES 1, FRICTION DATA--PILE l--4 DAY STATIC LOAD TEST • . . . . • • . . . . . • . . . . • . . . . . 33
TABLE 48. --SERIES l, FRICTION DATA--PILE 1--11 DAY STATIC LOAD TEST . • . . . • . • . . . . . . • . . . . • • . . 34
TABLE 5.--SERIES 2, FRICTION DATA--PILE 2--IMMEDIATE STATIC LOAD TEST . • . . . . . . . • • • . • . • • • • • . 35
TABLE 5A.--SERIES 2, FRICTION DATA--PILE 2--4 DAY STATIC LOAD TEST . . . • . . . • . . . . . . • . . • . • • . • 36
TABLE 58.--SERIES 2, FRICTION DATA--PILE 2--11 DAY STATIC LOAD TEST . . . . . . . . . . . . . . • . . . . . • . . 37
TABLE 6.--SERIES 3, FRICTION DATA--PILE 2--IMMEDIATE STATIC LOAD TEST . . . . . . . . . . . . . . • . • • . • • 38
TABLE 6A.--SERIES 3, FRICT~ON DATA--PILE 2--4 DAY STATIC LOAD TEST . . . . . . . . . . . . . . . • • • . • . . • 39
TABLE 6B.--SEREIS 3, FRICTION DATA--PILE 2--11 DAY STATIC LOAD TEST • • • • . • . . . . . • • . . . . • . • • · · 40
viii
PAGE TABLE 7. --POINT BEARING DATA . . . . . . . . • . . . . . 43
TABLE III-1.--TEST PILE 1, IMMEDIATE STATIC LOAD TEST 52
TABLE III-2.--TEST PILE 1, 4-DAY STATIC LOAD TEST . . 53
TABLE III-3.~-TEST PILE 1, 11-DAY STATIC LOAD TEST. 54
TABLE III-4.--TEST PILE 2, IMMEDIATE STATIC LOAD TEST 55
TABLE III-5.--TEST PILE 2, 4-DAY STATIC LOAD TEST . 56
TABLE III-6.--TEST PILE 2, 11-DAY STATIC LOAD TEST . 57
ix
LIST OF FIGURES
, Page
FIGURE 1 LOAD MEASURING DEVICE . . . . • . . . . • . . • • 6
FIGURE 2 HYDRAULIC EQUIPMENT USED TO PUSH DRILL PIPE INTO THE BORE HOLE . • . . . . . . 8
FIGURE 3 SHELBY TUBE SAMPLING 8
FIGURE 4 REMOVING IN-SITU LOAD MEASURING DEVICE AND DRILL-ING PILE FROM BORE HOLE . . . . . . . • . . . • • 9
FIGURE 5 BATTERY OPERATED BUDD-350 STRAIN INDICATOR USED TO BALANCE AND RECORD STRAINS IN LOAD MEASURING DEVICE. . . . • . . . . . . . . . . . . . . • 9
FIGURE 6 CALIBRATING IN-SITU LOAD MEASURING DEVICE ON INSTRON TESTING MACHINE . . . . . . . . . . . 11
FIGURE 7 LOCATION OF THE:5 STRAIN GAGE BRIDGES (PILE NO. 1) 13
FIGURE 8 LOCATION OF THE 5 STRAIN GAGE BRIDGES (PILE NO. 2) 14
FIGURE 9 BORING LOG - SITE ONE . . . . . . . . ~ . . . . . 17
FIGURE 10 BORING LOG - SITE TWO . 18
FIGURE 11 CONE AND BLUNT END TIP . . . . . . 23
FIGURE 12 CALCULATION OF SKIN FRICTION ON INSTRUMENTED PIPE PILE . . . . . . . . . . . . . . . . . . 29
FIGURE 13 Cp VS. PLASTICITY INDEX . . . . . . . . . . . 44
X

Page FIGURE 14 CT VS. PLASTICITY INDEX . . . . . . . . . . . . 45
FIGURE IV-1 LOAD VS. DEPTH, PILE 1 11 IMMEDIATE STATIC LOAD TEST 11
• • • • • • • • • • • • • • • • • • • • 59
FIGURE IV-2 LOAD VS. DEPTH, PILE 1 114 DAY STATIC LOAD TEST 11 • 60
FIGURE IV-3 LOAD VS. DEPTH, PILE 1 11 11 DAY STATIC LOAD TEST 11• 61
FIGURE IV-4 LOAD VS. DEPTH, PILE 2 11 IMMEDIATE STATIC LOAD TEST II • • • • • • • • • • • • • • • • • • • • 62
FIGURE IV-5 LOAD VS. DEPTH, PILE 2 11 4 DAY STATIC LOAD TEST 11 • 63
FIGURE IV-6 LOAD VS. DEPTH, PILE 2 11 11 DAY STATIC LOAD TEST". 64
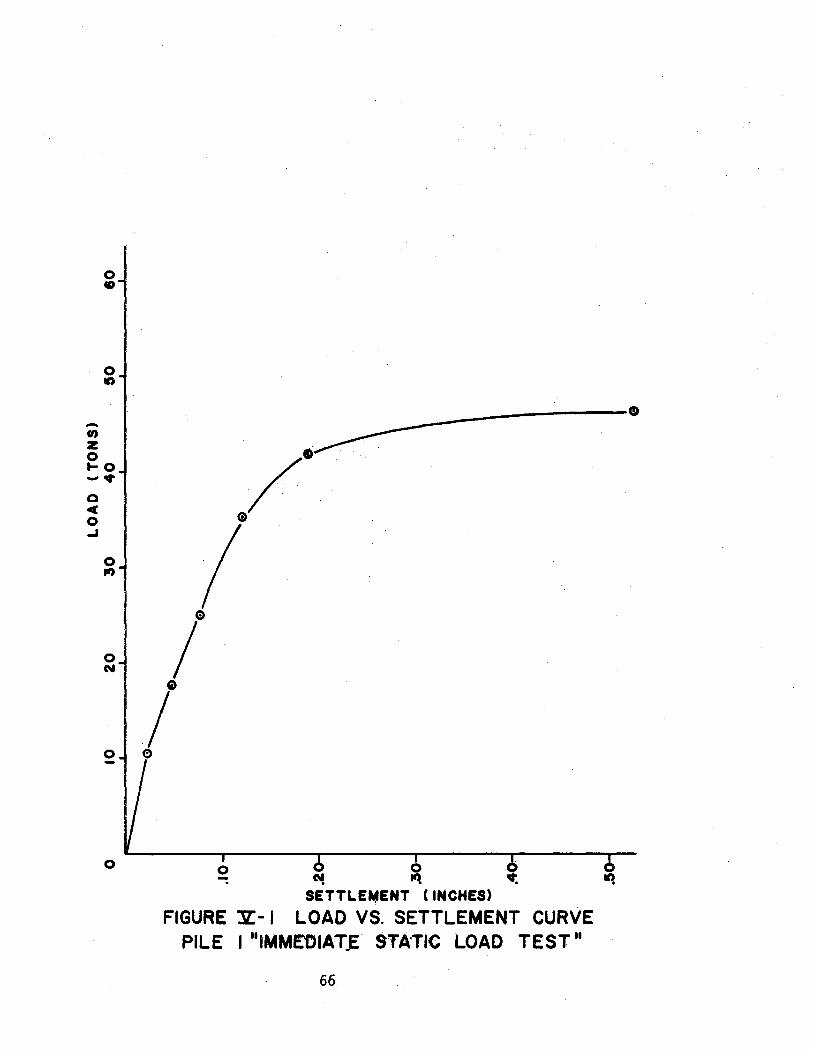
FIGURE V-1 LOAD VS. SETTLEMENT CURVE, PILE 1 11 IMMEDIATE STATIC LOAD TEST 11
• • • • • • • • • • • • • • 66
FIGURE V-2 LOAD VS. SETTLEMENT CURVE, PILE 1 11 4 DAY STATIC LOAD TEST 11
• • • • • • • • • • • • • • • • • 67
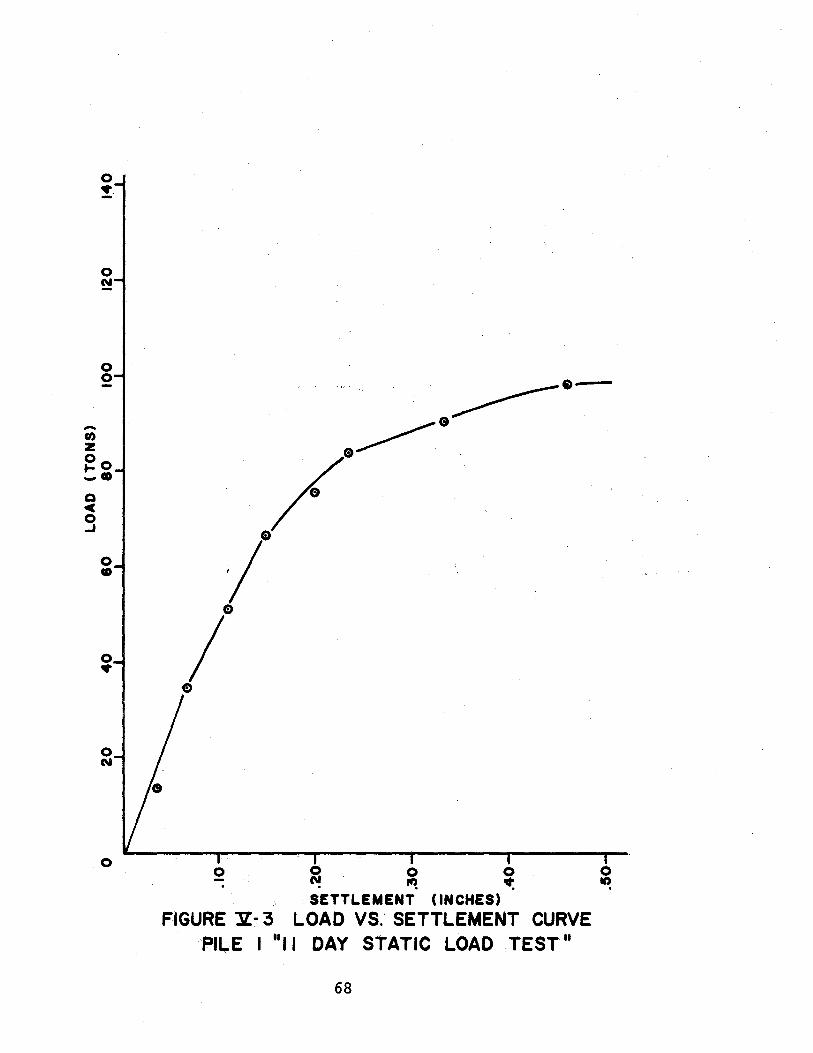
FIGURE V-3 LOAD VS. SETTLEMENT CURVE, PILE 1 11 11 DAY STATIC LOAD TEST 11
• • • • • • • • • • • • • • • 68
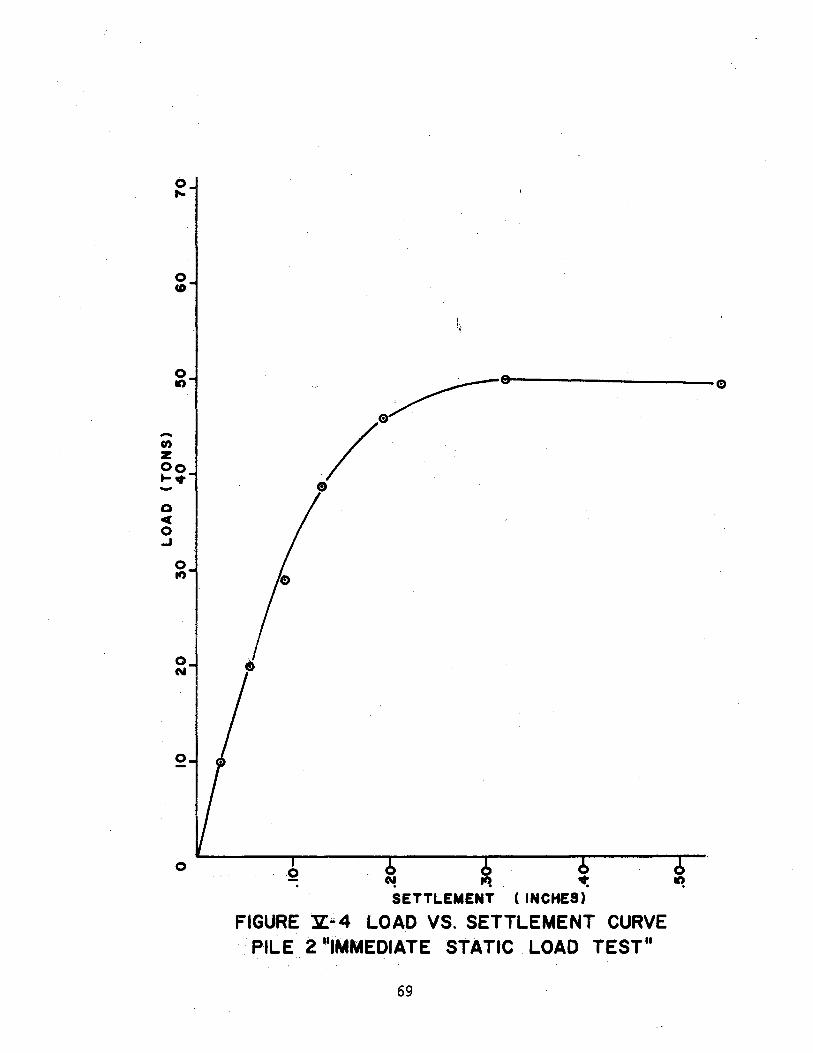
FIGURE V-4 LOAD VS. SETTLEMENT CURVE, PILE 2 11 IMMEDIATE STATIC LOAD TEST 11
• • • • • • • • • • • • • • • • 69
FIGURE V-5 LOAD VS. SETTLEMENT CURVE, PILE 2 11 4 DAY STATIC LOAD TEST 11
• • • • • • • • • • • • • • • • • 70
FIGURE V-6 LOAD VS. SETTLEMENT CURVE, PILE 2 11 11 DAY STATIC LOAD TEST 11
• • • • • • • • • • • • • • • • • 71
xi


INTRODUCTION
Nature of the Problem
Ever since piles were first used to transfer structural loads
to deeper soil strata, the problem of determining the bearing capac
ity of these piles has existed. A considerable amount of research
has been done over the years in order to find an accurate and eco-
nomical answer to this problem.
There are at present two static methods of predicting the bear
ing capacity of a pile (4)*
(1) a f4ll-scale static load test performed at the actual
site,
(2) a static formula in which the load carried by a pile
in skin friction and point bearing are calculated and
combined to give a static bearing capacity.
The first method is often very expensive and time consuming. The
second method of predicting the ultimate capacity, Qu, of a pile
relies on empirical data derived from model studies and full-scale
load tests. The static formula is given as follows:
Qu = fAs + qAp ( 1)
* Numbers in parentheses refer to references at the end of this report. (The citations on the following pages follow the style of the Journal of Soil Mechanics and Foundation Division, ASCE.)
1
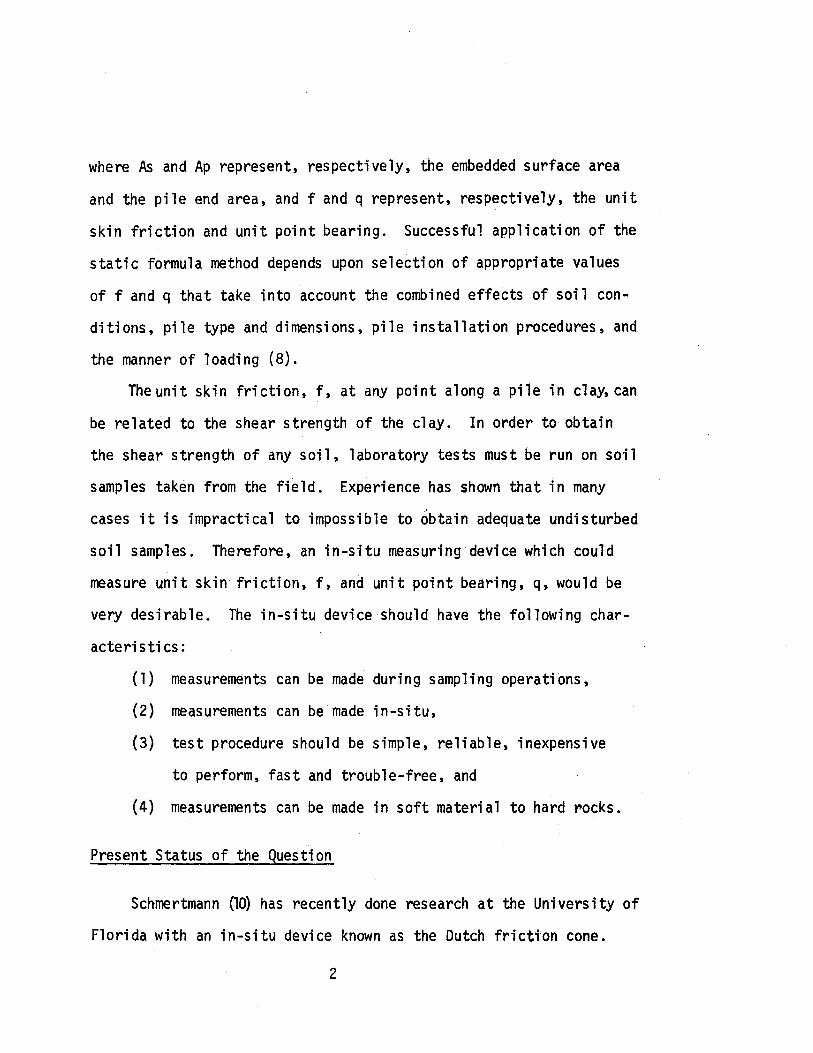
where As and Ap represent, respectively, the embedded surface area
and the pile end area, and f and q represent, respectively, the unit
skin friction and unit point bearing. Successful application of the
static formula method depends upon selection of appropriate values
of f and q that take into account the combined effects of soil con
ditions, pile type and dimensions, pile installation procedures, and
the manner of loading (8).
The unit skin friction, f, at any point along a pile in clay, can
be related to the shear strength of the clay. In order to obtain
the shear strength of any soil, laboratory tests must be run on soil
samples taken from the field. Experience has shown that in many
cases it is impractical to impossible to obtain adequate undisturbed
soil samples. Therefore, an in-situ measuring device which could
measure unit skin friction, f, and unit point bearing, q, would be
very desirable. The in-situ device should have the following char
acteristics:
(1) measurements can be made during sampling operations,
(2) measurements can be made in-situ,
(3) test procedure should be simple, reliable, inexpensive
to perform, fast and trouble-free, and
(4) measurements can be made in soft material to hard rocks.
Present Status of the Question
Schmertmann (10) has recently done research at the University of
Florida with an in-situ device known as the Dutch fricti-on cone.
2

It is a device which makes separate measurements of skin friction
and point bearing by static loading procedures. Schmertmann's proce
dure gives direct measurements of friction and bearing for use with
the static formula method of determining bearing capacity of a pile.
At present, the Texas Highway Department (5) uses either labor
atory shearing strength or the cone penetrometer test correlation to
determine the soil properties needed for use with the static formula.
The bearing capacity obtained in this manner is generally a conserva
tive approximation (5). In many cases the Texas Highway Department
performs full-scale static load tests on piles at an actual construc
tion site.
A study involving the use of a small instrumented pile to mea
sure dynamic and static skin friction and point loads in a variety of
field soils has been presented by Korb (6). Korb's pile was 2.5 ins.
in diameter and 3 ft. in length and was instrumented in such a way
that separate measurements of skin friction and point bearing were
made simultaneously. Korb recommended a test program with a longer
pile which would make it possible to test at greater depths, and to
examine the effects of over burden pressure.
Another study by Rehmet (9) was made using several in-situ
measuring devices. Field tests in clay were made by Rehmet using
these in-situ testing devices and limiting values of skin friction
and point bearing were obtained. As a result of this study, Rehmet
made recommendations concerning a practical test procedure which
could be used to measure skin friction and point bearing during
3

sampling operations. These recommendations involve a static test in
which a device is pushed slowly into the soil at specified depth in
a boring hole and load readings are taken at the ground surface to
determine the skin frtction and point bearing values.
Objectives
The objectives of this investigaiton are:
(1) To conduct a field test program at a test site which
involves measurement cr in-situ skin friction and
point bearing during sampling operations following
the recommended test procedures made by Rehmet {9).
(2) To correlate measured values of skin friction and
General
point bearing taken during sampling operations with data
obtained from the full-scale load tests on the instru
mented pipe piles.
IN-SITU TESTING EQUIPMENT
In order to conduct the in-situ tests outlined in the first
objective, the following equipment was needed:
1. A load measuring device,
2. Loading equipment,
3. And load recording equipment.
Since in-situ measurements were to be made during sampling operations,
4
a standard drilling rig was used as the means of applying the load
to the load measuring device. The load measuring device was connected
to the top of the drill pipei-n order to simplify measurement proce
dures. It was necessary that the load measuring device be simple,
practical, and adaptable to the standard drilling rig. Also, it was
necessary that the recording equipment be easy to operate and adapt
able to field use.
Load Measuring Device
The in-situ load measuring device was made so that it was small,
lightweight and attachable to standard drilling pipe as shown in Fig.
1. The load measuring device was fabricated from 2.375-in. 0. D.
steel tubing with two standard drill rod couplings welded to the tube
with the male connection on one end and the female connection on the
other. The load measuring device was 11.75 ins. in length with a
wall thickness of 0.375 in. Four SR-4 Budd gage Rosettes were placed
5.875 in. from the bottom of the load measuring device. In order to
increase the sensitivity of the gages, the walls of the drill pipe
were machined to a thickness of 0.10 in. at the bridge location.
Loading Equipment
A standard Texas Highway Department drilling rig was used to
apply loads to the drill pipe when running in-situ tests and when
recovering soil samples after each in-situ test. The hydraulic
.system on the drilling rig was used to push the drill pipe into the
5

BRIDGE NO. 1-~--
-., .... CD 10
2.37511
: 0 . G)
FIGURE I LOAD MEASURING DEVICE
6

boring hole the required penetration for each in-situ test at the
required depth. Fig. 2 shows the hydraulic system being used to push
the load measuring device and the drill pipe into the boring hole.
Since a standard drilling rig is used primarily for soil exploration,
it provided the means of obtaining soil samples at any depth desired.
The operation of obtaining soil samples with Shelby tubes is shown
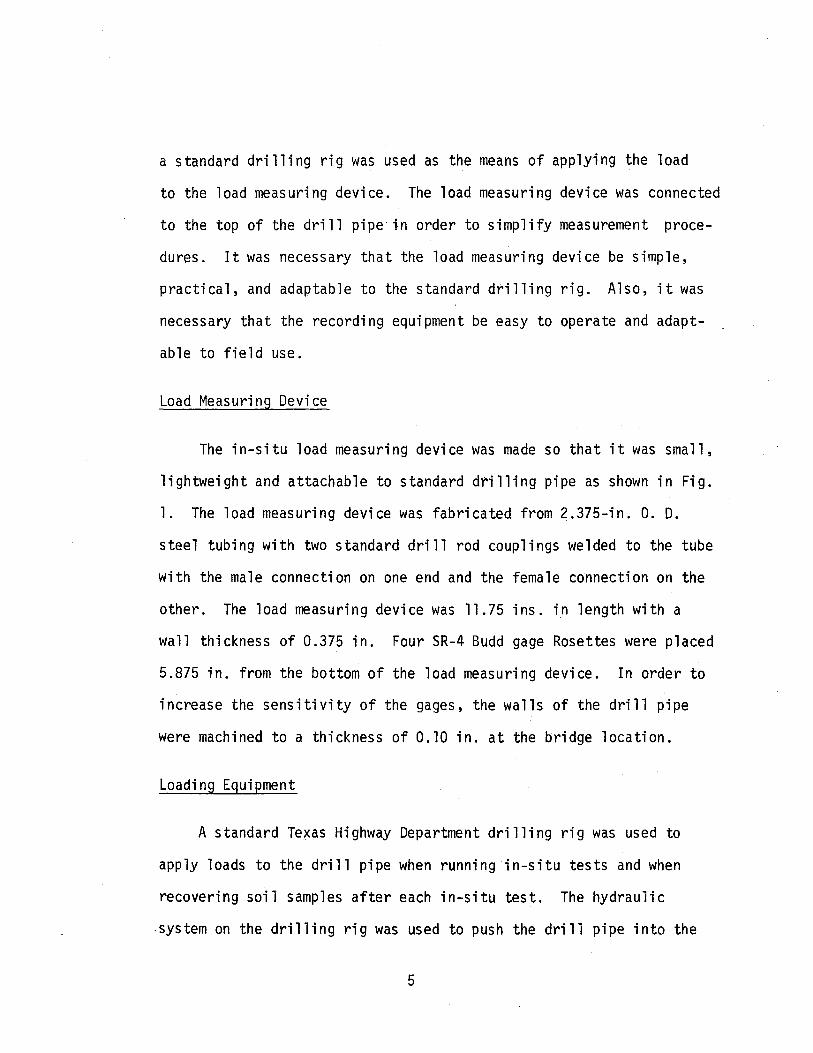
in Fig. 3. The wench on the drilling rig, as shown in Fig. 4,
provided a means of raising and lowering the drill pipe and load
measuring device in and out of the boring hole.
Load Recording Equipment
The battery-operated Budd P-350 strain indicator which was used
to record load data is shown in Fig. 5. Before each in-situ test,
the Budd-P-350 strain indicator was balanced at full sensitivity
with the in-situ load measuring device. During testing, the differ
ence between the balanced load reading and the reading under a given
1 oad constituted the strain in the 1 oad me as uri ng device for that
load. Thestrains found for each load could then be converted to
pounds by using predetermined load-strain (calibration) curves for
the load measuring device. After each in-situ test the load measur
ing device was rebalanced in order to make sure that the balanced
load reading did not change.
7

FIGURE 2 HYDRAULIC EQUIPMENT USED TO PUSH DRILL PIPE INTO THE BORE HOLE
FIGURE 3 SHELBY TUBE SAMPLING
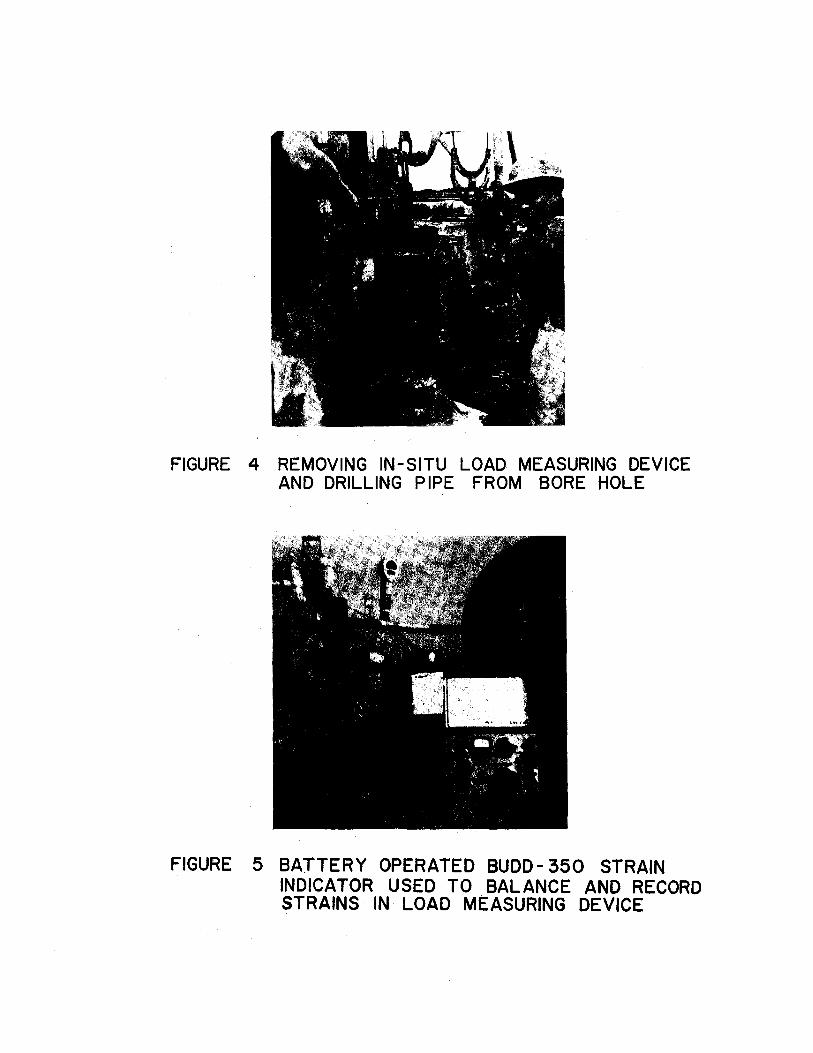
FIGURE 4 REMOVING IN-SITU LOAD MEASURING DEVICE AND DRILLING PIPE FROM BORE HOLE
FIGURE 5 BATTERY OPERATED BUDD- 350 STRAIN INDICATOR USED TO BALANCE AND RECORD STRAINS IN LOAD MEASURING DEVICE
Calibration
In order to calibrate the in-situ load measuring device, an
accurate loading machine was needed. An Instron Loading Machine was
available for this purpose. The load measuring device was loaded
and unloaded several times in the Instron Loading Machine in order
to eliminate permanent set that might occur. Once it was established
that no more permanent set would occur under a maximum assumed load
ing capacity of 10,000 pounds, increments of 1,000 pounds were
applied to the load measuring device and the corresponding strains
for each increment were recorded on a Budd P-350 strain indicator.
Loading and unloading from 0 to 10,000 pounds in increments of 1,000
pounds were accomplished several times in order to assure that cor
responding strains for each load increment were in agreement. The
resulting load-strain data was plotted and was found to be linear.
This process of calibration as shown in Fig. 6 for the in-situ load
measuring device was repeated after each series of in-situ tests.
FIELD TEST PILE INSTRUMENTATION
General
In order to satisfy the second objective of correlating measured
values of skin friction and point bearing taken during sampling oper
ations with data obtained from full-scale load tests on instrumented
pipe piles, it was necessary to test instrumented piles. Two htstru
mented piles were driven and tested at a site in Port Arthur, Texas,
10

FIGURE 6 CALIBRATING IN-SITU LOAD MEASURING
DEVICE ON INSTRON TESTING MACHINE
on State Highway 87 near the Intracoastal Canal Bridge. Pile No. l
was a steel pipe 67 ft. long, 16 ins. in diameter, and had a wall
thickness of 3/8 in. Pile No. 2 was a steel pipe 78 ft. long, 16
ins. in diameter, and had a wall thickness of 3/8 in. Pile No. 1
was driven and tested on the north side of the Intracoastal Canal
Bridge while pile No. 2 was driven and tested on the south side of
the bridge.
Instrumentation
Preliminary soil borings obtained from the Texas Highway Depart
ment, District 20 provided a means of determining the number of
different soil stratum through which the instrumented piles were to
be driven. These boring data are shown in Fig. 7 for site l and
Fig. 8 for site 2. Strain gage bridges were attached to the piles
at each elevation where a different soil layer came into contact with
the pile when embedded. The location of these strain gage bridges
is also shown in Figs. 7 and 8. At each of these locations four
conventional 90° strain gage rosettes were attached 90° apart on
the internal wall of the pile. These gages were wired into two
separa~ wheatstone bridges with 4 active gages in each bridge in
order to cancel bending in the pile and achieve temperature compen
sation and maximum sensitivity. The installation of these gages was
made in accordance with the procedures used by Airhart ( 1 ).
Since non-uniform load distributions about the circumference of
the pile were expected at the top and bottom of the pile, it was
12

LOCATION OF STRAIN GAGE BRIDGES ON
SITE ONE DESCRIPTION
OF STRATUM
PILE NO. I I
--~_£0 ~~~~------~--~------+--,~~~~ ~~~
DARK
ORGANIC CLAY
WET T&G
SILTY CLAY
WET T&G
CLAYEY SILT
WET GRAY
CLAY WITH SOME SHELL t--r-"T""'t-- 4 e' -----------1
WET T & G
SILTY CLAY
PLASTIC GRAY
SILTY CLAY
2
• 0 . CD • CO CD
1 -., . •
-ell
0 N
FIGURE 7 LOCATION OF THE 5 STRAIN GAGE BRIDGES (PILE NO. I)
13

%_ ..1 ..Jo t-..,: -· LIL 02
~- ft>> .,
v 10
20 v
JO v • • • ~ • ~ ~ • 40
~ • ~ ~
I
• 50 • •
'
~ ~ ~ ~ 60 ~ ~
70 ~ ~ ~ ~ ~ ~ ..
·~ 80
~ ~
SITE TWO LOCATION OF STRAIN GAGE BRIDGES ON
DESCRIPTION PILE NO.2 OF .. r,-STRATUM -. -=---. .,
4~ j ~ j • j~ ~ ~
WET OK GRAY ., -~
., ,..: "": • -
ORGANIC CLAY .,
., "': , . C\1 2 -CD ..
WET T&G . ., SILTY CLAY ~ ~ -. -
WITH SOME SHELL ir ,.
- 3 -
-WET T&G
.,
SILTY CLAY dr ,., j~ 4
671 -.,
WET T&G a -7 3
• SANDY CLAY ,., •lr • • l:..l..:
' -0
WET T&G CLAY
FIGURE 8 LOCATION OF THE 5 STRAIN GAGE BRIDGES ( PILE NO. 2)
14

felt that averaging of these two bridge outputs at a location would
be an accurate indication of the average load. Additionally, since
there was a possibility of losing one of the bridges at each location,
it was considered necessary to have two independent bridges at each
location. This approach would provide at least some indication of
the load, should one of the bridges become inoperative. The two
independent bridges also provided a means of checking the load at
each bridge location.
Strain gage cables inside the pile were adhered to the pile wall
over substantially the entire length and anchored near each bridge
location in order to eliminate cable stretching during driving and
data collection. All cables were terminated near the top of the pile
into a single multi-pin connector. This cable termination technique
was used to eliminate external cables being connected to the pile
during hauling and handling and provided a means of easy external
connection to the recording equipment.
In addition to the gages in the pile, a specially designed load
cell was attached in the field above the head of the pile to verify
the recorded loads at the top of the pile. The load cell was con
structed from the same type of material as the piles and was instru
mented in basically the same manner as the piles. The load cell's
theoretical bridge output agreed very closely with the actual out
put during several calibrations both before and after driving the
Riles. It was also found that close agreement was obtained between
the load cell and the top bridges in the piles throughout the tests.
15
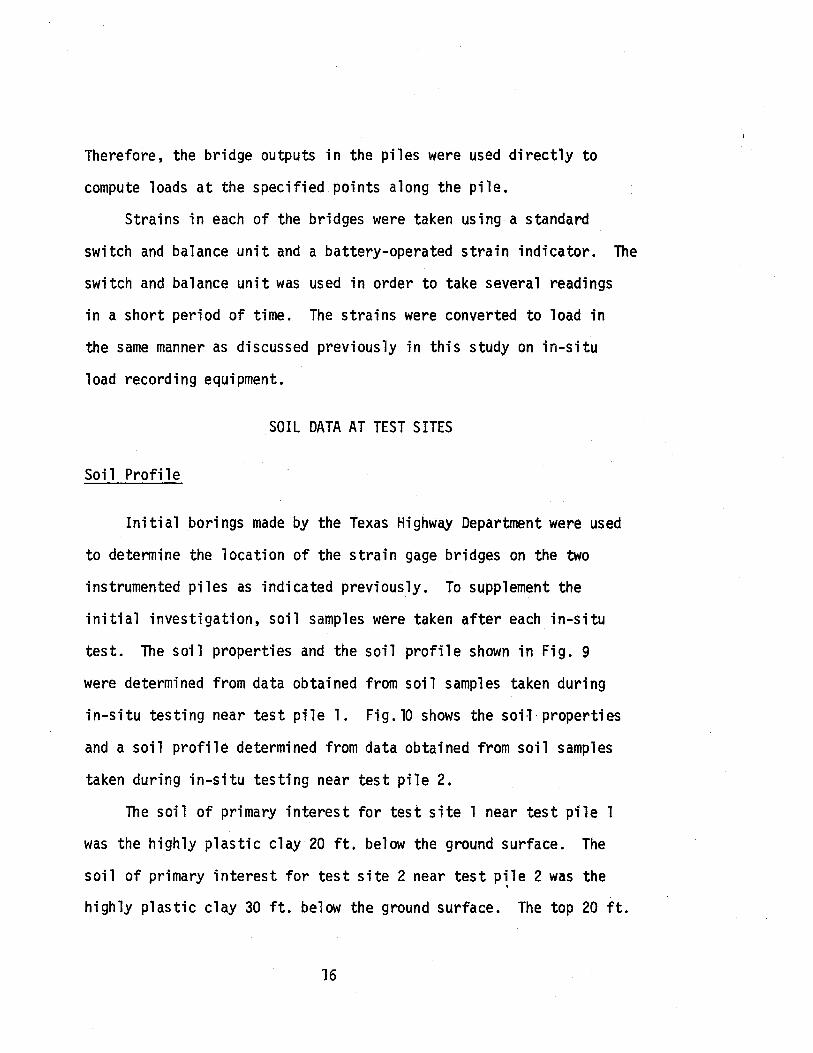
Therefore, the bridge outputs in the piles were used directly to
compute loads at the specified points along the pile.
Strains in each of the bridges were taken using a standard
switch and balance unit and a battery-operated strain indicator. The
switch and balance unit was used in order to take several readings
in a short period of time. The strains were converted to load in
the same manner as discussed previously in this study on in-situ
load recording equipment.
SOIL DATA AT TEST SITES
Soil Profile
Initial borings made by the Texas Highway Department were used
to determine the location of the strain gage bridges on the two
instrumented piles as indicated previously. To supplement the
initial investigation, soil samples were taken after each in-situ
test. The soil properties and the soil profile shown in Fig. 9
were determined from data obtained from soil samples taken during
in-situ testing near test pile 1. Fig. 10 shows the soil properties
and a soil profile determined from data obtained from soil samples
taken during in-situ testing near test pile 2.
The soil of primary interest for test site 1 near test pile 1
was the highly plastic clay 20 ft. below the ground surface. The
soil of primary interest for test site 2 near test P1le 2 was the
highly plastic clay 30 ft. below the ground surface. The top 20 ft.
16
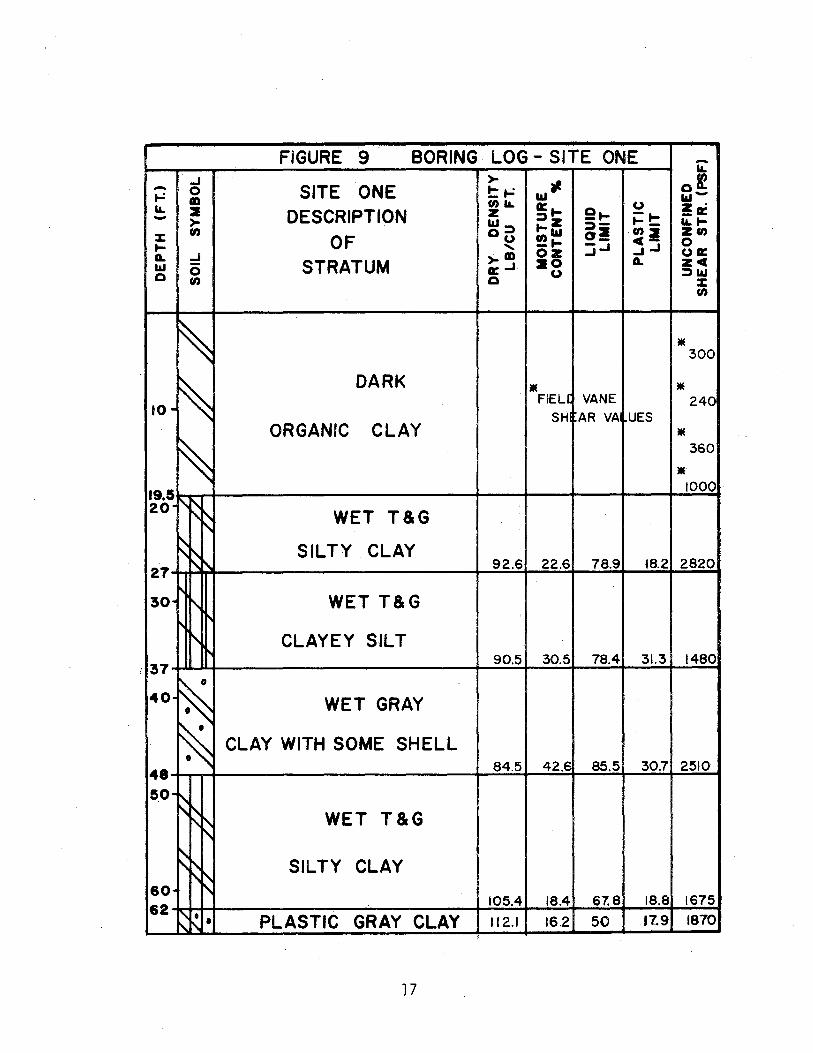
FIGURE 9 BORING LOG- SITE ONE -IL ..J >- ..,at of - 0 SITE ONE !::.-: ._; fD w-
IL 2 (I)IL D:l- (J z· - DESCRIPTION z e .... - .... _D:
>- I&J~ ::)z
::)-.... _ ILl-
% (I)
OF ou .... .., ol (l)i zen 1- '
!!t- :::;..J ~ .... 0 A. ..J >-Ill oz ua:: I&J 0 STRATUM ao A. zc 0
g:..J (J ~I&J (I) 0 :z:
(I)
f\ liE 300
~ DARK liE liE
10-FIEU VANE 240
SH AR VA UES
~ ORGANIC CLAY liE
360
liE
19.5 1000
20" r\~~ WET T&G ~
~~ SILTY CLAY 27 '' 92.6 22.6 78.9 18.2 2820
' 30 ' WET T&G
' ' CLAYEY SILT
! 37 90.5 30.5 78.4 31.3 1480
40 ~ WET GRAY
~ CLAY WITH SOME SHELL 84.5 42.6 85.5 30.7 2510
48 50 \
'~ ~ WET T&G
~~ ~
SILTY CLAY ~
60 62
105.4 18.4 67.8 18.8 1675
~ • • PLASTIC GRAY CLAY 112.1 16.2 50 11.9 1870
' 17
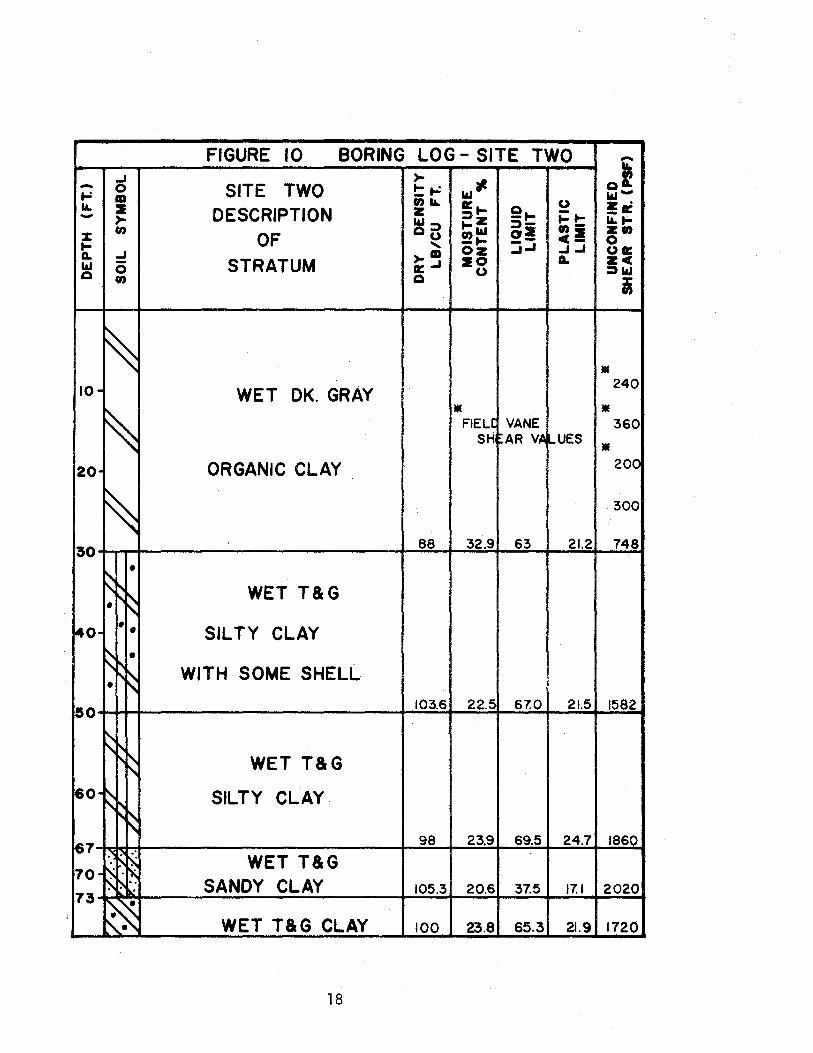
FIGURE 10 BORING LOG- SITE TWO -...1 )-
Lt.! at at - 0 SITE TWO !:t-= t-= CD w-I&. :a (I) I&. a= ...
9t-u z·
DESCRIPTION z i=t-_a= - )- Lt.l::) ::»z l&.t-
(I) t-Lt.l ::)- (1)- Z(l) % OF Ou !!t- o! cl 0 t- .... ~..J a.. ...1 >-CD oz ..J..J ua::
20 L zc LLI 0 STRATUM a: ...I u =»w a (I) 0 i
\ • 10 WET OK. GRAY
240
\ • • FIELC VANE 360
SH AR VA ~UES • 20· ORGANIC CLAY 200
\ 300
30 88 32.9 63 21.2 748
• ~ ~~ WET T&G • ~
40 • • SILTY CLAY
~ • ~ WITH SOME SHELL ~~ •
50 103.6 22.5 67.0 21.5 1582
~ ~ ~~ WET T&G
60-~ SILTY CLAY " "~
67 98 23.9 69.5 24.7 1860 :'i ~~ WET T&G
70 ~ -~ SANDY CLAY ~ ·: 105.3 20.6 37.5 17.1 2020 73
~ WET T&G CLAY 100 23.8 65.3 21.9 1720 t\..
18

near test pile l and the top 30 ft. near test pile 2 were too soft
to enable in-situ test of the type conducted in this study to be
run.
Soil Properties
The following physical properties were determined from data
obtained from soil samples taken during in-situ testing:
1 . Dry Density
2. Moisture Content
3. Liquid Limit
4. Plastic Limit.
It was necessary to obtain these physical properties so that a
correlation might be attempted between the soil properties and the
in-situ test data. The shear strength, an engineering property
of the soil, was also determined for each soil sample taken. The
shear strength could be used when using Eq. 1 to determine the
ultimate bearing capacity, Qu, of a pile. The physical and eng~
neering properties for test site 1 are shown in Fig. 9 and for test
site 2 in Fig. 10.
The top 20 ft. of soil near test pile 1 was too soft for uncon
fined compression tests to be run; therefore,field vane shear tests
were run to determine the vane shear strength of the soil. For
test site 2 where the top 30 ft. was too soft to enable unconfined
compression tests to be run; the field vane shear test was used to
determine the vane shear strength of the soil. The physical soil
19
properties and the engineering properties were determined using
accepted standard procedures as presented in the laboratory manual
by Lambe ( 7) .
TEST PROCEDURE
General
Rehmet ( 9) and Korb ( 6 ) used small instrumented piles to
simultaneously measure unit skin friction, f, and unit point bearing,
q. Their studies were restricted to testing in shaliow soil depths.
This restriction was due mainly to the limitations imposed by wires
extending from the recording equipment at the ground surface to the
strain gages located inside their small instrumented piles. This
shallow depth of penetration into the ground is impractical because
in-situ measurements of skin friction and point bearing are needed
at much greater depths in order to estimate the bearing capacity of
a pile. Rehmet ( 9) tested to depths of 10 ft. and made recommen
dations for conducting deeper tests. These recommendations were
followed in this study.
In-Situ Test Procedure
The test procedure used in this study was as follows:
(1) Using standard drilling rig equipment, advance the test
hole to the desired depth.
20
(2) Retract and remove drilling equipment and insert drill
pipe to the bottom of the test hole.
(3) Zero balance the in-situ measuring load cell with the
Budd P-350 Strain Indicator, as shown in Fig. 5.
(4) Take an initial reading on the Budd P-350 Strain Indicator
of the in-situ measuring load cell to be used during the
test.
(5) Connect the load cell to the drill pipe and to the Kelley
of the drill rig.
(6) Conduct a tip-only te_st by measuring the total surface load
required to move the drill pipe downward one inch.
(7) Push the drill pipe assembly downward so that the pipe will
be embedded eleven inches in the bottom of the test hole.
(8) Conduct an embedded test by measuring the total surface
load required to move the drill pipe downward one inch.
(9) Remove the load cell at the surface and retract the drill
pipe. Attach drilling equipment and advance the test
hole to the next desired depth.
(10) Repeat this procedure until measurements are made at any
number of desired depths.
In-Situ Test Series
For identification purposes, series l was conducted near test
pile 1 and series 2 and 3 were conducted near test pile 2. Each
21

test series involved a number of in-situ tip-only and embedded tests.
Test designation and descriptions are found in Table 1 for test
series 1, Table 2 for test series 2 and Table 3 for test series 3.
After a test site was selected near test pile 1 for test series
1 and near test pile 2 for test series 2 and 3, a bore hole was
drilled down to a soil strata that was stiff enough to enable tip
only and embedded tests to be run. For test series 1, the bore hole
was drilled to a depth of 20 ft. and for test series 2 and 3 the bore
holes were drilled to a depth of 30 ft. The bore holes were then
cleaned out with drilling mud and a 2 ft. Shelby tube sample was
taken in order that laboratory determinations of the soil parameters
could be made. The bore hole was again washed out and a tip-only and
embedded test conducted in accordance with the procedure discussed
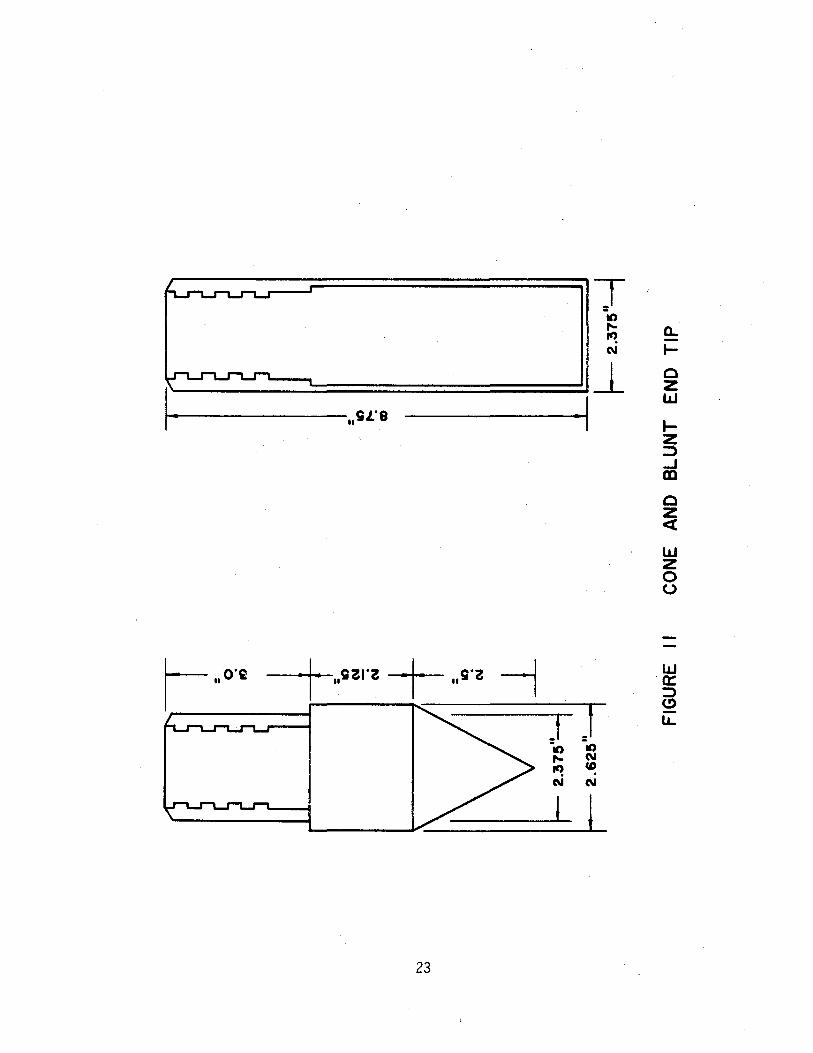
previously. For test series 1 and test series 2, the blunt 'end tip
shown in Fig. 11 was used for the tip-only and embedded tests. For
test series 3 the cone tip shown in Fig. 11 was used for the tip-only
and embedded tests. Sampling, washing and in-situ tests conducted
at each test depth are shown in Tables 1, 2, and 3.
Instrumented Pile Test Procedure
Test pile 1 was driven 61 ft. into the ground on November 3,
1969 and test pile 2 was driven 72 ft. into the ground on November
20, 1969. After the test piles were embedded to these respective
depths, load recording equipment was installed on the test piles.
22
T liD ~ a.. ~ N .....
_l 0 z w
.. gJ.'8 ..... z :,:) ..J m c z <t
lJJ z 0 (.)
w a: :,:)
J (!)
J IJ..
liD liD ,._ N
~ CD N N
l l
23

TABLE 1.--TEST DESIGNATION AND DESCRIPTION--TEST SERIES I
Series Hole Test Depth, Description of Test* in feet
I I 1 21.5 Tip only
I I 2 22.5 Total embedded test
I I 3 30.0 Tip only
I I 4 32.0 Total embedded test
I I 5 40.5 Tip only
I I 6 41.5 Total embedded test
I I 7 60.5 Tip only
I I 8 61.5 Total embedded test
I I 9 65.5 Tip only
I I 10 66.5 Total embedded test
*This test series consisted of all tip only and total surface load tests near instrumented pipe pile No. 1. Instrumented pipe pile No. 1 tests consisted of three full-scale static load tests: immediate, 4-day, and 11-day.
24

TABLE 2.--TEST DESIGNATION AND DESCRIPTION--TEST SERIES II
Series Hole Test Depth, Description of Test* in feet
II II 1 30 Tip only·
II II 2 31 Total embedded test
II II 3 40 Tip only
II II 4 41 Tota 1 embedded test
II II 5 50 Tip only
II II 6 51 Total embedded test
II II 7 60 Tip only
II II 8 61 Total embedded test
II II 9 69 Tip only
II II 10 69** Total embedded test
II II 11 80 Tip only
II II 12 81 Total embedded test
*This test series consisted of all tip only and total surface load tests near instrumented pipe pile No. 2. Instrumented pipe pile No. 2 consisted of three full-scale static load tests: immediate, 4-day, and 11-day.
**Soil was too stiff to enable embedded test to be run.
25
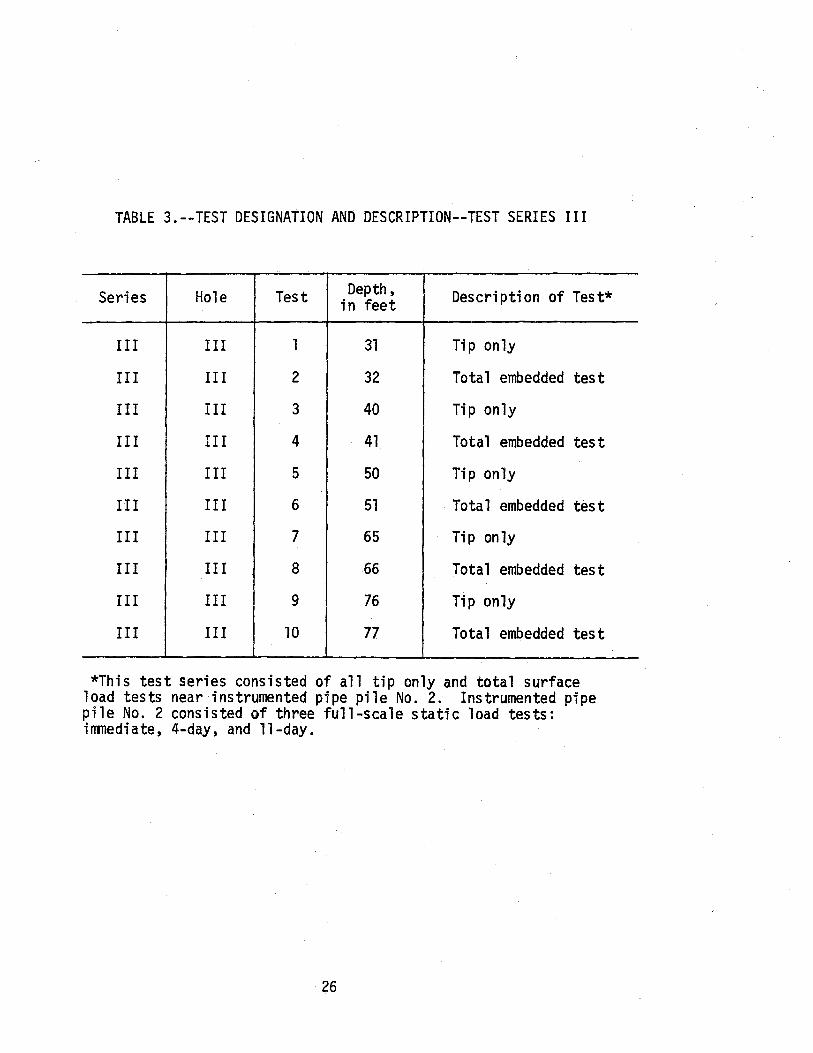
TABLE 3.--TEST DESIGNATION AND DESCRIPTION--TEST SERIES III
Series Hole Test Depth, Description of Test* in feet
III III 1 31 Tip only
III III 2 32 Total embedded test
III III 3 40 Tip only
III III 4 41 Total embedded test
III III 5 50 Tip only
III III 6 51 Total embedded test
III III 7 65 Tip only
III III 8 66 Total embedded test
III III 9 76 Tip only
III III 10 77 Total embedded test
*This test series consisted of all tip only and total surface load tests near instrumented pipe pile No. 2. Instrumented pipe pile No. 2 consisted of three full-scale static load tests: immediate, 4-day, and 11-day.
26
Each test pile was then driven three additional feet into the ground.
This enabled dynamic loading effects to be recorded during the final
3 feet of driving.
After the test piles were driven, static load tests were con
ducted to determine the ultimate bearing capacity, Qu, of the test
pile. Procedures and load test equipment were in keeping with
standard Texas Highway Department practice. The static load tests
were conducted immediately, 4 days and 11 days after driving the test
piles in order to determine the soil set-up factor around each test
pile.
Upon completion of the 11 day static load test, the test piles
were redriven one or two feet to record dynamic loading effects
after the 11 day set-up of the soi 1 around each of the test pi 1 es.
It should be noted that dynamic data recorded during driving of the
test piles was not reported in this study, but it is reported in a
research report by Bartoskewi tz ( 2).
ANALYSIS OF TEST RESULTS
General
The test results for this study were analyzed by comparing
measured values of unit skin friction and point bearing from the
instrumented test piles with the corresponding values measured
from the in-situ measuring device. Since simultaneous measure
ments of friction and bearing were not made with the in-situ
27
measuring device, it was necessary to develop adjustment factors for
the in-situ measurements. After developing the adjustment factors,
it was possible to correlate these factors with the soil parameter,
plasticity index.
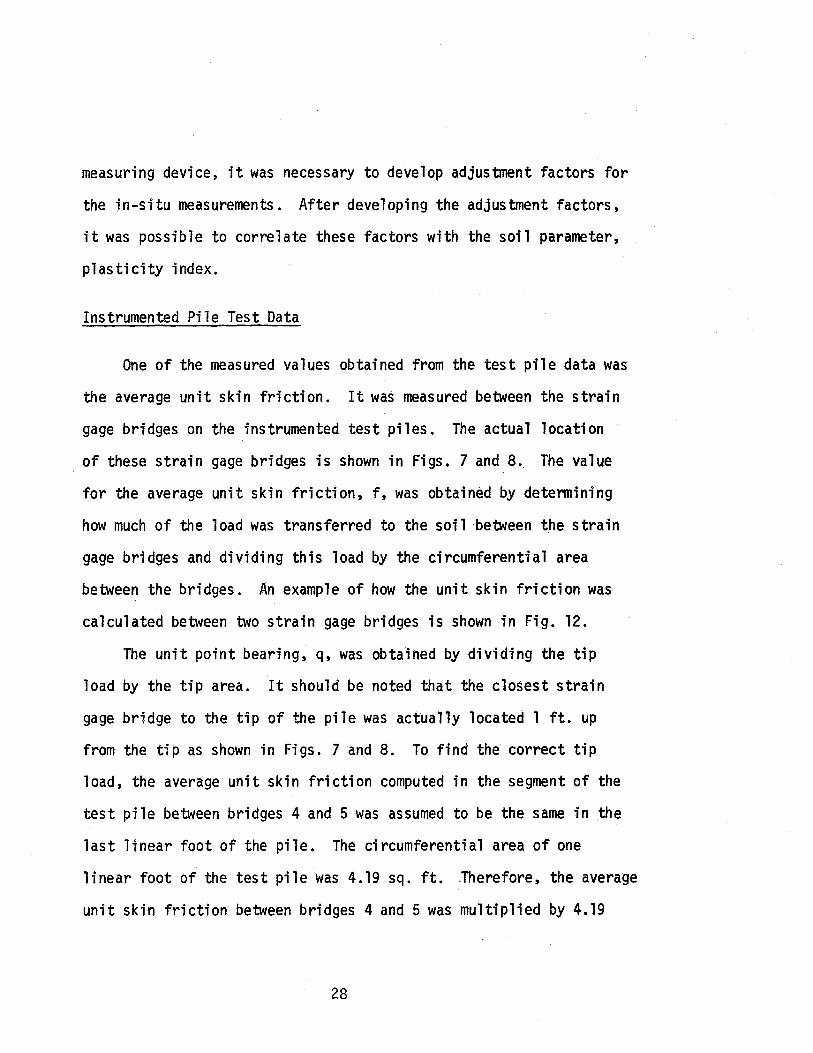
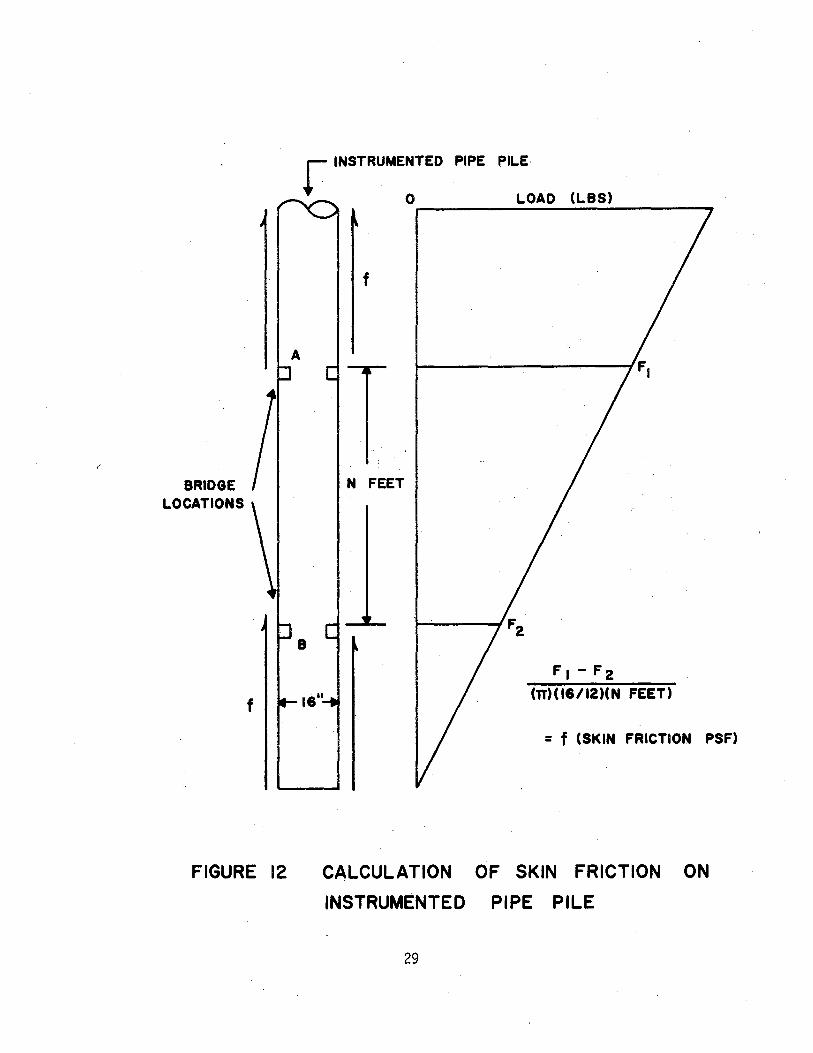
Instrumented Pile Test Data
One of the measured values obtained from the test pile data was
the average unit skin friction. It was measured between the strain
gage bridges on the instrumented test piles. The actual location
of these strain gage bridges is shown in Figs. 7 and 8. The value
for the average unit skin friction, f, was obtained by determining
how much of the load was transferred to the soil between the strain
gage bridges and dividing this load by the circumferential area
between the bridges. An example of how the unit skin friction was
calculated between two strain gage bridges is shown in Fig. 12.
The unit point bearing, q, was obtained by dividing the tip
load by the tip area. It should be noted that the closest strain
gage bridge to the tip of the pile was actually located 1 ft. up
from the tip as shown in Figs. 7 and 8. To find the correct tip
load, the average unit skin friction computed in the segment of the
test pile between bridges 4 and 5 was assumed to be the same in the
last linear foot of the pile. The circumferential area of one
linear foot of the test pile was 4.19 sq. ft. .Therefore, the average
unit skin friction between bridges 4 and 5 was multiplied by 4.19
28
BRIDGE LOCATIONS
FIGURE 12
A
r INSTRUMENTED PIPE PILE
0 LOAD (LBS)
f
N FEET
(n)(I6112)(N FEET)
= f (SKIN FRICTION PSF)
CALCULATION OF SKIN FRICTION ON
INSTRUMENTED PIPE PILE
29

sq. ft. and this value was subtracted from the load recorded in
bridge 5 to give the corrected load for the tip of the test pile.
This corrected load was then divided by the area of the tip of
the test pile to find the unit point bearing value.
All of the measured static data from the field load tests on the
the two instrumented test piles are given in Appendix III. The
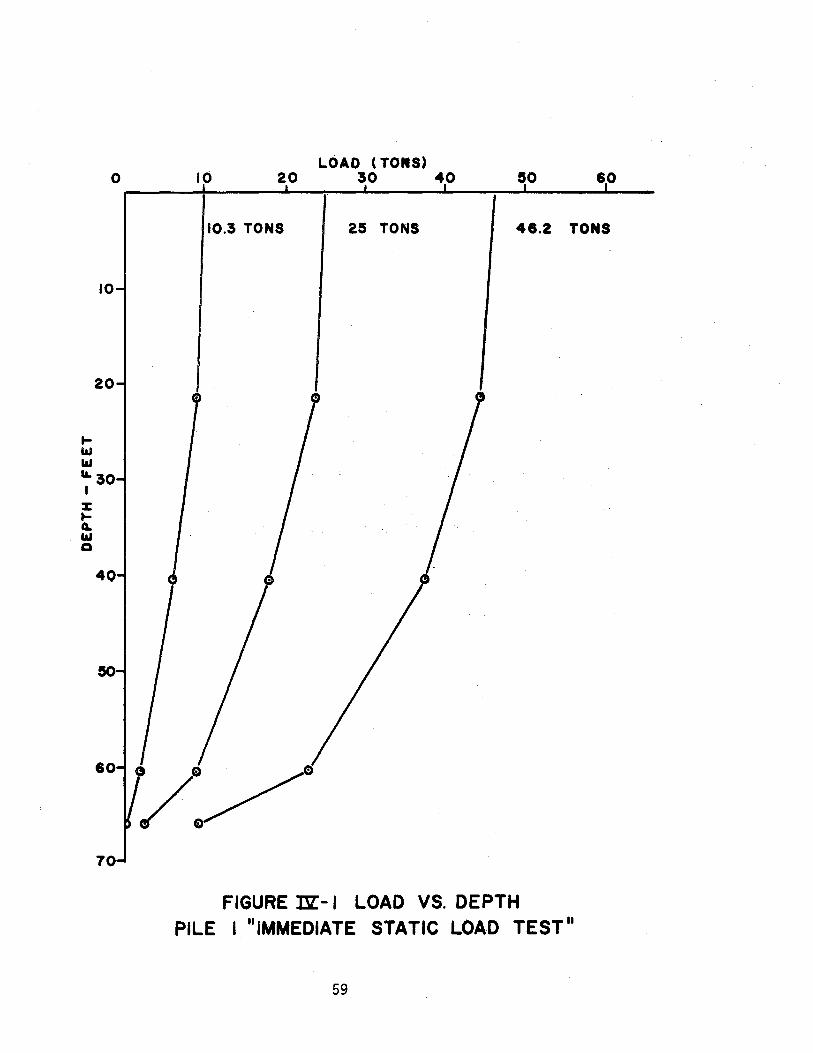
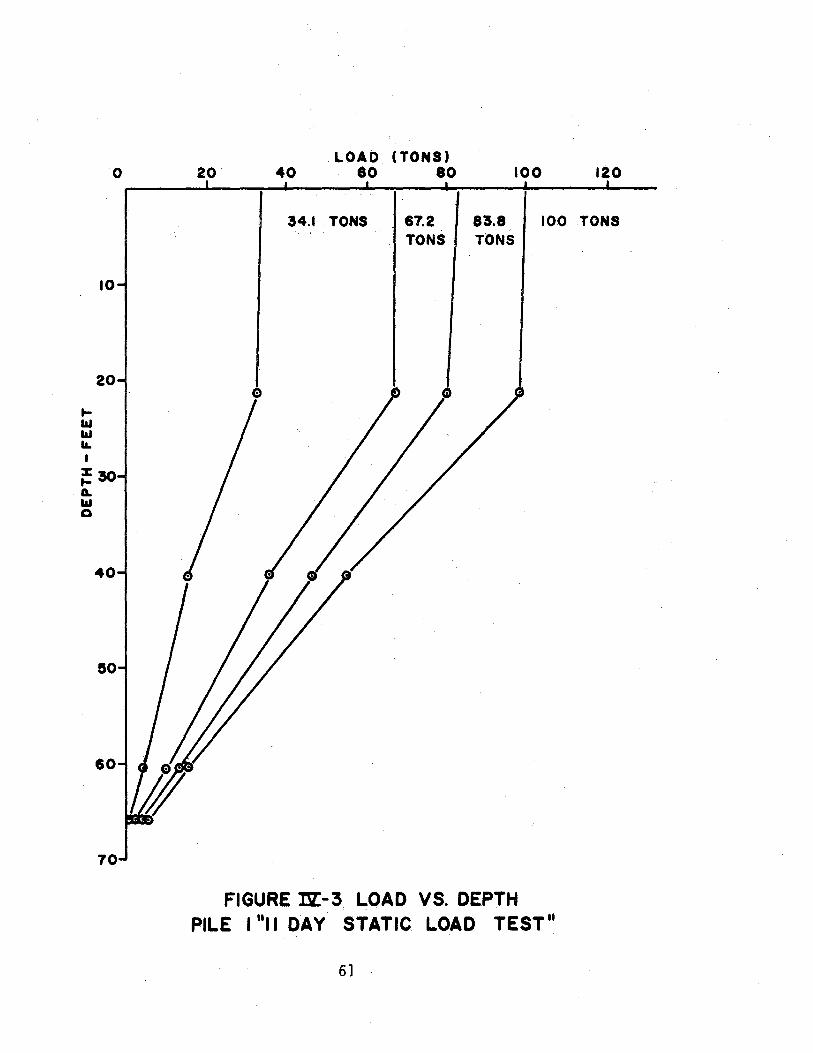
load Distribution versus Depth curves for the test piles are given
in Appendix IV. The Load-Settlement curves for the two test piles
are found in Appendix V. All loading values given in this study
were developed from load data taken from the 5 strain gage bridges
in each of the test piles. The failure loads are considered to
be those loads corresponding to plunging failure of the test piles.
In-Situ Friction Test Data
From the studies conducted by Korb { 6 ) and Rehmet ( g ) , it
was found that the point bearing values determined from tip-only
tests changed during the embedded test. Therefore, an adjustment
factor was used in this study to correct the point bearing value for
the embedded test so that correct friction values would be obtained.
The adjustment factor also includes a correction for shape and size
effects because in-situ measurments were compared with measured
friction from the full-scale piles.
Since the average unit skin friction as determined from the
immediate, 4-day and 11-day static load tests on the instrumented
30

test piles and the in-situ measurements were known, the measured
friction values from the test piles were equated to the in-situ
measurements. The following equation was used to equate average
unit skin friction, FM' to the in-situ measurements:
F = TE - [TO(CT)] M AREA
where: FM = average measured unit skin friction obtained from the instrumented test piles.
TE = load in lbs. measured from the in-situ embedded tests .
T0 = load in lbs. measured from the in-situ tiponly tests.
C = adjustment factor for the in-situ tip-only T tests.
Area = circumferential area for 1 ft. of drill pipe.
(2)
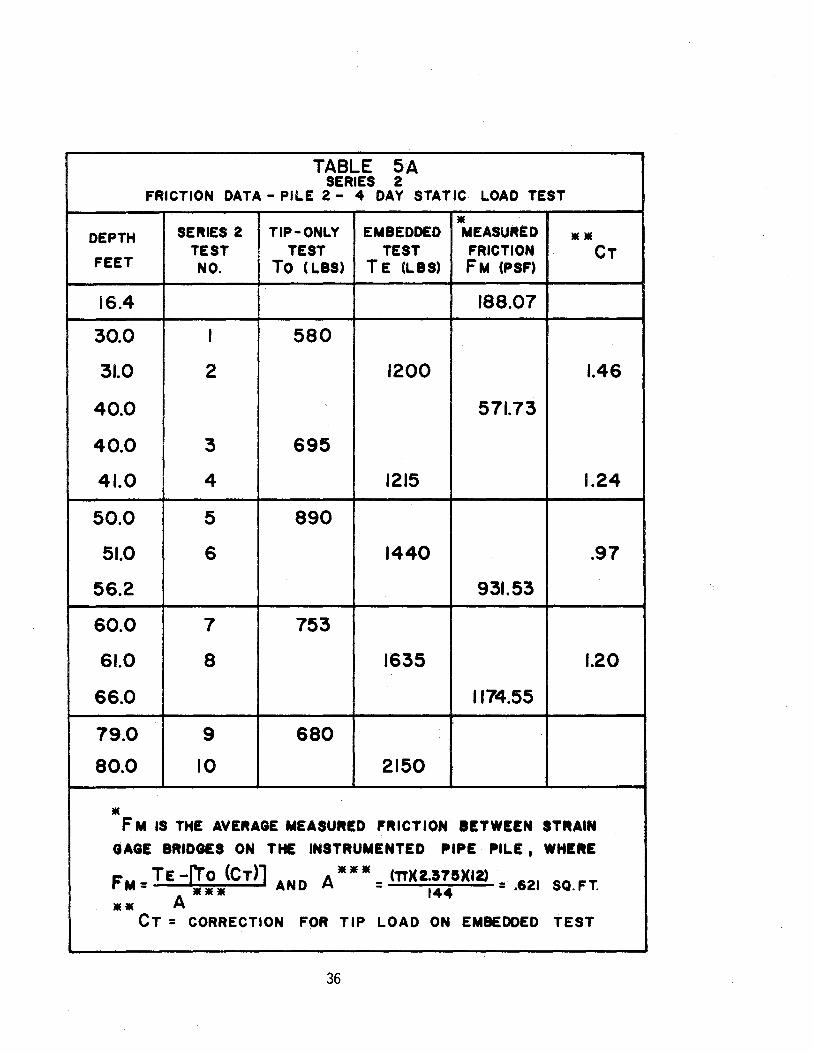
Since the FM value used in Eq. 2 is an average value obtained
from the test piles, it was necessary to make several in-situ
measurements in each different soil strata so that an average value
for CT could be found. Everything in Eq. 2 was measured and known
except the adjustment factor, Cr Therefore, it was p~ssible to
compare a CT value for each soil strata and for all tests conducted
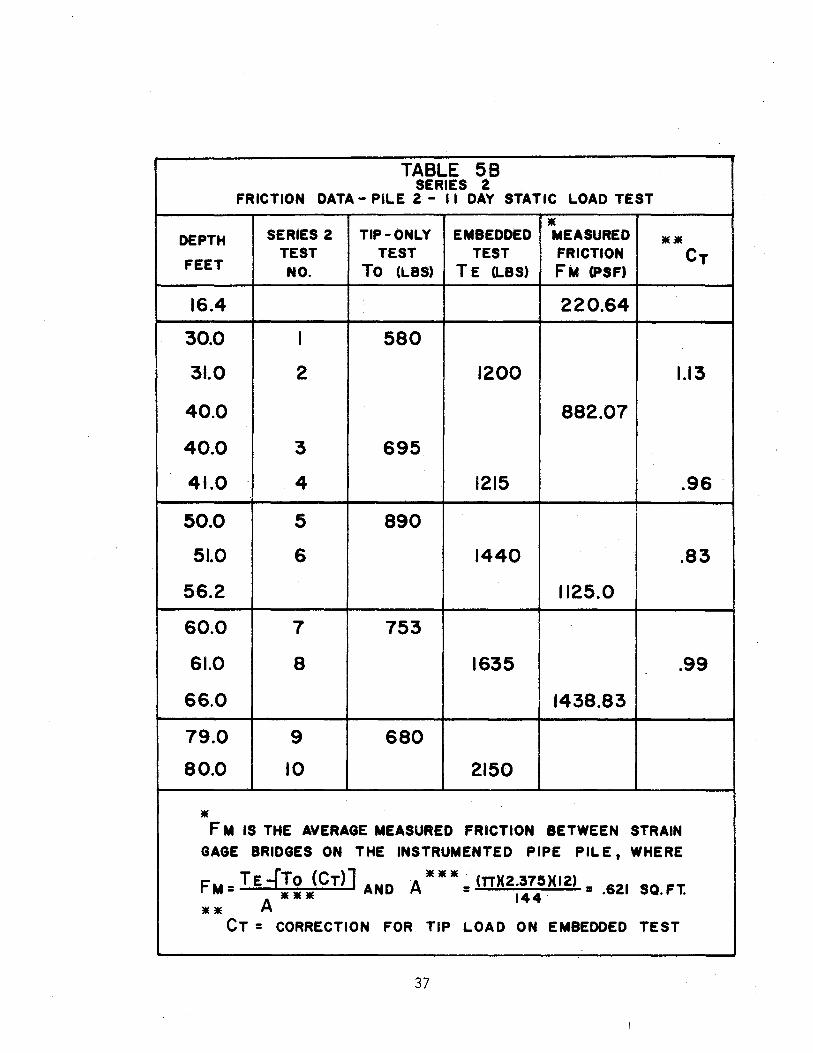
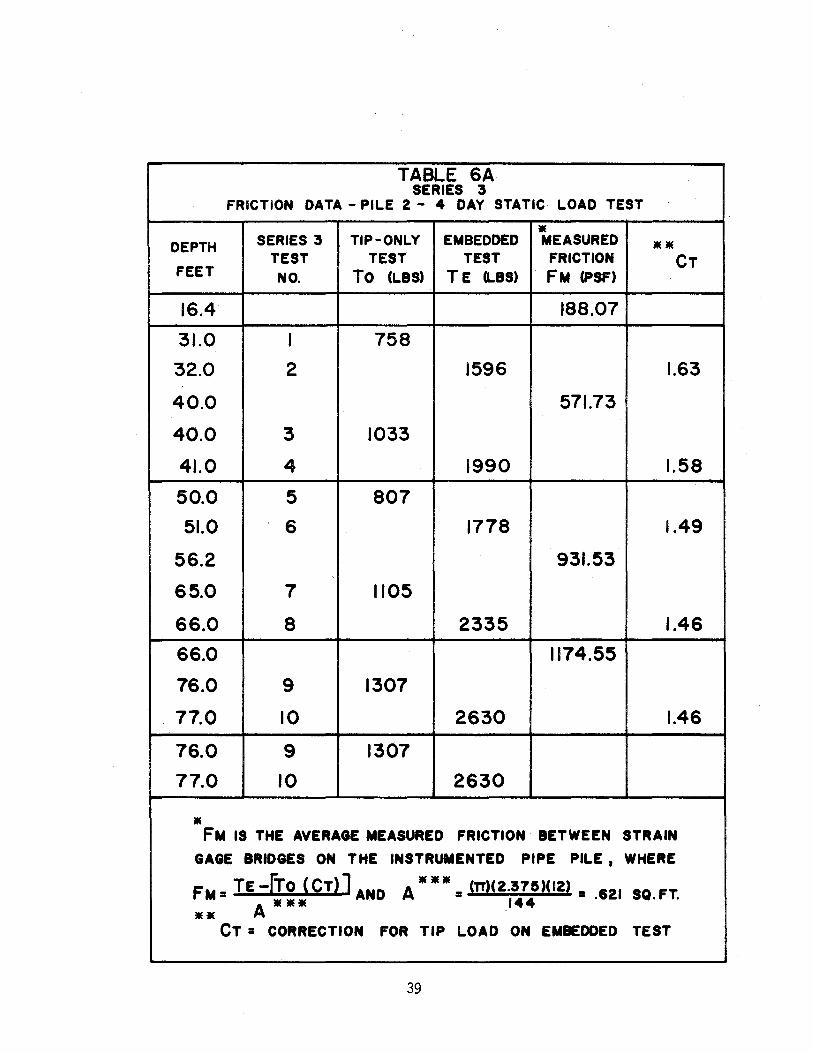
in this study. Tables 4, 5 and 6 contain average measured unit
skin friction values, in-situ measurements of tip-only tests,
embedded tests, and the corresponding CT values.
31

TABLE 4 SERIES I
FRICTION DATA- PILE 1- IMMEDIATE STATIC LOAD TEST
DEPTH
FEET
12.0
21.5
22.5
30.0
31.0
32.0
40.5
41.5
50.0
60.5
61.5
60.5
61.5
62.5
65.5
66.5
•
• SERIES I TIP·ONLY EMBEDDED . MEASURED TEST TEST TEST FRICTION
No. To <LBS) TE tLBS) FM (PSF)
I
2
3
4
5
6
7
8
7
8
9
10
920
790
748
1135
1135
1189
41.32
2239
173.5
1625
1711
352.3
2218
2218
1202.78
1868
2.32
1.92
2.14
1.76
1.30
FM IS THE AVERAGE MEASURED FRICTION BETWEEN STRAIN
GAGE BRIDGES ON THE INSTRUMENTED PIPE PILE , WHERE
FM : TE -(J 2.( C T)] AND A • • • = hrH2i!~5)(12) : .621 SQ. FT.
•• A CT = CORRECTION FOR TIP LOAD ON EMBEDDED TEST
32

DEPTH
FEET
12.0
21.5 22.5
30.0
31.0
32.0
40.5
41.5
50.0
60.5
61.5
60.5
61.5
62.5
65.5
66.5
•
TABLE 4A SERIES I
FRICTION DATA- PILE 1- 4 DAY STATIC LOAD. TEST
• SERIES I TIP-ONLY EMBEDDED MEASURED TEST TEST TEST FRICTION NO. To (LBs> T E (LBs> F M (PSF)
I
2
3
4
5
6
7
8
7
8
9
10
920
790
748
1135
1135
1189
16.79
2239
722.82
1625
1711
702.26
2218
2218
1337.39
1868
•• CT
1.75
1.49
1.71
1.57
1.22
FM IS THE AVERAGE MEASURED FRICTION BETWEEN STRAIN
GAGE BRIDGES ON THE INSTRUMENTED PIPE PILE , WHERE
-r ( ' 1 ••• FM = TE J~ • CT) AND A = (lT)(Zi!~S)(IZ) = .621 SQ. FT.
•• A CT = CORRECTION FOR TIP LOAD ON EMBEDDED TEST
33

DEPTH
FEET
12.0
21.5
22.5
30.0
31.0
32.0
40.5
41.5
50.0
60.5
61.5
60.5
61.5
62.5
65.5
66.5
liE
TABLE 48 SERIES I
FRICTION DATA- PILE I- II DAY STATIC LOAD TEST
SERIES I TEST NO.
I
2
3
4
5
6
7
8
7
8
9
10
TIP-ONLY TEST
To <LBS>
920
790
748
1135
1135
1189
EMBEDDED TEST
T E (LBS)
2239
1625
1711
2218
2218
1868
liE MEASURED FRICTION FM (PSF)
40.02
1101.19
894.52
1111.59
liE liE
CT
1.69
1.19
1.55
1.47
1.35
FM IS THE AVERAGE MEASURED FRICTION BETWEEN STRAIN
GAGE BRIDGES ON THE INSTRUMENTED PIPE PILE , WHERE
FM = TE -frsJCT)] AND A • • • = tn)(21ll5)U2) = .621 SQ. FT.
•• A CT • CORRECTION FOR TIP LOAD ON EMBEDDED TEST
34
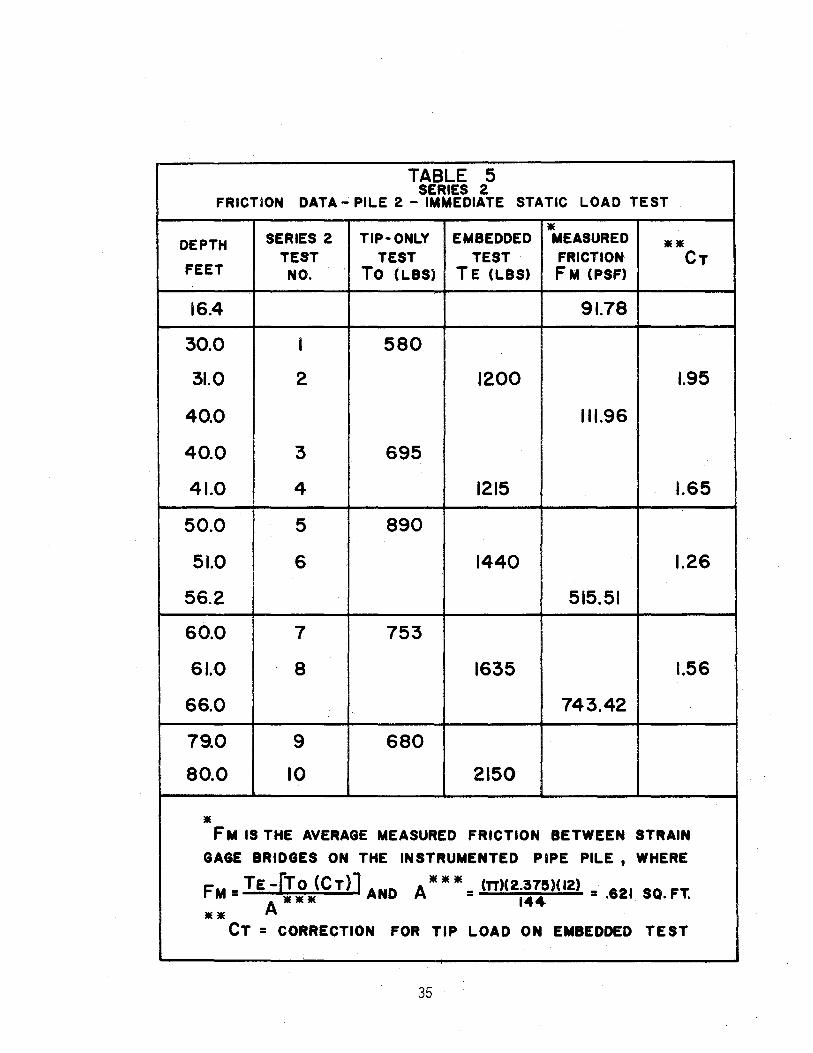
TABLE 5 SERIES 2
FRICTION DATA- PILE 2 - IMMEDIATE STATIC LOAD TEST
DEPTH
FEET
16.4
30.0
31.0
40.0
40.0
41.0
50.0
51.0
56.2
60.0
61.0
66.0
79.0
80.0
•
• SERIES 2 TIP- ONLY EMBEDDED MEASURED TEST TEST TEST FRICTION No. To (LBS) TE (LBS) FM <PSF)
I
2
3
4
5
6
7
8
9
10
580
695
890
753
680
91.78
1200
111.96
1215
1440
515.51
1635
743.42
2150
•• CT
1.95
1.65
1.26
1.56
FM IS THE AVERAGE MEASURED FRICTION BETWEEN STRAIN
GAGE BRIDGES ON THE INSTRUMENTED PIPE PILE , WHERE
FM = TE -[J~ *(CT)] AND A • * * = (TT)(Zi!~)(IZ) • .621 SQ. FT.
•• A CT = CORRECTION FOR TIP LOAD ON EMBEDDED TEST
35
DEPTH
FEET
16.4
30.0
31.0
40.0
40.0
41.0
50.0
51.0
56.2
60.0
61.0
66.0
79.0
80.0
•
TABLE 5A SERIES 2
FRICTION DATA- PILE 2- 4 DAY STATIC LOAD TEST
SERIES 2 TEST NO.
I
2
3
4
5
6
7
8
9
10
TIP-ONLY EMBEDDED TEST TEST
To ( LBS) T E (LBS)
580
1200
695
1215
890
1440
753
1635
680
2150
• MEASURED FRICTION FM (PSF)
188.07
571.73
931.53
1174.55
•• CT
1.46
1.24
.97
1.20
F M IS THE AVERAGE MEASURED FRICTION BETWEEN STRAIN
GAGE BRIDGES ON THE INSTRUMENTED PIPE PILE, WHIR!
FM = TE;cr~.<CT)) AND Awn= llTK~!~IIK12l = .621 SQ. FT.
•• CT = CORRECTION FOR TIP LOAD ON EMBEDDED TEST
36
DEPTH
FEET
16.4
30.0
31.0
40.0
40.0
41.0
50.0
51.0
56.2
60.0
61.0
66.0
79.0
80.0
liE
TABLE 58 SERIES 2
FRICTION DATA- PILE 2 - II DAY STATIC LOAD TEST
SERIES 2 TEST NO.
I
2
3
4
5
6
7
8
9
10
TIP-ONLY TEST
To (LBS)
580
695
890
753
680
liE EMBEDDED MEASURED
TEST FRICTION T E (LBS) F M (PSF)
220.64
1200
882.07
1215
1440
1125.0
1635
1438.83
2150
1.13
.96
.83
.99
F M IS THE AVERAGE MEASURED FRICTION BETWEEN STRAIN
GAGE BRIDGES ON THE INSTRUMENTED PIPE PILE, WHERE
fM• TE!J~,.(CTlJ AND A,.,.,.~ lnX2j!7:X12l = .621 SQ.Ft liE liE
CT = CORRECTION FOR TIP LOAD ON EMBEDDED TEST
37
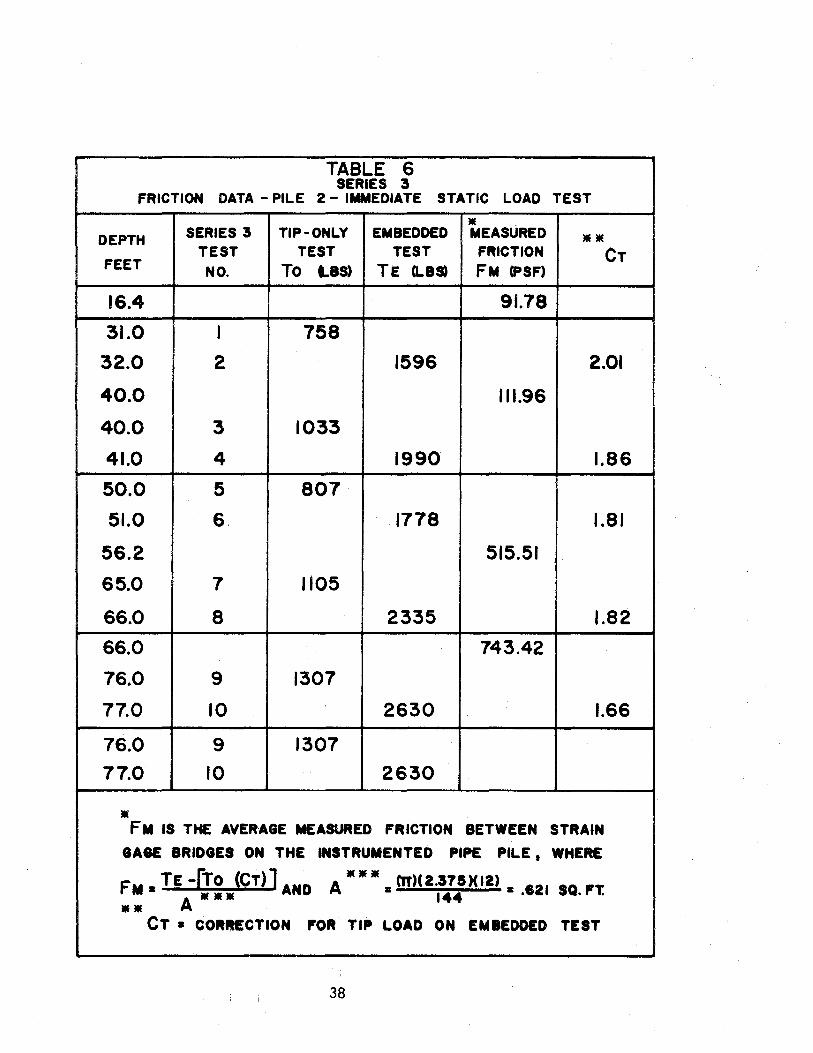
TABLE 6 SERIES 3
FRICTION DATA- PILE 2- IMMEDIATE STATIC LOAD TEST
DEPTH
FEET
16.4
31.0
32.0
40.0
40.0
41.0
50.0
51.0
56.2
65.0
66.0
66.0
76.0
77.0
76.0
77.0
•
SERIES 3 TEST NO.
I
2
3
4
5
6
7
8
9
10
9
10
TIP-ONLY TEST
To LBS)
758
1033
807
1105
1307
1307
• EMBEDDED MEASURED •• TEST FRICTION CT TE (LBS) FM (PSF)
91.78
1596 2.01
111.96
1990 1.86
1778 1.81
515.51
2335 1.82
743.42
2630 1.66
2630
FM IS THE AVERAGE MEASURED FRICTION BETWEEN STRAIN
8A8E BRID8ES ON THE INSTRUMENTED PIPE PILE , WHERE
FM • TE -rr~ •(CT) J AND A • • • • (Tf)( 2·~:)(12) = .821 SQ. FT.
•• A CT • CORRECTION FOR TIP LOAD ON EMBEDDED TEST
38
DEPTH
FEET
16.4
31.0
32.0
40.0
40.0
41.0
50.0
51.0
56.2
65.0
66.0
66.0
76.0
77.0
76.0
77.0
liE
TABLE 6A SERIES 3
FRICTION DATA- PILE 2- 4 DAY STATIC LOAD TEST
SERIES 3 TEST NO.
I
2
3
4
5
6
7
8
9
10
9
10
TIP-ONLY TEST
To CLBS>
758
1033
807
1105
1307
1307
EMBEDDED TEST
T E O..BS)
1596
1990
1778
2335
2630
2630
liE MEASURED
FRICTION FM (PSF)
188.07
571.73
931.53
1174.55
liE liE
CT
1.63
1.58
1.49
1.46
1.46
FM IS THE AVERAGE MEASURED FRICTION BETWEEN STRAIN
GAGE BRIDGES ON THE INSTRUMENTED PIPE PILE, WHERE
FM = TE -~~ J CT) J AND A • • • = (TT)(2 .• ~7:)(12) = .621 SQ. FT.
•• A CT = CORRECTION FOR TIP LOAD ON EMBEDDED TEST
39

DEPTH
FEET
16.4
31.0
32.0
40.0
40.0
41.0
50.0
51.0
56.2
65.0
66.0
66.0
76.0
77.0
76.0
77.0
•
TABLE 68 SERIES 3
FRICTION DATA - PILE 2 - II DAY STATIC LOAD TEST
• SERIES 3 TIP-ONLY EMBEDDED MEASURED TEST TEST TEST FRICTION NO. To (LIS) TE LIS) FM (PSF)
I
2
3
4
5 6
7
8
9
10
9
10
758
1033
807
1105
1307
1307
220.64
1596
882.07
1990
1778
1125.0
2335
1438.83
2630
2630
•• CT
1.38
1.40
1.33
1.31
1.33
FM IS THE AVERAGE MEASURED FRICTION BETWEEN STRAIN
GAGE BRIDGES ON THE INSTRUMENTED PIPE PILE , WHERE
FM = TE -tr~.CCT)) AND A • •• = (11')( 2·~::)(1 2) = .621 SQ. FT.
•• A CT = CORRECTION FOR TIP LOAD ON EMBEDDED TEST
40

In-Situ Bearing Test Data
From in-situ test series 1, 2 and 3, the tip-only tests were
compared directly with the meas.ured point bearing obtained from
the instrumented test piles. After the test piles were driven
and the depth of the tip was located, the in-situ tip-only tests
were conducted at these depths. This enabled comparisons to be
made between in-situ point bearing measurements and the actual
measured point bearing.
The unit point bearin~ qt, for the in-situ tip-only test
was obtained using the following equation:
To q = -:-.---=----t tip area (3)
where:
qt = in-situ unit point bearing
T0
= load in pounds measured from in-situ tip-only tests
lip Area = area of the b 1 unt or cone tip.
The adjustment factor, CP, for the in-situ measurements of
the point bearing was obtained using the following equation:
where:
cp = adjustment factor for point bearing
qt = in-situ measured point bearing
qp = test pile measured point bearing.
41
(4)
Thus, CP is the ratio of the in-situ measurements to the test pile
measurements of unit point bearing.
For test series 3, the tip area varied in diameter as shown
in Fig. 11. The diameter of the base of the cone was used to com
pute the cross-sectional area of the cone tip in accordance with the
procedure recommended by Begemann ( 3). The cross-sectional area
of the tip in test series 3 was computed to be 0.0376 sq. ft. The
unit point bearing, qt' for series 1, 2, and 3 and the computed
CP values for the immediate, 4-day and 11-day static load tests
are given in Table 7.
Correlation with Soil Properties
If in-situ measurements are made without having instrumented
test pile data available, the adjustment factors, Ct and CP, must
be known in order to determine unit skin friction and point bear
ing. Correlation of Ct and CP to some soil proper~ which is
obtainable by disturbed soil sampling methods is most desirable.
It was found in this study that the plasticity index, IP,
could be correlated to the adjustment factors, CP and Ct. Plots
of CP and Ct versus the plasticity index of the soil for these
test series are given in Figs. 13 and 14. Fig. 13 shows the
relationship between the CP values obtained from correlation with
the immediate, 4-day and 11-day static load test on the two
instrumented test piles. Fig. 14 shows the relationship between
42

..p. w
TABLE 7 POINT BEARING DATA
*POINT **POINT **POINT **POINT
DEPTH I TEST I SERIES TIP-ONLY BEARING BEARING ••• BEARING • •• BEARING
I*** AND TEST FROM TIP- IMMEDIATE Cp 4-DAY Cp II-DAY . Cp FEET PILE TEST NO. (LBS) ONLY TEST TEST TEST TEST
(PSF) q_T (PSF) q.p (PSF) q_ p (PSF) q_p
65.5 1 I 1-9 1189 38,604 9,329 4.13 1143 33.77 2887 13.37
80 I 2 2-11 680 22,078 9,329 2.37 16,415 1.34 10,614 2.07
76 I 2 3-9 1307 34,761 9,329 3.73 16,415 2.12 10,660 3.26
* POINT BEARING FROM TIP-ONLY TEST (~ ) WHERE q_ = LOAD (LBS) : T T ( 3 .14)(~)2
LOAD (LBS) .0308 SQ. FT.
FOR SERIES 3 q_T = 4
** POINT BEARING DETERMINED FROM FULL SCALE STATIC LOAD TEST ON
INSTRUMENTED PIPE PILES <q_p) WHERE q_p = LOAD (LBS) _
(3.14) ( :: )2 -4
LOAD (LBS) 1.40 SQ. FT.
•••Cp IS FOUND BY DIVIDING TIP- ONLY VALUE FOR POINT BEARING q_ T BY THE
INSTRUMENTED PILE. POINT BEARING q_ p WHERE q_T
q.p = Cp

30.0
25.0
20.0
15.0
10.0
5.0 --a
DAY STATIC LOAD TEST
--------
G) SERIES I
S SERIES 2
A SERIES 3
II DAY STATIC LOAD TEST
..,..,.....-IMMEDIATE STATIC LOAD TEST
o~----------------------~~------~-----------30 40 50
PLASTICITY INDEX (%)
FIGURE 13 Cp VS. PLASTICITY INDEX
44
4 DAY LOAD
IMMEDIATE LOAD
2.0
1.9
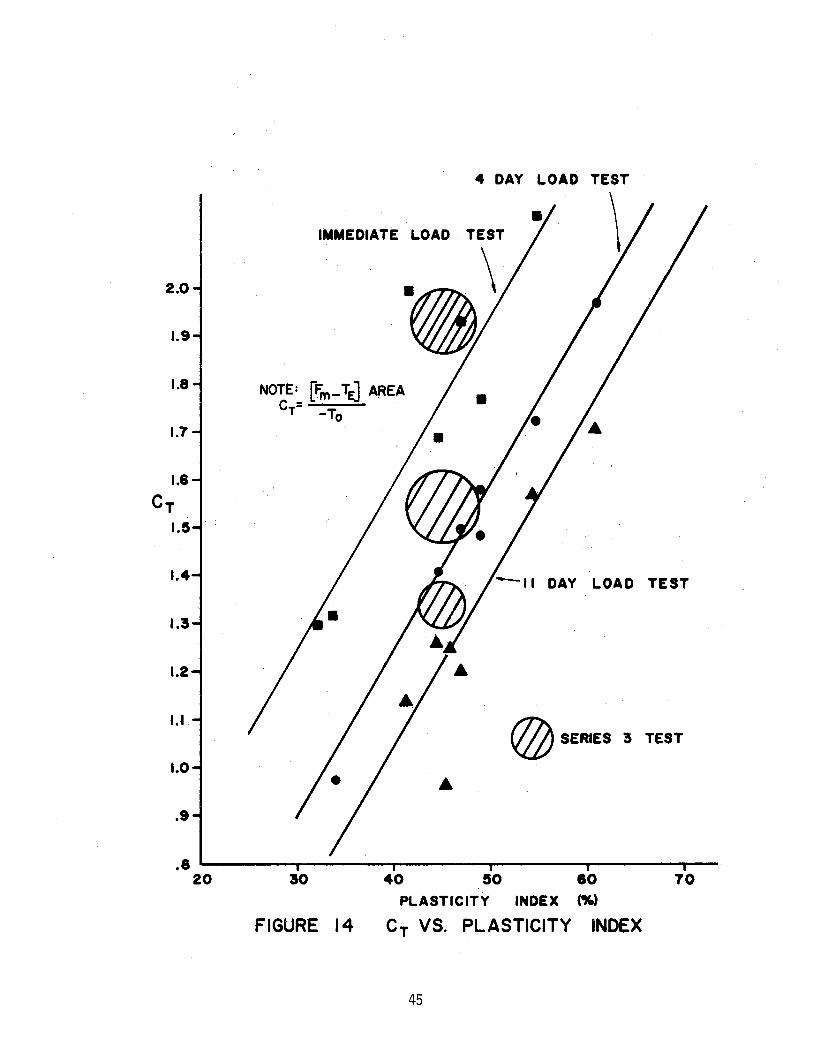
1.8 NOTE: (Fm-TE) AREA c = -=-::::--~
T -To 1.7
1.4 DAY LOAD TEST
1.3
1.2
1.1 @ SERIES 5 TEST
1.0
.9
.8 --------~------~--------~------~------~---20 30 40 50 80 70
PLASTrCITY INDEX (%)
FIGURE 14 CT VS. PLASTICITY INDEX
45

the Ct values obtained from correlation with the immediate, 4-day
and 11-day static load tests. It should be noted that in test .
series 3 the Ct values and the plasticity index of the soil at
each depth tested were approximately equal in value. Therefore,
the shaded circular areas in Fig. 14 show the relationship between
the Ct and the plasticity index of the soil for test series 3.
Since a correlation was obtained between the Ct and CP values
with the plasticity index of the soil, it is possible to use
these values of Ct and CP with in-situ measurements of the type
presented in this study to determine the bearing capacity of a
pile. The recommended procedure for estimating the ultimate
bearing capacity, Qu' of a pile and an example problem are given
in Appendix VI.
CONCLUSIONS AND RECOMMENDATIONS
Conclusions
The objectives of this research study consisted of two parts:
(1) to conduct a field test program at a test site
which involves measurements of in-situ skin friction
and point bearing during sampling operations, and
(2) to correlate the measured values of skin friction
and point bearing taken during sampling operations
with data obtained from full-scale instrumented
test piles.
46
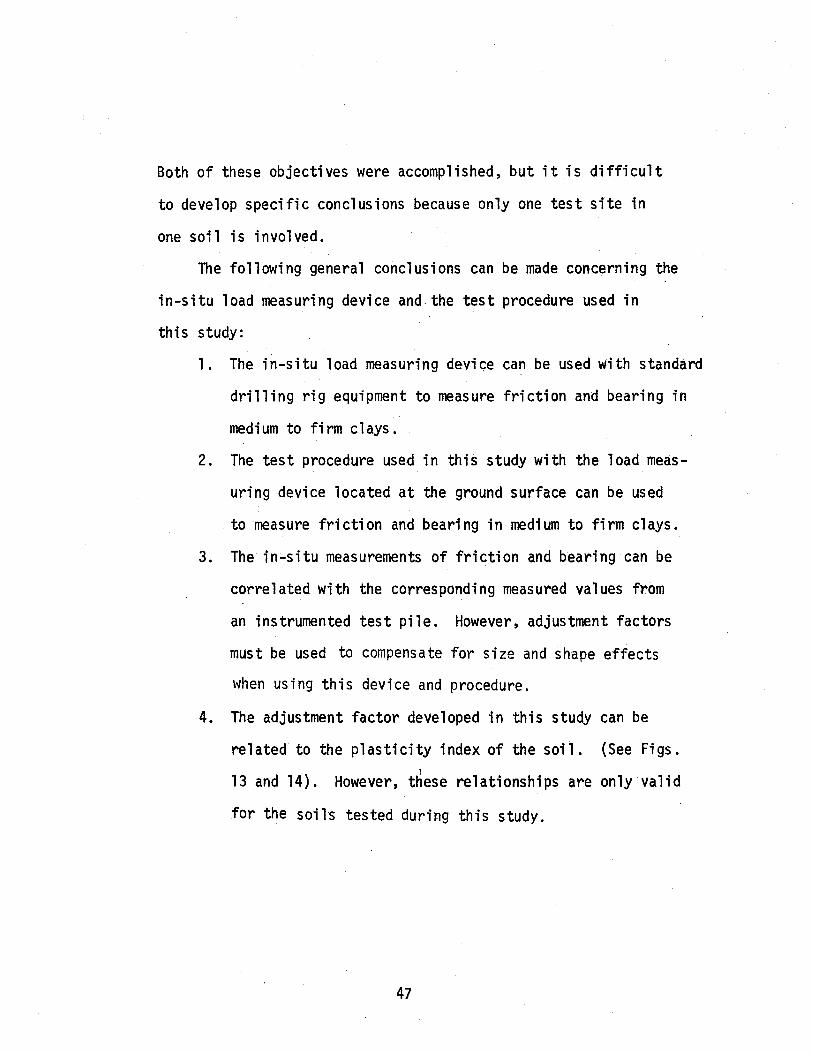
Both of these objectives were accomplished, but it is difficult
to develop specific conclusions because only one test site in
one soil is involved.
The following general conclusions can be made concerning the
in-situ load measuring device and the test procedure used in
this study:
1. The in-situ load measuring device can be used with standard
drilling rig equipment to measure friction and bearing in
medium to firm clays.
2. The test procedure used in this study with the load meas
uring device located at the ground surface can be used
to measure friction and bearing in medium to firm clays.
3. The in-situ measurements of friction and bearing can be
correlated with the corresponding measured values from
an instrumented test pile. However, adjustment factors
must be used to compensate for size and shape effects
when using this device and procedure.
4. The adjustment factor developed in this study can be
related to the plasticity index of the soil. (See Figs. ' 13 and 14}. However, these relationships are only valid
for the soils tested during this study.
47

Rec011111endations
It has been shown as a result of this study that the load
measuring device cannot be used either in very soft or very stiff
soils. Future in-situ tests should include a different method of
testing in very soft and in very stiff soils. Testing in very
soft soils could be accomplished by utilizing a field vane device.
Testing in very stiff soils could be accomplished by using the
standard penetration test.
It has also been shown in this study that the adjustment factors
developed can be related to plasticity index. However, future
in-situ tests and full-scale instrumented pile tests should be
conducted in a variety of test sites in order to verify these
relationships. Much additional data would be necessary before the
procedure outlined in Appendix VI could be used to estimate the
bearing capacity of a pile.
48
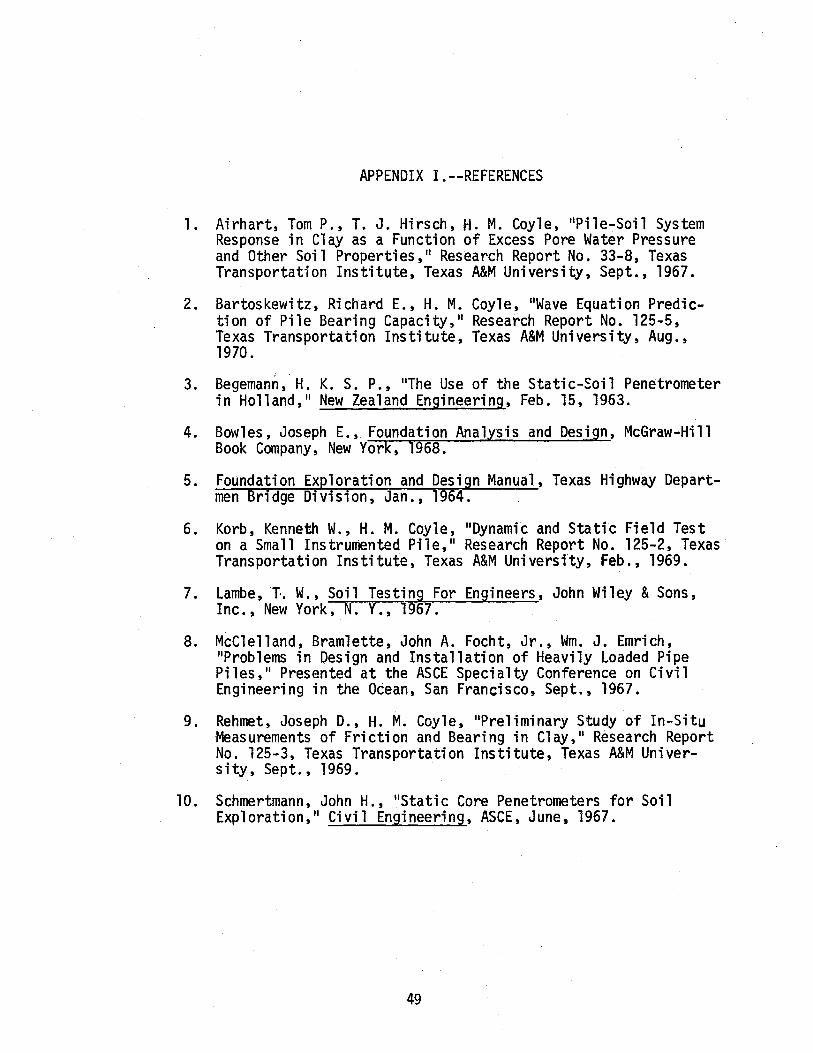
APPENDIX I.--REFERENCES
1. Airhart, Tom P., T. J. Hirsch, f-1. M. Coyle, "Pile-Soil System Response in Clay as a Function of Excess Pore Water Pressure and Other Soil Properties," Research Report No. 33-8, Texas Transportation Institute, Texas A&M University, Sept., 1967.
2. Bartoskewitz, Richard E., H. M. Coyle, "Wave Equation Prediction of Pi 1 e Bearing Capacity," Research Report No. 125-5, Texas Transportation Institute, Texas A&M University, Aug., 1970.
3. Begemann, H. K. s. P., "The Use of the Static-Soil Penetrometer in Holland," New Zealand Engineering, Feb. 15, 1963.
4. Bowles, Joseph E., Foundation Analysis and Design, McGraw-Hill Book Company, New York, 1968.
5. Foundation Exploration and Design Manual, Texas Highway Departmen Bridge Division, Jan., 1964.
6. Korb, Kenneth W., H. M. Coyle, "Dynamic and Static Field Test on a Small Instrumented Pile," Research Report No. 125-2, Texas Transportation Institute, Texas A&M University, Feb., 1969.
7. Lambe, T. W., Soil Testing For Engineers, John Wiley & Sons, Inc., New York, N.Y., 1967.
8. McClelland, Bramlette, John A. Focht, Jr., Wm. J. Emrich, "Problems in Design and Installation of Heavily Loaded Pipe Piles," Presented at the ASCE Specialty Conference on Civil Engineering in the Ocean, San Francisco, Sept., 1967.
9. Rehmet, Joseph D., H. M. Coyle, "Preliminary Study of In-Situ Measurements of Friction and Bearing in Clay," Research Report No. 125-3, Texas Transportation Institute, Texas A&M University, Sept., 1969.
10. Schmertmann, John H., "Static Core Penetrometers for Soil Exploration," Ci vi 1 Engineering, ASCE, June, 1967.
49


APPENDIX !I.--NOTATION
Qu = ultimate bearing capacity (tons)
f =unit skin friction (lbs./sq. ft.)
As= embedded surface area {sq. ft.)
q =unit point bearing (lbs./sq. ft.)
AP =pile end area (sq. ft.)
FM = average measured unit skin friction obtained from the instrumented test piles (lbs./sq. ft.)
TE =load measured from the in-situ embedded tests (lbs.)
T0 =load measured from the in-situ tip-only tests (lbs.)
CT = adjustment factor for the in-situ tip-only tests (dimensionless)
qt = in-situ measured point bearing (lbs./sq. ft.)
qp = test pile measured point bearing (lbs./sq. ft.)
cp = adjustment factor for point bearing (dimensionless)
IP = plasticity index (%)
50


APPENDIX III
STATIC LOAD TEST DATA
FOR INSTRUMENTED TEST PILES 1 & 2
51

TABLE 111-1.--TEST PILE 1, IMMEDIATE STATIC LOAD TEST
Average Average Average Average Average Load Load Load Load Load
1A & lB*, 2A & 28*, 3A & 38*, 4A & 48*, SA & 58*, in kips in kips in kips in kips in kips
20.6 18.0 11.9 4.3 1.7
34.6 32.5 23.1 10.3 3.5
49.9 48.1 36.5 18.5 5.8
69.4 67.1 54.7 30.2 9.3
83.8 82.4 68.2 41.7 13.7
92.3 89.1 75.3 45.8 18.1
*See Fig. 7 for location of bridges with respect to Ground Surface.
52

TABLE Ili-2 .... -TEST PILE 1, 4-DAY STATIC lOAD TEST
Average Average Average Average Average Load Load Load Load Load
lA & 1B*, 2A & 2B*, 3A & 3B*, 4A & 4B*, SA & SB*, in kips in kips in kips in kips in kips
18.6 17.4 7~0 1.9 0.3
37.0 33.3 14.5 3.7 0.8
55.0 54.0 24.3 6.2 1.2
71.8 67.5 33.3 9.2 2.0
85.5 81.7 43.7 12.1 2.8
101.3 99.6 54.5 16.4 3.6
117.0 117 .o 69.5 21.8 4.4
134.7 131.1 79.2 26.7 5.3
142.0 141.1 85.9 30.3 5.6
149.0 146.3 91.9 32.4 6.2
155.6 154.3 96.8 38.0 7.2
*See Fig. 7 for location of bridges with respect to Ground Surface.
53

TABLE III-3.--TEST PILE 1, 11-DAY STATIC LOAD TEST
Average Average· Average Average Average Load Load Load Load Load
lA & 18*, 2A & 28*, 3A & 38*, 4A & 4B*, SA & 58*, in kips in kips in kips in kips in kips
17.8 16.0 6.3 1.6 0.3
34.3 32.9 14.2 3.7 0.6
50.5 47.3 21.3 5.5 1.5
68.2 64.8 29.7 7.5 1.8
85.8 81.8 37.1 9.8 1.6
102.1 99.4 48.9 15.0 2.9
119.3 117.4 61.2 15.6 2.9
134.4 133.5 70.3 18.7 4.6
142.7 142.2 76.0 20.5 4.8
152.1 151.5 82.6 22.5 5.3
159.7 158.9 87.4 24.3 5.5
167.6 159.3 92.4 25.5 5.7
174.0 173.3 96.8 26.1 6.3
182.8 182.8 102.4 29.4 6.7
189.7 188.2 105.3 31.4 7.3
199.9 196.8 109.2 34.3 8.7
*See Fig. 7 for location of bridges with respect to Ground Surface.
54

TABLE III-4.-~TEST PILE 2, IMMEDIATE STATIC LOAD TEST
Average Average Average Average Average Load Load Load Load Load
lA & lB*, 2A & 28*, 3A & 38*, 4A & 48*, SA & 58*, in kips in kips in kips in kips in kips
18.9 14.7 11.8 8.6 0.9
39.0 34.2 27.3 12.3 2.0
56.6 46.4 42.4 20.3 3.7
76.1 64.8 59.4 32.0 6.9
67.8 72.7 66.7 39.0 8.2
92.4 80.0 74.4 40.0 10.7
100.2 88.0 80.5 48.1 16.2
*See Fig. 8 for location of bridges with respect to Ground Surface.
55
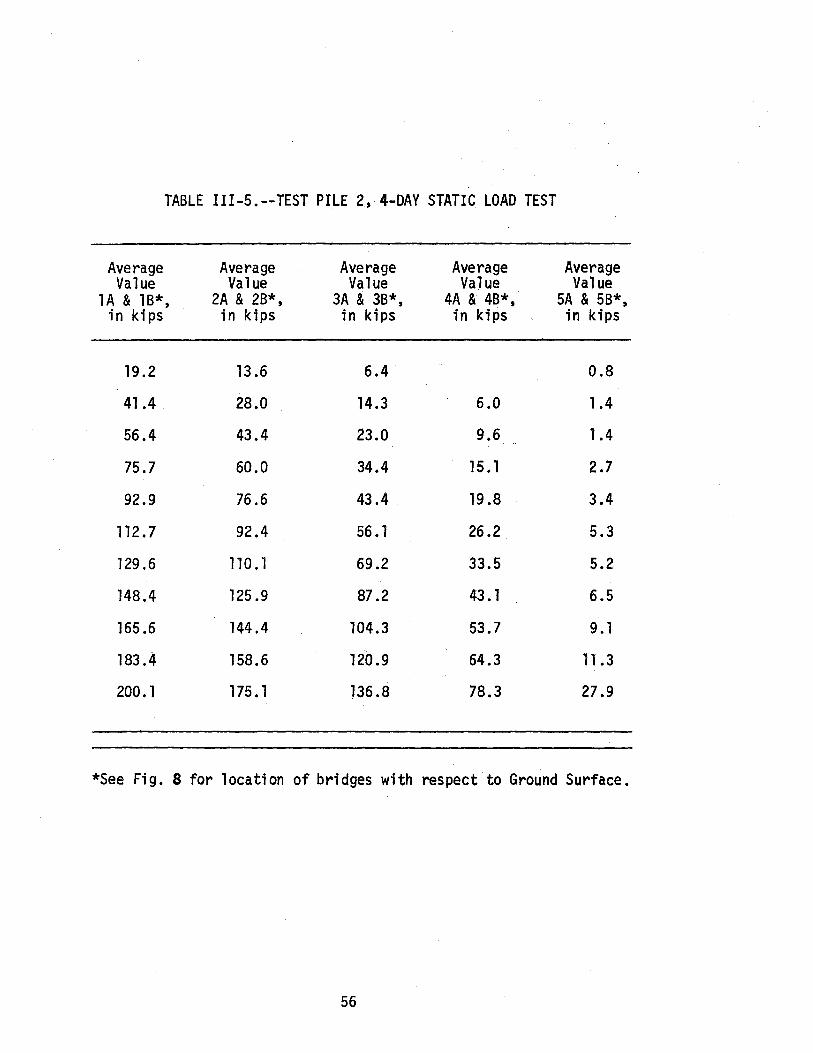
TABLE III-5.--TEST PILE 2, 4-DAY STATIC LOAD TEST
Average Value
lA & lB*, in kips
19.2
41.4
56.4
75.7
92.9
112.7
129.6
148.4
165.6
183.4
200.1
Average Value
2A & 28*, in kips
13.6
28.0
43.4
60.0
76.6
92.4
110.1
125.9
144.4
158.6
175.1
Average Value
3A & 38*, in kips
6.4
14.3
23.0
34.4
43.4
56.1
69.2
87.2
104.3
120.9
136.8
Average Value
4A & 48*, in kips
6.0
9.6
15.1
19.8
26.2
33.5
43.1
53.7
64.3
78.3
Average Value
5A & 58*, in kips
0.8
1.4
1.4
2.7
3.4
5.3
5.2
6.5
9. 1
11.3
27.9
*See Fig. 8 for location of bridges with respect to Ground Surface.
56

TABLE III-6.--TEST PILE 2, ll~DAY STATIC LOAD TEST
Average Load
lA & 18*, in kips
11.97
34.42
55.06
75.26
91.94
111.72
131.39
148.60
167.42
175.76
184.20
193.50
200.88
208.68
217.66
226.53
235.74
242.90
Average Load
2A & 28*, in kips
8.53
25.42
43 .00·
58:68
73.06
90.05
107.48
122.87
140.04
148.46
156.38
164.98
171.89
179.01
187.73
196.18
204.82
212.37
Average Load
3A & 38*, in kips
3.19
11.21
19.89
28.35
36.15
45.71
57.14
67.24
80.10
87.35
93.94
101.53
108.99
117.45
126.79
135.81
145.48
153.28
Average Load
4A & 48*, in kips
1.34
5.13
8.13
12.25
16.03
21.05
26.06
31.18
37.09
41.06
44.50
48.66
52.89
57.58
62.69
67.81
73.94
82.63
Average Load
5A & 58*, in kips
0.12
0.67
1.23
1.91
2.47
3.48
4 .,38
5.05
6.06
6.74
7.41
8.20
8.98
9.88
11 .23
12.92
15.27
20.89
*See Fig. 8 for location of bridges with respect to Ground Surface. 57

APPENDIX IV
LOAD DISTRIBUTION VERSUS DEPTH CURVES
58
~ 1&.1 1&.1
0
10
20
IL 30 I
% ~ Q. 1&.1 0
LOAD (TONS) 10 20 30 40 50 60
10.3 TONS 25 TONS 46.2 TONS
FIGURE llr -I LOAD VS. DEPTH PILE I "IMMEDIATE STATIC LOAD TEST 11
59

1-LIJ
0
10
20
LLI 30 IL.
I l: 1-~ LIJ Q
40
50
70
10 LOAD (TONS)
30 40 50 60 70 80 90
9.6 TONS 42.8 TONS
58.5 TONS
77.8 TONS
FIGURE nz:- 2 LOAD VS. DEPTH PILE I ·"4 DAY ·STATIC LOAD TEST"
60
... 1&1 1&1 .... I
0
10
20
~30 A. 1&1 Q
40
50
70
LOAD (TONS) 20 40 80 80 100 120
34.1 TONS 67.2 83.8 100 TONS TONS TONS
FIGURE :m::-3 LOAD VS. DEPTH PILE 1"11 DAY STATIC LOAD TEST"
61

~ LLI 1&.1 1&.
I
20
:c 40 ~ G. 1&.1 0
60
80
10
I 00
20 LOAD (TONS) 30 40
19.01 TONS 38.05 TONS
FIGURE Dl-4 LOAD VS. DEPTH
50
PILE 2 "IMMEDIATE STATIC LOAD TEST"
62
57

0
10
20
30
~ 1&1 1&1 1&.
1 40 % ~ A. 1&1 Q
eo
6
0
0
0
37.8 TONS·
56.34 TONS
FIGURE lJl- 5 LOAD VS. DEPTH PILE 2 "4 DAY STATIC LOAD TEST"
63

0
20
~ .., .., Ia. 0 I
%40 ... D. .., Q
0 0
60
.. 0 80
20
17.2 TONS
0
0
40
0
0
LOAD (TONS) 60 80 100
0 0
120
FIGURE nz:-6 LOAD VS. DEPTH
140
121.4 TONS
PILE 2 "II DAY STATIC LOAD TEST II
64

APPENDIX V
LOAD-SETTLEMENT CURVES
65
-U)
z
0 •
0 10
0 ... 0 -· 0 c 0 ...1
0 If)
0 N
0
0 0 0 0 - ~ ~ .. q
SETTLE .. ENT ( INCHES)
FIGURE JZ:-1 LOAD VS. SETTLEMENT CURVE PILE I "IMMEDIAT..E STA'TIC LOAD TEST 11
66

-(I)
0 -0 0
0 • 0 •
zo ~,... -Q co o• ...1
0 ID
0 • 0 .,
0
"'
0 -
0
/9---· G)
;· G)
I G)
I e ,; G)
I E>
I e
I e
~ ~ ~ 2 . SETTLEMENT (INCHES)
FIGURE 'll-2 LOAD VS. SETTLEMENT CURVE PILE I 114 DAY STATIC LOAD TEST ai
67
Q c 0 ..J
0 !·
0 N -
0 0 -
0 ~
0 ...
0 N
0 0 0 0 ~ ~ ~
0 . SETTLEMENT (INCHES)
FIGURE :sr~ 3 LOAD VS. SETTLEMENT CURVE PILE I "II DAY STATIC LOAD TEST 11
68
0 ID .
-
0 ,_.
0 CD
0 10
(I)
z oo ~ .. -0 c( 0 ..J
0 If)
0 N
0
0 2 .
I I· I
. ·~e---------e
/& e
~ "l ~ SETTLEMENT ( INCHES)
FIGURE :2:•4 LOAD VS. SETTLEMENT CURVE PILE 2 ''IMMEDIATE STATIC LOAD TEST"
69

-(I)
0 ~
0 0 -0 G)
0 CD
z oo ... .--oo CCD 0 ~
0 .,
0 'lit
0 ., 0 N
0 -
0
-
0 .o 0 ~ ~ ..
· S'ETTL.EME .. T ( INCHES )
FIGURE JZ:- 5 LOAD VS. SETTLEMENT CURVE PILE 2 114. DAY STATIC LOAD TEST"
70
0 ~

-(I)
z
0 ..
0 0
00 t-CD .... 0 cr 0 .J
0 ~
0 ..
0
"'
0
Q
I f)
I e
I Q
"! tfl .. SETTLEMENT ( INCHES )
FIGURE 1l- 6 LOAD VS. SETTLEMENT CURVE PILE 2 11 11 DAY STATIC LOAD TEST"
71


Procedure
APPENDIX VI.--PROCEDURE AND EXAMPLE PROBLEM
FOR ESTIMATING THE BEARING CAPACITY OF A PILE
The following method is recommended for estimating the bearing
capacity of a pile:
(1) Conduct several in-situ tip-only and embedded tests in
each different soil str'.ata.
(2) Take an average value for the tip-only and embedded tests
in each soil strata.
(3) From graphs of Cp and CT versus the plasticity index as
shown in Figs. 13 and 14, and knowing the PI of the soil,
determine the CT and CP values needed.
(4) Compute the unit skin friction, f, for the pile using
equation 2 and the in-situ measurements.
(5) Compute the load carried in each different soil strata
by multiplying the length of the pile in each different
soil strata by the corresponding unit skin friction, f.
(6) Sum up the load carried by the pile in friction.
(7) Determine the unit point bearing, q, of the pile by using
the appropriate tip-only tests and its corresponding CP
value.
(8) Determine the area of the tip of the pile and multiply
this area times the unit point bearing, q, to obtain
the load carried by the tip of the pile.
72
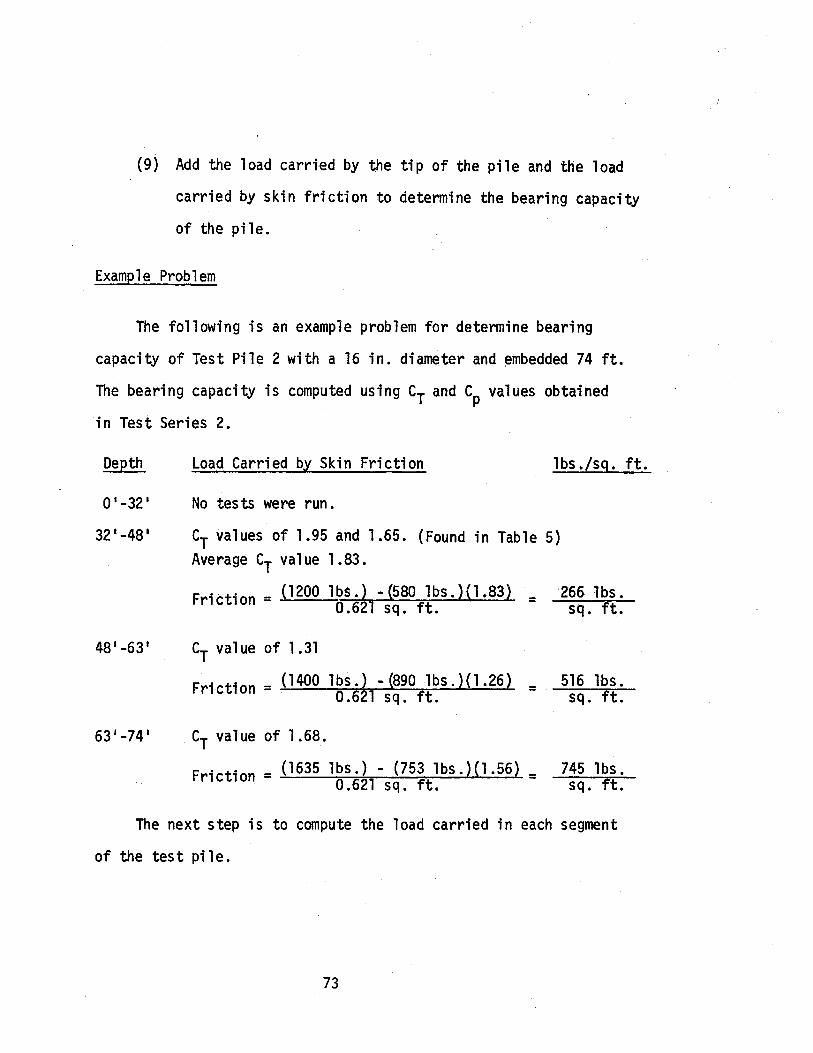
(9) Add the load carried by the tip of the pile and the load
carried by skin friction to determine the bearing capacity
of the pile.
Example Problem
The following is an example problem for determine bearing
capacity of Test Pile 2 with a 16 in. diameter and embedded 74 ft.
The bearing capacity is computed using CT and CP values obtained
in Test Series 2.
Depth
0'-32'
32'-48'
48'-63'
63'-74'
Load Carried by Skin Friction lbs./sq. ft.
No tests were run.
CT values of 1.95 and 1.65. (Found in Table 5) Average CT value 1.83.
Friction= (1200 lbs.) -(580 lbs.){l.83) = 266lbs. 0.621 sq. ft. sq. ft.
CT value of 1.31
Friction= (1400 lbs.) - (890 lbs.)(l.26) = 0.621 sq. ft.
CT value of 1.68.
Friction= (1635 lbs.)- (753 lbs.)(l.56) = 0.621 sq. ft.
516 lbs. sq. ft.
745 lbs. sq. ft.
The next step is to compute the load carried in each segment
of the test pile.
73

Depth Total Load Carried in Each Segment Load
From Load vs. Depth Distribution 01 -32 1 Curve for Pile 2, it was found 12,000 lbs. that the first 32 ft. carried a
load of 12,000 lbs.
32 1 -48 1 266 lbs. X (16 1 )(3.14)( 16 11
) = 15,150 1 bs. sq. ft. 12 11
48 1 -63 1 516 lbs. X . (15 1 )(3.14)( 16 11
) = 32,400 lbs. sq. ft. 12 11
63 1 -74 1 745 1bs. X (11 1 )(3.14)( 16 11
) = 34,400 lbs. sq. ft. 12 11
TOTAL 93,950 lbs.
To find the point bearing, use series 2 test 9 tip-only test
value of 680 lbs. and determine the in-situ unit point bearing, qt.
680 1bs. q = ------------
t = 22,078 1bs.
sq. ft. (3.14)(2·r~~~~ >2
4
Taking the value of 22 ,078 lbs. sq. ft. and dividing this va1u~ by CP=2.37
to obtain a unit point bearing, q for the test pile gives: p
22,078 lbs. sq. ft.
q =-------p 2.37
9330 lbs. = sq. ft.
Now, multiply 9330 flbts. by the area of the tip of the pile, 1.4 sq. sq. •
ft. to obtain the point bearing carried by the test pile.
74

( 9330 lbs. )( · ) q = sq. ft. 1.4 sq. ft. = 13,020 lbs.
Adding the load carried by skin friction and point bearing to give
an estimated bearing capacity, the result is:
93,950 lbs. 13,020 lbs.
106,970 lbs. = 53.485 tons.
The bearing capacity of test pile 2 obtained from the invnediate
static load test data was equal to 50.1 tons. It should be noted
that test pile 2 was loaded until a plunging ~pe failure was
obtai ned.
75