in situ high-pressure study of metal-organic frameworks
TRANSCRIPT
Western University Western University
Scholarship@Western Scholarship@Western
Electronic Thesis and Dissertation Repository
8-20-2015 12:00 AM
In Situ High-Pressure Study of Metal-Organic Frameworks and In Situ High-Pressure Study of Metal-Organic Frameworks and
Their Performance for CO2 Storage Probed by Vibrational Their Performance for CO2 Storage Probed by Vibrational
Spectroscopy Spectroscopy
Yue Hu, The University of Western Ontario
Supervisor: Yining Huang, The University of Western Ontario
Joint Supervisor: Yang Song, The University of Western Ontario
A thesis submitted in partial fulfillment of the requirements for the Doctor of Philosophy degree
in Chemistry
© Yue Hu 2015
Follow this and additional works at: https://ir.lib.uwo.ca/etd
Part of the Inorganic Chemistry Commons, Materials Chemistry Commons, and the Physical
Chemistry Commons
Recommended Citation Recommended Citation Hu, Yue, "In Situ High-Pressure Study of Metal-Organic Frameworks and Their Performance for CO2 Storage Probed by Vibrational Spectroscopy" (2015). Electronic Thesis and Dissertation Repository. 3090. https://ir.lib.uwo.ca/etd/3090
This Dissertation/Thesis is brought to you for free and open access by Scholarship@Western. It has been accepted for inclusion in Electronic Thesis and Dissertation Repository by an authorized administrator of Scholarship@Western. For more information, please contact [email protected].
IN SITU HIGH-PRESSURE STUDY OF METAL-ORGANIC FRAMEWORKS AND THEIR PERFORMANCE FOR CO2 STORAGE PROBED BY VIBRATIONAL
SPECTROSCOPY
(Thesis format: Integrated Article)
by
Yue Hu
Graduate Program in Chemistry
A thesis submitted in partial fulfillment of the requirements for the degree of
Doctor of Philosophy
The School of Graduate and Postdoctoral Studies The University of Western Ontario
London, Ontario, Canada
© Yue Hu 2015
ii
Abstract
Metal-organic frameworks (MOFs) are an important class of porous materials, owing
to their potential applications in a variety of areas, including gas storage, molecular separations,
catalysis, sensors and so on. Most importantly, their large surface areas, tunable pore properties
and potential for industrial scale production have made MOFs a promising material for clean
energy applications, such as CO2 storage. The chemical and mechanical stabilities of MOFs
play a crucial role in their CO2 storage performance, which require extreme loading pressures
that are far beyond ambient pressure at times. Application of high external pressure (e.g., in
gigapascal range) on MOFs can significantly alter the framework structure, pore opening and
consequently the adsorption properties. This Ph.D. work focuses on the investigation of high-
pressure effects on the structure and CO2 adsorptive performance of MOFs. In situ vibrational
spectroscopy was used as a primary characterization method, which allows the understanding
of local structures, chemical bonding, and thus the nature of guest-host interactions between
the adsorbed molecules and the framework.
Four types of MOFs with different topologies, structures and porosities have been
studied under high pressures. First, we showed that ZIF-8 (ZIF = zeolitic imidazolate
frameworks), a MOF with small pore size, exhibited an unusual chemical stability under
extreme compression. Structural modifications were found to be reversible in a low-pressure
region, but irreversible in a high-pressure region. The IR profile of CO2 loaded ZIF-8 on
compression provided direct evidence of the strong interactions between CO2 and ZIF-8,
indicating enhanced CO2 storage in the framework. The flexibility of the organic linker played
an important role in the CO2 adsorption of ZIF-8. MIL-68(In) (MIL = Matériaux de
l'Institut Lavoisier) features two types of channels with distinct pore sizes and was the next
iii
MOF studied. The pressure-induced structural modifications in MIL-68(In) were found to be
reversible for the as-made framework but irreversible for the activated framework. When
loaded with CO2, the framework exhibited interesting differential binding affinities with CO2
at different pressures via the hexagonal and triangular pores. The pressure enhanced CO2
storage behavior and the guest-host interaction mechanism between CO2 and MIL-68(In) were
explored with the aid of Monte Carlo simulations. Following this, the performance of α-
magnesium formate [α-Mg3(HCOO)6], a representative lightweight Mg-based MOF for CO2
adsorption under high pressure, was investigated. Highly ordered CO2 molecules were found
to be aligned within the pores of α-Mg3(HCOO)6 due to the strong pressure-induced
interactions with the formate ligand. Furthermore, a highly robust calcium-based MOF named
CaSDB (SDB = 4, 4′-sulfonyldibenzoate) demonstrated high affinity towards CO2 at high
pressures. Additional adsorption sites were found at elevated pressures, including an
interaction site on the metal center. A CO2 adsorption-driven phase transition was also
observed for the framework upon compression. This work demonstrates great potential for
MOF-based greenhouse gas storage applications.
Keywords
Metal-organic frameworks, high pressure, diamond anvil cell, vibrational spectroscopy, infra-
red spectroscopy, Raman spectroscopy, framework stability, reversibility, CO2 storage, CO2
adsorption site, guest-host interaction, pressure-induced phase transition, amorphization.
iv
Co-Authorship Statement
The following thesis contains materials from previously published manuscripts
authored by Yue Hu and co-authored or edited by others mentioned below. Dr. Yining Huang
and Dr. Yang Song were the corresponding authors on all the presented papers and were
responsible for the supervision of Yue Hu over the course of his Ph.D. study. Both of them
played a major role in the editing and revision of the materials presented in all chapters. For
copyright releases see the Appendix.
Chapter 2 is from the published communication authored by Yue Hu, Hossein
Kazemian, Sohrab Rohani, Yining Huang and Yang Song (Chemical Communications, 2011,
47, 12694). The majority of Chapter 3 is from the publication authored by Yue Hu, Zhenxian
Liu, Jun Xu, Yining Huang and Yang Song (Journal of the American Chemical Society 2013,
135, 9287).
The ZIF-8 samples used in Chapters 2 and 3 were supplied by Dr. Hossein Kazemian
in Prof. Sohrab Rohani’s group in the Department of Chemical and Biochemical Engineering.
The samples of MIL-68 (In) in Chapter 4, α-Mg3(HCOO)6 in Chapter 5 and CaSDB in Chapter
6 were synthesized by Peng He, Yuanjun Lu and Shoushun Chen in Dr. Huang’s group,
respectively.
Yue Hu is responsible for a majority of the sample preparation in diamond anvil cell
and data collection. All the mid-IR and Raman measurements were performed by Yue Hu in
Dr. Song’s lab, with the exception of the CO2 loading with α-Mg3(HCOO)6 and their mid-IR
measurements, which were completed by undergraduate student Ruilin Liang under the
v
supervision of Yue Hu. The far-IR data were collected by Yue Hu at National Synchrotron
Light Source (NSLS) with the help of beamline scientist Dr. Zhenxian Liu.
All data analysis was done by Yue Hu except for the Grand Canonical Monte Carlo
simulations in Chapter 4, which was performed by Bin Lin in Dr. Youyong Li’s group at
Soochow University.

vi
To my loving family
vii
Acknowledgments
First and foremost, I would like to thank my two advisors, Dr. Yining Huang and Dr.
Yang Song, for their patient guidance, inspiring advice and constant encouragement, without
which the finish of my Ph.D. study would not have been possible. I am truly grateful to study
and work under the supervision of two tremendous mentors who embody the valuable qualities
of scientists: curiosity, enthusiasm, patience and dedication to work. Their strong work ethic
will always inspire and impact me for the rest of my life.
I would also like to thank the members of my thesis examination board: Dr. Zhifeng
Ding, Dr. François Lagugné-Labarthet, Dr. Paul Charpentier (Department of Chemical &
Biomedical Engineering) and Dr. Tomislav Friščić (McGill Univeristy) for their time. I would
like to acknowledge Dr. Nicholas Payne, Dr T. K. Sham, Dr. Lyudmila Goncharova and Dr.
Xueliang Sun for their excellent graduate courses. In addition, I appreciate all the input from
my collaborators and synchrotron beamline scientists: Dr. Hossein Kazemian, Dr. Sohrab
Rohani, Dr. Youyong Li (Soochow University) and Dr. Zhenxian Liu (NSLS). Their help and
technical support have been much needed for the fulfilment of my degree.
It has been a privilege to work with my past and present colleagues in both Dr. Huang
and Song’s lab: Dr. Jun Xu, Dr. Lu Zhang, Dr. Margaret Hanson, Tetyana Levchenko, Adam
Macintosh, Donghan Chen, Zheng (Sonia) Lin, Le Xu, Peng He, Maxwell Goldman, Dr. Wei
Wang, Dr. Haiyan Mao, Dr. Farhana Gul-E-Noor, Balsam Ibrahim, Regina Sinelnikov, Dr.
Bryan Lucier, Yuanjun Lu, Shoushun Chen, Yue Zhang, Xuzhao Zhao, Scott Truman, Dr.
Zhaohui Dong, Ang Liu, Kamila Bladek, Dr. Vinod Panchal, Ankang Zhao, Liang Zhou,
Zhihao Yu, Ruilin Liang, Shan Jiang, Jiwen Guan, Fengping Xiao and Nilesh Shinde. I
appreciate their friendly help, which makes my research smooth and life in the lab joyful.

viii
Besides, the staff of the department are acknowledged: Darlene McDonald, Clara Fernandes,
Anna Vandendries-Barr, Barakat Misk, John Vanstone, Jon Aukema and Monica Chirigel. I
would also like to extend my gratitude to all my friends at Western: Xiaoxuan Guo, Yu Sun,
Linda Wu, Zhiqiang Wang, Ruiping Ge, Lijia Liu, Jing Chao, Jia Jia, Jing Zhang, Ting Li,
Ming Huang, Yiyi Liu, Fuyan Zhao, Dong Zhao, Jian Chen, Jiacheng Guo, Jun Li, Bo Fan,
Nazhen Liu, Renjie Hou, Xiaoxiao Wang, Jinqiang Hou, Dan Guo and Kyle Jeffs.
Most importantly, I would like to thank my beloved parents for their love,
encouragement and unconditional support during my graduate studies. My girlfriend Ziqing
Ye deserves a special thanks for always sharing my troubles as well as joys, and going through
everything together with me. Without her love and understanding, it would have been not
possible to finish my Ph.D. program.
ix
Table of Contents
Abstract ............................................................................................................................... ii
Co-Authorship Statement................................................................................................... iv
Acknowledgments............................................................................................................. vii
Table of Contents ............................................................................................................... ix
List of Tables ................................................................................................................... xiii
List of Figures ................................................................................................................... xv
List of Abbreviations ....................................................................................................... xxi
Chapter 1 ............................................................................................................................. 1
1 Introduction .................................................................................................................... 1
1.1 Metal-organic frameworks ...................................................................................... 1
1.1.1 Structures of metal-organic frameworks ............................................................... 1
1.1.2 CO2 storage in metal-organic frameworks ............................................................ 2
1.2 High-pressure science and technology .................................................................... 8
1.2.1 High-pressure phenomena ..................................................................................... 8
1.2.2 Diamond anvil cell ................................................................................................ 9
1.2.3 In situ high-pressure characterizations ................................................................ 12
1.2.4 IR and Raman spectra of CO2 at high pressures ................................................. 16
1.3 High-pressure effects on MOFs ............................................................................ 18
1.3.1 Unusual elastic responses .................................................................................... 19
1.3.2 Phase transitions .................................................................................................. 21
1.3.3 Chemical reactions .............................................................................................. 23
1.3.4 High-pressure guest insertion .............................................................................. 24
1.4 Outline of the thesis .............................................................................................. 26
1.5 Reference .............................................................................................................. 27
x
Chapter 2 ........................................................................................................................... 34
2 In Situ High Pressure Study of ZIF-8 by IR Spectroscopy .......................................... 34
2.1 Introduction ........................................................................................................... 34
2.2 Experimental section ............................................................................................. 36
2.3 Results ................................................................................................................... 37
2.3.1 IR spectra of ZIF-8 upon compression to 39 GPa............................................... 37
2.3.2 IR spectra of ZIF-8 upon compression to 1.6 GPa.............................................. 40
2.4 Discussion ............................................................................................................. 40
2.5 Conclusions ........................................................................................................... 43
2.6 References ............................................................................................................. 44
Chapter 3 ........................................................................................................................... 46
3 Evidence of Pressure Enhanced CO2 Storage in ZIF-8 Probed by FTIR Spectroscopy
...................................................................................................................................... 46
3.1 Introduction ........................................................................................................... 46
3.2 Experimental section ............................................................................................. 47
3.3 Results ................................................................................................................... 48
3.3.1 IR spectrum of ZIF-8 loaded with CO2 at 0.78 GPa ........................................... 48
3.3.2 IR spectra of ZIF-8 loaded with CO2 upon compression and decompression .... 52
3.4 Discussion ............................................................................................................. 54
3.5 Conclusions ........................................................................................................... 61
3.6 References ............................................................................................................. 61
Chapter 4 ........................................................................................................................... 63
4 The Structural Stability of and Enhanced CO2 Storage in MOF MIL-68(In) under High
Pressures Probed by FTIR Spectroscopy ..................................................................... 63
4.1 Introduction ........................................................................................................... 63
4.2 Experimental section ............................................................................................. 66
4.3 Results ................................................................................................................... 68
xi
4.3.1 IR spectra of as-made and activated MIL-68(In) at ambient pressure ................ 68
4.3.2 IR spectra of as-made MIL-68(In) upon compression ........................................ 72
4.3.3 IR spectra of activated MIL-68(In) upon compression ....................................... 77
4.3.4 IR spectra of activated MIL-68(In) with PTM upon compression ..................... 82
4.3.5 IR spectra of activated MIL-68(In) loaded with CO2 upon compression ........... 87
4.4 Discussion ............................................................................................................. 93
4.5 Conclusions ........................................................................................................... 98
4.6 Reference............................................................................................................... 99
Chapter 5 ......................................................................................................................... 103
5 High Pressure Study of CO2 Adsorption in MOF α-Mg3(HCOO)6 by Vibrational
Spectroscopy .............................................................................................................. 103
5.1 Introduction ......................................................................................................... 103
5.2 Experimental section ........................................................................................... 105
5.3 Results ................................................................................................................. 106
5.3.1 IR and Raman spectra of α-Mg3(HCOO)6 loaded with CO2 ............................. 106
5.3.2 Mid-IR spectra of α-Mg3(HCOO)6 loaded with CO2 at high pressures ............ 109
5.3.3 Raman and far-IR spectra of α-Mg3(HCOO)6 loaded with CO2 at high pressures
............................................................................................................................. 112
5.4 Discussion ........................................................................................................... 116
5.5 Conclusions ......................................................................................................... 124
5.6 Reference............................................................................................................. 124
Chapter 6 ......................................................................................................................... 127
6 Exploring the Remarkable Affinity of MOF CaSDB towards CO2 at Extreme Pressure
.................................................................................................................................... 127
6.1 Introduction ......................................................................................................... 127
6.2 Experimental section ........................................................................................... 130
6.3 Results ................................................................................................................. 131
xii
6.3.1 IR and Raman spectra of activated CaSDB at ambient pressure ...................... 131
6.3.2 IR and Raman spectra of activated CaSDB at high pressures .......................... 133
6.3.3 IR spectra of CaSDB loaded with CO2 at 0.39 GPa ......................................... 139
6.3.4 IR and Raman spectra of CaSDB loaded with CO2 at high pressures .............. 141
6.4 Discussion ........................................................................................................... 150
6.5 Conclusions ......................................................................................................... 155
6.6 Reference............................................................................................................. 155
Chapter 7 ......................................................................................................................... 159
7 Summary and Future Work ........................................................................................ 159
7.1 Summary ............................................................................................................. 159
7.2 Suggestions for future work ................................................................................ 161
Appendices: Copyright Permission................................................................................. 162
Curriculum Vitae ............................................................................................................ 164
xiii
List of Tables
Table 2-1. Pressure dependence (dν/dP, cm-1/GPa) of IR modes of ZIF-8 on compression .. 42
Table 3-1. Pressure dependence (dν/dP, cm-1/GPa) of IR modes of CO2 loaded ZIF-8 from 0
to 2.65 GPa.............................................................................................................................. 60
Table 4-1. Assignments for selected IR modes (cm-1) of MIL-68(In) at ambient pressure .... 71
Table 4-2. Pressure dependence (dν/dP, cm-1·GPa-1) of IR modes of as-made MIL-68(In)
from 0 to 9 GPa ....................................................................................................................... 76
Table 4-3. Pressure dependence (dν/dP, cm-1·GPa-1) of IR modes of activated MIL-68(In)
from 0 to 9 GPa ....................................................................................................................... 81
Table 4-4. Pressure dependence (dν/dP, cm-1·GPa-1) of IR modes of activated MIL-68(In)
with PTM from 0 to 18 GPa. .................................................................................................. 86
Table 4-5. Pressure dependence (dν/dP, cm-1·GPa-1) of the combination modes of CO2 and
the OH stretch mode of MIL-68(In) from 0.42 to 1.88 GPa................................................... 92
Table 5-1. Pressure dependences [dν/dP (cm-1∙GPa-1)] of the selected IR bands of α-
Mg3(HCOO)6 loaded with CO2 on compression .................................................................. 118
Table 5-2. Pressure dependences [dν/dP (cm-1∙GPa-1)] of the selected Raman bands of α-
Mg3(HCOO)6 loaded with CO2 on compression .................................................................. 119
Table 6-1. Pressure dependence (dν/dP, cm-1·GPa-1) of selected IR modes of CaSDB from
ambient to 11 GPa. ................................................................................................................ 138
Table 6-2. Pressure dependence (dν/dP, cm-1·GPa-1) of selected Raman modes of CaSDB
from ambient to 11 GPa ........................................................................................................ 138
Table 6-3. Pressure dependence (dν/dP, cm-1·GPa-1) of selected IR modes of CaSDB loaded
with CO2 from 0.24 to 13.6 GPa. .......................................................................................... 147

xiv
Table 6-4. Pressure dependence (dν/dP, cm-1∙ GPa-1) of selected Raman modes of CaSDB
loaded with CO2 from 0.24 to 13.6 GPa. .............................................................................. 149
xv
List of Figures
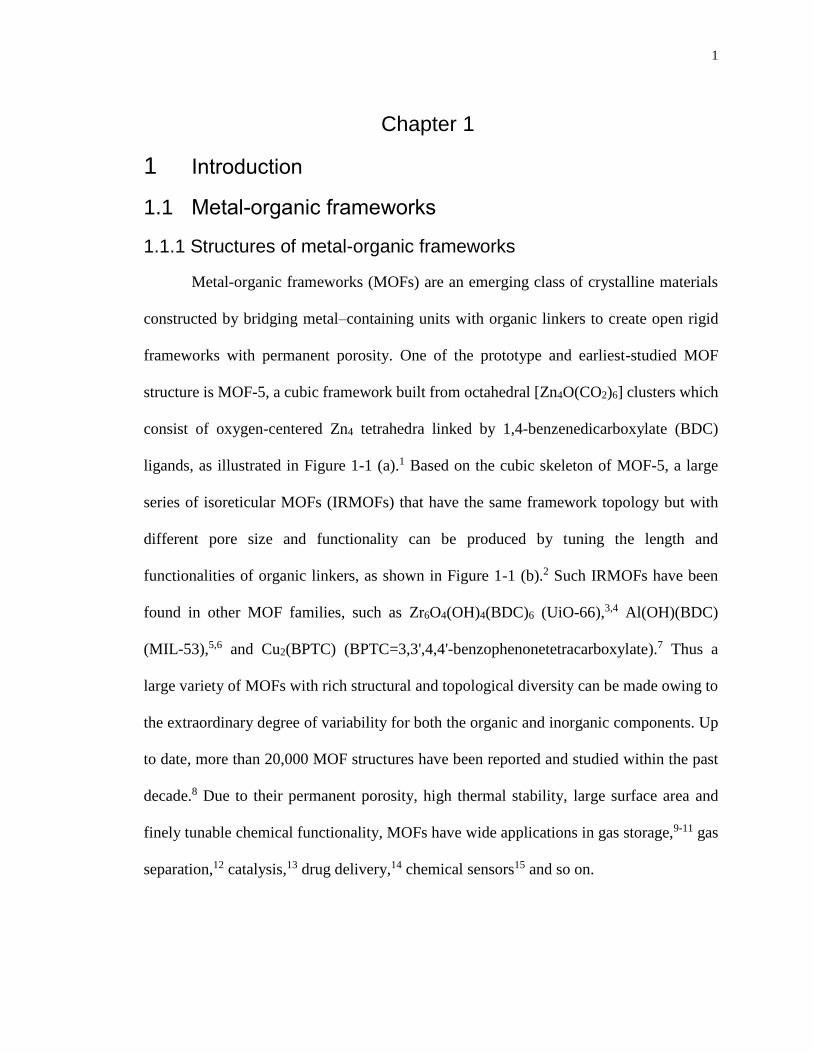
Figure 1-1. (a) The building units and structure of MOF-5; (b) Isoreticular MOFs of MOF-5.
(ref. 1, 2) ................................................................................................................................... 2
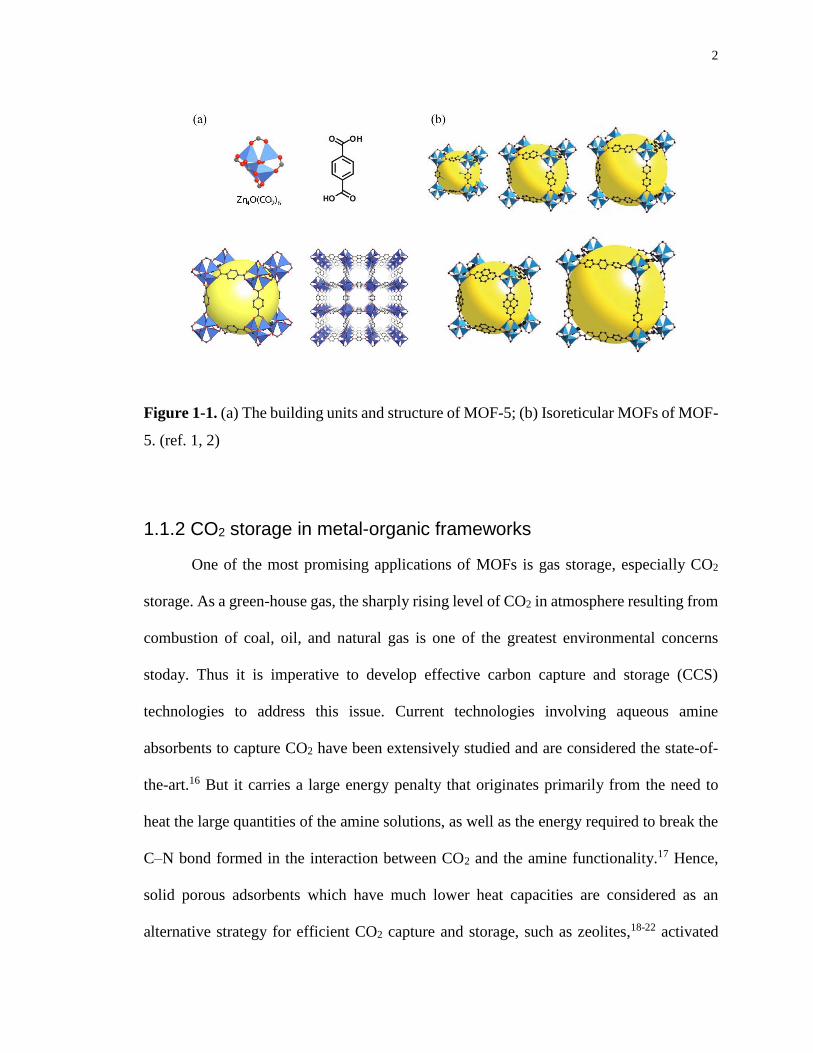
Figure 1-2. The crystal structure of MOF-177 and comparison of the gravimetric and
volumetric CO2 capacity for several MOFs and other porous materials. (ref. 31) ................... 4
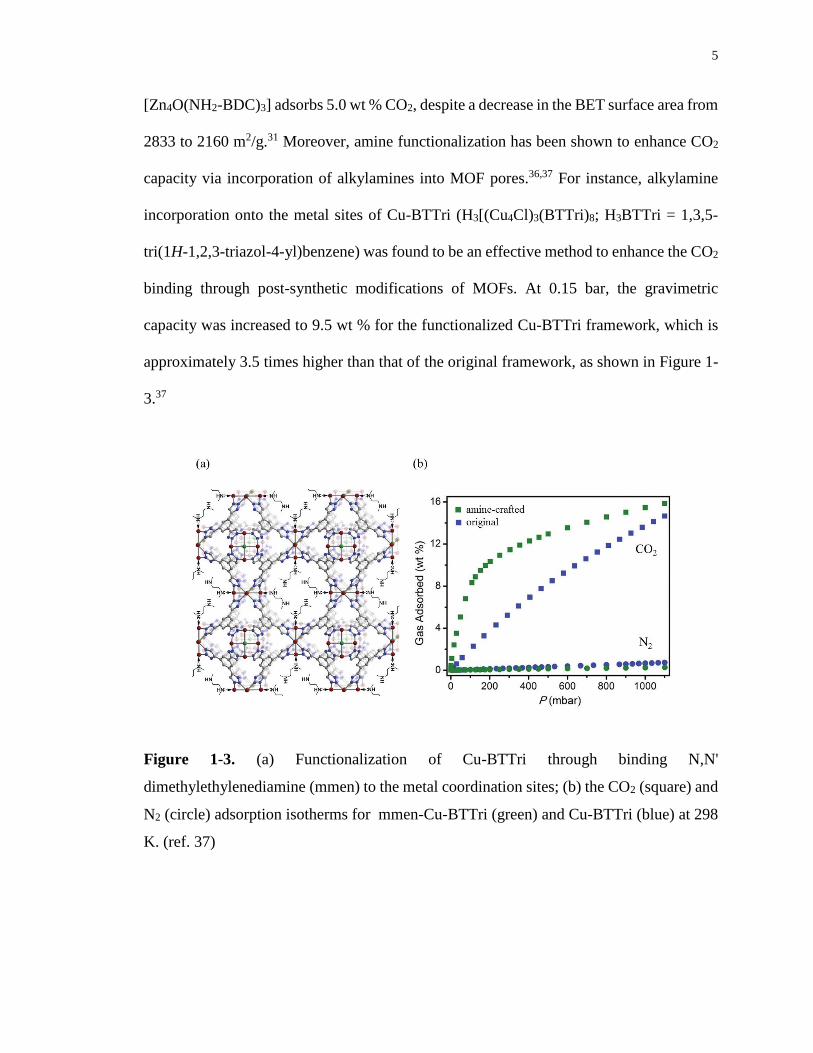
Figure 1-3. (a) Functionalization of Cu-BTTri through binding N,N'
dimethylethylenediamine (mmen) to the metal coordination sites; (b) the CO2 (square) and
N2 (circle) adsorption isotherms for mmen-Cu-BTTri (green) and Cu-BTTri (blue) at 298 K.
(ref. 37) ..................................................................................................................................... 5
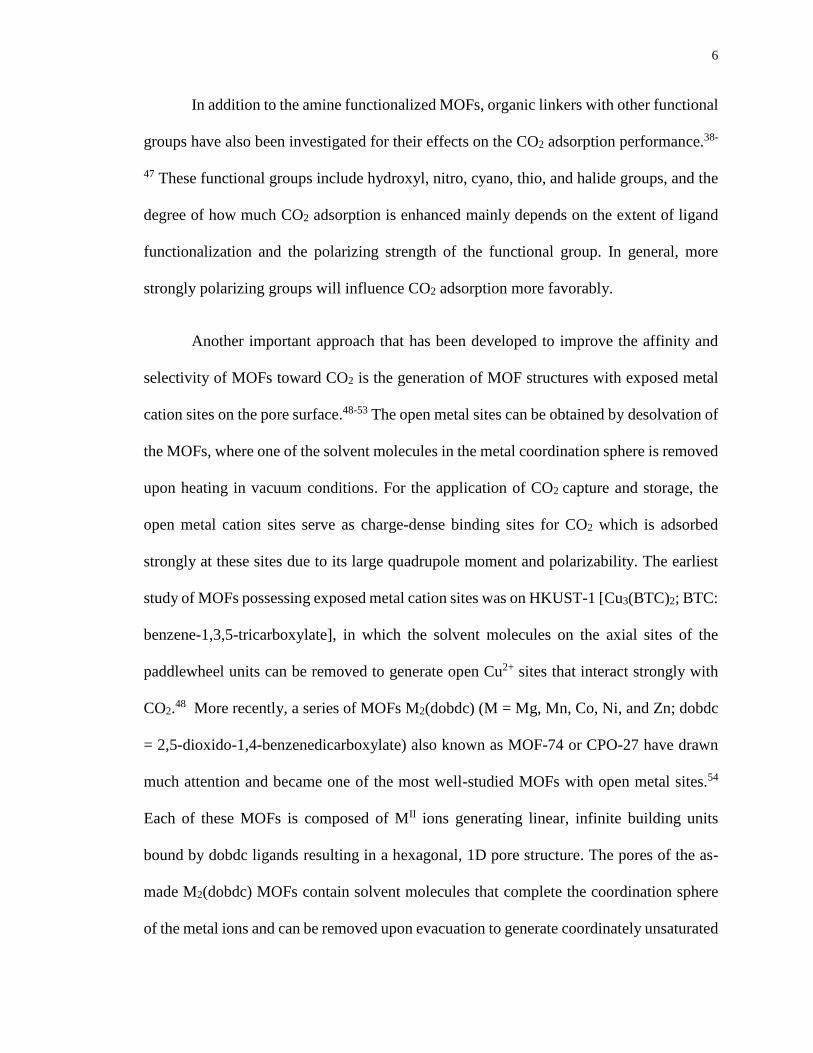
Figure 1-4. (a) View of 1D channel of the structure of MOF M2(dobdc) adsorbed with CO2;
(b) CO2 sorption isotherm (296 K, 0 to 1 atm) of the MOF M2(dobdc) series. (ref. 54) .......... 7
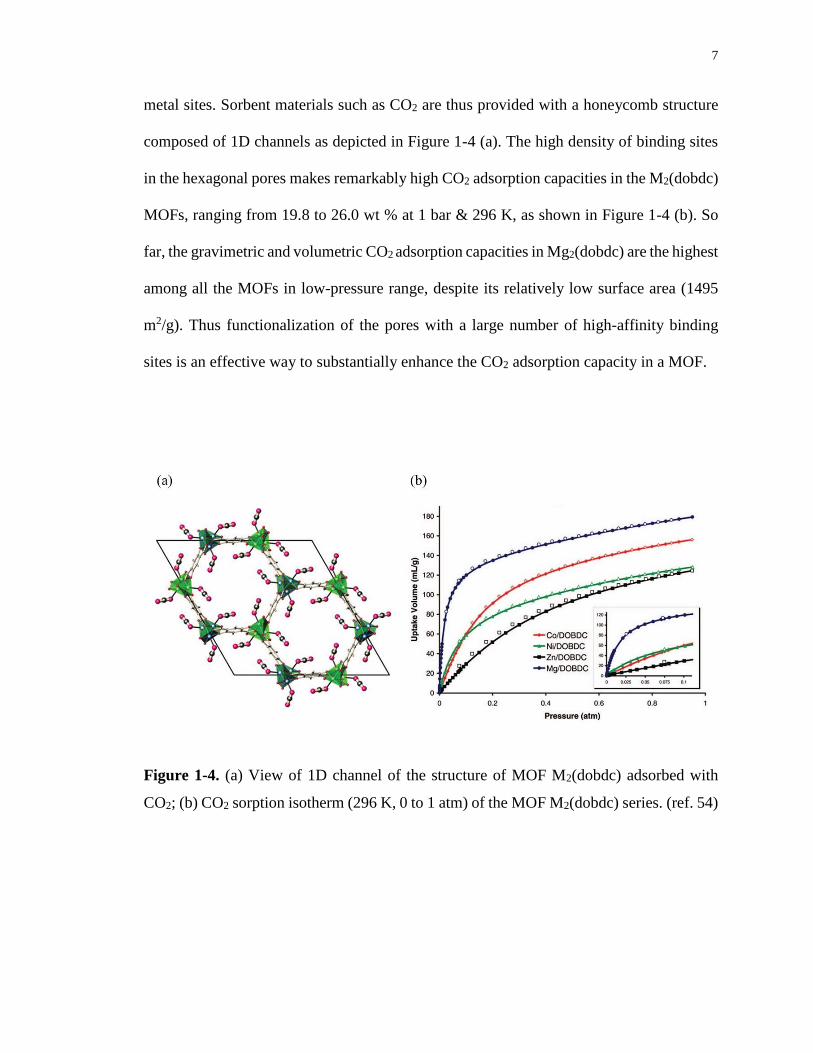
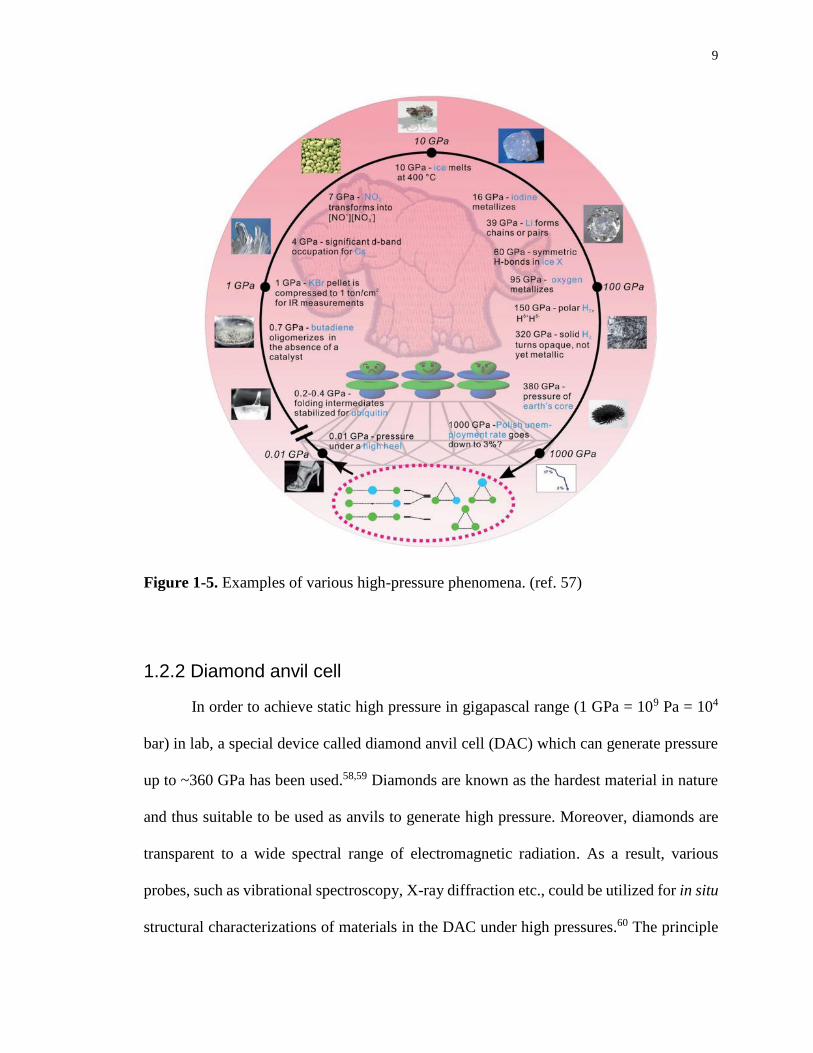
Figure 1-5. Examples of various high-pressure phenomena. (ref. 57)...................................... 9
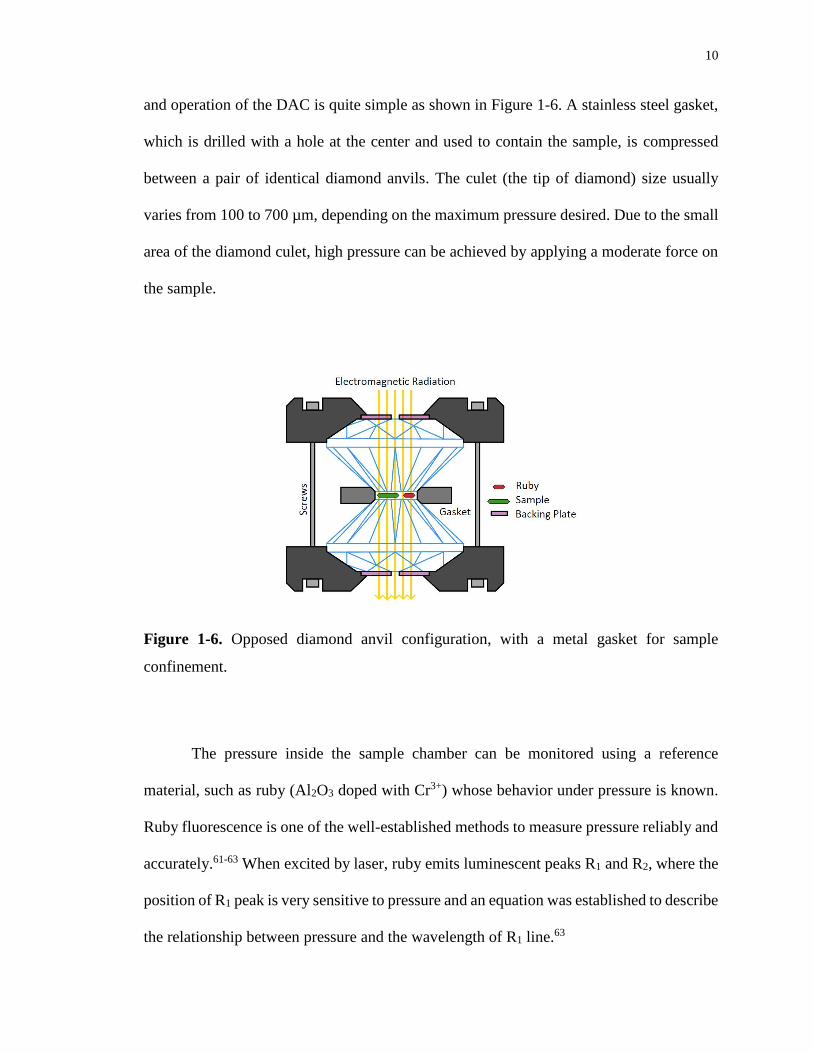
Figure 1-6. Opposed diamond anvil configuration, with a metal gasket for sample
confinement............................................................................................................................. 10
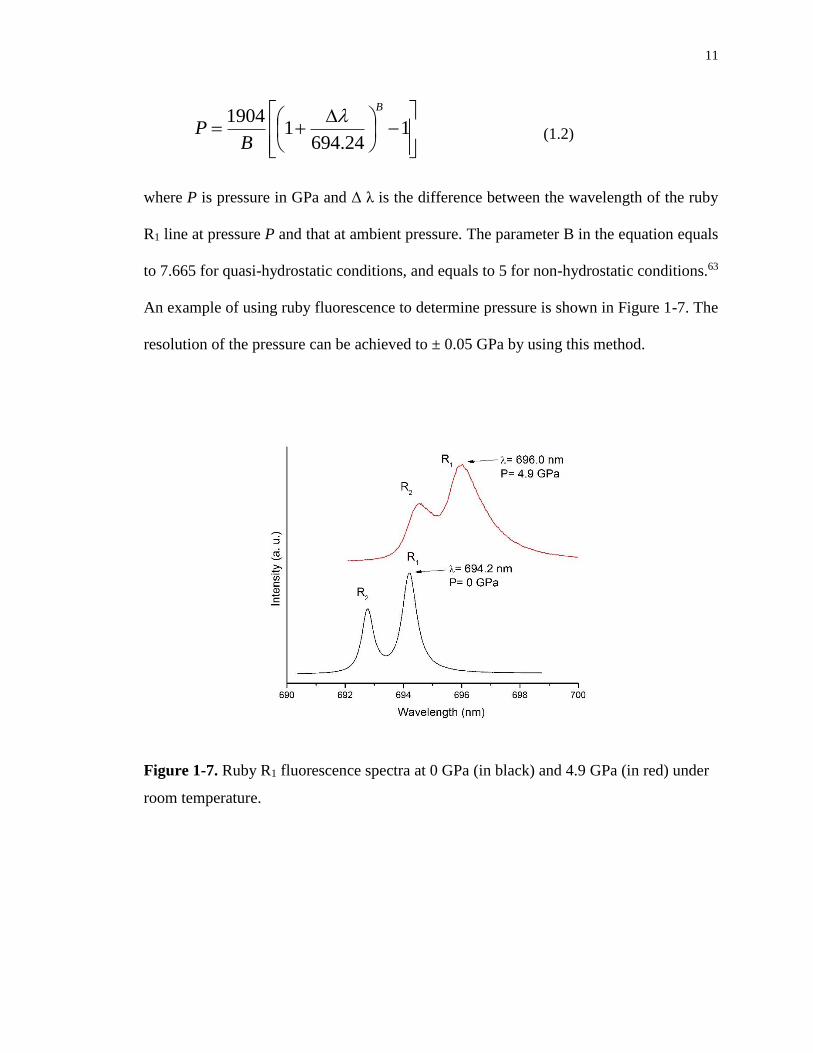
Figure 1-7. Ruby R1 fluorescence spectra at 0 GPa (in black) and 4.9 GPa (in red) under
room temperature. ................................................................................................................... 11
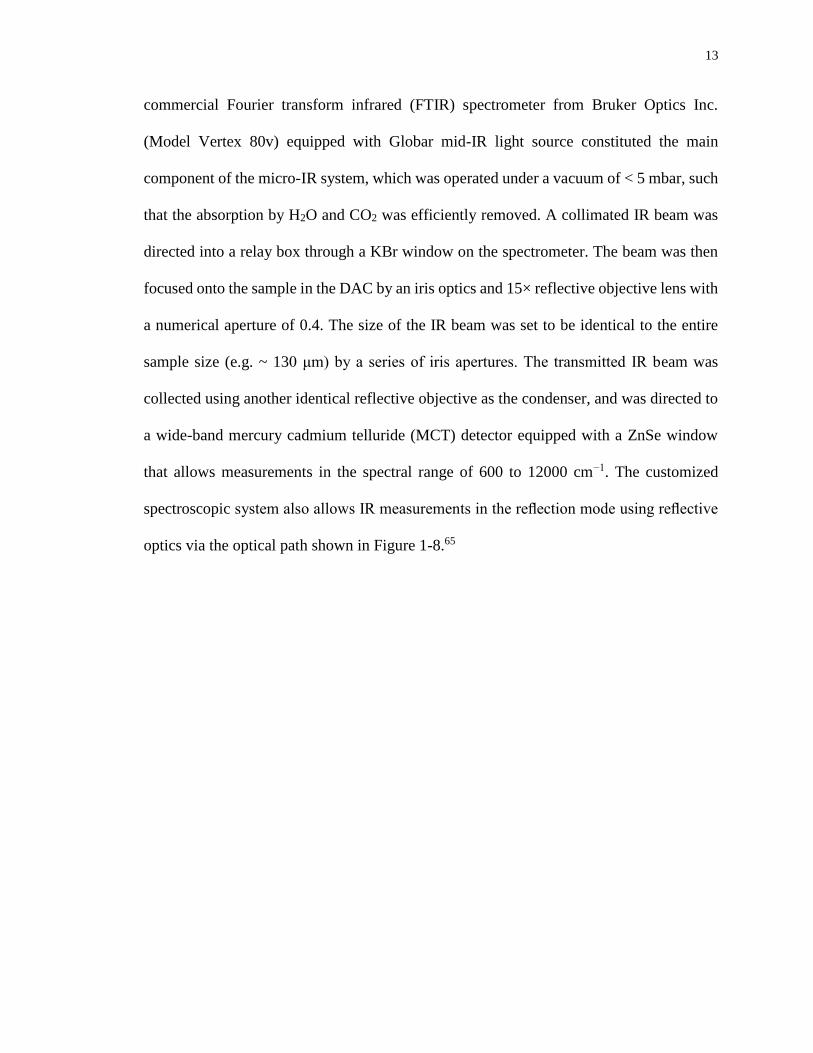
Figure 1-8. Schematic diagram of the IR micro-spectroscopy system, with major optical
components labeled. (ref. 65) .................................................................................................. 14
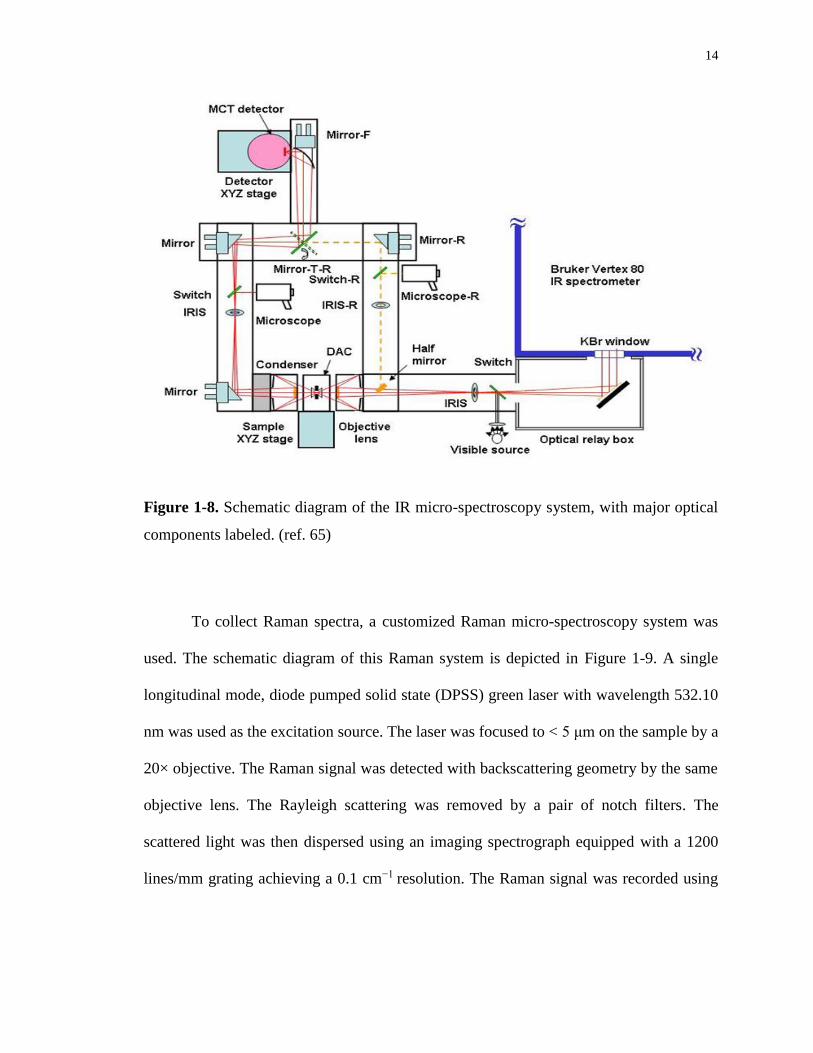
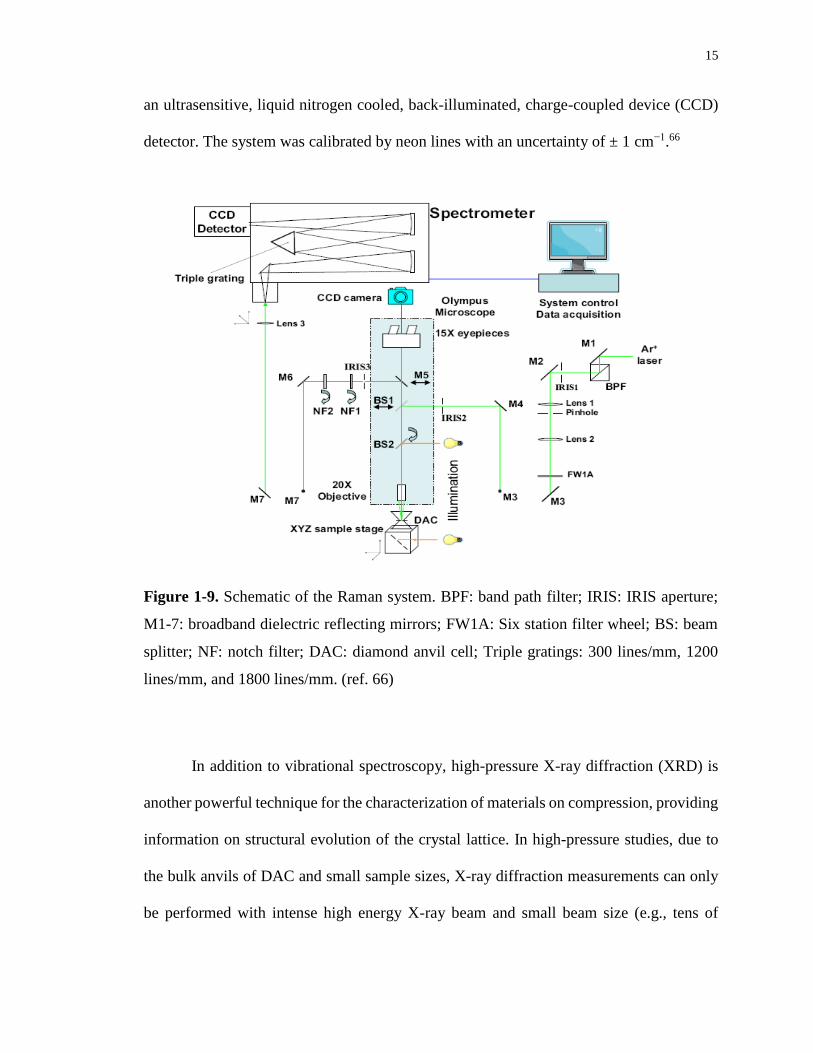
Figure 1-9. Schematic of the Raman system. BPF: band path filter; IRIS: IRIS aperture; M1-
7: broadband dielectric reflecting mirrors; FW1A: Six station filter wheel; BS: beam splitter;
NF: notch filter; DAC: diamond anvil cell; Triple gratings: 300 lines/mm, 1200 lines/mm,
and 1800 lines/mm. (ref. 66) ................................................................................................... 15
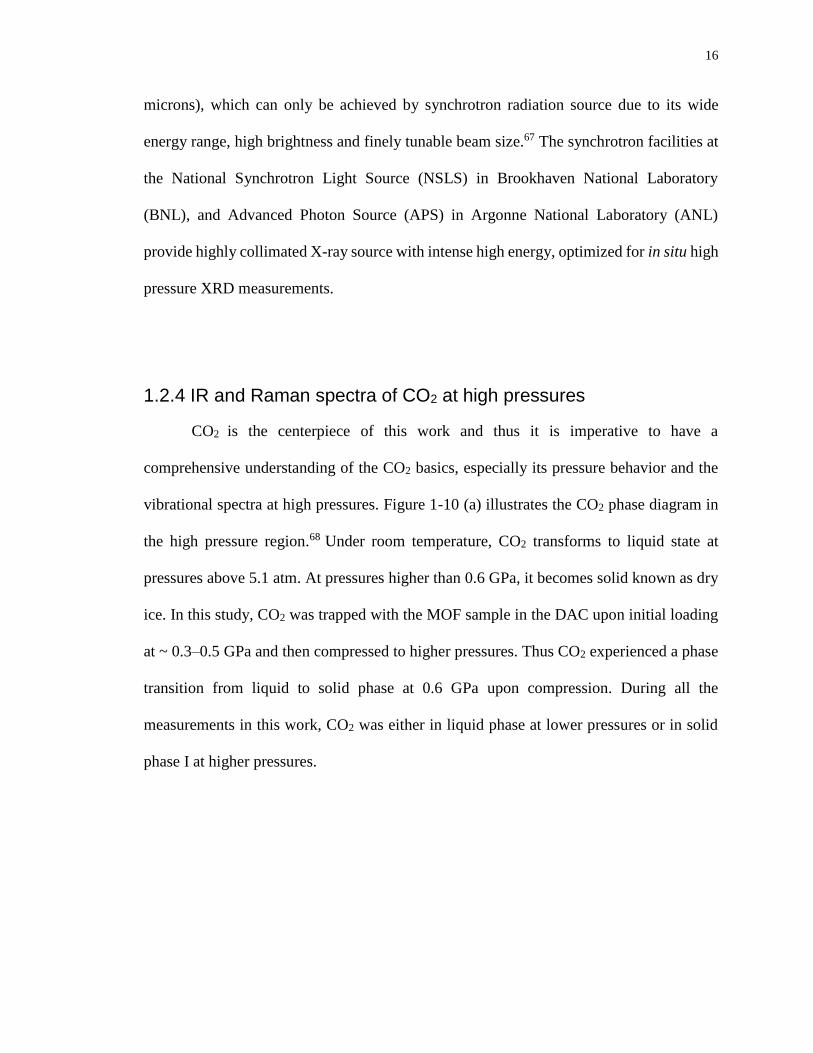
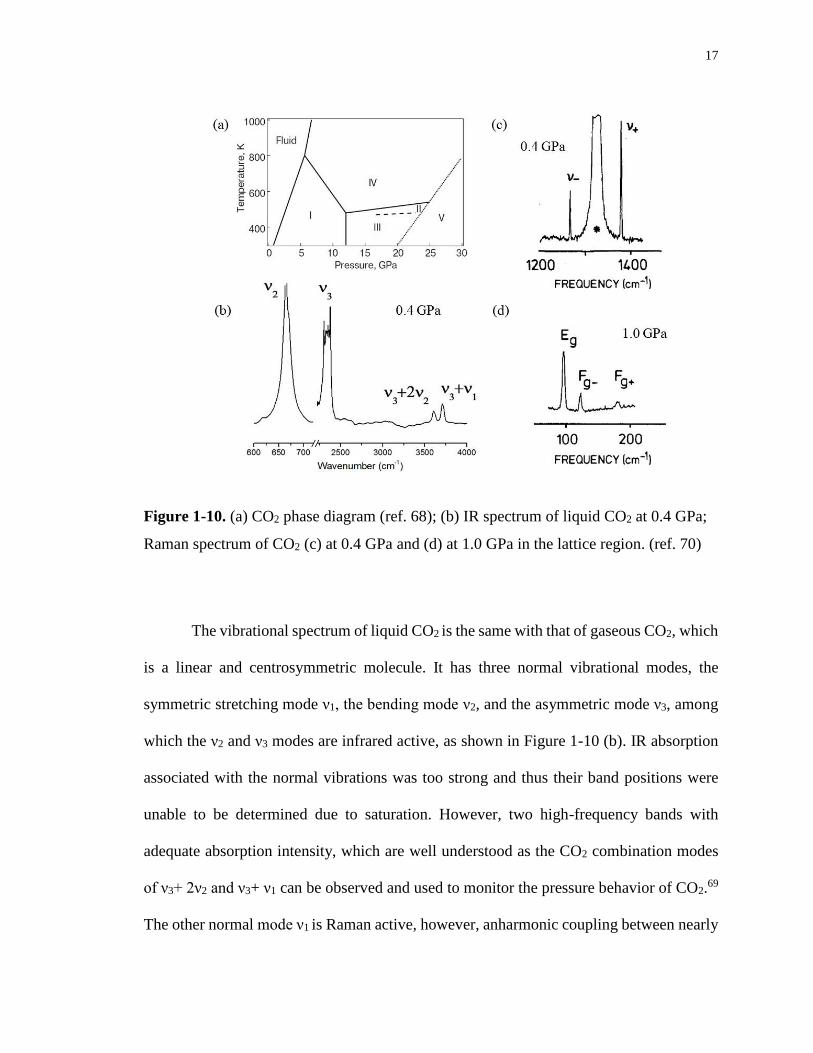
Figure 1-10. (a) CO2 phase diagram (ref. 68); (b) IR spectrum of liquid CO2 at 0.4 GPa;
Raman spectrum of CO2 (c) at 0.4 GPa and (d) at 1.0 GPa in the lattice region. (ref. 70) ..... 17
xvi
Figure 1-11. Evolution of the cell volume (top) and lattice parameters (bottom) of MIL-
53(Al) with increasing pressure. (ref. 83) ............................................................................... 20
Figure 1-12. Phase transitions of Zn(CN)2 upon compression in different fluid media. (ref.
91) ........................................................................................................................................... 22
Figure 1-13. Pressure-induced proton jump in ZAG-4 and ZAG-6. (ref. 98) ........................ 24
Figure 1-14. (a) Unit cell volume of Sc2BDC3 in methanol and Fluorinert as a function of
pressure; (b) pressure-induced methanol insertion in Sc2BDC3. (ref. 105) ............................ 26
Figure 2-1. Crystal structure of ZIF-8 viewed along the c-axis. The pink polyhedrons denote
the ZnN4 units. The yellow sphere indicates the space in the cage. ....................................... 35
Figure 2-2. Selected IR spectra of ZIF-8 on compression to a highest pressure of 39.15 GPa
and as recovered (a), and to another highest pressure of 1.60 GPa and as recovered (b) ....... 38
Figure 2-3. Pressure dependence of selected IR modes of ZIF-8 on compression in the
pressure region of 0–1.6 GPa and 2–14 GPa. ......................................................................... 41
Figure 3-1. (a) IR spectrum of ZIF-8 loaded with CO2 (middle) compared with that of pure
CO2 (top) and that of pure ZIF-8 (bottom) at similar pressures. The inset shows the zoomed
spectral region for the combination modes of ZIF-8 loaded with CO2 (top) and pure CO2
(bottom). (b) Photograph of ZIF-8 loaded with CO2 taken under an optical microscope. The
arrows indicate the positions of the C=C stretching mode of the imidazole ring. .................. 49
Figure 3-2. (a) IR spectra of pure CO2 in the spectral region of the combination modes
collected on compression. (b) Frequency plots of ν3 + ν1 mode of CO2 as a function of
pressure. .................................................................................................................................. 52
Figure 3-3. IR spectra of ZIF-8 loaded with CO2 in the spectral region of the combination
modes collected on compression (a) and decompression (b) at room temperature. ............... 53
Figure 3-4. Far-IR spectra of ZIF-8 upon compression to 2.61 GPa and decompression to
ambient pressure. The bands at 420 and 290 cm-1 can be attributed as Zn-N stretching and
xvii
bending modes, respectively; the lower frequency modes are assigned as framework lattice
vibrations................................................................................................................................. 57
Figure 3-5. IR spectra of ZIF-8 loaded with CO2 upon compression and decompression in
comparison with those of pure ZIF-8 at similar pressures. The band labeled with an asterisk
indicates the position of the C=N stretching mode of the ZIF-8 framework (see text). ......... 58
Figure 3-6. IR frequencies of selected modes of the ZIF-8 framework loaded with CO2 as a
function of pressure................................................................................................................. 59
Figure 4-1. (a) Local structure and Indium coordination environment of MIL-68 (In). (b)
View of the structure of activated MIL-68 (In) along c axis, showing the arrangement of
hexagonal and triangular channels. The DMF molecules in the channels of as-made
framework can be mostly removed upon activation. .............................................................. 64
Figure 4-2. IR spectra for as-made and activated MIL-68(In) in the frequency region (a) 600-
4000 cm-1, with the inset showing the OH stretching modes in the enlarged spectral region of
3610-3700 cm-1 at the top; (b) 1200-1800 cm-1. ..................................................................... 70
Figure 4-3. The IR spectra of as-made MIL-68(In) upon compression in the frequency region
(a) 650-1250 cm-1; (b) 1250-1750 cm-1; (c) 3600-3800 cm-1. ................................................ 73
Figure 4-4. Frequency of IR modes of as-made MIL-68(In) as a function of pressure from 0
to 9 GPa in the spectral region of (a) 750-3750 cm-1; (b) 1375-1695 cm-1. ........................... 75
Figure 4-5. IR spectra of activated MIL-68(In) upon compression in the frequency region (a)
700-1250 cm-1; (b) 1200-1750 cm-1; (c) 3500-3700 cm-1. ...................................................... 78
Figure 4-6. Frequency of IR modes of activated MIL-68(In) as a function of pressure from 0
to 9 GPa in the spectral region of (a) 750-3680 cm-1; (b) 1390-1585 cm-1. ........................... 80
Figure 4-7. Illustration of local structure of MIL-68(In) at (a) ambient pressure; (b) high
pressure (HP), showing hydrogen bonding between the OH units and carboxyl oxygens. .... 82
xviii
Figure 4-8. (a) IR spectra of activated MIL-68(In) with PTM upon compression. (b)
Frequency of IR modes of activated MIL-68(In) with PTM as a function of pressure from 0
to 18 GPa................................................................................................................................. 85
Figure 4-9. IR spectra of activated MIL-68(In) and MIL-68(In) loaded with CO2 at around
0.4 GPa in the frequency region (a) 600-3800 cm-1; (b) 1325-1800 cm-1. ............................. 89
Figure 4-10. IR spectra of MIL-68(In) loaded with CO2 upon (a) compression and (b)
decompression in the frequency region 3580-3800 cm-1. ....................................................... 91
Figure 4-11. Frequency of the combination modes of CO2 and the OH stretch mode of MIL-
68(In) as a function of pressure from 0.42 to 1.88 GPa. ......................................................... 92
Figure 4-12. Simulated contour plots of the CO2 probability density (in arbitrary unit)
distributions along the hexagonal and triangular channels of MIL-68(In) framework at (A) 1
bar, (B) 1000 bar or 0.1 GPa and (C) 105 bar (or 10 GPa). .................................................... 96
Figure 5-1. The structure of activated α-Mg3(HCOO)6 at ambient conditions. (a) The
framework structure along b axis, showing the one-dimensional zigzag channels with a
dimension of 4.5 Å × 5.5 Å. The green polyhedrons represent Mg-O clusters. (b) Four
Different Mg coordination environments. ............................................................................ 104
Figure 5-2. (a) Optical image of the sample chamber consisting of activated α-Mg3(HCOO)6
loaded with CO2 at 0.37 GPa and room temperature. (b) Selected mid-IR spectrum of α-
Mg3(HCOO)6 loaded with CO2 at 0.37 GPa compared with that of the activated α-
Mg3(HCOO)6 at 0.33 GPa. The inset shows the enlarged parts of the two spectra in the region
of 2650 – 2950 cm-1 and 3550 – 3750 cm-1, respectively. .................................................... 107
Figure 5-3. Selected Raman spectrum of α-Mg3(HCOO)6 loaded with CO2 at 0.42 GPa
compared with the empty α-Mg3(HCOO)6 at 0.44 GPa and α-Mg3(HCOO)6 loaded with
DMF at 0.45 GPa in the spectral region 50 – 400 cm-1 (a); Empty α-Mg3(HCOO)6 at 0.44
GPa in the spectral region 1200 – 3000 cm-1 (b)................................................................... 108
Figure 5-4. Selected mid-IR spectra of α-Mg3(HCOO)6 loaded with CO2 in the spectra region
of 3580–3800 cm-1 upon compression from 0.30 to 9.82 GPa (a); upon decompression to
xix
ambient (b); in the spectra region of 1100–3000 cm-1 upon compression and as recovered to
0.37 GPa (c). ......................................................................................................................... 111
Figure 5-5. (a) Selected Raman spectra of α-Mg3(HCOO)6 loaded with CO2 in the spectra
region of 50 – 400 cm-1 upon compression from 0.69 to 11.41 GPa and as recovered to 0.40
GPa and ambient pressure. (b) Selected far-IR spectra of α-Mg3(HCOO)6 loaded with CO2 in
the spectra region of 100 – 550 cm-1 upon compression from 0.69 to 11.41 GPa and as
recovered to 0.40 GPa and ambient pressure. ....................................................................... 115
Figure 5-6. (a) IR frequencies of ν(C-H), νs(OCO) and δ(C-H) mode of CO2 loaded α-Mg3(HCOO)6
as a function of pressure; (b) Raman shifts of the lattice modes (denoted as 1- 4) of CO2
loaded α-Mg3(HCOO)6 and the lattice modes (Fg+, Fg- and Eg) of solid CO2 as a function of
pressure; (c) IR frequencies of ν(Mg-O) and the lattice modes (denoted as 5- 9) of CO2 loaded
α-Mg3(HCOO)6 as a function of pressure. ........................................................................... 117
Figure 5-7. Illustration of CO2 adsorption in α-Mg3(HCOO)6. The grey & red ball-stick
models represent the CO2 molecules adsorbed inside the pores of the framework. The dash
lines symbolise the dipole-dipole interaction between CO2 and the formate ligands. .......... 123
Figure 6-1. (a) Local structure and Calcium coordination environment of CaSDB; (b) View
of the structure of activated CaSDB along b axis, showing the diamond-shaped channels with
the size of ~ 5.5 Å in diameter. ............................................................................................. 128
Figure 6-2. IR (bottom) and Raman (top) spectra of activated CaSDB at ambient pressure in
the frequency region of 100- 3400 cm-1, with the inset showing the C-H stretching modes in
the enlarged spectral region of 3000-3300 cm-1. .................................................................. 132
Figure 6-3. IR spectra of CaSDB upon compression from ambient to 10.93 GPa and upon
recovery in the frequency region (a) 100-550 cm-1 and (b) 1200-3400 cm-1. ....................... 134
Figure 6-4. Raman spectra of CaSDB upon compression from ambient to 10.73 GPa and
recovery in the frequency region (a) 100-1250 cm-1 and (b) 1400-3200 cm-1. ..................... 136
Figure 6-5. Frequency of selected (a) far-IR; (b) mid-IR; and (c) Raman modes of CaSDB as
a function of pressure from ambient to 11 GPa. ................................................................... 137
xx
Figure 6-6. IR spectra of CaSDB and CO2 loaded CaSDB at around 0.4 GPa in the spectral
region of (a) 100-525 cm-1; (b) 600-4000 cm-1. The inset shows (a) the optical image of the
sample chamber of CaSDB loaded with CO2; (b) the CO2 combination modes in the enlarged
spectral region of 3550-3800 cm-1. ....................................................................................... 140
Figure 6-7. IR spectra of CaSDB loaded with CO2 upon compression from 0.24 to 13.6 GPa
and recovery in the frequency region (a) 90-535 cm-1; (b) 1200-3300 cm-1 and (c) 3550-3850
cm-1. ...................................................................................................................................... 144
Figure 6-8. Frequency of selected IR modes of CaSDB loaded with CO2 GPa in the
frequency region of (a) 150-450 cm-1; (b) 1275-1700 cm-1 and (c) 3050-3800 cm-1 as a
function of pressure from 0.24 to 13.6 GPa. ......................................................................... 146
Figure 6-9. Raman spectra of CaSDB upon compression from (a) 0.24-4.08 GPa; (b) 5.39-
13.6 GPa and recovery in the frequency region of 75-450 cm-1 and (c) Frequency of selected
Raman modes of CaSDB loaded with CO2 as a function of pressure from 0.24 to 13.6 GPa.
............................................................................................................................................... 148
Figure 6-10. CO2 adsorption in CaSDB at (a) ambient pressure; (b) high pressures (HP). The
blue balls represent CO2 molecules inside the pores of CaSDB, with the oxygen atoms
omitted. The dash lines symbolize the interactions between CO2 and the specific adsorption
sites of the framework. .......................................................................................................... 154
xxi
List of Abbreviations
1D one-dimensional
3D three-dimensional
APS Advanced Photon Source
ANL Argonne National Laboratory
BDC 1,4-benzenedicarboxylate
BET Brunauer–Emmett–Teller
BS beam splitter
BNL Brookhaven National Laboratory
BTC benzene-1,3,5-tricarboxylate
CCD charge coupled device
DAC diamond anvil cell
DMF N,N-dimethylformamide
dobdc 2,5-dioxido-1,4-benzenedicarboxylate
FTIR Fourier transform infrared
GCMC Grand Canonical Monte Carlo
GPa gigapascal
HP high pressure
IR infrared
IRIS infrared radiation interferometer spectrometer
IRMOF isoreticular metal–organic framework
MCT mercury cadmium telluride
xxii
MIL Matériaux de l'Institut Lavoisier
mmen N,N'-dimethylethylenediamine
MOF metal-organic framework
NF notch filter
NLC negative linear compressibility
NSLS National Synchrotron Light Source
PTM pressure transmitting medium
SDB 4, 4′-sulfonyldibenzoate
XRD X-ray diffraction
ZAG zinc alkyl gate
ZIF zeolitic imidazolate framework
ZSM Zeolite Socony Mobil
1
Chapter 1
1 Introduction
1.1 Metal-organic frameworks
1.1.1 Structures of metal-organic frameworks
Metal-organic frameworks (MOFs) are an emerging class of crystalline materials
constructed by bridging metal–containing units with organic linkers to create open rigid
frameworks with permanent porosity. One of the prototype and earliest-studied MOF
structure is MOF-5, a cubic framework built from octahedral [Zn4O(CO2)6] clusters which
consist of oxygen-centered Zn4 tetrahedra linked by 1,4-benzenedicarboxylate (BDC)
ligands, as illustrated in Figure 1-1 (a).1 Based on the cubic skeleton of MOF-5, a large
series of isoreticular MOFs (IRMOFs) that have the same framework topology but with
different pore size and functionality can be produced by tuning the length and
functionalities of organic linkers, as shown in Figure 1-1 (b).2 Such IRMOFs have been
found in other MOF families, such as Zr6O4(OH)4(BDC)6 (UiO-66),3,4 Al(OH)(BDC)
(MIL-53),5,6 and Cu2(BPTC) (BPTC=3,3',4,4'-benzophenonetetracarboxylate).7 Thus a
large variety of MOFs with rich structural and topological diversity can be made owing to
the extraordinary degree of variability for both the organic and inorganic components. Up
to date, more than 20,000 MOF structures have been reported and studied within the past
decade.8 Due to their permanent porosity, high thermal stability, large surface area and
finely tunable chemical functionality, MOFs have wide applications in gas storage,9-11 gas
separation,12 catalysis,13 drug delivery,14 chemical sensors15 and so on.
2
Figure 1-1. (a) The building units and structure of MOF-5; (b) Isoreticular MOFs of MOF-
5. (ref. 1, 2)
1.1.2 CO2 storage in metal-organic frameworks
One of the most promising applications of MOFs is gas storage, especially CO2
storage. As a green-house gas, the sharply rising level of CO2 in atmosphere resulting from
combustion of coal, oil, and natural gas is one of the greatest environmental concerns
stoday. Thus it is imperative to develop effective carbon capture and storage (CCS)
technologies to address this issue. Current technologies involving aqueous amine
absorbents to capture CO2 have been extensively studied and are considered the state-of-
the-art.16 But it carries a large energy penalty that originates primarily from the need to
heat the large quantities of the amine solutions, as well as the energy required to break the
C–N bond formed in the interaction between CO2 and the amine functionality.17 Hence,
solid porous adsorbents which have much lower heat capacities are considered as an
alternative strategy for efficient CO2 capture and storage, such as zeolites,18-22 activated
3
carbons,23 covalent-organic frameworks,24-27 amine-grafted silica28,29 and MOFs. Among
these porous materials, MOFs are most promising for the applications in CO2 storage,
owing to their ultra-high porosity, large pore volume and surface area, and most
importantly, a flexibility with which chemical functionalization and molecular-level fine-
tuning can be achieved for optimized uptake capacities.
The adsorptive capacity is a critical parameter to evaluate the performance of MOFs
for CO2 storage. CO2 capacity in MOFs can be measured by the gravimetric CO2 uptake,
which represents the quantity of CO2 adsorbed within a unit mass of the material; or the
volumetric capacity refers to how densely the CO2 can be stored within the material. The
high internal surface areas of MOFs make large CO2 adsorption capacities in the
framework possible because of the efficient packing and close approach of the guest
molecules on the pore surface. For example, MOF-177 [Zn4O(1,3,5-benzenetribenzoate)2)]
combines an exceptional level of surface area (4,500 m2/g) with extra-large pores (11×17
Å) that are desirable for CO2 storage.30 The volumetric CO2 adsorption capacity for MOF-
177 at 35 bar reaches a storage density of 320 cm3(STP)/cm3 (STP= standard temperature
and pressure), which is 9 times higher than the quantity stored at this pressure in a container
without the adsorbent and 2 times higher than other porous materials such as zeolite 13X
and activated carbon, as shown in Figure 1-2.31 The high-pressure (10-50 bar) adsorption
capacities are mainly dependent on the surface area of MOFs, whereas the low-pressure
(<1.2 bar) adsorption capacities for MOFs are highly influenced by the chemical features
of the pore surface, especially those bearing highly functionalized surfaces.10 Therefore,
functionalization of the frameworks to improve the CO2 binding affinity is crucial for
optimization of the adsorptive properties of MOFs at low pressures.
4
Figure 1-2. The crystal structure of MOF-177 and comparison of the gravimetric and
volumetric CO2 capacity for several MOFs and other porous materials. (ref. 31)
Up to date, various types of functionalities in MOFs have been explored to enhance
the CO2 adsorption selectivity and capacity, including amines, strongly polarizing organic
functionalities, and exposed metal cation sites. MOFs functionalized with amines have
been intensively studied for their CO2 adsorption properties.32-35 The dispersion and
electrostatic forces resulting from the interaction of the quadrupole moment of CO2 with
localized dipoles generated by nitrogen incorporation are considered responsible for the
enhanced CO2 adsorption. In addition, acid-base type interactions between the lone-pair of
nitrogen and CO2 have been observed as well. The commercial availability of aromatic
amine containing linkers, such as 2-aminoterephthalic acid (NH2-BDC), and the expected
affinity of amino groups toward CO2 have generated significant interest in aromatic amine
functionalized frameworks. For example, MOF-5 [Zn4O(BDC)3] adsorbs approximately
4.6 wt % CO2 at 298 K and 1.1 bar; while the amine-functionalized variant IRMOF-3
5
[Zn4O(NH2-BDC)3] adsorbs 5.0 wt % CO2, despite a decrease in the BET surface area from
2833 to 2160 m2/g.31 Moreover, amine functionalization has been shown to enhance CO2
capacity via incorporation of alkylamines into MOF pores.36,37 For instance, alkylamine
incorporation onto the metal sites of Cu-BTTri (H3[(Cu4Cl)3(BTTri)8; H3BTTri = 1,3,5-
tri(1H-1,2,3-triazol-4-yl)benzene) was found to be an effective method to enhance the CO2
binding through post-synthetic modifications of MOFs. At 0.15 bar, the gravimetric
capacity was increased to 9.5 wt % for the functionalized Cu-BTTri framework, which is
approximately 3.5 times higher than that of the original framework, as shown in Figure 1-
3.37
Figure 1-3. (a) Functionalization of Cu-BTTri through binding N,N'
dimethylethylenediamine (mmen) to the metal coordination sites; (b) the CO2 (square) and
N2 (circle) adsorption isotherms for mmen-Cu-BTTri (green) and Cu-BTTri (blue) at 298
K. (ref. 37)
6
In addition to the amine functionalized MOFs, organic linkers with other functional
groups have also been investigated for their effects on the CO2 adsorption performance.38-
47 These functional groups include hydroxyl, nitro, cyano, thio, and halide groups, and the
degree of how much CO2 adsorption is enhanced mainly depends on the extent of ligand
functionalization and the polarizing strength of the functional group. In general, more
strongly polarizing groups will influence CO2 adsorption more favorably.
Another important approach that has been developed to improve the affinity and
selectivity of MOFs toward CO2 is the generation of MOF structures with exposed metal
cation sites on the pore surface.48-53 The open metal sites can be obtained by desolvation of
the MOFs, where one of the solvent molecules in the metal coordination sphere is removed
upon heating in vacuum conditions. For the application of CO2 capture and storage, the
open metal cation sites serve as charge-dense binding sites for CO2 which is adsorbed
strongly at these sites due to its large quadrupole moment and polarizability. The earliest
study of MOFs possessing exposed metal cation sites was on HKUST-1 [Cu3(BTC)2; BTC:
benzene-1,3,5-tricarboxylate], in which the solvent molecules on the axial sites of the
paddlewheel units can be removed to generate open Cu2+ sites that interact strongly with
CO2.48 More recently, a series of MOFs M2(dobdc) (M = Mg, Mn, Co, Ni, and Zn; dobdc
= 2,5-dioxido-1,4-benzenedicarboxylate) also known as MOF-74 or CPO-27 have drawn
much attention and became one of the most well-studied MOFs with open metal sites.54
Each of these MOFs is composed of MII ions generating linear, infinite building units
bound by dobdc ligands resulting in a hexagonal, 1D pore structure. The pores of the as-
made M2(dobdc) MOFs contain solvent molecules that complete the coordination sphere
of the metal ions and can be removed upon evacuation to generate coordinately unsaturated
7
metal sites. Sorbent materials such as CO2 are thus provided with a honeycomb structure
composed of 1D channels as depicted in Figure 1-4 (a). The high density of binding sites
in the hexagonal pores makes remarkably high CO2 adsorption capacities in the M2(dobdc)
MOFs, ranging from 19.8 to 26.0 wt % at 1 bar & 296 K, as shown in Figure 1-4 (b). So
far, the gravimetric and volumetric CO2 adsorption capacities in Mg2(dobdc) are the highest
among all the MOFs in low-pressure range, despite its relatively low surface area (1495
m2/g). Thus functionalization of the pores with a large number of high-affinity binding
sites is an effective way to substantially enhance the CO2 adsorption capacity in a MOF.
Figure 1-4. (a) View of 1D channel of the structure of MOF M2(dobdc) adsorbed with
CO2; (b) CO2 sorption isotherm (296 K, 0 to 1 atm) of the MOF M2(dobdc) series. (ref. 54)
8
1.2 High-pressure science and technology
1.2.1 High-pressure phenomena
It is well known that temperature, pressure and volume are three basic macroscopic
parameters to describe a thermodynamic system. Among these parameters, pressure spans
over 60 orders of magnitude in the universe, from 10-32 atmosphere in intergalactic space
to 1032 atmosphere in the center of neutron star.55 Under such a broad range of pressure,
materials could exhibit various structures as well as novel properties. When applying
pressure to materials, the general effect is to reduce the volume of the materials, as pressure
can efficiently shorten the inter-molecular and intra-molecular distances, which will
increase the free energy of the system.56 The relation between pressure (P) and total energy
(E) can be described by eq. 1.1,
V
EP
(1.1)
Consequently, and alternation of the volume will change the total energy of the system.
The response of the system to retrieve a new free energy minimum will result in a number
of possible processes, such as phase transformation, ionization, polymerization,
amorphization, dissociation, metallization and so on. Hence, the application of high
pressure on matters provides an effective method to delicately tune their electronic,
magnetic, optical and mechanical properties.56 Some examples of interesting phenomena
and novel materials with exotic structures and properties generated under high pressure are
highlighted in Figure 1-5.57
9
Figure 1-5. Examples of various high-pressure phenomena. (ref. 57)
1.2.2 Diamond anvil cell
In order to achieve static high pressure in gigapascal range (1 GPa = 109 Pa = 104
bar) in lab, a special device called diamond anvil cell (DAC) which can generate pressure
up to ~360 GPa has been used.58,59 Diamonds are known as the hardest material in nature
and thus suitable to be used as anvils to generate high pressure. Moreover, diamonds are
transparent to a wide spectral range of electromagnetic radiation. As a result, various
probes, such as vibrational spectroscopy, X-ray diffraction etc., could be utilized for in situ
structural characterizations of materials in the DAC under high pressures.60 The principle
10
and operation of the DAC is quite simple as shown in Figure 1-6. A stainless steel gasket,
which is drilled with a hole at the center and used to contain the sample, is compressed
between a pair of identical diamond anvils. The culet (the tip of diamond) size usually
varies from 100 to 700 µm, depending on the maximum pressure desired. Due to the small
area of the diamond culet, high pressure can be achieved by applying a moderate force on
the sample.
Figure 1-6. Opposed diamond anvil configuration, with a metal gasket for sample
confinement.
The pressure inside the sample chamber can be monitored using a reference
material, such as ruby (Al2O3 doped with Cr3+) whose behavior under pressure is known.
Ruby fluorescence is one of the well-established methods to measure pressure reliably and
accurately.61-63 When excited by laser, ruby emits luminescent peaks R1 and R2, where the
position of R1 peak is very sensitive to pressure and an equation was established to describe
the relationship between pressure and the wavelength of R1 line.63
11
1
24.6941
1904B
BP
(1.2)
where P is pressure in GPa and Δ λ is the difference between the wavelength of the ruby
R1 line at pressure P and that at ambient pressure. The parameter B in the equation equals
to 7.665 for quasi-hydrostatic conditions, and equals to 5 for non-hydrostatic conditions.63
An example of using ruby fluorescence to determine pressure is shown in Figure 1-7. The
resolution of the pressure can be achieved to ± 0.05 GPa by using this method.
Figure 1-7. Ruby R1 fluorescence spectra at 0 GPa (in black) and 4.9 GPa (in red) under
room temperature.
12
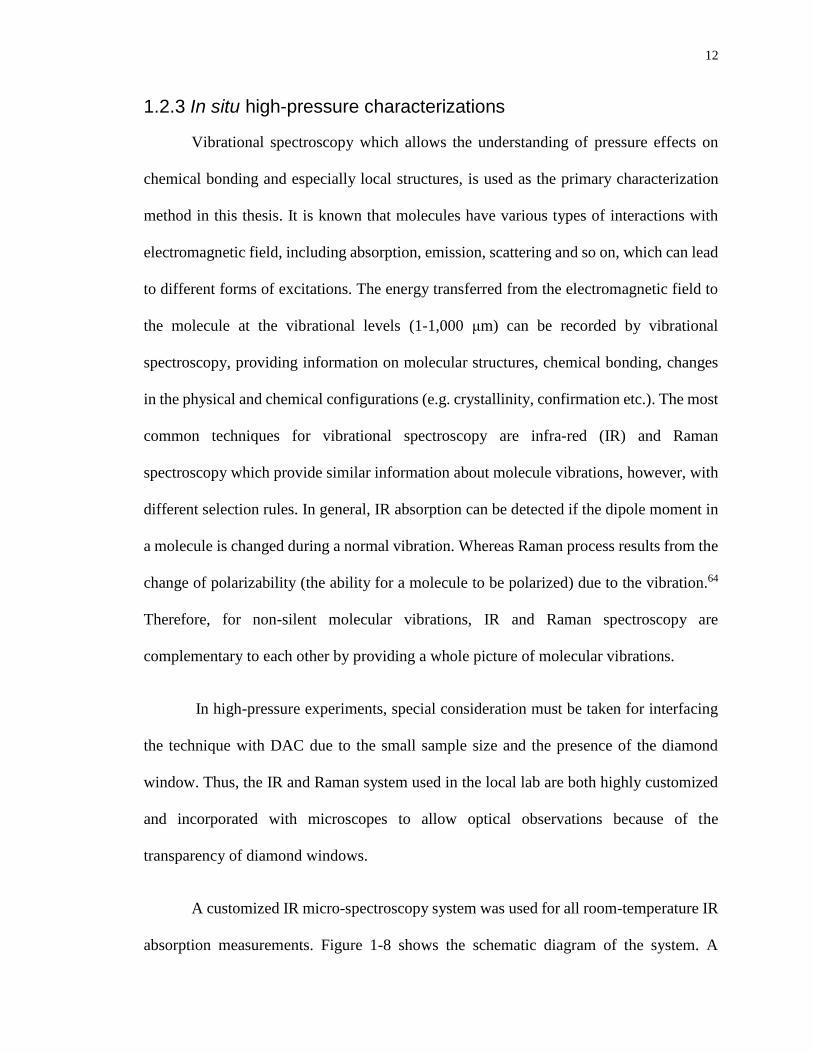
1.2.3 In situ high-pressure characterizations
Vibrational spectroscopy which allows the understanding of pressure effects on
chemical bonding and especially local structures, is used as the primary characterization
method in this thesis. It is known that molecules have various types of interactions with
electromagnetic field, including absorption, emission, scattering and so on, which can lead
to different forms of excitations. The energy transferred from the electromagnetic field to
the molecule at the vibrational levels (1-1,000 μm) can be recorded by vibrational
spectroscopy, providing information on molecular structures, chemical bonding, changes
in the physical and chemical configurations (e.g. crystallinity, confirmation etc.). The most
common techniques for vibrational spectroscopy are infra-red (IR) and Raman
spectroscopy which provide similar information about molecule vibrations, however, with
different selection rules. In general, IR absorption can be detected if the dipole moment in
a molecule is changed during a normal vibration. Whereas Raman process results from the
change of polarizability (the ability for a molecule to be polarized) due to the vibration.64
Therefore, for non-silent molecular vibrations, IR and Raman spectroscopy are
complementary to each other by providing a whole picture of molecular vibrations.
In high-pressure experiments, special consideration must be taken for interfacing
the technique with DAC due to the small sample size and the presence of the diamond
window. Thus, the IR and Raman system used in the local lab are both highly customized
and incorporated with microscopes to allow optical observations because of the
transparency of diamond windows.
A customized IR micro-spectroscopy system was used for all room-temperature IR
absorption measurements. Figure 1-8 shows the schematic diagram of the system. A
13
commercial Fourier transform infrared (FTIR) spectrometer from Bruker Optics Inc.
(Model Vertex 80v) equipped with Globar mid-IR light source constituted the main
component of the micro-IR system, which was operated under a vacuum of < 5 mbar, such
that the absorption by H2O and CO2 was efficiently removed. A collimated IR beam was
directed into a relay box through a KBr window on the spectrometer. The beam was then
focused onto the sample in the DAC by an iris optics and 15× reflective objective lens with
a numerical aperture of 0.4. The size of the IR beam was set to be identical to the entire
sample size (e.g. ~ 130 μm) by a series of iris apertures. The transmitted IR beam was
collected using another identical reflective objective as the condenser, and was directed to
a wide-band mercury cadmium telluride (MCT) detector equipped with a ZnSe window
that allows measurements in the spectral range of 600 to 12000 cm−1. The customized
spectroscopic system also allows IR measurements in the reflection mode using reflective
optics via the optical path shown in Figure 1-8.65
14
Figure 1-8. Schematic diagram of the IR micro-spectroscopy system, with major optical
components labeled. (ref. 65)
To collect Raman spectra, a customized Raman micro-spectroscopy system was
used. The schematic diagram of this Raman system is depicted in Figure 1-9. A single
longitudinal mode, diode pumped solid state (DPSS) green laser with wavelength 532.10
nm was used as the excitation source. The laser was focused to < 5 μm on the sample by a
20× objective. The Raman signal was detected with backscattering geometry by the same
objective lens. The Rayleigh scattering was removed by a pair of notch filters. The
scattered light was then dispersed using an imaging spectrograph equipped with a 1200
lines/mm grating achieving a 0.1 cm−1 resolution. The Raman signal was recorded using
15
an ultrasensitive, liquid nitrogen cooled, back-illuminated, charge-coupled device (CCD)
detector. The system was calibrated by neon lines with an uncertainty of ± 1 cm−1.66
Figure 1-9. Schematic of the Raman system. BPF: band path filter; IRIS: IRIS aperture;
M1-7: broadband dielectric reflecting mirrors; FW1A: Six station filter wheel; BS: beam
splitter; NF: notch filter; DAC: diamond anvil cell; Triple gratings: 300 lines/mm, 1200
lines/mm, and 1800 lines/mm. (ref. 66)
In addition to vibrational spectroscopy, high-pressure X-ray diffraction (XRD) is
another powerful technique for the characterization of materials on compression, providing
information on structural evolution of the crystal lattice. In high-pressure studies, due to
the bulk anvils of DAC and small sample sizes, X-ray diffraction measurements can only
be performed with intense high energy X-ray beam and small beam size (e.g., tens of
16
microns), which can only be achieved by synchrotron radiation source due to its wide
energy range, high brightness and finely tunable beam size.67 The synchrotron facilities at
the National Synchrotron Light Source (NSLS) in Brookhaven National Laboratory
(BNL), and Advanced Photon Source (APS) in Argonne National Laboratory (ANL)
provide highly collimated X-ray source with intense high energy, optimized for in situ high
pressure XRD measurements.
1.2.4 IR and Raman spectra of CO2 at high pressures
CO2 is the centerpiece of this work and thus it is imperative to have a
comprehensive understanding of the CO2 basics, especially its pressure behavior and the
vibrational spectra at high pressures. Figure 1-10 (a) illustrates the CO2 phase diagram in
the high pressure region.68 Under room temperature, CO2 transforms to liquid state at
pressures above 5.1 atm. At pressures higher than 0.6 GPa, it becomes solid known as dry
ice. In this study, CO2 was trapped with the MOF sample in the DAC upon initial loading
at ~ 0.3–0.5 GPa and then compressed to higher pressures. Thus CO2 experienced a phase
transition from liquid to solid phase at 0.6 GPa upon compression. During all the
measurements in this work, CO2 was either in liquid phase at lower pressures or in solid
phase I at higher pressures.
17
Figure 1-10. (a) CO2 phase diagram (ref. 68); (b) IR spectrum of liquid CO2 at 0.4 GPa;
Raman spectrum of CO2 (c) at 0.4 GPa and (d) at 1.0 GPa in the lattice region. (ref. 70)
The vibrational spectrum of liquid CO2 is the same with that of gaseous CO2, which
is a linear and centrosymmetric molecule. It has three normal vibrational modes, the
symmetric stretching mode ν1, the bending mode ν2, and the asymmetric mode ν3, among
which the ν2 and ν3 modes are infrared active, as shown in Figure 1-10 (b). IR absorption
associated with the normal vibrations was too strong and thus their band positions were
unable to be determined due to saturation. However, two high-frequency bands with
adequate absorption intensity, which are well understood as the CO2 combination modes
of ν3+ 2ν2 and ν3+ ν1 can be observed and used to monitor the pressure behavior of CO2.69
The other normal mode ν1 is Raman active, however, anharmonic coupling between nearly
18
degenerate modes ν1 and overtone 2ν2 gives rise to modes ν+ (≈ ν1) and ν- (≈ 2ν2) in the
Raman spectrum (Fermi resonance), as depicted in Figure 1-10 (c).70
Upon solidification, CO2 crystalizes in a cubic space group Pa3 (phase I), in which
the molecules are oriented along the body diagonal of the cubic cell.70 Each primitive unit
cell contains four CO2 molecules. In addition to the three internal modes in the gas phase,
solid state CO2 features external modes in the low frequency region due to the translational
and rotational motions of a whole molecule within the unit cell. Figure 1-10 (d) shows the
three external modes (lattice modes) of solid CO2 at ~1 GPa under room temperature.
1.3 High-pressure effects on MOFs
For the application of CO2 storage, MOFs need to be mechanically stable enough
to allow a dense packing of the adsorbent bed without loss of the framework structure.
Even slight perturbations to the structural or chemical features of MOFs under a high
mechanical pressure could have a considerable effect on their performance for CO2
adsorption. In contrast to the extensive studies of MOFs under ambient conditions, the
investigations of MOFs under high external pressure in the order of gigapascal are much
less. Thus it is of great interest to thoroughly explore the behavior and performance of
MOFs under high pressure. So far, studies have demonstrated a wide variety of behavior
of MOFs in response to the application of high external pressure, including unusual elastic
responses, phase transitions, chemical reactions and high-pressure guest insertion.71 In this
section of the thesis, selected examples will be given for those specific high-pressure
effects on MOFs.
19
1.3.1 Unusual elastic responses
The diversity of the mechanical behavior of materials as a function of topology has
been well established for inorganic materials, such as zeolites.72-74 However, the
mechanical properties of MOFs under external stress is an aspect that has not been
thoroughly explored mostly due to the difficulties in determining them reliably from
relatively small crystal sizes. Nonetheless, some systematic efforts at measuring
mechanical properties of MOFs, including bulk modulus (through high-pressure
crystallography), directional Young’s moduli and hardnesses (through nanoindentation of
micro-crystals) have been made in recent years.75-80 It was found that some MOFs have
demonstrated unusual mechanical responses to external pressure by deformations of large
amplitude or counterintuitive direction. The most representative example of
counterintuitive mechanical behavior of MOFs is negative linear compressibility (NLC),
in which the material expands along one or more directions while undergoing a reduction
in volume under increasing pressure. The NLC has been found in MOFs with wine rack-
type framework including silver(I) 2-methylimidazolate81 and [NH4][Zn(HCOO)3],82 as
well as in MOFs exhibiting a similar hinging mechanism, such as MIL-53.83,84 For
example, MIL-53(Al) showed an expansion in the b direction while contracting in the a
and c directions, demonstrating NLC in one direction upon increasing pressure from 0 to 3
GPa, as illustrated in Figure 1-11. To understand the mechanism that leads to the NLC
phenomenon in MIL-53(Al), the inorganic Al(OH) chains can be visualized to act as hinges
in the flexible framework. Dicarboxylate linkers in the orthogonal plane connect these
hinges to each other, serving as rigid struts. The rigidity of the struts in this wine-rack
geometry enforces a connection between variations in the a and b lattice parameters: when
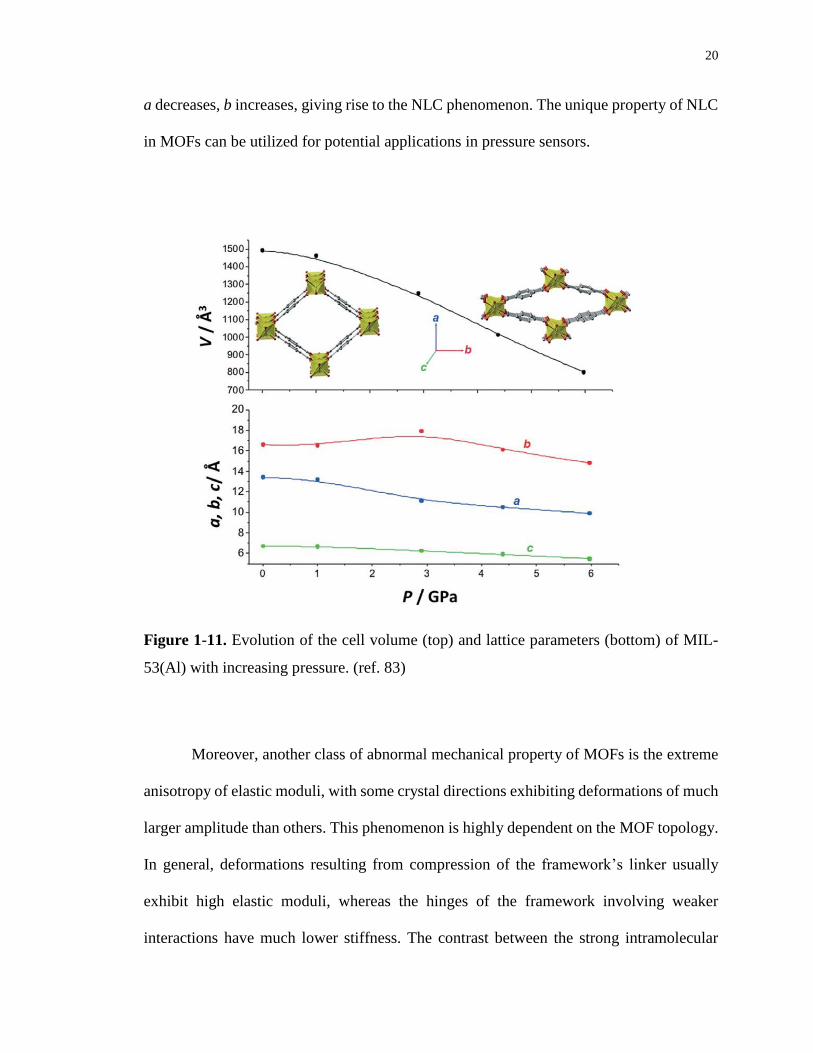
20
a decreases, b increases, giving rise to the NLC phenomenon. The unique property of NLC
in MOFs can be utilized for potential applications in pressure sensors.
Figure 1-11. Evolution of the cell volume (top) and lattice parameters (bottom) of MIL-
53(Al) with increasing pressure. (ref. 83)
Moreover, another class of abnormal mechanical property of MOFs is the extreme
anisotropy of elastic moduli, with some crystal directions exhibiting deformations of much
larger amplitude than others. This phenomenon is highly dependent on the MOF topology.
In general, deformations resulting from compression of the framework’s linker usually
exhibit high elastic moduli, whereas the hinges of the framework involving weaker
interactions have much lower stiffness. The contrast between the strong intramolecular
21
interactions (covalent & coordination bonds) and the weak intermolecular interactions (van
der Waals forces, hydrogen bonds, etc.) in MOFs can lead to up to two orders of magnitude
in difference between the highest and lowest moduli.85 The extreme elastic anisotropy is a
key feature of highly flexible MOFs, also known as the “breathing” MOFs.86
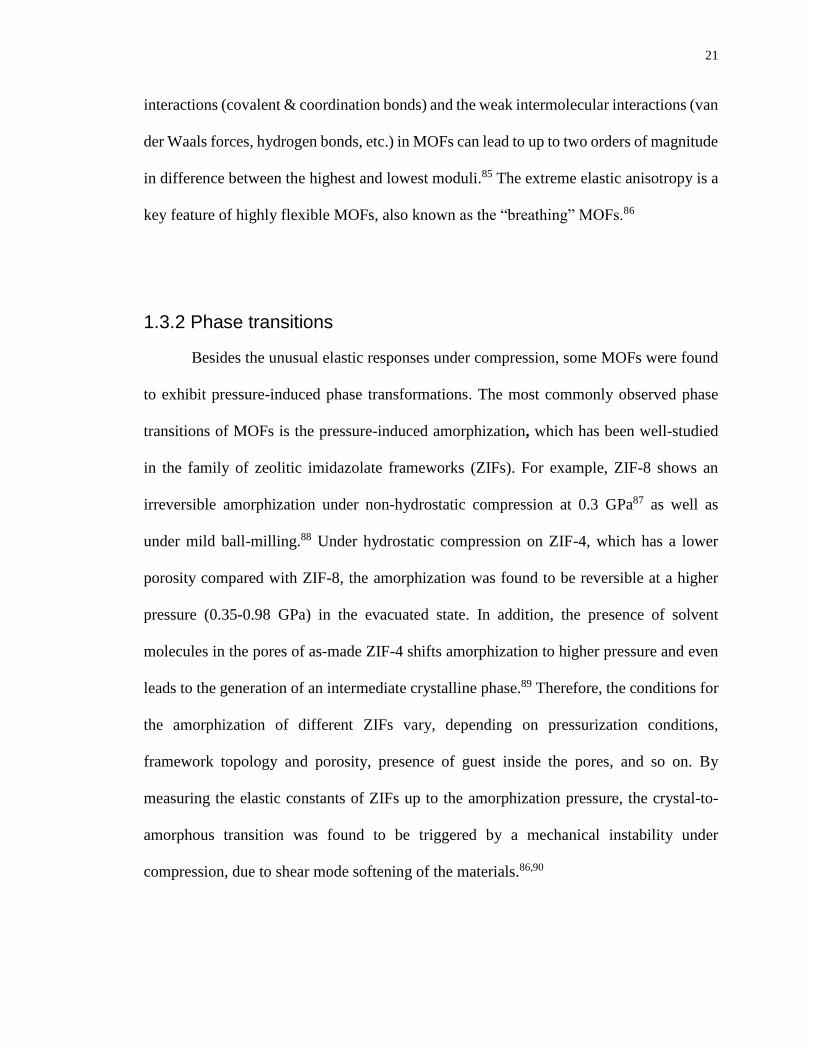
1.3.2 Phase transitions
Besides the unusual elastic responses under compression, some MOFs were found
to exhibit pressure-induced phase transformations. The most commonly observed phase
transitions of MOFs is the pressure-induced amorphization, which has been well-studied
in the family of zeolitic imidazolate frameworks (ZIFs). For example, ZIF-8 shows an
irreversible amorphization under non-hydrostatic compression at 0.3 GPa87 as well as
under mild ball-milling.88 Under hydrostatic compression on ZIF-4, which has a lower
porosity compared with ZIF-8, the amorphization was found to be reversible at a higher
pressure (0.35-0.98 GPa) in the evacuated state. In addition, the presence of solvent
molecules in the pores of as-made ZIF-4 shifts amorphization to higher pressure and even
leads to the generation of an intermediate crystalline phase.89 Therefore, the conditions for
the amorphization of different ZIFs vary, depending on pressurization conditions,
framework topology and porosity, presence of guest inside the pores, and so on. By
measuring the elastic constants of ZIFs up to the amorphization pressure, the crystal-to-
amorphous transition was found to be triggered by a mechanical instability under
compression, due to shear mode softening of the materials.86,90
22
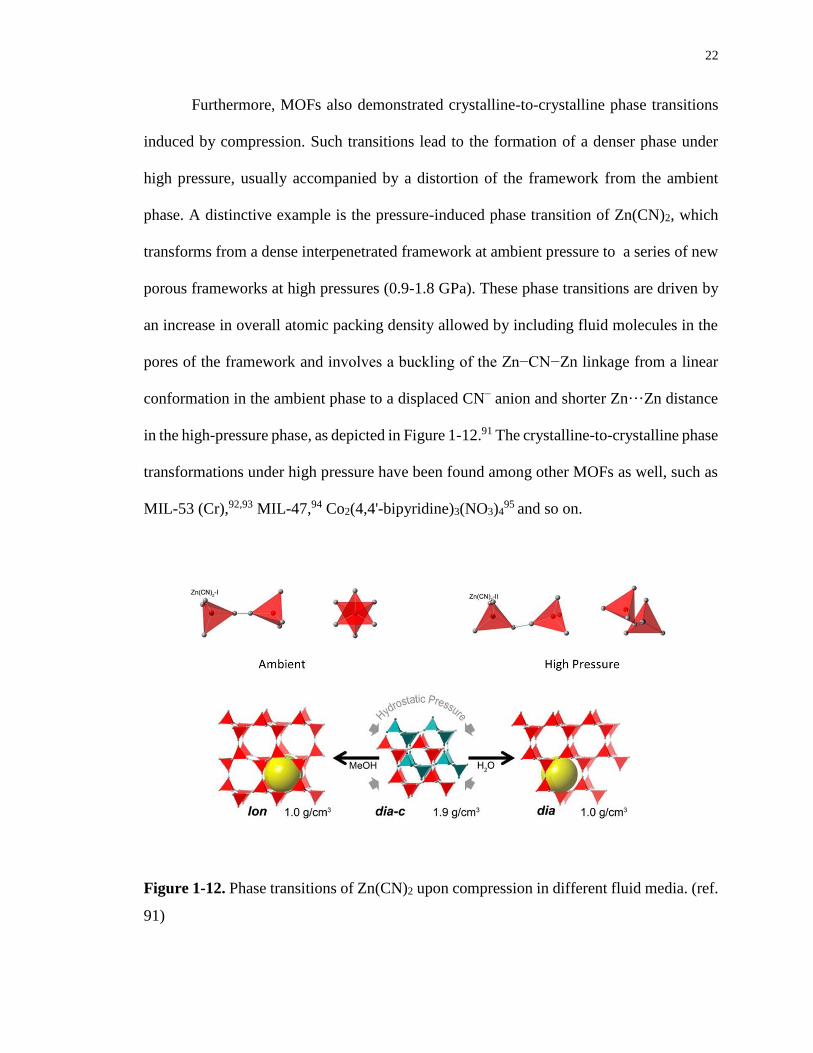
Furthermore, MOFs also demonstrated crystalline-to-crystalline phase transitions
induced by compression. Such transitions lead to the formation of a denser phase under
high pressure, usually accompanied by a distortion of the framework from the ambient
phase. A distinctive example is the pressure-induced phase transition of Zn(CN)2, which
transforms from a dense interpenetrated framework at ambient pressure to a series of new
porous frameworks at high pressures (0.9-1.8 GPa). These phase transitions are driven by
an increase in overall atomic packing density allowed by including fluid molecules in the
pores of the framework and involves a buckling of the Zn−CN−Zn linkage from a linear
conformation in the ambient phase to a displaced CN− anion and shorter Zn···Zn distance
in the high-pressure phase, as depicted in Figure 1-12.91 The crystalline-to-crystalline phase
transformations under high pressure have been found among other MOFs as well, such as
MIL-53 (Cr),92,93 MIL-47,94 Co2(4,4'-bipyridine)3(NO3)495
and so on.
Figure 1-12. Phase transitions of Zn(CN)2 upon compression in different fluid media. (ref.
91)
23
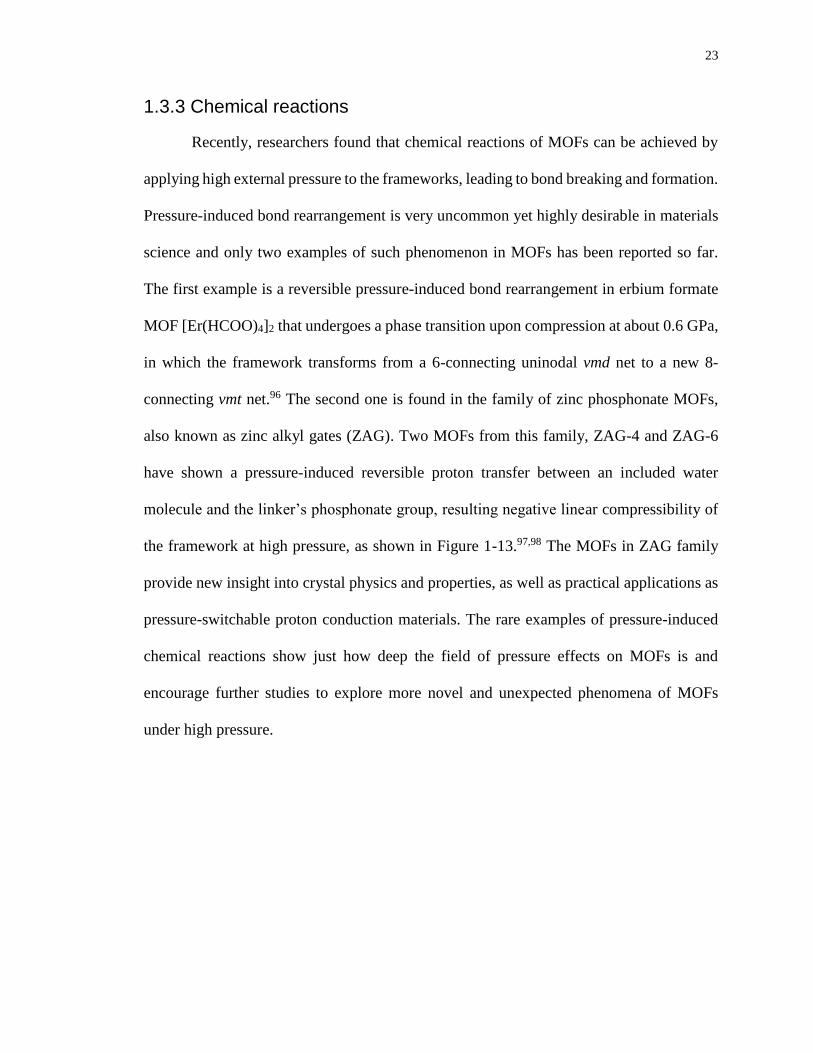
1.3.3 Chemical reactions
Recently, researchers found that chemical reactions of MOFs can be achieved by
applying high external pressure to the frameworks, leading to bond breaking and formation.
Pressure-induced bond rearrangement is very uncommon yet highly desirable in materials
science and only two examples of such phenomenon in MOFs has been reported so far.
The first example is a reversible pressure-induced bond rearrangement in erbium formate
MOF [Er(HCOO)4]2 that undergoes a phase transition upon compression at about 0.6 GPa,
in which the framework transforms from a 6-connecting uninodal vmd net to a new 8-
connecting vmt net.96 The second one is found in the family of zinc phosphonate MOFs,
also known as zinc alkyl gates (ZAG). Two MOFs from this family, ZAG-4 and ZAG-6
have shown a pressure-induced reversible proton transfer between an included water
molecule and the linker’s phosphonate group, resulting negative linear compressibility of
the framework at high pressure, as shown in Figure 1-13.97,98 The MOFs in ZAG family
provide new insight into crystal physics and properties, as well as practical applications as
pressure-switchable proton conduction materials. The rare examples of pressure-induced
chemical reactions show just how deep the field of pressure effects on MOFs is and
encourage further studies to explore more novel and unexpected phenomena of MOFs
under high pressure.
24
Figure 1-13. Pressure-induced proton jump in ZAG-4 and ZAG-6. (ref. 98)
1.3.4 High-pressure guest insertion
The interactions between the flexibility of MOFs and the adsorption of guests
within their pores has attracted much attention in the MOF studies because such interplay
is readily observed during adsorption measurements. In high-pressure range, one of the
important research directions in this area is the use of high pressure to insert guest fluids
into the pores of the frameworks, often triggering structural transformations of the host.
Typically for such experiments, the MOFs sample is loaded with small molecular fluid or
fluid mixture such as methanol, ethanol, etc., allowing the insertion of the guest into the
framework. Early studies involved in HKUST-199 and ZIF-8100 and more MOFs have been
investigated on the high-pressure guest inclusion recently.101-105 It was found that the
pressure-induced insertion of fluids into the porous framework can lead to contraction,
expansion, or structural transitions in the host framework as well as enhanced guest-host
25
interactions. In addition, the behavior of the host + guest system under compression can be
very different from the host itself. The presence of guests inside the pores increases elastic
moduli and diminishes compressibility, while improving resistance to delaying the onset
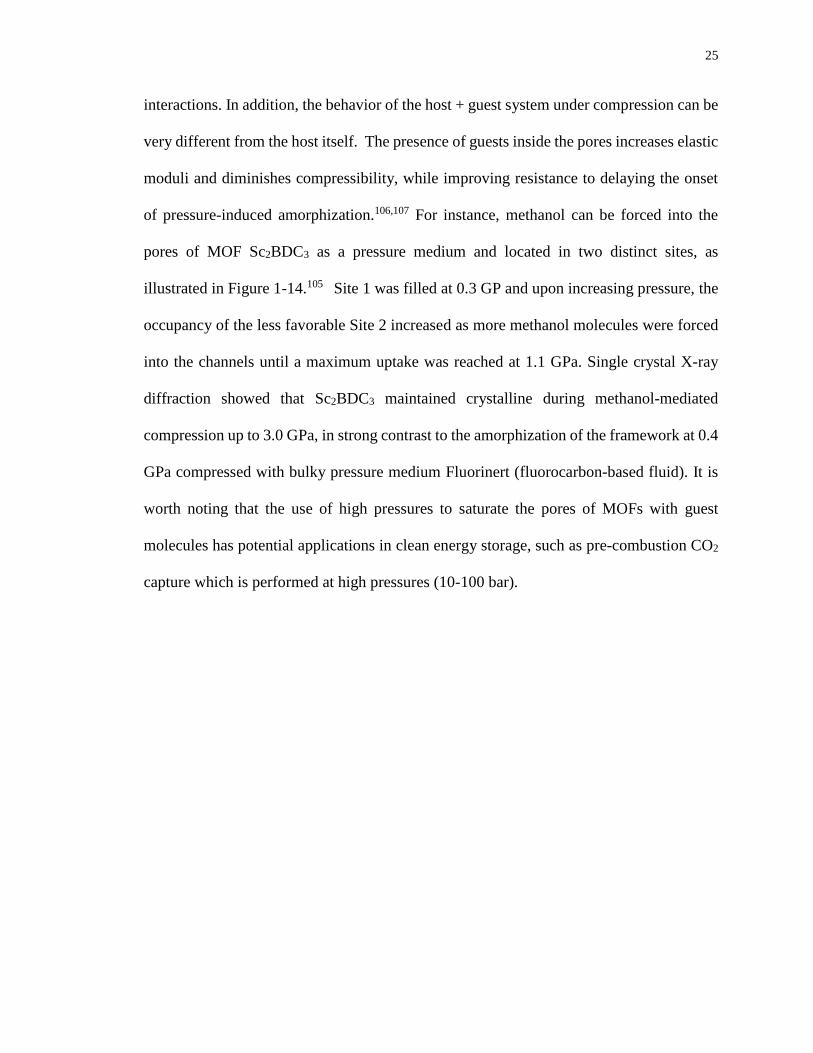
of pressure-induced amorphization.106,107 For instance, methanol can be forced into the
pores of MOF Sc2BDC3 as a pressure medium and located in two distinct sites, as
illustrated in Figure 1-14.105 Site 1 was filled at 0.3 GP and upon increasing pressure, the
occupancy of the less favorable Site 2 increased as more methanol molecules were forced
into the channels until a maximum uptake was reached at 1.1 GPa. Single crystal X-ray
diffraction showed that Sc2BDC3 maintained crystalline during methanol-mediated
compression up to 3.0 GPa, in strong contrast to the amorphization of the framework at 0.4
GPa compressed with bulky pressure medium Fluorinert (fluorocarbon-based fluid). It is
worth noting that the use of high pressures to saturate the pores of MOFs with guest
molecules has potential applications in clean energy storage, such as pre-combustion CO2
capture which is performed at high pressures (10-100 bar).
26
Figure 1-14. (a) Unit cell volume of Sc2BDC3 in methanol and Fluorinert as a function of
pressure; (b) pressure-induced methanol insertion in Sc2BDC3. (ref. 105)
1.4 Outline of the thesis
The main objectives of this thesis are to examine the chemical & structural
stabilities of selected MOFs and their performance for CO2 storage under high pressures.
The thesis is organized in the following way. Chapter 2 discusses the stability of ZIF-8 in
different pressure ranges probed by in-situ IR spectroscopy. Following Chapter 2, direct
evidences of the interactions between CO2 and ZIF-8 as well as an enhanced CO2 storage
in the framework were demonstrated in Chapter 3. The flexibility of the organic linker of
ZIF-8 was found to play an important role in the CO2 adsorption mechanism. Chapter 4
compares different pressure behavior among four MIL-68 (In) systems: the as-made MIL-
68 (In), the activated framework, the activated sample loaded with nujol and the CO2-
loaded framework. Furthermore, the CO2 adsorption mechanism and the host-guest
interactions are studied through in-situ IR spectroscopy as well as Grand Canonical Monte
27
Carlo simulations. Chapter 5 describes the interplay between CO2 and the α-Mg3(HCOO)6
framework, which undergoes a reversible amorphization upon compression. In Chapter 6,
the stability and CO2 storage in MOF CaSDB under high-pressure are investigated by in
situ IR and Raman spectroscopy. The CaSDB framework shows a remarkable affinity
towards CO2 and an enhanced CO2-metal interaction is found as evidenced by far-IR
measurements. As guest molecules, CO2 substantially influences the structure of CaSDB
and triggers a crystal-to-crystal phase transition of the framework at high pressures.
Chapter 7 is the final chapter, in which a brief summary of the thesis and some suggestions
for future work are provided.
1.5 Reference
(1) Li, H.; Eddaoudi, M.; O'Keeffe, M.; Yaghi, O. M. Nature 1999, 402, 276.
(2) Eddaoudi, M.; Kim, J.; Rosi, N.; Vodak, D.; Wachter, J.; O'Keeffe, M.; Yaghi, O. M.
Science 2002, 295, 469.
(3) Garibay, S. J.; Cohen, S. M. Chemical Communications 2010, 46, 7700.
(4) Cavka, J. H.; Jakobsen, S.; Olsbye, U.; Guillou, N.; Lamberti, C.; Bordiga, S.; Lillerud, K.
P. Journal of the American Chemical Society 2008, 130, 13850.
(5) Biswas, S.; Ahnfeldt, T.; Stock, N. Inorganic Chemistry 2011, 50, 9518.
(6) Serre, C.; Millange, F.; Thouvenot, C.; Noguès, M.; Marsolier, G.; Louër, D.; Férey, G.
Journal of the American Chemical Society 2002, 124, 13519.
(7) Lin, X.; Telepeni, I.; Blake, A. J.; Dailly, A.; Brown, C. M.; Simmons, J. M.; Zoppi, M.;
Walker, G. S.; Thomas, K. M.; Mays, T. J.; Hubberstey, P.; Champness, N. R.; Schröder,
M. Journal of the American Chemical Society 2009, 131, 2159.
(8) Furukawa, H.; Cordova, K. E.; O’Keeffe, M.; Yaghi, O. M. Science 2013, 341, 1230444.
(9) He, Y.; Zhou, W.; Qian, G.; Chen, B. Chemical Society Reviews 2014, 43, 5657.
(10) Sumida, K.; Rogow, D. L.; Mason, J. A.; McDonald, T. M.; Bloch, E. D.; Herm, Z. R.;
Bae, T. H.; Long, J. R. Chemical Reviews 2012, 112, 724.
28
(11) Suh, M. P.; Park, H. J.; Prasad, T. K.; Lim, D.-W. Chemical Reviews 2012, 112, 782.
(12) Li, J.-R.; Sculley, J.; Zhou, H.-C. Chemical Reviews 2012, 112, 869.
(13) Ranocchiari, M.; Bokhoven, J. A. v. Physical Chemistry Chemical Physics 2011, 13, 6388.
(14) Horcajada, P.; Gref, R.; Baati, T.; Allan, P. K.; Maurin, G.; Couvreur, P.; Férey, G.; Morris,
R. E.; Serre, C. Chemical Reviews 2012, 112, 1232.
(15) Kreno, L. E.; Leong, K.; Farha, O. K.; Allendorf, M.; Van Duyne, R. P.; Hupp, J. T.
Chemical Reviews 2012, 112, 1105.
(16) Rochelle, G. T. Science 2009, 325, 1652.
(17) Blanchon le Bouhelec, E.; Mougin, P.; Barreau, A.; Solimando, R. Energy & Fuels 2007,
21, 2044.
(18) Ghoufi, A.; Gaberova, L.; Rouquerol, J.; Vincent, D.; Llewellyn, P. L.; Maurin, G.
Microporous and Mesoporous Materials 2009, 119, 117.
(19) Himeno, S.; Tomita, T.; Suzuki, K.; Yoshida, S. Microporous and Mesoporous Materials
2007, 98, 62.
(20) Cavenati, S.; Grande, C. A.; Rodrigues, A. E. Chemical Engineering Science 2006, 61,
3893.
(21) Cavenati, S.; Grande, C. A.; Rodrigues, A. E. Journal of Chemical & Engineering Data
2004, 49, 1095.
(22) Kusakabe, K.; Kuroda, T.; Murata, A.; Morooka, S. Industrial & Engineering Chemistry
Research 1997, 36, 649.
(23) Bezerra, D.; Oliveira, R.; Vieira, R.; Cavalcante, C., Jr.; Azevedo, D. S. Adsorption 2011,
17, 235.
(24) Dogru, M.; Sonnauer, A.; Gavryushin, A.; Knochel, P.; Bein, T. Chemical
Communications 2011, 47, 1707.
(25) Choi, Y. J.; Choi, J. H.; Choi, K. M.; Kang, J. K. Journal of Material Chemistry 2011, 21,
1073.
(26) El-Kaderi, H. M.; Hunt, J. R.; Mendoza-Cortés, J. L.; Côté, A. P.; Taylor, R. E.; O'Keeffe,
M.; Yaghi, O. M. Science 2007, 316, 268.
(27) Côté, A. P.; El-Kaderi, H. M.; Furukawa, H.; Hunt, J. R.; Yaghi, O. M. Journal of the
American Chemical Society 2007, 129, 12914.
(28) Hicks, J. C.; Drese, J. H.; Fauth, D. J.; Gray, M. L.; Qi, G.; Jones, C. W. Journal of the
American Chemical Society 2008, 130, 2902.
(29) Xu, X.; Song, C.; Andrésen, J. M.; Miller, B. G.; Scaroni, A. W. Microporous and
Mesoporous Materials 2003, 62, 29.
29
(30) Chae, H. K.; Siberio-Perez, D. Y.; Kim, J.; Go, Y.; Eddaoudi, M.; Matzger, A. J.; O'Keeffe,
M.; Yaghi, O. M. Nature 2004, 427, 523.
(31) Millward, A. R.; Yaghi, O. M. Journal of the American Chemical Society 2005, 127, 17998.
(32) Arstad, B.; Fjellvåg, H.; Kongshaug, K.; Swang, O.; Blom, R. Adsorption 2008, 14, 755.
(33) Zeleňák, V.; Vargová, Z.; Almáši, M.; Zeleňáková, A.; Kuchár, J. Microporous and
Mesoporous Materials 2010, 129, 354.
(34) Beobide, G.; Wang, W.-g.; Castillo, O.; Luque, A.; Román, P.; Tagliabue, G.; Galli, S.;
Navarro, J. A. R. Inorganic Chemistry 2008, 47, 5267.
(35) Vaidhyanathan, R.; Iremonger, S. S.; Dawson, K. W.; Shimizu, G. K. H. Chemical
Communications 2009, 35, 5230.
(36) Demessence, A.; D’Alessandro, D. M.; Foo, M. L.; Long, J. R. Journal of the American
Chemical Society 2009, 131, 8784.
(37) McDonald, T. M.; D'Alessandro, D. M.; Krishna, R.; Long, J. R. Chemical Science 2011,
2, 2022.
(38) Phan, A.; Doonan, C. J.; Uribe-Romo, F. J.; Knobler, C. B.; O’Keeffe, M.; Yaghi, O. M.
Accounts of Chemical Research 2010, 43, 58.
(39) Furukawa, H.; Kim, J.; Ockwig, N. W.; O’Keeffe, M.; Yaghi, O. M. Journal of the
American Chemical Society 2008, 130, 11650.
(40) Park, H. J.; Suh, M. P. Chemical Communications 2010, 46, 610.
(41) Kim, T. K.; Suh, M. P. Chemical Communications 2011, 47, 4258.
(42) Banerjee, R.; Furukawa, H.; Britt, D.; Knobler, C.; O’Keeffe, M.; Yaghi, O. M. Journal of
the American Chemical Society 2009, 131, 3875.
(43) Morris, W.; Leung, B.; Furukawa, H.; Yaghi, O. K.; He, N.; Hayashi, H.; Houndonougbo,
Y.; Asta, M.; Laird, B. B.; Yaghi, O. M. Journal of the American Chemical Society 2010,
132, 11006.
(44) Thallapally, P. K.; Tian, J.; Radha Kishan, M.; Fernandez, C. A.; Dalgarno, S. J.; McGrail,
P. B.; Warren, J. E.; Atwood, J. L. Journal of the American Chemical Society 2008, 130,
16842.
(45) Fernandez, C. A.; Thallapally, P. K.; Motkuri, R. K.; Nune, S. K.; Sumrak, J. C.; Tian, J.;
Liu, J. Crystal Growth & Design 2010, 10, 1037.
(46) Inubushi, Y.; Horike, S.; Fukushima, T.; Akiyama, G.; Matsuda, R.; Kitagawa, S. Chemical
Communications 2010, 46, 9229.
(47) Liang, J.; Shimizu, G. K. H. Inorganic Chemistry 2007, 46, 10449.
30
(48) Chui, S. S.-Y.; Lo, S. M.-F.; Charmant, J. P. H.; Orpen, A. G.; Williams, I. D. Science
1999, 283, 1148.
(49) Vimont, A.; Goupil, J.-M.; Lavalley, J.-C.; Daturi, M.; Surblé, S.; Serre, C.; Millange, F.;
Férey, G.; Audebrand, N. Journal of the American Chemical Society 2006, 128, 3218.
(50) Dincă, M.; Long, J. R. Angewandte Chemie International Edition 2008, 47, 6766.
(51) Zhou, W.; Wu, H.; Yildirim, T. Journal of the American Chemical Society 2008, 130,
15268.
(52) Dietzel, P. D. C.; Besikiotis, V.; Blom, R. Journal of Materials Chemistry 2009, 19, 7362.
(53) Chen, B.; Xiang, S.; Qian, G. Accounts of Chemical Research 2010, 43, 1115.
(54) Caskey, S. R.; Wong-Foy, A. G.; Matzger, A. J. Journal of the American Chemical Society
2008, 130, 10870.
(55) Weir, C. E. L., E. R.; Valkenburg, A. V.; Bunting, E. N. Journal of Research of the
National Bureau of Standards, Section A: Physics and Chemistry 1959, 63, 55.
(56) Hemley, R. J. Annual Review of Physical Chemistry 2000, 51, 763.
(57) Grochala, W.; Hoffmann, R.; Feng, J.; Ashcroft, N. W. Angewandte Chemie International
Edition 2007, 46, 3620.
(58) Jayaraman, A. Reviews of Modern Physics 1983, 55, 65.
(59) Jeanloz, R. Annual Review of Physical Chemistry 1989, 40, 237.
(60) Tapper, R. J. Reports on Progress in Physics 2000, 63, 1273.
(61) MAO, H. K. Science 1978, 200, 1145.
(62) XU, J. A.; MAO, H. K.; BELL, P. M. Science 1986, 232, 1404.
(63) Mao, H. K.; Xu, J.; Bell, P. M. Journal of Geophysical Research: Solid Earth 1986, 91,
4673.
(64) Ferraro, J. R.; Nakamoto, K.; Brown, C. W. Introductory Raman Spectroscopy (Second
Edition) 2003, Academic Press, San Diego.
(65) Dong, Z. H.; Song, Y. Journal of Physical Chemistry C 2010, 114, 1782.
(66) Dong, Z. H., Ph.D. Thesis 2012.
(67) Hemley, R. J. M., H. K.; Struzhkin, V. V. Journal of Synchrotron Radiation 2005, 12, 135.
(68) Giordano, V. M.; Gorelli, F. A.; Bini, R.; Low Temperature Physics, 2006, 32, 1402.
(69) Aoki, K.; Yamawaki, H.; Sakashita, M. Physical Review B 1993, 48, 9231.
31
(70) Olijnyk, H.; Däufer, H.; Jodl, H.J.; Hochheimer, H. D. The Journal of Chemical Physics
1988, 88, 4204.
(71) Coudert, F.-X. Chemistry of Materials 2015, 27, 1905.
(72) Gatta, G. D. In High-Pressure Crystallography: From Fundamental Phenomena to
Technological Applications; Boldyreva, E., Dera, P., Eds.; Springer: Dordrecht, 2010, 481.
(73) Greaves, G. N.; Meneau, F.; Kargl, F.; Ward, D.; Holliman, P.; Albergamo, F. Journal of
Physics: Condensed Matter 2007, 19, 415102.
(74) Greaves, G. N. Compressibility, pressure-induced amorphisation and thermal collapse of
zeolites; Springer: Dordrecht, 2001, 48, 53.
(75) Su, Z.; Miao, Y.-R.; Mao, S.-M.; Zhang, G.-H.; Dillon, S.; Miller, J. T.; Suslick, K. S.
Journal of the American Chemical Society 2015, 137, 1750.
(76) Bennett, T. D.; Sotelo, J.; Tan, J.-C.; Moggach, S. A. CrystEngComm 2015, 17, 286.
(77) Tan, J. C.; Bennett, T. D.; Cheetham, A. K. Proceedings of the National Academy of
Sciences 2010, 107, 9938.
(78) Bennett, T. D.; Tan, J. C.; Moggach, S. A.; Galvelis, R.; Mellot-Draznieks, C.; Reisner, B.
A.; Thirumurugan, A.; Allan, D. R.; Cheetham, A. K. Chemistry - A European Journal
2010, 16, 10684.
(79) Tan, J. C.; Furman, J. D.; Cheetham, A. K. Journal of the American Chemical Society 2009,
131, 14252.
(80) Tan, J. C.; Cheetham, A. K. Chemical Society Reviews 2011, 40, 1059.
(81) Ogborn, J. M.; Collings, I. E.; Moggach, S. A.; Thompson, A. L.; Goodwin, A. L. Chemical
Science 2012, 3, 3011.
(82) Li, W.; Probert, M. R.; Kosa, M.; Bennett, T. D.; Thirumurugan, A.; Burwood, R. P.;
Parinello, M.; Howard, J. A. K.; Cheetham, A. K. Journal of the American Chemical
Society 2012, 134, 11940.
(83) Cai, W.; Katrusiak, A. Nature communications 2014, 5, 4337.
(84) Serra-Crespo, P.; Dikhtiarenko, A.; Stavitski, E.; Juan-Alcaniz, J.; Kapteijn, F.; Coudert,
F.-X.; Gascon, J. CrystEngComm 2015, 17, 276.
(85) Ortiz, A. U.; Boutin, A.; Fuchs, A. H.; Coudert, F.-X. Physical Review Letters 2012, 109,
195502.
(86) Ortiz, A. U.; Boutin, A.; Fuchs, A. H.; Coudert, F.-X. The Journal of Physical Chemistry
Letters 2013, 4, 1861.
(87) Chapman, K. W.; Halder, G. J.; Chupas, P. J. Journal of the American Chemical Society
2009, 131, 17546.
32
(88) Cao, S.; Bennett, T. D.; Keen, D. A.; Goodwin, A. L.; Cheetham, A. K. Chemical
Communications 2012, 48, 7805.
(89) Bennett, T. D.; Simoncic, P.; Moggach, S. A.; Gozzo, F.; Macchi, P.; Keen, D. A.; Tan, J.-
C.; Cheetham, A. K. Chemical Communications 2011, 47, 7983.
(90) Bouëssel du Bourg, L.; Ortiz, A. U.; Boutin, A.; Coudert, F.-X. APL Materials 2014, 2,
124110.
(91) Lapidus, S. H.; Halder, G. J.; Chupas, P. J.; Chapman, K. W. Journal of the American
Chemical Society 2013, 135, 7621.
(92) Beurroies, I.; Boulhout, M.; Llewellyn, P. L.; Kuchta, B.; Férey, G.; Serre, C.; Denoyel, R.
Angewandte Chemie International Edition 2010, 49, 7526.
(93) Neimark, A. V.; Coudert, F.-X.; Triguero, C.; Boutin, A.; Fuchs, A. H.; Beurroies, I.;
Denoyel, R. Langmuir 2011, 27, 4734.
(94) Yot, P. G.; Ma, Q.; Haines, J.; Yang, Q.; Ghoufi, A.; Devic, T.; Serre, C.; Dmitriev, V.;
Ferey, G.; Zhong, C.; Maurin, G. Chemical Science 2012, 3, 1100.
(95) Zhou, M.; Wang, K.; Men, Z.; Sun, C.; Li, Z.; Liu, B.; Zou, G.; Zou, B. CrystEngComm
2014, 16, 4084.
(96) Spencer, E. C.; Kiran, M. S. R. N.; Li, W.; Ramamurty, U.; Ross, N. L.; Cheetham, A. K.
Angewandte Chemie International Edition 2014, 53, 5583.
(97) Gagnon, K. J.; Beavers, C. M.; Clearfield, A. Journal of the American Chemical Society
2013, 135, 1252.
(98) Ortiz, A. U.; Boutin, A.; Gagnon, K. J.; Clearfield, A.; Coudert, F.-X. Journal of the
American Chemical Society 2014, 136, 11540.
(99) Chapman, K. W.; Halder, G. J.; Chupas, P. J. Journal of the American Chemical Society
2008, 130, 10524.
(100) Moggach, S. A.; Bennett, T. D.; Cheetham, A. K. Angewandte Chemie International
Edition 2009, 48, 7087.
(101) Hu, Y.; Liu, Z.; Xu, J.; Huang, Y.; Song, Y. Journal of the American Chemical Society
2013, 135, 9287.
(102) Graham, A. J.; Tan, J.-C.; Allan, D. R.; Moggach, S. A. Chemical Communications 2012,
48, 1535.
(103) Graham, A. J.; Allan, D. R.; Muszkiewicz, A.; Morrison, C. A.; Moggach, S. A.
Angewandte Chemie International Edition 2011, 50, 11138.
(104) Chapman, K. W.; Sava, D. F.; Halder, G. J.; Chupas, P. J.; Nenoff, T. M. Journal of the
American Chemical Society 2011, 133, 18583.
33
(105) Graham, A. J.; Banu, A.-M.; Duren, T.; Greenaway, A.; McKellar, S. C.; Mowat, J. P. S.;
Ward, K.; Wright, P. A.; Moggach, S. A. Journal of the American Chemical Society 2014,
136, 8606.
(106) Coasne, B.; Haines, J.; Levelut, C.; Cambon, O.; Santoro, M.; Gorelli, F.; Garbarino, G.
Physical Chemistry Chemical Physics 2011, 13, 20096.
(107) Haines, J.; Cambon, O.; Levelut, C.; Santoro, M.; Gorelli, F.; Garbarino, G. Journal of the
American Chemical Society 2010, 132, 8860.
34
Chapter 2
2 In Situ High Pressure Study of ZIF-8 by IR Spectroscopy*
2.1 Introduction
ZIFs, short for zeolitic imidazolate frameworks, are an emerging class of porous
materials with extended 3D crystalline structures constructed from tetrahedral metal ions
(Zn, Co, In, etc.) bridged by imidazolate (Im) units. Up to date, a large variety of ZIFs with
rich structural and topological diversity have been made by virtue of the flexibility with
which the metals and links can be varied.1,2 In the ZIF family, ZIF-8 [Zn(MeIm)2, MeIm =
2-methylimidazolate] has been widely studied due to its tunable pore size, chemical
stability and thermal robustness, which make it a promising candidate for gas storage,3
molecular separation,4 catalysis5,6 and so on. The topology of ZIF-8 corresponds to the
zeolite sodalite, which can be described as a space-filling packing of truncated
octahedrons.2 In particular, it crystallizes in a cubic lattice (space group I-43m) that
contains cavities with a diameter of 11.6 Å connected via 6-ring apertures with a 3.5 Å
window and 4-ring apertures (see Fig. 2-1).
* The content of this chapter has been published as: Hu, Y.; Kazemian, H.; Rohani, S.; Huang Y.
and Song, Y. Chemical Communications, 2011, 47, 12694.
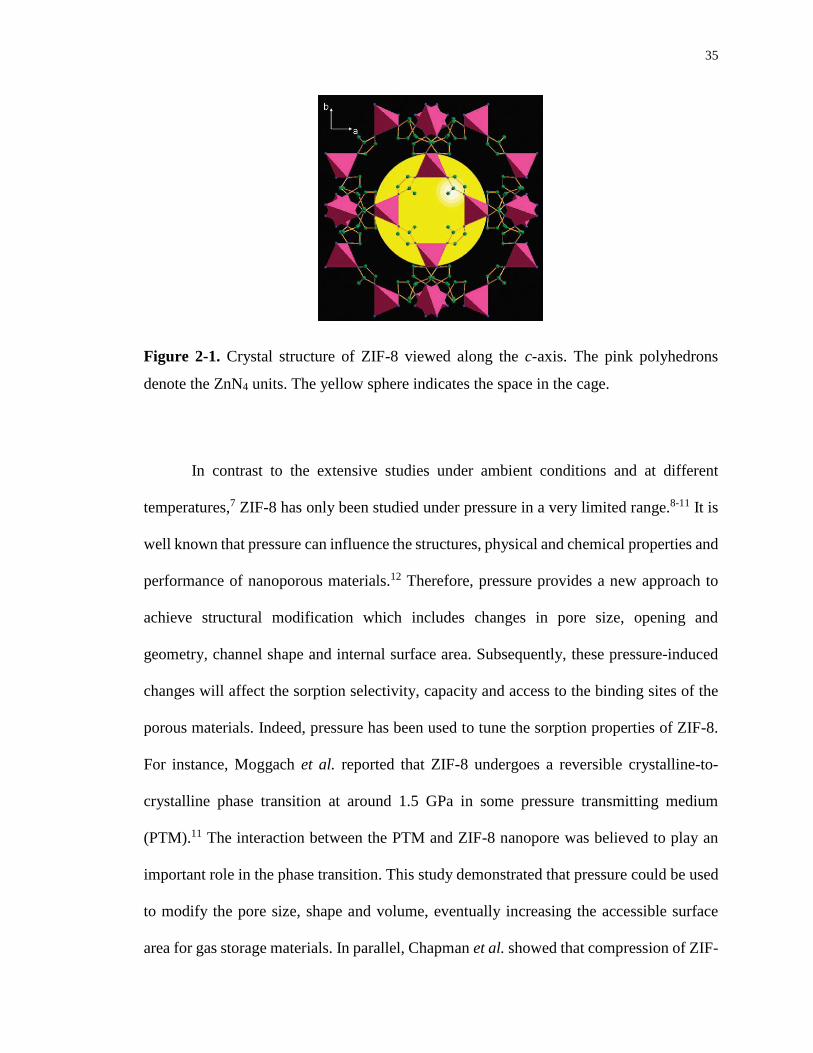
35
Figure 2-1. Crystal structure of ZIF-8 viewed along the c-axis. The pink polyhedrons
denote the ZnN4 units. The yellow sphere indicates the space in the cage.
In contrast to the extensive studies under ambient conditions and at different
temperatures,7 ZIF-8 has only been studied under pressure in a very limited range.8-11 It is
well known that pressure can influence the structures, physical and chemical properties and
performance of nanoporous materials.12 Therefore, pressure provides a new approach to
achieve structural modification which includes changes in pore size, opening and
geometry, channel shape and internal surface area. Subsequently, these pressure-induced
changes will affect the sorption selectivity, capacity and access to the binding sites of the
porous materials. Indeed, pressure has been used to tune the sorption properties of ZIF-8.
For instance, Moggach et al. reported that ZIF-8 undergoes a reversible crystalline-to-
crystalline phase transition at around 1.5 GPa in some pressure transmitting medium
(PTM).11 The interaction between the PTM and ZIF-8 nanopore was believed to play an
important role in the phase transition. This study demonstrated that pressure could be used
to modify the pore size, shape and volume, eventually increasing the accessible surface
area for gas storage materials. In parallel, Chapman et al. showed that compression of ZIF-
36
8 at very low pressures (e.g., 0.34 GPa) resulted in an irreversible structural transition and
amorphization upon recovery to ambient pressure.9 The amorphization behavior was found
to be independent of whether a PTM was used or not. These different results not only
involve guest–host interactions, but may be due to the intrinsic detailed intra-molecular
chemical responses of ZIF-8 to compression. While X-ray diffraction provides information
about structural evolution of the crystal lattice, vibrational spectroscopy allows the
understanding of pressure effects on chemical bonding and especially local structures. Here
we report the first in situ infrared (IR) absorption spectroscopic study of ZIF-8 under high
pressures.
2.2 Experimental section
The ZIF-8 sample was synthesized according to the literature.13 A solution of
Zn(NO3)2·6H2O (2.933 g, 9.87 mmol) in 200 mL of methanol is rapidly poured into a
solution of 2-methylimidazole (6.489 g, 79.04 mmol) in 200 mL of methanol under stirring
with a magnetic bar. The mixture slowly turns turbid and after 1 h the nanocrystals are
separated from the milky dispersion by centrifugation and washing with fresh methanol.
The nanocrystals are dried at 40 °C in air. Yield is 50 % based on zinc. The solvent
molecules can be removed from the as-made sample through thermal activation at 200 °C
for 6 hours. The crystallinity, morphology and porosity of the activated sample were
checked by XRD, SEM and BET, respectively. A diamond anvil cell (DAC) equipped with
type II diamonds with culet sizes of 400 and 600 μm was used to generate high pressures.
The pure desolvated samples were loaded into the DAC without KBr or any other fluid
PTM to rule out the possible guest–host interactions. The samples were 150–200 μm in
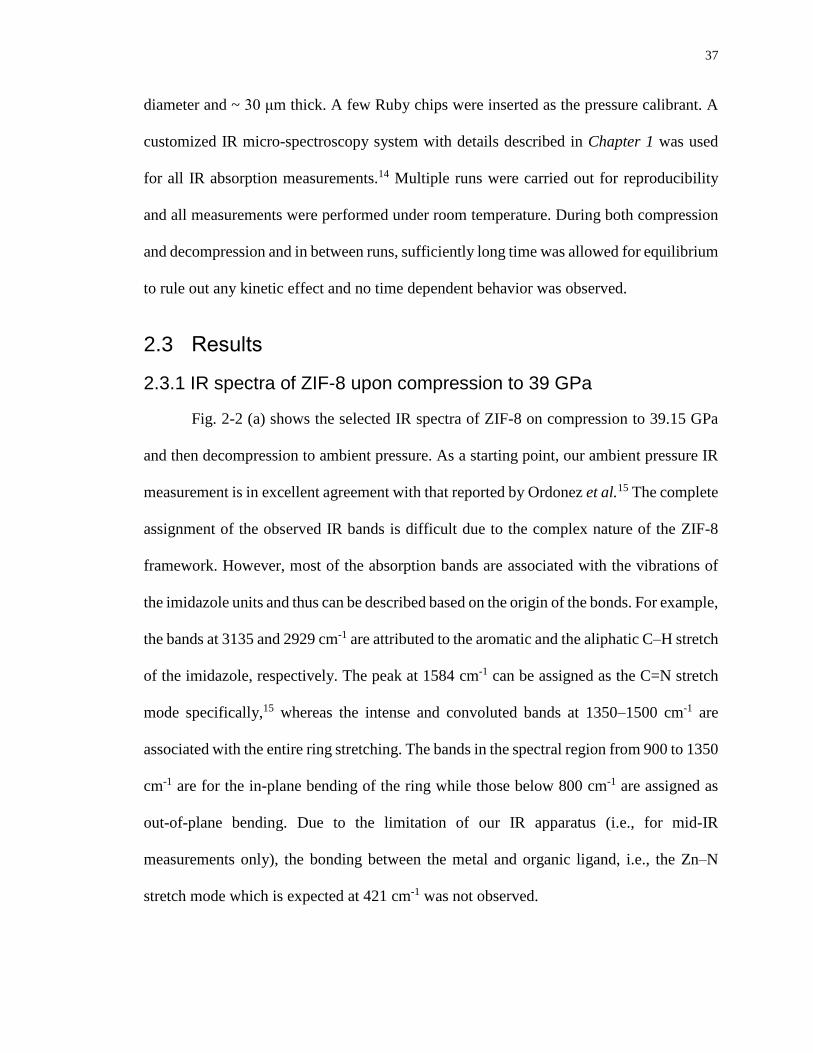
37
diameter and ~ 30 μm thick. A few Ruby chips were inserted as the pressure calibrant. A
customized IR micro-spectroscopy system with details described in Chapter 1 was used
for all IR absorption measurements.14 Multiple runs were carried out for reproducibility
and all measurements were performed under room temperature. During both compression
and decompression and in between runs, sufficiently long time was allowed for equilibrium
to rule out any kinetic effect and no time dependent behavior was observed.
2.3 Results
2.3.1 IR spectra of ZIF-8 upon compression to 39 GPa
Fig. 2-2 (a) shows the selected IR spectra of ZIF-8 on compression to 39.15 GPa
and then decompression to ambient pressure. As a starting point, our ambient pressure IR
measurement is in excellent agreement with that reported by Ordonez et al.15 The complete
assignment of the observed IR bands is difficult due to the complex nature of the ZIF-8
framework. However, most of the absorption bands are associated with the vibrations of
the imidazole units and thus can be described based on the origin of the bonds. For example,
the bands at 3135 and 2929 cm-1 are attributed to the aromatic and the aliphatic C–H stretch
of the imidazole, respectively. The peak at 1584 cm-1 can be assigned as the C=N stretch
mode specifically,15 whereas the intense and convoluted bands at 1350–1500 cm-1 are
associated with the entire ring stretching. The bands in the spectral region from 900 to 1350
cm-1 are for the in-plane bending of the ring while those below 800 cm-1 are assigned as
out-of-plane bending. Due to the limitation of our IR apparatus (i.e., for mid-IR
measurements only), the bonding between the metal and organic ligand, i.e., the Zn–N
stretch mode which is expected at 421 cm-1 was not observed.
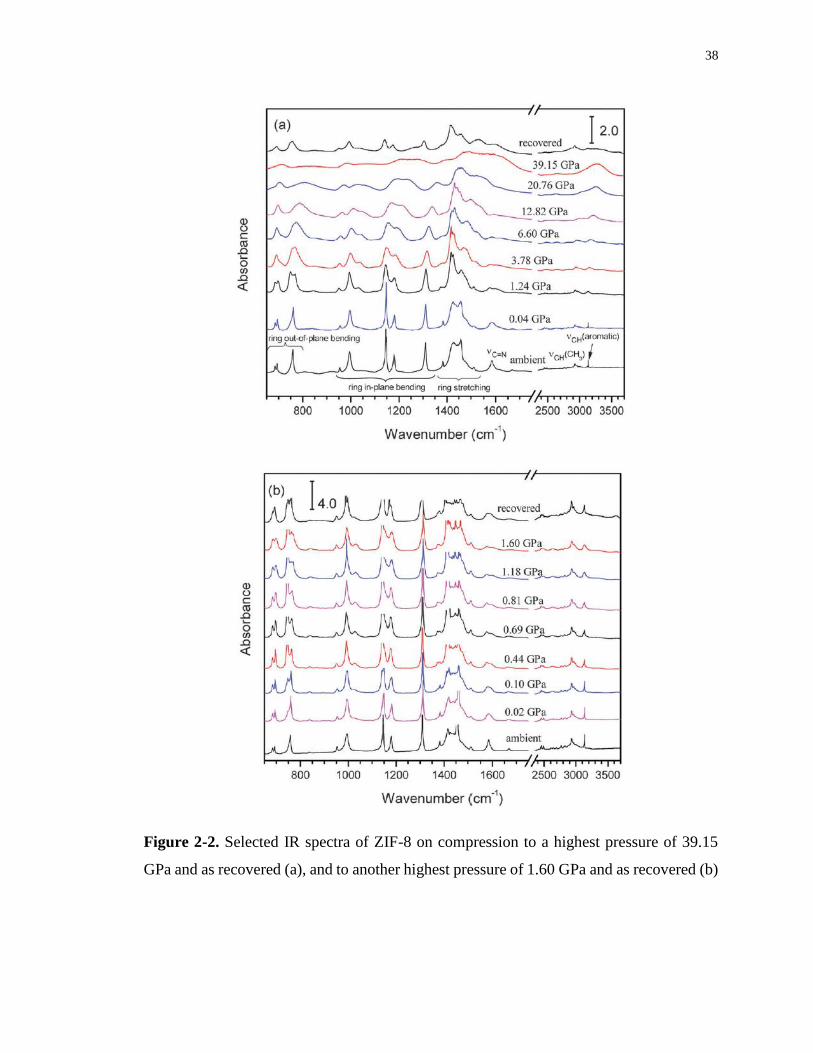
38
Figure 2-2. Selected IR spectra of ZIF-8 on compression to a highest pressure of 39.15
GPa and as recovered (a), and to another highest pressure of 1.60 GPa and as recovered (b)
39
Upon compression to 1.24 GPa, most of the IR absorption bands exhibited
significant changes. For example, the aromatic C–H stretch mode at 3135 cm-1, the C=N
stretch mode at 1584 cm-1, and an out-of-plane bending mode at 760 cm-1 were all
broadened and split. Band splitting typically suggests enhanced intermolecular
interactions, in this case, the ring-ring interaction of the ZIF-8 framework within the unit
cell. Other changes include the significant enhancement of one of the ring stretch modes at
1420 cm-1 and the appearance of a new IR band at 1031 cm-1. Further compression resulted
in continuous broadening accompanied by mode merging. At the highest pressure of 39.15
GPa, the IR profile can be characterized by an extremely broadened pattern, indicating the
transformation to disordered or amorphous structure, in accord with Chapman et al.’s
observation above 0.3 GPa.9 Then the IR spectra of ZIF-8 were collected upon
decompression all the way back to ambient pressure. The pressure evolutions were
observed in the reverse sequence as expected. Upon complete decompression, however,
the spectrum of the recovered sample only resembles that at around 4 GPa instead of the
initial ambient-pressure spectrum before compression especially in the ring stretch region
as as well the C=N and the C–H stretch regions, indicating that the framework has been
partially modified. Nonetheless, all other major IR bands of the recovered sample are still
characteristic of the imidazole ring, indicating that the entire ZIF-8 framework has survived
a compression pressure of 39.15 GPa without a permanent breakdown although the local
structures might have been modified.
40
2.3.2 IR spectra of ZIF-8 upon compression to 1.6 GPa
We then focused on a lower and narrower pressure region where the modification
might be completely reversible. Fig. 2-2 (b) shows the selected IR spectra of ZIF-8 on
compression to a highest pressure of 1.60 GPa followed by decompression. In this pressure
region, although pressure-induced band broadening was also observed, there was no
significant change of the entire IR profile in general, except that an out-of-plane bending
mode (band 3) exhibited a splitting at 0.1 GPa. The recovered material exhibited a very
similar profile to, but not exactly the same as the original sample, in strong contrast to that
compressed to 39.15 GPa. In particular, the C=N stretch mode and both the aromatic and
the aliphatic C–H stretch modes were clearly recovered. These observations suggest that
the structural modifications of ZIF-8 were mostly reversible in the lower pressure region
in which the crystallinity and framework structure are highly preserved, consistent with the
structure and reversibility of the phase below 1.47 GPa reported by Moggach et al.11 using
X-ray methods.
2.4 Discussion
The above two runs established that different highest compression pressures
resulted in different reversibilities. Thus we monitored the pressure dependence of IR
modes of ZIF-8 in the respective two compression regions, i.e., 0–1.6 GPa and 2–14 GPa,
as shown in Fig. 2-3. The pressure coefficients were analyzed by least-square fitting of the
experimental data and are reported in Table 2-1. In general, the pressure coefficients are
extremely small in magnitude (i.e., < 5 cm-1/GPa), indicating that the bond strength is not
very sensitive to compression in a broad pressure region. In the pressure region of > 2 GPa,
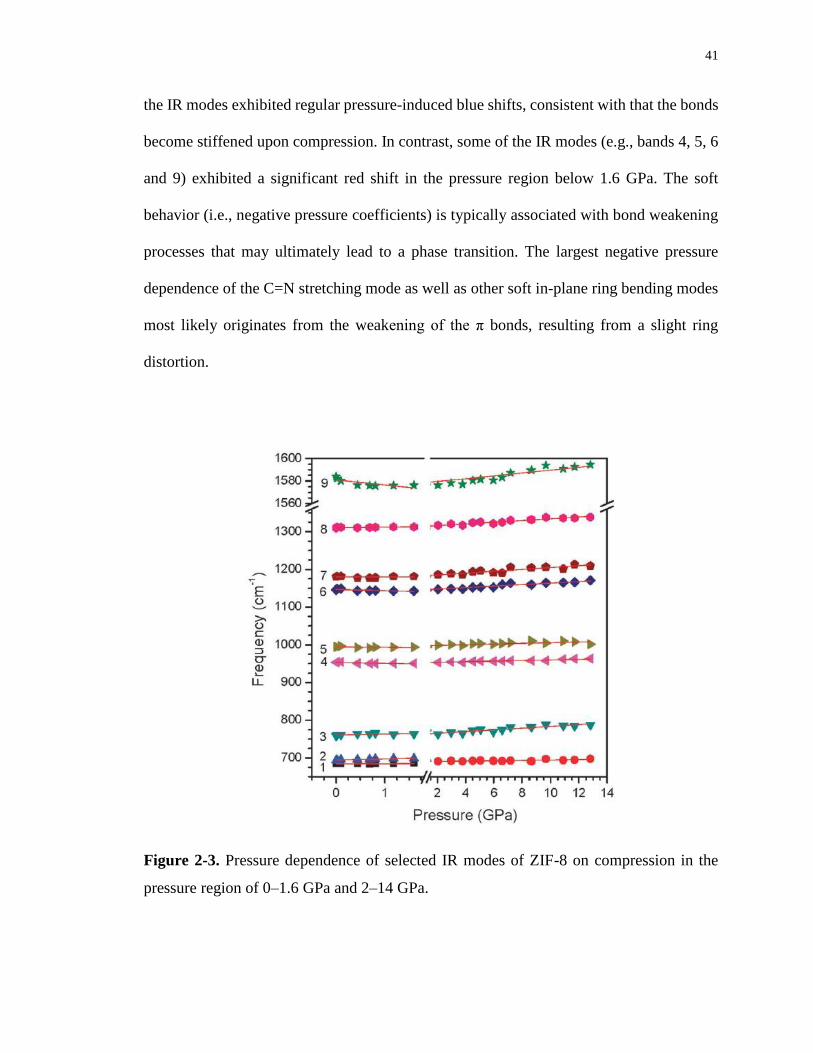
41
the IR modes exhibited regular pressure-induced blue shifts, consistent with that the bonds
become stiffened upon compression. In contrast, some of the IR modes (e.g., bands 4, 5, 6
and 9) exhibited a significant red shift in the pressure region below 1.6 GPa. The soft
behavior (i.e., negative pressure coefficients) is typically associated with bond weakening
processes that may ultimately lead to a phase transition. The largest negative pressure
dependence of the C=N stretching mode as well as other soft in-plane ring bending modes
most likely originates from the weakening of the π bonds, resulting from a slight ring
distortion.
Figure 2-3. Pressure dependence of selected IR modes of ZIF-8 on compression in the
pressure region of 0–1.6 GPa and 2–14 GPa.
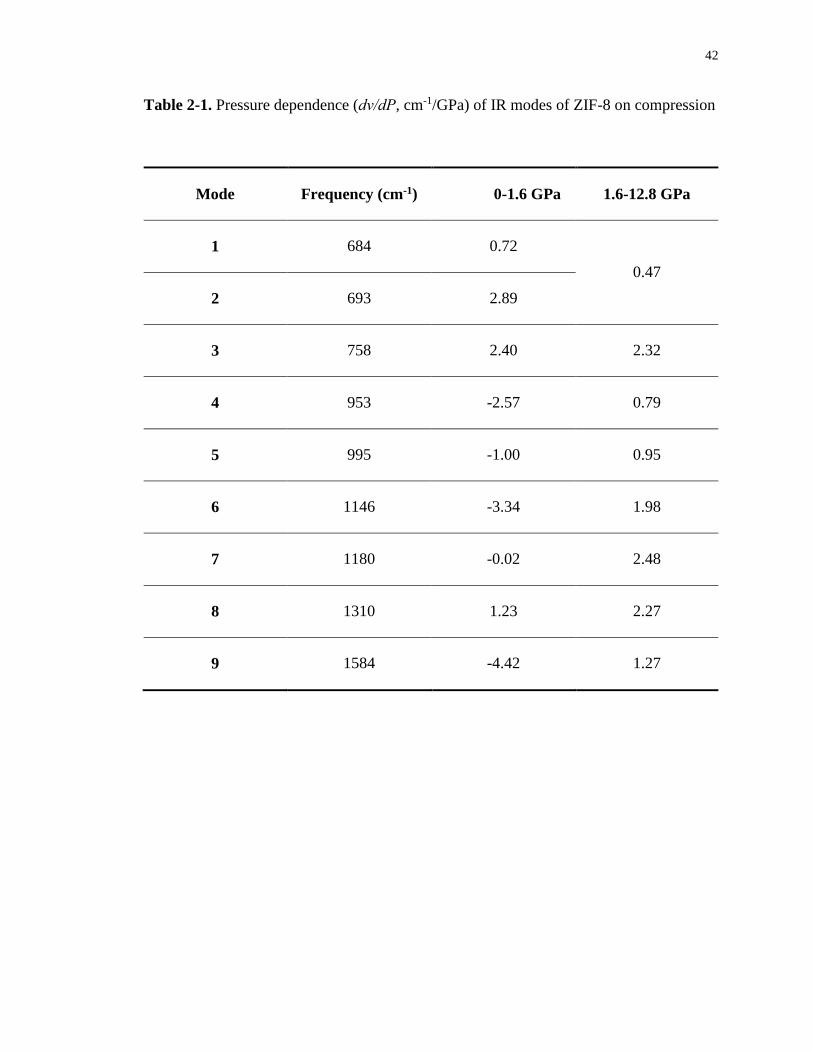
42
Table 2-1. Pressure dependence (dν/dP, cm-1/GPa) of IR modes of ZIF-8 on compression
Mode Frequency (cm-1) 0-1.6 GPa 1.6-12.8 GPa
1 684 0.72
0.47
2 693 2.89
3 758 2.40 2.32
4 953 -2.57 0.79
5 995 -1.00 0.95
6 1146 -3.34 1.98
7 1180 -0.02 2.48
8 1310 1.23 2.27
9 1584 -4.42 1.27
43
Finally, when combined with previous X-ray studies of high-pressure behavior, our
results provide interesting implications about the stabilities of ZIF-8 and thus its potential
applications. First of all, all the high-pressure studies so far suggest that the lattice
stabilities were greatly reduced without a penetrating PTM. However, the chemical
stability probed by the current IR study seems independent of the crystalline state and
surprisingly high compared to isolated aromatic systems that typically break down at even
very moderate pressures.16 This property makes ZIF-8 a promising storage material for
applications that require extreme loading pressures. Furthermore, the pressure effect on the
pore size of ZIF-8 is of great interest for its storage capacity. Moggach et al. showed that
the pore size of ZIF-8 can be enlarged with the incorporation of the PTM molecules by free
rotation of the imidazole rings, whereas Chapman et al. reported a monotonic decrease in
unit cell volume upon compression. Our IR results in the pressure region of < 1.6 GPa,
however, suggest that even without a PTM, the pore size may remain constant with enough
rigidity despite the ring weakening upon compression. Even in the amorphous phase, the
small pressure coefficients nonetheless suggest that the nanopores are not sensitive to and
may survive extreme compressions. This is especially desirable to extend the storage
applications of ZIF-8 to much broader physical conditions.
2.5 Conclusions
In summary, we obtained the first in situ IR spectra of ZIF-8 under high pressures
up to ~ 39 GPa. Upon compression to 1.6 GPa followed by decompression, the pressure
effects on the ZIF-8 framework were found to be reversible. Further compression to higher
pressures resulted in irreversible structural transitions to a disordered or amorphous phase.
44
However, the chemical structure of the framework was found to sustain extreme
compression without breaking down. The compression behavior and especially the
surprising chemical stability probed by in situ IR spectroscopy provide new insight into
the storage applications of ZIF-8.
2.6 References
(1) Park, K. S.; Ni, Z.; Cote, A. P.; Choi, J. Y.; Huang, R. D.; Uribe-Romo, F. J.; Chae, H. K.;
O'Keeffe, M.; Yaghi, O. M. Proceedings of the National Academy of Sciences of the United
States of America 2006, 103, 10186.
(2) Phan, A.; Doonan, C. J.; Uribe-Romo, F. J.; Knobler, C. B.; O'Keeffe, M.; Yaghi, O. M.
Accounts of Chemical Research 2010, 43, 58.
(3) Morris, R. E.; Wheatley, P. S. Angewandte Chemie International Edition 2008, 47, 4966.
(4) Li, K.; Olson, D. H.; Seidel, J.; Emge, T. J.; Gong, H.; Zeng, H.; Li, J. Journal of the
American Chemical Society 2009, 131, 10368.
(5) Jiang, H.-L.; Liu, B.; Akita, T.; Haruta, M.; Sakurai, H.; Xu, Q. Journal of the American
Chemical Society 2009, 131, 11302.
(6) Tran, U. P. N.; Le, K. K. A.; Phan, N. T. S. ACS Catalysis 2011, 1, 120.
(7) Zhou, W.; Wu, H.; Udovic, T. J.; Rush, J. J.; Yildirim, T. The Journal of Physical
Chemistry A 2008, 112, 12602.
(8) Bennett, T. D.; Tan, J. C.; Moggach, S. A.; Galvelis, R.; Mellot-Draznieks, C.; Reisner, B.
A.; Thirumurugan, A.; Allan, D. R.; Cheetham, A. K. Chemistry-A European Journal 2010,
16, 10684.
(9) Chapman, K. W.; Halder, G. J.; Chupas, P. J. Journal of the American Chemical Society
2009, 131, 17546.
(10) Fairen-Jimenez, D.; Moggach, S. A.; Wharmby, M. T.; Wright, P. A.; Parsons, S.; Duren,
T. Journal of the American Chemical Society 2011, 133, 8900.
(11) Moggach, S. A.; Bennett, T. D.; Cheetham, A. K. Angewandte Chemie International
Edition 2009, 48, 7087.
(12) Fu, Y. Q.; Song, Y.; Huang, Y. I. Journal of Physical Chemistry C 2012, 116, 2080.
(13) Isimjan, T. T.; Kazemian, H.; Rohani, S.; Ray, A. K. Journal of Material Chemistry 2010,
20, 10241.

45
(14) Dong, Z. H.; Song, Y. Journal of Physical Chemistry C 2010, 114, 1782.
(15) Ordoñez, M. J. C.; Balkus Jr, K. J.; Ferraris, J. P.; Musselman, I. H. Journal of Membrane
Science 2010, 361, 28.
(16) Zhuravlev, K. K.; Traikov, K.; Dong, Z.; Xie, S.; Song, Y.; Liu, Z. Physical Review B 2010,
82, 064116.
46
Chapter 3
3 Evidence of Pressure Enhanced CO2 Storage in ZIF-8 Probed by FTIR Spectroscopy*
3.1 Introduction
Zeolitic imidazolate frameworks (ZIFs) are an emerging class of metal-organic
framework (MOF) materials that could serve as an effective platform for the capture and
storage of CO2 due to their ordered structures, high thermal stability, very high porosity
and adjustable chemical functionality.1-4 In the large ZIF family, ZIF-8 [Zn(MeIm)2, MeIm
= 2-methylimidazolate] is one of the most studied ZIFs featuring a cubic lattice (space
group I-43m) and sodalite (SOD) topology that contains cavities with a diameter of 11.6 Å
connected via 6-ring apertures with a 3.4 Å window and 4-ring apertures.3 Adsorption
studies of various gases (e.g., CO2, CH4 and N2) in ZIF-8 have been documented both
experimentally and theoretically.5-9
Among these studies, it is suggested that the framework stability and flexibility play
an important role in the mechanism and performance of gas adsorptions. Application of
high external pressure (e.g., in the gigapascal range) on the framework far beyond the
practical gas adsorption pressure (e.g., up to 100 bar) may significantly alter the framework
topology and thus the adsorption properties.10-14 For instance, Chapman et al.10 showed
that compression of ZIF-8 to 0.34 GPa either in non-penetrating fluid or without pressure
* The content of this chapter is based on the publication: Hu, Y.; Liu, Z.; Xu, J.; Huang, Y. and
Song, Y. Journal of the American Chemical Society 2013, 135, 9287.
47
transmitting medium (PTM) resulted in an irreversible structural transition and
amorphization. Using in-situ high-pressure single crystal X-ray diffraction, however,
Moggach et al.11 observed a reversible crystalline-to-crystalline phase transition at around
1.5 GPa in some penetrating PTM. Thus the interaction between the PTM and ZIF-8
framework was believed to play an important role in the phase transition and have a
significant influence on the framework stability. While X-ray diffraction was extensively
used in these studies to provide the information about structural evolution of crystal lattice
with pressure, vibrational spectroscopy allows the understanding of local structures,
chemical bonding and, thus the nature of host-guest interaction between the adsorbed
molecules and the framework. Given the facts that kinetic diameter of CO2 (3.3 Å) is
slightly smaller than the size of the hexagonal channels of ZIF-8 (3.4 Å) and that the ZIF-
8 framework has relatively high stability, it should be possible to insert more CO2 into the
framework at pressures of gigapascal range to substantially enhance the storage capacity.
So far no study has addressed the CO2 storage capacity and CO2-ZIF-8 interaction at the
above mentioned pressure range, despite extensive adsorption studies and simulations at
lower pressures. Here, using in-situ FTIR spectroscopy, we investigate the CO2 adsorptive
performance of ZIF-8 and provide the first evidence of the enhanced CO2-framework
interactions at high external pressures.
3.2 Experimental section
The ZIF-8 sample was synthesized according to the literature.15 A diamond anvil
cell (DAC) equipped with type II diamonds with culet sizes of 600 μm was used to generate
high pressures. The pure desolvated ZIF-8 powder samples were loaded into the DAC
48
together with solid CO2 in a cryogenic bath of liquid nitrogen at a temperature below the
melting point of dry ice (i.e., < -78 C) by introducing the pure gaseous CO2. Then the cell
was carefully sealed with minimal possible pressure (e.g., 0.4 GPa) at low temperature
before warming up to room temperature. A customized IR micro-spectroscopic system with
details described in Chapter 1 was used for all mid-IR absorption measurements.16 Far-
Infrared measurements were performed at the U2A beamline at the National Synchrotron
Light Source (NSLS), Brookhaven National Laboratory (BNL).
3.3 Results
3.3.1 IR spectrum of ZIF-8 loaded with CO2 at 0.78 GPa
Figure 3-1b shows the optical image of the loaded sample where transparent areas
are mainly solid CO2 outside the ZIF-8 framework. From top to bottom, representative IR
absorption spectra of pure CO2, ZIF-8 loaded with CO2 and pure ZIF-8 collected at a
similar pressure (~0.8-1 GPa) are shown in Figure 3-1a. The IR spectrum of pure ZIF-8 is
consistent with that previously reported in the literature.13 The two strong absorption bands
at 671 and 2325 cm-1 in the pure CO2 spectrum are attributed to the bending mode (ν2) and
asymmetric stretching mode (ν3), respectively. In addition, two high-frequency bands were
observed at around 3600 and 3700 cm -1, which are well understood as the CO2 combination
modes of ν3 + 2ν2 and ν3 + ν1, respectively, due to the strong Fermi resonance effect.17-20
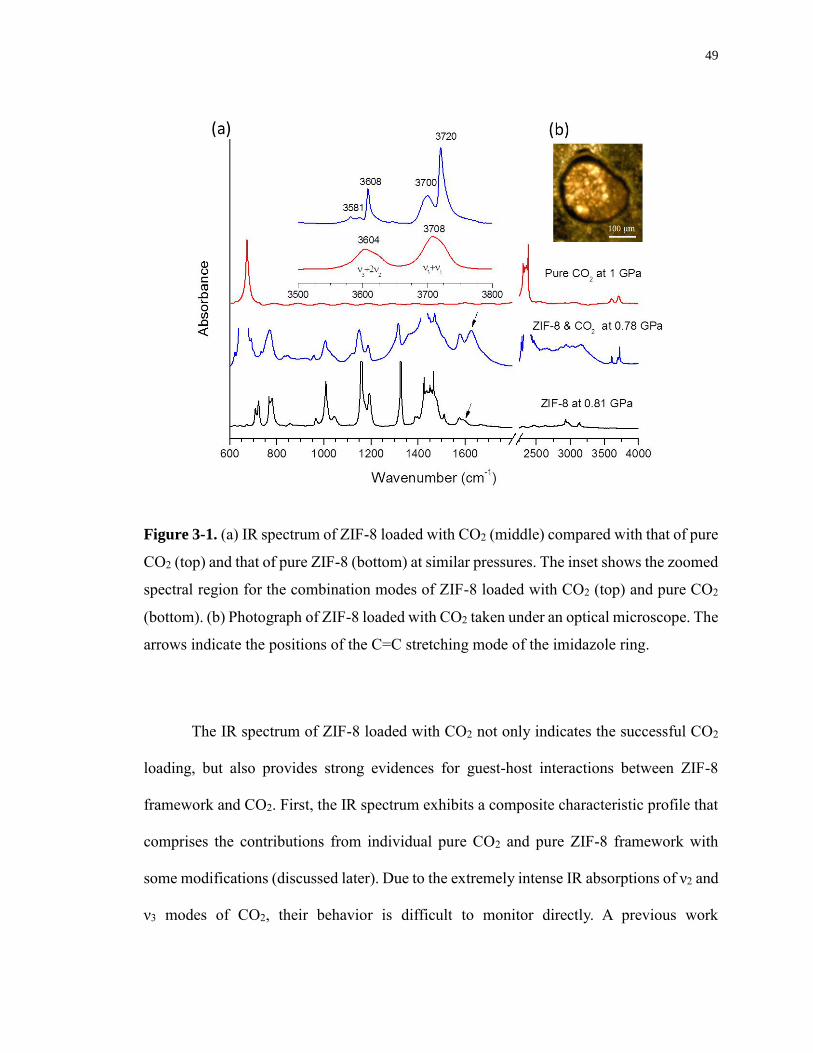
49
Figure 3-1. (a) IR spectrum of ZIF-8 loaded with CO2 (middle) compared with that of pure
CO2 (top) and that of pure ZIF-8 (bottom) at similar pressures. The inset shows the zoomed
spectral region for the combination modes of ZIF-8 loaded with CO2 (top) and pure CO2
(bottom). (b) Photograph of ZIF-8 loaded with CO2 taken under an optical microscope. The
arrows indicate the positions of the C=C stretching mode of the imidazole ring.
The IR spectrum of ZIF-8 loaded with CO2 not only indicates the successful CO2
loading, but also provides strong evidences for guest-host interactions between ZIF-8
framework and CO2. First, the IR spectrum exhibits a composite characteristic profile that
comprises the contributions from individual pure CO2 and pure ZIF-8 framework with
some modifications (discussed later). Due to the extremely intense IR absorptions of ν2 and
ν3 modes of CO2, their behavior is difficult to monitor directly. A previous work
50
demonstrated that the CO2 overtone/combination bands can be used to follow the insertion
of CO2 into the pores of zeolites.21 In the present case, the most striking observation is the
drastically different absorption profile of the overtone/combination bands as shown in
Figure 3-1 inset. Each of these two bands splits into a doublet: the ν3 + ν1 band originally
at 3708 cm-1 displays a doublet at 3700 and 3720 cm-1, while the ν3 + 2ν2 band also splits
into two peaks. For each doublet, the low-frequency component resembles the original
profile of pure CO2, while the high-frequency component is much sharper and intense. The
strongly contrasting intensity and linewidth for the two components for each doublet
indicate that there are two different types of CO2 molecules, i.e. the CO2 outside the ZIF-8
framework and the CO2 included in the pores of the framework. In order to determine the
exact assignments of the doublet, we must understand the pressure behavior of pure CO2
first.
Figure 3-2a shows the evolution of the pure CO2 combination modes as a function
of pressure from 0.33 to 2.23 GPa. It can be seen clearly that upon compression to 0.61
GPa, both of the combination modes of CO2 became much sharper, accompanied with an
increase of intensity. Previous studies revealed that CO2 solidifies at the pressure of 0.6
GPa under room temperature.18 Consequently, the sudden changes of the CO2 combination
modes on compression is due to the phase change of CO2 from liquid to solid. The sharper
and narrower band shape is due to the fact that the solid CO2 is in a highly crystalline phase
(phase I, Pa3),18 which provides homogenous chemical surroundings for the CO2
molecules, in contrast of the fluid CO2. In this case, CO2 was loaded with the sample
initially at 0.47 GPa and room temperature, under which the CO2 was in liquid state. Thus
the ZIF-8 framework was immersed in a liquid bath of CO2, which can diffuse into the
51
pores of the framework. Further compression resulted in the solidification of CO2 outside
the framework, whereas the CO2 trapped inside the framework remained fluid. As a result,
the low-frequency component with similar profile to the overtones of pure liquid CO2 can
be interpreted as a substantial portion of CO2 molecules being inserted into the ZIF-8
framework under the current pressure-temperature conditions. The higher-frequency
component can be assigned as the solid crystalline CO2 outside the framework. This
assignment can be further evidenced by the frequency plots of the ν3 + ν1 modes as a
function of pressure, compared with those of pure CO2 from experiment and solid CO2
from calculation,18 as shown in Figure 3-2b. Clearly, the component with higher frequency
(red square) behaves more like solid CO2 on compression. In addition, in a previous IR
study of CO2 trapped in solid N2 matrix, a similar splitting behavior for the ν3 + ν1
combination mode was reported by McCluskey and Zhuravlev.22 These observations
provide strong evidence that CO2 are trapped and constrained in the SOD cages of ZIF-8
at high pressures.

52
Figure 3-2. (a) IR spectra of pure CO2 in the spectral region of the combination modes
collected on compression. (b) Frequency plots of ν3 + ν1 mode of CO2 as a function of
pressure.
3.3.2 IR spectra of ZIF-8 loaded with CO2 upon compression and decompression
The pressure effects on the CO2 storage in ZIF-8 were further investigated. Figure
3-3 shows the IR absorption spectra of the combination modes of CO2 loaded with ZIF-8
upon compression and decompression. When initially loaded at 0.47 GPa, the IR spectrum
shows a regular profile of pure CO2. When compressed to above 0.78 GPa, a splitting of
the combination modes was observed as the CO2 outside the framework became solid,
whereas the CO2 trapped inside the framework remained fluid. Continuously compressing
to higher pressures (e.g., 2.65 GPa or higher) resulted in the blue shift of all modes (Figures
3-3a). However, the splitting of the combination modes can be observed in the entire
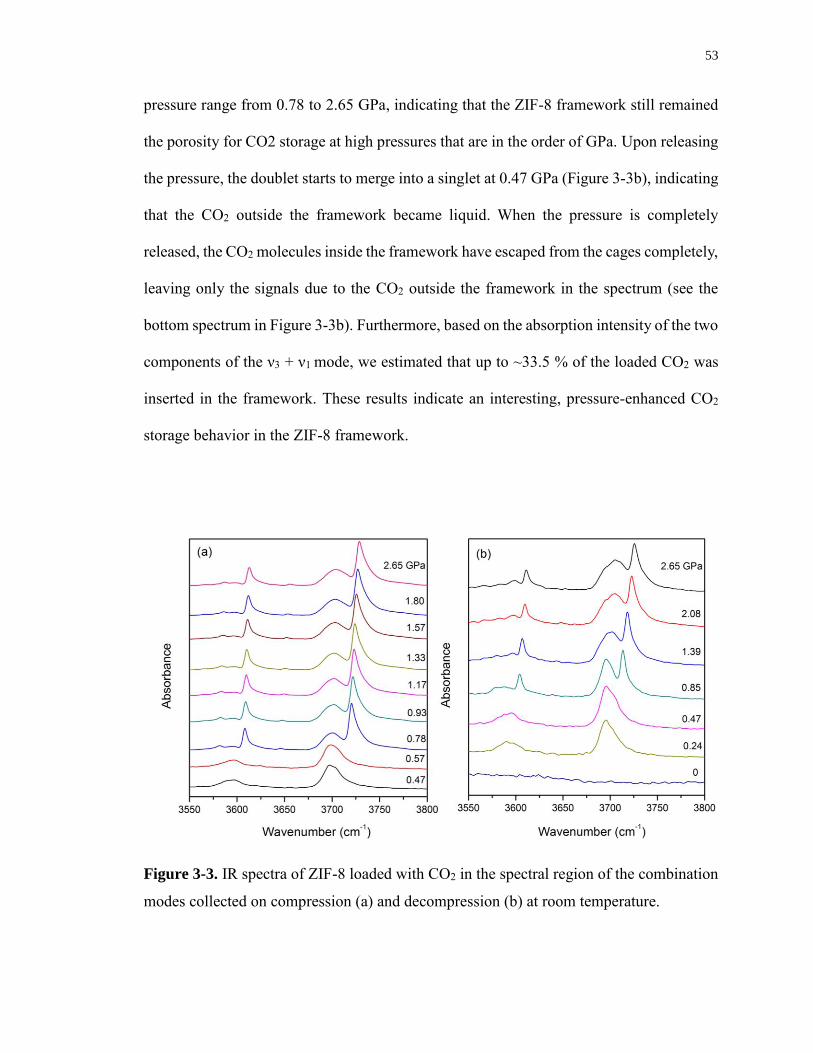
53
pressure range from 0.78 to 2.65 GPa, indicating that the ZIF-8 framework still remained
the porosity for CO2 storage at high pressures that are in the order of GPa. Upon releasing
the pressure, the doublet starts to merge into a singlet at 0.47 GPa (Figure 3-3b), indicating
that the CO2 outside the framework became liquid. When the pressure is completely
released, the CO2 molecules inside the framework have escaped from the cages completely,
leaving only the signals due to the CO2 outside the framework in the spectrum (see the
bottom spectrum in Figure 3-3b). Furthermore, based on the absorption intensity of the two
components of the ν3 + ν1 mode, we estimated that up to ~33.5 % of the loaded CO2 was
inserted in the framework. These results indicate an interesting, pressure-enhanced CO2
storage behavior in the ZIF-8 framework.
Figure 3-3. IR spectra of ZIF-8 loaded with CO2 in the spectral region of the combination
modes collected on compression (a) and decompression (b) at room temperature.
54
3.4 Discussion
The nature of the interaction between CO2 and ZIF-8 framework as well as the
migration mechanism is of great interest, which may be understood from previous studies.
For instance, Lee et al.23 observed a similar reversible insertion behavior of CO2 into a
small-pore zeolite natrolite under a pressure of 1.5 GPa, which results in the expansion of
unit cell volume of the host framework. However, the insertion must be triggered at
elevated temperatures, in contrast to the room-temperature behavior of ZIF-8 observed
here. The work by Haines et al.24 and Coasne et al.25 showed that at room temperature,
CO2 can be incorporated into the framework of completely siliceous zeolite ZSM-5
(silicalite-1) with a pore size slightly larger than that of natrolite and that the presence of
CO2 in the pore stabilizes the zeolitic framework.24 The pore size of ZIF-8 is in between
natrolite and silicalite-1. Other contributing factors that must be considered to fully
understand the insertion mechanism of CO2 into the framework at high pressures include:
(1) The pressure for the CO2 insertion with respect to the ZIF-8 framework is significantly
lower (lower than the gigapascal level at room temperature) compared to that for natrolite
(1.5 GPa at high temperature), suggesting that CO2 must be in fluid state for effective
diffusion under stressed conditions.23 (2) The unique pressure characteristics of ZIF-8 in
terms of framework flexibility and pressure-induced enlargement of pore opening and
volume plays an important role in the facilitation of CO2 insertion at high pressures. At
high pressures, Moggach et al.11 observed a new phase with the same space group
symmetry as the ambient ZIF-8, but with a twisted conformation of the imidazolate linkers,
resulting in total opening of the 6-member ring window. Thus methanol molecules as the
PTM can be reversibly inserted into the pores even at 1.5 GPa, leading to the expansion of
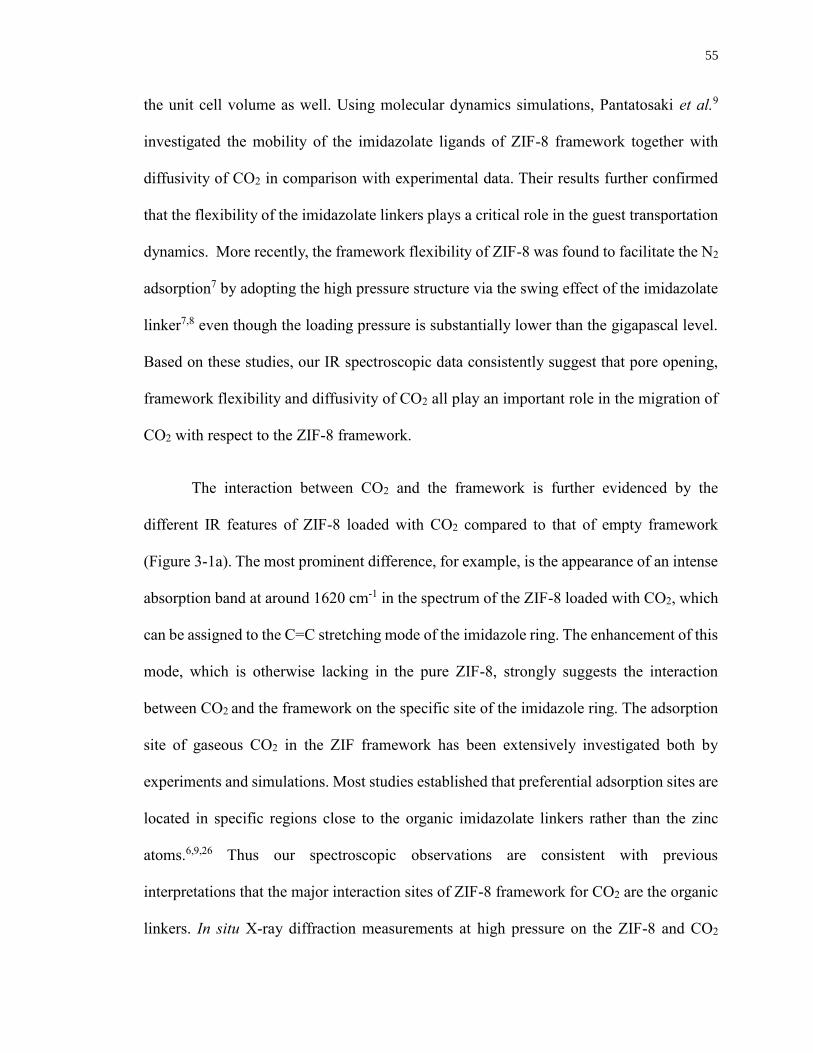
55
the unit cell volume as well. Using molecular dynamics simulations, Pantatosaki et al.9
investigated the mobility of the imidazolate ligands of ZIF-8 framework together with
diffusivity of CO2 in comparison with experimental data. Their results further confirmed
that the flexibility of the imidazolate linkers plays a critical role in the guest transportation
dynamics. More recently, the framework flexibility of ZIF-8 was found to facilitate the N2
adsorption7 by adopting the high pressure structure via the swing effect of the imidazolate
linker7,8 even though the loading pressure is substantially lower than the gigapascal level.
Based on these studies, our IR spectroscopic data consistently suggest that pore opening,
framework flexibility and diffusivity of CO2 all play an important role in the migration of
CO2 with respect to the ZIF-8 framework.
The interaction between CO2 and the framework is further evidenced by the
different IR features of ZIF-8 loaded with CO2 compared to that of empty framework
(Figure 3-1a). The most prominent difference, for example, is the appearance of an intense
absorption band at around 1620 cm-1 in the spectrum of the ZIF-8 loaded with CO2, which
can be assigned to the C=C stretching mode of the imidazole ring. The enhancement of this
mode, which is otherwise lacking in the pure ZIF-8, strongly suggests the interaction
between CO2 and the framework on the specific site of the imidazole ring. The adsorption
site of gaseous CO2 in the ZIF framework has been extensively investigated both by
experiments and simulations. Most studies established that preferential adsorption sites are
located in specific regions close to the organic imidazolate linkers rather than the zinc
atoms.6,9,26 Thus our spectroscopic observations are consistent with previous
interpretations that the major interaction sites of ZIF-8 framework for CO2 are the organic
linkers. In situ X-ray diffraction measurements at high pressure on the ZIF-8 and CO2
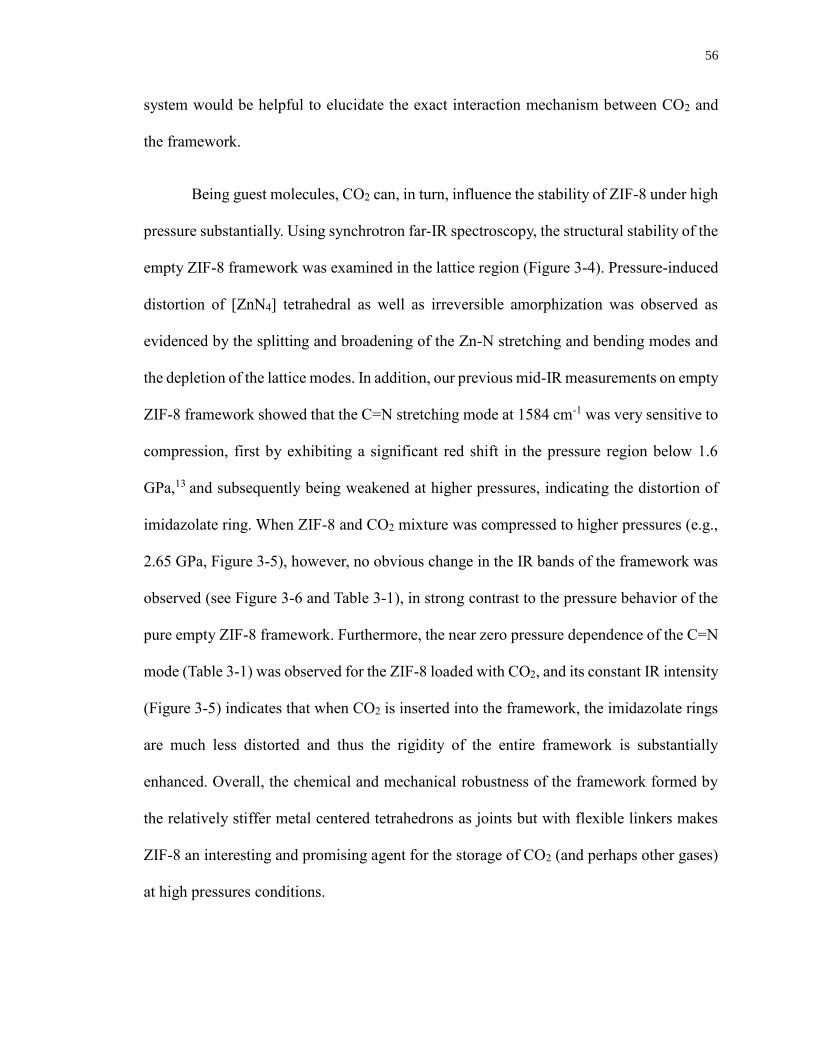
56
system would be helpful to elucidate the exact interaction mechanism between CO2 and
the framework.
Being guest molecules, CO2 can, in turn, influence the stability of ZIF-8 under high
pressure substantially. Using synchrotron far-IR spectroscopy, the structural stability of the
empty ZIF-8 framework was examined in the lattice region (Figure 3-4). Pressure-induced
distortion of [ZnN4] tetrahedral as well as irreversible amorphization was observed as
evidenced by the splitting and broadening of the Zn-N stretching and bending modes and
the depletion of the lattice modes. In addition, our previous mid-IR measurements on empty
ZIF-8 framework showed that the C=N stretching mode at 1584 cm-1 was very sensitive to
compression, first by exhibiting a significant red shift in the pressure region below 1.6
GPa,13 and subsequently being weakened at higher pressures, indicating the distortion of
imidazolate ring. When ZIF-8 and CO2 mixture was compressed to higher pressures (e.g.,
2.65 GPa, Figure 3-5), however, no obvious change in the IR bands of the framework was
observed (see Figure 3-6 and Table 3-1), in strong contrast to the pressure behavior of the
pure empty ZIF-8 framework. Furthermore, the near zero pressure dependence of the C=N
mode (Table 3-1) was observed for the ZIF-8 loaded with CO2, and its constant IR intensity
(Figure 3-5) indicates that when CO2 is inserted into the framework, the imidazolate rings
are much less distorted and thus the rigidity of the entire framework is substantially
enhanced. Overall, the chemical and mechanical robustness of the framework formed by
the relatively stiffer metal centered tetrahedrons as joints but with flexible linkers makes
ZIF-8 an interesting and promising agent for the storage of CO2 (and perhaps other gases)
at high pressures conditions.
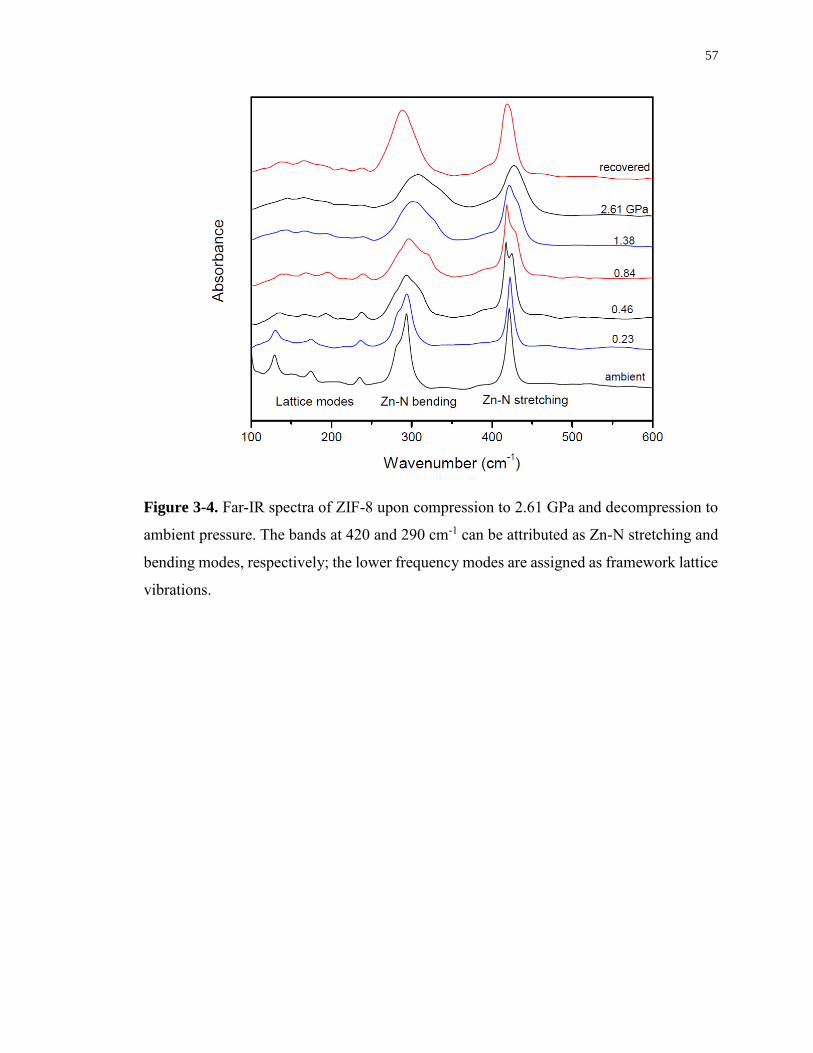
57
Figure 3-4. Far-IR spectra of ZIF-8 upon compression to 2.61 GPa and decompression to
ambient pressure. The bands at 420 and 290 cm-1 can be attributed as Zn-N stretching and
bending modes, respectively; the lower frequency modes are assigned as framework lattice
vibrations.
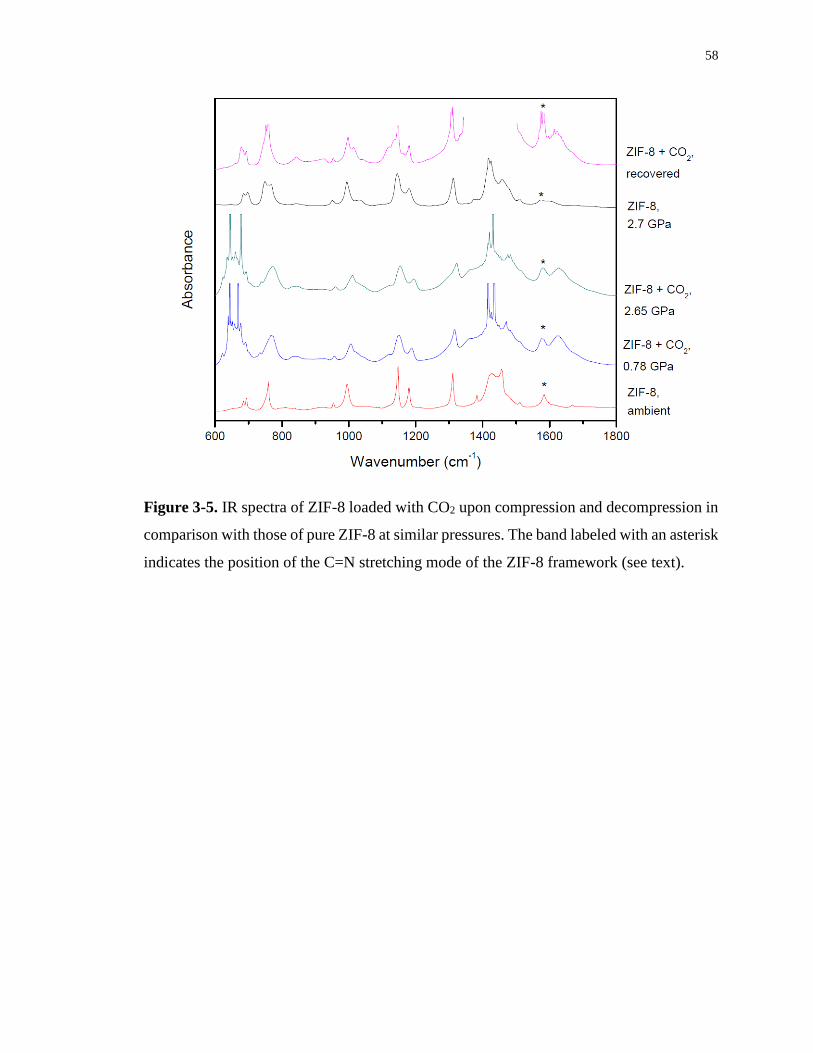
58
Figure 3-5. IR spectra of ZIF-8 loaded with CO2 upon compression and decompression in
comparison with those of pure ZIF-8 at similar pressures. The band labeled with an asterisk
indicates the position of the C=N stretching mode of the ZIF-8 framework (see text).
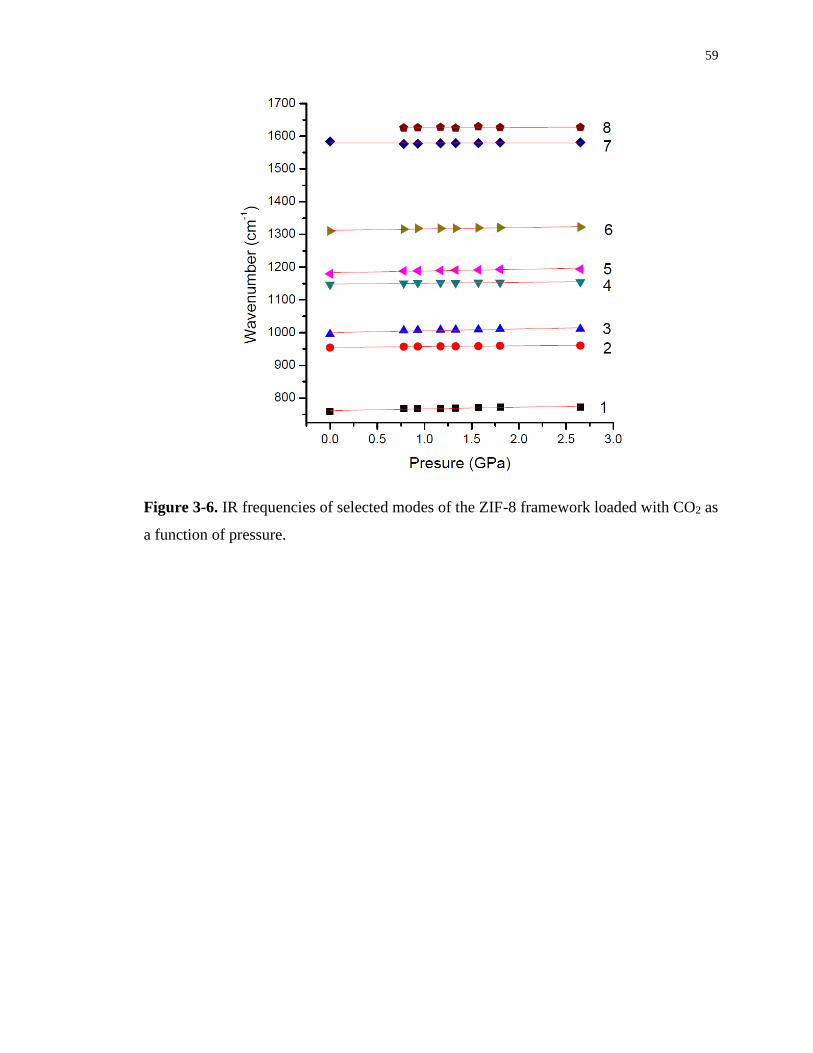
59
Figure 3-6. IR frequencies of selected modes of the ZIF-8 framework loaded with CO2 as
a function of pressure.
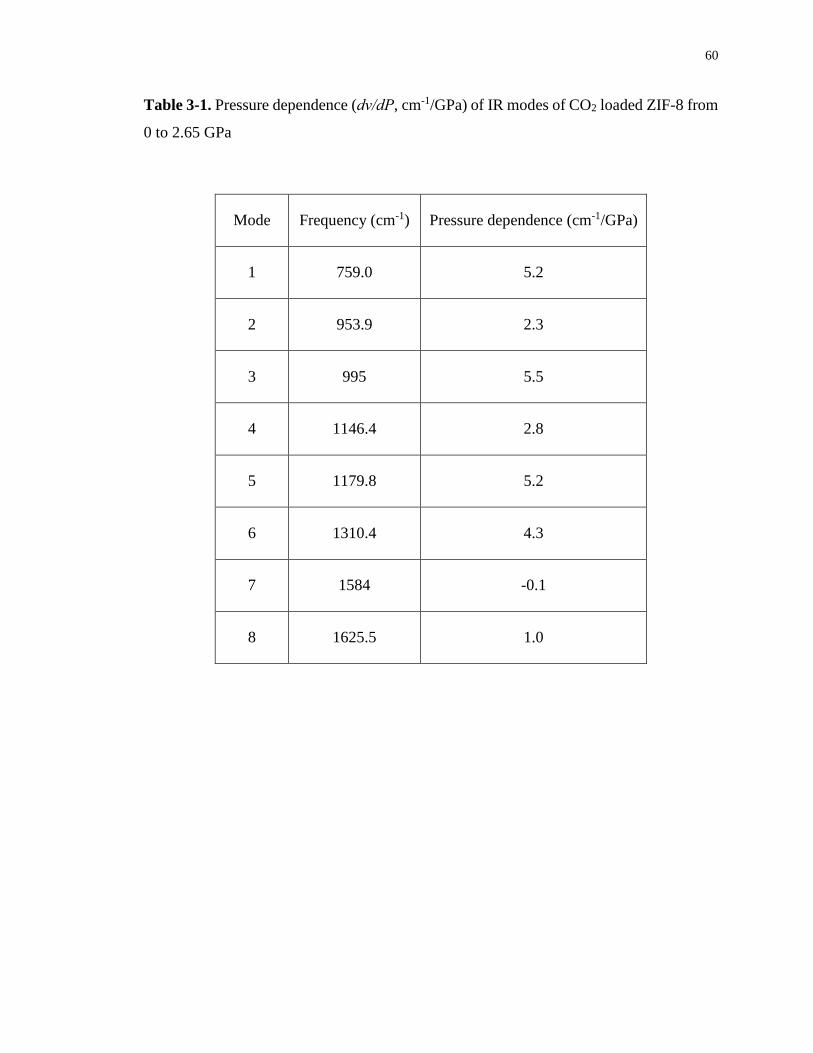
60
Table 3-1. Pressure dependence (dν/dP, cm-1/GPa) of IR modes of CO2 loaded ZIF-8 from
0 to 2.65 GPa
Mode Frequency (cm-1) Pressure dependence (cm-1/GPa)
1 759.0 5.2
2 953.9 2.3
3 995 5.5
4 1146.4 2.8
5 1179.8 5.2
6 1310.4 4.3
7 1584 -0.1
8 1625.5 1.0
61
3.5 Conclusions
In summary, we demonstrated a pressure-enhanced CO2 storage in ZIF-8 using in
situ FTIR spectroscopy. Two types of CO2 molecules (inside the framework and outside as
bulk medium) can be differentiated by the combination IR bands of CO2 unambiguously
due to the CO2 adsorption in the framework. Strong interactions between CO2 and
framework are apparent from the IR features of the framework in the C=C stretching
region, providing consistent information about the possible interaction site. As guest
molecules, CO2 can substantially influence the structural stability of the ZIF-8 framework.
The enhanced CO2 storage capacity of ZIF-8 at high pressure provides new insight into the
gas capture and storage applications of ZIFs.
3.6 References
(1) Park, K. S.; Ni, Z.; Cote, A. P.; Choi, J. Y.; Huang, R. D.; Uribe-Romo, F. J.; Chae, H. K.;
O'Keeffe, M.; Yaghi, O. M. Proceedings of the National Academy of Sciences of the United
States of America 2006, 103, 10186.
(2) Wang, B.; Cote, A. P.; Furukawa, H.; O'Keeffe, M.; Yaghi, O. M. Nature 2008, 453, 207.
(3) Phan, A.; Doonan, C. J.; Uribe-Romo, F. J.; Knobler, C. B.; O'Keeffe, M.; Yaghi, O. M.
Accounts of Chemical Research 2010, 43, 58.
(4) Sumida, K.; Rogow, D. L.; Mason, J. A.; McDonald, T. M.; Bloch, E. D.; Herm, Z. R.; Bae,
T. H.; Long, J. R. Chemical Reviews. 2012, 112, 724.
(5) Nune, S. K.; Thallapally, P. K.; Dohnalkova, A.; Wang, C. M.; Liu, J.; Exarhos, G. J.
Chemmical Communications. 2010, 46, 4878.
(6) Perez-Pellitero, J.; Amrouche, H.; Siperstein, F. R.; Pirngruber, G.; Nieto-Draghi, C.;
Chaplais, G.; Simon-Masseron, A.; Bazer-Bachi, D.; Peralta, D.; Bats, N. Chemistry-A
European Journal 2010, 16, 1560.
(7) Fairen-Jimenez, D.; Moggach, S. A.; Wharmby, M. T.; Wright, P. A.; Parsons, S.; Duren,
T. Journal of American Chemical Society 2011, 133, 8900.
62
(8) Fairen-Jimenez, D.; Galvelis, R.; Torrisi, A.; Gellan, A. D.; Wharmby, M. T.; Wright, P. A.;
Mellot-Draznieks, C.; Duren, T. Dalton Transactions 2012, 41, 10752.
(9) Pantatosaki, E.; Megariotis, G.; Pusch, A. K.; Chmelik, C.; Stallmach, F.; Papadopoulos,
G. K. Journal of Physical Chemistry C 2012, 116, 201.
(10) Chapman, K. W.; Halder, G. J.; Chupas, P. J. Journal of American Chemical Society 2009,
131, 17546.
(11) Moggach, S. A.; Bennett, T. D.; Cheetham, A. K. Angewandte Chemie International
Edition 2009, 48, 7087.
(12) Bennett, T. D.; Tan, J. C.; Moggach, S. A.; Galvelis, R.; Mellot-Draznieks, C.; Reisner, B.
A.; Thirumurugan, A.; Allan, D. R.; Cheetham, A. K. Chemistry-A European Journal 2010,
16, 10684.
(13) Hu, Y.; Kazemian, H.; Rohani, S.; Huang, Y. N.; Song, Y. Chemical Communications 2011,
47, 12694.
(14) Fu, Y. Q.; Song, Y.; Huang, Y. I. Journal of Physical Chemistry C 2012, 116, 2080.
(15) Shi, Q.; Chen, Z.; Song, Z.; Li, J.; Dong, J. Angewandte Chemie International Edition 2011,
50, 672.
(16) Dong, Z.; Song, Y. Journal of Physical Chemistry C 2010, 114, 1782.
(17) Hanson, R. C.; Jones, L. H. Journal of Chemical Physics 1981, 75, 1102.
(18) Aoki, K.; Yamawaki, H.; Sakashita, M. Physical Review B 1993, 48, 9231.
(19) Giordano, V. M.; Gorelli, F. A.; Bini, R. Low Temperature Physics 2006, 32, 1067.
(20) Martin, P. E.; Barker, E. F. Physical Review 1932, 41, 291.
(21) Santoro, M.; Gorelli, F.; Haines, J.; Cambon, O.; Levelut, C.; Garbarino, G. Proceedings
of the National Academy of Sciences of the United States of America 2011, 108, 7689.
(22) McCluskey, M. D.; Zhuravlev, K. K. Journal of Chemical Physics 2002, 116, 1607.
(23) Lee, Y.; Liu, D.; Seoung, D.; Liu, Z. X.; Kao, C. C.; Vogt, T. J. Am. Chem. Soc. 2011, 133,
1674.
(24) Haines, J.; Cambon, O.; Levelut, C.; Santoro, M.; Gorelli, F.; Garbarino, G. Journal of
American Chemical Society 2010, 132, 8860.
(25) Coasne, B.; Haines, J.; Levelut, C.; Cambon, O.; Santoro, M.; Gorelli, F.; Garbarino, G.
Physical Chemistry Chemical Physics 2011, 13, 20096.
(26) Garberoglio, G.; Taioli, S. Microporous and Mesoporous Materials 2012, 163, 215.
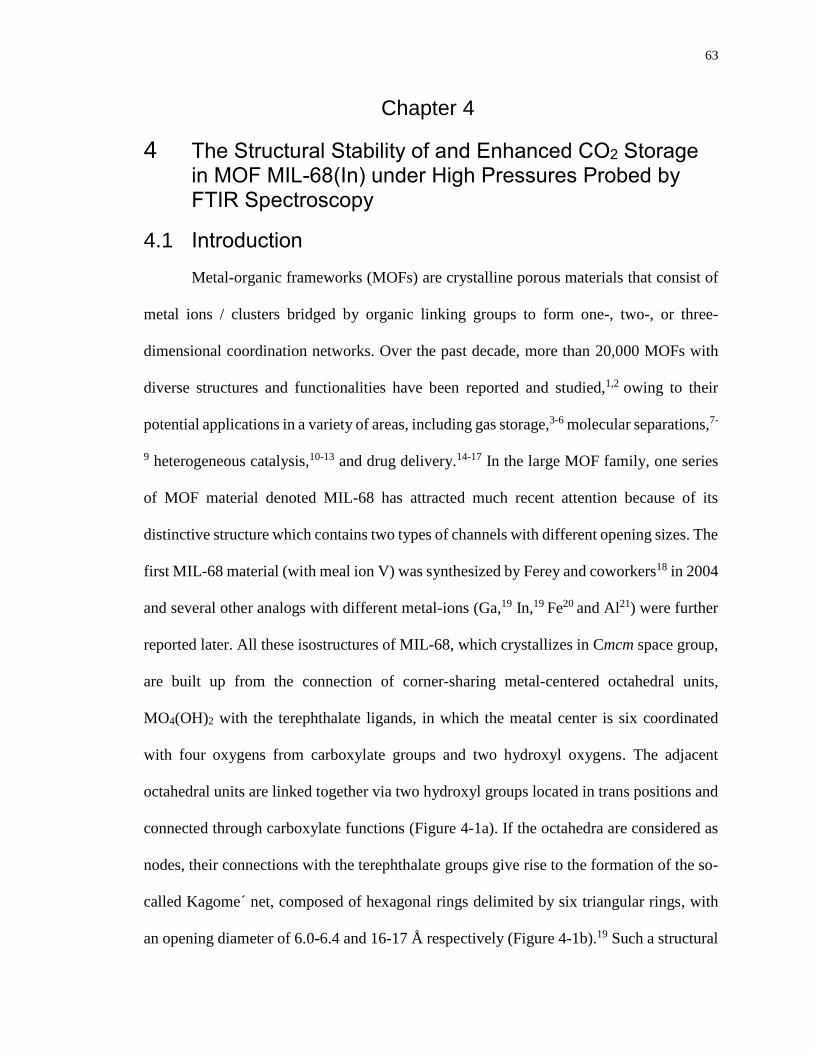
63
Chapter 4
4 The Structural Stability of and Enhanced CO2 Storage in MOF MIL-68(In) under High Pressures Probed by FTIR Spectroscopy
4.1 Introduction
Metal-organic frameworks (MOFs) are crystalline porous materials that consist of
metal ions / clusters bridged by organic linking groups to form one-, two-, or three-
dimensional coordination networks. Over the past decade, more than 20,000 MOFs with
diverse structures and functionalities have been reported and studied,1,2 owing to their
potential applications in a variety of areas, including gas storage,3-6 molecular separations,7-
9 heterogeneous catalysis,10-13 and drug delivery.14-17 In the large MOF family, one series
of MOF material denoted MIL-68 has attracted much recent attention because of its
distinctive structure which contains two types of channels with different opening sizes. The
first MIL-68 material (with meal ion V) was synthesized by Ferey and coworkers18 in 2004
and several other analogs with different metal-ions (Ga,19 In,19 Fe20 and Al21) were further
reported later. All these isostructures of MIL-68, which crystallizes in Cmcm space group,
are built up from the connection of corner-sharing metal-centered octahedral units,
MO4(OH)2 with the terephthalate ligands, in which the meatal center is six coordinated
with four oxygens from carboxylate groups and two hydroxyl oxygens. The adjacent
octahedral units are linked together via two hydroxyl groups located in trans positions and
connected through carboxylate functions (Figure 4-1a). If the octahedra are considered as
nodes, their connections with the terephthalate groups give rise to the formation of the so-
called Kagome net, composed of hexagonal rings delimited by six triangular rings, with
an opening diameter of 6.0-6.4 and 16-17 Å respectively (Figure 4-1b).19 Such a structural
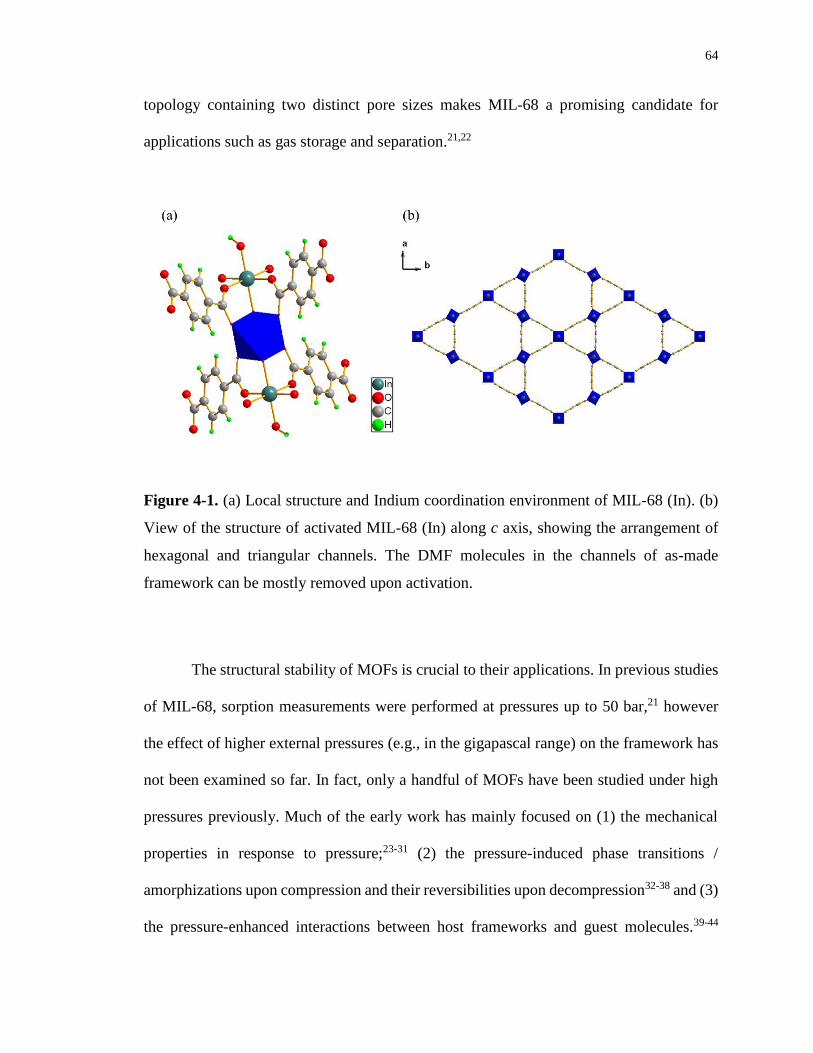
64
topology containing two distinct pore sizes makes MIL-68 a promising candidate for
applications such as gas storage and separation.21,22
Figure 4-1. (a) Local structure and Indium coordination environment of MIL-68 (In). (b)
View of the structure of activated MIL-68 (In) along c axis, showing the arrangement of
hexagonal and triangular channels. The DMF molecules in the channels of as-made
framework can be mostly removed upon activation.
The structural stability of MOFs is crucial to their applications. In previous studies
of MIL-68, sorption measurements were performed at pressures up to 50 bar,21 however
the effect of higher external pressures (e.g., in the gigapascal range) on the framework has
not been examined so far. In fact, only a handful of MOFs have been studied under high
pressures previously. Much of the early work has mainly focused on (1) the mechanical
properties in response to pressure;23-31 (2) the pressure-induced phase transitions /
amorphizations upon compression and their reversibilities upon decompression32-38 and (3)
the pressure-enhanced interactions between host frameworks and guest molecules.39-44
65
Take a few examples from the latter two directions, since the interest of our study lays in
the enhanced sorption properties of MOFs under high pressure. Moggach et al.33 observed
a reversible crystalline-to-crystalline phase transition of ZIF-8 in pressure transmitting
medium (PTM) at around 1.5 GPa, which increased the volume of the unit cell. Lapidus
et al. 36 demonstrated that external pressure (0.9-1.8 GPa) can be exploited to provide a
novel and unexpected means to transform a dense interpenetrated framework system
Zn(CN)2 into a new porous material, in the presence of small molecule pressure-
transmitting fluids. Our prior work42 suggested that pressure can play a regulating role in
the insertion and extrusion of CO2 with respect to the ZIF-8 framework, even at room
temperature. These work and high pressure studies on other nano-porous materials (e.g.
zeolites)45-47 demonstrate that pressure can provide a new approach to achieve structural
modifications for the framework including changes in pore size, opening and geometry,
channel shape and internal surface area. Subsequently, application of external pressure on
the frameworks far beyond the practical gas adsorption pressure may significantly enhance
their adsorption properties. Therefore, exploring the high-pressure behavior of MIL-68 is
important for its gas storage and separation applications. Herein, we report the first in situ
high-pressure investigation of MIL-68(In) and its performance for CO2 storage by FTIR
spectroscopy. Particular attention is focused on (1) the differences in stability and
reversibility of the structural modifications between MIL-68(In) with and without solvent
molecules; (2) the role of encapsulated guest molecules (PTM) in the stability and
transformation of the framework under high pressure; (3) the pressure dependence of CO2
storage in the framework and the host-guest interaction between the framework and CO2
66
and (4) understanding the structural origin of the MOF framework promoting CO2 storage
under high pressures with the aid of Monte Carlo simulations.
4.2 Experimental section
The as-made MIL-68(In) sample was prepared by hydrothermal synthesis from a
mixture of indium nitrate (1.05 mmol, 408.2 mg), terephthalic acid (1.2 mmol, 200 mg)
and dimethylformamide (DMF, 70 mmol, 5 mL).19 Specifically, the reactants were placed
in a Teflon-lined autoclave and heated for 48 h at 100 °C in an oven. The resulting white
powder was filtered off and washed with DMF and consisted of elongated needlelike
crystallites of 20-200 μm size. The yield was 83% based on indium. The activated MIL-
68(In) was obtained by heating the as-made sample in a vacuum gas manifold at 250 °C
for 6 hours to remove the solvent molecules encapsulated inside the framework. The
crystallinity of the samples were checked by powder X-ray diffraction (XRD).
A diamond anvil cell (DAC) equipped with type II diamonds with culet sizes of
600 μm was used to generate high pressures. A hole with a diameter of 200 μm was drilled
in the center of “pre-indented” stainless steel gaskets and used as a sample chamber. Ruby
chips (Al2O3 doped with Cr3+) were added in the sample chamber as the pressure calibrant,
and the pressure was determined from the well-established ruby R1 fluorescence line shift.
Spectral grade KBr was added in the sample chamber when necessary to resolve strong IR
peaks. The samples with 30 μm in thickness were loaded into the DAC. In order to focus
on the intrinsic pressure behavior of MIL-68 (In), both the as-made and activated sample
were loaded without PTM. In the entire pressure region (0-11 GPa), no significant
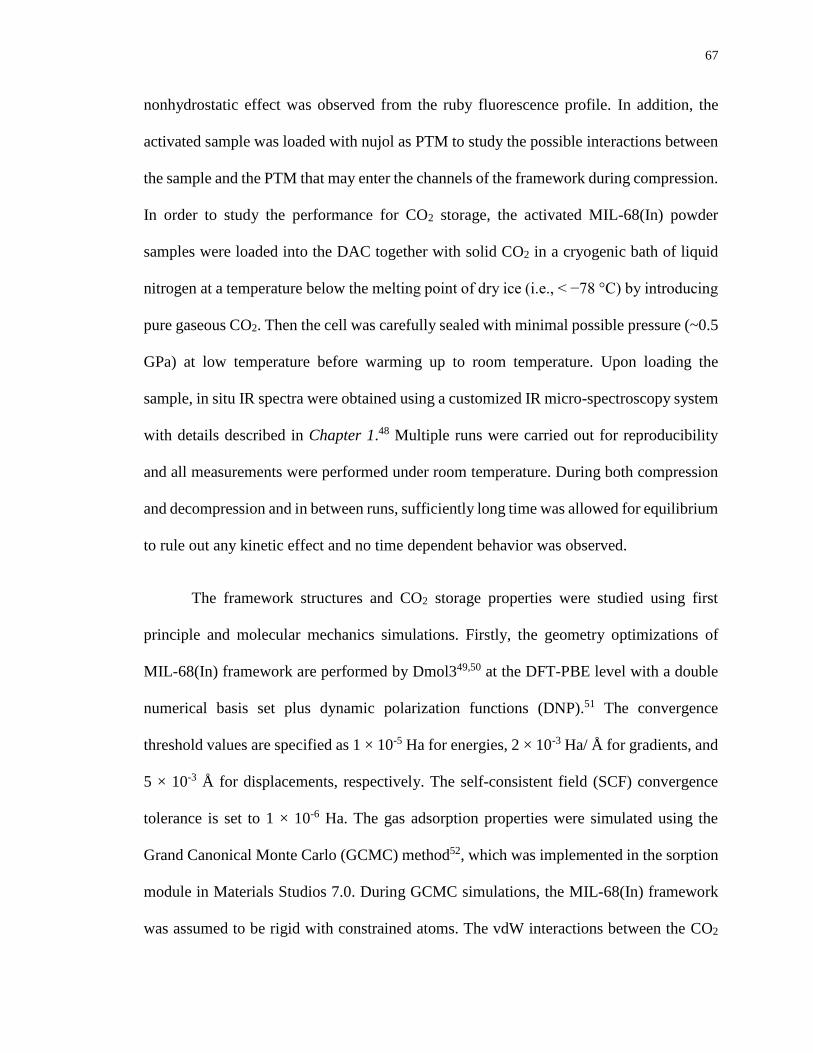
67
nonhydrostatic effect was observed from the ruby fluorescence profile. In addition, the
activated sample was loaded with nujol as PTM to study the possible interactions between
the sample and the PTM that may enter the channels of the framework during compression.
In order to study the performance for CO2 storage, the activated MIL-68(In) powder
samples were loaded into the DAC together with solid CO2 in a cryogenic bath of liquid
nitrogen at a temperature below the melting point of dry ice (i.e., < −78 °C) by introducing
pure gaseous CO2. Then the cell was carefully sealed with minimal possible pressure (~0.5
GPa) at low temperature before warming up to room temperature. Upon loading the
sample, in situ IR spectra were obtained using a customized IR micro-spectroscopy system
with details described in Chapter 1.48 Multiple runs were carried out for reproducibility
and all measurements were performed under room temperature. During both compression
and decompression and in between runs, sufficiently long time was allowed for equilibrium
to rule out any kinetic effect and no time dependent behavior was observed.
The framework structures and CO2 storage properties were studied using first
principle and molecular mechanics simulations. Firstly, the geometry optimizations of
MIL-68(In) framework are performed by Dmol349,50 at the DFT-PBE level with a double
numerical basis set plus dynamic polarization functions (DNP).51 The convergence
threshold values are specified as 1 × 10⁻⁵ Ha for energies, 2 × 10⁻³ Ha/ Å for gradients, and
5 × 10⁻³ Å for displacements, respectively. The self-consistent field (SCF) convergence
tolerance is set to 1 × 10⁻⁶ Ha. The gas adsorption properties were simulated using the
Grand Canonical Monte Carlo (GCMC) method52, which was implemented in the sorption
module in Materials Studios 7.0. During GCMC simulations, the MIL-68(In) framework
was assumed to be rigid with constrained atoms. The vdW interactions between the CO2
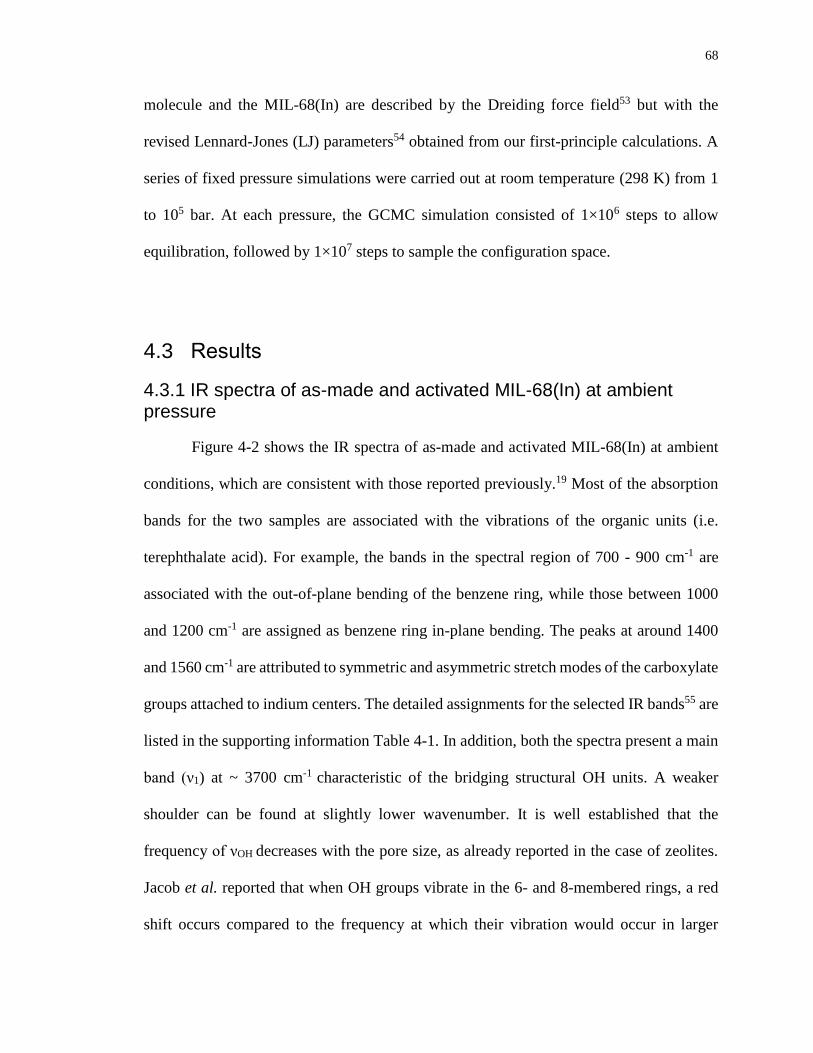
68
molecule and the MIL-68(In) are described by the Dreiding force field53 but with the
revised Lennard-Jones (LJ) parameters54 obtained from our first-principle calculations. A
series of fixed pressure simulations were carried out at room temperature (298 K) from 1
to 105 bar. At each pressure, the GCMC simulation consisted of 1×10⁶ steps to allow
equilibration, followed by 1×10⁷ steps to sample the configuration space.
4.3 Results
4.3.1 IR spectra of as-made and activated MIL-68(In) at ambient pressure
Figure 4-2 shows the IR spectra of as-made and activated MIL-68(In) at ambient
conditions, which are consistent with those reported previously.19 Most of the absorption
bands for the two samples are associated with the vibrations of the organic units (i.e.
terephthalate acid). For example, the bands in the spectral region of 700 - 900 cm-1 are
associated with the out-of-plane bending of the benzene ring, while those between 1000
and 1200 cm-1 are assigned as benzene ring in-plane bending. The peaks at around 1400
and 1560 cm-1 are attributed to symmetric and asymmetric stretch modes of the carboxylate
groups attached to indium centers. The detailed assignments for the selected IR bands55 are
listed in the supporting information Table 4-1. In addition, both the spectra present a main
band (ν1) at ~ 3700 cm-1 characteristic of the bridging structural OH units. A weaker
shoulder can be found at slightly lower wavenumber. It is well established that the
frequency of νOH decreases with the pore size, as already reported in the case of zeolites.
Jacob et al. reported that when OH groups vibrate in the 6- and 8-membered rings, a red
shift occurs compared to the frequency at which their vibration would occur in larger
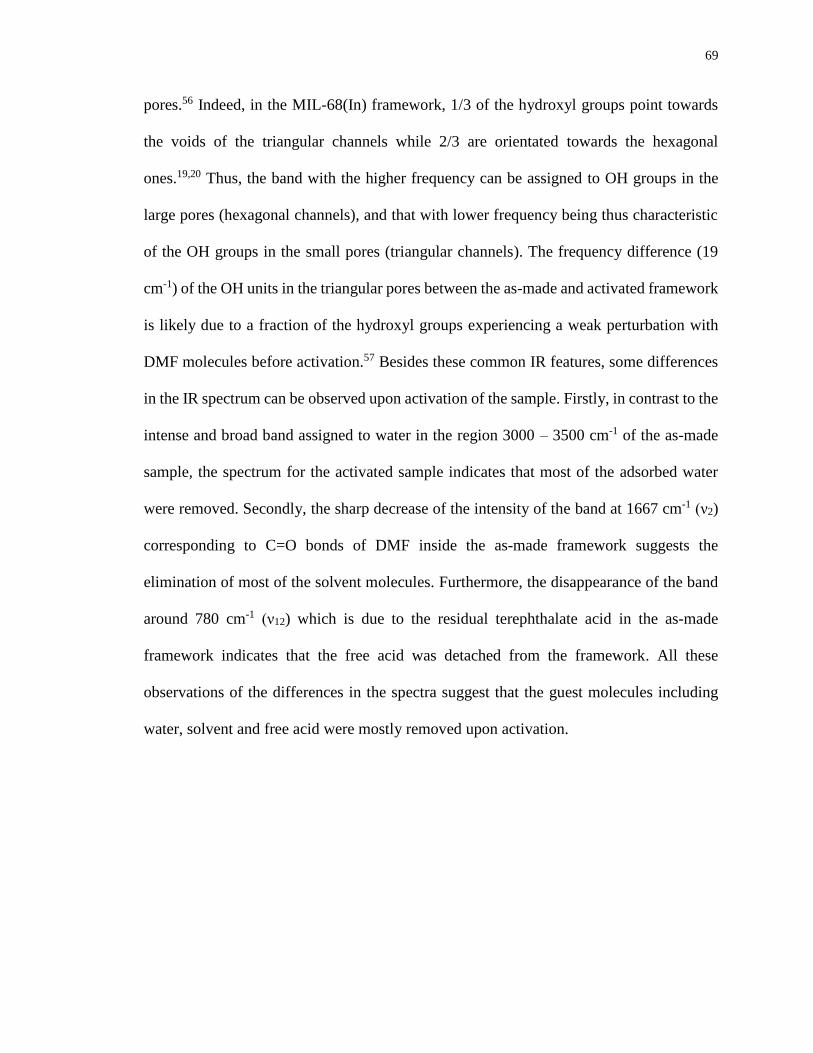
69
pores.56 Indeed, in the MIL-68(In) framework, 1/3 of the hydroxyl groups point towards
the voids of the triangular channels while 2/3 are orientated towards the hexagonal
ones.19,20 Thus, the band with the higher frequency can be assigned to OH groups in the
large pores (hexagonal channels), and that with lower frequency being thus characteristic
of the OH groups in the small pores (triangular channels). The frequency difference (19
cm-1) of the OH units in the triangular pores between the as-made and activated framework
is likely due to a fraction of the hydroxyl groups experiencing a weak perturbation with
DMF molecules before activation.57 Besides these common IR features, some differences
in the IR spectrum can be observed upon activation of the sample. Firstly, in contrast to the
intense and broad band assigned to water in the region 3000 – 3500 cm-1 of the as-made
sample, the spectrum for the activated sample indicates that most of the adsorbed water
were removed. Secondly, the sharp decrease of the intensity of the band at 1667 cm-1 (ν2)
corresponding to C=O bonds of DMF inside the as-made framework suggests the
elimination of most of the solvent molecules. Furthermore, the disappearance of the band
around 780 cm-1 (ν12) which is due to the residual terephthalate acid in the as-made
framework indicates that the free acid was detached from the framework. All these
observations of the differences in the spectra suggest that the guest molecules including
water, solvent and free acid were mostly removed upon activation.
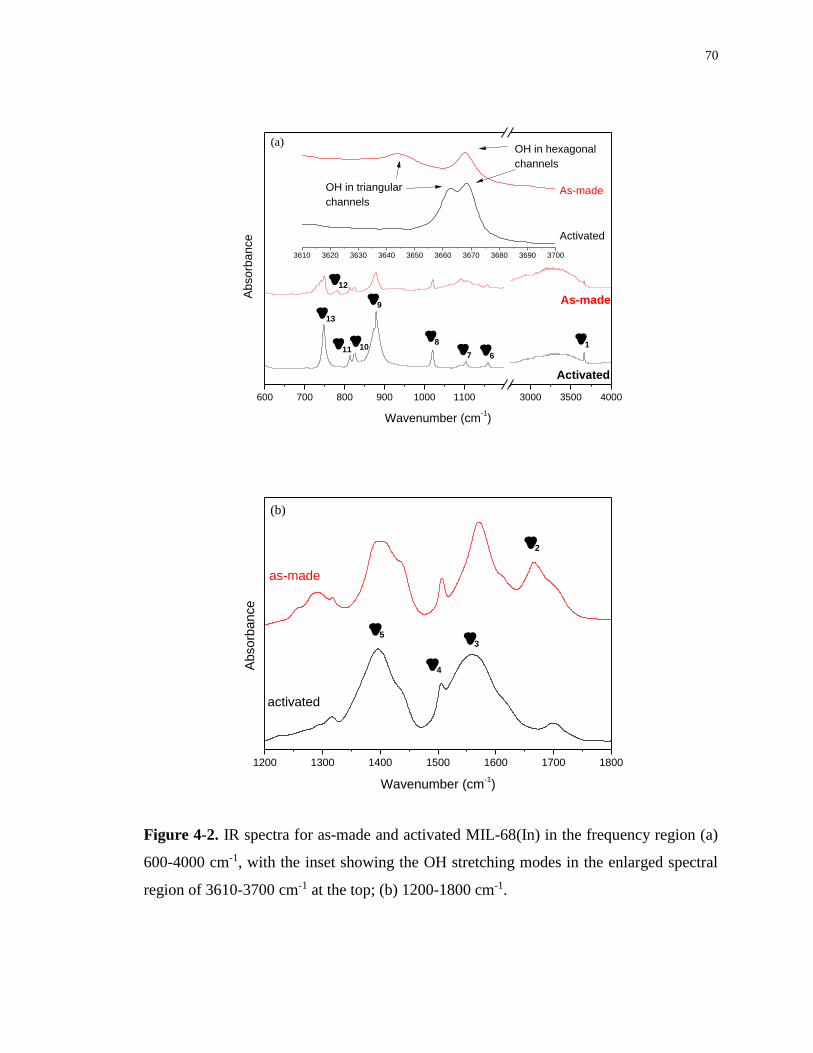
70
600 700 800 900 1000 1100 3000 3500 4000
3610 3620 3630 3640 3650 3660 3670 3680 3690 3700
Activated
As-made
OH in hexagonal
channels
OH in triangular
channels
6
7
8
9
10
11
12
13
1
Absorb
ance
Wavenumber (cm-1)
As-made
Activated
(a)
1200 1300 1400 1500 1600 1700 1800
Absorb
ance
2
4
5
Wavenumber (cm-1)
as-made
activated
(b)
3
Figure 4-2. IR spectra for as-made and activated MIL-68(In) in the frequency region (a)
600-4000 cm-1, with the inset showing the OH stretching modes in the enlarged spectral
region of 3610-3700 cm-1 at the top; (b) 1200-1800 cm-1.
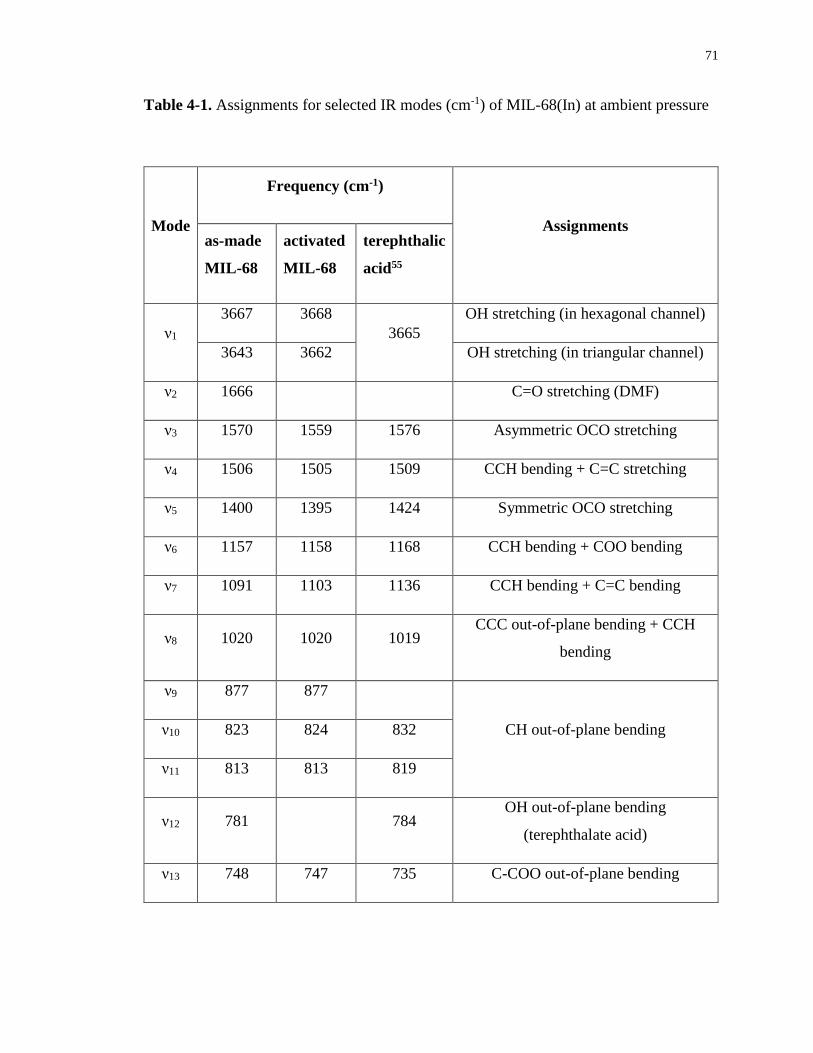
71
Table 4-1. Assignments for selected IR modes (cm-1) of MIL-68(In) at ambient pressure
Mode
Frequency (cm-1)
Assignments as-made
MIL-68
activated
MIL-68
terephthalic
acid55
ν1
3667 3668
3665
OH stretching (in hexagonal channel)
3643 3662 OH stretching (in triangular channel)
ν2 1666 C=O stretching (DMF)
ν3 1570 1559 1576 Asymmetric OCO stretching
ν4 1506 1505 1509 CCH bending + C=C stretching
ν5 1400 1395 1424 Symmetric OCO stretching
ν6 1157 1158 1168 CCH bending + COO bending
ν7 1091 1103 1136 CCH bending + C=C bending
ν8 1020 1020 1019 CCC out-of-plane bending + CCH
bending
ν9 877 877
CH out-of-plane bending ν10 823 824 832
ν11 813 813 819
ν12 781 784 OH out-of-plane bending
(terephthalate acid)
ν13 748 747 735 C-COO out-of-plane bending
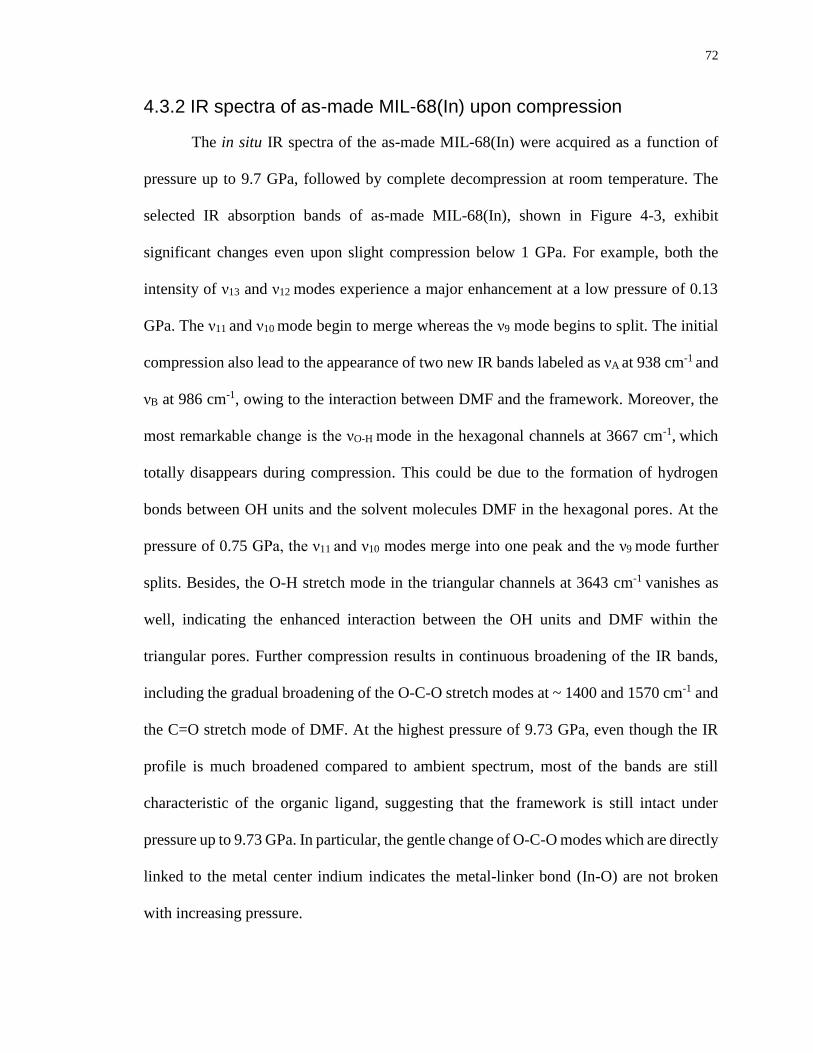
72
4.3.2 IR spectra of as-made MIL-68(In) upon compression
The in situ IR spectra of the as-made MIL-68(In) were acquired as a function of
pressure up to 9.7 GPa, followed by complete decompression at room temperature. The
selected IR absorption bands of as-made MIL-68(In), shown in Figure 4-3, exhibit
significant changes even upon slight compression below 1 GPa. For example, both the
intensity of ν13 and ν12 modes experience a major enhancement at a low pressure of 0.13
GPa. The ν11 and ν10 mode begin to merge whereas the ν9 mode begins to split. The initial
compression also lead to the appearance of two new IR bands labeled as νA at 938 cm-1 and
νB at 986 cm-1, owing to the interaction between DMF and the framework. Moreover, the
most remarkable change is the νO-H mode in the hexagonal channels at 3667 cm-1, which
totally disappears during compression. This could be due to the formation of hydrogen
bonds between OH units and the solvent molecules DMF in the hexagonal pores. At the
pressure of 0.75 GPa, the ν11 and ν10 modes merge into one peak and the ν9 mode further
splits. Besides, the O-H stretch mode in the triangular channels at 3643 cm-1 vanishes as
well, indicating the enhanced interaction between the OH units and DMF within the
triangular pores. Further compression results in continuous broadening of the IR bands,
including the gradual broadening of the O-C-O stretch modes at ~ 1400 and 1570 cm-1 and
the C=O stretch mode of DMF. At the highest pressure of 9.73 GPa, even though the IR
profile is much broadened compared to ambient spectrum, most of the bands are still
characteristic of the organic ligand, suggesting that the framework is still intact under
pressure up to 9.73 GPa. In particular, the gentle change of O-C-O modes which are directly
linked to the metal center indium indicates the metal-linker bond (In-O) are not broken
with increasing pressure.
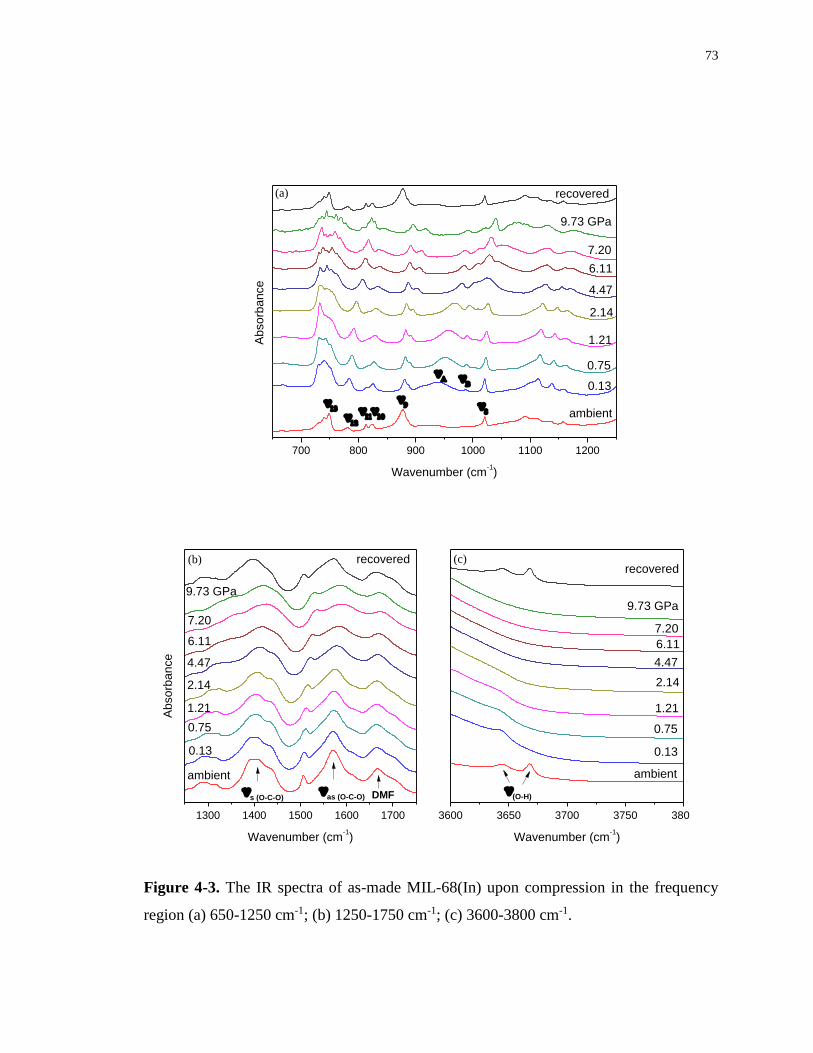
73
700 800 900 1000 1100 1200
Absorb
ance
Wavenumber (cm-1)
ambient
0.13
0.75
1.21
2.14
4.47
6.11
7.20
9.73 GPa
recovered
(a)
1300 1400 1500 1600 1700
Absorb
ance
as (O-C-O)
Wavenumber (cm-1)
ambient
0.13
0.75
1.21
2.14
4.47
6.11
7.20
9.73 GPa
recovered
s (O-C-O) DMF
(b)
3600 3650 3700 3750 3800
Wavenumber (cm-1)
ambient
0.13
0.75
1.21
2.14
4.47
6.11
7.20
9.73 GPa
recovered
(O-H)
(c)
Figure 4-3. The IR spectra of as-made MIL-68(In) upon compression in the frequency
region (a) 650-1250 cm-1; (b) 1250-1750 cm-1; (c) 3600-3800 cm-1.
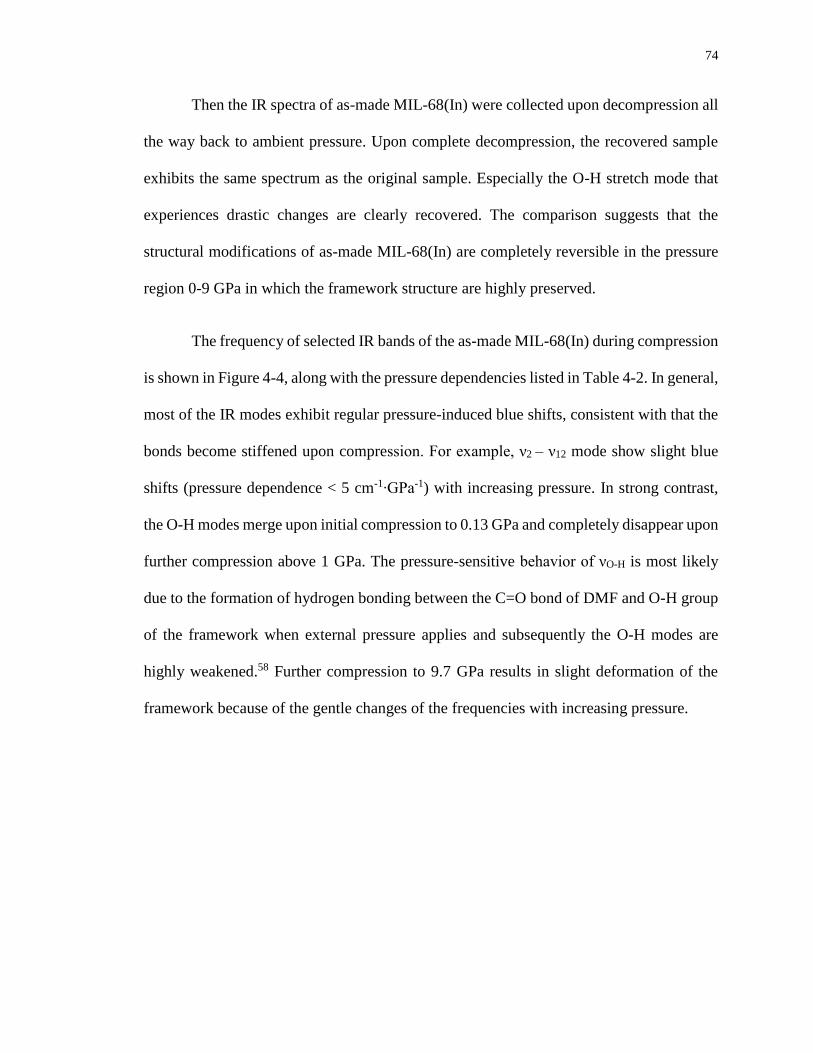
74
Then the IR spectra of as-made MIL-68(In) were collected upon decompression all
the way back to ambient pressure. Upon complete decompression, the recovered sample
exhibits the same spectrum as the original sample. Especially the O-H stretch mode that
experiences drastic changes are clearly recovered. The comparison suggests that the
structural modifications of as-made MIL-68(In) are completely reversible in the pressure
region 0-9 GPa in which the framework structure are highly preserved.
The frequency of selected IR bands of the as-made MIL-68(In) during compression
is shown in Figure 4-4, along with the pressure dependencies listed in Table 4-2. In general,
most of the IR modes exhibit regular pressure-induced blue shifts, consistent with that the
bonds become stiffened upon compression. For example, ν2 – ν12 mode show slight blue
shifts (pressure dependence < 5 cm-1∙GPa-1) with increasing pressure. In strong contrast,
the O-H modes merge upon initial compression to 0.13 GPa and completely disappear upon
further compression above 1 GPa. The pressure-sensitive behavior of νO-H is most likely
due to the formation of hydrogen bonding between the C=O bond of DMF and O-H group
of the framework when external pressure applies and subsequently the O-H modes are
highly weakened.58 Further compression to 9.7 GPa results in slight deformation of the
framework because of the gentle changes of the frequencies with increasing pressure.
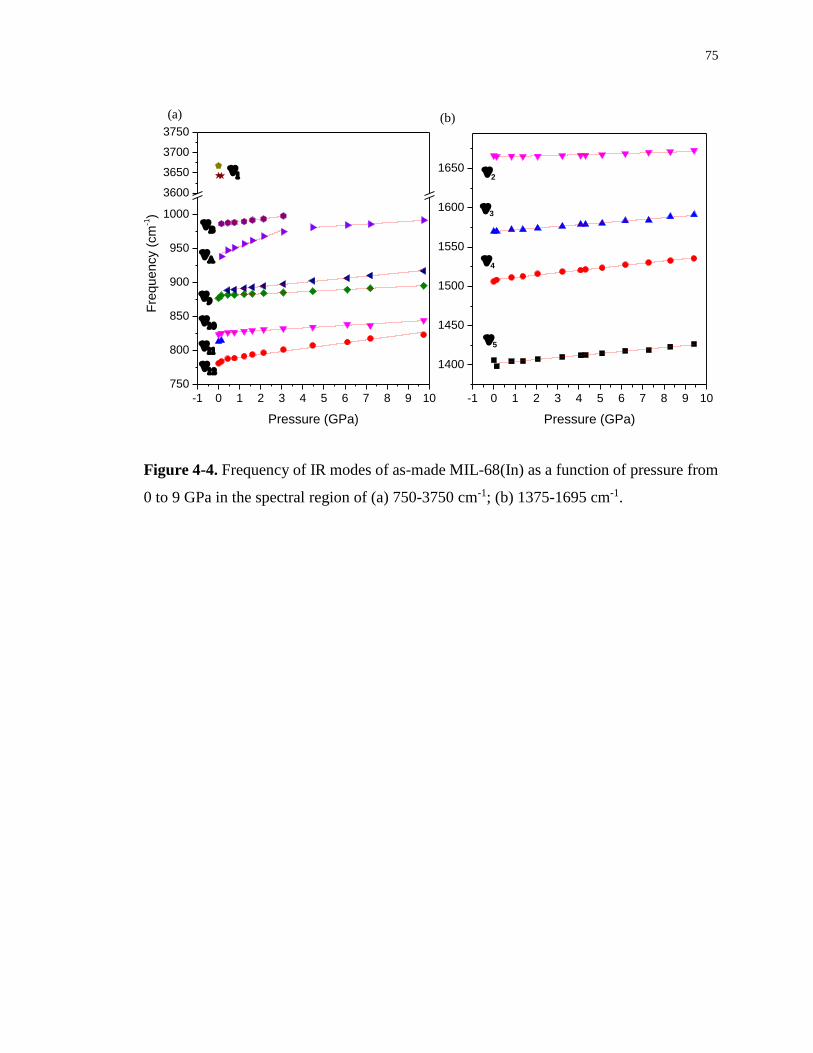
75
-1 0 1 2 3 4 5 6 7 8 9 10
750
800
850
900
950
1000
3600
3650
3700
3750
Fre
quency (
cm
-1)
Pressure (GPa)
(a)
-1 0 1 2 3 4 5 6 7 8 9 10
1400
1450
1500
1550
1600
1650
4
5
3
Pressure (GPa)
2
(b)
Figure 4-4. Frequency of IR modes of as-made MIL-68(In) as a function of pressure from
0 to 9 GPa in the spectral region of (a) 750-3750 cm-1; (b) 1375-1695 cm-1.
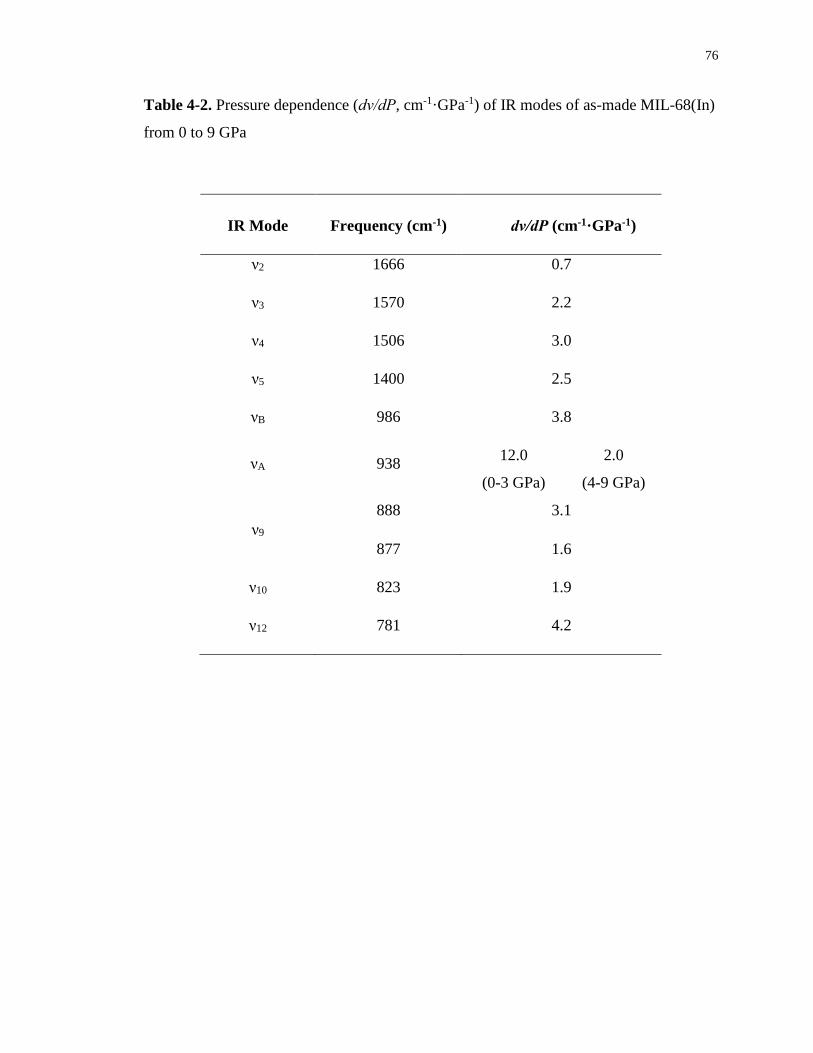
76
Table 4-2. Pressure dependence (dν/dP, cm-1·GPa-1) of IR modes of as-made MIL-68(In)
from 0 to 9 GPa
IR Mode Frequency (cm-1) dν/dP (cm-1·GPa-1)
ν2 1666 0.7
ν3 1570 2.2
ν4 1506 3.0
ν5 1400 2.5
νB 986 3.8
νA 938 12.0
(0-3 GPa)
2.0
(4-9 GPa)
ν9
888 3.1
877 1.6
ν10 823 1.9
ν12 781 4.2
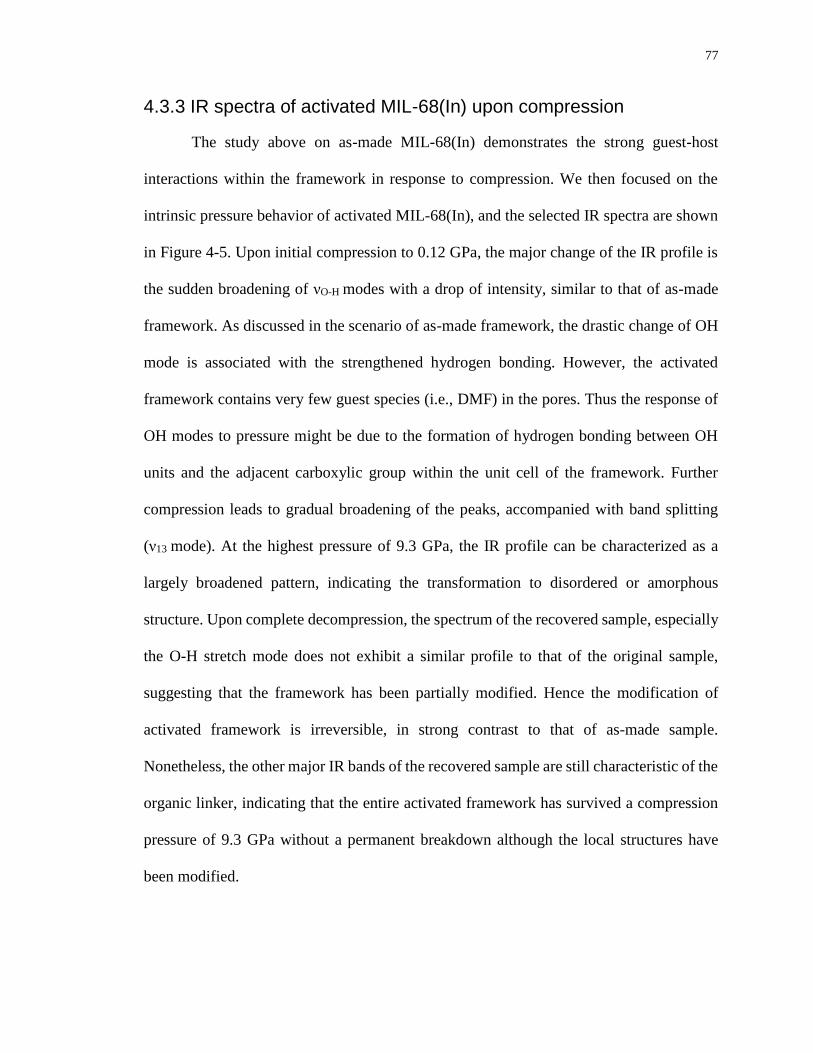
77
4.3.3 IR spectra of activated MIL-68(In) upon compression
The study above on as-made MIL-68(In) demonstrates the strong guest-host
interactions within the framework in response to compression. We then focused on the
intrinsic pressure behavior of activated MIL-68(In), and the selected IR spectra are shown
in Figure 4-5. Upon initial compression to 0.12 GPa, the major change of the IR profile is
the sudden broadening of νO-H modes with a drop of intensity, similar to that of as-made
framework. As discussed in the scenario of as-made framework, the drastic change of OH
mode is associated with the strengthened hydrogen bonding. However, the activated
framework contains very few guest species (i.e., DMF) in the pores. Thus the response of
OH modes to pressure might be due to the formation of hydrogen bonding between OH
units and the adjacent carboxylic group within the unit cell of the framework. Further
compression leads to gradual broadening of the peaks, accompanied with band splitting
(ν13 mode). At the highest pressure of 9.3 GPa, the IR profile can be characterized as a
largely broadened pattern, indicating the transformation to disordered or amorphous
structure. Upon complete decompression, the spectrum of the recovered sample, especially
the O-H stretch mode does not exhibit a similar profile to that of the original sample,
suggesting that the framework has been partially modified. Hence the modification of
activated framework is irreversible, in strong contrast to that of as-made sample.
Nonetheless, the other major IR bands of the recovered sample are still characteristic of the
organic linker, indicating that the entire activated framework has survived a compression
pressure of 9.3 GPa without a permanent breakdown although the local structures have
been modified.
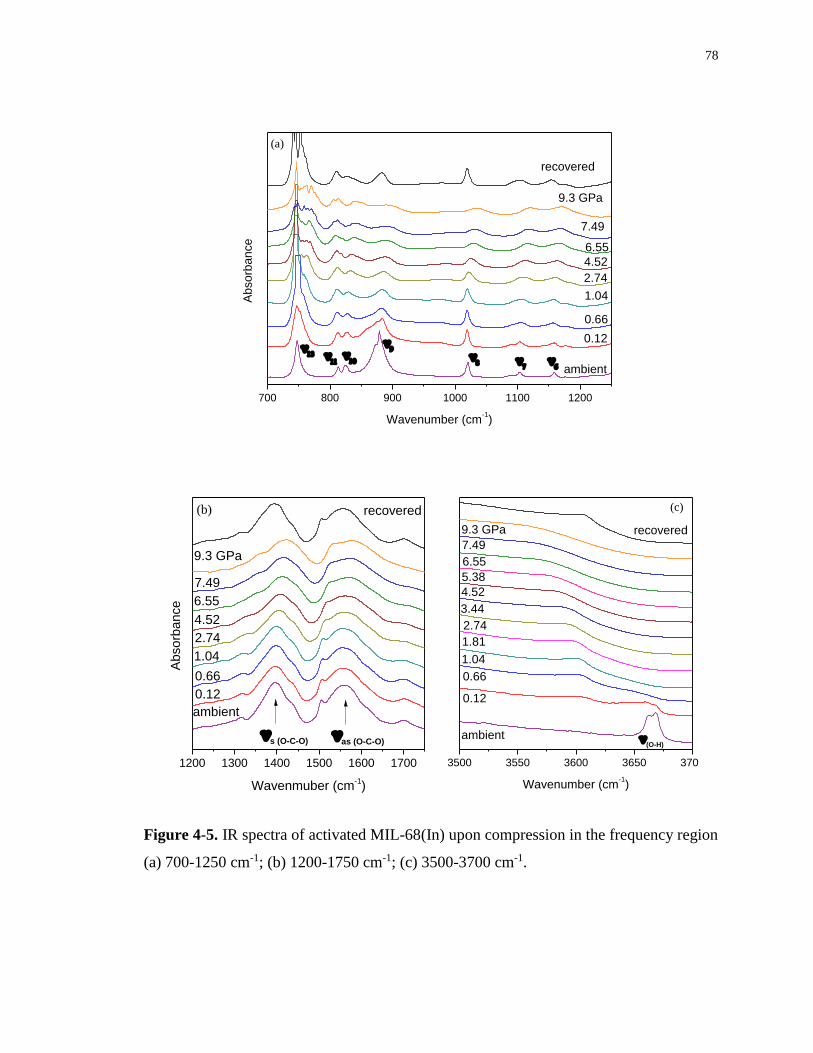
78
700 800 900 1000 1100 1200
Absorb
ance
Wavenumber (cm-1)
ambient
0.12
0.66
1.04
2.74
4.52
6.55
7.49
9.3 GPa
recovered
(a)
1200 1300 1400 1500 1600 1700
Absorb
ance
as (O-C-O)
s (O-C-O)
Wavenmuber (cm-1)
ambient
0.12
0.66
1.04
2.74
4.52
6.55
7.49
9.3 GPa
recovered(b)
3500 3550 3600 3650 3700
Wavenumber (cm-1)
ambient
0.12
0.66
1.04
1.81
2.74
3.44
4.52
5.38
6.55
7.49
9.3 GPa recovered
(O-H)
(c)
Figure 4-5. IR spectra of activated MIL-68(In) upon compression in the frequency region
(a) 700-1250 cm-1; (b) 1200-1750 cm-1; (c) 3500-3700 cm-1.
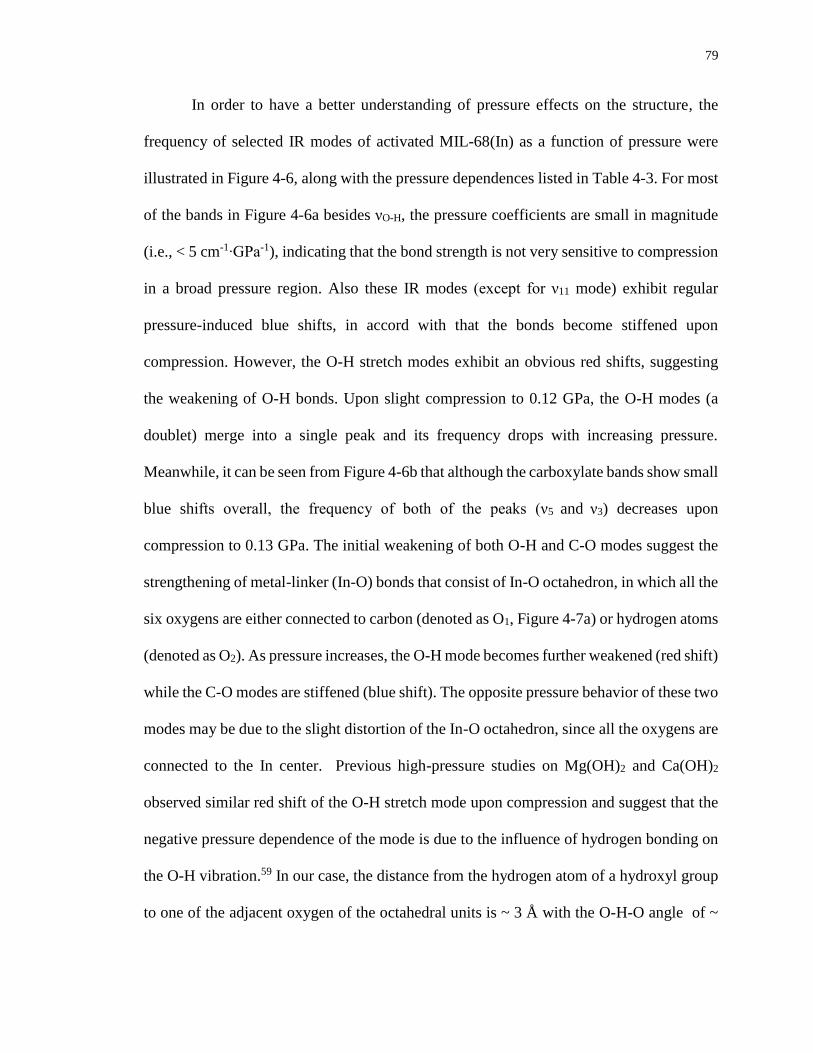
79
In order to have a better understanding of pressure effects on the structure, the
frequency of selected IR modes of activated MIL-68(In) as a function of pressure were
illustrated in Figure 4-6, along with the pressure dependences listed in Table 4-3. For most
of the bands in Figure 4-6a besides νO-H, the pressure coefficients are small in magnitude
(i.e., < 5 cm-1∙GPa-1), indicating that the bond strength is not very sensitive to compression
in a broad pressure region. Also these IR modes (except for ν11 mode) exhibit regular
pressure-induced blue shifts, in accord with that the bonds become stiffened upon
compression. However, the O-H stretch modes exhibit an obvious red shifts, suggesting
the weakening of O-H bonds. Upon slight compression to 0.12 GPa, the O-H modes (a
doublet) merge into a single peak and its frequency drops with increasing pressure.
Meanwhile, it can be seen from Figure 4-6b that although the carboxylate bands show small
blue shifts overall, the frequency of both of the peaks (ν5 and ν3) decreases upon
compression to 0.13 GPa. The initial weakening of both O-H and C-O modes suggest the
strengthening of metal-linker (In-O) bonds that consist of In-O octahedron, in which all the
six oxygens are either connected to carbon (denoted as O1, Figure 4-7a) or hydrogen atoms
(denoted as O2). As pressure increases, the O-H mode becomes further weakened (red shift)
while the C-O modes are stiffened (blue shift). The opposite pressure behavior of these two
modes may be due to the slight distortion of the In-O octahedron, since all the oxygens are
connected to the In center. Previous high-pressure studies on Mg(OH)2 and Ca(OH)2
observed similar red shift of the O-H stretch mode upon compression and suggest that the
negative pressure dependence of the mode is due to the influence of hydrogen bonding on
the O-H vibration.59 In our case, the distance from the hydrogen atom of a hydroxyl group
to one of the adjacent oxygen of the octahedral units is ~ 3 Å with the O-H-O angle of ~
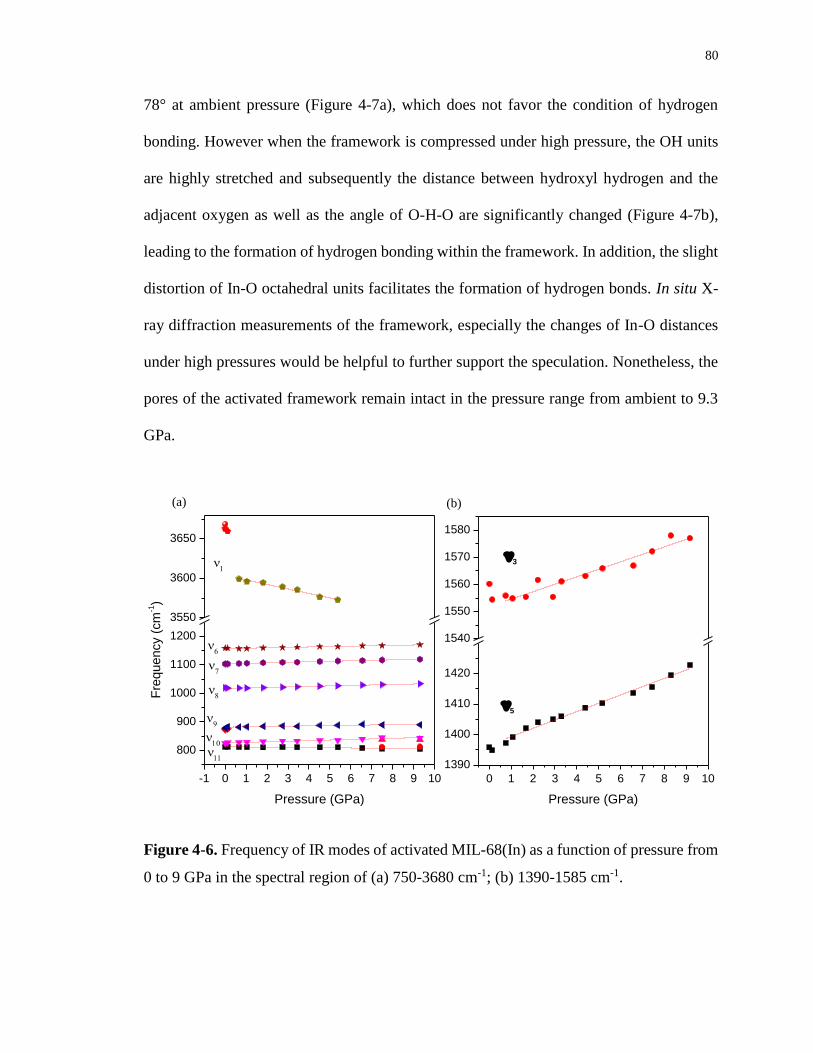
80
78° at ambient pressure (Figure 4-7a), which does not favor the condition of hydrogen
bonding. However when the framework is compressed under high pressure, the OH units
are highly stretched and subsequently the distance between hydroxyl hydrogen and the
adjacent oxygen as well as the angle of O-H-O are significantly changed (Figure 4-7b),
leading to the formation of hydrogen bonding within the framework. In addition, the slight
distortion of In-O octahedral units facilitates the formation of hydrogen bonds. In situ X-
ray diffraction measurements of the framework, especially the changes of In-O distances
under high pressures would be helpful to further support the speculation. Nonetheless, the
pores of the activated framework remain intact in the pressure range from ambient to 9.3
GPa.
-1 0 1 2 3 4 5 6 7 8 9 10
800
900
1000
1100
1200
3550
3600
3650
Fre
qu
en
cy (
cm
-1)
Pressure (GPa)
(a)
0 1 2 3 4 5 6 7 8 9 10
1390
1400
1410
1420
1540
1550
1560
1570
1580
3
Pressure (GPa)
(b)
5
Figure 4-6. Frequency of IR modes of activated MIL-68(In) as a function of pressure from
0 to 9 GPa in the spectral region of (a) 750-3680 cm-1; (b) 1390-1585 cm-1.
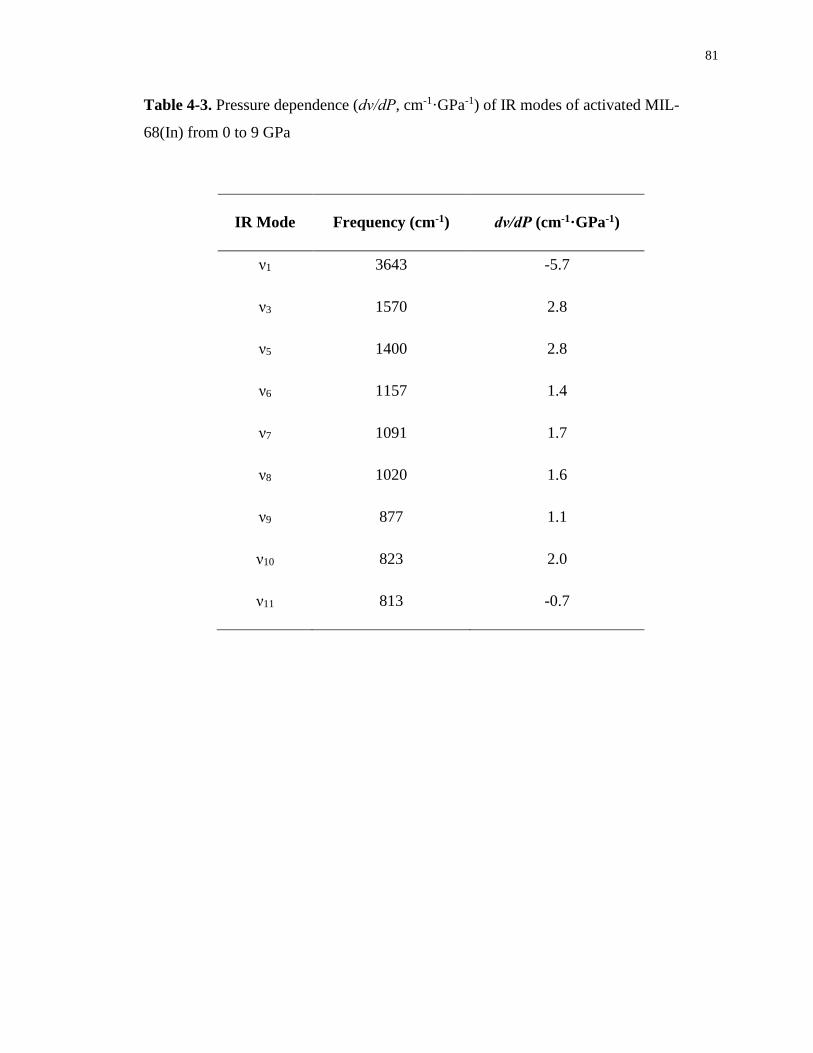
81
Table 4-3. Pressure dependence (dν/dP, cm-1·GPa-1) of IR modes of activated MIL-
68(In) from 0 to 9 GPa
IR Mode Frequency (cm-1) dν/dP (cm-1·GPa-1)
ν1 3643 -5.7
ν3 1570 2.8
ν5 1400 2.8
ν6 1157 1.4
ν7 1091 1.7
ν8 1020 1.6
ν9 877 1.1
ν10 823 2.0
ν11 813 -0.7
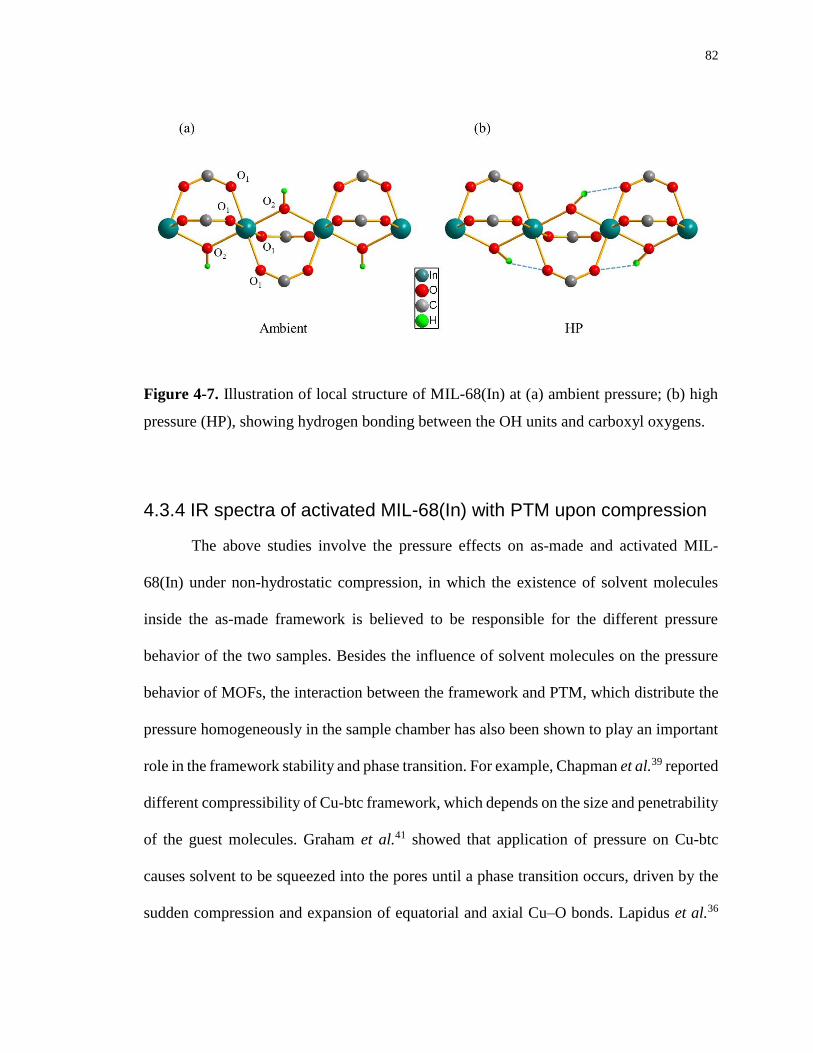
82
Figure 4-7. Illustration of local structure of MIL-68(In) at (a) ambient pressure; (b) high
pressure (HP), showing hydrogen bonding between the OH units and carboxyl oxygens.
4.3.4 IR spectra of activated MIL-68(In) with PTM upon compression
The above studies involve the pressure effects on as-made and activated MIL-
68(In) under non-hydrostatic compression, in which the existence of solvent molecules
inside the as-made framework is believed to be responsible for the different pressure
behavior of the two samples. Besides the influence of solvent molecules on the pressure
behavior of MOFs, the interaction between the framework and PTM, which distribute the
pressure homogeneously in the sample chamber has also been shown to play an important
role in the framework stability and phase transition. For example, Chapman et al.39 reported
different compressibility of Cu-btc framework, which depends on the size and penetrability
of the guest molecules. Graham et al.41 showed that application of pressure on Cu-btc
causes solvent to be squeezed into the pores until a phase transition occurs, driven by the
sudden compression and expansion of equatorial and axial Cu–O bonds. Lapidus et al.36
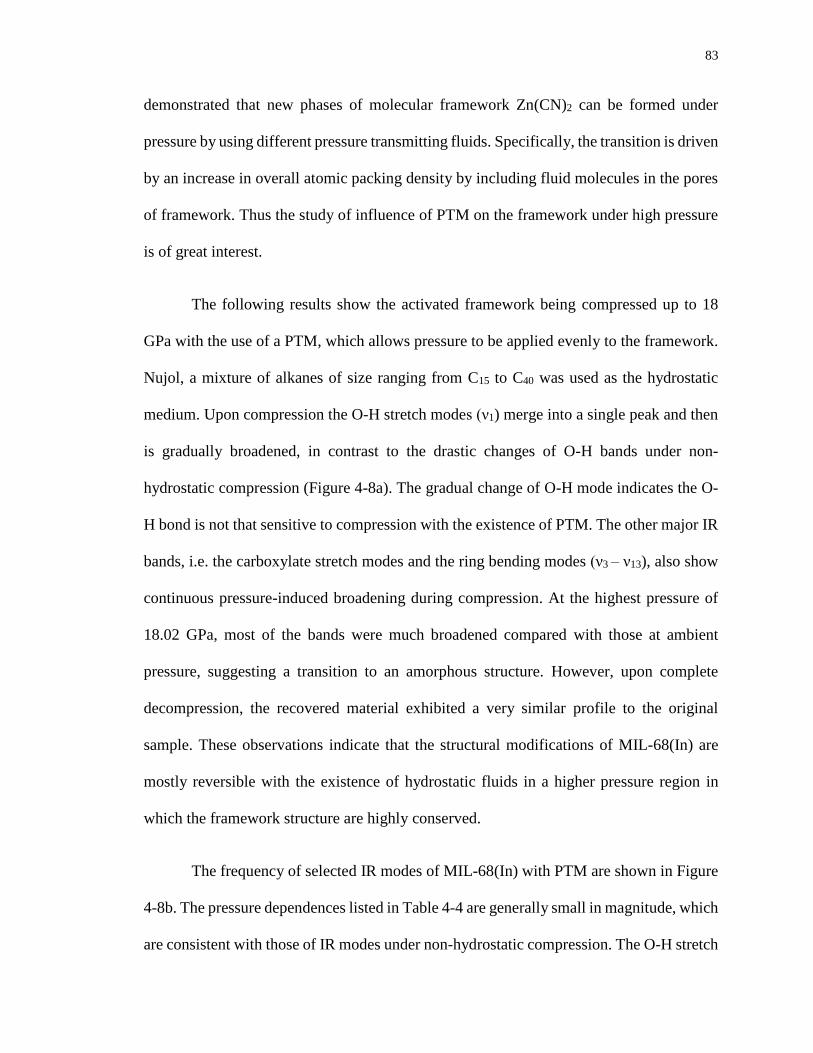
83
demonstrated that new phases of molecular framework Zn(CN)2 can be formed under
pressure by using different pressure transmitting fluids. Specifically, the transition is driven
by an increase in overall atomic packing density by including fluid molecules in the pores
of framework. Thus the study of influence of PTM on the framework under high pressure
is of great interest.
The following results show the activated framework being compressed up to 18
GPa with the use of a PTM, which allows pressure to be applied evenly to the framework.
Nujol, a mixture of alkanes of size ranging from C15 to C40 was used as the hydrostatic
medium. Upon compression the O-H stretch modes (ν1) merge into a single peak and then
is gradually broadened, in contrast to the drastic changes of O-H bands under non-
hydrostatic compression (Figure 4-8a). The gradual change of O-H mode indicates the O-
H bond is not that sensitive to compression with the existence of PTM. The other major IR
bands, i.e. the carboxylate stretch modes and the ring bending modes (ν3 – ν13), also show
continuous pressure-induced broadening during compression. At the highest pressure of
18.02 GPa, most of the bands were much broadened compared with those at ambient
pressure, suggesting a transition to an amorphous structure. However, upon complete
decompression, the recovered material exhibited a very similar profile to the original
sample. These observations indicate that the structural modifications of MIL-68(In) are
mostly reversible with the existence of hydrostatic fluids in a higher pressure region in
which the framework structure are highly conserved.
The frequency of selected IR modes of MIL-68(In) with PTM are shown in Figure
4-8b. The pressure dependences listed in Table 4-4 are generally small in magnitude, which
are consistent with those of IR modes under non-hydrostatic compression. The O-H stretch
84
mode still shows red shift as pressure increases, indicating the weakening of the O-H bond.
However, the lower pressure dependence of the OH mode (-1.03 cm-1/GPa) in the region
2-18 GPa, compared to that (-5.67 cm-1/GPa) under non-hydrostatic compression indicates
that the OH units are less pressure-sensitive with the existence of PTM in a much broader
pressure range. The pressure dependences of all the other modes of MIL-68(In) are lower
than those of activated framework as well, suggesting that the framework is less
compressible in the company of PTM. The enhanced stability of the framework usually
results from the pressure-induced inclusion of guest molecules in the pores of MOFs. For
example, previous X-ray studies on ZIF-8 showed that the framework began to amorphize
at 0.34 GPa without PTM, whereas stayed crystalline at 1.47 GPa with PTM due to its
interaction with the framework.32,33 For MIL-68 (In), the guest nujol molecules are small
enough (5-7 Å) to be forced into the large hexagonal channels of the framework upon
compression.60 The space-filling mechanism makes the framework more resilient to
compression and thus the OH units are much less pressure-sensitive.
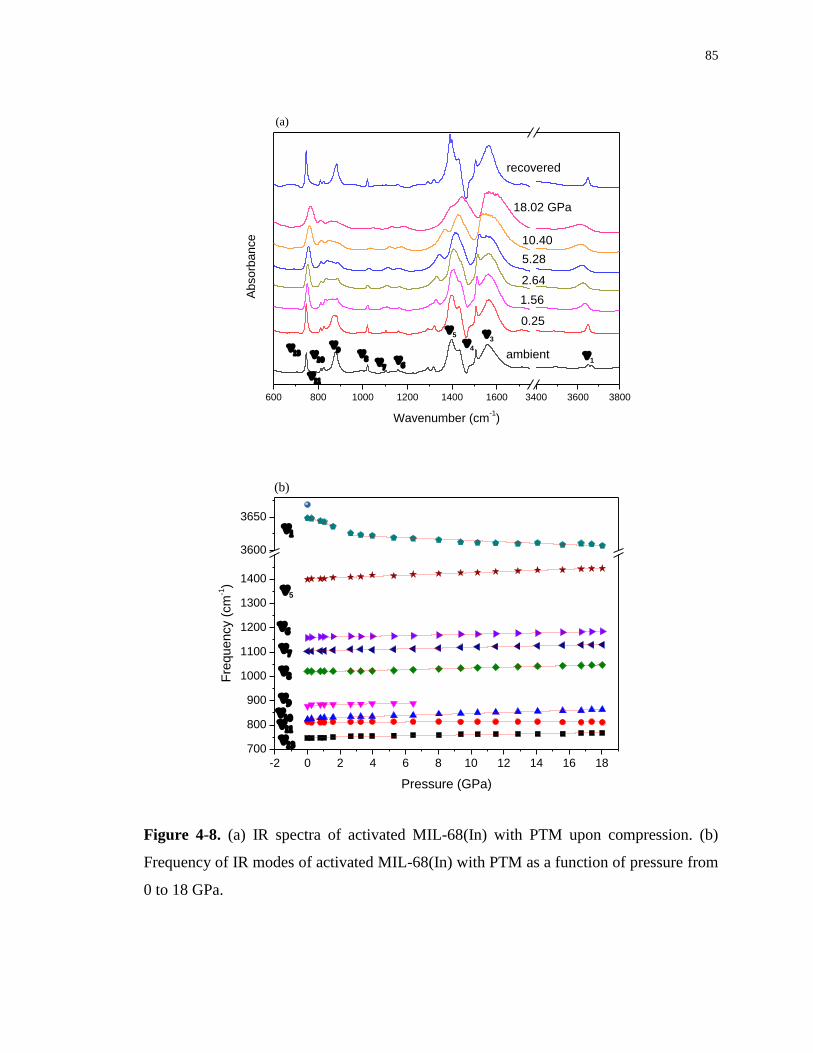
85
600 800 1000 1200 1400 1600 3400 3600 3800
4
3
5
Absorb
ance
Wavenumber (cm-1)
ambient
0.25
1.56
2.64
5.28
10.40
18.02 GPa
recovered
1
(a)
-2 0 2 4 6 8 10 12 14 16 18
700
800
900
1000
1100
1200
1300
1400
3600
3650
5
Fre
quency (
cm
-1)
Pressure (GPa)
(b)
Figure 4-8. (a) IR spectra of activated MIL-68(In) with PTM upon compression. (b)
Frequency of IR modes of activated MIL-68(In) with PTM as a function of pressure from
0 to 18 GPa.
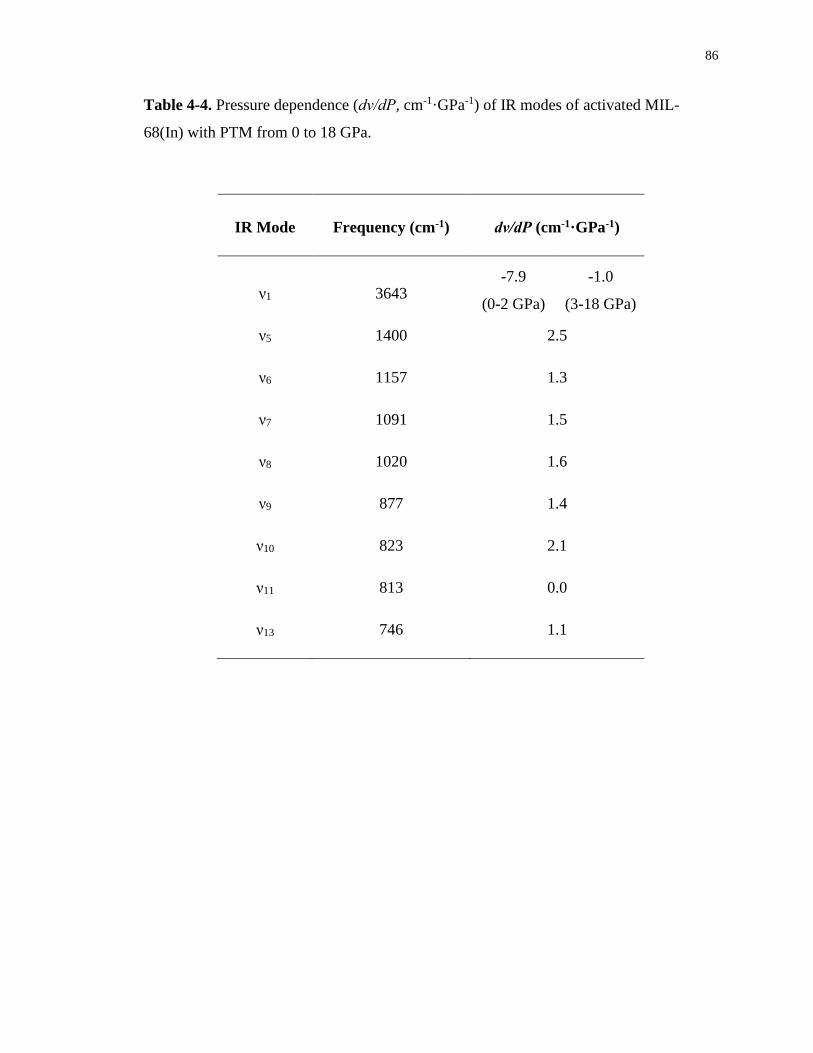
86
Table 4-4. Pressure dependence (dν/dP, cm-1·GPa-1) of IR modes of activated MIL-
68(In) with PTM from 0 to 18 GPa.
IR Mode Frequency (cm-1) dν/dP (cm-1·GPa-1)
ν1 3643 -7.9
(0-2 GPa)
-1.0
(3-18 GPa)
ν5 1400 2.5
ν6 1157 1.3
ν7 1091 1.5
ν8 1020 1.6
ν9 877 1.4
ν10 823 2.1
ν11 813 0.0
ν13 746 1.1
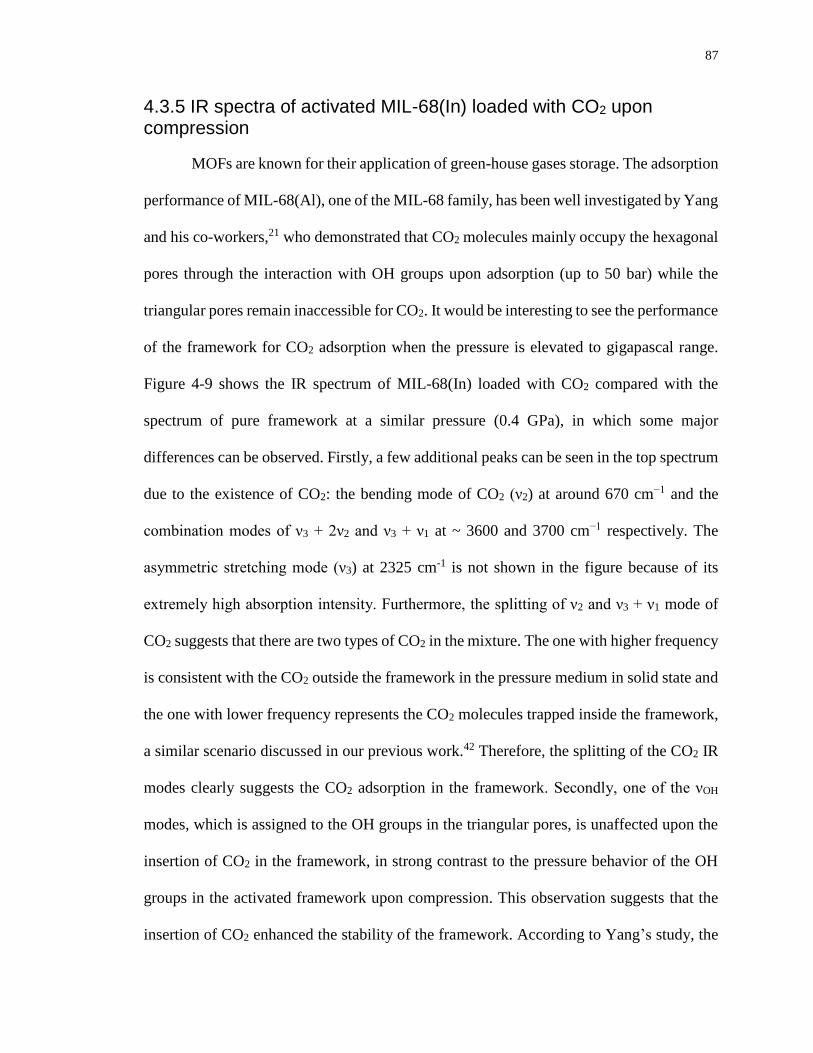
87
4.3.5 IR spectra of activated MIL-68(In) loaded with CO2 upon compression
MOFs are known for their application of green-house gases storage. The adsorption
performance of MIL-68(Al), one of the MIL-68 family, has been well investigated by Yang
and his co-workers,21 who demonstrated that CO2 molecules mainly occupy the hexagonal
pores through the interaction with OH groups upon adsorption (up to 50 bar) while the
triangular pores remain inaccessible for CO2. It would be interesting to see the performance
of the framework for CO2 adsorption when the pressure is elevated to gigapascal range.
Figure 4-9 shows the IR spectrum of MIL-68(In) loaded with CO2 compared with the
spectrum of pure framework at a similar pressure (0.4 GPa), in which some major
differences can be observed. Firstly, a few additional peaks can be seen in the top spectrum
due to the existence of CO2: the bending mode of CO2 (ν2) at around 670 cm−1 and the
combination modes of ν3 + 2ν2 and ν3 + ν1 at ~ 3600 and 3700 cm−1 respectively. The
asymmetric stretching mode (ν3) at 2325 cm-1 is not shown in the figure because of its
extremely high absorption intensity. Furthermore, the splitting of ν2 and ν3 + ν1 mode of
CO2 suggests that there are two types of CO2 in the mixture. The one with higher frequency
is consistent with the CO2 outside the framework in the pressure medium in solid state and
the one with lower frequency represents the CO2 molecules trapped inside the framework,
a similar scenario discussed in our previous work.42 Therefore, the splitting of the CO2 IR
modes clearly suggests the CO2 adsorption in the framework. Secondly, one of the νOH
modes, which is assigned to the OH groups in the triangular pores, is unaffected upon the
insertion of CO2 in the framework, in strong contrast to the pressure behavior of the OH
groups in the activated framework upon compression. This observation suggests that the
insertion of CO2 enhanced the stability of the framework. According to Yang’s study, the
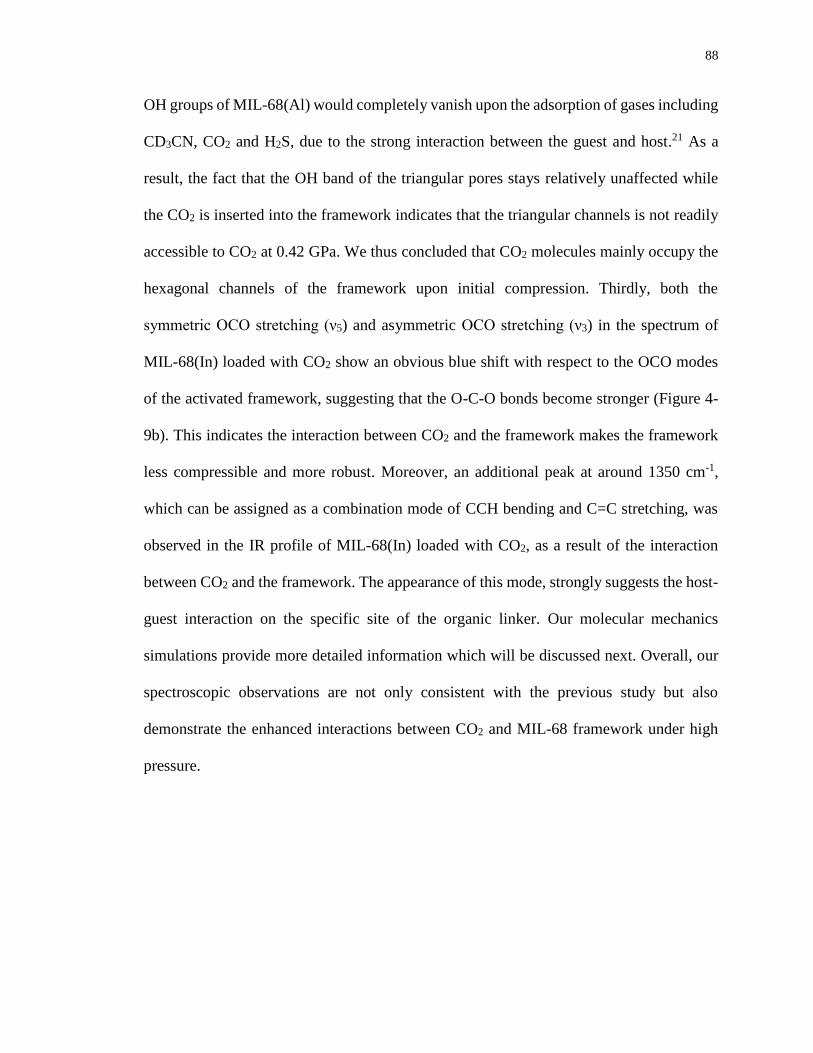
88
OH groups of MIL-68(Al) would completely vanish upon the adsorption of gases including
CD3CN, CO2 and H2S, due to the strong interaction between the guest and host.21 As a
result, the fact that the OH band of the triangular pores stays relatively unaffected while
the CO2 is inserted into the framework indicates that the triangular channels is not readily
accessible to CO2 at 0.42 GPa. We thus concluded that CO2 molecules mainly occupy the
hexagonal channels of the framework upon initial compression. Thirdly, both the
symmetric OCO stretching (ν5) and asymmetric OCO stretching (ν3) in the spectrum of
MIL-68(In) loaded with CO2 show an obvious blue shift with respect to the OCO modes
of the activated framework, suggesting that the O-C-O bonds become stronger (Figure 4-
9b). This indicates the interaction between CO2 and the framework makes the framework
less compressible and more robust. Moreover, an additional peak at around 1350 cm-1,
which can be assigned as a combination mode of CCH bending and C=C stretching, was
observed in the IR profile of MIL-68(In) loaded with CO2, as a result of the interaction
between CO2 and the framework. The appearance of this mode, strongly suggests the host-
guest interaction on the specific site of the organic linker. Our molecular mechanics
simulations provide more detailed information which will be discussed next. Overall, our
spectroscopic observations are not only consistent with the previous study but also
demonstrate the enhanced interactions between CO2 and MIL-68 framework under high
pressure.
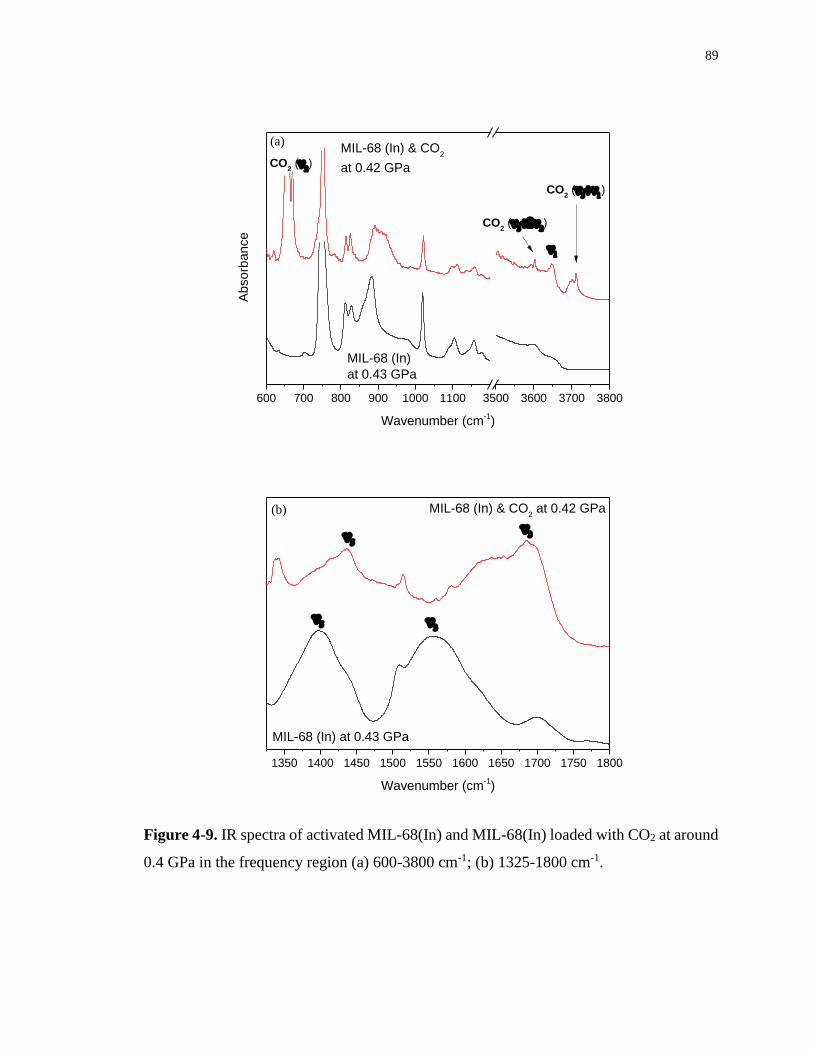
89
600 700 800 900 1000 1100 3500 3600 3700 3800
MIL-68 (In)
at 0.43 GPa
CO2 (
)
CO2 (
)
MIL-68 (In) & CO2
at 0.42 GPaCO2 (
)
Absorb
ance
Wavenumber (cm-1)
(a)
1350 1400 1450 1500 1550 1600 1650 1700 1750 1800
Wavenumber (cm-1)
MIL-68 (In) & CO2 at 0.42 GPa(b)
MIL-68 (In) at 0.43 GPa
Figure 4-9. IR spectra of activated MIL-68(In) and MIL-68(In) loaded with CO2 at around
0.4 GPa in the frequency region (a) 600-3800 cm-1; (b) 1325-1800 cm-1.
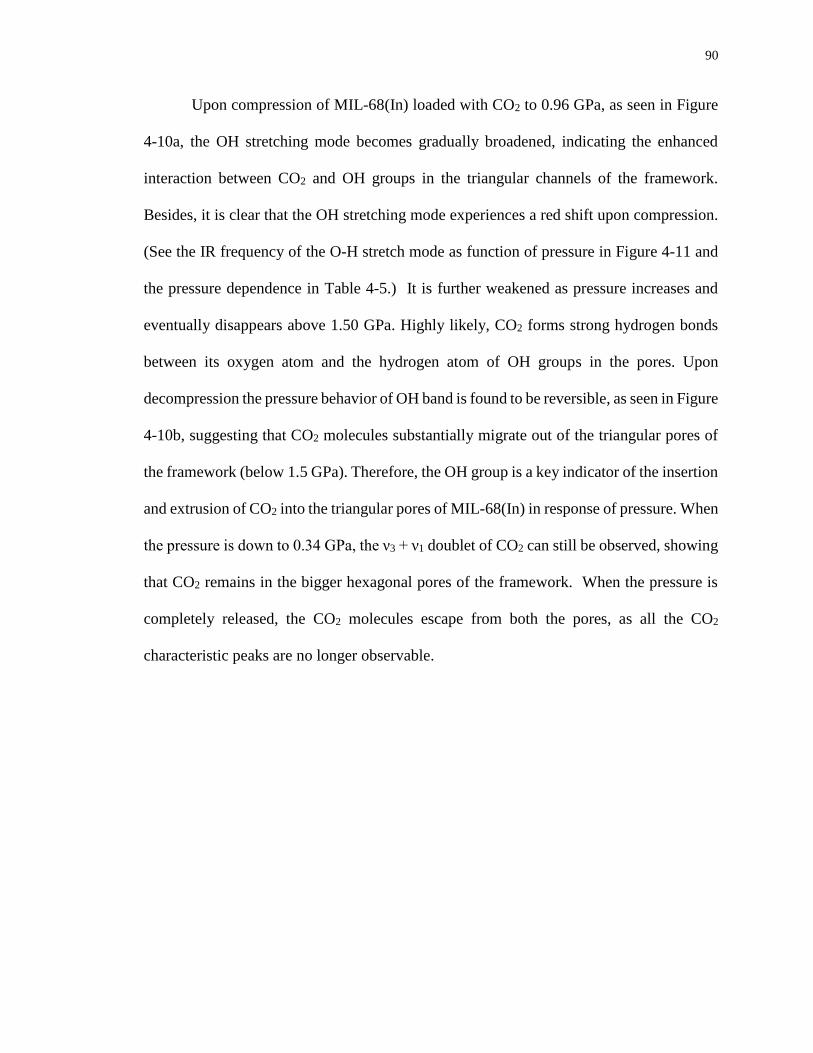
90
Upon compression of MIL-68(In) loaded with CO2 to 0.96 GPa, as seen in Figure
4-10a, the OH stretching mode becomes gradually broadened, indicating the enhanced
interaction between CO2 and OH groups in the triangular channels of the framework.
Besides, it is clear that the OH stretching mode experiences a red shift upon compression.
(See the IR frequency of the O-H stretch mode as function of pressure in Figure 4-11 and
the pressure dependence in Table 4-5.) It is further weakened as pressure increases and
eventually disappears above 1.50 GPa. Highly likely, CO2 forms strong hydrogen bonds
between its oxygen atom and the hydrogen atom of OH groups in the pores. Upon
decompression the pressure behavior of OH band is found to be reversible, as seen in Figure
4-10b, suggesting that CO2 molecules substantially migrate out of the triangular pores of
the framework (below 1.5 GPa). Therefore, the OH group is a key indicator of the insertion
and extrusion of CO2 into the triangular pores of MIL-68(In) in response of pressure. When
the pressure is down to 0.34 GPa, the ν3 + ν1 doublet of CO2 can still be observed, showing
that CO2 remains in the bigger hexagonal pores of the framework. When the pressure is
completely released, the CO2 molecules escape from both the pores, as all the CO2
characteristic peaks are no longer observable.
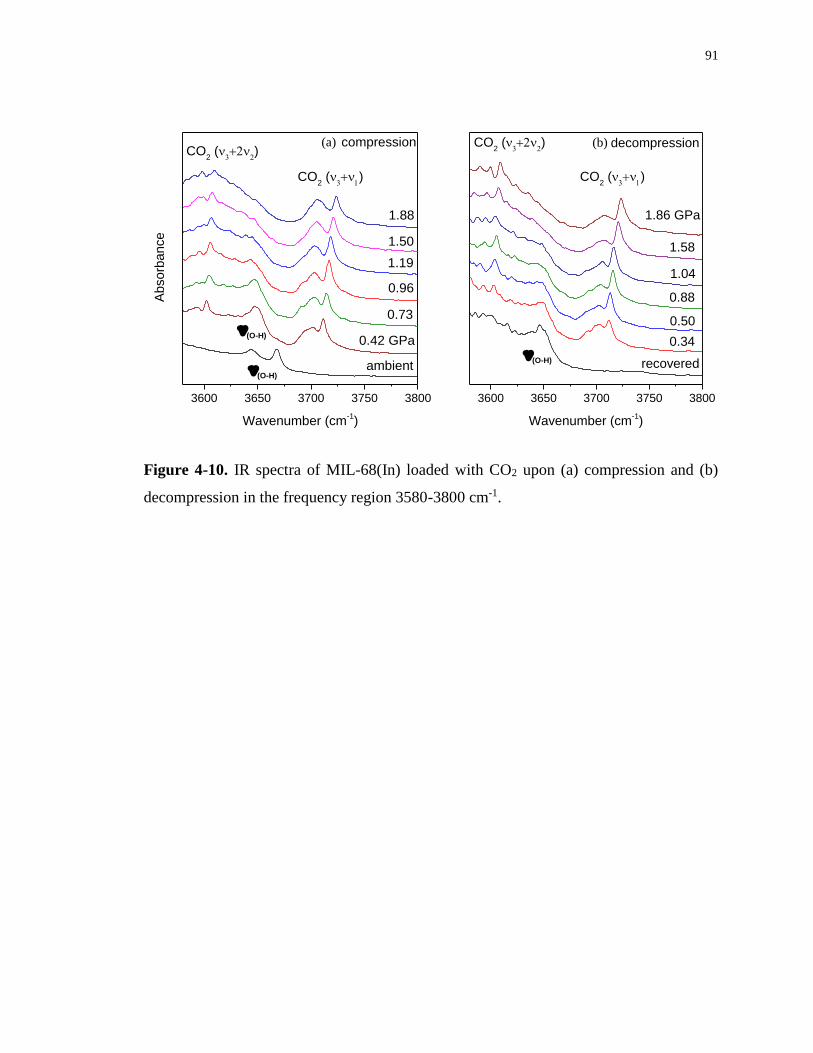
91
3600 3650 3700 3750 3800
(O-H)
CO2 (
)
Absorb
ance
Wavenumber (cm-1)
(a)
(O-H)
ambient
CO2 (
)
compression
0.42 GPa
0.73
0.96
1.19
1.50
1.88
3600 3650 3700 3750 3800
(O-H)
CO2 (
)
CO2 (
)
Wavenumber (cm-1)
decompression
1.86 GPa
1.58
1.04
0.88
0.50
0.34
recovered
(b)
Figure 4-10. IR spectra of MIL-68(In) loaded with CO2 upon (a) compression and (b)
decompression in the frequency region 3580-3800 cm-1.
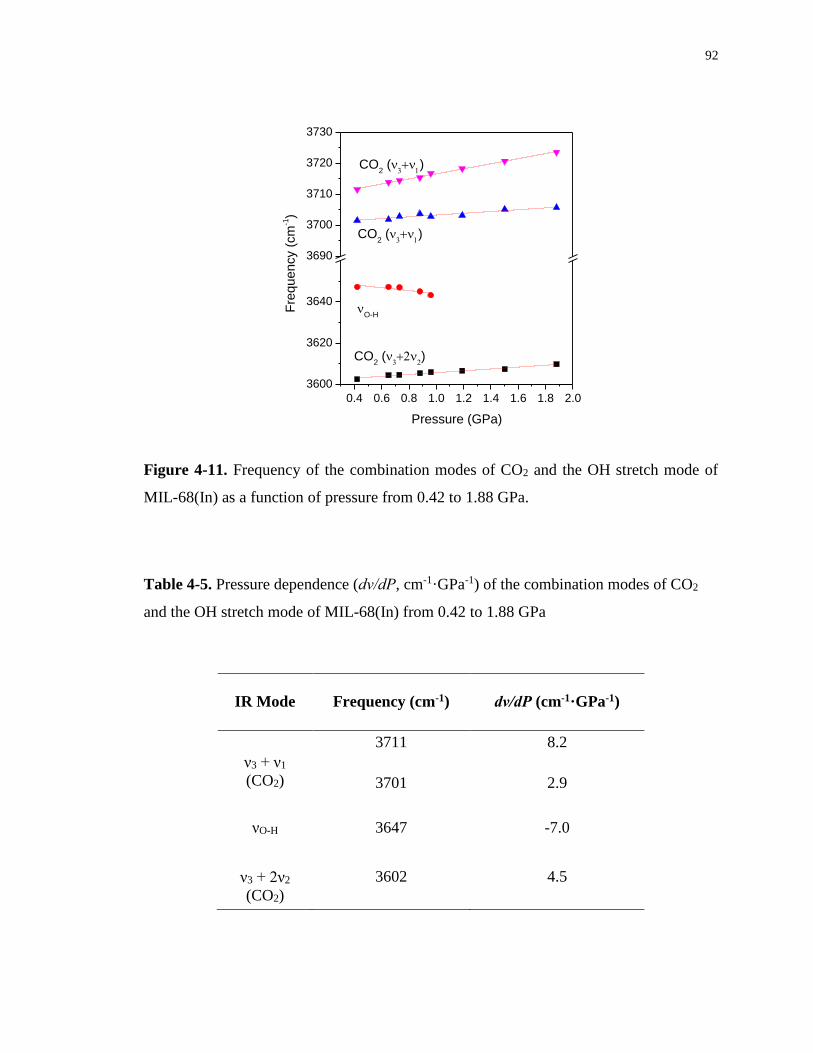
92
0.4 0.6 0.8 1.0 1.2 1.4 1.6 1.8 2.0
3600
3620
3640
3690
3700
3710
3720
3730
O-H
CO2 (
)
CO2 (
)
CO2 (
)
Fre
quency (
cm
-1)
Pressure (GPa)
Figure 4-11. Frequency of the combination modes of CO2 and the OH stretch mode of
MIL-68(In) as a function of pressure from 0.42 to 1.88 GPa.
Table 4-5. Pressure dependence (dν/dP, cm-1·GPa-1) of the combination modes of CO2
and the OH stretch mode of MIL-68(In) from 0.42 to 1.88 GPa
IR Mode Frequency (cm-1) dν/dP (cm-1·GPa-1)
ν3 + ν1
(CO2)
3711 8.2
3701 2.9
νO-H 3647 -7.0
ν3 + 2ν2
(CO2)
3602 4.5
93
4.4 Discussion
The above results showed different pressure behavior among four different
systems: the as-made MIL-68(In), the activated framework, the activated sample with PTM
and the activated framework loaded with CO2. In the pressure range of 0-9 GPa, the
activated framework undergoes an irreversible transformation upon recovery, whereas the
as-made framework and especially the OH units experience a completely reversible
deformation. The solvent molecules occluded in the channels of as-made framework are
believed to play a key role in restoring the structure and crystallinity of the framework
when the pressure was released. Prior studies of as-made ZSM-5 (Zeolite Socony Mobil–
5)61 under high pressure showed that the interaction between the template molecules and
zeolite framework preserves the local structures associated with the original topology at
high pressure. Upon releasing pressure, the template redirects the silicate species to
partially reform the initial topology. For as-made framework of MIL-68(In), the solvent
molecules DMF may play similar role to that of template molecules in ZSM-5. For the
activated framework, the weakening and soft behavior of OH modes is associated with the
formation of hydrogen bonding between the adjacent In-O octahedrons within the
framework. The OH modes are not recovered upon complete decompression as the empty
framework is partially modified during compression. The existence of solvent molecules
is thus clearly pivotal to the reversibility of the framework.
The stability of activated MIL-68(In) is significantly enhanced when nujol is added
as the hydrostatic medium with the sample, because of the pressure-induced insertion of
nujol into the pores of the framework. Previous high-pressure studies of porous molecular
frameworks have demonstrated the potential for fluid molecules to progressively fill the
94
pores with increasing pressure.36,39,40 For MIL-68(In), the nujol molecules act as an inert
space-filling agent which makes the framework more resistant to pressure. As a result, the
OH units remain unaffected and are much less sensitive to pressure than that of the
framework without hydrostatic medium.
As guest molecules to the MIL-68 framework, both nujol and CO2 were found to
enhance the stability of the framework. However, they have different impacts on the
compression behavior of the MIL-68(In) framework, especially on the OH bridging units.
Nujol appears to serve as the physical space-filling agent that makes the framework less
compressible and thus the OH groups remain intact and only show red shift upon
compression. In contrast, CO2 not only serves as a pressure medium, but chemically
interacts with the framework. Due to the strong interaction of hydrogen bonding between
the OH units and CO2, the IR intensity of the OH band of the hexagonal pores substantially
diminished upon initial CO2 loading (even at 1 atm) while the OH band of the triangular
pores without CO2 occupying remains. At elevated pressure around 1.5 GPa, the OH band
of the triangular pores finally vanishes as CO2 are forced into the small channels. These
unique signatures strongly suggest the chemical nature of the guest-host interaction in the
CO2 loaded activated framework.
The differential accessibility exhibited by the hexagonal pores (i.e., for CO2 or other
larger guest molecules (nujol) at low pressures, e.g., < 0.35 GPa) the triangular pores (i.e.,
for CO2 at elevated pressure of > 1.5 GPa) is of great interest. Yang’s computational study21
demonstrated that CO2 molecules are preferentially accommodated in the triangular pores
due to a higher degree of confinement that creates the strongest energetic adsorption sites.
However, the MIL-68(Al) framework in their work was not fully activated, thus leaving
95
the triangular pores inaccessible for small gas molecules under adsorption pressure (up to
50 bar). Our study is thus not inconsistent with the previous work at pressures that are
lower than 1 GPa. When pressure was extended to 1.5 GPa, the CO2 molecules can be
squeezed into the triangular channels and the process is found to be reversible upon
decompression. Thus pressure can play a regulating role in the insertion and extrusion of
CO2 molecules with respect to the triangular pores of MIL-68(In). The CO2 adsorption in
the triangular pores of MIL-68(In) is herein reported for the first time experimentally.
To understand the differential binding affinity of CO2 inside the MIL-68 framework
and the origin of the chemical nature of guest-host interactions at high pressures, we
performed Grand Canonical Monte Carlo simulations on the adsorption behavior of CO2
at different external compression pressures. Figure 4-11 shows the CO2 probability density
distributions in the MIL-68 framework at three representative pressures, i.e., ambient, 0.1
GPa and 10 GPa. These pressures were chosen to examine 1) the reproducibility of the
simulation method on the adsorption behaviour of CO2 studied before and 2) the trend and
pressure-dependence of CO2 adsorption at relatively lower and higher pressure aligned
with the two experimentally identified pressure regions. At ambient pressure, the
simulations show a CO2 probability density of 90% at the triangular channel centre,
suggesting that the triangular channel is the preferred binding sites. This result is consistent
with that by Yang et al.21 When compressed to about 1 kbar, the CO2 distribution density
is substantially shifted to the hexagonal channel. Although some density is found in the
triangular channel at this pressure, the CO2 probability density in the hexagonal channel is
dominant over the triangular channels with a ratio of 90%:10%, highly consistent with our
experimental observation that at below 0.35 GPa, the hexagonal channel is the preferential
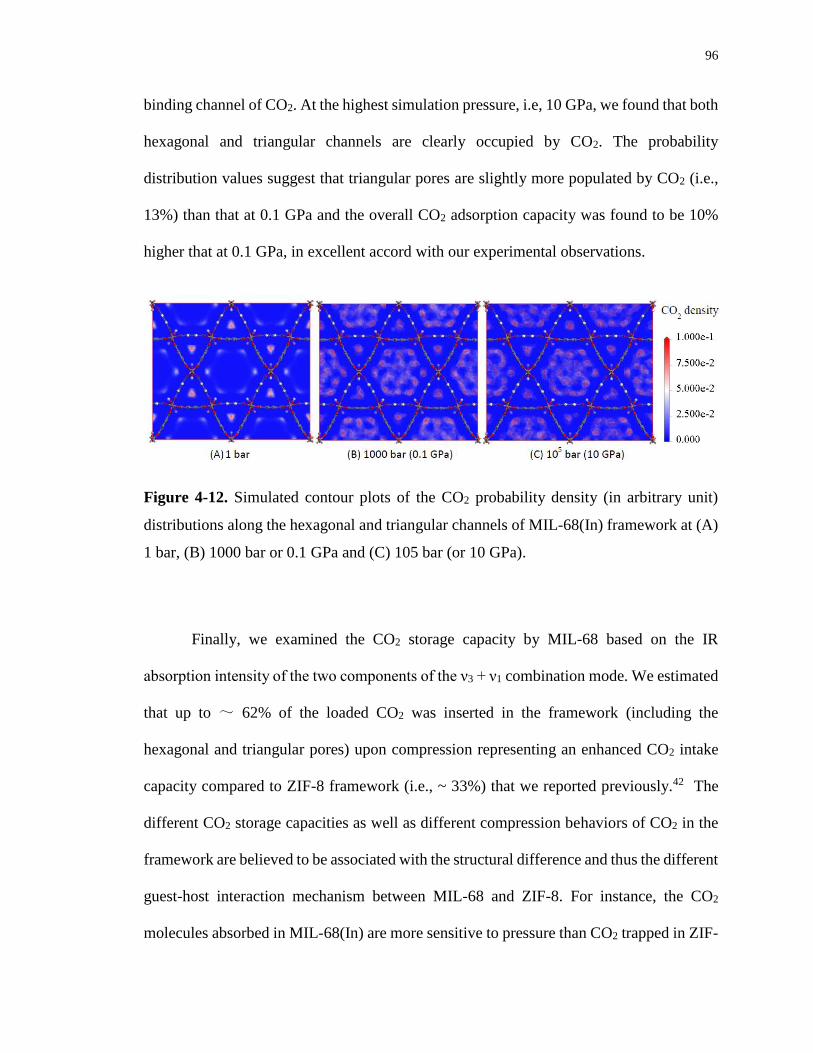
96
binding channel of CO2. At the highest simulation pressure, i.e, 10 GPa, we found that both
hexagonal and triangular channels are clearly occupied by CO2. The probability
distribution values suggest that triangular pores are slightly more populated by CO2 (i.e.,
13%) than that at 0.1 GPa and the overall CO2 adsorption capacity was found to be 10%
higher that at 0.1 GPa, in excellent accord with our experimental observations.
Figure 4-12. Simulated contour plots of the CO2 probability density (in arbitrary unit)
distributions along the hexagonal and triangular channels of MIL-68(In) framework at (A)
1 bar, (B) 1000 bar or 0.1 GPa and (C) 105 bar (or 10 GPa).
Finally, we examined the CO2 storage capacity by MIL-68 based on the IR
absorption intensity of the two components of the ν3 + ν1 combination mode. We estimated
that up to ~ 62% of the loaded CO2 was inserted in the framework (including the
hexagonal and triangular pores) upon compression representing an enhanced CO2 intake
capacity compared to ZIF-8 framework (i.e., ~ 33%) that we reported previously.42 The
different CO2 storage capacities as well as different compression behaviors of CO2 in the
framework are believed to be associated with the structural difference and thus the different
guest-host interaction mechanism between MIL-68 and ZIF-8. For instance, the CO2
molecules absorbed in MIL-68(In) are more sensitive to pressure than CO2 trapped in ZIF-
97
8. According to Figure 4-10a, the pressure dependences for ν3 + 2ν2 and ν3 + ν1 mode of
CO2 inside the framework of MIL-68(In) are 4.47 and 2.88 cm-1·GPa-1 respectively, which
are higher than those of CO2 trapped in ZIF-8.42 This is mainly due to the difference in the
pore size and opening between the two frameworks. ZIF-8 has three-dimensional cavities
with a small window size (3.4 Å), while MIL-68 (In) contains much larger one-dimensional
open channels (16 Å for the hexagonal channel and 6 Å for the triangular channel). Once
trapped, CO2 molecules in MIL-68(In) have a less confined environment than CO2 inside
the cavities of ZIF-8 and thus are more pressure-sensitive. Moreover, the CO2 adsorption
mechanism and the host-guest interactions vary in the two frameworks. For CO2 adsorption
in ZIF-8, the framework flexibility and pressure-induced enlargement of pore opening play
an important role in the facilitation of CO2 insertion, which mainly locate in the regions
close to the organic imidazolate linkers through van der Waals' interaction.62 On the other
hand, the MIL-68(In) framework contains the OH units, which serve as the binding sites
for CO2 adsorption through hydrogen bonding between each other. It has been established
that in order to enhance the CO2 binding affinity in MOFs, three main approaches are most
intensively investigated which includes amine grafting, introducing strongly polarizing
functional groups and open metal cation sites.63 In this case, the OH units of MIL-68(In)
serve as functional groups that can offer enhancement of CO2–MOF interactions. As a
result, CO2 molecules preferentially reside at the corners of the hexagonal pores near OH
units of the framework upon initial adsorption. Our molecular mechanics simulations
clearly suggest that the regions near the OH units in the hexagonal channels are the
preferential binding sites for CO2 with highest density distributions (Figure 4-11). Upon
further compression to above 1.5 GPa, CO2 substantially occupy both the whole hexagonal
98
pores and the triangular pores with larger regions than at lower pressures. Therefore the
existence of OH units as the CO2 binding sites makes the guest-host interaction stronger
for MIL-68(In), and the large pore sizes further contribute to the superior adsorption
performance of MIL-68(In).
4.5 Conclusions
In summary, the behavior of as-made and activated MIL-68(In) and their
reversibilities under high pressure were investigated by IR spectroscopy. Overall, the
structures of both frameworks are highly stable upon compression to 9 GPa, but with some
modifications on the local structure especially the bridging O-H units, which are very
sensitive to pressure. Upon the release of external pressure, the structural modifications
are found to be completely reversible for as-made MIL-68(In) while irreversible for the
activated framework. The difference in the reversibility of framework is attributed to the
solvent DMF molecules contained in the channels. In addition, the stability of the activated
framework was studied under hydrostatic compression by using PTM. The pressure-
induced inclusion of PTM makes the framework more resilient to pressure (18 GPa) and
the structural modifications are completely reversible upon decompression. Furthermore,
the performance of MIL-68(In) for CO2 adsorption under high pressure was investigated.
Our results show that the hexagonal pores are readily accessible for CO2 at relative low
pressures (e.g., < 0.35 GPa), while the triangular pores becomes accessible for CO2 at
elevated pressures (e.g., > 1.5 GPa). The pressure-regulated CO2 occupation in different
channels of the MIL-68 framework is found to be reversible between compression and
decompression. The unique adsorption behavior of CO2 in the framework is associated
99
with the OH units that contribute as the primary binding sites through hydrogen bonding
with CO2. These observations are strongly supported by our simulation results. The high
stability and enhanced CO2 adsorption of MIL-68(In) under high pressure makes it a
promising candidate for greenhouse gas storage.
4.6 Reference
(1) Furukawa, H.; Cordova, K. E.; O’Keeffe, M.; Yaghi, O. M. Science 2013, 341, 1230444.
(2) Sumida, K.; Rogow, D. L.; Mason, J. A.; McDonald, T. M.; Bloch, E. D.; Herm, Z. R.;
Bae, T. H.; Long, J. R. Chemical Reviews 2012, 112, 724.
(3) Furukawa, H.; Yaghi, O. M. Journal of the American Chemical Society 2009, 131, 8875.
(4) Murray, L. J.; Dinca, M.; Long, J. R. Chemical Society Reviews 2009, 38, 1294.
(5) Ma, S.; Zhou, H.-C. Chemical Communications 2010, 46, 44.
(6) Sculley, J.; Yuan, D.; Zhou, H.-C. Energy & Environmental Science 2011, 4, 2721.
(7) Li, J.-R.; Kuppler, R. J.; Zhou, H.-C. Chemical Society Reviews 2009, 38, 1477.
(8) Chen, B.; Xiang, S.; Qian, G. Accounts of Chemical Research 2010, 43, 1115.
(9) Li, J.-R.; Sculley, J.; Zhou, H.-C. Chemical Reviews 2011, 112, 869.
(10) Farrusseng, D.; Aguado, S.; Pinel, C. Angewandte Chemie International Edition 2009, 48,
7502.
(11) Lee, J.; Farha, O. K.; Roberts, J.; Scheidt, K. A.; Nguyen, S. T.; Hupp, J. T. Chemical
Society Reviews 2009, 38, 1450.
(12) Corma, A.; García, H.; Llabrés i Xamena, F. X. Chemical Reviews 2010, 110, 4606.
(13) Zhao, M.; Ou, S.; Wu, C.-D. Accounts of Chemical Research 2014, 47, 1199.
(14) Horcajada, P.; Serre, C.; Vallet-Regí, M.; Sebban, M.; Taulelle, F.; Férey, G. Angewandte
Chemie International Edition 2006, 118, 6120.
(15) Huxford, R. C.; Della Rocca, J.; Lin, W. Current Opinion in Chemical Biology 2010, 14,
262.
(16) McKinlay, A. C.; Morris, R. E.; Horcajada, P.; Férey, G.; Gref, R.; Couvreur, P.; Serre, C.
Angewandte Chemie International Edition 2010, 49, 6260.
100
(17) Della Rocca, J.; Liu, D.; Lin, W. Accounts of Chemical Research 2011, 44, 957.
(18) Barthelet, K.; Marrot, J.; Ferey, G.; Riou, D. Chemical Communications 2004, 5, 520.
(19) Volkringer, C.; Meddouri, M.; Loiseau, T.; Guillou, N.; Marrot, J. r. m.; Ferey, G. r.;
Haouas, M.; Taulelle, F.; Audebrand, N.; Latroche, M. Inorganic Chemistry 2008, 47,
11892.
(20) Fateeva, A.; Horcajada, P.; Devic, T.; Serre, C.; Marrot, J.; Grenèche, J.-M.; Morcrette,
M.; Tarascon, J.-M.; Maurin, G.; Férey, G. European Journal of Inorganic Chemistry
2010, 2010, 3789.
(21) Yang, Q.; Vaesen, S.; Vishnuvarthan, M.; Ragon, F.; Serre, C.; Vimont, A.; Daturi, M.; De
Weireld, G.; Maurin, G. Journal of Materials Chemistry 2012, 22, 10210.
(22) Wu, L.; Xue, M.; Qiu, S.-L.; Chaplais, G.; Simon-Masseron, A.; Patarin, J. Microporous
and Mesoporous Materials 2012, 157, 75.
(23) Bennett, T. D.; Tan, J. C.; Moggach, S. A.; Galvelis, R.; Mellot-Draznieks, C.; Reisner, B.
A.; Thirumurugan, A.; Allan, D. R.; Cheetham, A. K. Chemistry-A European Journal 2010,
16, 10684.
(24) Li, W.; Probert, M. R.; Kosa, M.; Bennett, T. D.; Thirumurugan, A.; Burwood, R. P.;
Parinello, M.; Howard, J. A. K.; Cheetham, A. K. Journal of the American Chemical
Society 2012, 134, 11940.
(25) Ogborn, J. M.; Collings, I. E.; Moggach, S. A.; Thompson, A. L.; Goodwin, A. L. Chemical
Science 2012, 3, 3011.
(26) Ortiz, A. U.; Boutin, A.; Fuchs, A. H.; Coudert, F.-X. Physical Review Letters 2012, 109,
195502.
(27) Ortiz, A. U.; Boutin, A.; Fuchs, A. H.; Coudert, F.-X. The Journal of Physical Chemistry
Letters 2013, 4, 1861.
(28) Cai, W.; Katrusiak, A. Nature Communications 2014, 5, 4337.
(29) Bennett, T. D.; Sotelo, J.; Tan, J.-C.; Moggach, S. A. CrystEngComm 2015, 17, 286.
(30) Serra-Crespo, P.; Dikhtiarenko, A.; Stavitski, E.; Juan-Alcaniz, J.; Kapteijn, F.; Coudert,
F.-X.; Gascon, J. CrystEngComm 2015, 17, 276.
(31) Su, Z.; Miao, Y.-R.; Mao, S.-M.; Zhang, G.-H.; Dillon, S.; Miller, J. T.; Suslick, K. S.
Journal of the American Chemical Society 2015, 137, 1750.
(32) Chapman, K. W.; Halder, G. J.; Chupas, P. J. Journal of the American Chemical Society
2009, 131, 17546.
(33) Moggach, S. A.; Bennett, T. D.; Cheetham, A. K. Angewandte Chemie International
Edition 2009, 48, 7087.
101
(34) Hu, Y.; Kazemian, H.; Rohani, S.; Huang, Y.; Song, Y. Chemical Communications 2011,
47, 12694.
(35) Gagnon, K. J.; Beavers, C. M.; Clearfield, A. Journal of the American Chemical Society
2013, 135, 1252.
(36) Lapidus, S. H.; Halder, G. J.; Chupas, P. J.; Chapman, K. W. Journal of the American
Chemical Society 2013, 135, 7621.
(37) Ortiz, A. U.; Boutin, A.; Gagnon, K. J.; Clearfield, A.; Coudert, F.-X. Journal of the
American Chemical Society 2014, 136, 11540.
(38) Spencer, E. C.; Kiran, M. S. R. N.; Li, W.; Ramamurty, U.; Ross, N. L.; Cheetham, A. K.
Angewandte Chemie International Edition 2014, 53, 5583.
(39) Chapman, K. W.; Halder, G. J.; Chupas, P. J. Journal of the American Chemical Society
2008, 130, 10524.
(40) Graham, A. J.; Allan, D. R.; Muszkiewicz, A.; Morrison, C. A.; Moggach, S. A.
Angewandte Chemie International Edition 2011, 50, 11138.
(41) Graham, A. J.; Tan, J.-C.; Allan, D. R.; Moggach, S. A. Chemical Communications 2012,
48, 1535.
(42) Hu, Y.; Liu, Z.; Xu, J.; Huang, Y.; Song, Y. Journal of the American Chemical Society
2013, 135, 9287.
(43) Graham, A. J.; Banu, A.-M.; Duren, T.; Greenaway, A.; McKellar, S. C.; Mowat, J. P. S.;
Ward, K.; Wright, P. A.; Moggach, S. A. Journal of the American Chemical Society 2014,
136, 8606.
(44) Li, Q.; Li, S.; Wang, K.; Liu, J.; Yang, K.; Liu, B.; Zou, G.; Zou, B. The Journal of Physical
Chemistry C 2014, 118, 5848.
(45) Haines, J.; Cambon, O.; Levelut, C.; Santoro, M.; Gorelli, F.; Garbarino, G. Journal of the
American Chemical Society 2010, 132, 8860.
(46) Lee, Y.; Liu, D.; Seoung, D.; Liu, Z. X.; Kao, C. C.; Vogt, T. Journal of the American
Chemical Society 2011, 133, 1674.
(47) Santoro, M.; Gorelli, F.; Haines, J.; Cambon, O.; Levelut, C.; Garbarino, G. Proceedings
of the National Academy of Sciences 2011, 108, 7689.
(48) Dong, Z. H.; Song, Y. Journal of Chemical Physics C 2010, 114, 1782.
(49) Delley, B. The Journal of Chemical Physics 2000, 113, 7756.
(50) Delley, B. The Journal of Chemical Physics 1990, 92, 508.
(51) Wang, Y.; Perdew, J. P. Physical Review B 1991, 44, 13298.
(52) Duren, T.; Bae, Y.-S.; Snurr, R. Q. Chemical Society Reviews 2009, 38, 1237.
102
(53) Mayo, S. L.; Olafson, B. D.; Goddard, W. A. Journal of Physical Chemistry 1990, 94,
8897.
(54) Martin, M. G.; Siepmann, J. I. Journal of Physical Chemistry B 1998, 102, 2569.
(55) Téllez S, C. A.; Hollauer, E.; Mondragon, M. A.; Castaño, V. M. Spectrochimica Acta Part
A: Molecular and Biomolecular Spectroscopy 2001, 57, 993.
(56) Jacobs, P. A.; Mortier, W. J. Zeolites 1982, 2, 226.
(57) Shearer, G.; Forselv, S.; Chavan, S.; Bordiga, S.; Mathisen, K.; Bjørgen, M.; Svelle, S.;
Lillerud, K. Topics in Catalysis 2013, 56, 770.
(58) Chen, B.; Wang, L.; Zapata, F.; Qian, G.; Lobkovsky, E. B. Journal of the American
Chemical Society 2008, 130, 6718.
(59) Kruger, M. B.; Williams, Q.; Jeanloz, R. The Journal of Chemical Physics 1989, 91, 5910.
(60) Grice, K.; Mesmay, R. d.; Glucina, A.; Wang, S. Organic Geochemistry 2008, 39, 284.
(61) Fu, Y. Q.; Song, Y.; Huang, Y. I. Journal of Physical Chemistry C 2012, 116, 2080.
(62) Perez-Pellitero, J.; Amrouche, H.; Siperstein, F. R.; Pirngruber, G.; Nieto-Draghi, C.;
Chaplais, G.; Simon-Masseron, A.; Bazer-Bachi, D.; Peralta, D.; Bats, N. Chemistry-A
European Journal 2010, 16, 1560.
(63) Zhang, Z.; Zhao, Y.; Gong, Q.; Li, Z.; Li, J. Chemical Communications 2013, 49, 653.
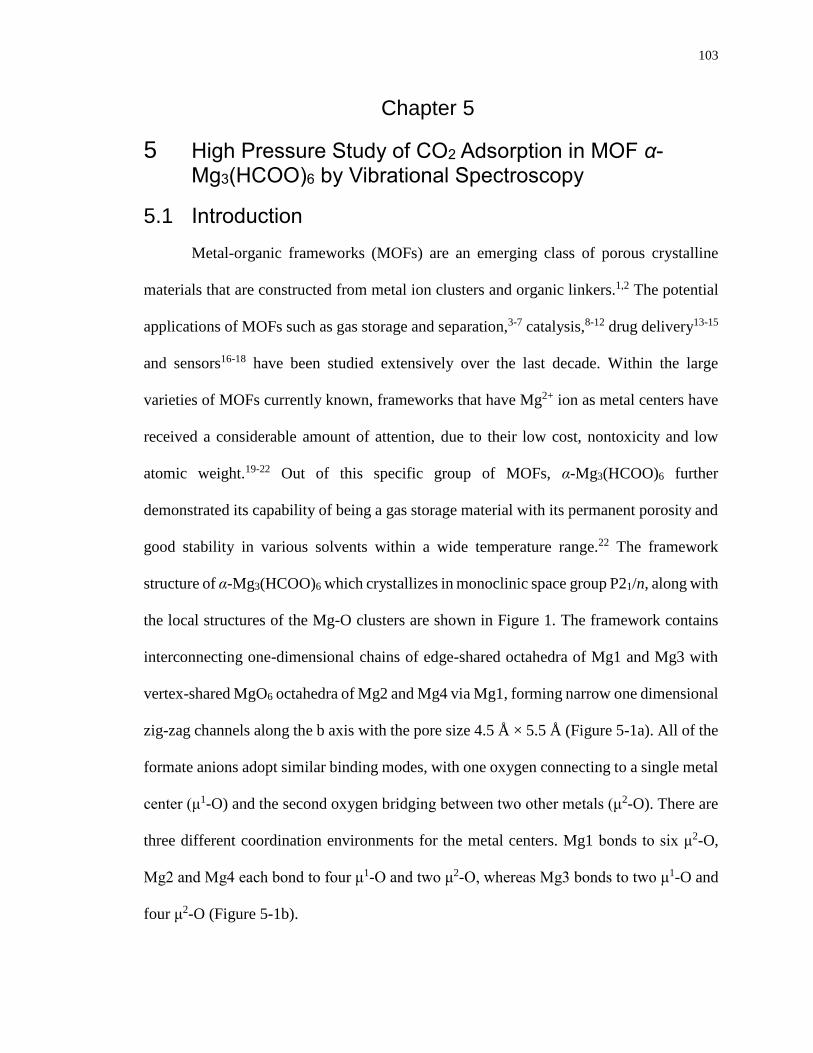
103
Chapter 5
5 High Pressure Study of CO2 Adsorption in MOF α-Mg3(HCOO)6 by Vibrational Spectroscopy
5.1 Introduction
Metal-organic frameworks (MOFs) are an emerging class of porous crystalline
materials that are constructed from metal ion clusters and organic linkers.1,2 The potential
applications of MOFs such as gas storage and separation,3-7 catalysis,8-12 drug delivery13-15
and sensors16-18 have been studied extensively over the last decade. Within the large
varieties of MOFs currently known, frameworks that have Mg2+ ion as metal centers have
received a considerable amount of attention, due to their low cost, nontoxicity and low
atomic weight.19-22 Out of this specific group of MOFs, α-Mg3(HCOO)6 further
demonstrated its capability of being a gas storage material with its permanent porosity and
good stability in various solvents within a wide temperature range.22 The framework
structure of α-Mg3(HCOO)6 which crystallizes in monoclinic space group P21/n, along with
the local structures of the Mg-O clusters are shown in Figure 1. The framework contains
interconnecting one-dimensional chains of edge-shared octahedra of Mg1 and Mg3 with
vertex-shared MgO6 octahedra of Mg2 and Mg4 via Mg1, forming narrow one dimensional
zig-zag channels along the b axis with the pore size 4.5 Å × 5.5 Å (Figure 5-1a). All of the
formate anions adopt similar binding modes, with one oxygen connecting to a single metal
center (μ1-O) and the second oxygen bridging between two other metals (μ2-O). There are
three different coordination environments for the metal centers. Mg1 bonds to six μ2-O,
Mg2 and Mg4 each bond to four μ1-O and two μ2-O, whereas Mg3 bonds to two μ1-O and
four μ2-O (Figure 5-1b).
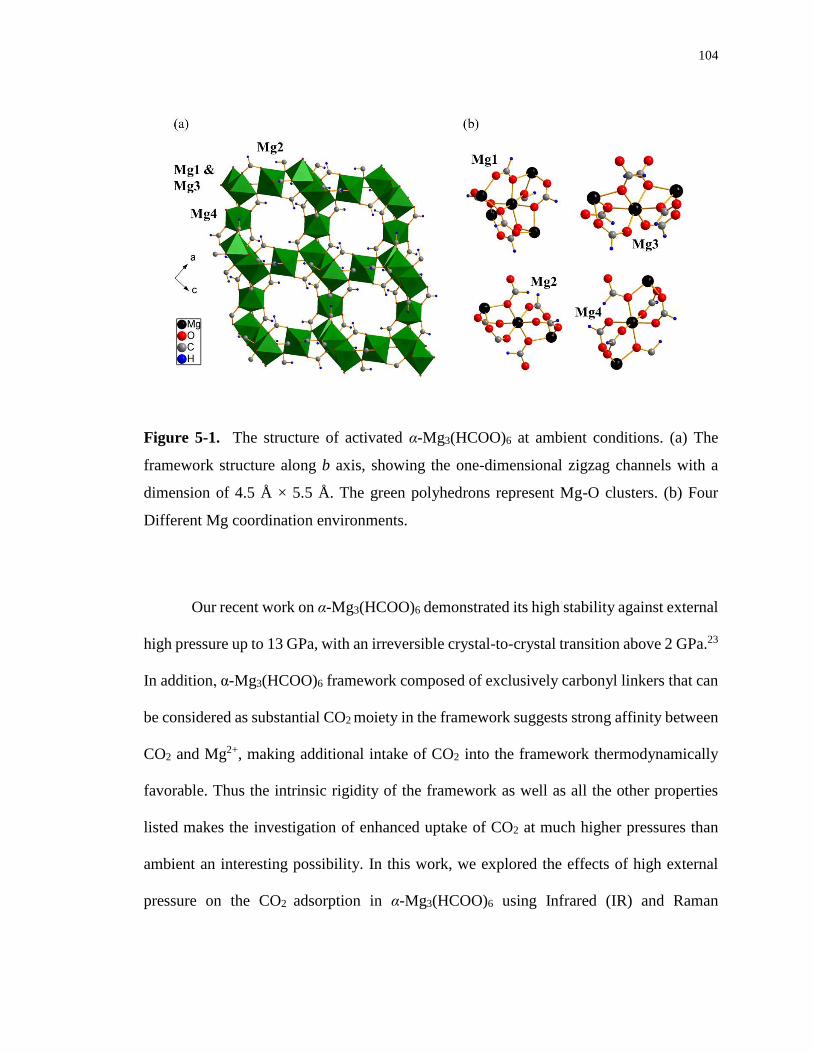
104
Figure 5-1. The structure of activated α-Mg3(HCOO)6 at ambient conditions. (a) The
framework structure along b axis, showing the one-dimensional zigzag channels with a
dimension of 4.5 Å × 5.5 Å. The green polyhedrons represent Mg-O clusters. (b) Four
Different Mg coordination environments.
Our recent work on α-Mg3(HCOO)6 demonstrated its high stability against external
high pressure up to 13 GPa, with an irreversible crystal-to-crystal transition above 2 GPa.23
In addition, α-Mg3(HCOO)6 framework composed of exclusively carbonyl linkers that can
be considered as substantial CO2 moiety in the framework suggests strong affinity between
CO2 and Mg2+, making additional intake of CO2 into the framework thermodynamically
favorable. Thus the intrinsic rigidity of the framework as well as all the other properties
listed makes the investigation of enhanced uptake of CO2 at much higher pressures than
ambient an interesting possibility. In this work, we explored the effects of high external
pressure on the CO2 adsorption in α-Mg3(HCOO)6 using Infrared (IR) and Raman
105
Spectroscopy, which demonstrated pressure-enhanced CO2 interactions with the
framework on compression.
5.2 Experimental section
The α-Mg3(HCOO)6 sample was synthesized according to the literature.22 Specifically, a
mixture of 10 mL DMF, 0.23 mL of formic acid (6 mmol) and 0.77 g of Mg(NO3)2·6H2O
(3 mmol) was placed in a 20 mL scintillation vial. The vial was capped and immersed in a
silicon oil bath that was kept at a constant temperature of 110 °C for 40 h. During this
period, high quality crystals of the as-made sample were deposited (0.34 g, 81.7%). The
crystals could then be filtered in air until dry. Activated α-Mg3(HCOO)6 was obtained by
heating the as-made sample to 130 °C for 36 h in vacuum condition. Its crystallinity was
checked by XRD. A diamond anvil cell (DAC) equipped with type II diamonds with culet
sizes of 600 μm was used to generate high pressures. The pure desolvated α-Mg3(HCOO)6
powder samples were loaded into the DAC together with solid CO2 in a cryogenic bath of
liquid nitrogen at a temperature below the melting point of dry ice (i.e., < −78 °C). Then
the cell was carefully sealed in the liquid nitrogen bath before warming up to room
temperature. A few ruby chips were preloaded in the DAC as the pressure calibrant and the
pressure was determined by the well-established ruby fluorescent method.24 A customized
IR and Raman micro-spectroscopic system with details described in Chapter 1 were used
for all mid-IR absorption and Raman measurements.23 Far-infrared measurements were
performed at the U2A beamline at the National Synchrotron Light Source (NSLS),
Brookhaven National Laboratory (BNL). All measurements were performed under room
temperature and multiple runs were carried out for reproducibility.
106
5.3 Results
5.3.1 IR and Raman spectra of α-Mg3(HCOO)6 loaded with CO2
Figure 5-2a shows the optical image of the sample chamber that consists of α-
Mg3(HCOO)6 sample (the opaque parts) with CO2 (the transparent areas). The
representative IR absorption spectra of α-Mg3(HCOO)6 loaded with CO2 and pure α-
Mg3(HCOO)6 at similar pressure (i.e. 0.3-0.4 GPa) are shown in Figure 5-2b, with the inset
that displays the zoomed spectral region of 2650 - 2950 cm-1 and 3550 – 3750 cm-1 of the
two samples. The IR spectrum of pure α-Mg3(HCOO)6 at 0.33 GPa is almost identical with
that of activated α-Mg3(HCOO)6 at ambient reported previously.23 The comparison of the
two spectra suggests the successful loading of CO2 as evidenced by the additional peaks of
the top spectrum observed. The two strong absorption bands at 670 and 2350 cm−1 in the
top spectrum are attributed to the bending mode (ν2) and asymmetric stretching mode (ν3)
of CO2, respectively. Moreover, two high-frequency bands were observed at around 3600
and 3710 cm−1, which are well understood as the CO2 combination modes of ν3 + 2ν2 and
ν3 + ν1, respectively due to the strong Fermi resonance effect.25 The IR spectrum of α-
Mg3(HCOO)6 loaded with CO2 not only indicates the effective CO2 loading but also
provides strong evidence for guest−host interactions between the framework and CO2.
Firstly, the modifications in the number and shape of νs(OCO) at ~1400 cm-1and νas(OCO) peaks
at ~1600 cm-1 strongly indicate that one of the preferential CO2 adsorption sites of α-
Mg3(HCOO)6 are located in particular regions close to the formate linkers. Secondly, a new
band at around 1160 cm-1 that can be assigned as the C-H in-plane bending mode (δ(C-H))
appears upon CO2 loading with the framework, providing consisting information on the
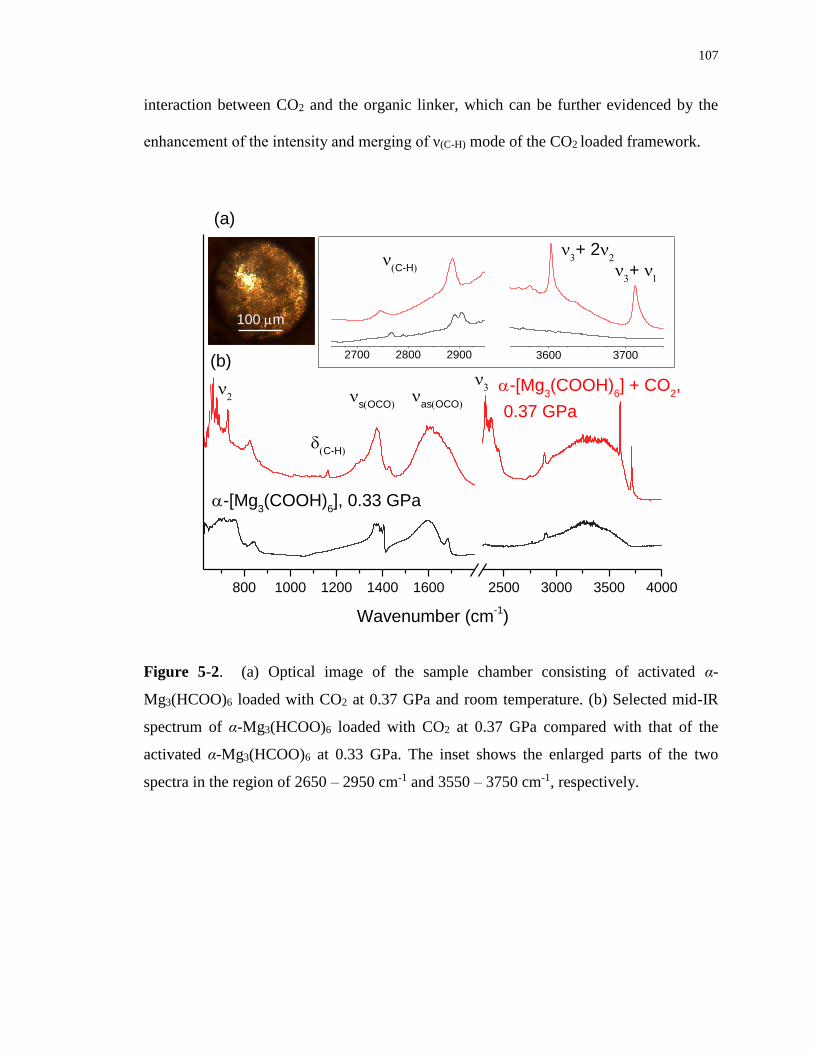
107
interaction between CO2 and the organic linker, which can be further evidenced by the
enhancement of the intensity and merging of ν(C-H) mode of the CO2 loaded framework.
800 1000 1200 1400 1600 2500 3000 3500 4000
3600 37002700 2800 2900
(C-H)
as(OCO)
s(OCO)
(C-H)
+ 2
-[Mg3(COOH)
6], 0.33 GPa
-[Mg3(COOH)
6] + CO
2,
0.37 GPa
Absorb
ance
Wavenumber (cm-1)
(a)
(b)
+
100 m
Figure 5-2. (a) Optical image of the sample chamber consisting of activated α-
Mg3(HCOO)6 loaded with CO2 at 0.37 GPa and room temperature. (b) Selected mid-IR
spectrum of α-Mg3(HCOO)6 loaded with CO2 at 0.37 GPa compared with that of the
activated α-Mg3(HCOO)6 at 0.33 GPa. The inset shows the enlarged parts of the two
spectra in the region of 2650 – 2950 cm-1 and 3550 – 3750 cm-1, respectively.
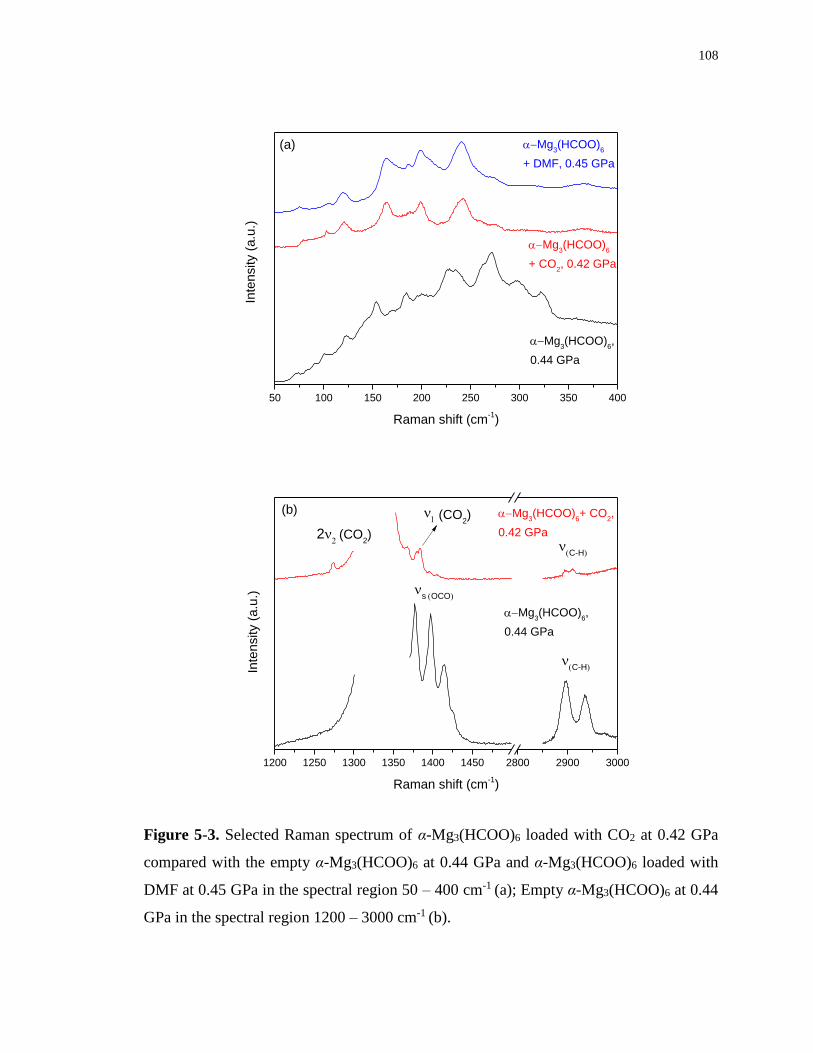
108
50 100 150 200 250 300 350 400
Mg3(HCOO)
6
+ DMF, 0.45 GPa
Mg3(HCOO)
6,
0.44 GPa
Mg3(HCOO)
6
+ CO2, 0.42 GPa
Inte
nsity (
a.u
.)
Raman shift (cm-1)
(a)
1200 1250 1300 1350 1400 1450 2800 2900 3000
Inte
nsity (
a.u
.)
(CO2)
s(OCO)
(C-H)
Mg3(HCOO)
6,
0.44 GPa
Mg3(HCOO)
6+ CO
2,
0.42 GPa
Raman shift (cm-1)
(b)
(C-H)
2(CO
2)
Figure 5-3. Selected Raman spectrum of α-Mg3(HCOO)6 loaded with CO2 at 0.42 GPa
compared with the empty α-Mg3(HCOO)6 at 0.44 GPa and α-Mg3(HCOO)6 loaded with
DMF at 0.45 GPa in the spectral region 50 – 400 cm-1 (a); Empty α-Mg3(HCOO)6 at 0.44
GPa in the spectral region 1200 – 3000 cm-1 (b).
109
Figure 5-3 shows the Raman spectrum of α-Mg3(HCOO)6 loaded with CO2
compared with that of empty framework at similar pressure (i.e. 0.4 GPa). The additional
peaks of the CO2 loaded framework at 1273 cm-1 (2ν2 of CO2) and 1384 cm-1 (ν1 of CO2)
confirmed the successful loading of CO2. From the lattice region (Figure 5-3a), it can be
seen that the lattice modes of the CO2 loaded samples are significantly different from the
ones of pure α-Mg3(HCOO)6, yet consistent with those of the DMF loaded framework.23
This observation suggests that guest loading in α-Mg3(HCOO)6 could lead to the change of
crystal structure of the framework, independent of the guest. Moreover, the significant
changes in the νs(OCO) and ν(C-H) modes (Figure 5-3b) were also observed upon CO2 loading,
in accord with our observations in the IR spectra, indicating that CO2 interacts with the
framework in particular regions near the formate ligands.
5.3.2 Mid-IR spectra of α-Mg3(HCOO)6 loaded with CO2 at high pressures
In order to study the pressure effects on the performance of α-Mg3(HCOO)6 for CO2
storage, the IR spectra of the framework loaded with CO2 were measured upon
compression and decompression. As mentioned in our previous work,26 the CO2
overtone/combination bands (ν3 + 2ν2 and ν3 + ν1) can be used to monitor the insertion of
CO2 into the pores of framework. It can be seen from Figure 5-4a that the ν3 + ν1 mode of
CO2 at above 3710 cm-1 becomes broadened and asymmetrical upon compression from
initial loading at 0.3 GPa. At the pressure higher than 3 GPa, the ν3 + ν1 mode clearly splits
into a doublet, indicating two types of CO2 exist in the system, with the high-frequency
component representing the CO2 residing outside the framework as the excessive pressure
110
medium, while the low-frequency component characterizing the CO2 molecules inside the
framework of α-Mg3(HCOO)6.27 Typically it is difficult to monitor the behavior of ν2 and
ν3 modes of CO2 due to their extremely intense IR absorptions. But in this case, even the
combination mode ν3 + ν1 of CO2 is saturated, indicating that a significant amount of CO2
has been trapped in the sample chamber and a large portion of CO2 are inserted into the
pores of α-Mg3(HCOO)6. The splitting of the ν3 + ν1 mode of CO2 upon compression
strongly suggest a pressure-enhanced CO2 interaction with the framework. Continuously
compressing to higher pressures (up to 9.82 GPa) resulted in the blue shift of all modes.
Upon decompression, the ν3 + ν1 doublet starts to merge back into a singlet below 2.61
GPa. When the pressure is completely released, the CO2 has escaped from the DAC
completely (Figure 5-4b). The compression−decompression cycles can be repeated several
times reversibly with very little hysteresis, and the splitting of ν3 + ν1 mode always occurs
at 2.6−3.0 GPa. Thus the pressure behavior of CO2 combination modes suggests a
reversible pressure-enhanced CO2 interaction with the α-Mg3(HCOO)6 framework.
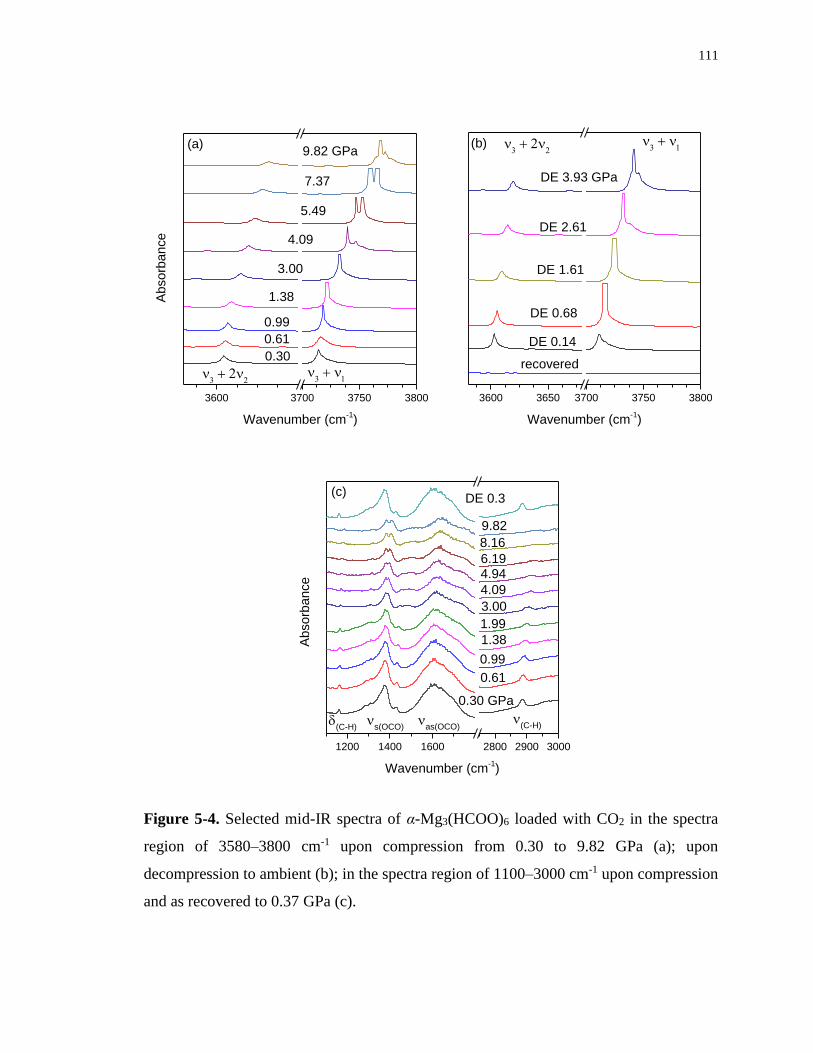
111
3600 3700 3750 3800
Absorb
ance
Wavenumber (cm-1)
0.30
0.61
0.99
1.38
3.00
4.09
5.49
7.37
9.82 GPa
(a)
3600 3650 3700 3750 3800
Wavenumber (cm-1)
DE 3.93 GPa
DE 2.61
DE 1.61
DE 0.68
DE 0.14
recovered
(b)
1200 1400 1600 2800 2900 3000
Absorb
ance
(C-H)
as(OCO)
s(OCO)
Wavenumber (cm-1)
0.30 GPa
0.61
0.99
1.38
1.99
3.00
4.09
4.946.19
8.16
9.82
DE 0.3
(C-H)
(c)
Figure 5-4. Selected mid-IR spectra of α-Mg3(HCOO)6 loaded with CO2 in the spectra
region of 3580–3800 cm-1 upon compression from 0.30 to 9.82 GPa (a); upon
decompression to ambient (b); in the spectra region of 1100–3000 cm-1 upon compression
and as recovered to 0.37 GPa (c).
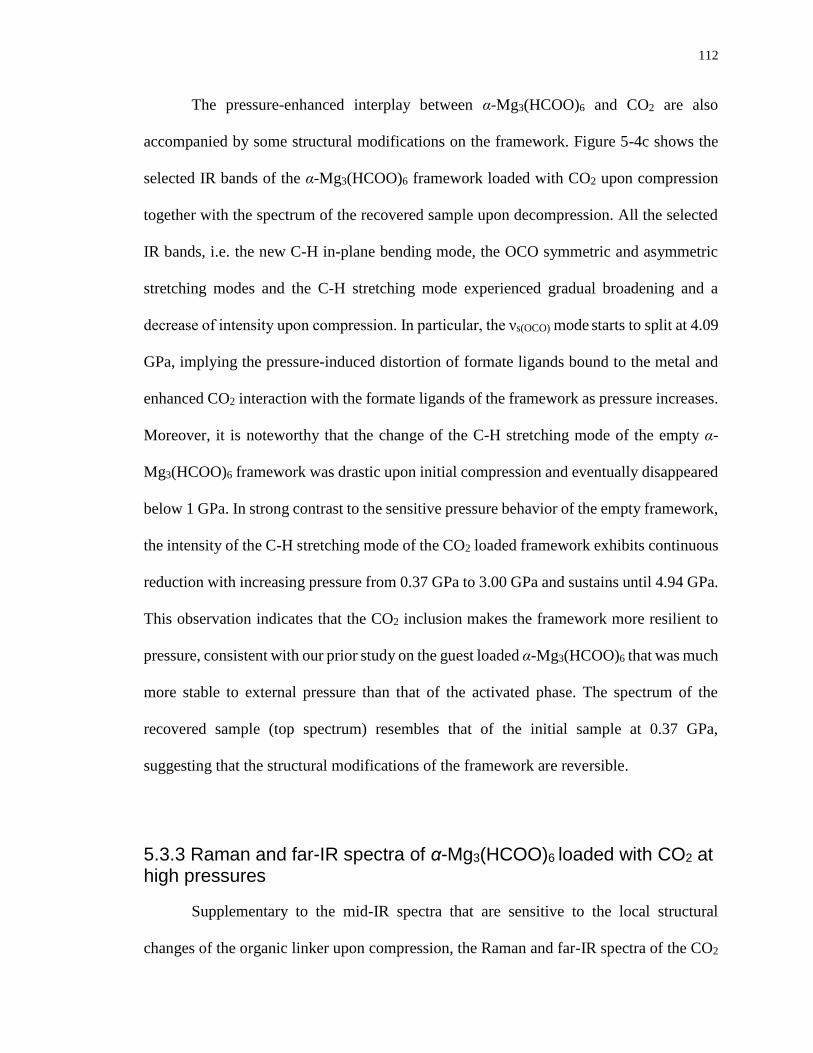
112
The pressure-enhanced interplay between α-Mg3(HCOO)6 and CO2 are also
accompanied by some structural modifications on the framework. Figure 5-4c shows the
selected IR bands of the α-Mg3(HCOO)6 framework loaded with CO2 upon compression
together with the spectrum of the recovered sample upon decompression. All the selected
IR bands, i.e. the new C-H in-plane bending mode, the OCO symmetric and asymmetric
stretching modes and the C-H stretching mode experienced gradual broadening and a
decrease of intensity upon compression. In particular, the νs(OCO) mode starts to split at 4.09
GPa, implying the pressure-induced distortion of formate ligands bound to the metal and
enhanced CO2 interaction with the formate ligands of the framework as pressure increases.
Moreover, it is noteworthy that the change of the C-H stretching mode of the empty α-
Mg3(HCOO)6 framework was drastic upon initial compression and eventually disappeared
below 1 GPa. In strong contrast to the sensitive pressure behavior of the empty framework,
the intensity of the C-H stretching mode of the CO2 loaded framework exhibits continuous
reduction with increasing pressure from 0.37 GPa to 3.00 GPa and sustains until 4.94 GPa.
This observation indicates that the CO2 inclusion makes the framework more resilient to
pressure, consistent with our prior study on the guest loaded α-Mg3(HCOO)6 that was much
more stable to external pressure than that of the activated phase. The spectrum of the
recovered sample (top spectrum) resembles that of the initial sample at 0.37 GPa,
suggesting that the structural modifications of the framework are reversible.
5.3.3 Raman and far-IR spectra of α-Mg3(HCOO)6 loaded with CO2 at high pressures
Supplementary to the mid-IR spectra that are sensitive to the local structural
changes of the organic linker upon compression, the Raman and far-IR spectra of the CO2
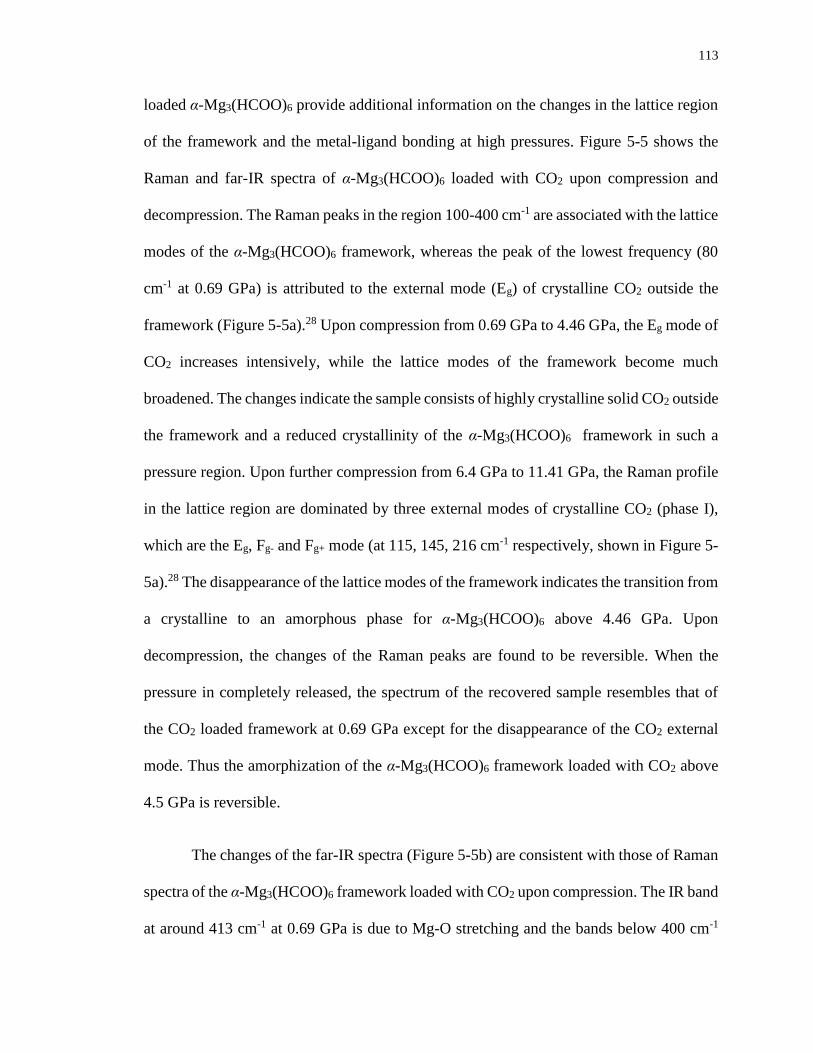
113
loaded α-Mg3(HCOO)6 provide additional information on the changes in the lattice region
of the framework and the metal-ligand bonding at high pressures. Figure 5-5 shows the
Raman and far-IR spectra of α-Mg3(HCOO)6 loaded with CO2 upon compression and
decompression. The Raman peaks in the region 100-400 cm-1 are associated with the lattice
modes of the α-Mg3(HCOO)6 framework, whereas the peak of the lowest frequency (80
cm-1 at 0.69 GPa) is attributed to the external mode (Eg) of crystalline CO2 outside the
framework (Figure 5-5a).28 Upon compression from 0.69 GPa to 4.46 GPa, the Eg mode of
CO2 increases intensively, while the lattice modes of the framework become much
broadened. The changes indicate the sample consists of highly crystalline solid CO2 outside
the framework and a reduced crystallinity of the α-Mg3(HCOO)6 framework in such a
pressure region. Upon further compression from 6.4 GPa to 11.41 GPa, the Raman profile
in the lattice region are dominated by three external modes of crystalline CO2 (phase I),
which are the Eg, Fg- and Fg+ mode (at 115, 145, 216 cm-1 respectively, shown in Figure 5-
5a).28 The disappearance of the lattice modes of the framework indicates the transition from
a crystalline to an amorphous phase for α-Mg3(HCOO)6 above 4.46 GPa. Upon
decompression, the changes of the Raman peaks are found to be reversible. When the
pressure in completely released, the spectrum of the recovered sample resembles that of
the CO2 loaded framework at 0.69 GPa except for the disappearance of the CO2 external
mode. Thus the amorphization of the α-Mg3(HCOO)6 framework loaded with CO2 above
4.5 GPa is reversible.
The changes of the far-IR spectra (Figure 5-5b) are consistent with those of Raman
spectra of the α-Mg3(HCOO)6 framework loaded with CO2 upon compression. The IR band
at around 413 cm-1 at 0.69 GPa is due to Mg-O stretching and the bands below 400 cm-1
114
are attributed to the lattice modes of the α-Mg3(HCOO)6 framework. No IR bands
associated with solid CO2 are observed in the far-IR region, due to the weak IR absorption
of solid CO2.29 The disappearance of the Mg-O stretching mode and the external modes of
the framework above 4.46 GPa suggests the amorphization for the CO2 loaded framework.
The spectrum of the recovered sample (top spectrum), when the CO2 completely escape
the sample chamber, is almost identical with that of CO2 loaded framework at 0.69 GPa
except for the frequency shifts. This observation strongly suggests that CO2 does not
interact with the metal center of the α-Mg3(HCOO)6 framework.
The combined Raman and far-IR data suggest that the CO2 loaded α-Mg3(HCOO)6
framework undergoes a reversible crystalline-to-amorphous phase transition at around 4.5
GPa. Thus the connectivity of the pores remains intact in the amorphous phase at high
pressures. The pressure behavior of the framework loaded with CO2 is similar to those of
benzene or DMF loaded framework which has no phase transition within 4 GPa, consistent
with the fact that the framework containing guest molecules is more stable to external
pressure than that of the empty framework.
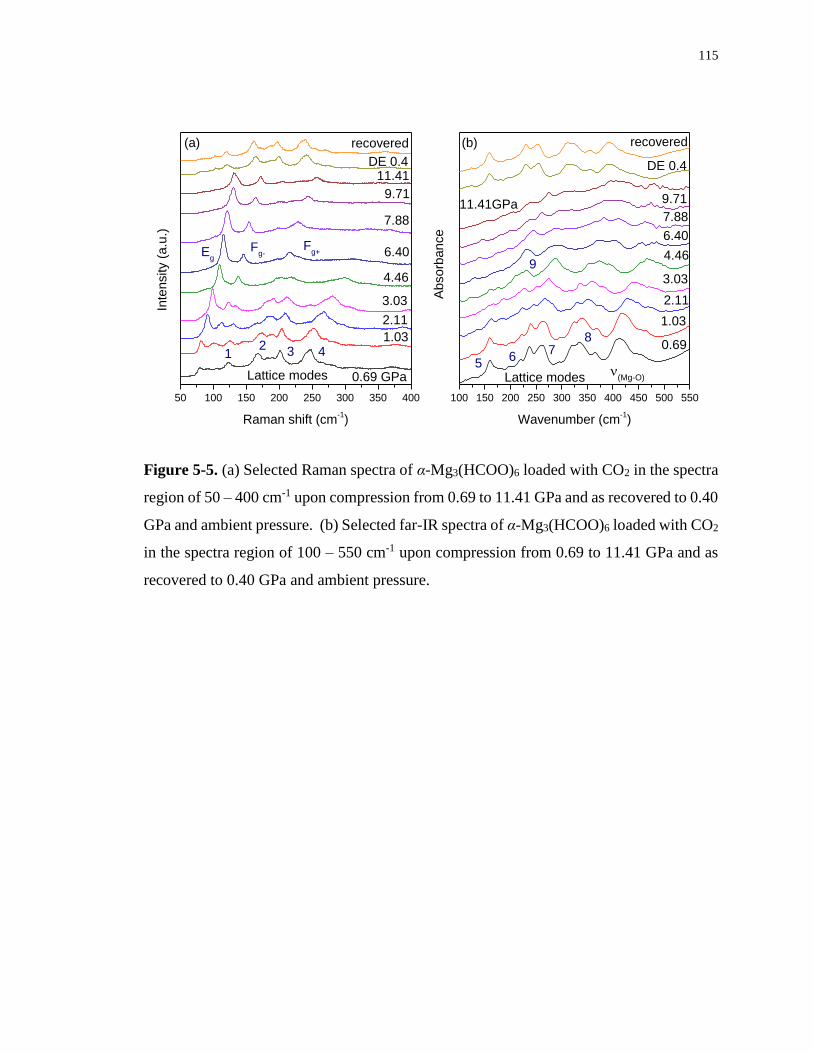
115
50 100 150 200 250 300 350 400
Fg-
Fg+
Inte
nsity (
a.u
.)
Raman shift (cm
-1)
0.69 GPa
1.03
3.03
4.46
6.40
7.88
9.71
11.41
2.11
DE 0.4
recovered
Eg
Lattice modes
(a)
12 3 4
100 150 200 250 300 350 400 450 500 550
9
Absorb
ance
(Mg-O)
Wavenumber (cm-1)
DE 0.4
recovered
11.41GPa 9.71
7.88
6.40
4.46
3.03
2.11
1.03
0.69
Lattice modes
(b)
57
8
6
Figure 5-5. (a) Selected Raman spectra of α-Mg3(HCOO)6 loaded with CO2 in the spectra
region of 50 – 400 cm-1 upon compression from 0.69 to 11.41 GPa and as recovered to 0.40
GPa and ambient pressure. (b) Selected far-IR spectra of α-Mg3(HCOO)6 loaded with CO2
in the spectra region of 100 – 550 cm-1 upon compression from 0.69 to 11.41 GPa and as
recovered to 0.40 GPa and ambient pressure.
116
5.4 Discussion
In order to examine the stability and phase transformation of the CO2 loaded α-
Mg3(HCOO)6 on compression in great details, we monitored the IR frequencies and Raman
shifts as a function of pressure as shown in Figures 5-6. The pressure coefficients (dν/dP
(cm-1∙GPa-1)) of the IR and Raman modes were calculated by linear regression of the
experimental data and listed in Tables 5-1 and 5-2, respectively. Generally all the IR and
Raman modes exhibit regular pressure-induced blue shifts, consistent with that the bonds
become stiffened upon compression. For mid-IR measurements of the framework loaded
with CO2, both the δ(C-H) and ν(C-H) mode vanish above 4.09 GPa (Figure 5-6a). Moreover,
the disappearance of the lattice modes of α-Mg3(HCOO)6 (denoted as 1-8 in Figures 5-6b
and 5-6c) beyond 4.46 GPa provides clear evidence for the amorphization of the
framework. The approximate phase transition boundary for the CO2 loaded α-
Mg3(HCOO)6 is thus around 4.50 GPa, as indicated in Figures 5-6.
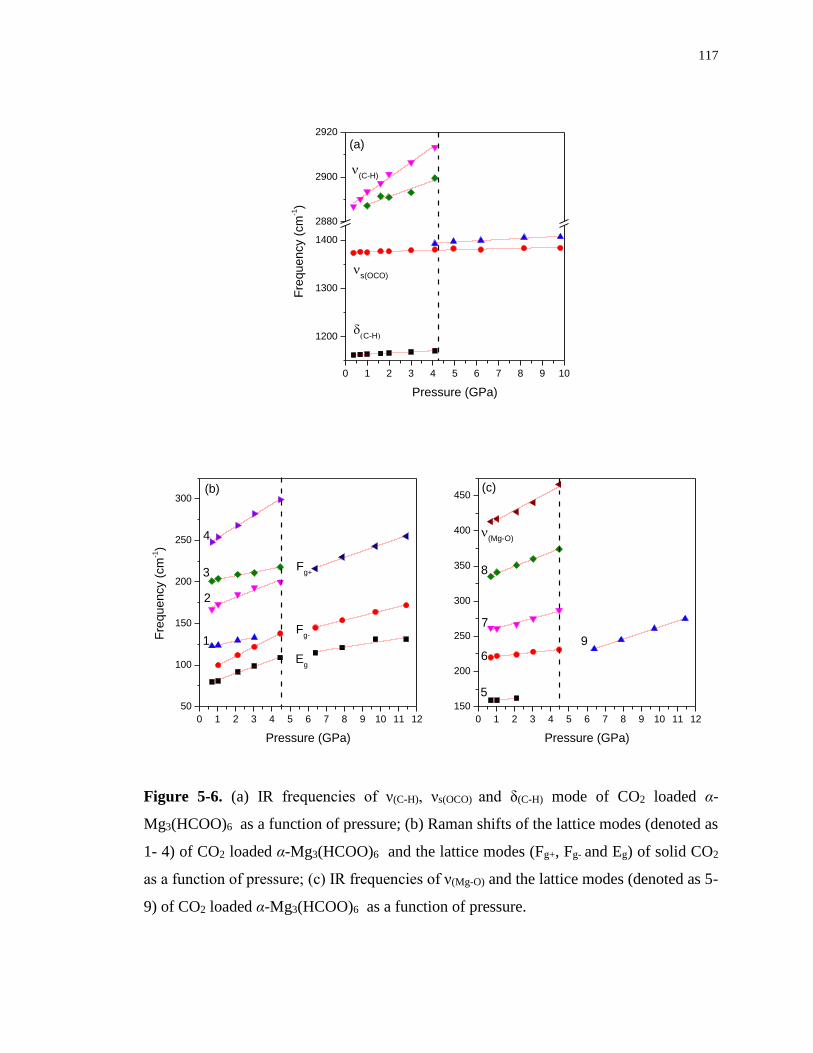
117
0 1 2 3 4 5 6 7 8 9 10
1200
1300
1400
2880
2900
2920
s(OCO)
Fre
quency (
cm
-1)
Pressure (GPa)
(C-H)
(C-H)
(a)
0 1 2 3 4 5 6 7 8 9 10 11 12
50
100
150
200
250
300
Fre
quency (
cm
-1)
Fg+
Fg-
Pressure (GPa)
Eg
1
2
3
4
(b)
0 1 2 3 4 5 6 7 8 9 10 11 12
150
200
250
300
350
400
450
9
(Mg-O)
8
7
6
Pressure (GPa)
5
(c)
Figure 5-6. (a) IR frequencies of ν(C-H), νs(OCO) and δ(C-H) mode of CO2 loaded α-
Mg3(HCOO)6 as a function of pressure; (b) Raman shifts of the lattice modes (denoted as
1- 4) of CO2 loaded α-Mg3(HCOO)6 and the lattice modes (Fg+, Fg- and Eg) of solid CO2
as a function of pressure; (c) IR frequencies of ν(Mg-O) and the lattice modes (denoted as 5-
9) of CO2 loaded α-Mg3(HCOO)6 as a function of pressure.
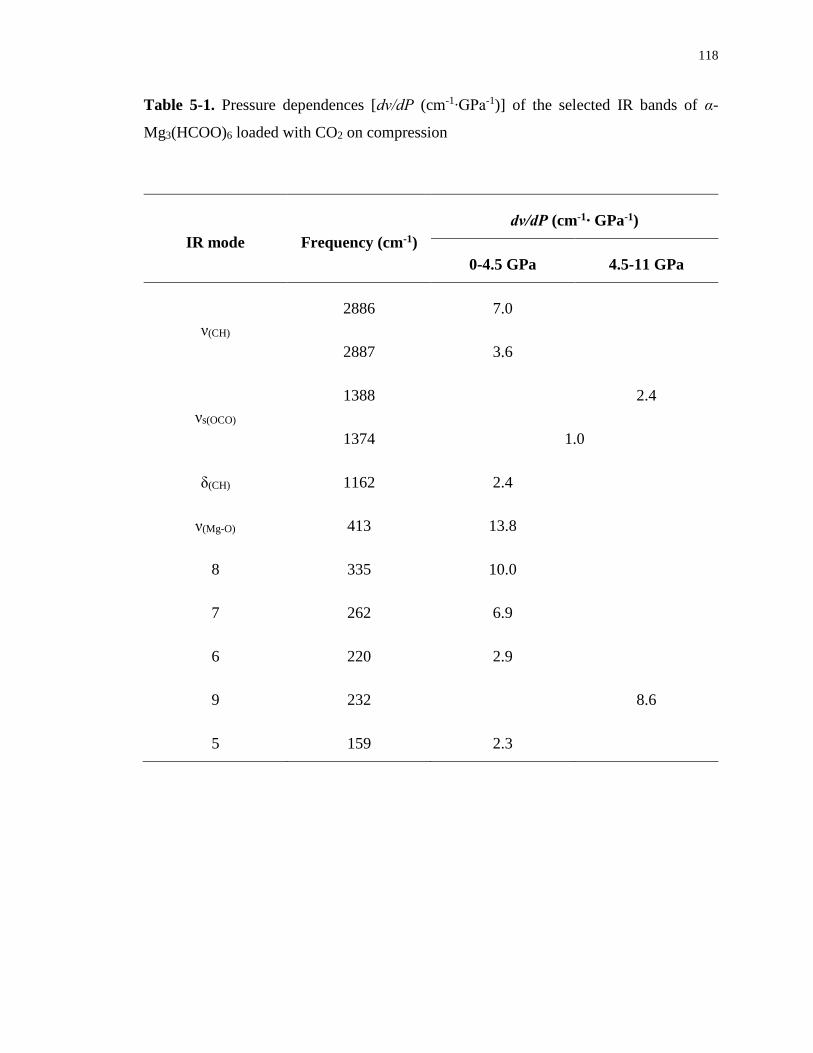
118
Table 5-1. Pressure dependences [dν/dP (cm-1∙GPa-1)] of the selected IR bands of α-
Mg3(HCOO)6 loaded with CO2 on compression
IR mode Frequency (cm-1)
dν/dP (cm-1∙ GPa-1)
0-4.5 GPa 4.5-11 GPa
ν(CH)
2886 7.0
2887 3.6
νs(OCO)
1388 2.4
1374 1.0
δ(CH) 1162 2.4
ν(Mg-O) 413 13.8
8 335 10.0
7 262 6.9
6 220 2.9
9 232 8.6
5 159 2.3
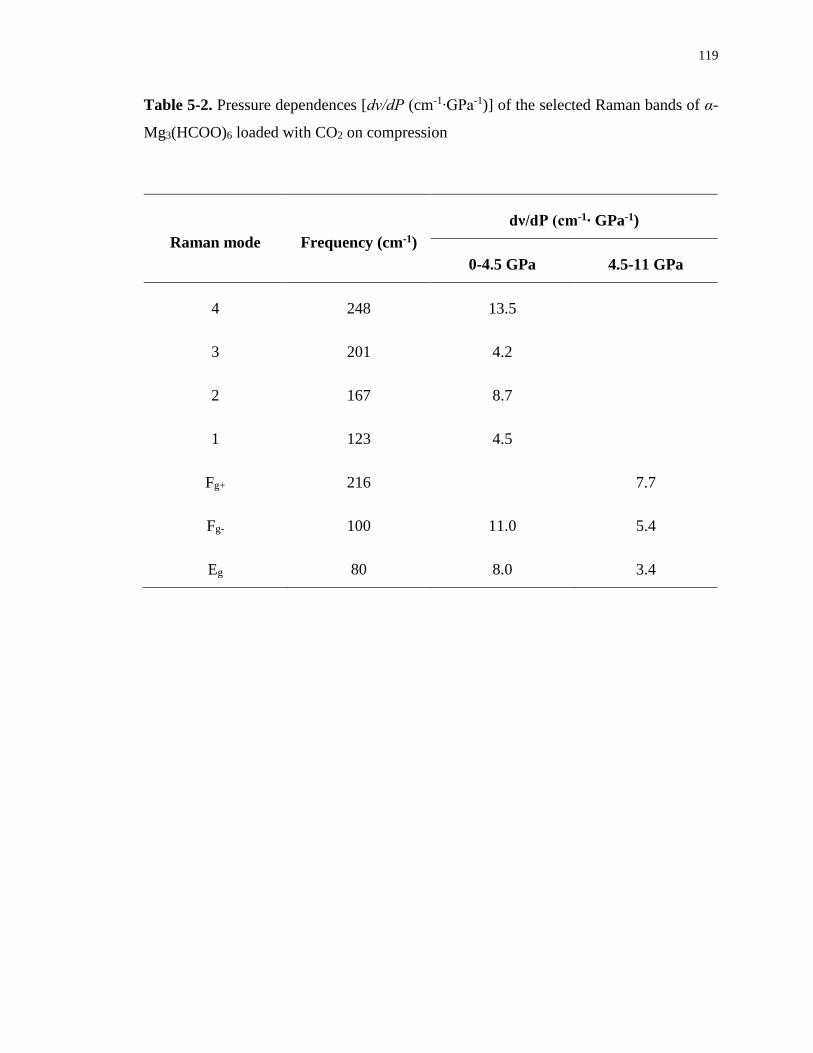
119
Table 5-2. Pressure dependences [dν/dP (cm-1∙GPa-1)] of the selected Raman bands of α-
Mg3(HCOO)6 loaded with CO2 on compression
Raman mode Frequency (cm-1)
dν/dP (cm-1∙ GPa-1)
0-4.5 GPa 4.5-11 GPa
4 248 13.5
3 201 4.2
2 167 8.7
1 123 4.5
Fg+ 216 7.7
Fg- 100 11.0 5.4
Eg 80 8.0 3.4
120
Our results demonstrate an enhanced stability of α-Mg3(HCOO)6 framework to
external high pressure due to the space-filling of the guest CO2. Below 4 GPa, the CO2
loaded framework experiences no phase change whereas the empty framework undergoes
an irreversible phase transformation at 2 GPa. Similar pressure behavior were observed for
the DMF/benzene loaded framework, which further demonstrates the general trend that
guest molecules can significantly enhance framework resistance to external stress,
independent of the guest molecules loaded. In addition, the higher stability of the CO2
loaded framework is further evidenced by the pressure behavior of the internal mode νs(OCO)
from mid-IR spectra. The pressure dependence of the νs(OCO) mode of the CO2 loaded
framework (i.e. 1.0 cm-1∙GPa-1) is much lower compared with its counterparts of the empty
framework (i.e. 13.1 cm-1∙GPa-1),23 indicating that the formate ligands that bound to the
metal are much less distorted with the existence of CO2 inside the framework. Thus the
rigidity of the entire framework is substantially enhanced upon CO2 loading.
The compression-decompression cycles on CO2 loaded α-Mg3(HCOO)6 reveal an
reversible pressure-enhanced interactions between CO2 and the framework. As a promising
candidate for CO2 storage material, the performance of MOFs for CO2 adsorption has been
widely studied. However, the study of the enhanced guest-host interactions between the
surrounding CO2 and the MOF framework or other nano-porous materials (e.g. zeolites)
are sparse.26,27,30 Previous studies have shown that the nature of the interactions between
CO2 and the framework as well as the migration mechanism are mainly dependent on the
porosity, the flexibility and the existence of the preferential adsorption sites of the host
framework. The above factors that influence the performance of α-Mg3(HCOO)6 for CO2
storage will be discussed in details as follows.
121
Firstly, the porosity of the host framework especially the pore size has a significant
impact on the threshold conditions of CO2 inclusion into the framework. For example, Lee
et al.30 demonstrated that only under pressure (1.5 GPa) and elevated temperatures (110
°C) CO2 can be inserted into the natrolite in which the pore size is just slightly bigger that
the kinetic diameter of gaseous CO2 (3.3 Å). The α-Mg3(HCOO)6 has a pore diameter
around 5 Å, which provides enough space for guest molecules CO2 to fit inside the
channels. Thus CO2 can be adsorbed into the α-Mg3(HCOO)6 framework upon initial
loading at low pressures (i.e., < 0.6 GPa when CO2 is in fluid phase) under room
temperature.
Secondly, the flexibility of the organic ligand plays an important role in the
mechanism and performance of CO2 adsorption in MOFs. Earlier work on ZIF-8 revealed
a so-called “gate opening” effect, under which the imidazolate ligands can be reoriented in
response to adsorption as well as external pressure to increase the accessible pore volume,
facilitating the CO2 diffusion and adsorption in the framework.26,31,32 Therefore, ZIF-8
exhibits excellent performance for CO2 adsorption, with the maximum CO2 uptake of 4.3
wt% at 298K and ambient pressure, despite its small pore size (3.4 Å).33 In contrast, the
CO2 adsorption capacity of α-Mg3(HCOO)6 at ambient pressure (1.32 wt%)34 is
substantially lower than that of ZIF-8, not only owing to the lesser porosity, but also
because of the rigidity of organic ligands of the framework. Our previous work showed
that the response of α-Mg3(HCOO)6 framework to compression was initiated by the small
distortion of the individual Mg2-O and Mg4-O clusters, in contrast to the twist of the
organic linker of ZIF-8. This argument is further evidenced by the pressure behavior of
the Mg-O bond monitored by far-IR measurements in this work. Our results show that the
122
pressure dependence of Mg-O stretch mode (13.8 cm-1/GPa) is substantially higher than
those of the other modes from the formate ligand (such as νs(OCO) and ν(CH)), indicating that
the compression on the framework is mainly mediated through the Mg-O bonds. Thus the
rigidity of the organic ligands make α-Mg3(HCOO)6 less favorable for CO2 adsorption
compared with ZIF-8.
Lastly, the existence of preferential adsorption site of MOFs can substantially affect
their performance for CO2 adsorption. A typical example is Mg-MOF-7421, an efficient
CO2 capture media due to the strong affinity between its open metal sites and CO2. Our
prior studies of MIL-68 (In) showed an outstanding performance for CO2 adsorption not
only because of the large pore size of the framework, but also due to the presence of the
preferential adsorption site OH units, which interact strongly with CO2 through hydrogen
bonding. In this work, unlike Mg-MOF-74, the Mg metal center of α-Mg3(HCOO)6 has no
interaction with CO2 as it is stably coordinated with six oxygens from the organic ligands.
The almost identical IR profiles of the CO2 loaded framework and the empty one from the
far-IR measurements suggested that the Mg-O bonds are not affected upon CO2 adsorption.
Nonetheless, strong interactions between CO2 and the formate ligand of α-Mg3(HCOO)6
were observed from the pressure behavior of ν3 + ν1 mode of CO2. The splitting of the ν3 +
ν1 mode of CO2 loaded α-Mg3(HCOO)6, which suggests two types of CO2 present in the
system, is distinctively different from what we observed in ZIF-8 or MIL-68 (In). The CO2
adsorbed in ZIF-8 or MIL-68 (In), which exhibited a broad ν3 + ν1 IR band with a lower
frequency, is characteristic of fluid-like CO2, in strong contrast to the solid CO2 outside the
framework which displayed a sharp peak with a higher frequency. However in this case,
the CO2 included in α-Mg3(HCOO)6 framework under high pressures showed a solid-like
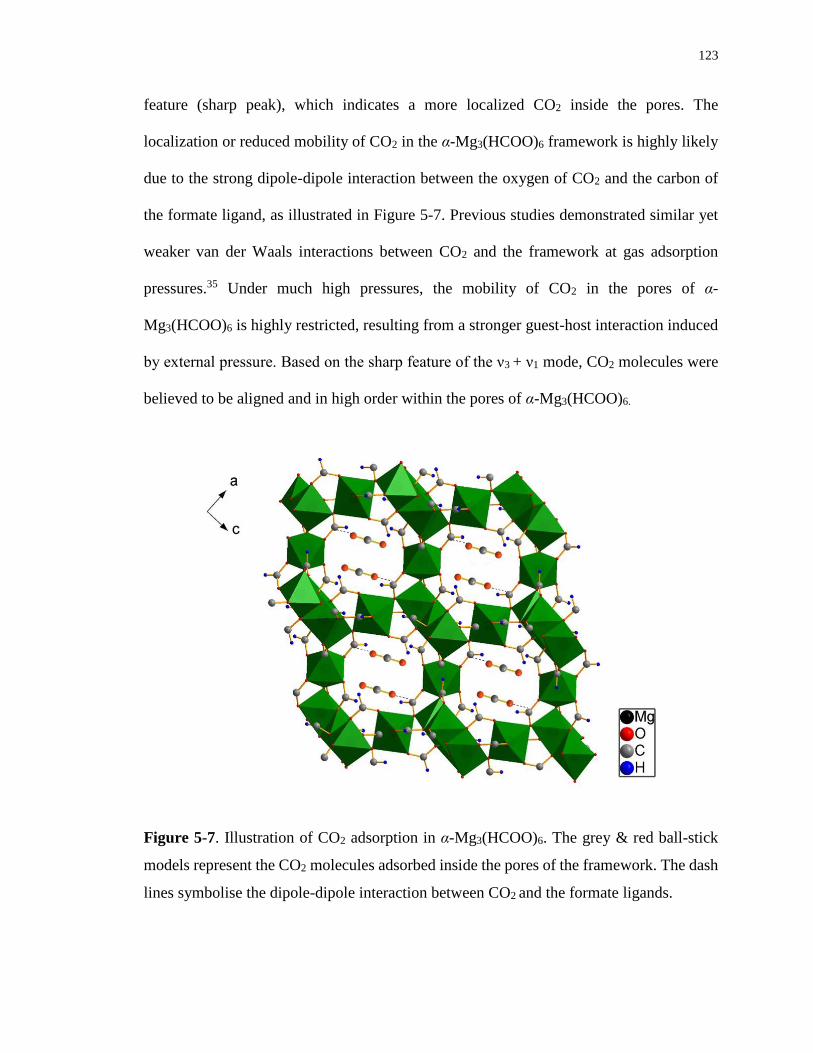
123
feature (sharp peak), which indicates a more localized CO2 inside the pores. The
localization or reduced mobility of CO2 in the α-Mg3(HCOO)6 framework is highly likely
due to the strong dipole-dipole interaction between the oxygen of CO2 and the carbon of
the formate ligand, as illustrated in Figure 5-7. Previous studies demonstrated similar yet
weaker van der Waals interactions between CO2 and the framework at gas adsorption
pressures.35 Under much high pressures, the mobility of CO2 in the pores of α-
Mg3(HCOO)6 is highly restricted, resulting from a stronger guest-host interaction induced
by external pressure. Based on the sharp feature of the ν3 + ν1 mode, CO2 molecules were
believed to be aligned and in high order within the pores of α-Mg3(HCOO)6.
Figure 5-7. Illustration of CO2 adsorption in α-Mg3(HCOO)6. The grey & red ball-stick
models represent the CO2 molecules adsorbed inside the pores of the framework. The dash
lines symbolise the dipole-dipole interaction between CO2 and the formate ligands.
124
5.5 Conclusions
In summary, in situ IR and Raman spectroscopic measurements of α-Mg3(HCOO)6
loaded with CO2 were investigated under external high pressure up to 11 GPa. We
demonstrate a strong guest-host interplay between CO2 and the formate ligand via dipole-
dipole interaction, while the Mg metal center has no interactions with CO2. The CO2
molecules are highly confined inside the pores due to the strong interaction with the
framework at high pressures. Moreover, the CO2 loaded α-Mg3(HCOO)6 framework
undergoes a reversible crystalline-to-amorphous phase transformation at around 4.5 GPa,
in contrast to the pressure behavior of the empty framework that experience an irreversible
crystal-to-crystal phase transition at 2 GPa. The chemical connectivity was intact in the
amorphous phase that maintained the porosity for CO2 storage at high pressures. Our
observations further demonstrate that guest molecules can significantly enhance the
stability of the host framework to external pressure. Overall, the chemical and mechanical
robustness of the framework with the presence of preferential CO2 adsorption site makes
α-Mg3(HCOO)6 an interesting and promising candidate for CO2 storage at high pressure
conditions.
5.6 Reference
(1) Rowsell, J. L. C.; Yaghi, O. M. Microporous and Mesoporous Materials 2004, 73, 3.
(2) Furukawa, H.; Cordova, K. E.; O’Keeffe, M.; Yaghi, O. M. Science 2013, 341, 1230444.
(3) Li, B.; Wen, H.-M.; Zhou, W.; Chen, B. The Journal of Physical Chemistry Letters 2014,
5, 3468.
(4) Van de Voorde, B.; Bueken, B.; Denayer, J.; De Vos, D. Chemical Society Reviews 2014,
43, 5766.
125
(5) He, Y.; Zhou, W.; Qian, G.; Chen, B. Chemical Society Reviews 2014, 43, 5657.
(6) Barea, E.; Montoro, C.; Navarro, J. A. R. Chemical Society Reviews 2014, 43, 5419.
(7) Sumida, K.; Rogow, D. L.; Mason, J. A.; McDonald, T. M.; Bloch, E. D.; Herm, Z. R.;
Bae, T. H.; Long, J. R. Chemical Reviews 2012, 112, 724.
(8) Dhakshinamoorthy, A.; Garcia, H. Chemical Society Reviews 2014, 43, 5750.
(9) Zhang, T.; Lin, W. Chemical Society Reviews 2014, 43, 5982.
(10) Liu, J.; Chen, L.; Cui, H.; Zhang, J.; Zhang, L.; Su, C.-Y. Chemical Society Reviews 2014,
43, 6011.
(11) Gascon, J.; Corma, A.; Kapteijn, F.; Llabrés i Xamena, F. X. ACS Catalysis 2014, 4, 361.
(12) Ranocchiari, M.; Bokhoven, J. A. v. Physical Chemistry Chemical Physics 2011, 13, 6388.
(13) Della Rocca, J.; Liu, D.; Lin, W. Accounts of Chemical Research 2011, 44, 957.
(14) McKinlay, A. C.; Morris, R. E.; Horcajada, P.; Férey, G.; Gref, R.; Couvreur, P.; Serre, C.
Angewandte Chemie International Edition 2010, 49, 6260.
(15) Rodrigues, M. O.; de Paula, M. V.; Wanderley, K. A.; Vasconcelos, I. B.; Alves, S.; Soares,
T. A. International Journal of Quantum Chemistry 2012, 112, 3346.
(16) Kreno, L. E.; Leong, K.; Farha, O. K.; Allendorf, M.; Van Duyne, R. P.; Hupp, J. T.
Chemical Reviews 2012, 112, 1105.
(17) Hu, Z.; Deibert, B. J.; Li, J. Chemical Society Reviews 2014, 43, 5815.
(18) Ramaswamy, P.; Wong, N. E.; Shimizu, G. K. H. Chemical Society Reviews 2014, 43,
5913.
(19) Xu, J.; Terskikh, V. V.; Huang, Y. Chemistry – A European Journal 2013, 19, 4432.
(20) Mallick, A.; Saha, S.; Pachfule, P.; Roy, S.; Banerjee, R. Inorganic Chemistry 2011, 50,
1392.
(21) Britt, D.; Furukawa, H.; Wang, B.; Glover, T. G.; Yaghi, O. M. Proceedings of the National
Academy of Sciences 2009, 106, 20637.
(22) Rood, J. A.; Noll, B. C.; Henderson, K. W. Inorganic Chemistry 2006, 45, 5521.
(23) Mao, H.; Xu, J.; Hu, Y.; Huang, Y.; Song, Y. Journal of Materials Chemistry A 2015, 3,
11976.
(24) Mao, H. K.; Xu, J.; Bell, P. M. Journal of Geophysical Research: Solid Earth 1986, 91,
4673.
(25) Hanson, R. C.; Jones, L. H. The Journal of Chemical Physics 1981, 75, 1102.
126
(26) Hu, Y.; Liu, Z.; Xu, J.; Huang, Y.; Song, Y. Journal of the American Chemical Society
2013, 135, 9287.
(27) Santoro, M.; Gorelli, F.; Haines, J.; Cambon, O.; Levelut, C.; Garbarino, G. Proceedings
of the National Academy of Sciences 2011, 108, 7689.
(28) Olijnyk, H.; Däufer, H.; Jodl, H. J.; Hochheimer, H. D. The Journal of Chemical Physics
1988, 88, 4204.
(29) Aoki, K.; Yamawaki, H.; Sakashita, M. Phys Rev B 1993, 48, 9231.
(30) Lee, Y.; Liu, D.; Seoung, D.; Liu, Z. X.; Kao, C. C.; Vogt, T. Journal of the American
Chemical Society 2011, 133, 1674.
(31) Fairen-Jimenez, D.; Moggach, S. A.; Wharmby, M. T.; Wright, P. A.; Parsons, S.; Duren,
T. Journal of the American Chemical Society 2011, 133, 8900.
(32) Moggach, S. A.; Bennett, T. D.; Cheetham, A. K. Angewandte Chemie International
Edition 2009, 48, 7087.
(33) Low, J. J.; Benin, A. I.; Jakubczak, P.; Abrahamian, J. F.; Faheem, S. A.; Willis, R. R.
Journal of the American Chemical Society 2009, 131, 15834.
(34) Rossin, A.; Ienco, A.; Costantino, F.; Montini, T.; Di Credico, B.; Caporali, M.; Gonsalvi,
L.; Fornasiero, P.; Peruzzini, M. Crystal Growth & Design 2008, 8, 3302.
(35) Fischer, M.; Hoffmann, F.; Fröba, M. ChemPhysChem 2010, 11, 2220.
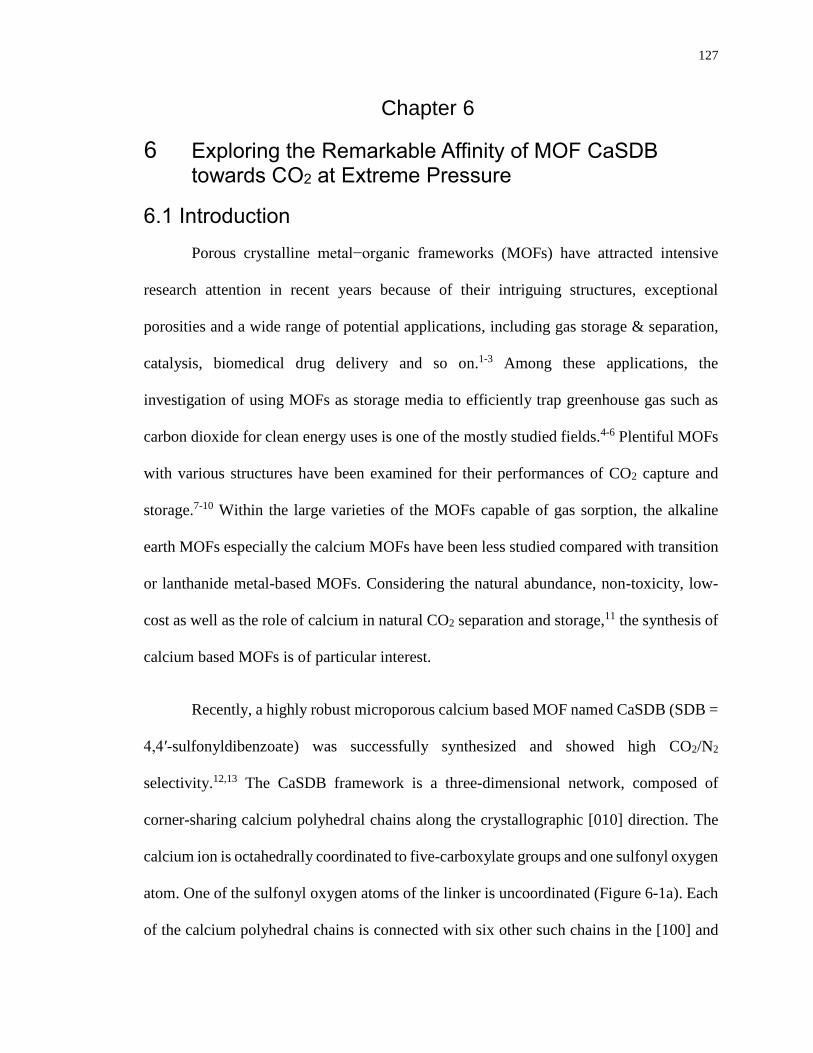
127
Chapter 6
6 Exploring the Remarkable Affinity of MOF CaSDB towards CO2 at Extreme Pressure
6.1 Introduction
Porous crystalline metal−organic frameworks (MOFs) have attracted intensive
research attention in recent years because of their intriguing structures, exceptional
porosities and a wide range of potential applications, including gas storage & separation,
catalysis, biomedical drug delivery and so on.1-3 Among these applications, the
investigation of using MOFs as storage media to efficiently trap greenhouse gas such as
carbon dioxide for clean energy uses is one of the mostly studied fields.4-6 Plentiful MOFs
with various structures have been examined for their performances of CO2 capture and
storage.7-10 Within the large varieties of the MOFs capable of gas sorption, the alkaline
earth MOFs especially the calcium MOFs have been less studied compared with transition
or lanthanide metal-based MOFs. Considering the natural abundance, non-toxicity, low-
cost as well as the role of calcium in natural CO2 separation and storage,11 the synthesis of
calcium based MOFs is of particular interest.
Recently, a highly robust microporous calcium based MOF named CaSDB (SDB =
4,4′-sulfonyldibenzoate) was successfully synthesized and showed high CO2/N2
selectivity.12,13 The CaSDB framework is a three-dimensional network, composed of
corner-sharing calcium polyhedral chains along the crystallographic [010] direction. The
calcium ion is octahedrally coordinated to five-carboxylate groups and one sulfonyl oxygen
atom. One of the sulfonyl oxygen atoms of the linker is uncoordinated (Figure 6-1a). Each
of the calcium polyhedral chains is connected with six other such chains in the [100] and
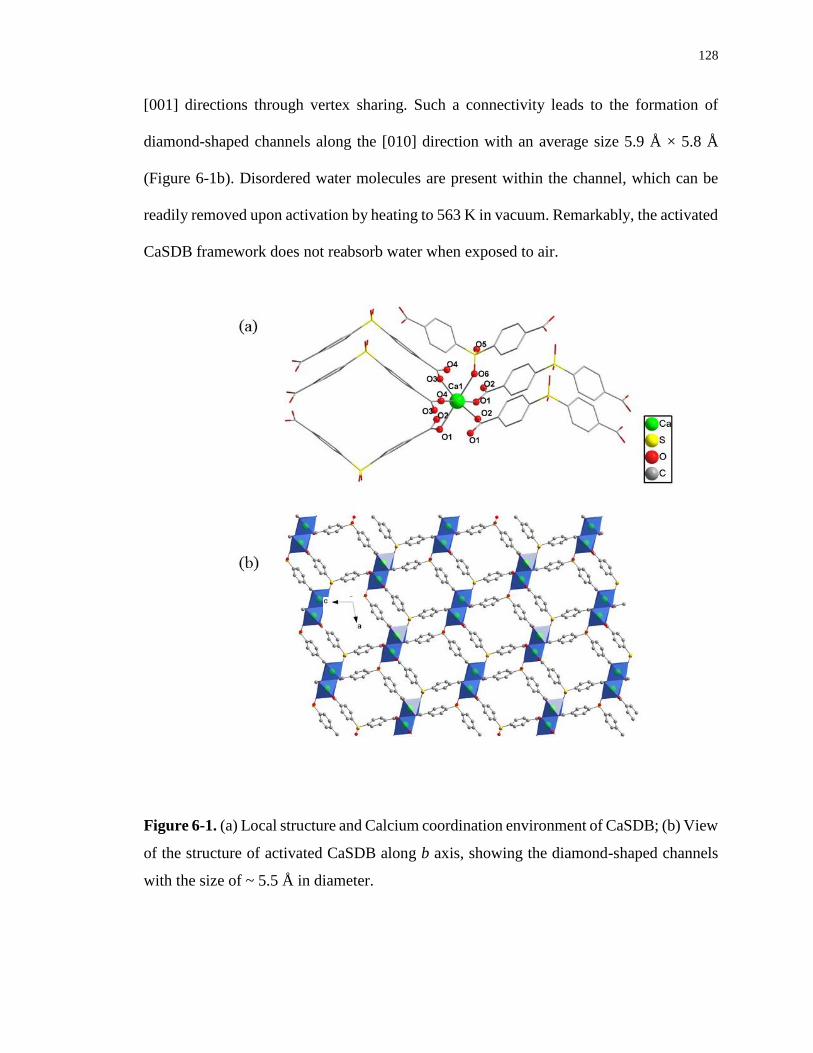
128
[001] directions through vertex sharing. Such a connectivity leads to the formation of
diamond-shaped channels along the [010] direction with an average size 5.9 Å × 5.8 Å
(Figure 6-1b). Disordered water molecules are present within the channel, which can be
readily removed upon activation by heating to 563 K in vacuum. Remarkably, the activated
CaSDB framework does not reabsorb water when exposed to air.
Figure 6-1. (a) Local structure and Calcium coordination environment of CaSDB; (b) View
of the structure of activated CaSDB along b axis, showing the diamond-shaped channels
with the size of ~ 5.5 Å in diameter.
129
For the performance of CO2 storage, CaSDB shows a reversible uptake of CO2 of
4.37 wt% at 298 K, 1 bar; with a high CO2/N2 selectivity. The specific CO2 adsorption sites
at the framework has been explored by Plonka et al., who observed that CO2 molecules
adopt two positions approximately in the middle of the channel through the interaction
between the delocalized π aromatic system of both phenyl rings of the organic linker and
the molecular quadrupole of CO2 via single crystal data.14 The CO2 – phenyl ring
interactions at low pressures (≤ 1 bar) in an alkaline-metal-containing MOFs is novel and
encouraging in the search for alternative mechanisms for CO2 adsorption under higher
pressures, as the application of MOFs as a gas storage media sometimes requires extreme
loading pressures that is far beyond ambient pressure. So far no study has addressed the
CO2 storage in CaSDB and guest-host interactions at high pressures in the gigapascal scale,
despite the adsorption studies at low pressures mentioned above. Application of high
external pressure on the framework may significantly change the framework topology,15-25
the pore size opening and thus the adsorption properties.26-33 Thus the stability of the
framework is pivotal to its gas storage performance. Besides, the storage capacity can be
substantially enhanced as more CO2 could be inserted into the framework at high pressures.
In this study, the stability of CaSDB framework and the enhanced CO2 adsorptive
performance under high pressures were examined by IR and Raman spectroscopy, which
allows the understanding of local structures, chemical bonding, and thus the nature of
host−guest interactions between the adsorbed molecules and the framework. We
demonstrated a high stability of activated CaSDB on compression and a remarkable affinity
of the framework towards CO2 at high pressures. In addition to the single CO2 adsorption
130
site observed at ambient pressure, new CO2 interaction sites were found at elevated
pressure, suggesting a pressure-enhanced CO2 storage in CaSDB.
6.2 Experimental section
The CaSDB sample was synthesized according to the literature.12 The detailed
procedure is as follows: a mixture of 4,4′-sulfonyldibenzoate acid (H2SDB, 0.1224 g, 0.4
mmol), Ca(NO3)2·4H2O (0.1890 g, 0.8 mmol), ethanol (9.0 ml) and H2O (1.0 ml) was
stirred for 10 min in air. Then the mixture was placed in a 100 ml Teflon autoclave and
heated at 150 °C for 20 minutes. The autoclave was cooled to room temperature, washed
with fresh ethanol and colorless crystals were collected (0.1077 g, 74.3% yield based on
the H2SDB reagent). The as-synthesized sample was then activated in a vacuum gas
manifold at 563 K to remove the solvent molecules inside the channels of the framework.
The crystallinity of the activated sample was checked by XRD.
To achieve high pressure, diamond anvil cells (DAC) equipped with type II and I
diamonds with culet size of 600 μm were used for IR and Raman measurements,
respectively. Stainless steel gaskets were predrilled with a hole of 200 μm as the sample
chamber. The samples with 30 μm in thickness were loaded into the gasket along with a
few ruby chips as the pressure calibrant. To study CO2 storage in CaSDB under high
pressures, the activated CaSDB powder samples were firstly loaded into the DAC which
was cooled in a cryogenic bath of liquid nitrogen. Gaseous CO2 was then introduced into
the sample chamber when the temperature was below the melting point of dry ice (i.e., <
−78 °C) before the DAC was sealed with minimal possible pressure (~ 0.5 GPa). After the
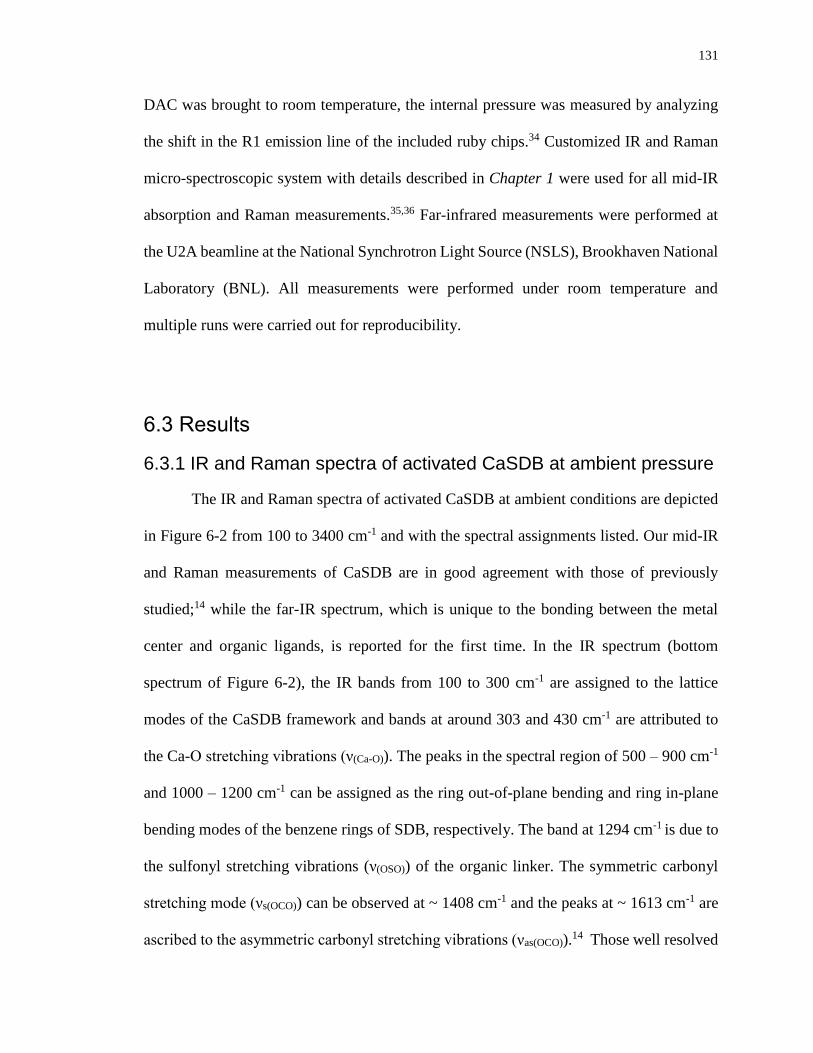
131
DAC was brought to room temperature, the internal pressure was measured by analyzing
the shift in the R1 emission line of the included ruby chips.34 Customized IR and Raman
micro-spectroscopic system with details described in Chapter 1 were used for all mid-IR
absorption and Raman measurements.35,36 Far-infrared measurements were performed at
the U2A beamline at the National Synchrotron Light Source (NSLS), Brookhaven National
Laboratory (BNL). All measurements were performed under room temperature and
multiple runs were carried out for reproducibility.
6.3 Results
6.3.1 IR and Raman spectra of activated CaSDB at ambient pressure
The IR and Raman spectra of activated CaSDB at ambient conditions are depicted
in Figure 6-2 from 100 to 3400 cm-1 and with the spectral assignments listed. Our mid-IR
and Raman measurements of CaSDB are in good agreement with those of previously
studied;14 while the far-IR spectrum, which is unique to the bonding between the metal
center and organic ligands, is reported for the first time. In the IR spectrum (bottom
spectrum of Figure 6-2), the IR bands from 100 to 300 cm-1 are assigned to the lattice
modes of the CaSDB framework and bands at around 303 and 430 cm-1 are attributed to
the Ca-O stretching vibrations (ν(Ca-O)). The peaks in the spectral region of 500 – 900 cm-1
and 1000 – 1200 cm-1 can be assigned as the ring out-of-plane bending and ring in-plane
bending modes of the benzene rings of SDB, respectively. The band at 1294 cm-1 is due to
the sulfonyl stretching vibrations (ν(OSO)) of the organic linker. The symmetric carbonyl
stretching mode (νs(OCO)) can be observed at ~ 1408 cm-1 and the peaks at ~ 1613 cm-1 are
ascribed to the asymmetric carbonyl stretching vibrations (νas(OCO)).14 Those well resolved
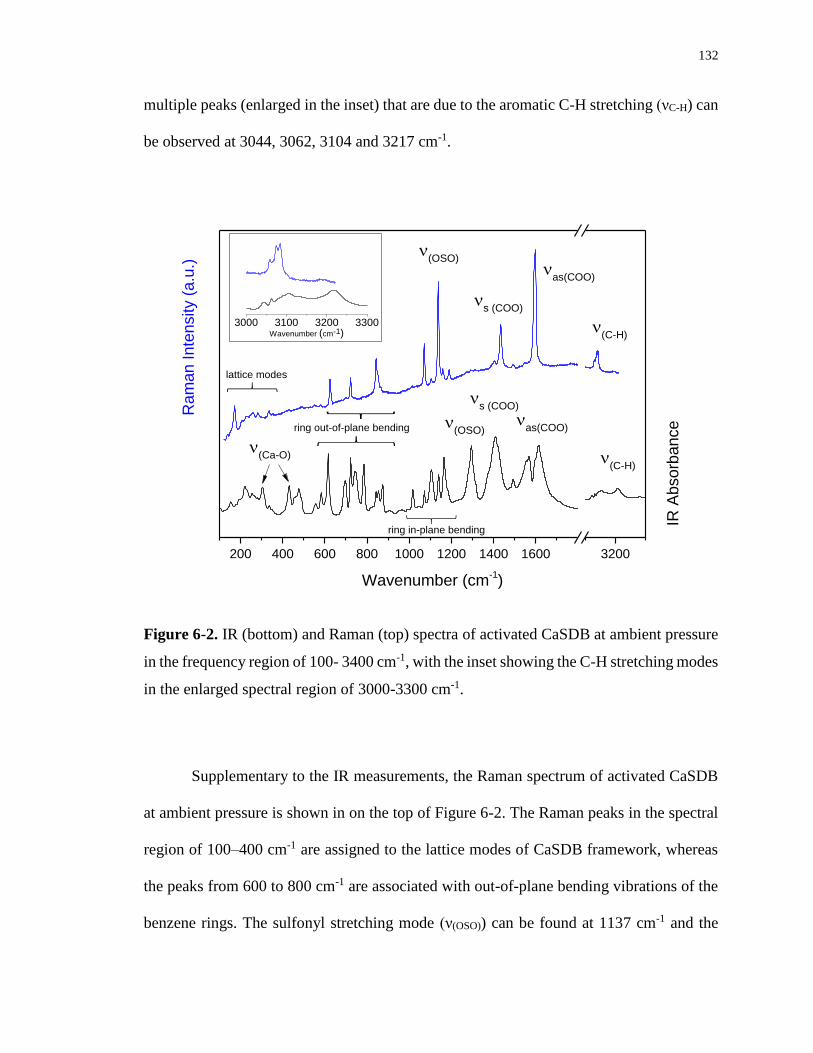
132
multiple peaks (enlarged in the inset) that are due to the aromatic C-H stretching (νC-H) can
be observed at 3044, 3062, 3104 and 3217 cm-1.
200 400 600 800 1000 1200 1400 1600 3200
3000 3100 3200 3300
(Ca-O)
ring out-of-plane bending
(OSO)
(C-H)
s (COO)
as(COO)
(C-H)
(OSO)
s (COO)
as(COO)
IR A
bso
rban
ce
Ra
man
In
ten
sity (
a.u
.)
Wavenumber (cm-1)
ring in-plane bending
lattice modes
Wavenumber (cm-1)
Figure 6-2. IR (bottom) and Raman (top) spectra of activated CaSDB at ambient pressure
in the frequency region of 100- 3400 cm-1, with the inset showing the C-H stretching modes
in the enlarged spectral region of 3000-3300 cm-1.
Supplementary to the IR measurements, the Raman spectrum of activated CaSDB
at ambient pressure is shown in on the top of Figure 6-2. The Raman peaks in the spectral
region of 100–400 cm-1 are assigned to the lattice modes of CaSDB framework, whereas
the peaks from 600 to 800 cm-1 are associated with out-of-plane bending vibrations of the
benzene rings. The sulfonyl stretching mode (ν(OSO)) can be found at 1137 cm-1 and the
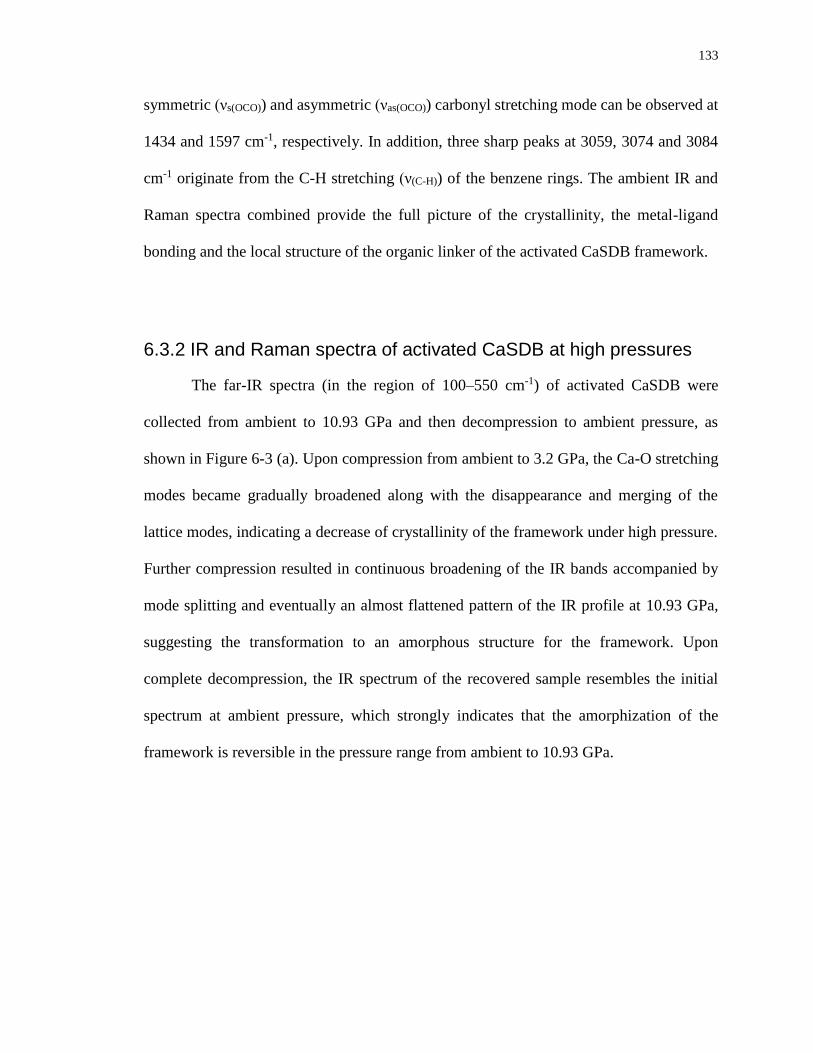
133
symmetric (νs(OCO)) and asymmetric (νas(OCO)) carbonyl stretching mode can be observed at
1434 and 1597 cm-1, respectively. In addition, three sharp peaks at 3059, 3074 and 3084
cm-1 originate from the C-H stretching (ν(C-H)) of the benzene rings. The ambient IR and
Raman spectra combined provide the full picture of the crystallinity, the metal-ligand
bonding and the local structure of the organic linker of the activated CaSDB framework.
6.3.2 IR and Raman spectra of activated CaSDB at high pressures
The far-IR spectra (in the region of 100–550 cm-1) of activated CaSDB were
collected from ambient to 10.93 GPa and then decompression to ambient pressure, as
shown in Figure 6-3 (a). Upon compression from ambient to 3.2 GPa, the Ca-O stretching
modes became gradually broadened along with the disappearance and merging of the
lattice modes, indicating a decrease of crystallinity of the framework under high pressure.
Further compression resulted in continuous broadening of the IR bands accompanied by
mode splitting and eventually an almost flattened pattern of the IR profile at 10.93 GPa,
suggesting the transformation to an amorphous structure for the framework. Upon
complete decompression, the IR spectrum of the recovered sample resembles the initial
spectrum at ambient pressure, which strongly indicates that the amorphization of the
framework is reversible in the pressure range from ambient to 10.93 GPa.
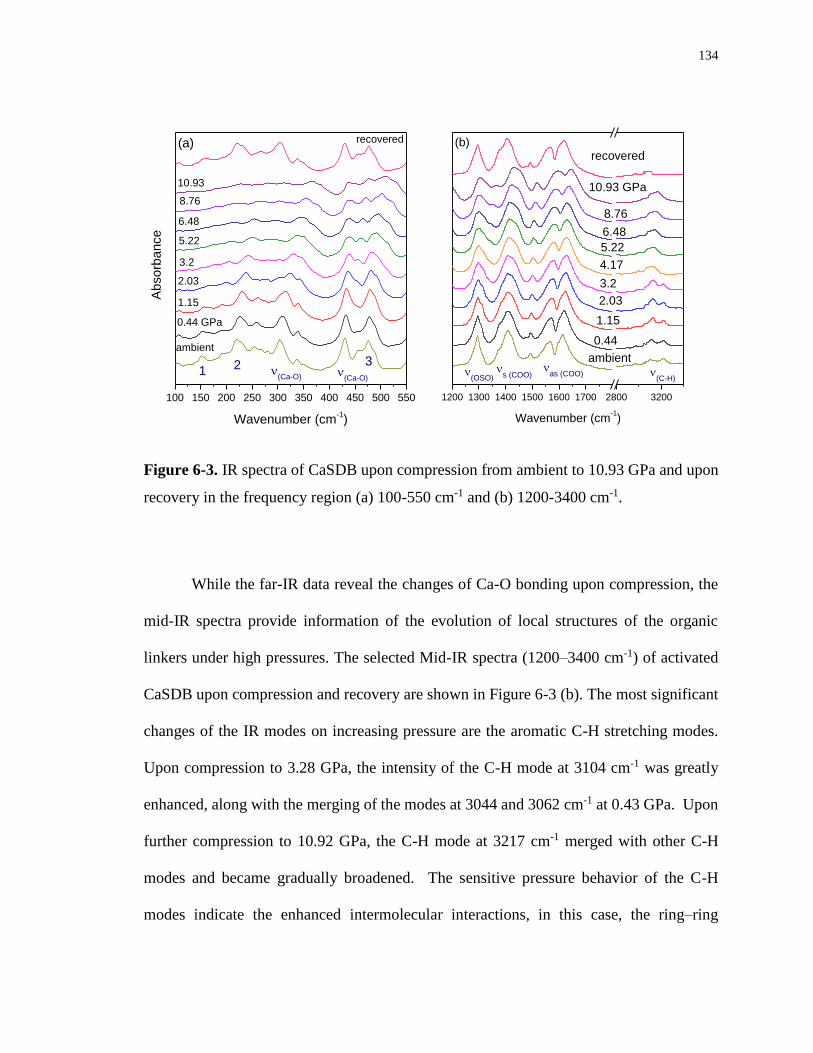
134
100 150 200 250 300 350 400 450 500 550
32
(Ca-O)
Absorb
ance
Wavenumber (cm-1)
ambient
0.44 GPa
1.15
2.03
3.2
5.22
6.48
8.76
10.93
recovered
(Ca-O)
(a)
1
1200 1300 1400 1500 1600 1700 2800 3200
(C-H)
as (COO)
s (COO)
(OSO)
Wavenumber (cm-1)
ambient
0.44
1.15
2.03
3.2
4.17
5.22
6.48
8.76
10.93 GPa
recovered(b)
Figure 6-3. IR spectra of CaSDB upon compression from ambient to 10.93 GPa and upon
recovery in the frequency region (a) 100-550 cm-1 and (b) 1200-3400 cm-1.
While the far-IR data reveal the changes of Ca-O bonding upon compression, the
mid-IR spectra provide information of the evolution of local structures of the organic
linkers under high pressures. The selected Mid-IR spectra (1200–3400 cm-1) of activated
CaSDB upon compression and recovery are shown in Figure 6-3 (b). The most significant
changes of the IR modes on increasing pressure are the aromatic C-H stretching modes.
Upon compression to 3.28 GPa, the intensity of the C-H mode at 3104 cm-1 was greatly
enhanced, along with the merging of the modes at 3044 and 3062 cm-1 at 0.43 GPa. Upon
further compression to 10.92 GPa, the C-H mode at 3217 cm-1 merged with other C-H
modes and became gradually broadened. The sensitive pressure behavior of the C-H
modes indicate the enhanced intermolecular interactions, in this case, the ring–ring
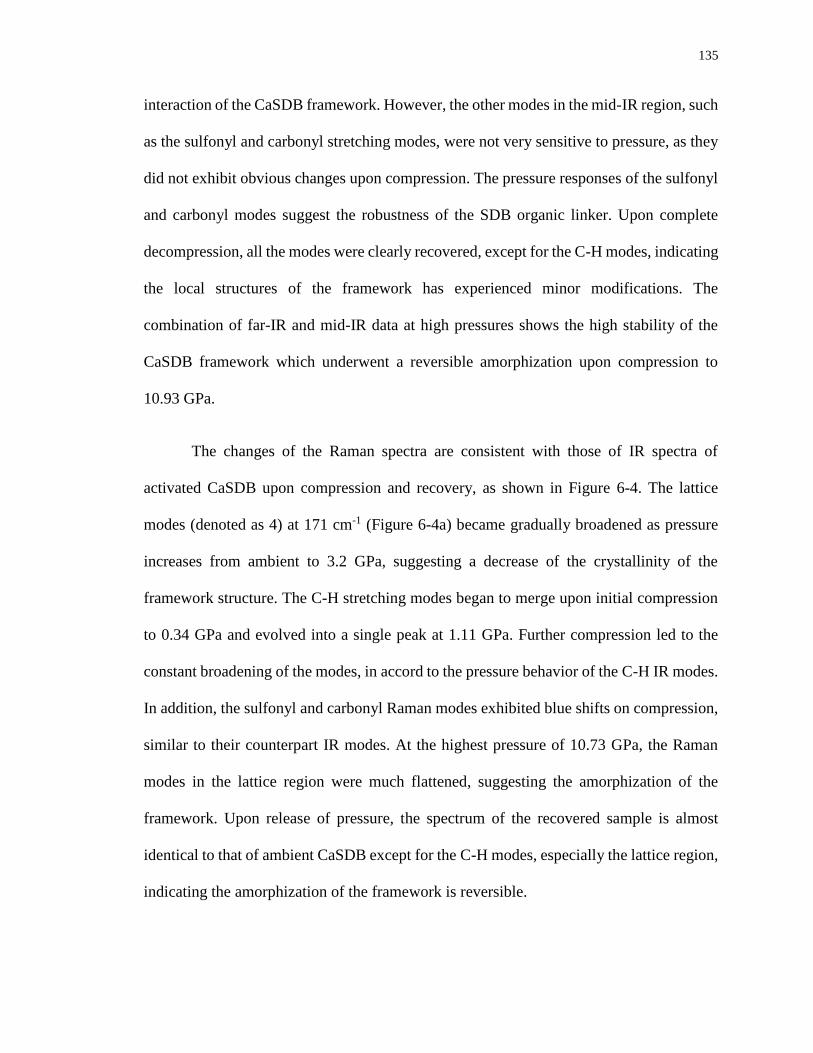
135
interaction of the CaSDB framework. However, the other modes in the mid-IR region, such
as the sulfonyl and carbonyl stretching modes, were not very sensitive to pressure, as they
did not exhibit obvious changes upon compression. The pressure responses of the sulfonyl
and carbonyl modes suggest the robustness of the SDB organic linker. Upon complete
decompression, all the modes were clearly recovered, except for the C-H modes, indicating
the local structures of the framework has experienced minor modifications. The
combination of far-IR and mid-IR data at high pressures shows the high stability of the
CaSDB framework which underwent a reversible amorphization upon compression to
10.93 GPa.
The changes of the Raman spectra are consistent with those of IR spectra of
activated CaSDB upon compression and recovery, as shown in Figure 6-4. The lattice
modes (denoted as 4) at 171 cm-1 (Figure 6-4a) became gradually broadened as pressure
increases from ambient to 3.2 GPa, suggesting a decrease of the crystallinity of the
framework structure. The C-H stretching modes began to merge upon initial compression
to 0.34 GPa and evolved into a single peak at 1.11 GPa. Further compression led to the
constant broadening of the modes, in accord to the pressure behavior of the C-H IR modes.
In addition, the sulfonyl and carbonyl Raman modes exhibited blue shifts on compression,
similar to their counterpart IR modes. At the highest pressure of 10.73 GPa, the Raman
modes in the lattice region were much flattened, suggesting the amorphization of the
framework. Upon release of pressure, the spectrum of the recovered sample is almost
identical to that of ambient CaSDB except for the C-H modes, especially the lattice region,
indicating the amorphization of the framework is reversible.
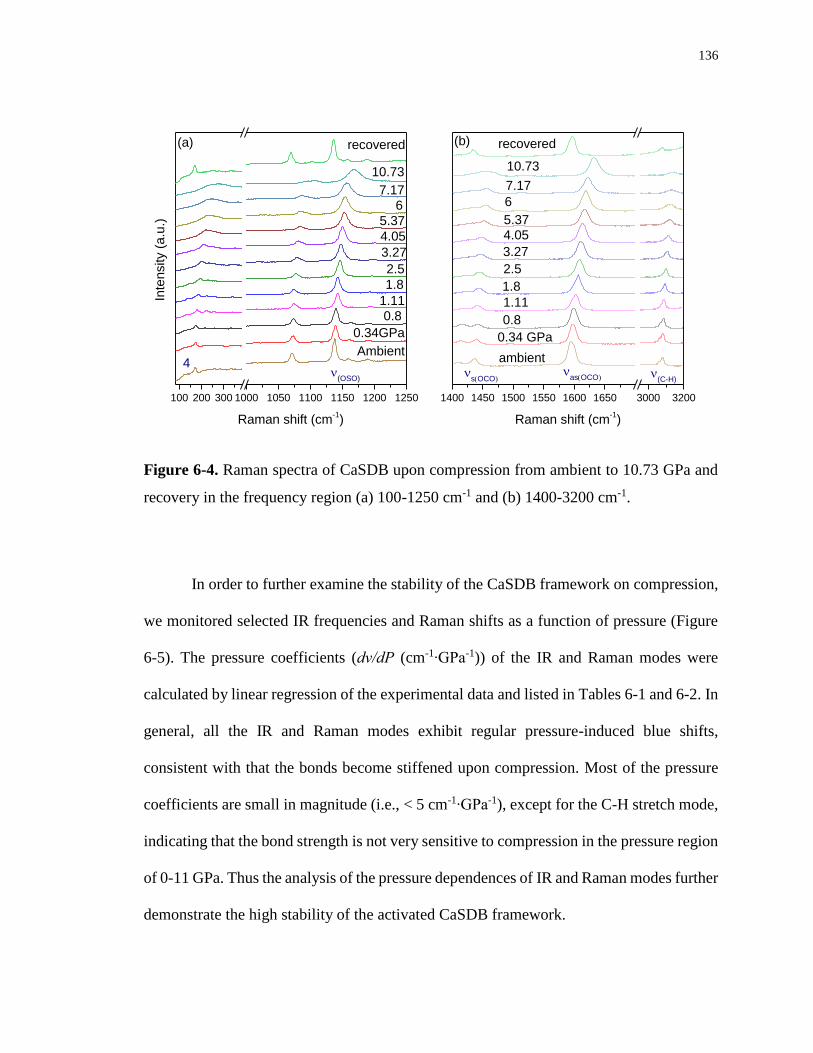
136
100 200 300 1000 1050 1100 1150 1200 1250
Inte
nsity (
a.u
.)
Raman shift (cm-1)
0.34GPa
0.8 1.11
1.8
2.5
3.27
4.05
5.37
6
7.17
10.73
recovered
Ambient
(a)
(OSO)
4
1400 1450 1500 1550 1600 1650 3000 3200
(C-H)
s(OCO)
Raman shift (cm
-1)
ambient
0.34 GPa
0.8
1.11
1.8
2.5
3.27
4.055.37
6
7.17
10.73
recovered
as(OCO)
(b)
Figure 6-4. Raman spectra of CaSDB upon compression from ambient to 10.73 GPa and
recovery in the frequency region (a) 100-1250 cm-1 and (b) 1400-3200 cm-1.
In order to further examine the stability of the CaSDB framework on compression,
we monitored selected IR frequencies and Raman shifts as a function of pressure (Figure
6-5). The pressure coefficients (dν/dP (cm-1∙GPa-1)) of the IR and Raman modes were
calculated by linear regression of the experimental data and listed in Tables 6-1 and 6-2. In
general, all the IR and Raman modes exhibit regular pressure-induced blue shifts,
consistent with that the bonds become stiffened upon compression. Most of the pressure
coefficients are small in magnitude (i.e., < 5 cm-1∙GPa-1), except for the C-H stretch mode,
indicating that the bond strength is not very sensitive to compression in the pressure region
of 0-11 GPa. Thus the analysis of the pressure dependences of IR and Raman modes further
demonstrate the high stability of the activated CaSDB framework.
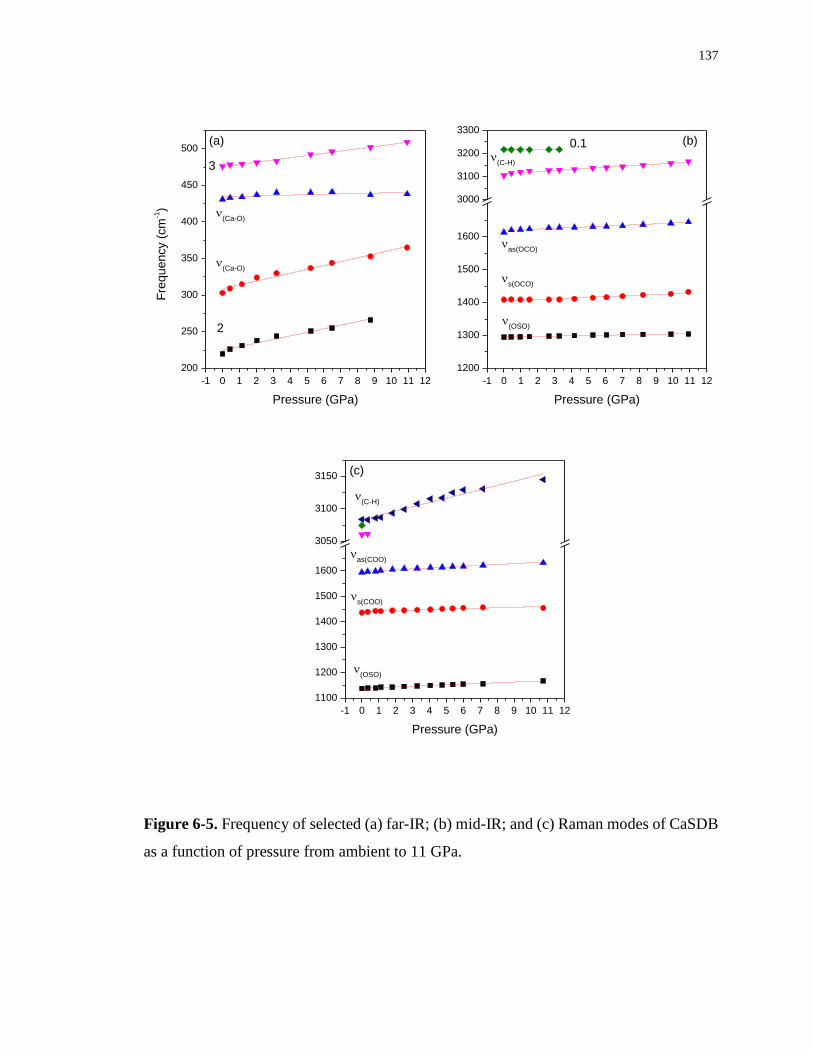
137
-1 0 1 2 3 4 5 6 7 8 9 10 11 12
200
250
300
350
400
450
500
(Ca-O)
(Ca-O)
3
Fre
quency (
cm
-1)
Pressure (GPa)
2
(a)
-1 0 1 2 3 4 5 6 7 8 9 10 11 12
1200
1300
1400
1500
1600
3000
3100
3200
3300
(C-H)
(OSO)
s(OCO)
as(OCO)
Pressure (GPa)
0.1 (b)
-1 0 1 2 3 4 5 6 7 8 9 10 11 12
1100
1200
1300
1400
1500
1600
3050
3100
3150
(OSO)
s(COO)
(C-H)
as(COO)
Pressure (GPa)
(c)
Figure 6-5. Frequency of selected (a) far-IR; (b) mid-IR; and (c) Raman modes of CaSDB
as a function of pressure from ambient to 11 GPa.
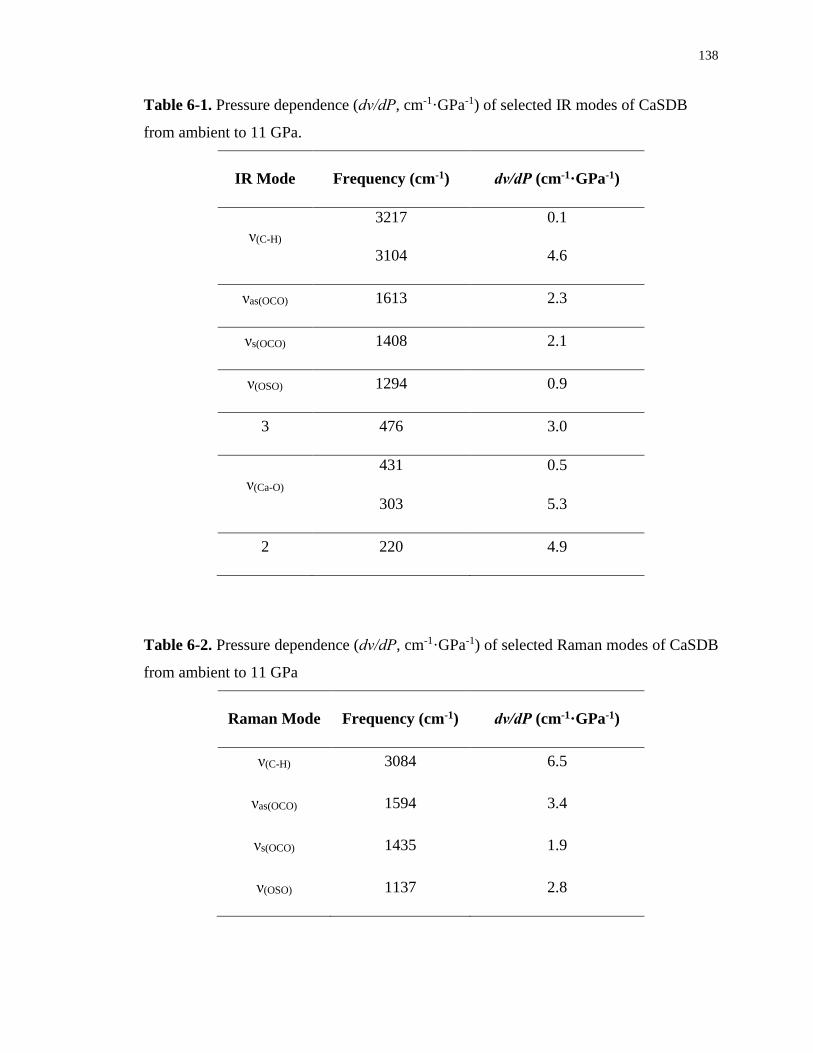
138
Table 6-1. Pressure dependence (dν/dP, cm-1·GPa-1) of selected IR modes of CaSDB
from ambient to 11 GPa.
IR Mode Frequency (cm-1) dν/dP (cm-1·GPa-1)
ν(C-H)
3217
3104
0.1
4.6
νas(OCO) 1613 2.3
νs(OCO) 1408 2.1
ν(OSO) 1294 0.9
3 476 3.0
ν(Ca-O)
431 0.5
303 5.3
2 220 4.9
Table 6-2. Pressure dependence (dν/dP, cm-1·GPa-1) of selected Raman modes of CaSDB
from ambient to 11 GPa
Raman Mode Frequency (cm-1) dν/dP (cm-1·GPa-1)
ν(C-H) 3084 6.5
νas(OCO) 1594 3.4
νs(OCO) 1435 1.9
ν(OSO) 1137 2.8
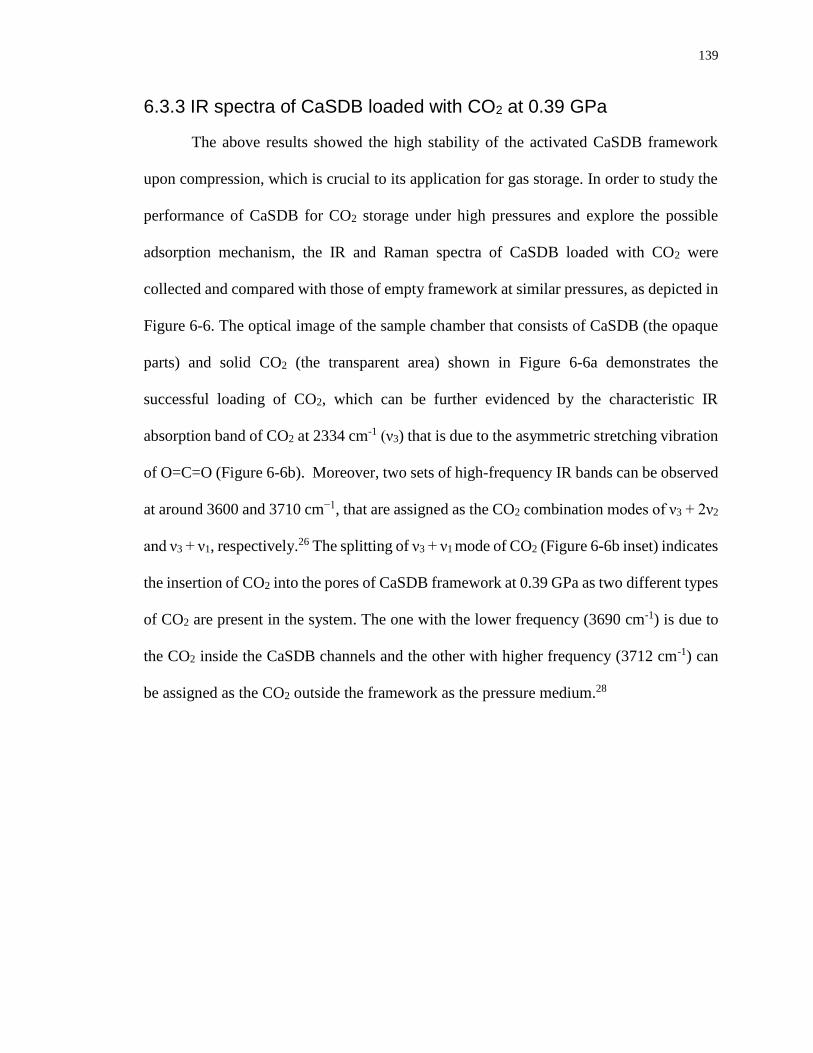
139
6.3.3 IR spectra of CaSDB loaded with CO2 at 0.39 GPa
The above results showed the high stability of the activated CaSDB framework
upon compression, which is crucial to its application for gas storage. In order to study the
performance of CaSDB for CO2 storage under high pressures and explore the possible
adsorption mechanism, the IR and Raman spectra of CaSDB loaded with CO2 were
collected and compared with those of empty framework at similar pressures, as depicted in
Figure 6-6. The optical image of the sample chamber that consists of CaSDB (the opaque
parts) and solid CO2 (the transparent area) shown in Figure 6-6a demonstrates the
successful loading of CO2, which can be further evidenced by the characteristic IR
absorption band of CO2 at 2334 cm-1 (ν3) that is due to the asymmetric stretching vibration
of O=C=O (Figure 6-6b). Moreover, two sets of high-frequency IR bands can be observed
at around 3600 and 3710 cm−1, that are assigned as the CO2 combination modes of ν3 + 2ν2
and ν3 + ν1, respectively.26 The splitting of ν3 + ν1 mode of CO2 (Figure 6-6b inset) indicates
the insertion of CO2 into the pores of CaSDB framework at 0.39 GPa as two different types
of CO2 are present in the system. The one with the lower frequency (3690 cm-1) is due to
the CO2 inside the CaSDB channels and the other with higher frequency (3712 cm-1) can
be assigned as the CO2 outside the framework as the pressure medium.28
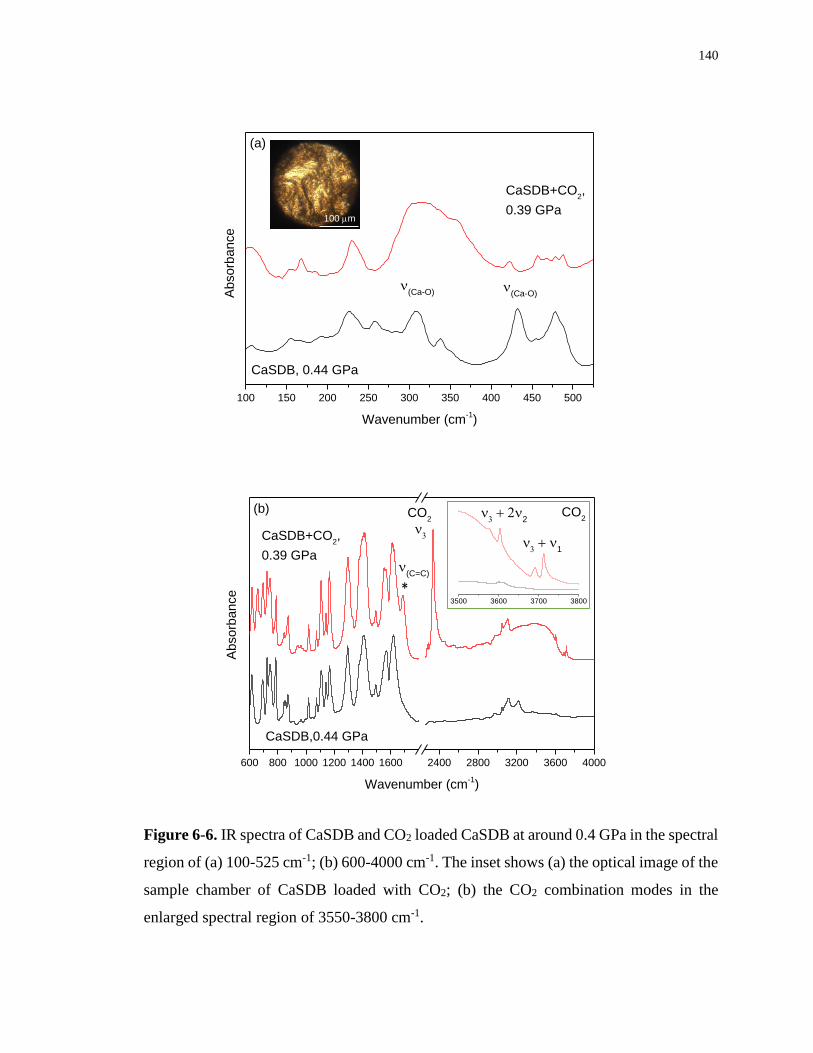
140
100 150 200 250 300 350 400 450 500
(Ca-O)A
bsorb
ance
Wavenumber (cm-1)
CaSDB+CO2,
0.39 GPa
CaSDB, 0.44 GPa
(Ca-O)
(a)
100 m
600 800 1000 1200 1400 1600 2400 2800 3200 3600 4000
Absorb
ance
(C=C)
CO2
*
1
3500 3600 3700 3800
2
CaSDB+CO2,
0.39 GPa
Wavenumber (cm-1)
CaSDB,0.44 GPa
(b) CO2
Figure 6-6. IR spectra of CaSDB and CO2 loaded CaSDB at around 0.4 GPa in the spectral
region of (a) 100-525 cm-1; (b) 600-4000 cm-1. The inset shows (a) the optical image of the
sample chamber of CaSDB loaded with CO2; (b) the CO2 combination modes in the
enlarged spectral region of 3550-3800 cm-1.
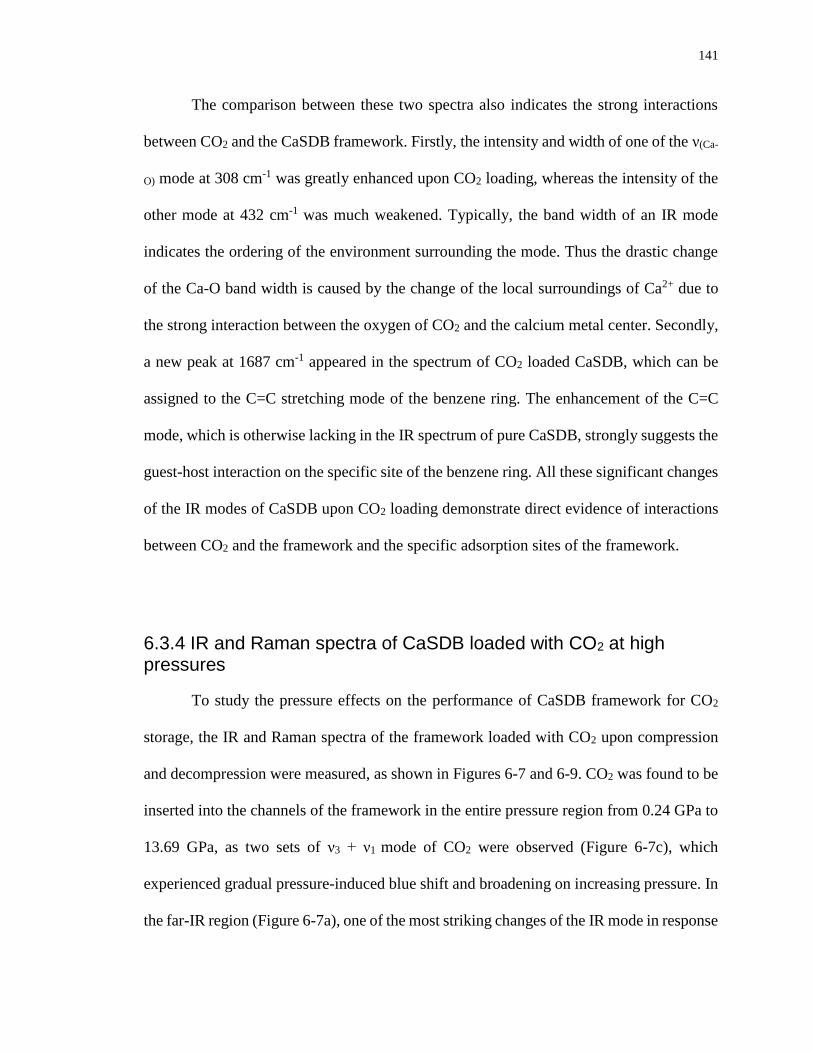
141
The comparison between these two spectra also indicates the strong interactions
between CO2 and the CaSDB framework. Firstly, the intensity and width of one of the ν(Ca-
O) mode at 308 cm-1 was greatly enhanced upon CO2 loading, whereas the intensity of the
other mode at 432 cm-1 was much weakened. Typically, the band width of an IR mode
indicates the ordering of the environment surrounding the mode. Thus the drastic change
of the Ca-O band width is caused by the change of the local surroundings of Ca2+ due to
the strong interaction between the oxygen of CO2 and the calcium metal center. Secondly,
a new peak at 1687 cm-1 appeared in the spectrum of CO2 loaded CaSDB, which can be
assigned to the C=C stretching mode of the benzene ring. The enhancement of the C=C
mode, which is otherwise lacking in the IR spectrum of pure CaSDB, strongly suggests the
guest-host interaction on the specific site of the benzene ring. All these significant changes
of the IR modes of CaSDB upon CO2 loading demonstrate direct evidence of interactions
between CO2 and the framework and the specific adsorption sites of the framework.
6.3.4 IR and Raman spectra of CaSDB loaded with CO2 at high pressures
To study the pressure effects on the performance of CaSDB framework for CO2
storage, the IR and Raman spectra of the framework loaded with CO2 upon compression
and decompression were measured, as shown in Figures 6-7 and 6-9. CO2 was found to be
inserted into the channels of the framework in the entire pressure region from 0.24 GPa to
13.69 GPa, as two sets of ν3 + ν1 mode of CO2 were observed (Figure 6-7c), which
experienced gradual pressure-induced blue shift and broadening on increasing pressure. In
the far-IR region (Figure 6-7a), one of the most striking changes of the IR mode in response
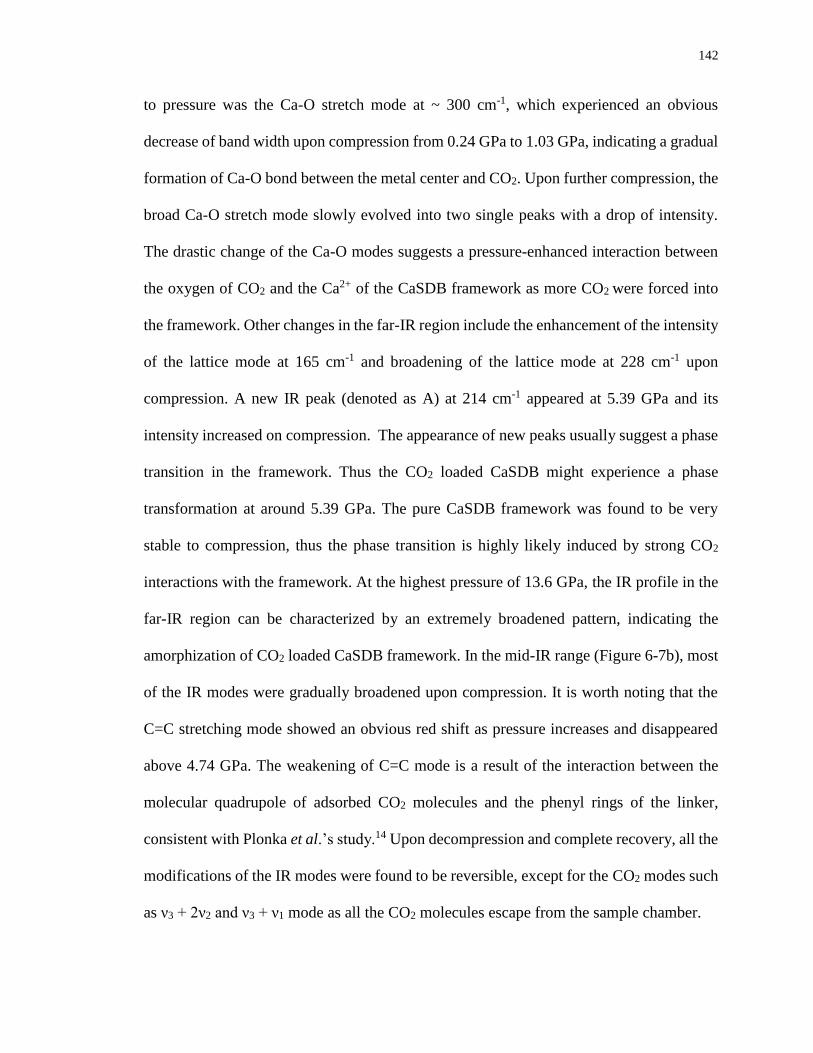
142
to pressure was the Ca-O stretch mode at ~ 300 cm-1, which experienced an obvious
decrease of band width upon compression from 0.24 GPa to 1.03 GPa, indicating a gradual
formation of Ca-O bond between the metal center and CO2. Upon further compression, the
broad Ca-O stretch mode slowly evolved into two single peaks with a drop of intensity.
The drastic change of the Ca-O modes suggests a pressure-enhanced interaction between
the oxygen of CO2 and the Ca2+ of the CaSDB framework as more CO2 were forced into
the framework. Other changes in the far-IR region include the enhancement of the intensity
of the lattice mode at 165 cm-1 and broadening of the lattice mode at 228 cm-1 upon
compression. A new IR peak (denoted as A) at 214 cm-1 appeared at 5.39 GPa and its
intensity increased on compression. The appearance of new peaks usually suggest a phase
transition in the framework. Thus the CO2 loaded CaSDB might experience a phase
transformation at around 5.39 GPa. The pure CaSDB framework was found to be very
stable to compression, thus the phase transition is highly likely induced by strong CO2
interactions with the framework. At the highest pressure of 13.6 GPa, the IR profile in the
far-IR region can be characterized by an extremely broadened pattern, indicating the
amorphization of CO2 loaded CaSDB framework. In the mid-IR range (Figure 6-7b), most
of the IR modes were gradually broadened upon compression. It is worth noting that the
C=C stretching mode showed an obvious red shift as pressure increases and disappeared
above 4.74 GPa. The weakening of C=C mode is a result of the interaction between the
molecular quadrupole of adsorbed CO2 molecules and the phenyl rings of the linker,
consistent with Plonka et al.’s study.14 Upon decompression and complete recovery, all the
modifications of the IR modes were found to be reversible, except for the CO2 modes such
as ν3 + 2ν2 and ν3 + ν1 mode as all the CO2 molecules escape from the sample chamber.
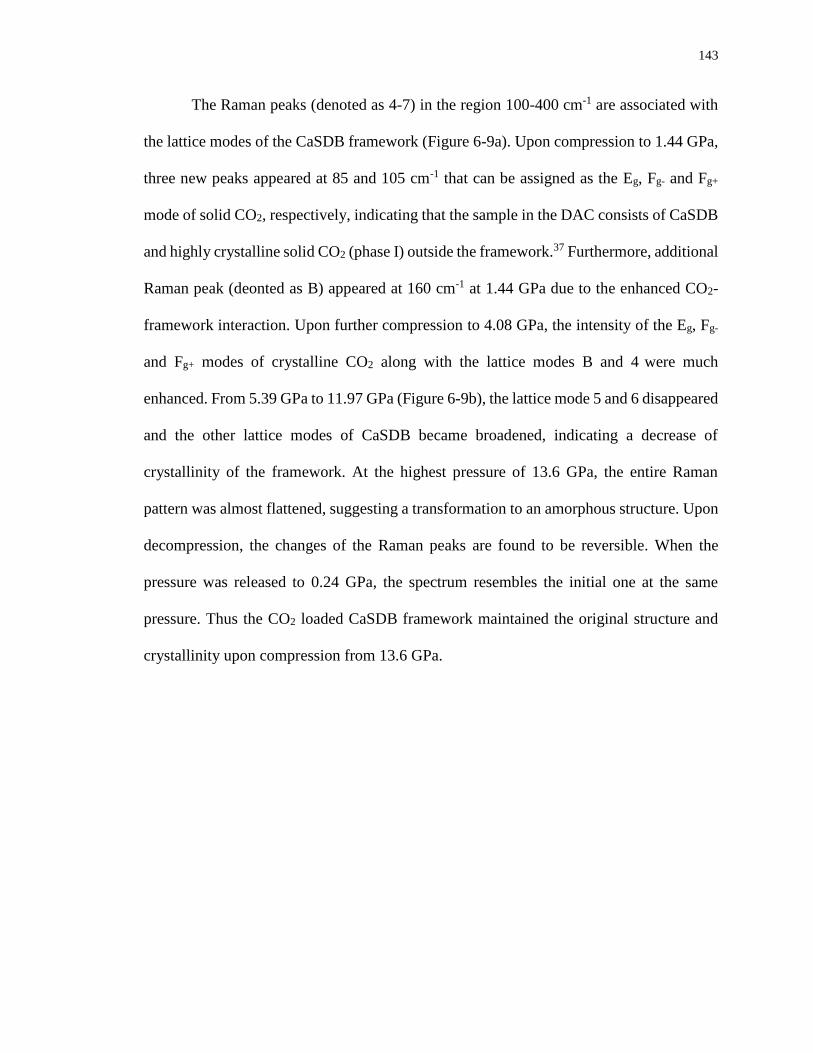
143
The Raman peaks (denoted as 4-7) in the region 100-400 cm-1 are associated with
the lattice modes of the CaSDB framework (Figure 6-9a). Upon compression to 1.44 GPa,
three new peaks appeared at 85 and 105 cm-1 that can be assigned as the Eg, Fg- and Fg+
mode of solid CO2, respectively, indicating that the sample in the DAC consists of CaSDB
and highly crystalline solid CO2 (phase I) outside the framework.37 Furthermore, additional
Raman peak (deonted as B) appeared at 160 cm-1 at 1.44 GPa due to the enhanced CO2-
framework interaction. Upon further compression to 4.08 GPa, the intensity of the Eg, Fg-
and Fg+ modes of crystalline CO2 along with the lattice modes B and 4 were much
enhanced. From 5.39 GPa to 11.97 GPa (Figure 6-9b), the lattice mode 5 and 6 disappeared
and the other lattice modes of CaSDB became broadened, indicating a decrease of
crystallinity of the framework. At the highest pressure of 13.6 GPa, the entire Raman
pattern was almost flattened, suggesting a transformation to an amorphous structure. Upon
decompression, the changes of the Raman peaks are found to be reversible. When the
pressure was released to 0.24 GPa, the spectrum resembles the initial one at the same
pressure. Thus the CO2 loaded CaSDB framework maintained the original structure and
crystallinity upon compression from 13.6 GPa.
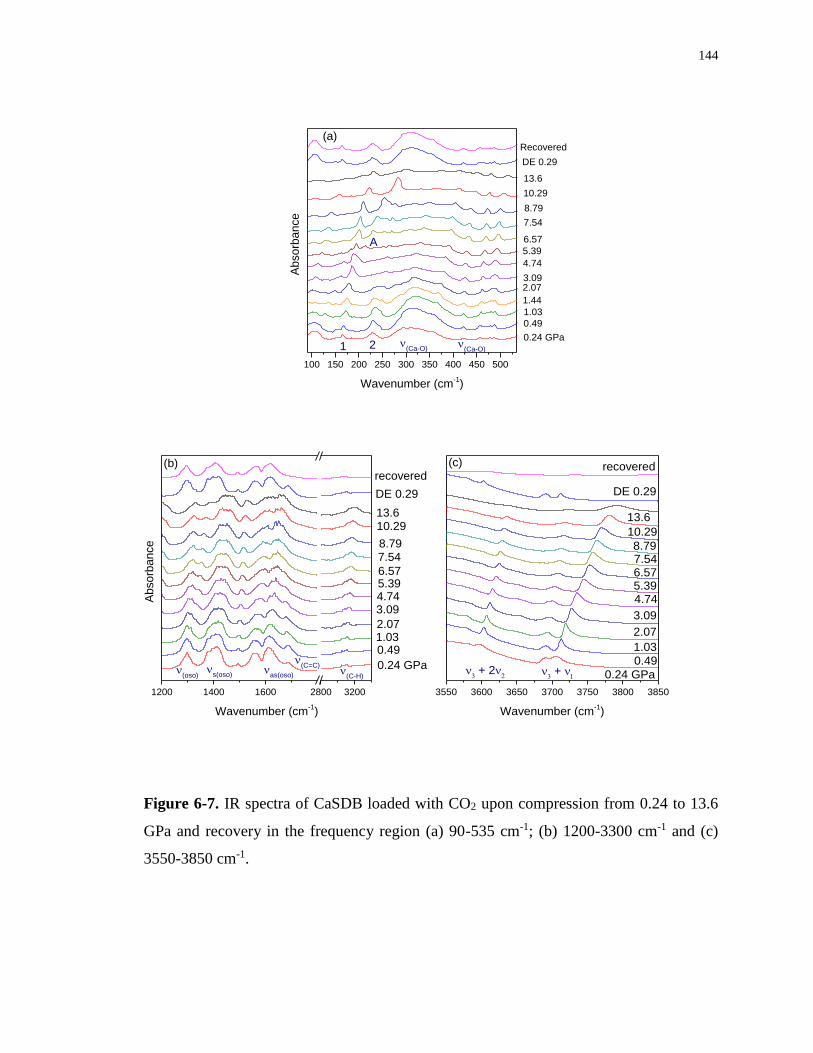
144
100 150 200 250 300 350 400 450 500
A
(Ca-O)21
Absorb
ance
Wavenumber (cm-1)
0.24 GPa
0.49
1.03
1.44
2.073.09
4.74
5.39
6.57
7.54
8.79
10.29
13.6
Recovered
DE 0.29
(a)
(Ca-O)
1200 1400 1600 2800 3200
Absorb
ance
(C-H)
(C=C)
as(oso)
s(oso)
Wavenumber (cm-1)
0.24 GPa
0.491.032.07
3.094.745.396.57
7.548.79
10.2913.6
DE 0.29
recovered
(oso)
(b)
3550 3600 3650 3700 3750 3800 3850
+
Wavenumber (cm-1)
0.24 GPa
0.49
1.03
2.07
3.09
4.745.396.577.548.79
10.29
13.6
DE 0.29
recovered
+ 2
(c)
Figure 6-7. IR spectra of CaSDB loaded with CO2 upon compression from 0.24 to 13.6
GPa and recovery in the frequency region (a) 90-535 cm-1; (b) 1200-3300 cm-1 and (c)
3550-3850 cm-1.
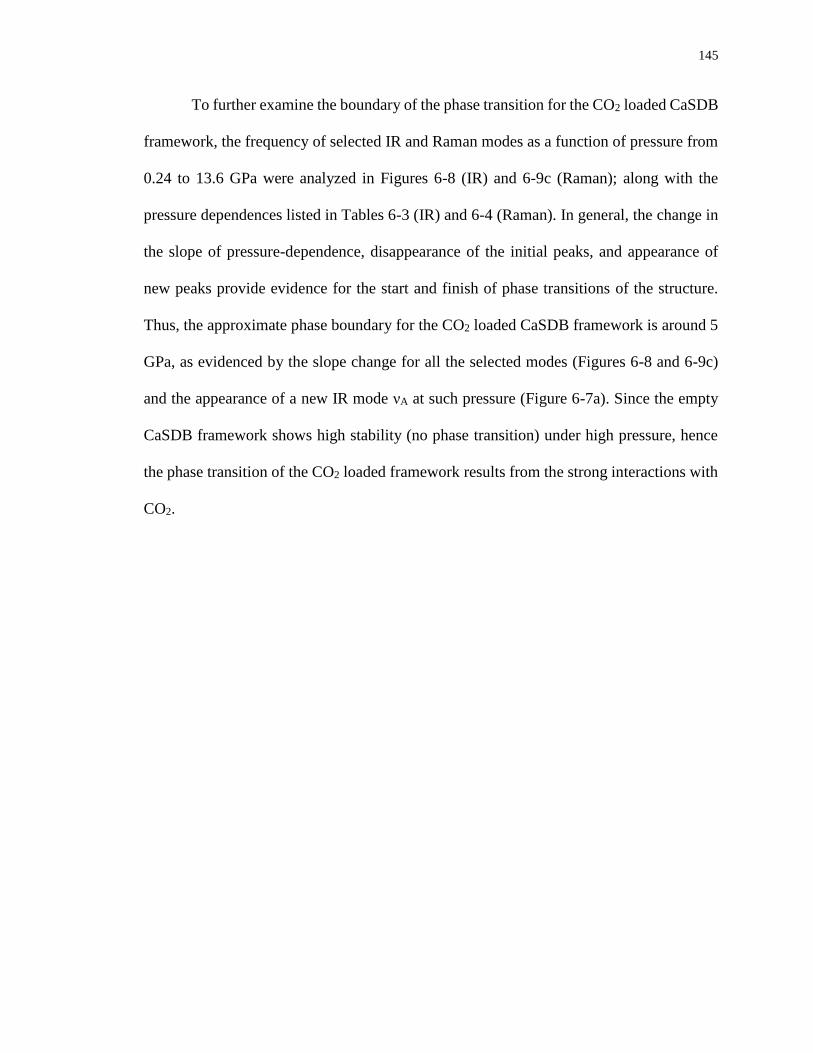
145
To further examine the boundary of the phase transition for the CO2 loaded CaSDB
framework, the frequency of selected IR and Raman modes as a function of pressure from
0.24 to 13.6 GPa were analyzed in Figures 6-8 (IR) and 6-9c (Raman); along with the
pressure dependences listed in Tables 6-3 (IR) and 6-4 (Raman). In general, the change in
the slope of pressure-dependence, disappearance of the initial peaks, and appearance of
new peaks provide evidence for the start and finish of phase transitions of the structure.
Thus, the approximate phase boundary for the CO2 loaded CaSDB framework is around 5
GPa, as evidenced by the slope change for all the selected modes (Figures 6-8 and 6-9c)
and the appearance of a new IR mode νA at such pressure (Figure 6-7a). Since the empty
CaSDB framework shows high stability (no phase transition) under high pressure, hence
the phase transition of the CO2 loaded framework results from the strong interactions with
CO2.
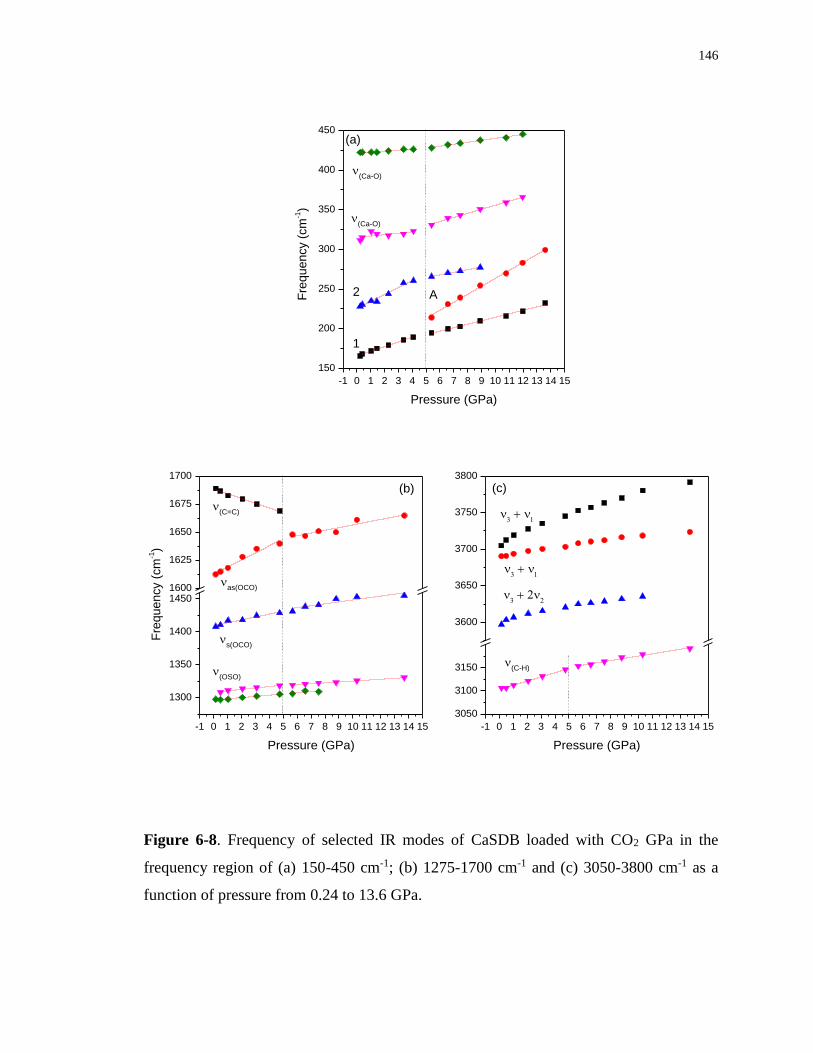
146
-1 0 1 2 3 4 5 6 7 8 9 10 11 12 13 14 15
150
200
250
300
350
400
450
(Ca-O)
(Ca-O)
A2Fre
quency (
cm
-1)
Pressure (GPa)
1
(a)
-1 0 1 2 3 4 5 6 7 8 9 10 11 12 13 14 15
1300
1350
1400
14501600
1625
1650
1675
1700
Fre
quency (
cm
-1)
(OSO)
s(OCO)
as(OCO)
Pressure (GPa)
(C=C)
(b)
-1 0 1 2 3 4 5 6 7 8 9 10 11 12 13 14 15
3050
3100
3150
3600
3650
3700
3750
3800
Pressure (GPa)
(C-H)
(c)
Figure 6-8. Frequency of selected IR modes of CaSDB loaded with CO2 GPa in the
frequency region of (a) 150-450 cm-1; (b) 1275-1700 cm-1 and (c) 3050-3800 cm-1 as a
function of pressure from 0.24 to 13.6 GPa.
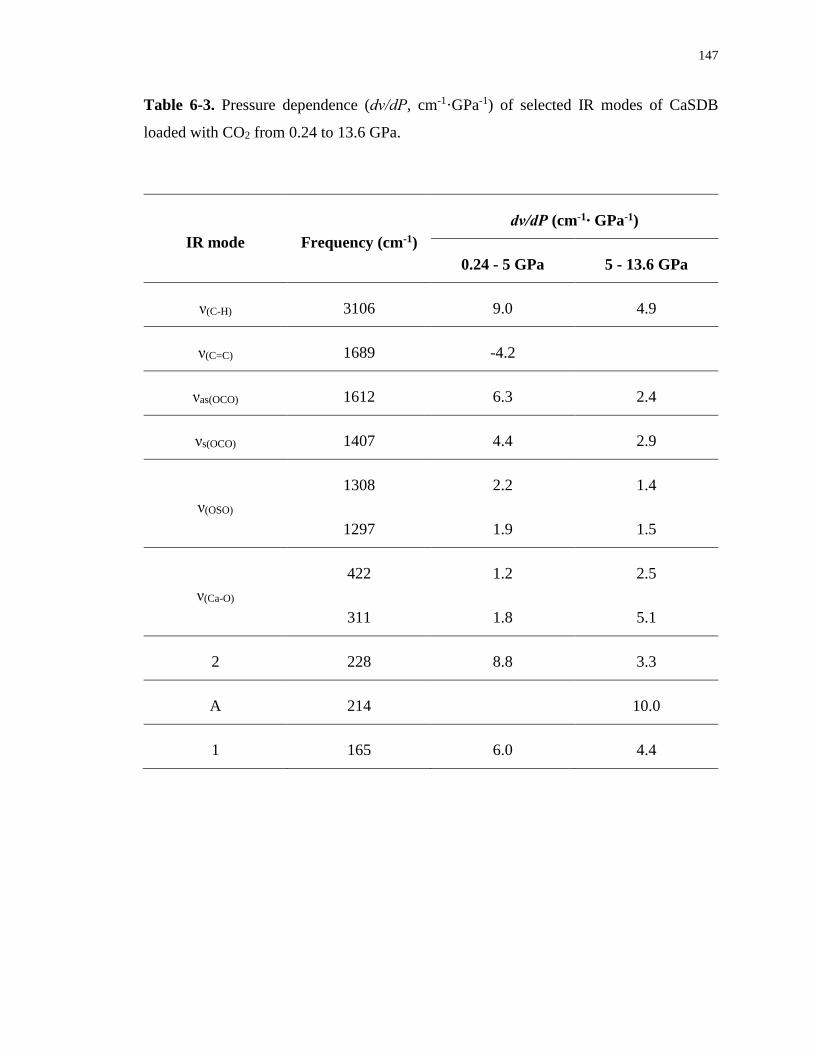
147
Table 6-3. Pressure dependence (dν/dP, cm-1·GPa-1) of selected IR modes of CaSDB
loaded with CO2 from 0.24 to 13.6 GPa.
IR mode Frequency (cm-1)
dν/dP (cm-1∙ GPa-1)
0.24 - 5 GPa 5 - 13.6 GPa
ν(C-H) 3106 9.0 4.9
ν(C=C) 1689 -4.2
νas(OCO) 1612 6.3 2.4
νs(OCO) 1407 4.4 2.9
ν(OSO)
1308 2.2 1.4
1297 1.9 1.5
ν(Ca-O)
422 1.2 2.5
311 1.8 5.1
2 228 8.8 3.3
A 214 10.0
1 165 6.0 4.4
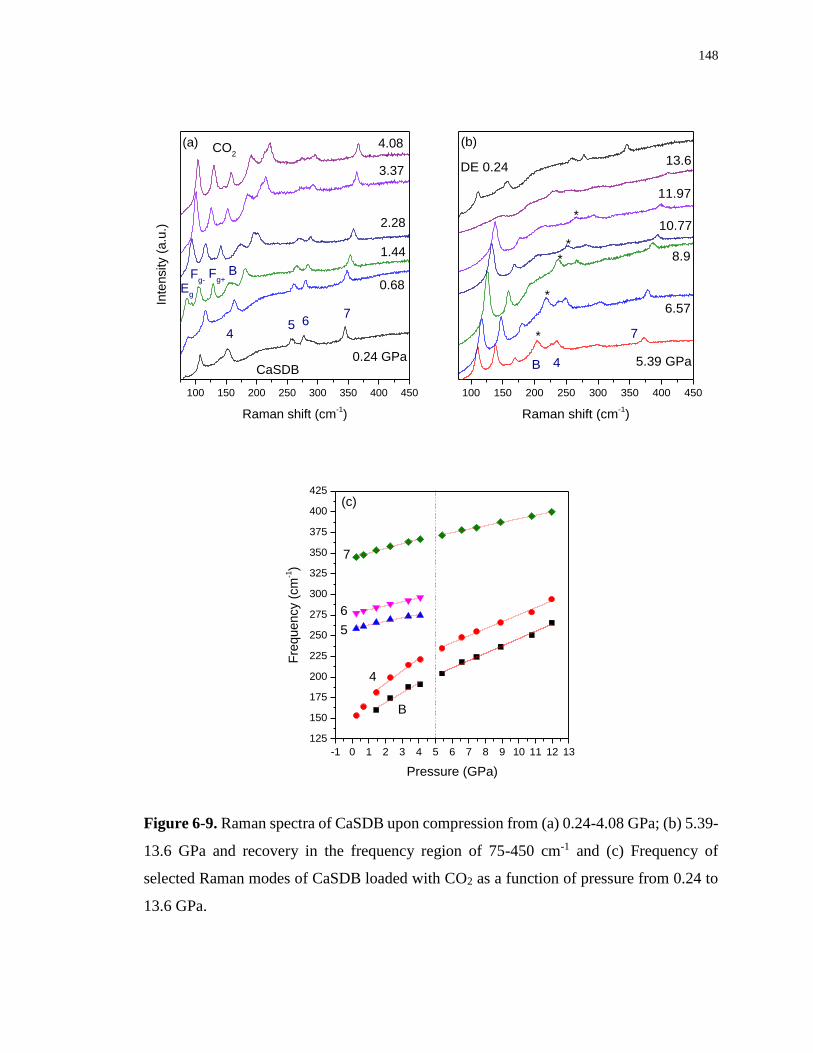
148
100 150 200 250 300 350 400 450
B
765
Fg+
Fg-
Eg
Inte
nsity (
a.u
.)
Raman shift (cm-1)
0.24 GPa
0.68
1.44
2.28
3.37
4.08CO2
CaSDB
(a)
4
100 150 200 250 300 350 400 450
7
4
*
*
*
*
Raman shift (cm-1)
5.39 GPa
8.9
10.77
11.97
13.6DE 0.24
6.57
*
(b)
B
-1 0 1 2 3 4 5 6 7 8 9 10 11 12 13
125
150
175
200
225
250
275
300
325
350
375
400
425
7
6
5
4
Fre
quency (
cm
-1)
Pressure (GPa)
B
(c)
Figure 6-9. Raman spectra of CaSDB upon compression from (a) 0.24-4.08 GPa; (b) 5.39-
13.6 GPa and recovery in the frequency region of 75-450 cm-1 and (c) Frequency of
selected Raman modes of CaSDB loaded with CO2 as a function of pressure from 0.24 to
13.6 GPa.
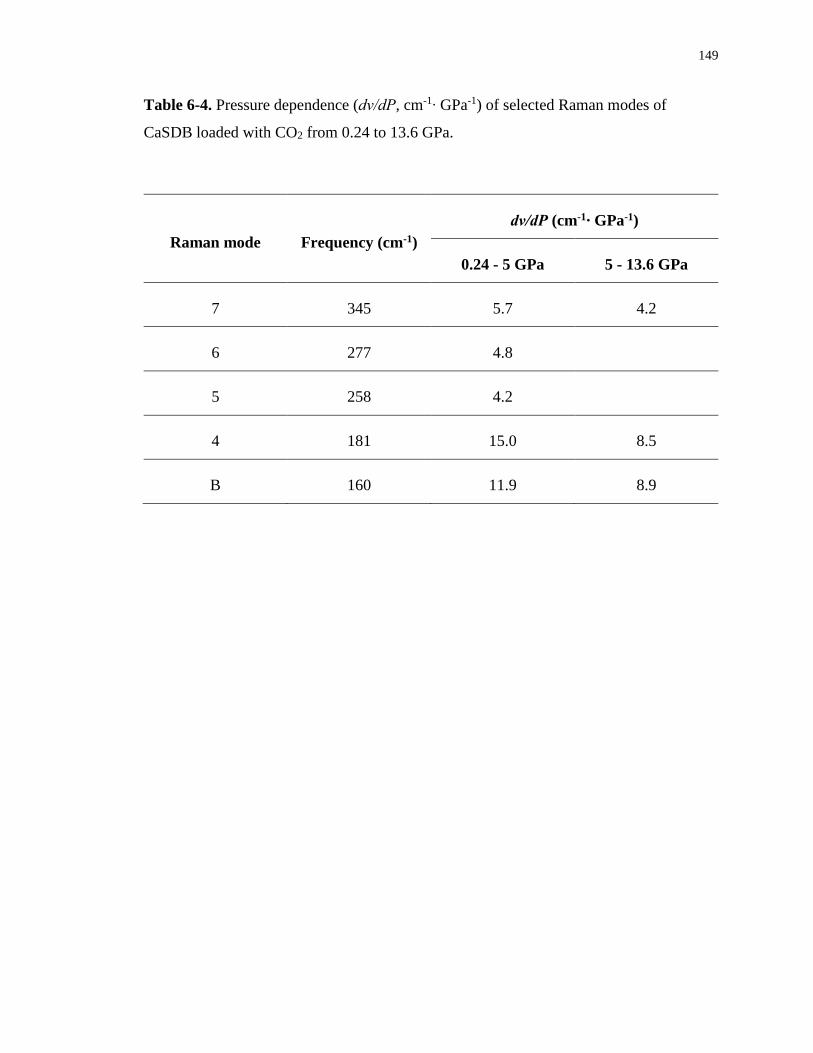
149
Table 6-4. Pressure dependence (dν/dP, cm-1∙ GPa-1) of selected Raman modes of
CaSDB loaded with CO2 from 0.24 to 13.6 GPa.
Raman mode Frequency (cm-1)
dν/dP (cm-1∙ GPa-1)
0.24 - 5 GPa 5 - 13.6 GPa
7 345 5.7 4.2
6 277 4.8
5 258 4.2
4 181 15.0 8.5
B 160 11.9 8.9
150
6.4 Discussion
The above results showed the high stability of activated CaSDB framework under
high pressure and an enhanced CO2 storage in CaSDB induced by pressure. Thus, in-depth
understanding of the contributing factors to the framework stability as well as the guest-
host interaction mechanisms are of fundamental interest. Firstly, the Far-IR and Raman
measurements suggest that the activated CaSDB framework exhibit high crystallinity upon
compression to 3.2 GPa evidenced by the well-resolved lattice modes. The crystalline
stability is close to that of α-Mg3(HCOO)6 and significantly higher than those of other
MOFs investigated under high pressure such as ZIF-8. According to Mao’s work, the
activated α-Mg3(HCOO)6 framework stays crystalline up to 4 GPa with an irreversible
crystalline-to-crystalline phase transition at 2 GPa.36 In contrast, Chapman et al.21
demonstrated that the ZIF-8 framework undergoes irreversible amporphization upon slight
compression to 0.34 GPa. Based on previous studies, the crystalline stability of a MOF
framework mainly depends on the porosity of the framework and the connectivity between
the metal center and organic ligands. The BET surface area and pore volume of CaSDB
are 224 m2/g and 0.65 cm3/g, respectively12, which are slightly higher than those of α-
Mg3(HCOO)6;38 yet much smaller than those of ZIF-8.39 Thus the relatively low porosity
of CaSDB makes the framework crystalline stable. Moreover, the metal center of CaSDB
not only connects with carboxylic oxygens, but also bonds to one of the sulfonyl oxygens
from the ligands due to the special geometry of the SDB ligand. Usually, the metal center
of a MOF framework only bounds to one kind of functional group of the organic linker.
The unique connection of the metal center to bi-functional groups of the organic linker
further helps the stabilization of framework crystallinity to compression. Further
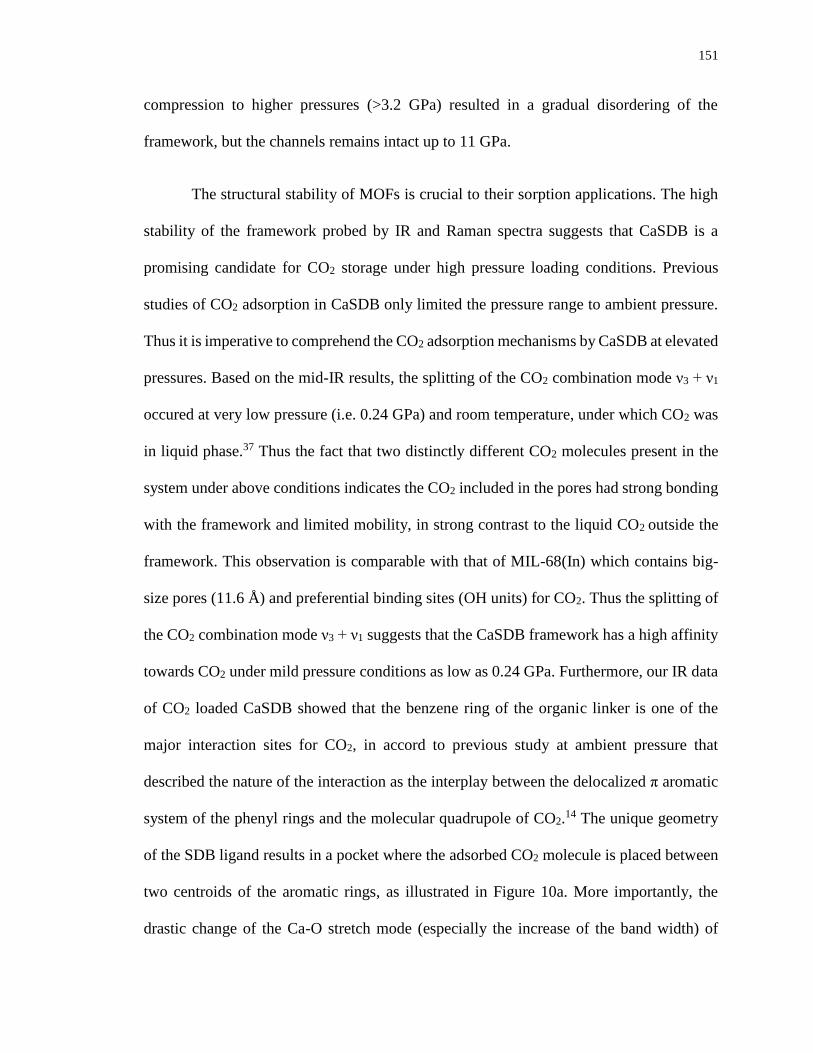
151
compression to higher pressures (>3.2 GPa) resulted in a gradual disordering of the
framework, but the channels remains intact up to 11 GPa.
The structural stability of MOFs is crucial to their sorption applications. The high
stability of the framework probed by IR and Raman spectra suggests that CaSDB is a
promising candidate for CO2 storage under high pressure loading conditions. Previous
studies of CO2 adsorption in CaSDB only limited the pressure range to ambient pressure.
Thus it is imperative to comprehend the CO2 adsorption mechanisms by CaSDB at elevated
pressures. Based on the mid-IR results, the splitting of the CO2 combination mode ν3 + ν1
occured at very low pressure (i.e. 0.24 GPa) and room temperature, under which CO2 was
in liquid phase.37 Thus the fact that two distinctly different CO2 molecules present in the
system under above conditions indicates the CO2 included in the pores had strong bonding
with the framework and limited mobility, in strong contrast to the liquid CO2 outside the
framework. This observation is comparable with that of MIL-68(In) which contains big-
size pores (11.6 Å) and preferential binding sites (OH units) for CO2. Thus the splitting of
the CO2 combination mode ν3 + ν1 suggests that the CaSDB framework has a high affinity
towards CO2 under mild pressure conditions as low as 0.24 GPa. Furthermore, our IR data
of CO2 loaded CaSDB showed that the benzene ring of the organic linker is one of the
major interaction sites for CO2, in accord to previous study at ambient pressure that
described the nature of the interaction as the interplay between the delocalized π aromatic
system of the phenyl rings and the molecular quadrupole of CO2.14 The unique geometry
of the SDB ligand results in a pocket where the adsorbed CO2 molecule is placed between
two centroids of the aromatic rings, as illustrated in Figure 10a. More importantly, the
drastic change of the Ca-O stretch mode (especially the increase of the band width) of
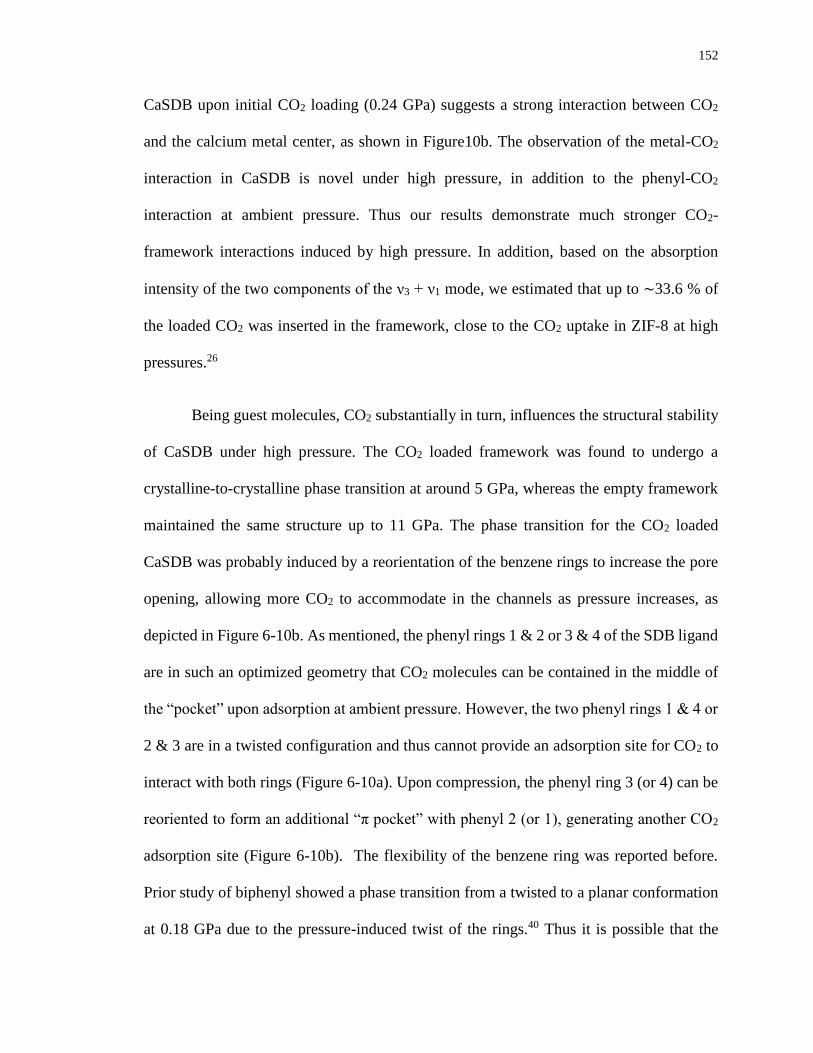
152
CaSDB upon initial CO2 loading (0.24 GPa) suggests a strong interaction between CO2
and the calcium metal center, as shown in Figure10b. The observation of the metal-CO2
interaction in CaSDB is novel under high pressure, in addition to the phenyl-CO2
interaction at ambient pressure. Thus our results demonstrate much stronger CO2-
framework interactions induced by high pressure. In addition, based on the absorption
intensity of the two components of the ν3 + ν1 mode, we estimated that up to ∼33.6 % of
the loaded CO2 was inserted in the framework, close to the CO2 uptake in ZIF-8 at high
pressures.26
Being guest molecules, CO2 substantially in turn, influences the structural stability
of CaSDB under high pressure. The CO2 loaded framework was found to undergo a
crystalline-to-crystalline phase transition at around 5 GPa, whereas the empty framework
maintained the same structure up to 11 GPa. The phase transition for the CO2 loaded
CaSDB was probably induced by a reorientation of the benzene rings to increase the pore
opening, allowing more CO2 to accommodate in the channels as pressure increases, as
depicted in Figure 6-10b. As mentioned, the phenyl rings 1 & 2 or 3 & 4 of the SDB ligand
are in such an optimized geometry that CO2 molecules can be contained in the middle of
the “pocket” upon adsorption at ambient pressure. However, the two phenyl rings 1 & 4 or
2 & 3 are in a twisted configuration and thus cannot provide an adsorption site for CO2 to
interact with both rings (Figure 6-10a). Upon compression, the phenyl ring 3 (or 4) can be
reoriented to form an additional “π pocket” with phenyl 2 (or 1), generating another CO2
adsorption site (Figure 6-10b). The flexibility of the benzene ring was reported before.
Prior study of biphenyl showed a phase transition from a twisted to a planar conformation
at 0.18 GPa due to the pressure-induced twist of the rings.40 Thus it is possible that the
153
strong CO2-framework interaction forced the reorientation of the benzene rings of SDB
ligand, which can be described as two phenyl rings connected by sulfonyl group, despite
the fact that the SDB ligand itself is quite resilient to compression. Besides, the guest
adsorption-driven phase transition of other MOFs were investigated many times before,
including the study on the specific CO2 adsorption-induced phase transformations of
MOFs.41-46 For example, MIL-53 (Cr) experienced so-called “breathing” transitions
between large pore and narrow pore phases during CO2 adsorption.47 In situ X-ray
diffraction measurements on the CO2 loaded CaSDB at high pressures would be helpful to
elucidate the exact interaction mechanism between CO2 and the framework, including the
phase transition and specific adsorption sites.
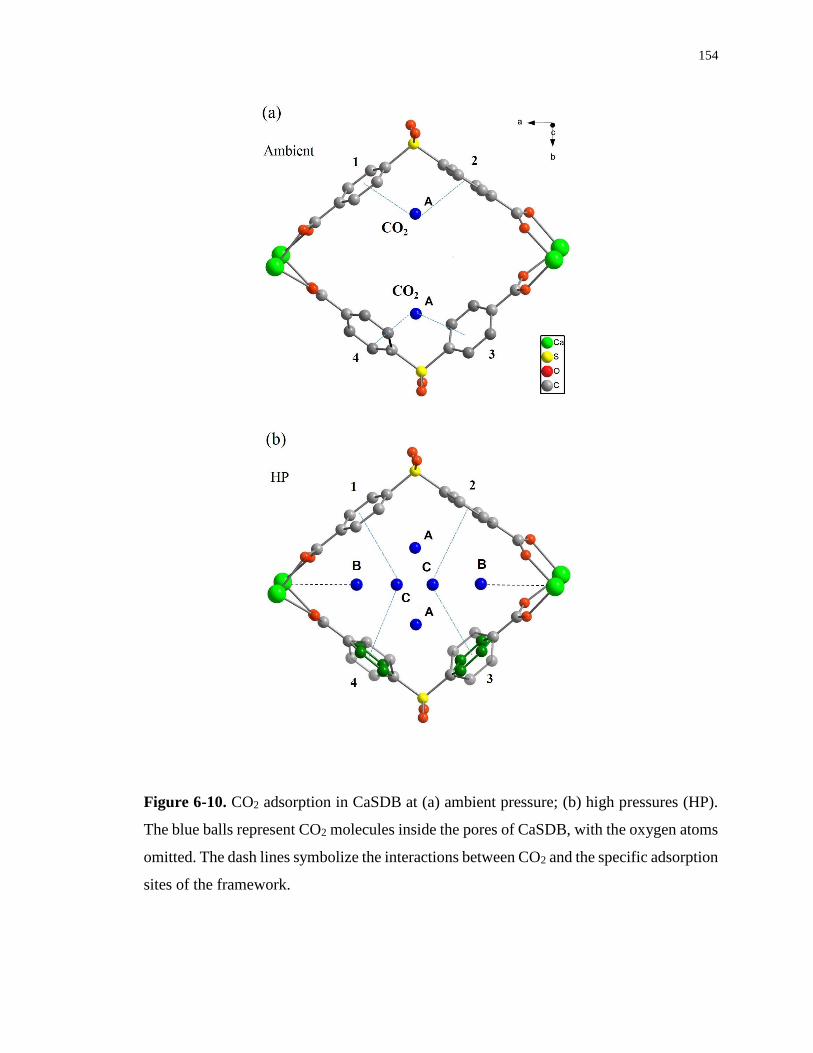
154
Figure 6-10. CO2 adsorption in CaSDB at (a) ambient pressure; (b) high pressures (HP).
The blue balls represent CO2 molecules inside the pores of CaSDB, with the oxygen atoms
omitted. The dash lines symbolize the interactions between CO2 and the specific adsorption
sites of the framework.
155
6.5 Conclusions
In summary, the stability of activated CaSDB framework and its performance for
CO2 storage under high pressures were investigated by in situ IR and Raman spectroscopic
measurements. The activated CaSDB framework which underwent a reversible
amorphization at 11 GPa exhibited high stability upon compression. We also demonstrated
a remarkable affinity between CO2 and the framework evidenced by the splitting of the ν3
+ ν1 mode of CO2 at very low pressure (0.24 GPa). Strong guest-host interactions are
apparent from the IR features of the framework in the Ca-O, C=C stretching region,
providing key information about the possible CO2 adsorption sites of CaSDB. In particular,
the CO2-metal interaction is novel and intriguing. As guest molecules, CO2 substantially
influenced the structure of CaSDB and triggered a reversible phase transition of the
framework at 5 GPa, involving the reorientation of the phenyl rings to allow
accommodation for more CO2 storage. Our results provide a fundamental understanding of
CO2 adsorption mechanism in CaSDB, which is promising for the application of green-
house storage.
6.6 Reference
(1) Zhou, H. C. K., S. Chemical Society Reviews 2014, 43, 5415.
(2) Zhou, H.-C.; Long, J. R.; Yaghi, O. M. Chemical Reviews 2012, 112, 673.
(3) Furukawa, H.; Cordova, K. E.; O’Keeffe, M.; Yaghi, O. M. Science 2013, 341, 1230444.
(4) He, Y.; Zhou, W.; Qian, G.; Chen, B. Chemical Society Reviews 2014, 43, 5657.
(5) Sumida, K.; Rogow, D. L.; Mason, J. A.; McDonald, T. M.; Bloch, E. D.; Herm, Z. R.;
Bae, T. H.; Long, J. R. Chemical Reviews 2012, 112, 724.
(6) Ma, S.; Zhou, H.-C. Chemical Communications 2010, 46, 44.
156
(7) Poloni, R.; Lee, K.; Berger, R. F.; Smit, B.; Neaton, J. B. The Journal of Physical Chemistry
Letters 2014, 5, 861.
(8) Liu, Y.; Wang, Z. U.; Zhou, H.-C. Greenhouse Gases: Science and Technology 2012, 2,
239.
(9) Li, J.-R.; Ma, Y.; McCarthy, M. C.; Sculley, J.; Yu, J.; Jeong, H.-K.; Balbuena, P. B.; Zhou,
H.-C. Coordination Chemistry Reviews 2011, 255, 1791.
(10) Liu, J.; Thallapally, P. K.; McGrail, B. P.; Brown, D. R.; Liu, J. Chemical Society Reviews
2012, 41, 2308.
(11) Lee, J. D. Concise Inorganic Chemistry; Chapman & Hall: New York, 1991, 4th ed.
(12) Yeh, C.-T.; Lin, W.-C.; Lo, S.-H.; Kao, C.-C.; Lin, C.-H.; Yang, C.-C. CrystEngComm
2012, 14, 1219.
(13) Banerjee, D.; Zhang, Z.; Plonka, A. M.; Li, J.; Parise, J. B. Crystal Growth & Design 2012,
12, 2162.
(14) Plonka, A. M.; Banerjee, D.; Woerner, W. R.; Zhang, Z.; Nijem, N.; Chabal, Y. J.; Li, J.;
Parise, J. B. Angewandte Chemie International Edition 2013, 52, 1692.
(15) Spencer, E. C.; Kiran, M. S. R. N.; Li, W.; Ramamurty, U.; Ross, N. L.; Cheetham, A. K.
Angewandte Chemie International Edition 2014, 53, 5583.
(16) Ortiz, A. U.; Boutin, A.; Gagnon, K. J.; Clearfield, A.; Coudert, F.-X. Journal of the
American Chemical Society 2014, 136, 11540.
(17) Gagnon, K. J.; Beavers, C. M.; Clearfield, A. Journal of the American Chemical Society
2013, 135, 1252.
(18) Hu, Y.; Kazemian, H.; Rohani, S.; Huang, Y.; Song, Y. Chemical Communications 2011,
47, 12694.
(19) Su, Z.; Miao, Y.-R.; Mao, S.-M.; Zhang, G.-H.; Dillon, S.; Miller, J. T.; Suslick, K. S.
Journal of the American Chemical Society 2015, 137, 1750.
(20) Serra-Crespo, P.; Dikhtiarenko, A.; Stavitski, E.; Juan-Alcaniz, J.; Kapteijn, F.; Coudert,
F.-X.; Gascon, J. CrystEngComm 2015, 17, 276.
(21) Chapman, K. W.; Halder, G. J.; Chupas, P. J. Journal of the American Chemical Society
2009, 131, 17546.
(22) Serra-Crespo, P.; Stavitski, E.; Kapteijn, F.; Gascon, J. RSC Advances 2012, 2, 5051.
(23) Zhou, M.; Wang, K.; Men, Z.; Sun, C.; Li, Z.; Liu, B.; Zou, G.; Zou, B. CrystEngComm
2014, 16, 4084.
(24) Ortiz, A. U.; Boutin, A.; Coudert, F.-X. Chemical Communications 2014, 50, 5867.
157
(25) Yot, P. G.; Ma, Q.; Haines, J.; Yang, Q.; Ghoufi, A.; Devic, T.; Serre, C.; Dmitriev, V.;
Ferey, G.; Zhong, C.; Maurin, G. Chemical Science 2012, 3, 1100.
(26) Hu, Y.; Liu, Z.; Xu, J.; Huang, Y.; Song, Y. Journal of the American Chemical Society
2013, 135, 9287.
(27) Graham, A. J.; Tan, J.-C.; Allan, D. R.; Moggach, S. A. Chemical Communications 2012,
48, 1535.
(28) Santoro, M.; Gorelli, F.; Haines, J.; Cambon, O.; Levelut, C.; Garbarino, G. Proceedings
of the National Academy of Sciences 2011, 108, 7689.
(29) Lee, Y.; Liu, D.; Seoung, D.; Liu, Z. X.; Kao, C. C.; Vogt, T. Journal of the American
Chemical Society 2011, 133, 1674.
(30) Graham, A. J.; Allan, D. R.; Muszkiewicz, A.; Morrison, C. A.; Moggach, S. A.
Angewandte Chemie International Edition 2011, 50, 11138.
(31) Chapman, K. W.; Sava, D. F.; Halder, G. J.; Chupas, P. J.; Nenoff, T. M. Journal of the
American Chemical Society 2011, 133, 18583.
(32) Moggach, S. A.; Bennett, T. D.; Cheetham, A. K. Angewandte Chemie International
Edition 2009, 48, 7087.
(33) Bennett, T. D.; Sotelo, J.; Tan, J.-C.; Moggach, S. A. CrystEngComm 2015, 17, 286.
(34) Mao, H. K.; Xu, J.; Bell, P. M. Journal of Geophysical Research: Solid Earth 1986, 91,
4673.
(35) Dong, Z. H.; Song, Y. Applied Physics Letters 2010, 96, 151903.
(36) Mao, H.; Xu, J.; Hu, Y.; Huang, Y.; Song, Y. Journal of Materials Chemistry A 2015. 3,
11976.
(37) Hanson, R. C.; Jones, L. H. The Journal of Chemical Physics 1981, 75, 1102.
(38) Rood, J. A.; Noll, B. C.; Henderson, K. W. Inorganic Chemistry 2006, 45, 5521.
(39) Phan, A.; Doonan, C. J.; Uribe-Romo, F. J.; Knobler, C. B.; O'Keeffe, M.; Yaghi, O. M.
Accounts of Chemical Research 2010, 43, 58.
(40) Zhuravlev, K. K.; McCluskey, M. D. The Journal of Chemical Physics 2002, 117, 3748.
(41) Li, Q.; Li, S.; Wang, K.; Liu, J.; Yang, K.; Liu, B.; Zou, G.; Zou, B. The Journal of Physical
Chemistry C 2014, 118, 5848.
(42) Graham, A. J.; Banu, A.-M.; Duren, T.; Greenaway, A.; McKellar, S. C.; Mowat, J. P. S.;
Ward, K.; Wright, P. A.; Moggach, S. A. Journal of the American Chemical Society 2014,
136, 8606.
(43) Lapidus, S. H.; Halder, G. J.; Chupas, P. J.; Chapman, K. W. Journal of the American
Chemical Society 2013, 135, 7621.
158
(44) Fairen-Jimenez, D.; Moggach, S. A.; Wharmby, M. T.; Wright, P. A.; Parsons, S.; Düren,
T. Journal of the American Chemical Society 2011, 133, 8900.
(45) Cheng, Y.; Kajiro, H.; Noguchi, H.; Kondo, A.; Ohba, T.; Hattori, Y.; Kaneko, K.; Kanoh,
H. Langmuir 2011, 27, 6905.
(46) Kitaura, R.; Seki, K.; Akiyama, G.; Kitagawa, S. Angewandte Chemie International
Edition 2003, 42, 428.
(47) Neimark, A. V.; Coudert, F.-X.; Triguero, C.; Boutin, A.; Fuchs, A. H.; Beurroies, I.;
Denoyel, R. Langmuir 2011, 27, 4734.
159
Chapter 7
7 Summary and Future Work
7.1 Summary
In this thesis, high pressure in situ IR and Raman spectroscopy were used to
examine the stability as well as the CO2 adsorption performance of a series of MOFs with
different topology and structures. All the MOFs exhibited extraordinary stability at high
pressures, retaining chemical connectivity and porosity for CO2 storage. Additional CO2
adsorption sites have been observed in these MOFs under high pressure, suggesting
enhanced guest-host interactions between CO2 and the frameworks. The porosity,
flexibility of the framework and the existence of preferential CO2 adsorption sites play an
important role in the performance of the frameworks for CO2 storage.
In Chapters 2 and 3, it was shown that the ZIF-8 framework sustained extreme
compression up to 39 GPa without permanent breakdown; and experienced fully reversible
structural modifications upon compression from 1.6 GPa. Upon CO2 loading, strong
interactions between CO2 and the framework were apparent from the IR features of the
framework in the C=C stretching region, providing key information about the possible
adsorption site. As guest molecules, CO2 substantially enhanced the structural stability of
the ZIF-8 framework.
In Chapter 4, the MIL-68 (In) framework exhibited high stability under
compression up to 9 GPa, while the pressure-induced structural modifications were found
to be completely reversible for the as-made framework but irreversible for the activated
framework. The difference in the reversibility of framework is attributed to the solvent
160
DMF molecules contained in the channels. More interestingly, the normally inaccessible
triangular pores became available for CO2 at elevated pressures (e.g., > 1.5 GPa). The
unique adsorption behavior of CO2 in the framework was associated with the OH units that
were the primary binding sites through hydrogen bonding. In addition, the pressure-
enhanced CO2 storage behavior and the guest-host interaction mechanism were explored
with the aid of Monte Carlo molecular mechanics simulations.
Chapter 5 described a distinctly different CO2 adsorption behavior in α-
Mg3(HCOO)6 versus those in ZIF-8 or MIL-68 (In). At high pressures, the CO2 molecules
were highly confined inside the pores due to strong dipole-dipole interactions with the
formate ligand of the framework. Moreover, the CO2 loaded α-Mg3(HCOO)6 framework
underwent a reversible crystalline-to-amorphous phase transformation at around 4.5 GPa,
as evidenced by the Raman measurements.
Chapter 6 revealed a remarkable affinity between CO2 and the CaSDB framework,
as multiple CO2 adsorption sites in the framework were observed under high pressure in
addition to the single interaction site at ambient pressure. In particular, the far-IR
measurements suggested a CO2-metal interaction in CaSDB induced by pressure. As guest
molecules, CO2 substantially influenced the structure of CaSDB and triggered a reversible
crystalline-to-crystalline phase transition of the framework at 5 GPa, involving the
reorientation of the phenyl rings to allow accommodation for more CO2 molecules.
161
7.2 Suggestions for future work
We now have a preliminary understanding of pressure effects on MOFs, their
stabilities and CO2 storage performance. Further experiments should help answer some
unsolved questions from this work.
(1) In situ high pressure XRD would be a complimentary method to probe possible
phase transitions of MOFs under high pressure. If single-crystal MOFs could be obtained,
the single crystal XRD can not only monitor the structural changes of the frameworks, but
also pinpoint the exact CO2 adsorption sites in the frameworks at high pressures.
(2) More computational simulations can be performed to investigate the CO2
storage in α-Mg3(HCOO)6 and CaSDB at high pressures to compare with the experimental
work.
(3) All the current work was done under room temperature, at which CO2 solidifies
above 0.6 GPa. In the future, the MOFs loaded with CO2 can be heated to higher
temperatures to facilitate the diffusion of CO2 at pressures higher than 0.6 GPa. As a result,
even more CO2 could be forced into the frameworks by pressure. A special heating device
would be needed for the in situ high temperature measurements.
162
Appendices: Copyright Permission

163
164
Curriculum Vitae
Name: Yue Hu
Post-secondary The University of Western Ontario
Education and London, Ontario, Canada
Degrees: 2010-2015 Ph.D. candidate (Chemistry)
Anhui University
Hefei, Anhui, China
2005-2009 B.Sc. (Materials Chemistry)
Honours and International Graduate Student Scholarship (UWO)
Awards: 2010-2015
Western Graduate Research Scholarship (UWO)
2010-2015
Excellent Student Scholarship (Anhui University)
2006-2009
Related Work Teaching Assistant/Research Assistant
Experience The University of Western Ontario
2010-2015
Publications:
1. Hu Y., Lin B., He P., Li Y., Huang Y., Song Y., The structural stability of and
enhanced CO2 storage in MOF MIL-68 (In) under high pressures probed by FTIR
spectroscopy. Chemistry - A European Journal, 2015, submitted.
2. Mao H., Xu J., Hu Y., Huang Y., Song Y., The effect of high external pressure on
structure and stability of MOF α-Mg3(HCOO)6 probed by in situ Raman and FTIR
spectroscopy. Journal of Materials Chemistry A, 2015, 3, 11976.
3. Hu Y., Liu Z., Xu J., Huang Y., Song Y., Evidence of pressure enhanced CO2
storage in ZIF‑8 probed by FTIR spectroscopy. Journal of the American Chemical
Society, 2013, 135, 9287.
4. Hu Y., Kazemian H., Rohani S., Huang Y., Song Y., In situ high pressure study of
ZIF-8 by FTIR spectroscopy. Chemical Communications, 2011, 47, 12694.
165
Presentations:
1. High-pressure study of CaSDB and its performance for CO2 storage by vibrational
spectroscopy; poster presentation, Ottawa, CSC 2015.
2. The stability and enhanced CO2 storage of MIL-68 (In) under high pressure; oral
presentation, Niagara Falls, NANO-7, 2014. / poster presentation, Quebec city,
CSC 2013.
3. CO2 storage of ZIF-8 at high pressures; oral presentation, Calgary, CSC 2012.
4. In situ high-pressure study of ZIF-8 by FTIR; oral presentation, Montreal, CSC
2011.