in-service evaluation of major urban areterials with ... director research engineer principal...
TRANSCRIPT
June 2013Mark E. HallenbeckPeter M. Briglia Jr.Zachary N. HowardAnna St. Martin
WA-RD 636.3
Office of Research & Library Services
WSDOT Research Report
In-Service Evaluation of Major Urban Arterials with Landscaped Medians–Phase III


Final Research Report Agreement T4118, Task 39
Landscape Phase 3
IN-SERVICE EVALUATION OF MAJOR URBAN ARTERIALS WITH LANDSCAPED MEDIANS—
PHASE III
by
Mark E. Hallenbeck Peter M. Briglia Jr. TRAC Director Research Engineer Principal Zachary N. Howard Anna St. Martin Graduate Research Assistant Graduate Research Assistant
Washington State Transportation Center (TRAC) University of Washington, Box 354802
University District Building 1107 NE 45th Street, Suite 535
Seattle, Washington 98105-4631
Washington State Department of Transportation Technical Monitor Barbara Briggs
Area Operations Engineer Traffic Operations Office, Northwest Region
Prepared for
The State of Washington Department of Transportation
Lynn Peterson, Secretary
June 2013


TECHNICAL REPORT STANDARD TITLE PAGE
1. REPORT NO. 2. GOVERNMENT ACCESSION NO. 3. RECIPIENT'S CATALOG NO.
WA-RD 636.3 4. TITLE AND SUBTITLE 5. REPORT DATE
IN-SERVICE EVALUATION OF MAJOR URBAN June 2013 ARTERIALS WITH LANDSCAPED MEDIANS— PHASE III 6. PERFORMING ORGANIZATION CODE 7. AUTHOR(S) 8. PERFORMING ORGANIZATION REPORT NO.
Mark E. Hallenbeck, Peter M. Briglia Jr., Zachary N. Howard, Anna St. Martin
9. PERFORMING ORGANIZATION NAME AND ADDRESS 10. WORK UNIT NO.
Washington State Transportation Center (TRAC) University of Washington, Box 354802 11. CONTRACT OR GRANT NO.
University District Building; 1107 NE 45th Street, Suite 535 Agreement T4118 Task 39 Seattle, Washington 98105-4631 12. SPONSORING AGENCY NAME AND ADDRESS 13. TYPE OF REPORT AND PERIOD COVERED
Research Office Washington State Department of Transportation Transportation Building, MS 47372
Research Report
Olympia, Washington 98504-7372 14. SPONSORING AGENCY CODE
Project Manager: Rhonda Brooks, 360-705-7945 15. SUPPLEMENTARY NOTES
This study was conducted in cooperation with the U.S. Department of Transportation, Federal Highway Administration. 16. ABSTRACT:
Several cities have implemented redevelopment plans that include the re-design of major regional arterials in order to raise the quality of life of those living, working, and shopping along, or near the arterial. Many of these redevelopment efforts include landscaped medians with trees placed close to the roadway including in the median. WSDOT’s clear zone width criterion may not always be met when trees are placed within medians. To address this potential conflict, an in-service evaluation process was adopted to study collision, environmental, operational, and maintenance experiences in the field.
This report updates earlier work published in 2007 and 2009. It examines before and after periods for all 13 roadway sections identified by WSDOT for review. Some of these 13 sections contain trees in medians with no protection, others are sections that contain raised medians but no trees, and others are control sections.
The study finds that the presence of small trees in the median did not significantly increase crash rates, crash severity, or injury crash rates. Crash rates decreased at statistically significant levels for both types of median treatment locations. No significant difference was found when comparing median treatments with and without trees. At test sites, crash rates remain stable six years after the treatments were completed, indicating that the safety benefits first observed remain in place over time. It appears that adding small trees to landscaped medians does not have a detrimental effect on safety. Installation of medians and access control as part of a more general increase in access control generally result in a decrease in midblock crashes, but an increase in crashes occurring at intersections where turning movements are allowed in large part because turns are concentrated at those locations. These increases are a fraction of the midblock gains, resulting in improved safety overall.
17. KEY WORDS 18. DISTRIBUTION STATEMENT
Trees, highway safety, aesthetic design, Context Sensitive Design, urban design, accident rates, injury severity
No restrictions. This document is available to the public through the National Technical Information Service, Springfield, VA 22616
19. SECURITY CLASSIF. (of this report) 20. SECURITY CLASSIF. (of this page) 21. NO. OF PAGES 22. PRICE
None None

DISCLAIMER
The contents of this report reflect the views of the authors, who are responsible
for the facts and the accuracy of the data presented herein. The contents do not
necessarily reflect the official views or policies of the Washington State Department of
Transportation or Federal Highway Administration. This report does not constitute a
standard, specification, or regulation.


iii
TABLE OF CONTENTS
I INTRODUCTION ................................................................................................ 1 Background ................................................................................................................ 2 Project Description..................................................................................................... 3 Crash Data .................................................................................................................. 7 Traffic Characteristics ................................................................................................ 7 II ANALYSIS METHODOLOGY ......................................................................... 9 Crash Rates ................................................................................................................ 9 III FINDINGS .......................................................................................................... 10 Crash Rates ................................................................................................................ 12 Crashes Involving Trees ............................................................................................ 15 Crashes Involving Fixed Objects ............................................................................... 15 Fatal and Injury Crashes ............................................................................................ 18 Crashes Involving Bicycles and Pedestrians.............................................................. 23 Vehicle Speeds ........................................................................................................... 25 IV DESCRIPTION OF TEST SECTIONS ........................................................... 27 Sections With Unprotected Median Trees ................................................................. 27 Federal Way Phase 1 ......................................................................................... 27 Federal Way Phase 2 ......................................................................................... 27 SeaTac Phases 1 Through 4 .............................................................................. 28 Shoreline Phase 1 .............................................................................................. 30 Sections With Median Trees Behind Low Protective Barriers .................................. 30 Des Moines ....................................................................................................... 30 Mukilteo ............................................................................................................ 31 Kenmore ............................................................................................................ 32 Control Sections ......................................................................................................... 32 Federal Way Phase 4 ......................................................................................... 32 Shoreline Phase 2 .............................................................................................. 32 Kent ................................................................................................................... 32 VI LOCAL AGENCY INPUT ............................................................................... 34 Local Agency Perspective .......................................................................................... 34 Tree Types, Maintenance, and Design Issues ............................................................ 34 Federal Way ...................................................................................................... 34 Mukilteo ............................................................................................................ 35 SeaTac ............................................................................................................... 35 Shoreline ........................................................................................................... 35 VI CONCLUSIONS AND RECOMMENDATIONS .......................................... 37 VII REFERENCES ................................................................................................. 38 APPENDIX A: ACCIDENT RATE CALCULATION ........................................ A-1

iv
TABLES
Table Page
1 Traffic and Crash Characteristics Before Project Construction .................. 8 2 Traffic and Crash Characteristics Following Project Construction ............ 11 3 Before and After Crash Rates ..................................................................... 13 4 Crash Rate Trends Over Longer Time Periods ........................................... 14 5 Crashes on SeaTac Phase 1 and 2 Sections with Median Trees, 2001 – 2010 14 6 Tree Involved Crashes and Crash Rates ..................................................... 16 7 Fixed Object Crashes and Crash Rates ....................................................... 17 8 Before and After Fatal Crash Rates ............................................................ 19 9 Before and After Injury Crash Rates .......................................................... 20 10 Bicycle and Pedestrian Crashes and Crash Rates ....................................... 24 11 Available Vehicle Speed Data (85th Percentile Speeds – mph) .................. 26
FIGURES
Figure Page
1 Example of a Two-Way Left Turn Lane (TWLTL) with Limited Access Control .......................................................................................... 5
2 Example of a C-Curb Separating Directions of Traffic .............................. 5 3 Typical Cross-Section in Federal Way Phase 1 and Phase 2 ...................... 28 4 Map Showing the Locations of SeaTac Streetscape Project Phases ........... 29 5 Des Moines Median Treatment: Trees Behind a Low Profile Barrier ........ 31
1
I. INTRODUCTION
In the 1990s, a number of cities in the Puget Sound region expressed interest in
changing the roadway characteristics of major arterials operating under their control. The
desired changes added access control to roadways that often had minimal access control
before the project. The street improvements generally included the addition of medians,
protected turn pockets, and sidewalks in areas that did not have those geometric features.
As part of these streetscape improvements, several jurisdictions also included the addition
of street trees and other landscape improvements. These changes were intended to
improve the aesthetics of the city, calm traffic, and encourage safe pedestrian
movements. The desired outcomes included economic growth in neighborhoods along
those arterials and, with that growth, more and safer pedestrian travel along and across
these corridors.
Some of the proposed improvements, such as placing small trees within the
roadway right-of-way, are not common engineering practice within the state. As a result,
the cities that wanted to make these changes entered into an agreement with the
Washington State Department of Transportation (WSDOT) to study their effects to
ensure that the benefits expected did, in fact, occur and that the landscaping caused no
significant detrimental effects.
An initial study of the effects of placing trees in medians was conducted on
several roadway sections on SR 99 in the city of SeaTac. Three years of data were
collected before the street improvements took place, and these data were compared with
three years of data collected after the improvements had been completed. These results
were published in February 2007 in the WSDOT research report “In-Service Evaluation
of Major Urban Arterials with Landscaped Medians—Conditions as of 2004,” WA-RD
636.1. A second phase of the study continued the evaluation by examining seven
additional sites, two of which were control sites where medians were constructed but
where trees were not planted. The results of that phase of the project were reported in
2009 in the report “In-Service Evaluation of Major Urban Arterials with Landscaped
Medians—Phase 2,” WA-RD 636.2. This report completes the safety evaluation by
comparing crash rates at an additional four sites, as well as comparing the ongoing crash
2
rates at the previously reported locations. Two of the four new sites have trees, while the
other two are additional control sections.
BACKGROUND
Transportation agencies are attempting to implement roadway designs that are
sensitive to local landforms, culture, and desires. These “context sensitive
designs/context sensitive solutions” (CSD/CSS) may entail selecting and implementing
design solutions for local areas that would not be adopted on the basis of regional design
standards or procedures currently applied by federal or state transportation agencies.
While current highway design standards were adopted in an attempt to enhance
the safety of roadway users, those standards can reflect a one-dimensional view of
roadway use, rather than a more holistic view of the interaction between drivers and their
vehicles within a modern urban landscape. As a result of viewing roads more holistically,
cities have recently been pushing to install landscaping along urban facilities that have
speed limits of 35 to 45 mph as a way to improve the aesthetic characteristics of their
arterials. To maintain safety, the cities have selected specific trees and design treatments
to allow those landscaped medians to maintain or enhance the safety of both motor
vehicles and the pedestrians and bikes using the arterial.
Unfortunately, strict application of existing design standards may preclude the
installation of these desired landscaped treatments. Prominent among these standards is
one that specifies a “clear zone.” The design clear zone defines the width of the roadside
that should be clear of fixed objects. Several city redevelopment proposals for SR 99 and
other state routes included medians with trees placed close to the roadway. However,
placing trees within curbed medians may not meet WSDOT’s clear zone width criterion.
Beyond enhancing aesthetics, the justification for deviating from the design clear zone
standard is the prediction that the locations of the proposed deviations will not
experience the same consequences as those in which clear zone analysis was conducted.
To evaluate the effects of deviating from these design standards, WSDOT
proposed an in-service evaluation process that would assess real-world experience that
were not well represented in previous assessments of design clear zone. In part, WSDOT
initiated the In-Service Evaluation of Landscaped Medians Agreement with cities along
3
SR 99 and other roadways to study the overall effects of various “context sensitive”
designs. The process allowed these types of projects to be constructed, with the explicit
agreement that the cities would cooperate with data collection efforts, as well as
mitigation strategies if they were deemed necessary.
This report continues the previous evaluation of landscaped median treatments by
describing an evaluation of accident occurrences on 13 roadway sections on SR 99, SR
522, and SR 525. The evaluation compared crash rates and crash types on treatment
sections, on control sections where no medians were installed, and on sections where
trees were placed in medians but behind barriers. Various crash types that had the
potential to be affected by the median treatments were examined.
PROJECT DESCRIPTION
Arterials such as SR 99 north and south of Seattle, SR 525 in Mukilteo, and
SR 522 have characteristics that are considered by many cities to be undesirable. High
traffic volumes and high speeds are not viewed as positive traits as land uses along those
routes intensify. These changes in development intensity have led numerous cities to
create comprehensive plans that include redevelopment of the highway facilities to
include more resident-, pedestrian-, and bicycle-friendly treatments. However, as
alternative, parallel routes to roads such as Interstate 5, roads like SR 99 retain a
significant regional mobility function while they must simultaneously provide access to
local businesses, services, and residents. As the major arterial providing east/west travel
around the north end of Lake Washington, SR 522 serves a similar combination of local
access and regional mobility needs. SR 525 is a regionally important route because of the
access that it provides to the Washington State Ferry dock in Mukilteo.
The project evaluated sections along SR 99 that were within the cities of Des
Moines, Federal Way, Kent, SeaTac, and Shoreline. Also included in this study were a
section of SR 522 through Kenmore and a section of SR 525 through Mukilteo. State
Routes 99, 522, and 525 are classified as urban arterials. Each route has high traffic
volumes and high speeds, and each experiences crash rates involving vehicles and
pedestrians that are above the statewide average for facilities of this classification. High
crash rates have been a significant motivation for landscape treatment projects. Although

4
these corridors have historically not had pedestrian-friendly facilities or amenities, there
is a significant level of pedestrian traffic along many sections. Much of the pedestrian
traffic is associated with bus routes through the corridors. Many pedestrians cross SR 99
at unmarked mid-block locations, as opposed to walking to the nearest signalized
intersection. There is also a significant percentage of truck traffic, particularly on SR 99
and SR 525. In addition, these streetscapes have also been considered unattractive, which
is detrimental to the redevelopment plans the cities have for land adjacent to, or nearby,
these regional roadways.
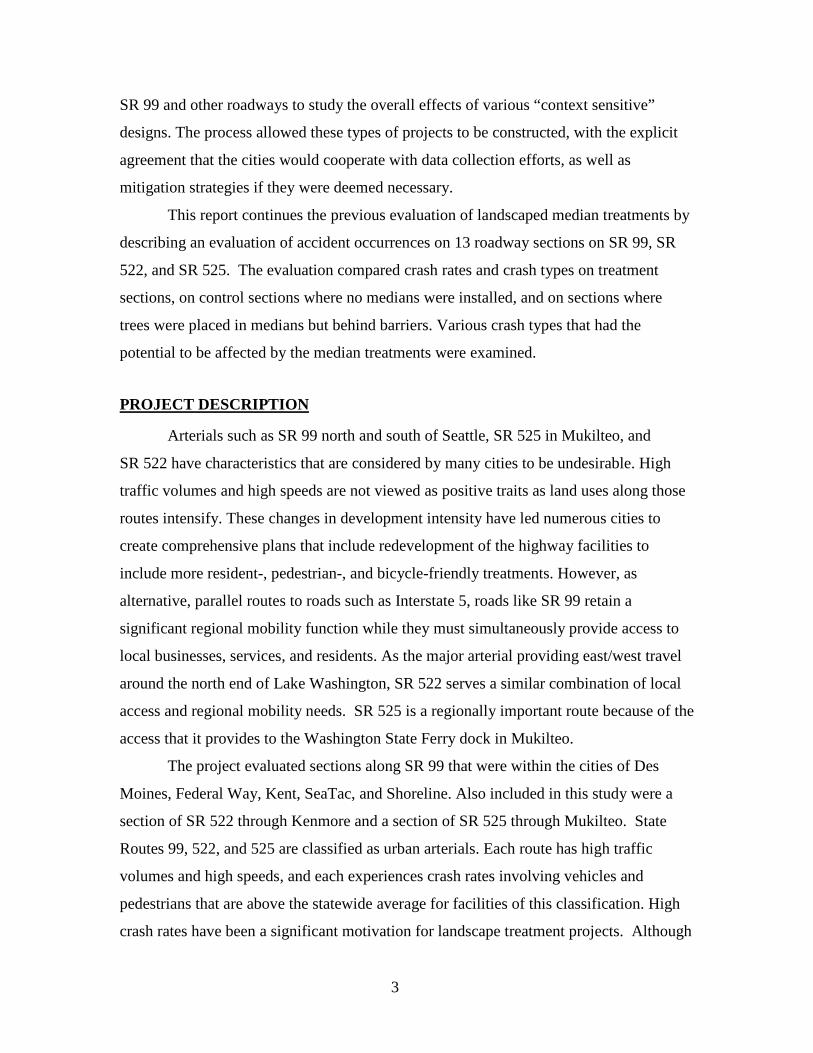
The typical historic cross-section of SR 99 within the metropolitan region
consisted of five to seven lanes, including a center, two-way left turn lane (TWLTL). In
general, the paved shoulders were wide, with sidewalks present at only a few locations.
Figure 1 shows an example of a typical roadway section with TWLTL and minimal
access control.
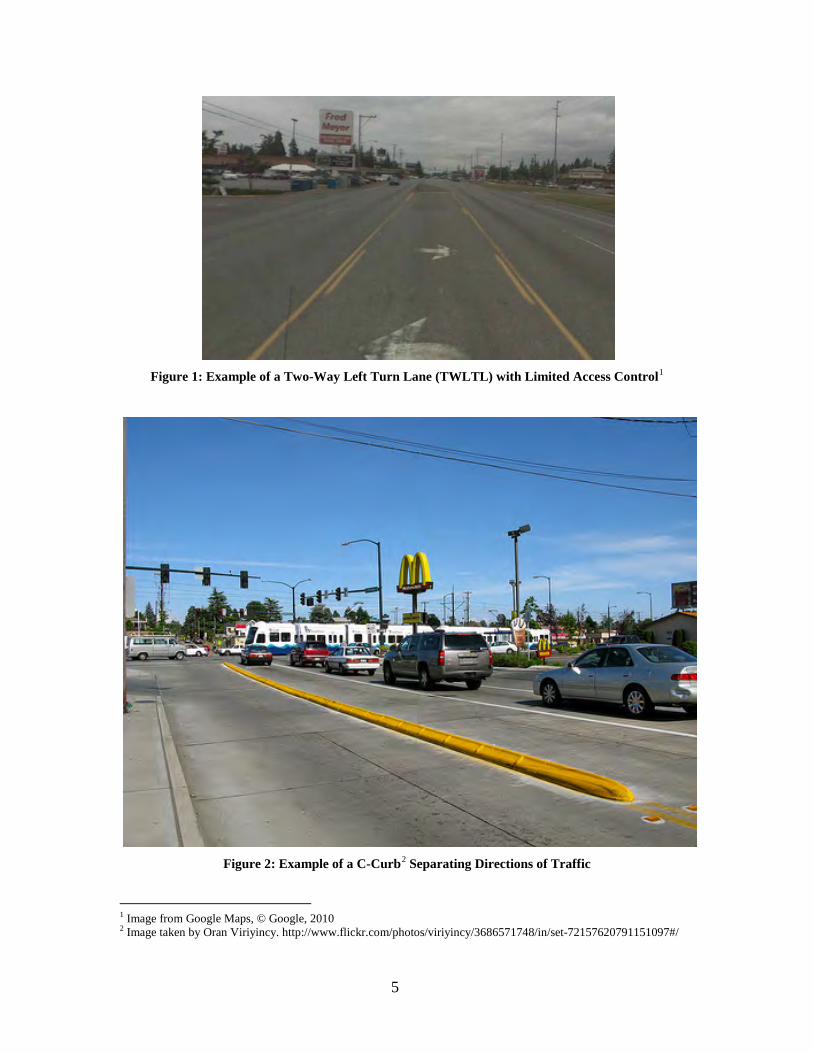
Access to commercial and private properties was minimally controlled. At a few
locations there was no TWLTL or a low, asphalt-covered median and C-curb (see Figure
2) separating the two directions of traffic. At many intersections, dedicated right and left
turn lanes existed. In general, the aspect was of a wide, uncontrolled asphalt streetscape
with cars moving in every direction. There was almost no provision for the comfort and
safety, of pedestrians, though many pedestrians travel through and across the SR 99
corridor. The land use was, and remains, primarily commercial strip development.
The typical SR 522 section through Kenmore was similar to that of SR 99 except
that it also contained a right side business-access-and-transit (BAT) lane in both
directions for most of the study section. Another difference between the Kenmore
section of SR 522 and the SR 99 sections was that development in Kenmore is almost
exclusively on the north side of the roadway, with a major, regional, grade separated bike
trail located on the south side of the roadway.
The typical SR 525 section was a two-lane, undivided highway with relatively
uncontrolled access and variable width shoulders. The sections of commercial
development are more spread out than along SR 99, with some sections having a more
rural or residential character.
5
Figure 1: Example of a Two-Way Left Turn Lane (TWLTL) with Limited Access Control1
Figure 2: Example of a C-Curb2 Separating Directions of Traffic
1 Image from Google Maps, © Google, 2010 2 Image taken by Oran Viriyincy. http://www.flickr.com/photos/viriyincy/3686571748/in/set-72157620791151097#/

6
These streetscapes were incompatible with city and community comprehensive
plans, and given the need for a variety of improvements, cities chose to initiate
boulevard-type streetscape redevelopment plans. The choice of the boulevard style street
design was an attempt to smooth traffic flow, reduce vehicle speeds, create an
environment that was attractive to pedestrians, safely accommodate bicycles, and foster a
sense of community in the neighborhoods bordering these roads.
As part of the streetscape improvements, changes to the roadway environment
occurred in three general areas: roadway, roadside, and pedestrian facilities.
Improvements to the roadway included converting two-way left turn lanes into
landscaped medians with left turn/U-turn pockets, widening the roadway, adding BAT
lanes through some project sections, installing street lighting, and making signal
improvements. Improvements to the roadside environment included consolidating and
defining driveways/access points, putting utilities underground, and upgrading storm
water collection and detention. To enhance pedestrian facilities, cities installed sidewalks
and pedestrian features such as lighting, improved crossing points, improved or added
new transit stops, and added aesthetic treatments such as landscaping and street trees.
The key element of this study was the nature of the landscaping changes. At
several locations cities wished to place small trees (“street trees”) in the roadway right-
of-way. While there is no standard definition of a “street tree,” they are commonly
defined as trees placed within the general roadway environment to provide a visually
pleasing aesthetic but without creating a traffic hazard. They are generally selected from
tree species that are hardy in the local environment, require minimal amounts of care, and
do not grow to a large diameters in order to limit the hazard they pose to motorists in
crashes.
In some cases trees were planted in “unprotected” locations, while in other
locations, the median in which the trees were placed contained a low wall that separated
the street trees from traffic. This latter design is specifically intended to limit the
potential involvement of street trees in vehicle crashes. This study compared the crash
histories of the sections of road that had street trees without protection to those sections
with trees located behind protection, and to those from a set of control sections where no
trees were planted within the right-of-way.

7
CRASH DATA
For this study update, crash records were collected from the three years before
project construction and from at least three years after construction had been completed.
For the test sections where construction was completed before the end of 2004, three
additional years of data are reported. These additional years of data allowed the
comparison of not only before and after conditions, but also evaluation of whether the
after conditions remained stable over time.
TRAFFIC CHARACTERISTICS
Traffic volume data were obtained from the WSDOT Annual Traffic Reports
(WSDOT 2001 through 2010). Speed studies were conducted in both directions of travel
on five of the study sections in 2008. Speed data were collected at similar locations in
2011, as well as at two additional locations on SR 99. The results from these studies are
discussed later in this report. (See the “Vehicle Speeds section of the “Findings”).
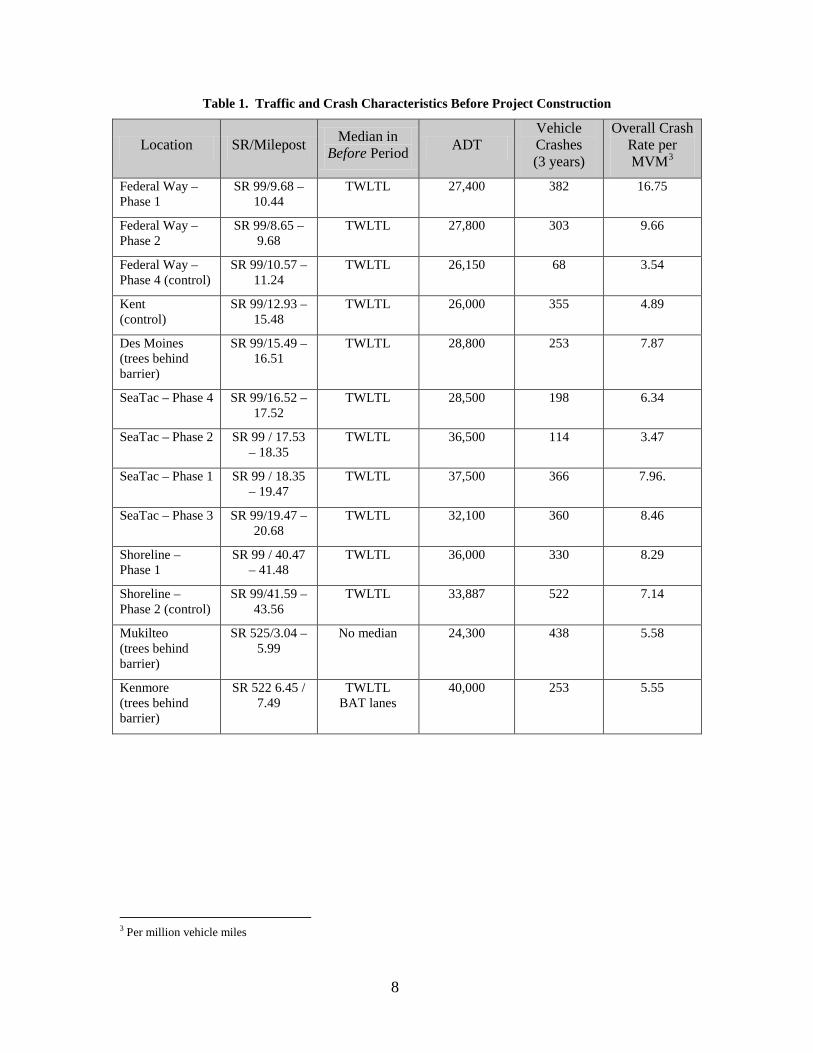
The roadway locations studied in this project are listed in Table 1. The table
describes the general crash and traffic characteristics for the before period of data
collection, as well as each segment’s milepost limits. “Phases” within individual projects
refer to separate construction projects that were built (typically) end-to-end with other
phases within the same city or neighboring cities. Each phase was constructed
independently but included many of the same general features.
Street trees without barrier protection were planted along sections of SR 99 in the
City of SeaTac, Federal Way (phases 1 and 2) and Shoreline (Phase1 only). Trees were
placed behind low barriers in Des Moines on SR 99, in Kenmore on SR 522, and in
Mukilteo on SR 525. No trees were planted in the medians on SR 99 in Kent, in
Shoreline Phase 2, or in Federal Way in the Phase 4 section.
8
Table 1. Traffic and Crash Characteristics Before Project Construction
Location SR/Milepost Median in Before Period ADT
Vehicle Crashes (3 years)
Overall Crash Rate per MVM3
Federal Way –Phase 1
SR 99/9.68 – 10.44
TWLTL 27,400 382 16.75
Federal Way – Phase 2
SR 99/8.65 – 9.68
TWLTL 27,800 303 9.66
Federal Way – Phase 4 (control)
SR 99/10.57 – 11.24
TWLTL 26,150 68 3.54
Kent (control)
SR 99/12.93 – 15.48
TWLTL 26,000 355 4.89
Des Moines (trees behind barrier)
SR 99/15.49 – 16.51
TWLTL 28,800 253 7.87
SeaTac – Phase 4 SR 99/16.52 – 17.52
TWLTL 28,500 198 6.34
SeaTac – Phase 2 SR 99 / 17.53 – 18.35
TWLTL 36,500 114 3.47
SeaTac – Phase 1 SR 99 / 18.35 – 19.47
TWLTL 37,500 366 7.96.
SeaTac – Phase 3 SR 99/19.47 – 20.68
TWLTL 32,100 360 8.46
Shoreline – Phase 1
SR 99 / 40.47 – 41.48
TWLTL 36,000 330 8.29
Shoreline – Phase 2 (control)
SR 99/41.59 – 43.56
TWLTL 33,887 522 7.14
Mukilteo (trees behind barrier)
SR 525/3.04 – 5.99
No median 24,300 438 5.58
Kenmore (trees behind barrier)
SR 522 6.45 / 7.49
TWLTL BAT lanes
40,000 253 5.55
3 Per million vehicle miles
9
II. ANALYSIS METHODOLOGY
CRASH RATES
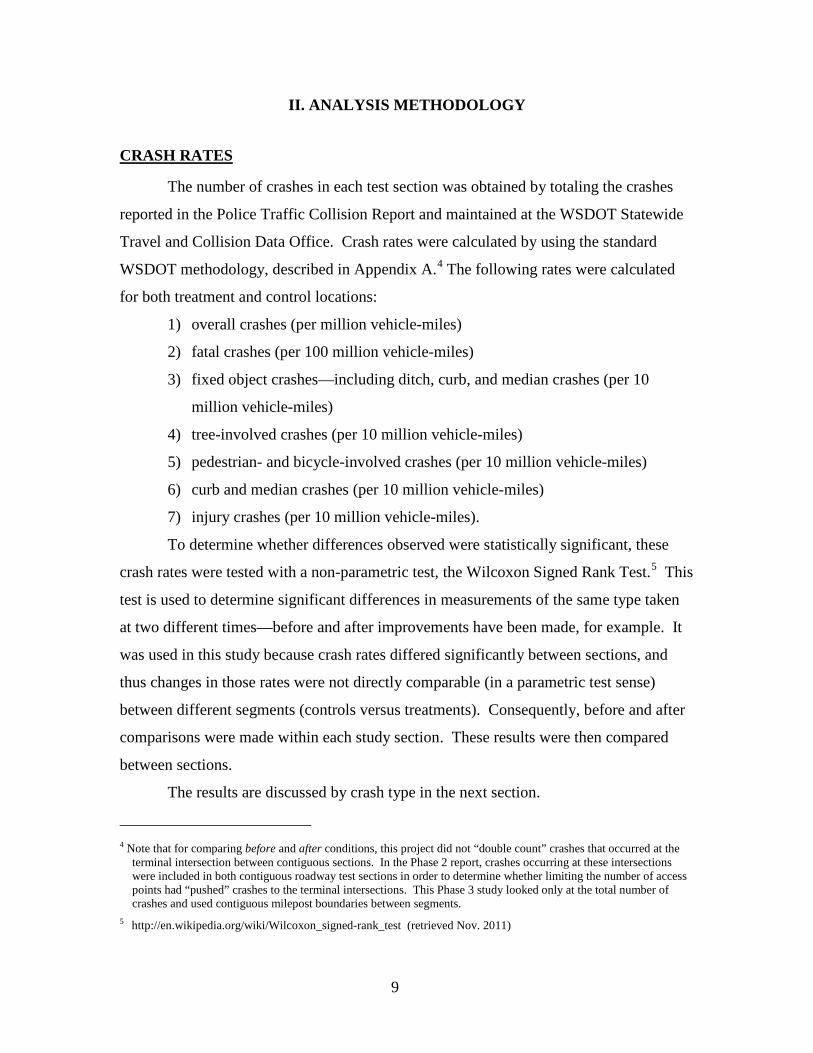
The number of crashes in each test section was obtained by totaling the crashes
reported in the Police Traffic Collision Report and maintained at the WSDOT Statewide
Travel and Collision Data Office. Crash rates were calculated by using the standard
WSDOT methodology, described in Appendix A.4 The following rates were calculated
for both treatment and control locations:
1) overall crashes (per million vehicle-miles)
2) fatal crashes (per 100 million vehicle-miles)
3) fixed object crashes—including ditch, curb, and median crashes (per 10
million vehicle-miles)
4) tree-involved crashes (per 10 million vehicle-miles)
5) pedestrian- and bicycle-involved crashes (per 10 million vehicle-miles)
6) curb and median crashes (per 10 million vehicle-miles)
7) injury crashes (per 10 million vehicle-miles).
To determine whether differences observed were statistically significant, these
crash rates were tested with a non-parametric test, the Wilcoxon Signed Rank Test.5 This
test is used to determine significant differences in measurements of the same type taken
at two different times—before and after improvements have been made, for example. It
was used in this study because crash rates differed significantly between sections, and
thus changes in those rates were not directly comparable (in a parametric test sense)
between different segments (controls versus treatments). Consequently, before and after
comparisons were made within each study section. These results were then compared
between sections.
The results are discussed by crash type in the next section.
4 Note that for comparing before and after conditions, this project did not “double count” crashes that occurred at the
terminal intersection between contiguous sections. In the Phase 2 report, crashes occurring at these intersections were included in both contiguous roadway test sections in order to determine whether limiting the number of access points had “pushed” crashes to the terminal intersections. This Phase 3 study looked only at the total number of crashes and used contiguous milepost boundaries between segments.
5 http://en.wikipedia.org/wiki/Wilcoxon_signed-rank_test (retrieved Nov. 2011)
10
III. FINDINGS
Table 2 lists traffic volumes, crash counts, the initial after period dates, and crash
rates for these state highway segments in both the initial three-year after period and, if
sufficient time has past, the latest three-year period (2008-2010). It can be seen in Table
2 that both the total number of crashes and the crash rates for all roadway segments in
which trees were planted decreased in comparison to their before condition. In some
cases, these values changed substantially. For example, on the Federal Way Phase 2
section, crashes declined 30 percent during the first three years after the streetscape was
changed, and the site maintained that lower rate through the following three years.
Crashes within the SeaTac Phase 3 corridor dropped more than 45 percent in the first
three years, and that crash rate then dropped in half again in the three subsequent years.
Four of the six comparison sections also showed a decline in both total crashes
and crash rates. (One of the exceptions was Federal Way Phase 4, a control section
without medians of any kind. The other exception, Des Moines, experienced a decrease
in the number of crashes but a slight increase in crash rates because of slightly lower
measured traffic volumes.) A good example of the majority of comparison sections is the
Kent section of SR 99 from S. 272nd St. to SR 516. This test section included many of
the same streetscape improvements (better access control, landscaping) as the median
test sections with trees, but the Kent section improvements did not include trees in the
median. This section of SR 99 also showed a substantial reduction in crashes (more than
30 percent).
A simple conclusion from Table 2 is that the general streetscape improvements
successfully reduced crash rates in the test sections and that the trees themselves did not
result in an increase in crashes.
More detailed analysis of the crash histories of these sections is included in the
following sections of this report. This report presents data only from 2000 through 2010
and thus does not revisit the SeaTac Phase 1 and Phase 2 results. Readers interested in
the initial before/after analysis can find that analysis in the Phase 1 report. (See: “In-
Service Evaluation of Major Urban Arterials with Landscaped Medians—Conditions as
of 2004,” WSDOT WA-RD 636.1, 2004.) This report does describe changes in the

11
Table 2. Traffic and Crash Characteristics Following Project Construction
Location
Crashes Before
Projects (3 years)
Crash Rate per MVM
Before Project
Crashes in Initial After
Period (3-year rate6)
Initial After Time Period
Initial After Crash Rate per MVM
Continuing Crashes
(3-year rate)
Continuing Time Period
Continuing Crash Rate per MVM
Federal Way –Phase 1 382 16.75 314 2/01/04 – 12/31/07 13.95 272 1/1/08 - 12/31/10 11.27 Federal Way – Phase 2 303 9.66 197 2/01/05 – 12/31/07 6.06 196 1/1/08 - 12/31/10 5.79 Federal Way – Phase 4 (control) 68 3.54 98 1/01/04 – 12/31/07 4.91 71 1/1/08 - 12/31/10 3.29
Kent (control) 355 4.89 235 1/1/08 - 6/30/10 3.24 Des Moines (trees behind barrier) 253 7.87 243 2/01/05 – 12.31/07 8.05 195 1/1/08 - 12/31/10 6.47
SeaTac – Phase 4 198 6.34 114 1/1/08 - 6/30/10 4.00 SeaTac – Phase 27 114 3.478 84 1/02/01 – 12/31/03 3.27 68 1/1/08 - 12/31/10 2.84 SeaTac – Phase 1 366 7.96 275 1/02/01 – 12/31/03 7.47 258 1/1/08 - 12/31/10 7.25 SeaTac – Phase 3 360 8.46 185 8/01/04 – 12/31/07 5.43 97 1/1/08 - 12/31/10 2.61 Shoreline – Phase 1 330 8.29 153 1/1/08 - 12/31/10 4.46 Shoreline – Phase 2 (control) 522 7.14 4419 1/01/04 – 12/31/07 5.84 432 1/1/08 - 12/31/10 6.28
Mukilteo (trees behind barrier) 438 5.58 354 4/01/05 – 12/31/07 3.46 196 1/1/08 - 12/31/10 2.74
Kenmore (trees behind barrier) 253 5.55 167 1/1/08 - 12/31/10 3.67
6 In some cases, more than three years of data were available. In this case, the total number of crashes has been proportionately reduced to reflect a three-year average. In other
cases, less than three full years of crash data were available or published at the time of the analyses. In these cases, the total number of crashes has been proportionately increased.
7 In the initial report (WA.RD 636.1, both SeaTac Phase 1 and Phase 2 include data for crashes located at milepost 18.35. This double counted these crashes. Crash data were –re-extracted from WSDOT’s crash database to make these values comparable.
8 This is different than reported in the Phase 1 report. The change is due to an incorrectly reported AADT for the SeaTac Phase 2 roadway section. The value used here is 33,000.
9 Based on four years of crash data but factored to represent three years. (588 crashes occurred in the four year period 1/1/2004 – 12/21/2007.)
12
SeaTac Phase 1 and Phase 2 sections over the last ten years to illustrate the continued
performance of those early treed median roadway sections.
CRASH RATES
The changes in crash rates for the study sections are summarized in Table 3.
Table 3 shows crash rates before and after treatments were completed. The table also
shows crash rates for the control sections during similar time periods. Overall crash rates
for all of the roadway sections that included unprotected trees in medians as part of the
new controlled access streetscape decreased in the three-year after period. Of the six
control sites, four showed decreased crash rates during the first three-year after period,
and two showed slight increases. One of the two sections showing an increase was a
pure control section (no significant change in streetscape occurred during the study
period). The other—Des Moines, which has protected trees in the new landscaping—
experienced a decrease in total crashes but a slight increase in crash rates because of a
decrease in traffic volumes on the roadway section. In the most recent three-year period
of this study, the Des Moines crash rates declined below the before rates.
While the small number of test sections within both the “test” and “control”
groups limits the statistical reliability of test comparisons, it is important to note that the
reduction in overall crash rates for all of the treed median sections was larger than the
crash rate reduction observed in any of the control sections, including the control sections
that contained new medians and small trees behind barriers. If looked at on the basis of
percentage reduction, the performance of the treed medians was generally similar to that
of the control sections with trees behind median barriers. Given the limited sample size
and the design of the experiment, it is not possible to conclude with statistical
significance that the treed sections were “safer” than the sections with trees behind
barriers or no trees, but it is possible to conclude that the treed median sections did
perform as well as the more conventional designs.
Although it is possible to state with a high degree of statistical confidence that the
treed median designs decreased the overall crash rates, the observed crash reductions are
not assumed to be caused solely by the presence of the small trees but by a combination
of the various design elements in these roadway sections. This analysis did not attempt to

13
Table 3: Before and After Crash Rates
Test Section
Before Crash Rate10
After Crash Rate
Change11 in Crash
Rate
Percentage Change11 in Crash Rate
Sections with Median Trees
Federal Way –Phase 1 16.75 13.95 -2.80 -17%
Federal Way – Phase 2 9.66 6.06 -3.60 -37%
SeaTac – Phase 3 8.46 5.43 -3.03 -36% SeaTac – Phase 4 6.34 4.00 -2.34 -37% Shoreline – Phase 1 8.29 4.46 -3.83 -46%
Control Sections
Des Moines (trees behind barrier) 7.87 8.05 0.18 2% Kenmore (trees behind barrier) 5.55 3.67 -1.88 -34%
Mukilteo (trees behind barrier) 5.58 3.46 -2.12 -38%
Shoreline – Phase 2 (control) 7.14 5.84 -1.30 -18%
Federal Way – Phase 4 (control) 3.54 4.91 1.37 39%
Kent (control) 4.89 3.24 -1.65 -34%
associate specific crash improvements with the various individual design elements
incorporated in the treed median sections, and given the performance of the other sections
with new median barriers and access control, it is not possible to attribute any specific
safety improvement to the presence of trees.
To confirm that the general reduction in crash rates measured in the primary
before/after analysis continued into future years, this study tracked crash rates on those
treed median roadway sections constructed before 2004 for an additional three years.
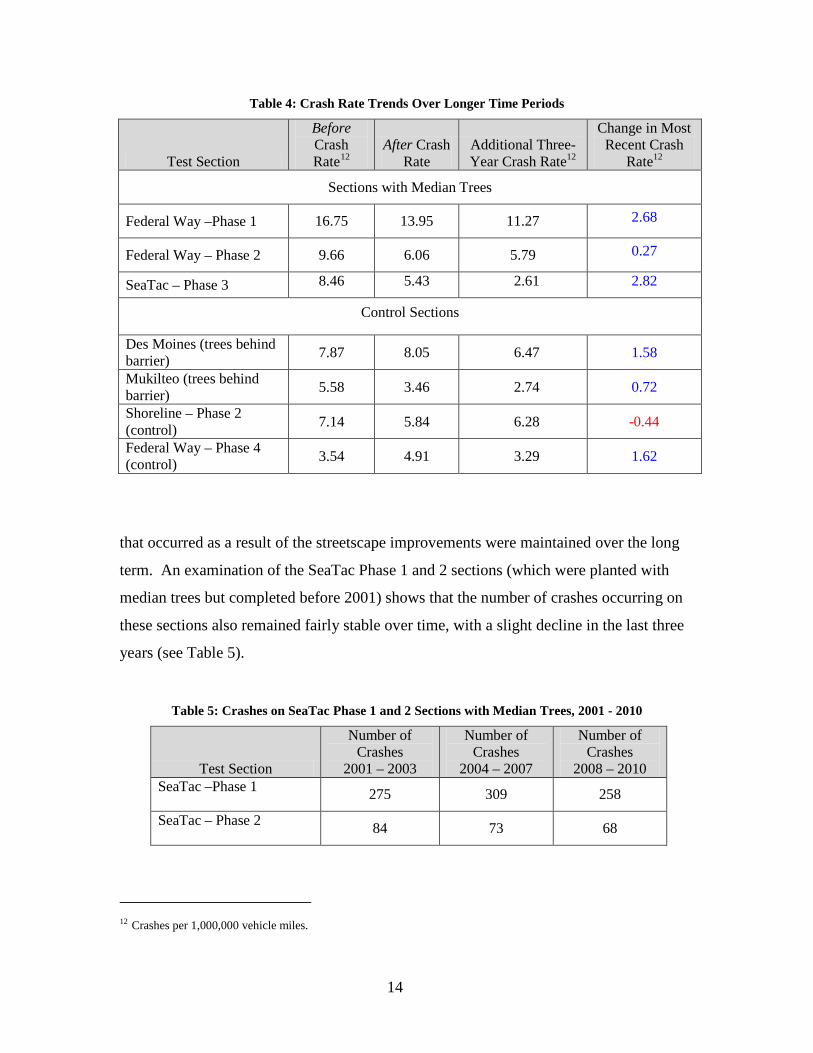
Table 4 shows how crash rates changed in the last three years (2008 to 2010) in
comparison to the previous three-year study period (2005 to 2007). Table 4 shows that
crash rates on the three test sections remained stable, indicating that the crash reductions 10 Crashes per 1,000,000 vehicle miles.
11 In this table, a positive value represents an improvement in the crash rate.
14
Table 4: Crash Rate Trends Over Longer Time Periods
Test Section
Before Crash Rate12
After Crash Rate
Additional Three-Year Crash Rate12
Change in Most Recent Crash
Rate12
Sections with Median Trees
Federal Way –Phase 1 16.75 13.95 11.27 2.68
Federal Way – Phase 2 9.66 6.06 5.79 0.27
SeaTac – Phase 3 8.46 5.43 2.61 2.82
Control Sections
Des Moines (trees behind barrier) 7.87 8.05 6.47 1.58
Mukilteo (trees behind barrier) 5.58 3.46 2.74 0.72
Shoreline – Phase 2 (control) 7.14 5.84 6.28 -0.44
Federal Way – Phase 4 (control) 3.54 4.91 3.29 1.62
that occurred as a result of the streetscape improvements were maintained over the long
term. An examination of the SeaTac Phase 1 and 2 sections (which were planted with
median trees but completed before 2001) shows that the number of crashes occurring on
these sections also remained fairly stable over time, with a slight decline in the last three
years (see Table 5).
Table 5: Crashes on SeaTac Phase 1 and 2 Sections with Median Trees, 2001 - 2010
Test Section
Number of Crashes
2001 – 2003
Number of Crashes
2004 – 2007
Number of Crashes
2008 – 2010 SeaTac –Phase 1 275 309 258
SeaTac – Phase 2 84 73 68
12 Crashes per 1,000,000 vehicle miles.

15
CRASHES INVOLVING TREES
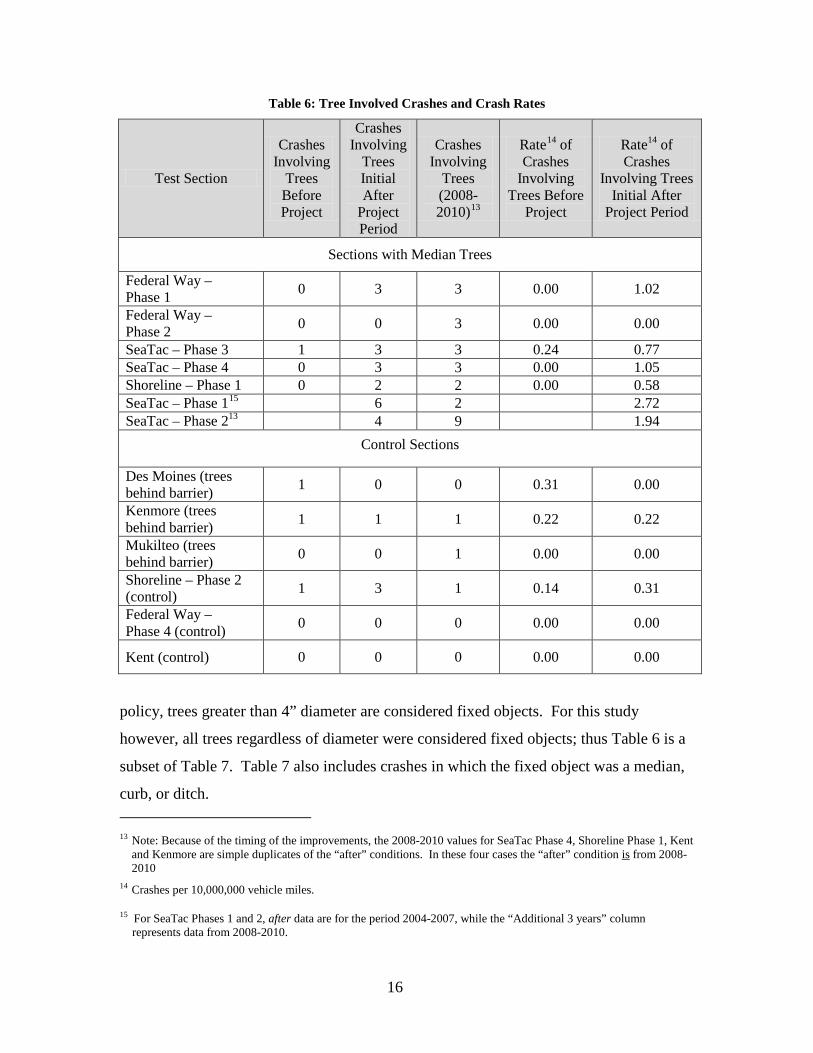
Table 6 shows the total number of crashes that involved trees in the test sections.
Not surprisingly, the sections with unprotected trees in the median (as well as along the
roadside) generally had more crashes that involved trees than the control sections, as the
test segments with median trees provided more exposure to trees. Of concern is the fact
that the number of crashes involving trees increased in 2008 to 2010 versus the initial 3-
year after periods on several, but not all, of the test sections with median trees. However,
those changes were not statistically significant. The authors believe that these increases
were due to the variability inherent in the crash rates involving trees, especially given the
relatively small number of crashes involving trees. Tree-involved crashes were a small
percentage of total crashes, and crashes themselves were a random occurrence, making
the number of tree crashes highly variable from year to year and even over a three-year
period.
Between 2008 and 2010, 25 reported crashes involved trees in the test sections
featuring unprotected trees. Of those 25 crashes, five resulted in injuries to individuals in
the crashing vehicles. Three of those five injury crashes involved trees in the median,
and the other two involved trees on the shoulder of the roadway. A total of nine of the 25
tree involved crashes occurred in the median, with the remaining 16 occurring on the
shoulder of the road. Four of the five injury/tree crashes also involved impaired drivers.
(That is, most serious crashes with trees involved drivers operating under the influence of
drugs or alcohol.) Two of those four occurred in the median and two on the side of the
road.
For the two sets of control sections (trees behind barriers and no streetscape
changes), only three crashes involving trees occurred between 2008 and 2010. None of
these crashes occurred in the median. One of the crashes involved a driver impaired by
drugs or alcohol. That crash occurred on the shoulder and resulted in evident injuries.
CRASHES INVOLVING FIXED OBJECTS
Trees are only one of many types of fixed objects that can be involved in crashes.
Table 7 examines whether the presence of trees and changed streetscapes increased or
decreased the number of crashes in which vehicles hit fixed objects. Within WSDOT
16
Table 6: Tree Involved Crashes and Crash Rates
Test Section
Crashes Involving
Trees Before Project
Crashes Involving
Trees Initial After
Project Period
Crashes Involving
Trees (2008-2010)13
Rate14 of Crashes
Involving Trees Before
Project
Rate14 of Crashes
Involving Trees Initial After
Project Period
Sections with Median Trees
Federal Way – Phase 1 0 3 3 0.00 1.02
Federal Way – Phase 2 0 0 3 0.00 0.00
SeaTac – Phase 3 1 3 3 0.24 0.77 SeaTac – Phase 4 0 3 3 0.00 1.05 Shoreline – Phase 1 0 2 2 0.00 0.58 SeaTac – Phase 115 6 2 2.72 SeaTac – Phase 213 4 9 1.94
Control Sections
Des Moines (trees behind barrier) 1 0 0 0.31 0.00
Kenmore (trees behind barrier) 1 1 1 0.22 0.22
Mukilteo (trees behind barrier) 0 0 1 0.00 0.00
Shoreline – Phase 2 (control) 1 3 1 0.14 0.31
Federal Way – Phase 4 (control) 0 0 0 0.00 0.00
Kent (control) 0 0 0 0.00 0.00
policy, trees greater than 4” diameter are considered fixed objects. For this study
however, all trees regardless of diameter were considered fixed objects; thus Table 6 is a
subset of Table 7. Table 7 also includes crashes in which the fixed object was a median,
curb, or ditch. 13 Note: Because of the timing of the improvements, the 2008-2010 values for SeaTac Phase 4, Shoreline Phase 1, Kent
and Kenmore are simple duplicates of the “after” conditions. In these four cases the “after” condition is from 2008-2010
14 Crashes per 10,000,000 vehicle miles.
15 For SeaTac Phases 1 and 2, after data are for the period 2004-2007, while the “Additional 3 years” column represents data from 2008-2010.
17
Table 7: Fixed Object Crashes and Crash Rates
Test Section
Crashes Involving
Fixed Objects Before Project
Crashes Involving
Fixed Objects After
Project
Crashes Involving
Fixed Objects After
Additional 3 Years
Rate of Crashes
Involving Fixed
Objects Before
Project16
Rate16 of Crashes
Involving Fixed Objects After
Project
Sections with Median Trees
Federal Way –Phase 1 8 9 9 3.51 3.07
Federal Way – Phase 2 6 6 10 1.91 1.90
SeaTac – Phase 3 7 7 7 1.65 1.80 SeaTac – Phase 4 11 10 N/A 3.52 3.51 Shoreline – Phase 1 11 5 N/A 2.76 1.46
Control Sections
Des Moines (trees behind barrier) 14 10 14 4.35 3.41
Kenmore (trees behind barrier) 4 2 N/A 0.88 0.44
Mukilteo (trees behind barrier) 19 24 25 2.42 2.55
Shoreline – Phase 2 (control) 14 25 9 1.98 2.57
Federal Way – Phase 4 (control) 3 4 1 1.54 1.48
Kent (control) 5 15 N/A 0.69 2.20
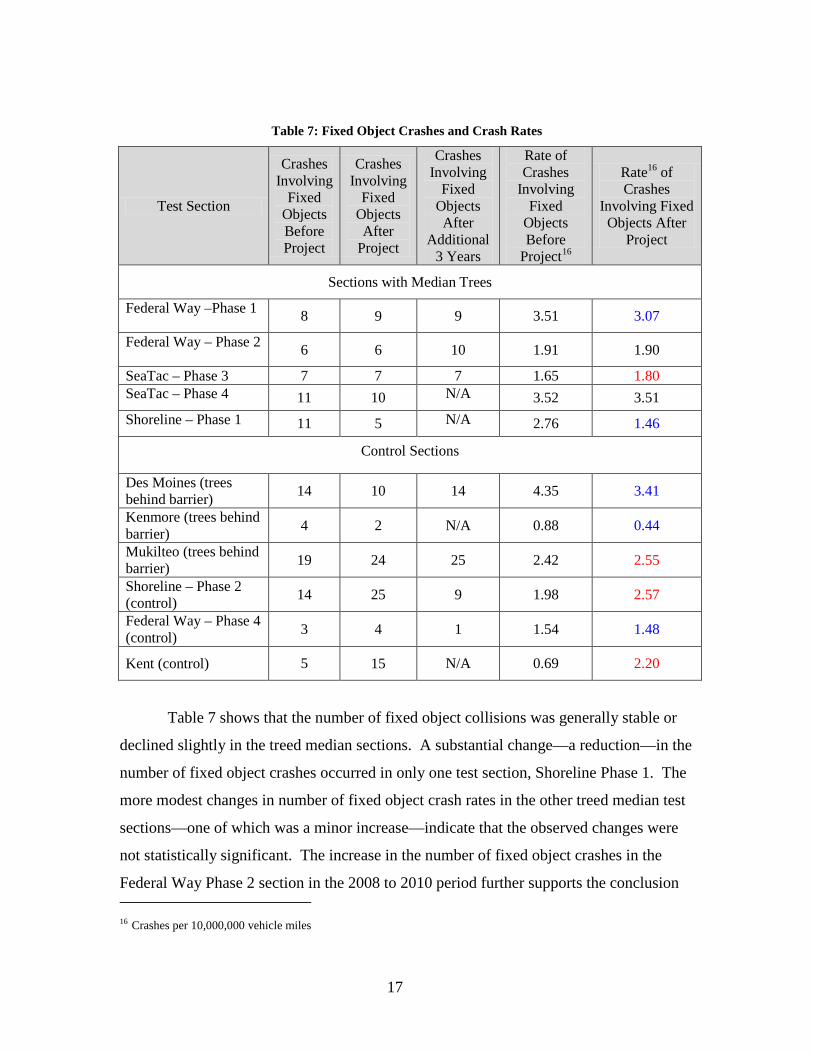
Table 7 shows that the number of fixed object collisions was generally stable or
declined slightly in the treed median sections. A substantial change—a reduction—in the
number of fixed object crashes occurred in only one test section, Shoreline Phase 1. The
more modest changes in number of fixed object crash rates in the other treed median test
sections—one of which was a minor increase—indicate that the observed changes were
not statistically significant. The increase in the number of fixed object crashes in the
Federal Way Phase 2 section in the 2008 to 2010 period further supports the conclusion 16 Crashes per 10,000,000 vehicle miles
18
that the treed median sections did not change fixed object crash rates. The fact that the
increase in the number of fixed object crashes observed in Federal Way Phase 2 was not
mirrored in the other treed median test sections that had been operating for six or more
years indicates that the increase was either a random occurrence or was caused by
external factors present only in that test section. The lack of change in the treed median
sections was similar to that observed in the control sections against which the unprotected
median tree sections were compared. The number of fixed object crashes declined in two
of the three sections with trees behind barriers; one was a fairly significant reduction.
However, the third section showed an increase in the number of fixed object crashes. In
the three pure control sections, the number of fixed object crashes increased in two
sections and declined in the third.
These mixed results lead to the conclusion that the presence of unprotected trees
did not result in a significant change in the number of fixed object crashes. A review of
the sustained fixed object crash rate showed that the number and rate of fixed object
crashes remained essentially unchanged across all sections. There was considerable
fluctuation in those rates even over three-year periods, on all three types of study sections
(unprotected median trees, trees behind barriers, and control sections). These fluctuations
were larger than the changes observed, although the general trend was a slight decrease in
the number of fixed object crashes across all types of facilities.
FATAL AND INJURY CRASHES
While it is clear that the addition of street trees did not result in an increase in the
number of crashes, one of the concerns about placing small trees in the median was that
the presence of trees would increase the number of severe crashes. This section explores
whether placing trees in the median increased the number of severe crashes, even while
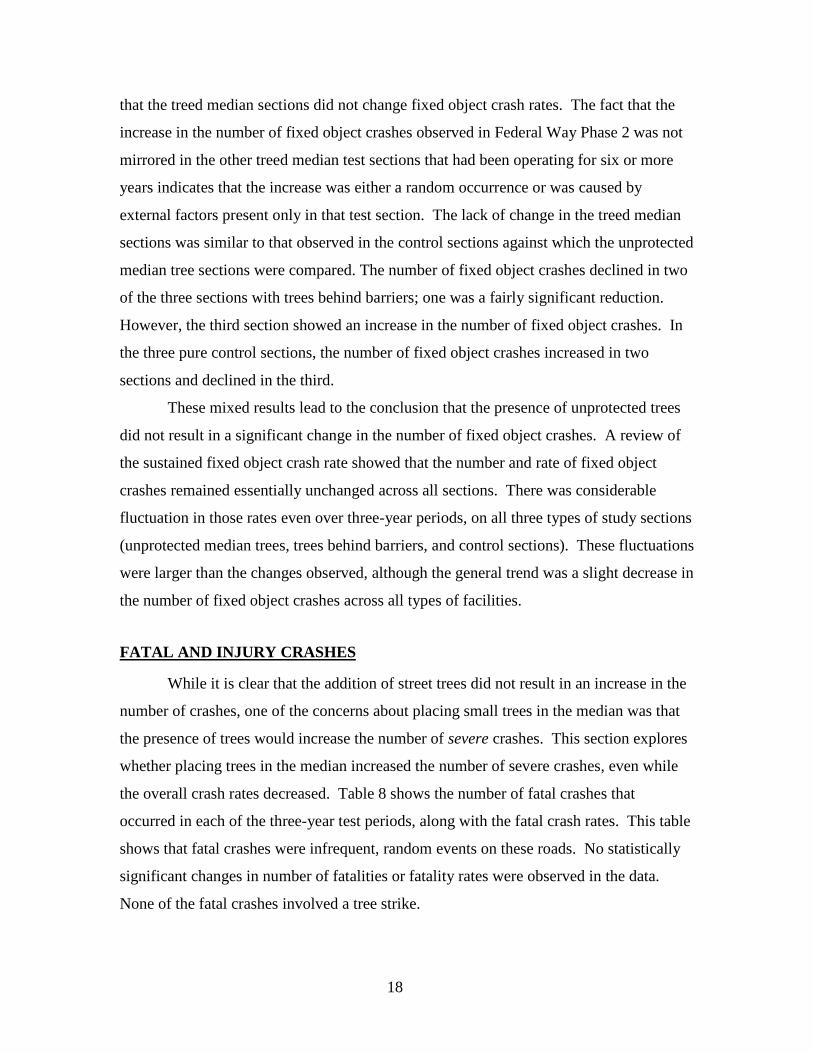
the overall crash rates decreased. Table 8 shows the number of fatal crashes that
occurred in each of the three-year test periods, along with the fatal crash rates. This table
shows that fatal crashes were infrequent, random events on these roads. No statistically
significant changes in number of fatalities or fatality rates were observed in the data.
None of the fatal crashes involved a tree strike.
19
Table 8: Before and After Fatal Crash Rates
Test Section
Fatal Crashes Before Project
Fatal Crashes
After Project
Fatal Crashes
After Additional
3 Years
Fatal Crash Rate17 Before Project
Fatal Crash Rate17 After
Project
Sections with Median Trees
Federal Way –Phase 1 0 1 1 0.00 3.42
Federal Way – Phase 2 1 0 0 3.19 0.00
SeaTac – Phase 3 0 0 0 0 0 SeaTac – Phase 4 1 0 N/A 9.61 0 Shoreline – Phase 1 0 0 N/A 0 0
Control Sections
Des Moines (trees behind barrier) 1 1 0 3.11 3.41
Kenmore (trees behind barrier) 0 0 N/A N/A N/A
Mukilteo (trees behind barrier) 1 1 0 1.27 1.06
Shoreline – Phase 2 (control) 1 2 0 1.41 2.05
Federal Way – Phase 4 (control) 0 1 0 0.00 3.70
Kent (control) 1 1 N/A 1.38 1.38
Because fatalities are rare, this study also looked at the number of crashes that
involved injuries. Table 9 shows how the occurrence of these injury crashes changed
over the course of the study. Table 9 shows that the number of injury crashes declined in
all study sections. The Wilcoxon Signed Rank test showed this decrease to be
statistically significant at the 99 percent level of confidence.
17 Crashes per 100,000,000 vehicle miles.

20
Table 9: Before and After Injury Crash Rates
Test Section Injury Crash Rate Before
Project
Injury Crash Rate After
Project
Change in Injury Crash
Rate18
Injury Crash Rate18
After an Additional
3 Years
Change in Injury Crash Rate18 After
an Additional 3
Years
Sections with Median Trees
Federal Way –Phase 1 60.52 47.06 13.46 36.46 10.60
Federal Way – Phase 2 42.74 21.26 21.47 15.96 5.31
SeaTac – Phase 3 37.62 14.66 22.96 9.16 5.49 SeaTac – Phase 4 26.60 14.05 12.55 N/A N/A Shoreline – Phase 1 30.14 18.38 11.76 N/A N/A
Control Sections
Des Moines (trees behind barrier) 35.13 27.98 7.15 23.88 4.11
Kenmore (trees behind barrier) 17.56 10.76 6.81 N/A N/A
Mukilteo (trees behind barrier) 24.33 11.92 12.42 6.84 5.08
Shoreline – Phase 2 (control) 45.72 31.51 14.21 15.39 16.12
Federal Way – Phase 4 (control) 32.87 29.57 3.30 12.04 17.53
Kent (control) 17.63 10.74 6.89 N/A N/A
Because some of these test sections (Federal Way Phase 4, Kent, and Shoreline
Phase 2) did not have major streetscape improvements but still showed significant
decreases in the number of injury crashes, the decline in injury crashes can not be
attributed entirely to either the streetscape improvements or the presence of trees.
However, because all five of the sections that included unprotected treed medians fell
into the group of seven sections with the largest drops in injury crash rates, it can be
concluded that the trees did not increase the injury hazard. This is further supported by
the fact that in an examination of the percentage change in injury crash rates, four of the
18 Crashes per 10,000,000 vehicle miles.
21
top six test sections contained unprotected trees. (Because of the small sample size of the
locations with trees, a direct, paired (one tree section paired with one control section),
non-parametric comparison of these changes would not have been reliable.)
To further explore the effects of trees on crash severity, this study looked at the
specific crashes that involved both trees and injuries. In the last three years, at all 13
study sections combined, only seven crashes both involved trees and resulted in injuries
(tree&injury crashes)—a rate of just over two per year. One additional crash that
involved both a tree and an injury occurred on SR 99, between the Federal Way Phase 4
and Kent study sections, although this crash is not technically in a roadway segment
included in this study. Five of these eight crashes occurred on road sections containing
median trees; however, only three of those five crashes involved trees located in the
median. The remaining two crashes involved trees on the shoulder. Four of the five
tree&injury crashes occurred on the SeaTac Phase 2 test section. That section also
included all three of the median crashes involving injuries. One reason for this higher
crash rates is likely the fact that SeaTac Phases 1 and 2 were among the first streetscape
improvement projects, and trees were planted in median sections that did not provide the
7’ clear to edgeline criteria used for later projects.
For the two tree&injury crashes that occurred in the control test sections, both
occurred in control sections that contained trees behind barriers (one in Kenmore on SR
522, and the other in Mukilteo on SR 525). Neither crash occurred in the median.
Finally, the “extra” tree&injury crash which occurred on a non-test (unimproved) section
of SR 99 between the Federal Way Phase 4 and Kent control sections, occurred on the
shoulder in a run-off-the-road crash.
As a comparison to these results describing the frequency of crashes involving
trees and the likelihood of injuries resulting from those crashes, the study team also
examined the relative occurrence of crashes involving utility poles, signal poles, street
lights, and metal sign poles and the occurrence of injuries in those crashes. Data was
extracted involving these specific types of fixed object crashes for the period 2008 to
2010. In the control sections, 13 of these specific types of fixed object crashes occurred,
22
and seven of those involved injuries (54 percent). This compares to a ratio of two of six19
(33 percent) for injuries involving trees in the control sections. In the unprotected treed
median sections, nine fixed object crashes occurred involving utility poles, street lights,
and metal sign poles. Of those, three involved injuries (33 percent). The ratio for
tree&injury involved crashes to the total number of tree-involved crashes in the study
sections involving unprotected street trees was 20 percent (five of 25). In both the study
sections involving unprotected street trees and in the control cases, motorists were
slightly less likely to be injured in a crash with trees than with light or utility poles.
While these differences were not statistically significant because of the small
number of tree-involved crashes, these results suggest that the street trees that were
planted increased the number of crashes that hit fixed objects (considering all trees to be
“fixed objects”) only slightly—simply because they increased the number of potential
fixed objects that out-of-control vehicles could strike—while decreasing the rate of injury
per fixed object crash.
One advantage of treed medians is that while the trees in the median become
objects which an out of control vehicle can strike, their presence helps limit vehicle
cross-over movements that result in head-on crashes. No head-on crashes occurred in the
unprotected treed median sections in the four year period from 2007 to 2010. Three
occurred in control sections (Federal Way Phase 4 in 2009, Kent in 2009, and Mukilteo
in 2008—one of the sections with trees behind barriers). In addition, a fourth head-on
crash occurred on a short, unimproved stretch of SR 99 located between two of the
control study sections (Kent and Federal Way Phase 4). That fourth crash occurred in
2009 at milepost 11.59. This suggests, but does not prove, that the medians may have
successfully limited cross-over, head-on crashes and that the addition of medians reduced
the occurrence of very serious crashes (which most head-on crashes are), even with the
increased potential for fixed object crashes. While those crashes can be serious, they are
generally less serious than head-on crashes because the speed differential involved in a
fixed object crash is likely to be half that of a head-on crash.
19 The six crashes are the sum of all crashes occurring in the control sections between 2008- and 2010 and is taken
from Table 6.

23
CRASHES INVOLVING BICYCLES AND PEDESTRIANS
The participating jurisdictions wanted street trees because their presence can
create a more livable environment. One of the desired outcomes from the overall project
was that the improved streetscape would encourage more pedestrian and bike activity,
while also encouraging pedestrians to cross the major arterials in a safer manner at more
effectively controlled locations. While this study did not have the resources to conduct
pedestrian and bike activity counts, it did examine the frequencies of pedestrian- and
bike-involved crashes to determine whether the new streetscapes made the street
environment safer for pedestrians and bikes. Table 10 summarizes these findings.
Table 10 shows that there was little consistency in observed changes in the
number of pedestrian and bike crashes as a result of the various streetscape improvements
(or lack of improvements). The number of pedestrian and bike crashes declined in three
of five test sections with unprotected trees but increased in the other two. However, the
test segment with the largest decline showed a substantial increase in the number of
pedestrian and bike crashes in the subsequent three-year period, bringing the number of
these events close to the number of crashes that occurred before the streetscape
improvements.
The control sections where trees were placed behind median barriers did no better
than the unprotected tree sections. At two of those three sections, the number of
pedestrian- and bike-involved crashes increased, while at the third section there was a
substantial reduction. All three of the control sections showed an increase in the number
of pedestrian- and bike-involved crashes during the initial three-year after period.
The number of crashes involving non-motorized travel modes was highly variable
in large part because their number—like tree involved crashes—was modest. One
example of this was the Federal Way Phase 2 test section, in which ten crashes occurred
in the three-year before period, a low of three crashes occurred during the first three years
after the completion of the streetscape project, and then nine crashes occurred in the last
three-year period. This same crash volatility also was apparent in the control sections;
for example, in the Shoreline Phase 2 control section, the number of crashes increased
from 16 in the before period to 23 in the after period and then dropped back to 15 in the
last three-year period. In comparison, in the Federal Way Phase 4 control section, the

24
Table 10: Bicycle and Pedestrian Crashes and Crash Rates
Test Section
Crashes Involving Bikes and
Pedestrians Before Project
Crashes Involving Bikes and
Pedestrians After
Project
Crashes Involving Bikes and
Pedestrians After
Additional 3 Years
Rate of Crashes
Involving Bikes and
Pedestrians Before
Project20
Rate20 of Crashes
Involving Bikes and
Pedestrians After
Project
Sections with Median Trees
Federal Way –Phase 1 12 16 13 5.26 5.46
Federal Way – Phase 2 10 3 9 3.19 0.95
SeaTac – Phase 3 6 3 4 1.41 0.77
SeaTac – Phase 4 8 5 N/A 2.56 1.76
Shoreline – Phase 1 4 5 N/A 1.00 1.46
Control Sections
Des Moines (trees behind barrier)
12 3 4 3.73 1.02
Kenmore (trees behind barrier)
2 5 N/A 0.44 1.10
Mukilteo (trees behind barrier) 3 6 5 0.38 0.64
Shoreline – Phase 2 (control)
16 23 15 2.26 2.36
Federal Way – Phase 4 (control)
3 12 17 1.54 4.44
Kent (control) 13 14 N/A 1.79 1.93
20 Crashes per 10,000,000 vehicle miles
25
number of pedestrian and bike crashes increased from three in the before period to 12 in
the first after period, and then up again to 17 in the last three-year period.
Without having data on pedestrian and bicycle activity levels, it is unclear
whether these changes reflect an increase in pedestrian activity or simply a random
increase in pedestrian- and bike-involved crashes.
In lieu of additional exposure data, the conclusion is that the unprotected treed
median roadway sections are as safe as, if not safer than, the roadway sections with trees
behind protective barriers for pedestrians and bicyclists. They are also potentially safer
than the control sections, although the level of statistical significance for the data is
difficult to determine because of the limited number of roadway sections in the test.
VEHICLE SPEEDS
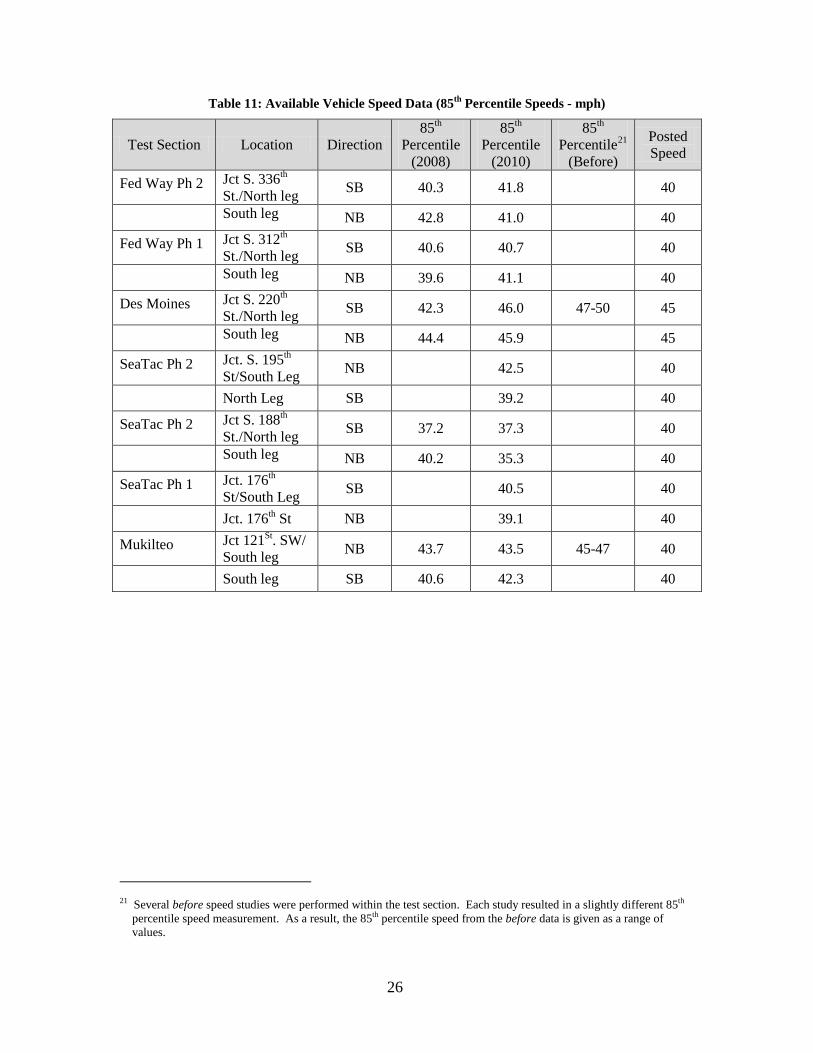
Table 11 shows a summary of the available speed data. Speed data were not
available at many of the test sections for the before periods. This made it impossible to
perform a direct comparison of the effects of the various streetscape treatments on
vehicle speeds. However, it is possible to see from Table 11 that 85th percentile speeds
were reasonably close to the speed limit in all cases. The Mukilteo section, with trees
behind protected barriers, had 85th percentile speeds that exceeded the speed limit by the
greatest amount (3.5 mph northbound and 2.3 mph southbound), but these speeds were
actually lower than the before speeds collected prior to the construction of the median
treatments. In the other location where comparable before data were collected, Des
Moines, the observed 85th percentile speeds also dropped slightly. While these data are
not statistically reliable measures of vehicle speed change, they do offer solid reassurance
that vehicles traveled at speeds appropriate for the facility.
The primary conclusions that can be drawn from the available speed data are that
motorists generally conformed to the posted speed limits in all of the test sections
observed, regardless of whether trees were placed behind protective barriers. The trees,
by themselves did not cause drivers to consistently drive below the posted speeds. No
other conclusions can be stated with statistical confidence from the data available.
26
Table 11: Available Vehicle Speed Data (85th Percentile Speeds - mph)
Test Section Location Direction 85th
Percentile (2008)
85th Percentile
(2010)
85th Percentile21
(Before)
Posted Speed
Fed Way Ph 2 Jct S. 336th St./North leg SB 40.3 41.8 40
South leg NB 42.8 41.0 40
Fed Way Ph 1 Jct S. 312th St./North leg SB 40.6 40.7 40
South leg NB 39.6 41.1 40
Des Moines Jct S. 220th St./North leg SB 42.3 46.0 47-50 45
South leg NB 44.4 45.9 45
SeaTac Ph 2 Jct. S. 195th St/South Leg NB 42.5 40
North Leg SB 39.2 40
SeaTac Ph 2 Jct S. 188th St./North leg SB 37.2 37.3 40
South leg NB 40.2 35.3 40
SeaTac Ph 1 Jct. 176th St/South Leg SB 40.5 40
Jct. 176th St NB 39.1 40
Mukilteo Jct 121St. SW/ South leg NB 43.7 43.5 45-47 40
South leg SB 40.6 42.3 40
21 Several before speed studies were performed within the test section. Each study resulted in a slightly different 85th
percentile speed measurement. As a result, the 85th percentile speed from the before data is given as a range of values.

27
IV. DESCRIPTION OF TEST SECTIONS
This section provides basic descriptive information about the test sections.
SECTIONS WITH UNPROTECTED MEDIAN TREES
Federal Way Phase 1
Phase 1 of the City of Federal Way redevelopment project extended from S. 310th
Street to S. 324th Street (MP 9.68 to 10.44), a distance of 0.76 mile. Improvements
included the widening of the existing five-lane roadway to a seven-lane section, including
two general-purpose lanes and one BAT lane in each direction (beginning south of the
intersection with S. 312th Street), and installation of a landscaped median with provisions
for left turn and U-turn movements at intersections and designated mid-block locations.
The median included trees planted within some sections. The landscaping plans
precluded planting trees within narrow medians near intersections or along mid-block left
turn lanes.
Other elements included curbs, gutters, and sidewalks along both sides of the
roadway. A 6-ft. planter strip separated the 8-ft. sidewalk from the roadway in most
locations, providing room for street trees and other landscaping. All overhead utility
distribution lines were buried with the exception of high-voltage electricity transmission
lines, which were relocated to new poles.
This construction was completed in January 2004.
Federal Way Phase 2
Phase 2 of the City of Federal Way redevelopment project was located just to the
south of Phase 1. This phase extended from S. 340th St. to S. 324th Street (MP 8.65 to
9.68), a distance of 1.03 miles. The improvements in this section involved extension to
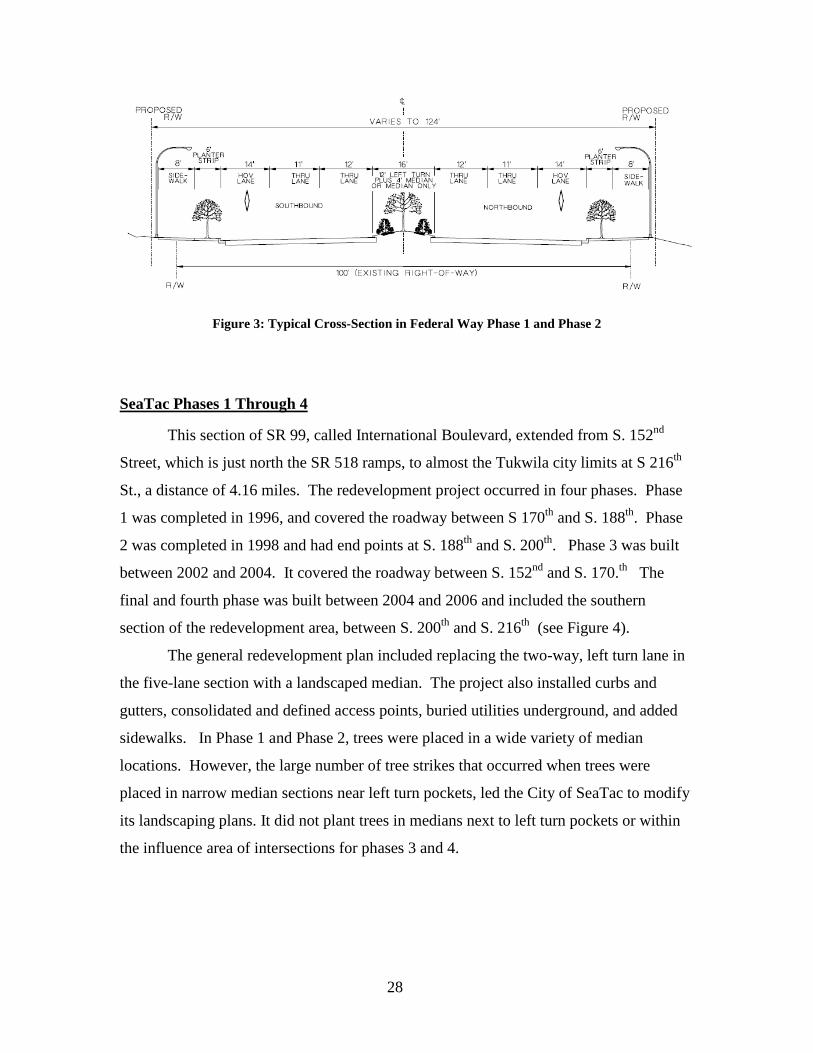
the south of changes similar to those made in Phase 1. Figure 3 shows a typical cross-
section for the improved roadway. Construction was completed in January 2005.
28
Figure 3: Typical Cross-Section in Federal Way Phase 1 and Phase 2
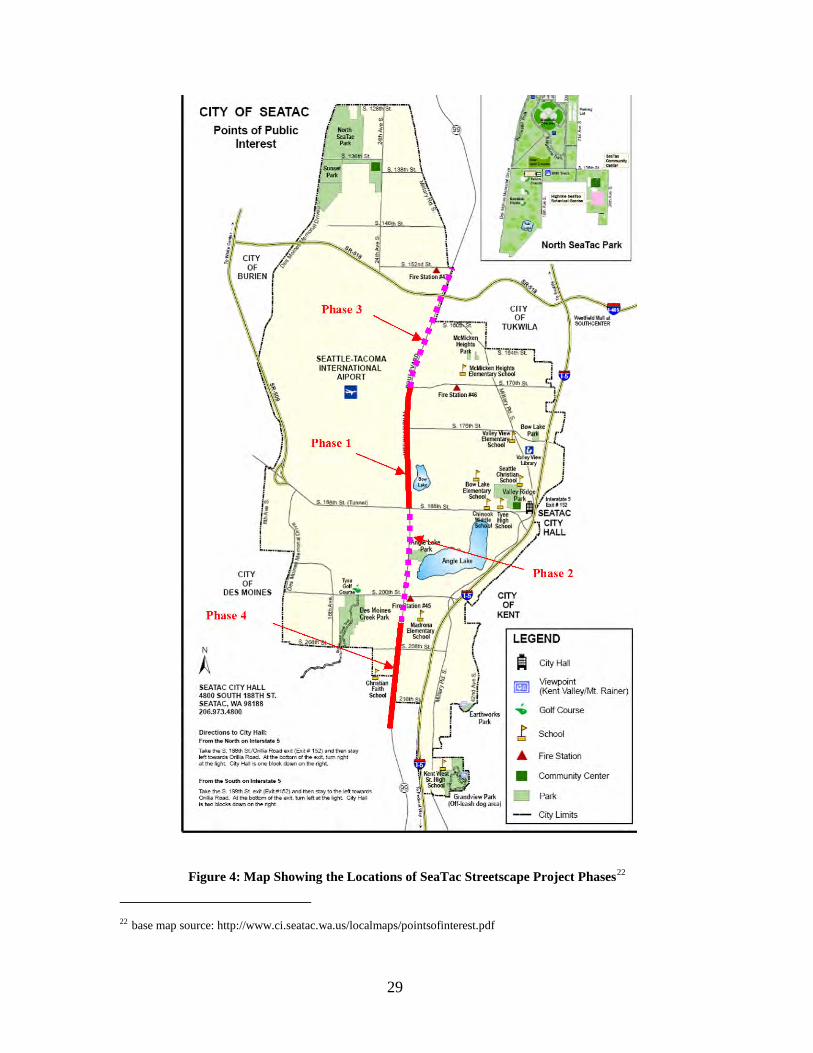
SeaTac Phases 1 Through 4
This section of SR 99, called International Boulevard, extended from S. 152nd
Street, which is just north the SR 518 ramps, to almost the Tukwila city limits at S 216th
St., a distance of 4.16 miles. The redevelopment project occurred in four phases. Phase
1 was completed in 1996, and covered the roadway between S 170th and S. 188th. Phase
2 was completed in 1998 and had end points at S. 188th and S. 200th. Phase 3 was built
between 2002 and 2004. It covered the roadway between S. 152nd and S. 170.th The
final and fourth phase was built between 2004 and 2006 and included the southern
section of the redevelopment area, between S. 200th and S. 216th (see Figure 4).
The general redevelopment plan included replacing the two-way, left turn lane in
the five-lane section with a landscaped median. The project also installed curbs and
gutters, consolidated and defined access points, buried utilities underground, and added
sidewalks. In Phase 1 and Phase 2, trees were placed in a wide variety of median
locations. However, the large number of tree strikes that occurred when trees were
placed in narrow median sections near left turn pockets, led the City of SeaTac to modify
its landscaping plans. It did not plant trees in medians next to left turn pockets or within
the influence area of intersections for phases 3 and 4.
29
Figure 4: Map Showing the Locations of SeaTac Streetscape Project Phases22
22 base map source: http://www.ci.seatac.wa.us/localmaps/pointsofinterest.pdf
30
Shoreline Phase 1
The City of Shoreline’s Aurora Corridor Project redeveloped the three miles of
Aurora Avenue North (SR 99) that run through Shoreline. The project stretched from N.
145th Street to N. 205th Street and was split into two phases. Phase 1 extended from N.
145th to N. 165th Street (mileposts 40.47 to 41.48). Construction started in 2006 and was
completed before January 1, 2008.
The new roadway features included two through-lanes and a BAT lane in each
direction, a landscaped median with lanes for left turn and U-turn movements at mid-
block locations and intersections, and continuous street lighting. The pedestrian
environment was enhanced with continuous sidewalks, typically 7 feet wide, curbs and
gutters, pedestrian-scale lighting at intersections, amenities such as benches, and
landscaping in the 4-ft buffer region between the roadway and the sidewalk. Overhead
utilities were placed underground, and the medians were landscaped, including some
street trees in the wider median sections.
SECTIONS WITH MEDIAN TREES BEHIND LOW PROTECTIVE BARRIERS
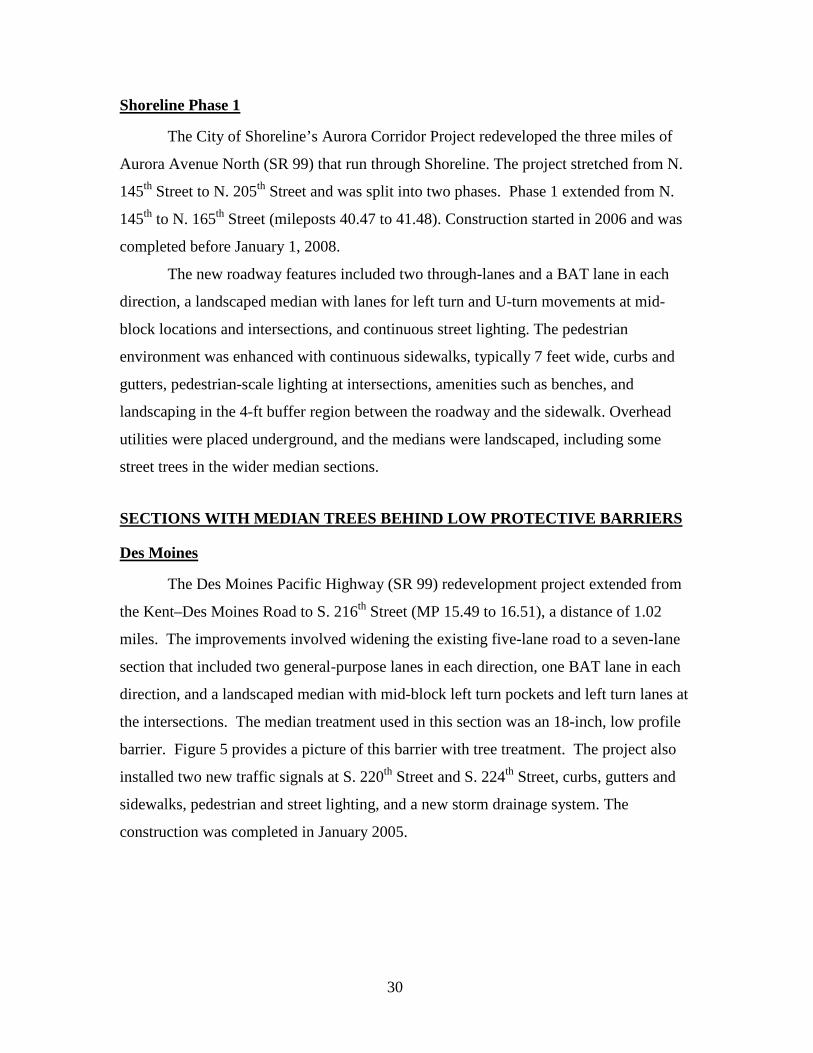
Des Moines
The Des Moines Pacific Highway (SR 99) redevelopment project extended from
the Kent–Des Moines Road to S. 216th Street (MP 15.49 to 16.51), a distance of 1.02
miles. The improvements involved widening the existing five-lane road to a seven-lane
section that included two general-purpose lanes in each direction, one BAT lane in each
direction, and a landscaped median with mid-block left turn pockets and left turn lanes at
the intersections. The median treatment used in this section was an 18-inch, low profile
barrier. Figure 5 provides a picture of this barrier with tree treatment. The project also
installed two new traffic signals at S. 220th Street and S. 224th Street, curbs, gutters and
sidewalks, pedestrian and street lighting, and a new storm drainage system. The
construction was completed in January 2005.

31
Figure 5: Des Moines Median Treatment: Trees Behind a Low Profile Barrier23
Mukilteo
The section of SR 525 included in this study extended west from milepost 3.04
(just after the intersection with SR 99) to milepost 5.99 the intersection with
92nd Street SW in the City of Mukilteo. It continued through town to the terminal for the
Washington State Ferry to Whidbey Island. The study section started at Lincoln Way
and ended at 92nd Street SW (MP 3.04 to 5.99), a distance of 2.95 miles.
The redevelopment work involved widening the roadway from two to four lanes
and adding a landscaped median with low growing vegetation and trees. A low profile
barrier (18 inches high) was placed in the locations where trees were planted. Medians
without trees were delineated with a standard 6-inch curb. Provisions for U-turns were
made at intersections and a few mid-block left turn pockets. Also installed were
sidewalks, bike lanes, and improved lighting and drainage. Roadside trees were also
planted in a landscaping strip between the roadway and the sidewalk. 23 Picture courtesy of Anna St. Martin

32
Kenmore
The City of Kenmore reconstructed SR 522 from 60th Ave NE to the eastern city
limits (MP 6.54 to MP 8.23.) Phase 1 of this project included almost one mile of this
project from 60th Ave NE to 73rd Ave NE (MP 7.49). Construction occurred during 2006
and 2007. The major components of the improvement project included making alignment
improvements at intersections; creating a Burk-Gilman Trail underpass; extending the
existing BAT lanes to the eastern city limit; installing landscaped medians with a low-
profile median barrier; and adding landscaping, street lighting, and sidewalks to several
sections of the corridor. Two additional signals were installed, one at the intersection
with 83rd Place NE and one at the entrance to Kenmore Lanes.
CONTROL SECTIONS
Federal Way Phase 4
Federal Way Phase 4 extended from S. 310th Street to 18th Avenue S. (MP 10.57
to 11.24), a distance of 0.67 mile. It was one of three control segments where no
landscaping enhancements were constructed. The control segments were analyzed for
later comparison with segments where enhancements were implemented.
Shoreline Phase 2
The City of Shoreline’s Aurora Corridor Project is redeveloping 3 miles of Aurora
Avenue North (SR 99) that run through the city. Shoreline Phase 2 extended from N.
170th Street to N. 205th Street (MP 41.59 to 43.56), a distance of 1.97 miles. This control
section had no landscaping enhancements.
Kent
The City of Kent's project widened Pacific Highway (SR 99) between S. 272nd
Street and south of the intersection with the Kent-Des Moines Road (SR 516), a length of
approximately 2.5 miles (MP 12.93 to 15.48). The $17 million effort was prompted by
increasing delays due to traffic congestion and increasing vehicle accident rates due to
uncontrolled driveway access.
33
The improvements included widening the roadway; providing northbound and
southbound BAT lanes adjacent to the street curb; the construction of concrete curbs,
gutters, and sidewalks; and a median to control and define driveway access and improve
the pedestrian environment. Landscaping was included along the roadside and within the
median. No trees were planted in the median. The existing traffic signal system was also
upgraded along with drainage and illumination system improvements.

34
V. LOCAL AGENCY INPUT
As part of earlier project evaluation efforts, interviews were conducted with three
local agencies: Federal Way, Mukilteo, and Shoreline. Three agencies provided tree
maintenance information. This section summarizes the information obtained from those
interviews and maintenance records.
LOCAL AGENCY PERSPECTIVE
City staff we spoke with had positive comments about the landscaped medians.
Their communities and elected officials were pleased with the improved aesthetics and
local “Main Street” feel. In general, agencies reported that they had learned that
aesthetics can be improved without affecting transportation service. This has been a
paradigm shift for many road designers, and the cities plan to, or would like to, install
more of these median treatments.
TREE TYPES, MAINTENANCE, AND DESIGN ISSUES
The types of trees used by local agencies for landscaped medians varied widely,
and therefore, success with the aesthetics and longevity of the plantings varied. Provision
of information on appropriate tree plantings and their relative attributes (e.g., drought
resistance, expected diameter of fully mature trees, etc.) would benefit future landscaping
efforts.
Federal Way
Federal Way planted the following types of trees: Armstrong maple, flowering
pear, skymaster oak, and incense cedar. All trees were planted in November 2004. When
the trees were measured during installation, the diameters ranged from 1.9 to 4.9 inches
(caliper measurements at 4-ft high). After approximately one year, the diameter of the
trees was the same. As of May 2008, the diameter of the trees ranged from 2 to 6 inches.
The width of the median in Federal Way ranged from 16 to 24 feet, although that did not
seem to influence the type of tree planted.
There were few tree strikes. Those that did occur usually involved trees on the
roadside and not in the median.
35
Because of the popularity of the medians, maintenance continues to be a high
priority for the city. However, there are some issues with scheduling maintenance work.
Federal Way uses a private contractor, and it is now scheduling this work during off-peak
hours because it typically involves a lane closure.
Median installations like this make it important to adequately size the left turn
pockets. There is no extra storage as there is with a two-way, left turn lane adjacent to
the left turn pocket.
Mukilteo
No installation report was available for Mukilteo. However, Mukilteo Public
Works Director Larry Waters indicated that the maintenance needs for the landscaped
medians have varied. Mukilteo used sand instead of topsoil for most of the medians,
which contributed to problems of sand getting in the street and on sidewalks.
Winter snow and ice control activities are tough on the median plants. Plows or
snow blowers pile the snow on the plants, and sand and gravel applied to improve
traction get thrown onto the median, where they bury the plants.
Mukilteo has also found that many of the plants are too big for the medians and
require a fair amount of annual maintenance to prevent them from becoming overgrown.
Like other local agencies, it has to close a lane to do maintenance. Irrigation has also
been a major problem for the landscaped medians, and some narrower areas have dried
out and will eventually have to be replanted.
SeaTac
SeaTac planted a combination of sweet gum and pear trees with diameters ranging
from 2 to 7 inches. About twelve trees had to be replaced in 2006, although the reasons
are unknown. SeaTac staff members were not available for an interview.
Shoreline
In Shoreline, three types of maple trees were planted: parkway maple, Pacific
sunset maple, and Karpick maple. All trees were planted in November and December of
2006, and the city clustered the trees in certain areas instead of spacing them equal
distances apart on the median.
36
At installation, the diameters of the trees ranged from 2.5 to 4.5 inches. There was
little change in the size of the trees almost two years later. Shoreline planners noted that it
was more difficult to support vegetation on the narrower landscaped medians toward the
south end of the study area, as the plantings became overly dry. In addition, several trees
toward the northern end of the study area became diseased.
Shoreline has started irrigating the planting strips and tries to use drought tolerant
plants where possible. It has found that native plantings often do not work well in an
urban street environment. Other maintenance issues have included weeds in the soil mix
and substandard landscaping work performed by the contractor. The city is working to
amend future contracts so that more attention is paid to landscape maintenance post-
construction.
Like Mukilteo, Shoreline would like to change to using concave medians below
curb level to keep water within the curb and to build more natural storm drainage into
future landscaped medians.
To avoid the conflict between U-turning and right turning vehicles, Shoreline
installed upstream U-turn pockets to separate vehicles making these movements from
intersection traffic.
37
VI. CONCLUSIONS AND RECOMMENDATIONS
The installation of landscaped medians resulted in a statistically significant
decrease in overall accident rates both at treatment locations with unprotected trees and at
locations with trees placed behind low profile barriers. The control locations experienced
no significant changes in accident rates. It appears that the installation of landscaped
medians as part of streetscape improvements that include better access management can
be expected to reduce overall accidents. While the number of crashes involving trees
frequently increases when trees are placed within medians with no protection due to the
increase in exposure, no statistically significant increase in fixed object crashes occurred
even when including small trees in the definition of “fixed objects.” The installation of
these medians did not show any beneficial effect on the rates of pedestrian or bicycle
accidents. The improvements in the treed median sections did result in a statistically
significant decrease in the number of injury crashes. It is unclear how much of this
decrease is due to the presence of trees and how much is due to other aspects of the
streetscape improvements.
While reviewers of this report are interested in learning about how differences in
tree diameter effect crash severity, insufficient data was collected during the course of
crash investigations on the size (diameter or caliper) of trees that were struck in those
crashes to allow analysis of the effect of tree size (diameter) on the likelihood that
injuries would occur as a result of crashes involving trees of different sizes.
38
VII. REFERENCES
St. Martin, Anna, Mark E. Hallenbeck, John Milton, and Jennifer Nee. In-Service
Evaluation of Major Urban Arterials with Landscaped Medians – Conditions as of 2004. University of Washington, Washington State Transportation Center, Seattle, 2007., WA-RD 636.1
Briglia, P., Z. N. Howard, E. Fishkin, M. E. Hallenbeck and A. St. Martin.. In-service
Evaluation of Major Urban Arterials with Landscaped Medians—Phase II, July 2009, WA-RD 636.2
Washington State Department of Transportation, Annual Traffic Report, 2001-2010. Washington State Department of Transportation, State Highway Log, 2001, 2007. Washington State Department of Transportation, 1996 Washington State Highway
Accident Report, Planning and Programming Service Center, Transportation Data Office, Olympia, WA, 1996.
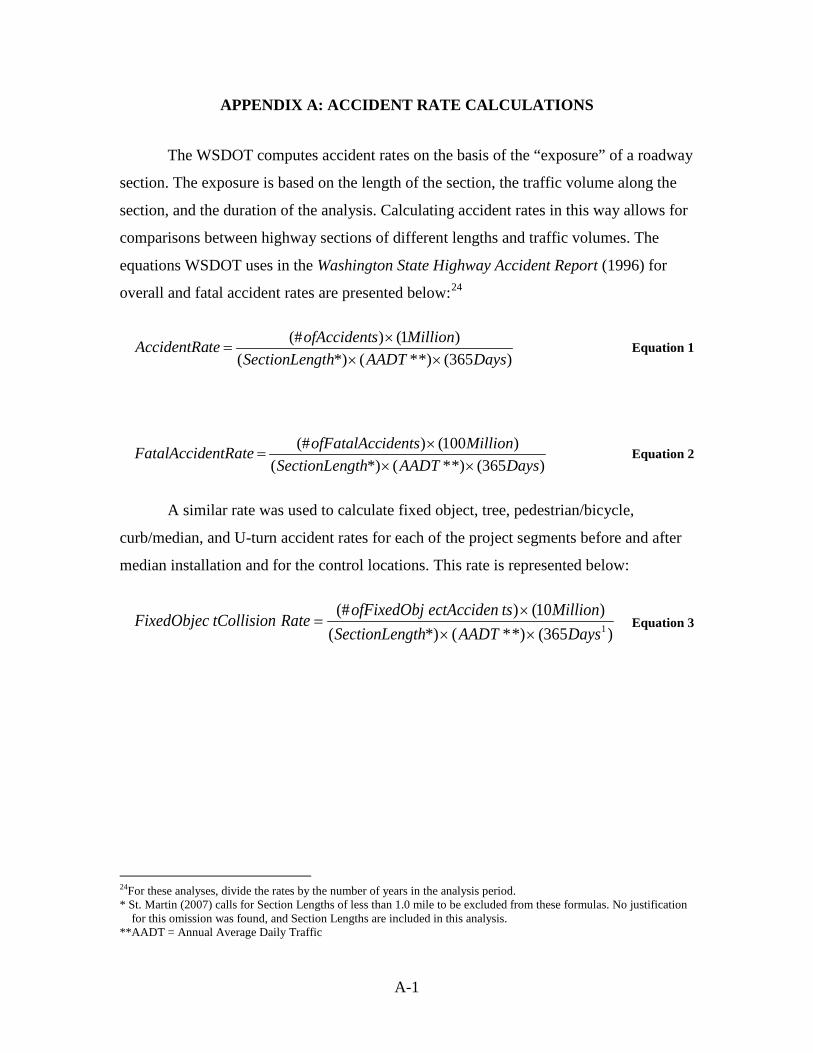
A-1
APPENDIX A: ACCIDENT RATE CALCULATIONS
The WSDOT computes accident rates on the basis of the “exposure” of a roadway
section. The exposure is based on the length of the section, the traffic volume along the
section, and the duration of the analysis. Calculating accident rates in this way allows for
comparisons between highway sections of different lengths and traffic volumes. The
equations WSDOT uses in the Washington State Highway Accident Report (1996) for
overall and fatal accident rates are presented below:24
Equation 1
)365(*)*(*)()100()(#
DaysAADTgthSectionLenMillionidentsofFatalAccentRateFatalAccid××
×= Equation 2
A similar rate was used to calculate fixed object, tree, pedestrian/bicycle,
curb/median, and U-turn accident rates for each of the project segments before and after
median installation and for the control locations. This rate is represented below:
)365(*)*(*)()10()(#1DaysAADTgthSectionLen
MilliontsectAccidenofFixedObjRatetCollisionFixedObjec×××
= Equation 3
24For these analyses, divide the rates by the number of years in the analysis period. * St. Martin (2007) calls for Section Lengths of less than 1.0 mile to be excluded from these formulas. No justification
for this omission was found, and Section Lengths are included in this analysis. **AADT = Annual Average Daily Traffic
)365(*)*(*)()1()(#
DaysAADTgthSectionLenMillionsofAccidentteAccidentRa
×××
=

A-2