in search of the link between ship size and operations · link between ship size and operations,...
TRANSCRIPT

ARTICLE
In Search of the Link between ShipSize and Operations
CHRISTA SYS+,$, GUST BLAUWENS**, EDDY OMEY$,EDDY VAN DE VOORDE** & FRANK WITLOX%
*Faculty of Applied Business, University College Ghent, Henleykaai, Gent, Belgium;**Department of Transport and Regional Economics, University of Antwerp,
Prinsstraat, Antwerpen, Belgium; $SHERPPA, Ghent University, Tweekerkenstraat,Gent, Belgium & %Department of Geography, Ghent University, Krijgslaan,
Gent, Belgium
(Received 7 November 2006; Revised 27 June 2008; In final form 8 July 2008)
ABSTRACT Since 1990s the liner shipping industry has faced a period ofrestructuring and consolidation, and been confronted with a continuing increasein container vessel scale. The impact of these changes is noticeable in tradepatterns, cargo handling methods and shipping routes, in short ‘operations’.After listing factors influencing size, growth in container ship size is explained byeconomies of scale in deploying larger vessels. In order to quantify economies ofscale, this paper uses the liner service cash flow model. A novelty in the model isthe inclusion of �6000-20-foot Equivalent Unit (TEU) vessels and the distinctionin costs between single and twin propeller units on ships. The results illustratethat scale economies have been � and will continue to be � the driving forcebehind the deployment of larger container vessels. The paper then assesses thelink between ship size and operations, given current discussions aboutthe increase in container vessel scale. It is found that (a) ship size and operationsare linked; (b) optimal ship size depends on transport segment (deep-sea vs.short-sea shipping, SSS), terminal type (transhipment terminals vs. otherterminals), trade lane (East-West vs. North-South trades) and technology; and(c) a ship optimal for one trade can be suboptimal for another.
KEY WORDS: Liner shipping; containership size; container operations;economies of scale
Correspondence Address: Christa Sys, Faculty of Applied Business, University College Ghent,
Henleykaai 84, B-9000 Gent, Belgium. Email: [email protected]
ISSN 0308-1060 print: ISSN 1029-0354 online # 2008 Taylor & Francis
DOI: 10.1080/03081060802335109
Transportation Planning and Technology, August 2008
Vol. 31, No. 4, pp. 435�463

Introduction
History tells us that the liner shipping industry has been characterisedby a number of profound changes, starting from the introduction of thecontainer box in the early 1960s, the set-up of consortia and otheroperational agreements (1970�1980), and in the 1990s, the formationof (global) alliances. These alliances have made it financially possible todeploy bigger ships which, in turn, allow the economies of scaleassociated with such vessels (Ham, 2004; Stopford, 2004; EuropeanCommission, 2005; UNCTAD, various editions). The planned aboli-tion of the European conferences in October 2008 puts the linershipping industry on the threshold of a new era.
The maritime landscape, which plays a vital role in industrial andeconomic development, was redesigned by successive waves of con-solidation. The first consolidation in the liner shipping industry tookplace around 1995. Ten years later a second consolidation roundstarted. In Mid-June 2005, the liner shipping industry was shaken up bythe takeover of Royal P&O Nedlloyd by Maersk Sealand (since knownas Maersk Line). No doubt this merger will redesign the liner shippingindustry and inevitably provoke others to follow, as can already benoted (Fossey, 1990; Brooks, 2000; Containerisation International,various editions). After all, liner shipping is an example of anoligopolistic market where interdependence is a key feature (Lipczynskiet al., 2005). The question becomes: Will the trend towards megaconcerns affect the operations of liner shipping companies? If so, how?
The focus of this paper is to examine from an economic point of viewthe way ship size is linked with operations. The paper is divided intofour sections. In Section ‘Market Configuration’ the configuration ofmarket is explained. The next two Sections focus on the concept‘Optimal Ship Size’ and ‘Optimal Ship Operations’, respectively. TheSection ‘The Link between Ship Size and Operations’ outlines the linkbetween both concepts. Finally, conclusions are drawn in the Section‘Conclusions’.
Market Configuration
Firstly, the world’s pure cellular fleet capacity (or the capacity ofcontainer ships fitted throughout with fixed or portable cell guides forthe carriage of containers, OECD Glossary of Statistical Terms, 2008)as at 1 January 2008 was assessed at 4312 vessels with a total nominalcapacity of about 11 million 20-foot Equivalent Unit (TEU) (BRS,2008). Assuming that all vessels are delivered as contracted and withthe sustained minimum scrapping taking place, this carrying capacity isforecasted to increase by another 15.18% during 2009, 14% during
436 Christa Sys et al.

2010, 13.71% during 2011 and by 8.59% by 2012 (see Table 1 �Figures refer to 1 January of each year. The figures for the period 2009�2012 have been derived from the order book. As liner operators canstill book orders for delivery in 2010, the figures for the period 2010�2012 are not yet definitive). The 10 million-TEU barrier was over-stepped in 2007.
Secondly, we zoom in on the evolution of the world container fleetover two decades (see Table 1 � compiled with data from BRS, 2008and Drewry Shipping Consultants, 2005). While the number of shipsgrew by a factor of five, the carrying capacity (TEU) increased at twicethat rate. In combination these two aspects show that average ship sizeincreased from about 1306 TEUs at the end of the 1980s up to 2533TEUs (2008). Consultancy reports confirm that this trend of increasedaverage ship size will continue. The trend forecast suggests that theaverage size will move to about 3300 TEUs in 10 years’ time (DrewryShipping Consultants, 2005).
In detail, Table 2 shows the distribution by size range of the newlydelivered ships in the respective years (BRS, 2008). While in 1995, ninenew vessels were deployed with a capacity in the size range of 5001�6000 TEUs, a decade later, 76 vessels were delivered with a capacity ofover 5000 TEUs. Although the smallest size segments still account forthe largest share, a shift towards larger ships is noticeable. Looking at
Table 1. Evolution of the cellular fleet 1988�2010
YearNumber of
ships IndexCarrying capacity
(TEU) IndexGrowth
%Average ship
size
1988 1151 100 1503244 100 1306
1998 2332 203 3875130 258 16621999 2512 218 4296511 286 10.87 17102000 2611 227 4525919 301 5.34 17332001 2735 238 4936737 328 9.08 18052002 2892 251 5540085 369 12.22 19162003 3033 264 6125493 407 10.57 20202004 3174 276 6667758 444 8.85 21012005 3347 291 7318184 487 9.75 21862006 3606 313 8258608 549 12.85 22902007 3943 343 9587306 638 16.09 24312008 4312 375 10921474 727 13.92 25332009 4798 417 12579049 837 15.18 26222010 5240 455 14340308 954 14.00 27372011 5600 487 16306339 1085 13.71 29122012 5788 503 17706885 1178 8.59 3059
In Search of the Link between Ship Size and Operations 437

the cellular ship deliveries for the period 2008�2011, one can concludethat this trend will continue (see Figure 1) (BRS, 2008).
Ultimately, the container liner shipping industry is currently under-going a period of unprecedented structural growth, in terms of bothvolume and ship size. Table 3 shows the evolution of the biggest ships(listed by TEU) in the world, the information about the owner and thecharacteristics of the ship (i.e. length over all (length o.a.), beam,draught, TEU, Gross Register Ton (GRT), and Deadweight Tonnage(DWT) (compiled with data from www.answer.com and informationfrom liner operators).
The impressive size growth � particularly during the last decade � isastonishing, especially when compared with the preceding period of 25years. In the latter period (1970�1995) the vessel size tripled, whileduring the last 10 years it almost doubled.
The official number of TEU is not necessarily the same as thenominal number of TEU the ship can carry. In the column of the TEUcharacteristics in Table 3, the nominal values between brackets can benoted. Maersk Line for instance does not quote the TEU capacity of itsships in the same way as other liner shipping operators. Maersk Linequotes the maximum load capacity of their ships in terms of filled TEUswith a 14 tonne load (tare weight included). This will always result in asmaller TEU capacity than the true TEU capacity (i.e. the ship MS ‘AxelMaersk’ most likely has a capacity of 8650 TEU instead of the reported7226 TEU).
Assuming that a 13,500-TEU vessel is soon to be deployed, how doesthis reflect on the problematic nature of draught and accessibility ofports (see Section ‘Optimal Ship Operations’)? Further research yieldsthe following explanation: a containership cannot transport its nominalcapacity, even if we are talking about empty containers. A hypothetical
Table 2. Number of ships newly deployed
Year Range in TEU 1990 1995 2000 2005 2006
1001�2000 31 51 43 47 952001�3000 16 16 20 44 713001�4000 4 13 7 7 244001�5000 7 22 18 40 355001�6000 9 23 34 206001�7000 5 3 137001�8000 7 58001�9000 4 24 339001�10,000 8 20Total 58 111 120 214 316
438 Christa Sys et al.

example illustrates this point: suppose all 20-foot containers are filledwith sand, and each container loaded up to a weight of 18t�2t (weightof the container) or 20t. Multiplying the weight by the number of slots,viz 9580 TEUs, equals 191,600t, which exceeds the deadweight of theship (11,5000t � see Table 3). Starting from its deadweight and usingthe Maersk Line rule of thumb, a 9580 vessel could transport about8214 TEUs loaded (115,000t/14t).
Linking weight with trade lane, vessels on the Far East/Europe tradelane are fully loaded by TEU and not by weight. On the contrary, theAfrican trade lane is characterised by heavy cargo (e.g. chemicals), sohere the vessels are fully loaded by weight and not on slot capacity.
Besides the characteristics of cargo, the commercial aspect also playsan important role. In a very competitive environment on the one handand with the forecasted risk of overcapacity on the other, it will becomehard to sell all slots of these larger vessels. We can cautiously concludethat the problem of accessibility of ports is not an issue yet, as vesselsare seldom fully loaded by weight and, in addition, main ports respondlargely by intensive dredging investments (see Section ‘Optimal ShipOperations’).
The shift towards larger ships seems to continue, possibly even upto 18,000 TEUs (known as the Malacca-max vessels which refers tothe maximum size and draught to transit the Strait of Malacca, avital part of the Asian trade route). Although it is not clear if andwhen an 18,000-TEU containership with an allowable draught willbe built, it is fairly certain that the recent surge in vessel size will notstop at the barrier of 11,000 TEUs. Technically there seem to be nolimitations.
0% 20% 40% 60% 80% 100%
2008
2009
2010
2011
<1000
1000 - 2999
3000 - 5099
5100 - 7499
7500 - 10499
> 10500
Figure 1. Cellular ship deliveries
In Search of the Link between Ship Size and Operations 439

Table 3. The biggest ships (listed by TEU) in the world
Beam
Built Name Length o.a. (m) (TEU) Draught TEU GRT DWT Owners
2006 Emma Maersk 394.00 m 56.40 m 17 (22) 16.00 m 11,000(13,460)
n.n 173000 Maersk Line/Denmark
2006 COSCO Guangzhou 350.00 m 45.60 m 17 15.00 m 9580 105000 115000 China Shipping Container Lines2005 MSC Pamela 336.70 m 45.60 m 18 15.00 m 9200 107849 109600 MSC/Switzerland2004 CSCL Europe 334.00 m 42.80 m 17 14.50 m 8468 90465 101612 China Shipping Container Line2003 OOCL Shenzhen 322.97 m 42.80 m 17 14.50 m 8063 89097 99518 OOCL/Hongkong2003 Axel Maersk 352.10 m 42.80 m 17 15.02 m 7226
(8650)93496 109000 Maersk Sealand/Denmark
1997 Sovereign Maersk 346.98 m 42.80 m 17 14.50 m 6600(8050)
91500 104690 Maersk Line/Denmark
1996 Regina Maersk 318.24 m 42.80 m 17 14.00 m 6000(7048)
81488 82135 Maersk Line/Denmark
1995 OOCL Hongkong 276.02 m 40.00 m 16 14.00 m 5344 66046 67637 OOCL/Hongkong1991 Hannover Express 294.00 m 32.30 m 13 13.50 m 4639 53783 67686 Hapag-Lloyd/Germany1988 Marchen Maersk 294.12 m 32.22 m 13 11.00 m 4300 53600 60639 Maersk Line/Denmark1984 Louis Maersk 270.00 m 32.30 m 13 11.00 m 3390
(3700)43392 53395 Maersk Line/Denmark
1981 Frankfurt Express 287.73 m 32.28 m 13 13.06 m 3430 57540 51540 Hapag-Lloyd/Germany1972 Hamburg Express 287.70 m 32.20 m 13 12.04 m 3010 58088 47995 Hapag-Lloyd/Germany1972 Tokyo Bay 289.32 m 32.26 m 13 13.00 m 2961 58889 47462 OCL then P&O/GB1971 Kamakura Maru 261.00 m 32.20 m 13 12.00 m 2500 51069 35737 NYK/Japan1970 Sydney Express 217.00 m 30.58 m 12 11.58 m 1665 27407 33350 Hapag-Lloyd/Germany1969 Encounter Bay 227.31 m 30.56 m 12 9.00 m 1572 28800 28794 OCL then P&O/GB1968 Hakone Maru 187.00 m 26.00 m 10 9.00 m 752 10423 14745 NYK/Japan
440
Christa
Syset
al.

Optimal Ship Size
Wijnolst et al. (1999) states that the driving force is the creation of acompetitive advantage through economies of scale. The Malacca-maxdesign has an overall lower cost level of approximately 16% over thecurrent largest container ships of 8000 TEUs. In a world of cut-throatcompetition, 16% can make a decisive difference. From a technologicalpoint of view, 18,000 TEUs can be considered as the maximal shipdesign, but it is not the optimal ship size.
Factors Influencing Size
Various technical studies have shown that the deployment of largercontainer ships is feasible and that there are neither technicallimitations nor market obstacles to introducing them (Wijnolst et al.1999; Akiyama et al., 2002; Ham, 2004). Currently, further engineer-ing is still needed regarding future Panamax vessels and new logisticalconcepts are required. The tremendous growth in ship size makes itnecessary to look for a systematic explanation of the factors influencingthe size of ships.
The driving variables were obtained by reviewing the relevantliterature and from interviews with liner carriers and shippers. Afterlisting the variables, it became clear that the criterion for cataloguingthe driving key factors would be a synthesis of the different points ofview of all players involved. In clockwise order this includes theshipper, the (port) authorities, technology, the terminal operators, thecarrier and finally, though not least important, market-driven forces.The result of the driving variables pushing the vessel scale is shown inFigure 2.
From the viewpoint of the carrier, the response to the expandingmarket, the permanent strive for cost cutting, the formation of strategiccooperation, and most particularly the (global) alliances have fuelledthe upsizing trend. Economies of scale, the engine that drives the scaleof the container ship, exist when the unit costs of operating a shipdecrease as the size of containerships increases. In a very competitivemarket new building orders for bigger ships provoke others to follow.These orders have not been solely placed by alliance members. In anattempt to maintain their market share by keeping pace with this leveland type of investment, most major independent liner operators havealso placed orders for such vessels.
In addition, other variables such as the increase in the worldwidedemand for liner shipping, technological evolution (e.g. the develop-ment of the 45’ high cube/pallet wide containers), ongoing conversionof cargoes to containerisation, etc. have also contributed to the increase
In Search of the Link between Ship Size and Operations 441

in container vessel scale. The economies of scale definitely form themain variable. But, without any doubt, the interaction between allfactors plays a very important role in this upsizing movement.
Optimal (Ship) Size
In general, micro-economic theory links the size of a company toefficiency; that is to say, a size that minimises average long-run costs.Furthermore, the size of a business depends on the market that it is in. Ifdemand is not sufficiently great, it is not possible to produce at theminimum efficiency level, even if it is technologically possible to takeadvantage of the economies of size.
Another approach refers to economies of scale, which are predomi-nantly of a technical nature and which determines the optimal size ofthe firm (Baumol, 1982). However, organisational factors also have aninfluence on the optimal size, possibly creating diseconomies of scale,and thus changing the optimal size of the firm. Consequently, thebalance between the predominance of economies of scale and thepredominance of diseconomies of scale determines the optimum size ofa company.
Size, a common denominator for ships expressing type as well ascapacity (TEU), is singled out as the most important design variable oranalytical tool for liner service optimisation.
Before the 1970s the theory was to use the largest ship possible thatcould be accommodated at both origin and destination ports (Heaver,
Market
trend towardslarger
containerships
Technology- increase in volume of container trade
- alter trading patterns- shift from owner ship towards longterm chartering of new tonnage
- growth of the trade with Asia
- ongoing conversion of cargoes to containerisation
- development of 45' high cube/palletwide containers
- introduction of containerisation- no technical limitations to build larger ships
- construction of adjusted port to shore infrastructure- increased implementation of IT-applications
Shipper/customer (Port) authorities
- environmental reasons- development of megaports- port access
- ongoing deregulation- spatial logistics
- the move to individual and confidential service contracting
- increasing demand - greater reliability at lower total cost - global accounts
Terminal operatorsCarrier
- the capabilities of terminals to deliver and despatch large consignments of containers and the effectiveness of hinterland linkages
- the ability of container terminals to physically berth such units- the capacity of terminals to load and discharge such vessels within an acceptable time frame
- technical difficulties, e.g. maximum stack height limitations
- competitive nature forces to advance towardsthe next size echelon
- to serve expanding market- formation of alliances
- rationalisation/investment
- permanent strive for cost cutting- search for competitive advantage
Figure 2. Influencing key factors
442 Christa Sys et al.

1968; Van de Voorde, 2005). Since then, the subject of optimal shipsize has received a lot of attention from transport economists (Heaver,1968; Goss, 1971; Kendall, 1972; Jansson & Shneerson, 1982, 1987;Talley, 1990; McLellan, 1997; Lim, 1994, 1998; Cullinane & Khanna,1999, 2000; Stopford, 2004; Imai et al., 2006). Nowadays, we knowthat other determinants, such as volume of trade, length of route,sailing frequency, the number of port calls, etc. also influence ship size.Regarding the number of port calls, an interesting question is: Is thereduction in the number of ports due to the dimensions of the ships ordo liner operators in some cases decide to tailor their ship size to a port/region? The right answer probably lies somewhere in between.
A scan of the literature yields the following definitions:Kendall (1972) describes the optimum size of a ship used on a
particular route as the size which minimises total transport costs. By‘total transport costs’ he does not only mean those costs incurred by theship at sea, but also the related cost of the terminals at either end of thevoyage (port costs � dredging, berthing, . . . , handling costs, storagecosts). This definition already refers to the link with operations, whichwill be explored in Section ‘The Link between Ship Size andOperations’.
According to Jansson and Shneerson (1982), optimal ship size isobtained by trading off economies of size in the hauling operations withdiseconomies of size in the handling operations. In port, handling costsper ton increase with ship size, while hauling costs per ton at sea, on theother hand, decline with size. Talley (1990) defines optimal ship size asthe containership size that minimises the cost per TEU moved pervoyage leg (between two port calls) on a given route. Cullinane andKhanna (1999, 2000) and Stopford (2004) refer in their studiesregarding optimal ship size to economies of scale as the determinantfor optimal ship size.
Previous maritime studies provide an insight into the concept‘optimal ship size’ but exclude from their model the costs linked withcargo handling, shore infrastructure, etc. (Heaver, 1968; Jansson &Shneerson, 1987; Cullinane & Khanna, 1999, 2000). Given the currentexpansion towards door-to-door transportation systems, recognition ofthese costs and their impact on logistic decisions (regarding waitingtime, inventory, etc.) must be considered.
From the point of view of a profit-maximising liner operator, thenotion ‘optimal’ is determined by minimising costs per TEU, given thecurrent and forecasted demand. In the next section it will become clearthat the optimum is rather a segment than a point estimation.Currently, due to technological advances and specialisation, optimalship size on a particular route is equal to the number of containers aline can capture between port A and port B on a weekly fixed-day basis
In Search of the Link between Ship Size and Operations 443

by minimising cost per TEU, at sea, in the port and hinterlandconnection, while still offering the greatest flexibility to liner operatorsin their movement toward logistic providers.
There are many different factors (e.g. number of ports, time in port,distance, etc.) that might determine optimal ship size and manydifferent points of view of what optimal ship size really is. The fact isthat minimising costs per TEU recurs as a crucial element. This pointleads to the question: How can we identify the optimal containership?
The optimal containership size can be found by studying theeconomies of scale in deploying larger vessels. In order to quantifythe economies of scale, this paper uses the liner service cash flow modelof Stopford (2004). This model is based on a transatlantic round-tripvoyage, assuming a hypothetical weekly service frequency, an 8500-mile distance, an average operating speed of 19 knots, seven port callsand a capacity utilisation of 80% outward and 90% return. The modelconsists of two levels. Level one constructs the six components of linerservice costs (viz. service schedule, ship costs, port charges, containeroperations, container costs and administration costs). In the secondstage the calculated costs are used in a cash flow model. The model waslater updated by Notteboom (2000). In addition, he linked the days/portcall with ship size. Stopford’s and Notteboom’s calculations arelimited to ships up to 6500 TEUs.
For an impact analysis of economies of scale, we focus on ship costs,more specific on the unit cost per TEU (expressed in terms of USD/day)by comparing different ship sizes. The unit cost per TEU (USD/day) isdefined in the following way:
Unit cost per TEU (USD=day)
�operating cost (USD=day) � capital cost (USD=day) � bunker cost (USA=day)
ship size (TEU)
Given the increase in container vessel scale, it is most interesting toenlarge the model with �6500-TEU vessels. In this paper the model hasbeen expanded to include ship sizes up to the hypothetical 18,000TEUs. Another novelty in the model is the distinction in costs betweensingle and twin propeller units on ships. The use of single-propellerunits on ships larger than 10,000 TEUs would require progressivelylonger engine rooms to accommodate such installations. Given thecurrent structural implications it has been assumed, in our model, thatultra large containerships are equipped with a twin-propeller config-uration. Ship owners opting for a twin configuration would have to beassured that operating costs would more than compensate for highercapital costs.
Two scenarios were computed. In the cost assessment of container-ships exceeding current sizes, the assumptions of Stopford’s model
444 Christa Sys et al.

were, in a first stage, maintained and extrapolated (s1). Subsequentlythe cost calculation (s2) was repeated taking into account that:
. by the end of 2005, on the transatlantic trade, outward capacityutilisation was 68% and return capacity utilisation was 80% insteadof 80 and 90%, respectively (Drewry Shipping Consultants, 2005);
. the average speed for vessels larger than 4500 is 21.5 knots ratherthan 19 knots;
. the moves per hour/crane are for the first three categories 30 moves/hour/crane, for the next three ship sizes 45 moves/hour/crane and forthe remaining sizes 50 moves/hour/crane as the productivity of newcranes improves;
. the number of cranes increases gradually. In this calculation it isassumed that four cranes will be used for a 6500-TEU vessel, fivecranes for the next two sizes and up to six cranes for the ultra-largecontainer ships (ULCSs); and
. the capital cost is updated.
The data, processed in a standard spreadsheet application, wereobtained from The Drewry Annual Container Market Review andForecast (DSC, various editions) and from interviews with salesmanagers of top 10 liner carriers. The results of both calculations areshown in Table 4.
On closer analysis of the results of the first calculation (s1), we notice� not surprisingly � that savings are achieved by using bigger ships. Theunit cost per TEU drops from 16.59 $/TEU/day for a 1200-TEU ship toabout 6 $/TEU/day for a ship whose carrying capacity is 10 times
Table 4. Results of cost calculation � 2005
Unit cost per TEU (USD/day)
Ship size Calculation 1 Calculation 2
1200 TEU single propeller 16.59 15.102600 TEU single propeller 11.06 �33.33% 10.10 �33.11%4000 TEU single propeller 9.50 �14.10% 8.34 �17.43%6500 TEU single propeller 7.45 �21.58% 6.63 �20.50%7500 TEU single propeller 7.20 �3.36% 6.25 �5.73%8500 TEU single propeller 7.02 �2.50% 5.97 �4.48%10,000 TEU single propeller 6.52 �7.12% 5.63 �5.70%12,500 TEU single propeller 6.02 �7.67% 5.45 �3.20%10,000 TEU twin propeller 7.70 6.6312,500 TEU twin propeller 6.75 �12.34% 6.04 �8.90%15,000 TEU twin propeller 5.97 �11.56% 5.73 �5.13%18,000 TEU twin propeller 5.35 �10.39% 5.35 �6.63%
In Search of the Link between Ship Size and Operations 445

bigger (see Table 4) (1 US$: t 0.64). The rationale for this conclusion isthat unit cost generally falls as ship size increases, because capital,operating and cargo handling costs � key elements in the economies ofscale calculation � do not increase proportionally with capacity. Forexample, a 12,500-TEU ship only costs twice as much as a 5000-TEUship, but carries more than two and a half times as many containers.Further increases in vessel size provide only limited unit cost reduc-tions. Once the 7500-TEU barrier is exceeded, the economies of scalediminish very rapidly, which is in line with the results of the Malaccareport (Wijnolst et al., 1999).
Graphically, the economies of scale curve relates the unit cost perTEU (US$/day) on the vertical axis to ship size (TEU) on the horizontalaxis (see Figure 3). Introducing the distinction between single vs. twin-propeller configuration results in a split economies of scale curve (seethe dotted line in Figure 3).
Comparing the results of the size bracket [10,000 TEUs�12,500TEUs] from a cost perspective, a liner operator will rather opt for asingle-propeller than a twin-propeller configuration. It goes withoutsaying a twin-propeller configuration is more costly (initial cost,maintenance, etc.). But then again, it also has some advantages: (a)the second propeller serves as a spare part; (b) increased manoeuvr-ability; (c) it economises on the number of tug boats, etc.
In the second scenario (s2), Stopford’s assumptions were altered (asabove). The results are also shown in Table 4 (second calculation � s2).The conclusion of the adjusted calculation does not diverge from theconclusion of the first. For the majority of vessel sizes the unit cost per
Figure 3. Economies of scale curve � s1
446 Christa Sys et al.

TEU is lower. Again, the cost falls sharply when sizing up towards4000 TEUs, and in the larger categories the marginal return levels off.The results of both calculations are shown graphically in Figure 4.
The cost curve of the second calculation is situated below the curvesof the first calculation. The marked full line corresponds with ship sizesfitted with a single propeller (i.e. 1200 TEUs�12,500 TEUs), while themarked dotted line shows the cost curve for ships equipped with a twinpropeller (i.e. 10,000 TEUs�18,000 TEUs). The grey colour illustratesthe economies of scale curve of the first calculation (s1), while the blackcurves show the results of the second calculation (s2) for both single(marked full line) and twin propeller (marked dotted line). Bycoincidence, the latter curve overlaps and continues the economies ofscale curve of the first calculation (full grey line), giving the falseimpression that �12,500-TEU ships will be equipped with a singlepropeller. Again the curve becomes very flat and the optimal ship sizeseems to become very large.
When looking to minimise costs, a liner operator should opt for thelargest ship available. But there is far more than this to take intoconsideration.
First, the determination of optimal ship size is undeniably linked tooperational occurrence (see Section ‘Optimal Ship Operations’/‘TheLink between Ship Size and Operations’). Secondly, the port-to-portcost saving will only be achieved if the vessel is fully utilised. Poor slotutilisation can have an impact on carriers’ revenues and lead to lowerprofitability.
Figure 4. Economies in scale curve � s1 & s2
In Search of the Link between Ship Size and Operations 447

Furthermore, the deployment of larger ships will also increase anoperator’s cost base as additional sales and marketing staff may have tobe employed, particularly if new trades are targeted to provide theadditional cargo necessary to load the vessels and if operations arereconfigured.
Eventually, if the additional feeder, transhipment and landsidedistribution costs are taken into account, the cost per TEU willhypothetically increase for 12,500-TEU, 15,000-TEU and 18,000-TEU vessels. The shape of the economies of scale curve (see Figure 4)is likely to change into a U-shaped curve (see Figure 5). If this proves tobe the case, the size bracket [10,000 TEU�12,500 TEU] appears to bethe optimum, under the assumptions that the carrier operates efficientlyand that there is sufficient volume on a particular trade.
This latter assumption cannot be ignored. Returning to the startingpoint, the cost calculation is based on a transatlantic round-trip voyage.The long-term prognosis for this trade, according to Drewry ShippingConsultants, is not very promising, with growth in both directionsforecast to be in the 2 to 2.5% range for the foreseeable future (DrewryShipping Consultants, 2005). Even though a liner operator wants toreduce unit costs (i.e. to achieve economies of scale) and to increaseincome (i.e. to gain greater market power), on the transatlantic tradelane smaller ships will be put in service compared with the other majorline routes (see Section ‘The Link between Ship Size and Operations’).Thus features such as demand, space for future volume growth andcargo imbalances also need to be examined.
Another important issue is the infrastructure needed at ports toaccommodate large ships. The trend toward increased size of contain-erships presents challenges not only for liner operators, owners,
015
0030
0045
0060
0075
0090
00
1050
0
1200
0
1350
0
1500
0
1650
0
1800
0
1950
0
2100
0
TEU
Un
it c
ost
per
TE
U (
$/d
ay)
Figure 5. Interval estimation of optimal ship size
448 Christa Sys et al.

designers and classification societies, etc, but especially for operationalmanagers. This brings us to a discussion of the impact of vessel scaleincrease on operations.
Optimal Ship Operations
Optimal ship operations should be interpreted in a broader sense thanship operational management. Optimal operations include:
. linking economic centres by choosing the right route with the bestnumber of port calls, taking into account the possibilities of feederand hinterland connections;
. a reasonable frequency: this should be interpreted for the lineroperator as, for example, offering a weekly fixed-day service withthe smallest number of ships employed. Setting up a weekly serviceon the Europe-Far East line will require the deployment of seven toeight ships; for the transpacific, five vessels employed is sufficient;
. an efficient agency network;
. a sufficient number of stevedores providing a reliable service;
. good logistical support; and
. acceptable port conditions (i.e. port entry charges � port and canaldues, frequency reduction, pilotage, etc. if applicable, acceptabletime-windows, etc.).
In other words, optimal operations involve all aspects geared towardsminimising cost. The impact of previously listed aspects should beintegrated into the outline of costs (e.g. the impact of frequency onwaiting time cost, inventory cost, etc.) (Witlox & Vandaele, 2005;Blauwens et al., 2006).
Clearly, the central question regarding optimal ship size cannot bestudied without reference to operations. In the decision process, lineroperators take into account potential implications on ports bydeploying ever-larger vessels.
In the past, ports and terminals have responded to size increases bymaking large and rapid investments in infrastructure in order to copewith these new vessel sizes. Until now they could provide whatevercapacity to ensure that the vessel only stayed in port for a brief period.But the movement to the next size echelon has struck terror into thehearts of terminal operators (Stopford, 2002).
Opting for minimisation of the number of port calls (see Section ‘TheLink between Ship Size and Operations’), container shipping alliances,as well as independent lines, put pressure on domestic ports to keepskylines. Moreover, the movement towards larger ships confronts theport authorities with a number of pressing issues with regard to
In Search of the Link between Ship Size and Operations 449
investing in stronger tugs; deepening and/or widening approachchannels, port and turning basins; environmental and regulatoryconstraints; expansion projects; organising traffic (deepsea � shortsea� barges); etc.
At present, the limiting factor is water depth in ports and navigablewaterways. Rumour has it that in future the limiting factor will nolonger be vessel draught but rather vessel length (i.e. turning circle). Anindication can be found in the expansion plans of the BremerhavenBasin in Germany. Extra limiting factors will be air draft, bendingmoment and torsion of the vessel.
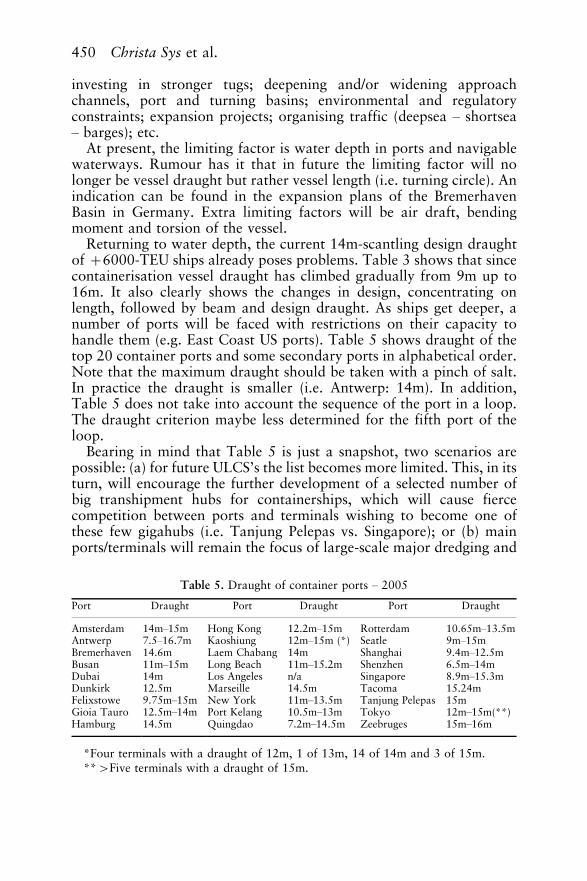
Returning to water depth, the current 14m-scantling design draughtof �6000-TEU ships already poses problems. Table 3 shows that sincecontainerisation vessel draught has climbed gradually from 9m up to16m. It also clearly shows the changes in design, concentrating onlength, followed by beam and design draught. As ships get deeper, anumber of ports will be faced with restrictions on their capacity tohandle them (e.g. East Coast US ports). Table 5 shows draught of thetop 20 container ports and some secondary ports in alphabetical order.Note that the maximum draught should be taken with a pinch of salt.In practice the draught is smaller (i.e. Antwerp: 14m). In addition,Table 5 does not take into account the sequence of the port in a loop.The draught criterion maybe less determined for the fifth port of theloop.
Bearing in mind that Table 5 is just a snapshot, two scenarios arepossible: (a) for future ULCS’s the list becomes more limited. This, in itsturn, will encourage the further development of a selected number ofbig transhipment hubs for containerships, which will cause fiercecompetition between ports and terminals wishing to become one ofthese few gigahubs (i.e. Tanjung Pelepas vs. Singapore); or (b) mainports/terminals will remain the focus of large-scale major dredging and
Table 5. Draught of container ports � 2005
Port Draught Port Draught Port Draught
Amsterdam 14m�15m Hong Kong 12.2m�15m Rotterdam 10.65m�13.5mAntwerp 7.5�16.7m Kaoshiung 12m�15m (*) Seatle 9m�15mBremerhaven 14.6m Laem Chabang 14m Shanghai 9.4m�12.5mBusan 11m�15m Long Beach 11m�15.2m Shenzhen 6.5m�14mDubai 14m Los Angeles n/a Singapore 8.9m�15.3mDunkirk 12.5m Marseille 14.5m Tacoma 15.24mFelixstowe 9.75m�15m New York 11m�13.5m Tanjung Pelepas 15mGioia Tauro 12.5m�14m Port Kelang 10.5m�13m Tokyo 12m�15m(**)Hamburg 14.5m Quingdao 7.2m�14.5m Zeebruges 15m�16m
*Four terminals with a draught of 12m, 1 of 13m, 14 of 14m and 3 of 15m.**�Five terminals with a draught of 15m.
450 Christa Sys et al.
port infrastructure developments to cater to them, while other ports/terminals will need to focus on niches (Fairplay, 2005; Lloyd’s List,2004).
The latter scenario suggests that port and terminal operators musttake action and, moreover, continue to respond by investing interminals and in larger ship-to-shore handling equipment. Takinginto account that the next generation of quay cranes with their evergreater outreach (965m) and lift capacity will cause higher loads onthe wheels, quay walls must be stronger, and this has implications onquay wall construction methods, a serious concern for all containerports (Drewry Shipping Consultants, 2001).
In addition to investment decisions about ship-to-shore equipment,terminal operators are also confronted with an increased quantity ofTEU handling, partly due to their clients’ enormous growth in tonnage.As their clients grew � in tonnage as well as in market power � terminaloperators had to follow, if they wanted to carry on independently fromany shipping line. Terminal operators have to be extremely cost-conscious, as the handling rate remains the principal factor for the lineroperator when selecting a port and an operator. From this point ofview, the advent of ever-larger container vessels necessitates portdecisions regarding the container yard area, higher yard stacking,terminal automation, improved gate system, reduced container dwelltimes, security and safety issues, environmental aspects (e.g. the EUhabitat directive), the depth of berth, etc.
Berth time is an ever more critical aspect. A lot of equipment andwork force are required when such a mega-vessel arrives. Can aterminal handle these ships cost-effectively? Will the handling costremain relatively constant? Over time as vessel size increased, berthproductivity (moves/vessel/hour) became ever more important toguarantee that vessels could adhere to their sailing schedule. Theoperating system enabling these high productivities is the so-called‘direct straddle carrier system’. A fully automated yard managementand operation planning system is necessary to exploit the potential ofthe straddle carrier. Terminal operators also need to consider decisionsregarding new IT and communication systems, Internet applications,etc. with regard to this operating system.
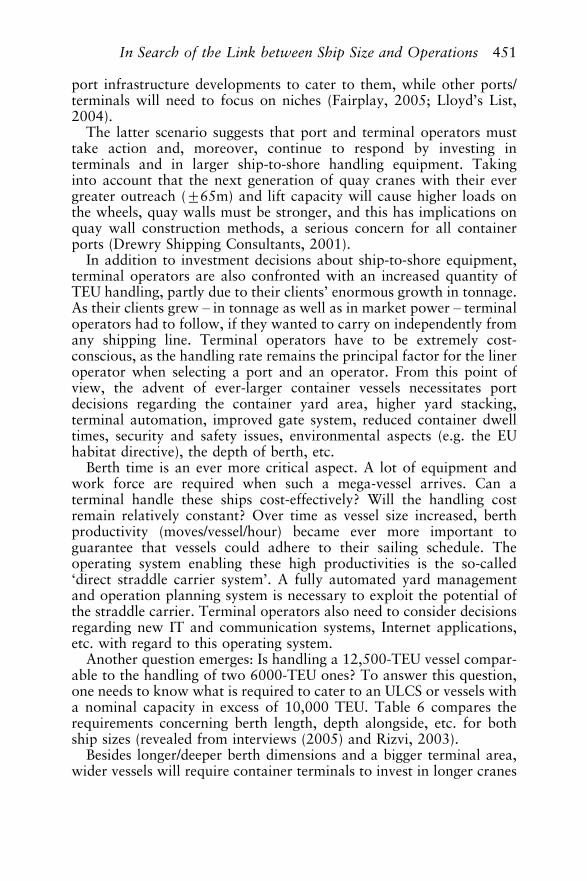
Another question emerges: Is handling a 12,500-TEU vessel compar-able to the handling of two 6000-TEU ones? To answer this question,one needs to know what is required to cater to an ULCS or vessels witha nominal capacity in excess of 10,000 TEU. Table 6 compares therequirements concerning berth length, depth alongside, etc. for bothship sizes (revealed from interviews (2005) and Rizvi, 2003).
Besides longer/deeper berth dimensions and a bigger terminal area,wider vessels will require container terminals to invest in longer cranes
In Search of the Link between Ship Size and Operations 451
that can handle �20-container-wide vessels. The main aspect is ratherthe number of gantries (or port cranes used to load and dischargecontainers from vessels able to be positioned by moving along railtrack) and straddle carriers (or wheeled vehicle designed for loadingcontainers onto or unloading them from a trailer, and carrying them toand from a stacking area, Port Glossary) a terminal operator must haveat its disposal when a large ship arrives. An excess of terminal handlingequipment will jeopardise the overall cost-effectiveness. Furthermore,practise teaches us that the capacity/crane is not the constraining factor;it is rather the system bringing the containers under the gantry cranethat plays a key role in the productivity of handling a ship. Dependingon the clauses stipulated in the terminal contract, three to five containercranes are used simultaneously for one 6000-TEU vessel. Up to sixcranes have to be put into action to load/unload a �12,500-TEU ship.These vessels have to be served in the shortest possible time (typicallyless than 24 hours, depending on the volume of the cargo). At the sametime operations on other vessels must not be hampered by a lack ofequipment due to the operations on the ULCS. More and fastercontainer handling is necessary just to keep up with vessel upsizing;otherwise extended port time will destroy the rationale for bigger ships.Thus ship size has a number of effects on container operations.
Whereas, the beam or the number of rows of containers affects theoutreach of cranes, the length of ships influences the quay length. Givena quay length of 1000m, two ships of 6000 TEUs can be catered to atthe same time. In future a 12,500-TEU ship and, say a 6000-TEU shipcan easily be put into action alongside such quay length. Consequently,this will require a significant increase in productivity of terminals.
When dimensions and capacities of the equipment are considered, theimpact of the ULCS on the terminal is rather minor. Vessel size has noinfluence on terminal transport equipment and stacking area design.But what about the size of the terminal? The parameter ‘size’ is lessimportant, because a containership hardly unloads all its containers inone port. The impact difference between 2x6000-TEU vessel deploy-ment and a 12,500-TEU will be determined by the hinterland (offtake
Table 6. Terminal requirements
6000 TEU 12,500 TEU
Berth length 350m 450mDepth alongside 14m 15.5�16.0mApproach
channel depth14m 18.0�19.0m
Terminal area 16.0 ha per berth 22.5 ha per berthGantry cranes 45m outreach/45 cycles per hour 63m outreach/45 cycles per hour
452 Christa Sys et al.

of the containers) and whether or not the terminal is a dedicatedterminal, rather than by the size of the terminal. Port operations willnot be a bottleneck for their deployment, provided large terminals arecalled at. However, it seems likely that hinterland connections arebecoming a significant factor, as a consequence of the move towards adoor-to-door transportation system.
In order to maintain acceptable container line schedules and tocompete successfully with smaller container ships, main liner operatorsare becoming more and more involved in extended partnerships withterminal operators. The huge scale of investment required for containerhandling operations favours these closer relationships. Besides infra-structure, operational managers are confronted with other issues, such as:
. the lobby of environmental groups against competitiveness andgrowth of large terminals;
. the containership loading problem;
. lack of qualified people;
. 24/5 or 24/7 availability of the customs office depending on thecountry;
. hinterland transportation operations; and
. direct service vs. the trend towards hub-and-spoke operations. A hubis the central transhipment point in a transport structure, to whichtraffic from many ports is directed and from where traffic is fed toother areas/ports (referred as spokes). Given the growing importanceof transhipment, 12,000 TEU capacity will most likely be deployedbetween hubs. Note that the trend towards hub-and-spoke opera-tions is located in the East-West trade, and less in the North-Southtrade. Moreover, it does not exist in the African trade.
Until now, the trend in the East-West Transpacific trade has been tocall direct at as many ports as possible in different loops. In Europe, thebiggest ships generally call at two or three Mediterranean ports andaround four in the North-West of the continent. The advantages arethreefold, keeping transit times and roundtrips as short as possible,limiting expensive feeder operations only to outports and finally,allowing the shipper the advantage of direct port calls. As ship sizecontinues to increase, various studies (Cullinane & Khanna, 2000;Rijsenbrij, 2001; Ham, 2004) forecast that liner shipping companies insearch of cost reduction and faster transit times will reduce the numberof port calls in favour hub-and-spoke global networks, with motherand feeder services integrated to serve the container trade. This upsizingmovement in the main trades creates a corresponding increase in bothnumber and size of feeder vessels. This cascading effect is probably themost important application of scale economies in the container business
In Search of the Link between Ship Size and Operations 453

(Stopford, 2004). However, other questions arise: will the lower slotcost outweigh the higher feeder cost for ships above 10,000 TEUs?Have we already reached the point at which additional feeder andinventory costs outweigh any further savings in slot costs on main linevessels? Tariffs diverge strongly, depending on the destination variablessuch as distance, degree of competition, expensive/cheap ports andsurcharges such as bunkering adjustment factor (BAF), InternationalShip and Port Security (ISPS), etc. One thing is certain: what matters isthe total cost of the network.
Finally, the logistics of the container flow itself will become moreimportant. Are these flows large enough to maintain container-shippingservices with very large ships with a reasonable frequency, knowingthat each container transported requires two others, one in the port oforigin and one in the port of destination?
The Link between Ship Size and Operations
It is obvious that ship size and operations are linked, but towhat extent? After expounding the experience of the sector throughinterviews, considering the cost price of bigger vessels � chartered orowned � and taking into account the operational process, cost-effectiveness will probably not increase by deploying such ships. Thereare three arguments to consider:
First, various studies (Cullinane & Khanna, 1999; Ham, 2004) statethat larger ships will have access to fewer ports due to the limiteddraught of the ports (see Section ‘Optimal Ship Operations’). Thenumber of port calls by the post-Panamax vessel will be reduced as longas the additional costs for feeder and intermodal connections are lowerthan the savings from fewer port calls. However, currently this is hardlythe case for ship sizes up to 9700 TEUs calling at North Europeanports. For example, an analysis of the CMA CGM’s French Asia Line(FAL) tells us that in 2006 this liner operator gradually replaced the6500-TEU ships by new ones with a capacity of 8450 TEUs with thesame port rotation (Shanghai, Ningbo, Yantian, Hong Kong, PortKelang, Suez, before calling at Malta and continuing to Le Havre,Rotterdam, Hamburg, Zeebrugge and Southampton) (see Table 7)(Compagnie Maritime d’Affretement � Compagnie Generale Maritimeabbreviates to CMA CGM). Starting in July 2007, the number of portcalls in this service increased (�4).
Since August 2006, eight vessels of 9400�9600-TEU capacity havebeen deployed on the Far East liner service (FAL2) with the lineroperator China Shipping Container Line (CSCL). The port rotation isNingbo, Shanghai, Yantian, Hong Kong, Port Kelang, Le Havre,Rotterdam, Hamburg, Zeebrugge, Port Kelang and back to Ningbo.
454 Christa Sys et al.

With the launch of the FAL2 Malta (12m average draught), South-ampton (with a 12.6m channel depth) and the ports in the Arabic Gulfwere excluded from this rotation. Under the denominator of providingoptimum port coverage, FAL 4 (July 2008) and FAL 5 (October 2009 �11,000 TEUs) are added to the existing FAL network, linking Asia andEurope (FAL1, FAL 2 & FAL3). The launch of the new service, FAL5will coincide with the process of enlargement, since CMA CGM will inthe same year take entities of 11,000 TEUs into service.
Knowing that on the world’s densest maritime routes nearly all mainports are considering expansion plans, we assume that for thedeployment of �10,000-TEU ships a revision of major loops willresult in a reduction in the number of port calls. This trend by no meanscomplies with the preferences of shippers who favour more ports, more
Table 7. Overview French Asia Line (FAL)
French Asia Line
Service name FAL1 FAL2 FAL3 FAL4 FAL5
Year jan/06 jul/06 jul/07 aug/06 jul/08 oct/09
Vessel type 6500
TEU
8450
TEU
8450
TEU
9400/9600
TEU
6400/6700
TEU
9700 TEU 11,000 TEU
Port call
Beirut �Chiwan � �Dalian �Hamburg � � � � � �Hong Kong � � � �Jeddah �Khor Al Fakkan �Le Havre � � � � �Malta � � �Nansha �Ningbo � � � � �Port Kelang � � � � �Qingdao �Rotterdam � � � � � �Shanghai � � � � �Southampton � � � �Suez � � � �Tiajin Xingang �Xiamen � �Yantian � � � � � �Zeebrugge � � � � � �
Number of ports 12 12 16 10 11 8
Cooperation 50�50
China
Shipping
Container
Line
(CSCL)
50�50
China
Shipping
Container
Line
(CSCL)
In Search of the Link between Ship Size and Operations 455

routes, shorter transits, greater frequency and all this with a lowerfreight rate. Economies of scale are the driving force behind the trend ofcontainerships calling at a limited number of big ports. This policy will,therefore, increase transhipment costs as well as the risk of longertransit time for containers that have to be transhipped and relayed,whether by feeder vessel or overland. But how long will carriers be ableto follow a strategy of restricting the number of entry ports into Europeto provide opportunity for consolidated freight flows? And what aboutthe impact on service levels? Or are shippers pleased with a lowerfreight rate for slow moving containers?
Second, not all terminals are dedicated terminals. To unload suchlarge ships three to five gantry cranes are required. Dedicated terminalswill organise the process of unloading so that a ship can leave the portas quickly as possible. But will other terminals have the same strategy?Will they only concentrate on the big ships or not?
Third, containerships with higher container capacities have to sail athigher speeds than those with lower capacity, because they need moreport time. This is the reason why ship speed is of such enormousimportance to large container ships. An hour’s time loss in port wouldrequire on average a four-knot increase in transit speed to meet thescheduled arrival time. The very large single-propeller containershipscannot reach the required service speed with their current main engines.Large ships, certainly those above 12,000 TEUs, will need twinpropellers, and this will logically increase maintenance and fuelconsumption. Fuel consumption rises exponentially with increasedspeed. A rule of thumb: a 10% increase in speed results in about a 30%increase in fuel consumption (www.prads2004.de).
Furthermore, there are financial implications. A ship with a capacityof 10,000 TEUs only has a reduced slot cost with the assumption thatthe capacity is fully utilised. It is clear that these ships will be deployedon the Far East trade (Far East � Europe route and Far East � USAroute). Knowing that to exploit a route on the Far East, a liner operatorneeds seven to eight ships for a weekly service and the capital cost of a10,000-TEU ship is about US$ 130 million (end 2005), it is quiteobvious that only the main liner operators will be able to finance suchships.
Nor can the loading problem be ignored. A liner operator cannotoperate a loop with one loading port and one discharging port. If thiswere the case, a weekly service would be impossible because thepresence of more than one ship at the terminal would hinderoperational speed. Imagine a loop with three loading ports and threedischarging ports. Will it be possible to load a ship with a huge numberof containers in each loading port and to discharge the containers in theright discharging port without repositioning containers on the ship or
456 Christa Sys et al.

by way of the quay? And what will be the projected cost ofrepositioning? Moreover, how will a liner operator fill ULCS notonce but with a reasonable frequency, preferably weekly? And will theship in that first discharging port be expected to take in additionalcargo for the next destination in order to keep it at full chargingcapacity?
These arguments confirm the link between ship size and operationsand also confirm that ship size influences operations, creatingdiseconomies of scale (e.g. increased cost of transhipment, . . .). It isobvious that (optimal) ship size goes hand in hand with (optimal)operations. This brings us to the question: Is there an optimal ship size?
Until the mid-1980s, size was limited by the dimensional constraintsof the Panama Canal (length 294 m and width 32 m), which stronglyinfluenced the development in containership size. For a long time themarket levelled off at the maximum ship size of 4500 TEUs. This wasundoubtedly the reason why this was labelled as ‘optimal ship size’ formore than a decade. Note, due to technological reconfiguration, thecapacity of new Panamax vessels is pushed above 4500 TEU � the so-called high capacity Panamax vessels. In future the planned expansionof the Panama locks will definitely cause another revolution in theglobal liner shipping industry and eliminate the distinction betweenPanamax and wider-than-Panamax vessels.
The 2003�2006 ordering craze has fuelled speculations on futureship size. CEOs of big carriers give different statements. CMA CGMindicates 9500 TEUs as the optimal ship size. According to themdeploying such ships is the best strategy without reducing the numberof ports (www.cmacgm.com). This trend towards ever-larger vessels isnot followed by all top 25-carriers. APL, CSAV/Norasia, PIL, Wan Haiand ZIM do not (yet) have ships larger than 7500-TEU vessels onorder. Will this be the optimal strategy or will they jump immediatelytowards �10,000-TEU vessels?
Clearly ‘the’ optimal ship size does not exist. It will evolve accordingto transport segment (deep-sea vs. short-sea shipping, SSS), terminalconcept, trade lane and technology. These parameters � or four T’s �are taken into account. First, a distinction is made between terminalswhich operate solely as transhipment hubs (e.g. Gioia Tauro, Algeciras,etc.) and other terminals, where hinterland throughput plays animportant role (e.g. Antwerp, Rotterdam, Hamburg, etc.). Hubterminals will be marked by operational activities focused on thequayside area, whereas other terminals will focus more on backyardarea or even both. Second, the determination of optimal ship sizecannot be studied separately from a trade route (volume, portaccessibility). Container business covers a spectrum of different trades.There are about 1500 liner routes. The industry divides the trade routes
In Search of the Link between Ship Size and Operations 457

into three groups: East-West trades, North-South trades and intrar-egional cargo. The different routes are marked by a different volumeand therefore the global liner operator requires a portfolio of differentship sizes. Ultimately, as larger ships enter the market, a shift towardsthese ships can be expected, as they are more cost-effective withreference to the routes.
Table 8 gives an overview of the optimal ship size with theparameters of transport segment, type of terminal, trade lane, andphasing-up of larger ships. This overview is based on the results ofSection ‘Optimal (Ship) Size’ and on extrapolation of the demand, costand technology parameters. At present neither 15,000-TEU nor18,000-TEU ships have been built, but for the purpose of the presentstudy we are already simulating the consequences of their existence.Since preparations to widen the Suez Canal have already begun, thearrival of those ships in the next 10 years is a serious possibility.Undoubtedly, this ship size will be the minority in the fleet portfolio ofthe main liner operators.
Assuming that the main liner companies will continue to invest inlarger tonnage, the size of a typical container ship on the Europe-Asiatrade lane will shift first towards vessel sizes varying between 7500TEUs and 12,500 TEUs. Within the portfolio of the fleet, one expectsthat the number of vessels varying between 7500�9500 TEUs will formthe majority (read: be the optimal ship size segment). The vessels will bepowered by a single propeller and will offer operators, compared to a4500-TEU ship, potential cost savings of about 35% (see Section‘Optimal Ship Size’). It is likely that the upcoming giant container shipswill be single-propeller vessels. Due to economic reasons twin-propellervessels are currently not competitive (i.e. increased maintenance, fuelconsumption, . . .). By 2012, the largest ships on the Europe/Asia/Europe and the transpacific trade lanes will be 15,000-TEU twin-propeller, rising to 18,000 TEUs. Few vessels of the future Panamaxsize, which will be able to load at least 22 containers across the weatherdeck, will enter service during the latter part of this decade, once theports/terminals operating companies have made the necessary invest-ments in new equipment (cranes, . . .), berths, etc. to handle them. Ever-larger vessels will most likely constitute a minority within the fleetportfolio.
The optimal ship size will be found around 12,500-TEU capacity.This vessel does not only offer economies of scale, but also environ-mental benefits (reduced emissions, improved fuel consumption, etc.).In the long run, optimal ship size will probably shift towards the12,500�15,000-TEU segment, taking into account the expected growthof China and India. The same trend is expected for the transpacifictrade. The last main trade, though not the least important, is the
458 Christa Sys et al.

Table 8. Optimal ship size linked to optimal operations
Transport segment Deepsea SSS
Terminal type Hub�hinterland Hub
Trade lanes Main trades Other
Technology Eu/Asia/Eu Intra Asia Transatlantic Transpacific North/South
2005 � up to 10,000 TEU 7500�9500 1000�1500 3000�5500 7500�9500 1500�3000 7500�12,500 15002012 � up to 15,000 TEU 10,000�12,500 1500�3000 3000�5500 10,000�12,500 3000�4500 7500�15,000 3000�2012 � up to 18,000 TEU 12,500�15,000 1500�3000 4500�6500 12,500�15,000 5500�6500 7500�18,000 4500
InSearch
of
the
Lin
kbetw
eenSh
ipSize
and
Operatio
ns
459

Intra-Asia trade. The smaller ports in this region are fed with vessels upto a capacity of 1500 TEUs. Given the increased volume, optimal shipsize will gradually increase. A noticeable trend is the takeover of thistrade by the main liner operators. Recently two feeder operators havefiled a petition of bankruptcy.
The transatlantic trade is quite another story. Most of the reflectionsconcerning future seaport development depend heavily on estimationsof future demand for freight transport, a major element. Generally, thedemand is expected to grow continuously. But, as cargo volumes on thetransatlantic route evolve at a slower pace and no real durable growthmargin is noticeable, the optimal ship size is currently situated in therange between 3000 and 5500 TEUs, according to the deployed shipsizes. In line with the trend on the other two major trade lanes andunder the assumption of sufficient volume, the optimal ship size for thetransatlantic route is expected to be located in the 4,500�6,500-TEUsegment by 2012.
Other trades will be served with smaller ship sizes. The mainconstraints here are trade volume and port accessibility. On theNorth-South routes, the optimal ship size today is about 3000 TEUs.Hamburg Sud, a major player on these routes, started deploying shipswith a capacity of 5500 TEUs. According to them this capacity is theoptimal ship size for this trade, taking into account the volume of tradeand especially the accessibility of ports in South America. These ‘truegiants’ (e.g. the Monte Rosa, a 5500-TEU container freighter withthe largest reefer capacity) represent the beginning of a new era for theSouth American trade. �10,000-TEU freighters cannot/will not behandled in, for instance, South American ports. Ports on the North-South trade lanes are advised not to invest in large facilities. These portsare facing pressure to upgrade, as vessel sizes on these routes are alsogrowing due to a cascade effect. The optimal ship size will steadily riseto 4500 TEUs followed by a shift to the 5500�6500-TEU segment after2012.
The capacity of a terminal solely operating as a hub port needs toevolve hand in hand with the growth of container ship size. Here thefeeder network gains importance. Consequently, the focus of theoptimal ship size in deep-sea operations will shift towards the optimalship size in short sea operations (SSS).
The existing range of vessels deployed on the intraregional routesdiverges between 1000 TEUs and 3500 TEUs. Here the optimal shipsize is expected to increase repeatedly with �1500 TEUs largely due tothe cascading effect, but also because of the development of hub-and-spoke systems (see Section ‘Optimal Ship Operations’).
460 Christa Sys et al.

Conclusions
The liner shipping industry is an increasingly important and attractivetransport market segment. Nowadays, this industry is marked by(increased) containerisation, globalisation, consolidation, deregulation,rationalisation and (intensified) competition. These have radicallychanged the liner shipping industry and helped to fuel progress towardslarger ships.
The central question of this paper was to analyse the link betweenship size and container operations.
Firstly, this paper dealt with the question of the driving variablesbehind the growth in size of the containership. Evidently, thedeployment of the new generation of container vessels is largely dueto economies of scale which are based on the assumption that a goodutilisation of the larger vessels can be achieved. Scale economies havebeen � and will continue to be � the driving force behind thedeployment of larger container vessels. Neither the desire to maximiseprofit nor the impact of the other variables can be ignored.
Secondly, the economic analysis of the concept of ‘optimal contain-ership size’ was studied, allowing the following conclusions to be drawn:
. the economies of scale curve is rather a split curve (single propellervs. twin propeller);
. for a long time the market levelled off at the maximum/optimal shipsize of 4500 TEUs, while nowadays a shift of the optimal ship sizetowards larger vessel scale is noticeable: economies of scale still existfor �8000 TEUs (see Figure 3 � Section ‘Optimal Ship Size’);
. the operating cost (especially feeder cost) and the landside distribu-tion costs should be integrated in the cost model; and
. consequently, the split economies of scale curve will likely turn into aU-shaped curve.
Thirdly, the size of the future post-Panamax ships challenges not onlythe liner shipping companies, but also the ports and terminalsbusinesses. Ports and terminals have responded and still respond tosize increases by making large investment plans. This is the case becausethe main limiting factor is the water depth in ports and navigablewaterways besides the length of the vessel, the airdraft, etc. Further-more, it is quite obvious that the operation of bigger vessels raisesterminal, intermodal and commercial issues.
Finally, throughout this paper it has become clear that (optimal) shipsize and (optimal) operations cannot be studied separately. Bothconcepts develop hand in hand. It has been shown that the determina-tion of the optimal ship size in relation to operations depends on the4T’s-Transport segment; Terminal type; Trade lane; and Technology.
In Search of the Link between Ship Size and Operations 461

Acknowledgements
The authors wish to thank the editor-in-chief for his comments, and acknowledge theanonymous referees for their constructive criticism and helpful suggestions thatcontributed to the overall quality of this paper. All remaining errors are theresponsibility of the authors.
References
Akiyama, A., Horn, G. & Wong, K. M. (2002) Structural design challenges of ultra large container
ships, in: Pacific 2002 International Maritime and Naval Expo & Conference, Sydney,
January 29�February 1.
Baumol, W. (1982) Contestable Markets and the Theory of Industry Structure (New York:
Harcourt Brace Jovanovich).
Blauwens, G., Vandaele, N., Van De Voorde, E., Vernimmen, B. & Witlox, F. (2006) Towards a
modal shift in freight transport? A business logistics analysis of some policy measures,
Transport Reviews, 26(2), pp. 239�251.
Brooks, M. R. (2000) Sea Change in Liner Shipping: Regulation and Managerial Decision-
Making, in a Global Industry (Oxford: Pergamon Press).
BRS (2008) Shipping and Shipbuilding Markets (Neuilly sur Seine: Barry Rogliano Salles).
Containerisation International, various editions (London: Informa Maritime & Transport).
Cullinane, K. & Khanna, M. (1999) Economies of scale in large container ships, Journal of
Transport Geography, 33(2), pp. 185�208.
Cullinane, K. & Khanna, M. (2000) Economies of scale in large containerships: Optimal size and
geographical implications, Journal of Transport Geography, 8(3), pp. 181�195.
Drewry Shipping Consultants (2001) Post-Panamax Containerships � the Next Generation
(London: DSC Consultants).
Drewry Shipping Consultants (2005) The Drewry Annual Container Market Review and Forecast
2004/2005 (London: DSC Consultants).
Drewry Shipping Consultants (2006) The Drewry Annual Container Market Review and Forecast
2005/2006 (London: DSC Consultants).
Drewry Shipping Consultants (2007a) The Drewry Container Market Review � 2006/2007
(London: DSC Consultants).
Drewry Shipping Consultants (2007b) Ship Operating Costs Annual Review and Forecast � 2006/
2007 (London: DSC Consultants).
European Commission (2005) The Application of Competition Rules to Liner Shipping
(Luxembourg: DG Comp).
Fairplay (2005) Port and Terminals Guide � 2005�2006 (London: Fairplay publications).
Fossey, J. (1990) Top 20 Carriers Consolidate, Containerisation International, June, pp. 46�51.
Goss, R. O. (1971) The Economies of Size in Dry Bulk Carriers (London: HMSO).
Ham, J. C. (2004) The feasibility of megacontainer vessels, International Journal of Transport
Economies, Engineering and Law, 25/26, pp. 89�98.
Heaver, T. D. (1968) The Economics of Vessel Size (Ottawa, Canada: National Harbour Board).
Imai, A., Nishimura, E., Papadimitriou, S. & Liu, M. J. (2006) The economic viability of container
mega-ships, Tranportation Research Part E-Logistics and Transportation Review, 46(1), pp.
21�41.
Jansson, J. O. & Shneerson, D. (1982) The optimal ship size, Journal of Transport Economies and
Policy, 16(3), pp. 217�238.
462 Christa Sys et al.

Jansson, J. O. & Shneerson, D. (1987) Liner Shipping Economics (New York: Chapman and
Hall).
Kendall, P. M. (1972) The theory of optimal ship size, Journal of Transport Economies and Policy,
VI(2), pp. 128�146.
Lim, S. (1994) Economies of container ship size: a new evaluation, Maritime Policy and
Management, 21(2), pp. 149�160.
Lim, S. (1998) Economies of scale in container shipping, Maritime Policy and Management, 25(4),
pp. 361�373.
Lipczynski, J., Wilson, J. & Goddard, J. (2005) Industrial Organisation, an Analysis of
Competitive Markets (Essex: Prentice Hall).
Lloyd’s list (2004) Ports of the World � 2004 (London).
McLellan, R. G. (1997) Bigger vessels: How big is too big?, Maritime Policy and Management,
24(2), pp. 193�211.
Notteboom, T. (2000) Logistieke ontwikkelingen in het voorland-achterland continuum
(Antwerp: unpublished PhD dissertation).
OECD Glossary of Statistical Terms, online available http://stats.oecd.org/glossary/ � consulted on
21 June 2008.
Port Glossary, online available http://www.portofantwerp.com � consulted on 21 june 2008.
Rijsenbrij, J. C. (2001) Impact of tomorrows ships on landside infrastructure, TOC2001.
Rizvi, Z. (2003) The containership: How big?, IAPH Conference, Durban.
Stopford, M. (2002) Is the drive for ever bigger containerships irresistible? in: MD Clarkson
research, Lloyd’s List Shipping Forecasting Conference, 26th April 2002.
Stopford, M. (2004) Maritime Economics (London: Routledge).
Talley, W. K. (1990) Optimal containership size, Maritime Policy and Management’’, 17(3), pp.
165�175.
UNCTAD (various editions) Review of Maritime Transport (Geneva, Switzerland: United
Nations).
Van de Voorde, E. (2005) What future the maritime sector? Some considerations on globalisation,
co-operation and market power, in: Kanafani, Adib and Katsuhiko Kuroda (Eds) Global
Competition in Transportation Markets: Analysis and Policy Making, Research in Trans-
portation Economics, pp. 253�277 (Amsterdam, The Netherlands: Elsevier JAI).
Wijnolst, N., Scholtens, M. & Waals, F. (1999) Malacca-Max. The Ultimate Container Carrier
(Delft, The Netherlands: University Press).
Witlox, F. & Vandaele, E. (2005) Determining the monetary value of quality attributes in freight
transportation using a stated preference approach, Transportation Planning and Technology,
28(2), pp. 77�92.
In Search of the Link between Ship Size and Operations 463