in screening dpp-4 inhibitors dipeptidyl peptidase-4 in vitro and in … · 2016-01-26 · 1...
TRANSCRIPT
1
Supplementary Information for
Fluorescent switchable AIE probe for selective imaging of
dipeptidyl peptidase-4 in vitro and in vivo and its application
in screening DPP-4 inhibitors
Yi Wang ab*, Xueli Wuc, Yiyu Chengab, Xiaoping Zhao c*
a College of Pharmaceutical Sciences, Zhejiang University, Hangzhou, Zhejiang, China.b Collaborative Innovation Center for Diagnosis and Treatment of Infectious Diseases, Zhejiang University, Hangzhou, China.
c College of Preclinical Medicine, Zhejiang Chinese Medical University, Hangzhou , Zhejiang, China.
Experimental details
Materials
DPP-4, diprotin A, cytochrome C (CYC), bovine serum albumin (BSA), α-
chymotrysin and lysozyme were purchased from Sigma-Aldrich (USA). Trypsin was
purchased from Solarbio (China). DPP-8 was purchased from Cloud-Clone (USA).
Human serum albumin (HSA) was purchased from TCI (Japan). Collagenase type I, II
and bovine serum (BS) were purchased from Gibco (USA). DMEM medium was
purchased from Corning Incorporated Life Sciences (USA). Proteinase K,
benzophenone, 4-hydroxybenzophenone, TiCl4, tert-butyl bromoacetate, K2CO3 were
purchased from Aladdin. Solid phase synthesis of TPE-Lys-Phe-Pro-Glu (TPE-KFPE),
TPE-Lys-Phe-Pro-Gly(TPE-KFPG), and TPE-Gly-Pro-Asp(TPE-GPD) were
conducted by Shanghai Top-peptide Bio (China). Other reagents without being listed
were used as received.
Electronic Supplementary Material (ESI) for Chemical Communications.This journal is © The Royal Society of Chemistry 2016
2
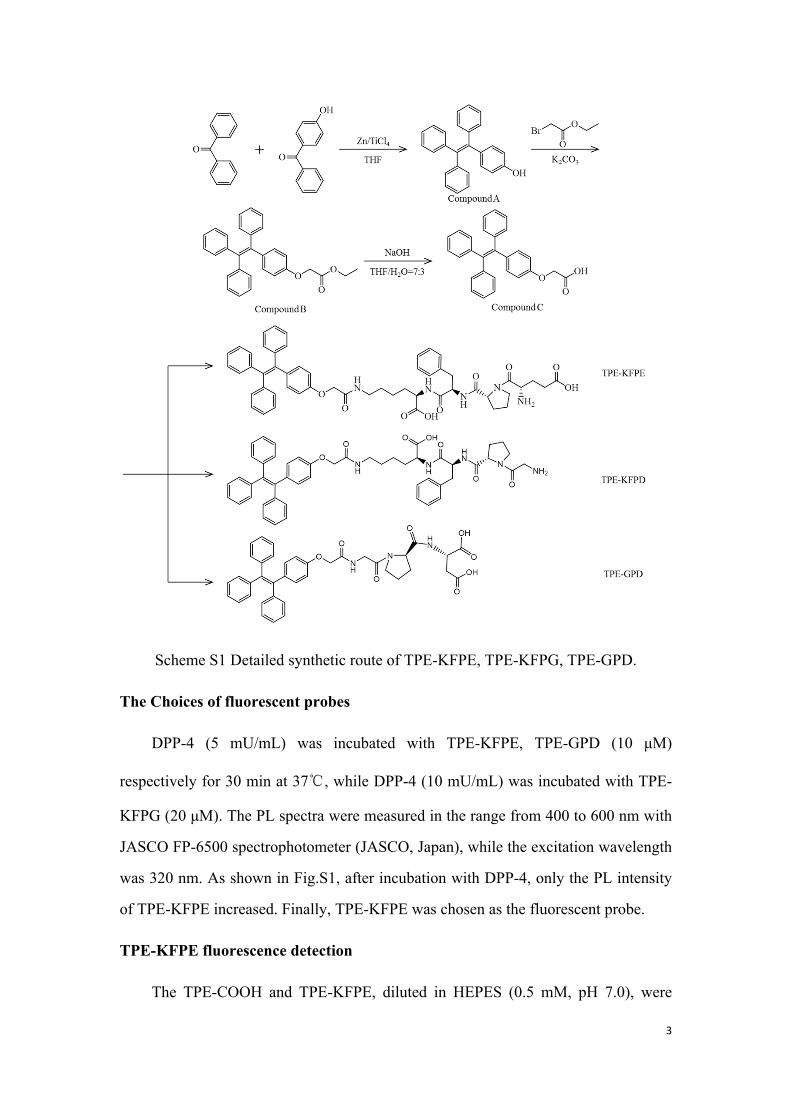
Synthesis of fluorescent probes
First, benzophenone (2.2 g, 12 mmol), 4-Hydroxybenzophenone (1.9 g, 10
mmol), zinc powder (2.9 g, 44 mmol) and tetrahydrofuran (80 mL) were mixed using
magnetic stirrer in a three-necked flask, under an N2 atmosphere. TiCl4 (2.4 mL, 22
mmol) was slowly added drop by drop during stiring at 0 °C. The mixture was
suffered reflux overnight at 85℃. 200 mL CH2Cl2 and 200 mL HCl were added to the
mixture and the organic part of the mixture was extracted. And the solution was
dehydrated by MgSO4, and the solution was removed by rotary evaporator. Then, the
crude product was purified by silica gel column and white solid (Compound A) was
got. Compound A (1 g), ethyl bromoacetate (0.576 g), K2CO3 (0.5 g) and acetonitrile
were added into a flask. The mixture was reflux at 110°C for 24 h. After filtration,
this product was purified by silica gel column and get compound B. Compound B (0.5
g) was dissolved by tetrahydrofuran (28 mL) with 12 mL NaOH solution (4.17 M)
and stirred. After 24 h, through extraction and vacuum distillation, white solid powder
was obtained, which was TPE-COOH (Compound C). TPE-KFPE, TPE-KFPG, TPE-
GPD were synthesized through solid phase synthesis.
To obtain product of enzymatic reaction, DPP-4 was incubated with TPE-
KFPE(10 mg) at 37℃. After 48 h, we got the reaction products of TPE-KFPE
reaction with DPP-4 by centrifugal freeze-drying.
The 1H NMR specta of TPE-KFPE and the product of enzymatic reaction after
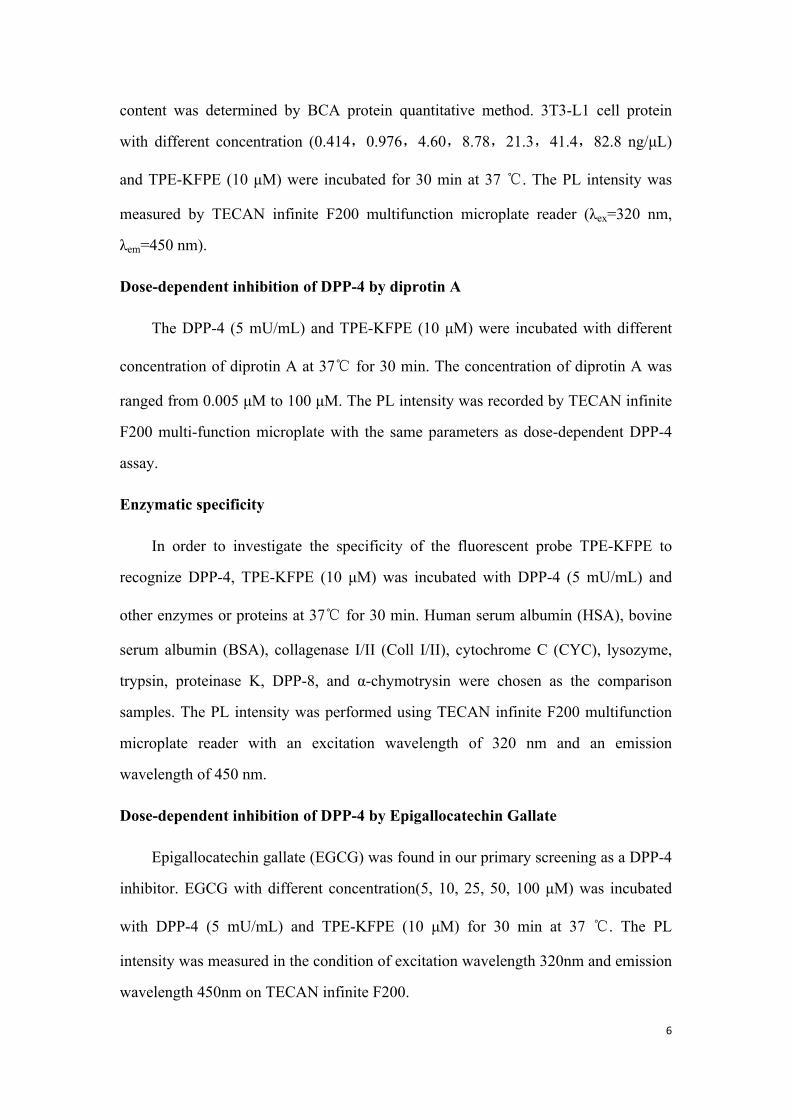
incubated with DPP-4 were shown in Fig.S2. The 13C NMR spectrum of TPE-KFPE
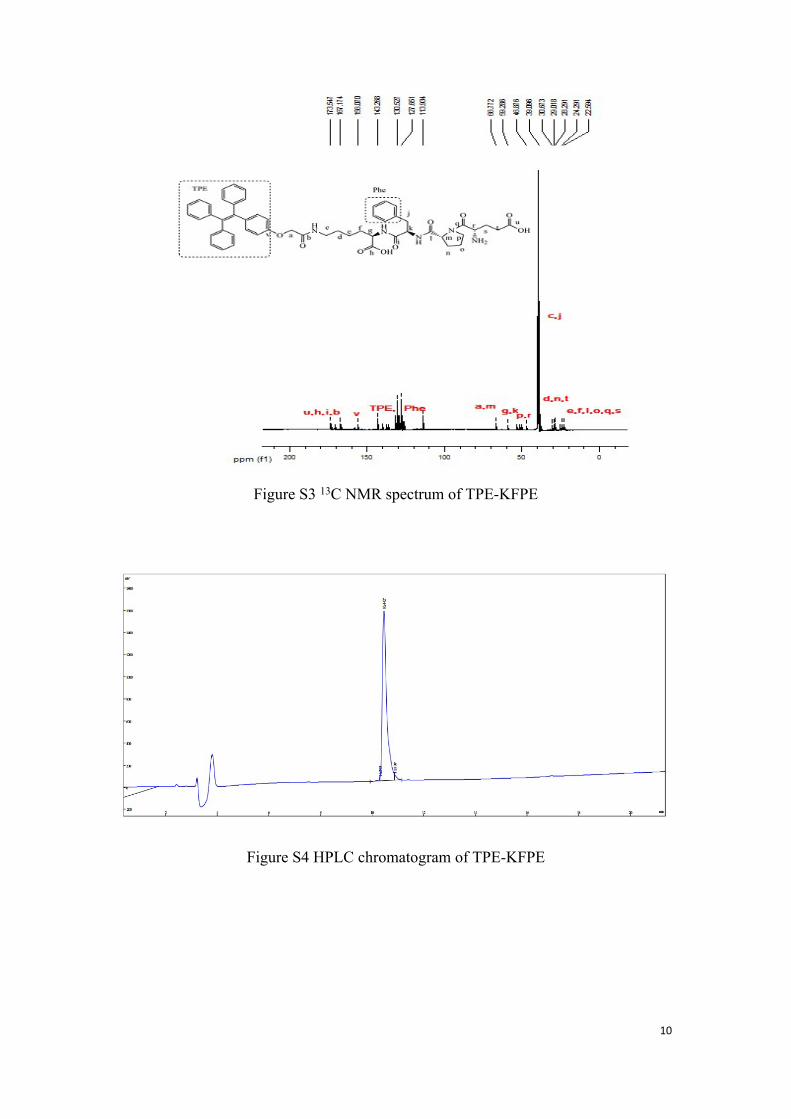
was shown in Fig.S3. The mass spectra of TPE-KFPE and the product of enzymatic
reaction after incubated with DPP-4 were shown in Fig.S7. The HPLC chromatogram
of TPE-KFPE was shown as and Fig.S4.
3
Scheme S1 Detailed synthetic route of TPE-KFPE, TPE-KFPG, TPE-GPD.
The Choices of fluorescent probes
DPP-4 (5 mU/mL) was incubated with TPE-KFPE, TPE-GPD (10 μM)
respectively for 30 min at 37℃, while DPP-4 (10 mU/mL) was incubated with TPE-
KFPG (20 μM). The PL spectra were measured in the range from 400 to 600 nm with
JASCO FP-6500 spectrophotometer (JASCO, Japan), while the excitation wavelength
was 320 nm. As shown in Fig.S1, after incubation with DPP-4, only the PL intensity
of TPE-KFPE increased. Finally, TPE-KFPE was chosen as the fluorescent probe.
TPE-KFPE fluorescence detection
The TPE-COOH and TPE-KFPE, diluted in HEPES (0.5 mM, pH 7.0), were

4
prepared with 10 μM respectively. The PL spectra were measured in the range from
400 to 600 nm with JASCO FP-6500 spectrophotometer, while the excitation
wavelength was set at 320 nm.
Enzymatic fluorescence and diprotin A inhibition
To ensure the enzymatic reaction of DPP-4 hydrolyzing the probe, 5 mU/mL
DPP-4 was incubated with 10 μM TPE-KFPE for 30 min at 37℃ in the presence or
absence of inhibitor diprotin A (5μM). For LC-MS analysis, 10 mU/mL DPP-4 was
incubated with 50 μM TPE-KFPE for 30 min at 37℃ in the presence or absence of
inhibitor diprotin A (5μM). The PL spectra were measured from 400 to 600 nm with
JASCO FP-6500 spectrophotometer (JASCO, Japan), while the excitation wavelength
was set at 320 nm. Finnigan LCQ Deca XPplus ion trap mass spectrometer (Thermo
Finnigan, USA) was used for LC-MS analysis. The parameters of LC-MS analysis
were as follows: nebulizing gas, high purity nitrogen (N2); collosion gas, high-purity
helium (He); ion spray voltage: -3 kV; capillary temperature: 350℃; capillary voltage:
−15 V; mass range: m/z 100−1500. The LC-MS method was applied with a reversed-
phase Zorbax SB-C18 analytical column (250 mm × 4.6 mm I.D., 5 μm, Agilent
Technologies, USA) by a gradient elution using 0.1% (v/v) formic acid (A) –
acetonitrile (B) as the mobile phase 0 min (70% A)→5 min (70% A)→35 min (25%
A)→45 min (5% A). The flow rate was 0.6 mL/min.
Optimal pH of HEPES buffer
In order to determine the optimal pH of HEPES buffer (0.5 mM), DPP-4 (5
mU/mL) was incubated with TPE-KFPE (10 μM) for 30 min at 37℃ in HEPES buffer
with pH 4.0, 6.5, 7.0, 8.2, and 10.0 respectively. The PL intensity was immediately
measured by TECAN Infinite F200 Multi-function microplate (Tecan, Austria) with
the parameters: excitation wavelength 320 nm, emission wavelength 450 nm. As
shown in Fig.S5, the acidified (pH 4.0) or alkalized solution (pH 10.0) led to the
5
invalid assay. The solution with pH range of 6.5 to 8.2 can produce appropriate
fluorescent signal.
Optimal concentration of HEPES buffer
To explore the optimal concentration of HEPES buffer, DPP-4 (5 mU/mL) was
incubated with TPE-KFPE (10 μM) for 30 min at 37℃ with different concentration of
HEPES buffer (pH 7.0). The concentration of HEPES buffer was ranged from 0.1 mM
to 50 mM. The PL intensity was performed using TECAN Infinite F200 multifunction
microplate reader with an excitation wavelength of 320 nm and an emission
wavelength of 450 nm.
Enzyme kinetics assay
TPE-KFPE (10 μM) was incubated with/without DPP-4 (5 mM/mL) at 37℃.
The PL intensity was immediately measured by TECAN infinite F200 Multi-function
microplate (excitation wavelength 320 nm, emission wavelength 450 nm). In the
presence of DPP-4, the PL intensity was gradually increasing by the time until the PL
intensity was stable.
Dose-dependent DPP-4 assay
In order to choose the appropriate concentration of DPP-4 in the assay, TPE-
KFPE (10 μM) was incubated with different concentrations of DPP-4 (from 0.1
mU/mL to 20 mU/mL) at 37℃ for 30 min. As shown in Fig.2B, with the increasing
concentration of DPP-4, the PL intensity was gradually increased and more
fluorescent hydrolysate TPE-KF was released. The PL intensity was measured by
TECAN infinite F200 Multi-function microplate (excitation wavelength 320 nm,
emission wavelength 450 nm).
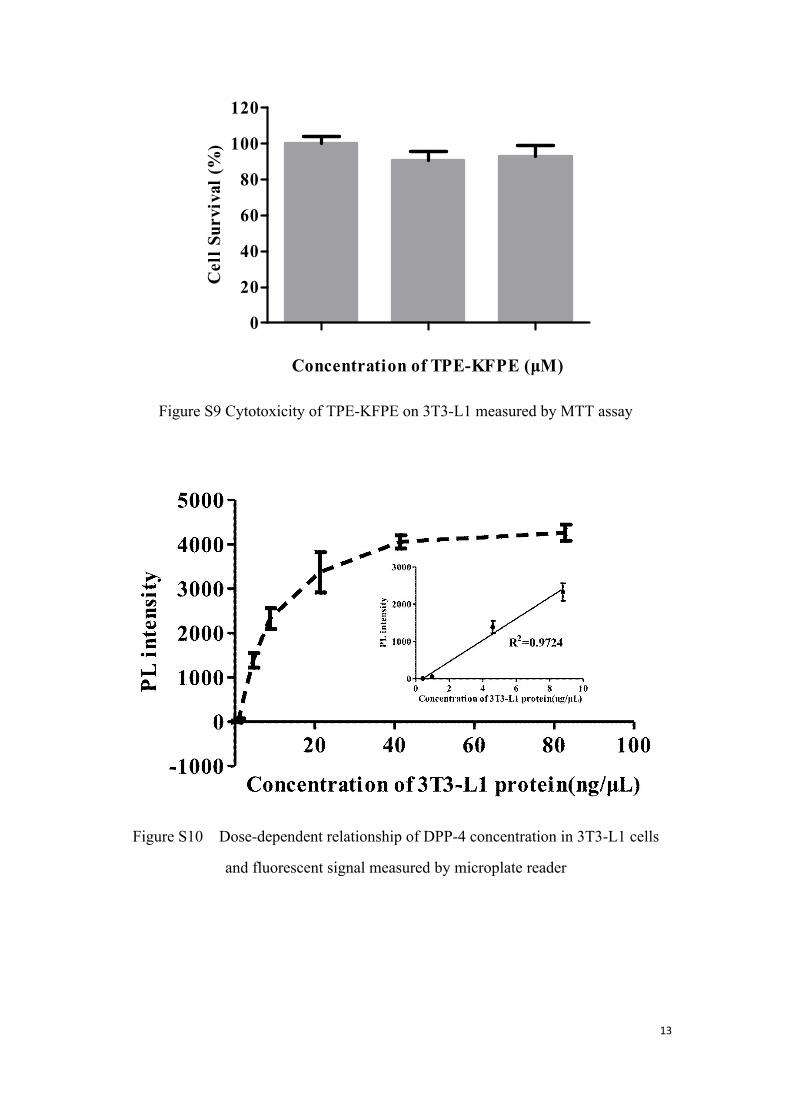
To investigate the linearity of DPP-4 in 3T3-L1 cells, 3T3-L1 (2×10⁶ cells) cells
were seeded in culture dish. After 24 h, cells were washed with HEPES buffer. Cell
protein was prepared from 3T3-L1 by repeated freeze thaw method. The protein
6
content was determined by BCA protein quantitative method. 3T3-L1 cell protein
with different concentration (0.414,0.976,4.60,8.78,21.3,41.4,82.8 ng/μL)
and TPE-KFPE (10 μM) were incubated for 30 min at 37 ℃. The PL intensity was
measured by TECAN infinite F200 multifunction microplate reader (λex=320 nm,
λem=450 nm).
Dose-dependent inhibition of DPP-4 by diprotin A
The DPP-4 (5 mU/mL) and TPE-KFPE (10 μM) were incubated with different
concentration of diprotin A at 37℃ for 30 min. The concentration of diprotin A was
ranged from 0.005 μM to 100 μM. The PL intensity was recorded by TECAN infinite
F200 multi-function microplate with the same parameters as dose-dependent DPP-4
assay.
Enzymatic specificity
In order to investigate the specificity of the fluorescent probe TPE-KFPE to
recognize DPP-4, TPE-KFPE (10 μM) was incubated with DPP-4 (5 mU/mL) and
other enzymes or proteins at 37℃ for 30 min. Human serum albumin (HSA), bovine
serum albumin (BSA), collagenase I/II (Coll I/II), cytochrome C (CYC), lysozyme,
trypsin, proteinase K, DPP-8, and α-chymotrysin were chosen as the comparison
samples. The PL intensity was performed using TECAN infinite F200 multifunction
microplate reader with an excitation wavelength of 320 nm and an emission
wavelength of 450 nm.
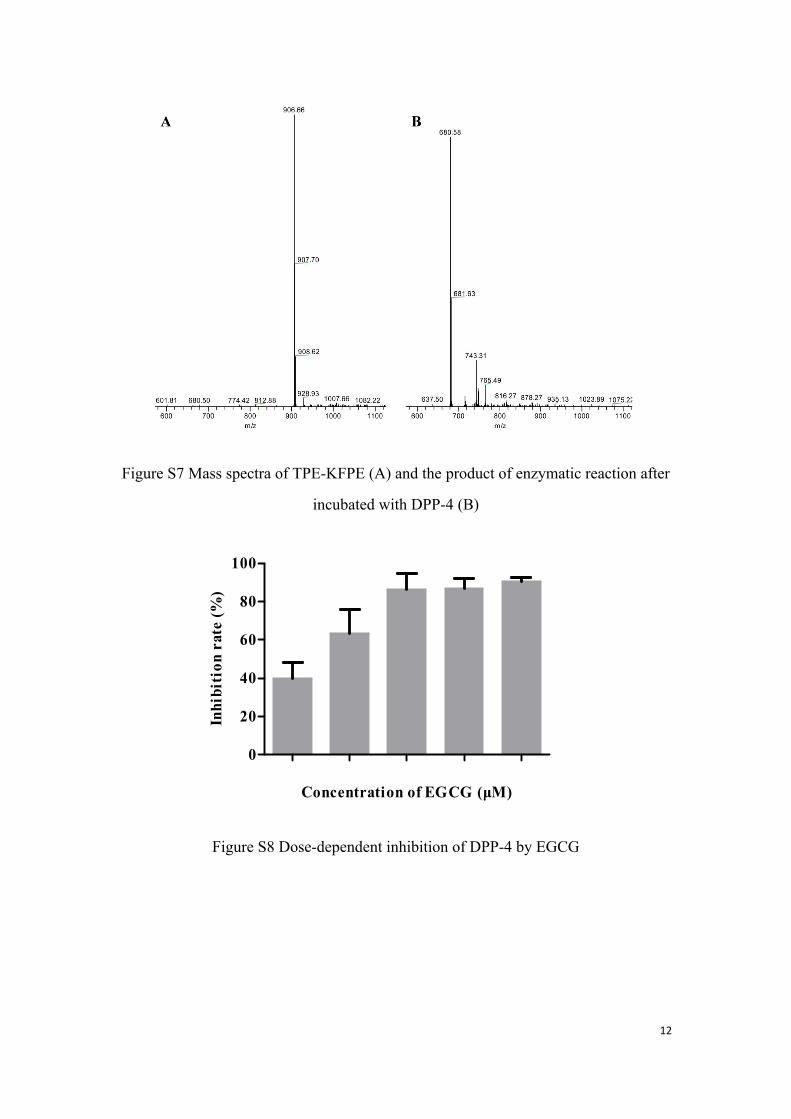
Dose-dependent inhibition of DPP-4 by Epigallocatechin Gallate
Epigallocatechin gallate (EGCG) was found in our primary screening as a DPP-4
inhibitor. EGCG with different concentration(5, 10, 25, 50, 100 μM) was incubated
with DPP-4 (5 mU/mL) and TPE-KFPE (10 μM) for 30 min at 37 ℃. The PL
intensity was measured in the condition of excitation wavelength 320nm and emission
wavelength 450nm on TECAN infinite F200.

7
Cell culture
3T3-L1 preadipocytes were obtained from Cell bank of Chinese Science
Academy, Shanghai, China. 3T3-L1 preadipocytes were grown in DMEM (Corning,
USA) with 10% bovine serum (Gibco, USA), 100 U/mL penicillin and 100 μg/mL
streptomycin (Gibco, USA). Cells were cultured in 5% humidified CO2 atmosphere at
37℃.
Cytotoxicity of TPE-KFPE
3T3-L1 (4×10³ cells/well) cells seeded in 96-well plates were treated with
respective concentrations of TPE-KFPE (10, 30, 50 μM) for 24 h. Cell survival rate
was measured by MTT assay. Absorbance was measured at 580 nm using TECAN
Infinite F200 multifunction microplate reader. As shown in Fig.S9, TPE-KFPE
showed no cytotoxic effect on 3T3-L1 cells.
Cell survival(%) =Absorbance of test sample
Absorbance of control× 100%
Living cell imaging of DPP-4 activity in 3T3-L1 cells using TPE-KFPE
3T3-L1 (1×10⁵ cells/well) cells were seeded in confocal culture dish. After 24 h,
cells were pre-incubated with diprotin A (0.1 mM) for 15 min. Then, the medium was
subsequently replaced by medium contained TPE-KFPE (50 μM) for 1 h. After
incubation, the cells were washed with PBS. Fluorescence images were captured with
60× lens by Nikon A1R laser scanning confocal microscope equipped with 405nm
laser. The fluorescent intensity was calculated by software Image-J, and summed the
total fluorescent intensity of cells from six images.
In vivo imaging of DPP-4 in zebrafish using TPE-KFPE
The zebrafish were chosen 6-7 days post fertilization. Wild type zebrafish was
bred in sea salt water with 1-phenyl-2-thiourea (PTU) at 28.5 ºC. One group of
zebrafish was bred with diprotin A (1 mM) for 24 h. The zebrafish were microinjected
with TPE-KFPE (2.5 mM, 10 nL). After 2 h, the fluorescent images were taken by

8
Leica DMI6000B fluorescent microscope with Andor Zyla cMOS camera (5× lens).
The relative fluorescent intensity was calculated by Image-J. The mean fluorescent
intensity of 6 different samples in each group was calculated. Fluorescent images
were also captured by Nikon A1R laser scanning confocal microscope equipped with
405 nm laser. Optical slices through islet were acquired by moving focal plane (x,y)
along z-axis from the bottom to the top of the islet at 2-μm increments.

9
Figure S1 PL spectra of different TPE-based probes with DPP-4
Figure S2 1H NMR spectra of TPE-KFPE (Stage 1) and the probe after incubation
with DPP-4 (Stage 2)
10
Figure S3 13C NMR spectrum of TPE-KFPE
Figure S4 HPLC chromatogram of TPE-KFPE

11
Figure S5 The (I-I0)/I0 value of probe incubated with DPP-4 in HEPES buffer with
different pH value.
Figure S6 The (I-I0)/I0 value of probe incubated with DPP-4 in HEPES buffer with
different concentration.
12
Figure S7 Mass spectra of TPE-KFPE (A) and the product of enzymatic reaction after
incubated with DPP-4 (B)
5 10 25 50 1000
20
40
60
80
100
Concentration of EGCG (μM)
Inhi
biti
on r
ate
(%)
Figure S8 Dose-dependent inhibition of DPP-4 by EGCG
13
10 30 500
20
40
60
80
100
120
Concentration of TPE-KFPE (μM)
Cel
l Sur
viva
l (%
)
Figure S9 Cytotoxicity of TPE-KFPE on 3T3-L1 measured by MTT assay
Figure S10 Dose-dependent relationship of DPP-4 concentration in 3T3-L1 cells
and fluorescent signal measured by microplate reader
14
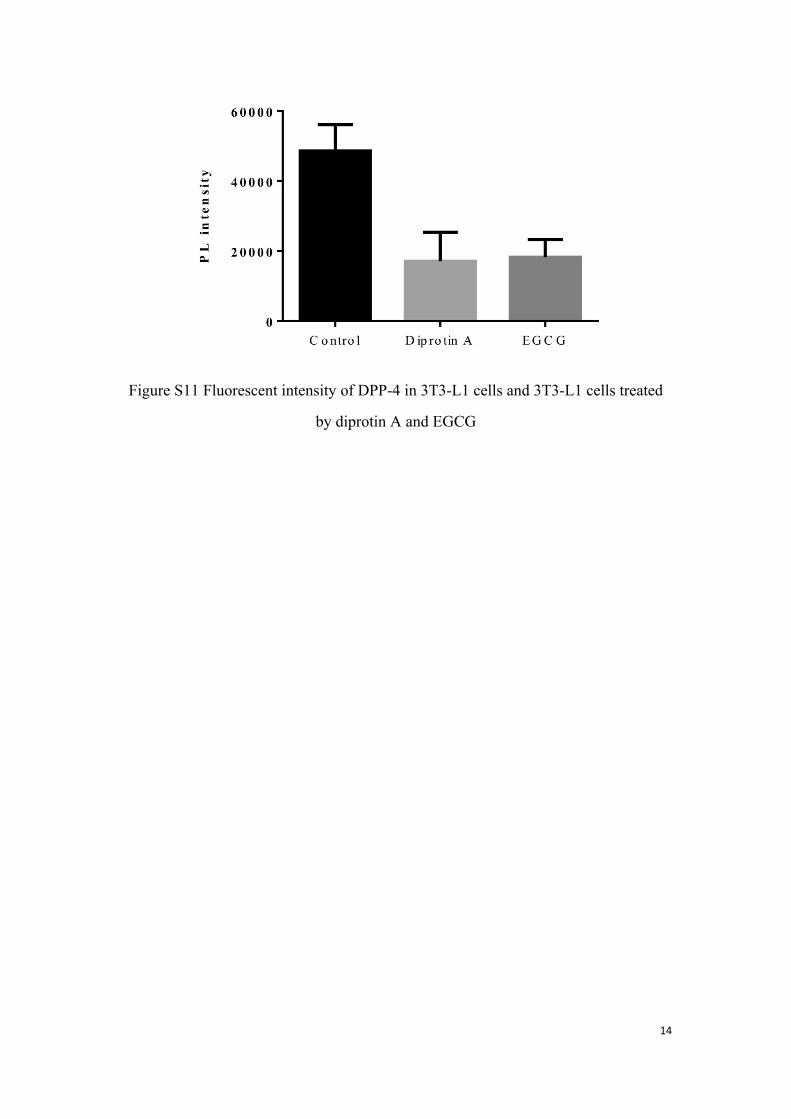
Figure S11 Fluorescent intensity of DPP-4 in 3T3-L1 cells and 3T3-L1 cells treated
by diprotin A and EGCG

15
Figure S12 Representative series of optical sections captured by laser scanning
confocal along z-axis from the bottom to the top of the islet at 2-μm increments
Blank TPE-KFPE Diprotin A0
100
200
300
400
Perc
ent o
f Bla
nk (%
)
Figure S13 Relative fluorescent intensity of DPP-4 in zebrafish and zebrafish treated
by diprotin A