in schools of georgia mid year report performance...
TRANSCRIPT
Communities In Schools of Georgia
Mid‐Year Formative Report
on Race to the Top
Performance Learning Centers
FY2013
Communities In Schools of Georgia
Submitted April 3rd, 2013

Mid‐Year Formative Report on Race to the Top Submitted: April 3rd, 2013 Performance Learning Centers FY2013 Page 2 of 58
Mid‐Year Formative Report
on Race to the Top
Performance Learning Centers FY2013
Overview of the Race to the Top Performance Learning Centers
Communities In Schools of Georgia was awarded a contract by the Georgia Department of Education to develop three Performance Learning Centers as part of the State’s Race to the Top grant. Communities In Schools of Georgia has contracted with the following agencies to fulfill the contract: CIS of Carrollton City/Carroll County, Carrollton City Schools, CIS of Augusta/Richmond County, Richmond County School System, Rome/Floyd CIS and Floyd County School System. The Floyd County and Richmond County Performance Learning Centers opened in August of 2011 and the Carrollton City Performance Learning Center opened in August of 2012.
This mid‐year report provides information on the support and services CIS of Georgia has provided to these three communities in developing their Performance Learning Centers, detail on their progress in implementing the model during the first half of the 2013 year and the results for the students they served during the first semester of the 2013 school year.
Overview of CIS of Georgia Support to Communities in PLC Development
Communities In Schools of Georgia’s Race to the Top (RT3) PLC Team provide training and technical support to lead the local school districts and Communities In Schools staff through the process of developing their Performance Learning Center. The RT3 PLC Team is comprised of the CIS of Georgia Director of Field Support, our field support curriculum & training coordinator, two field support coordinators, the director of evaluation and technology, one evaluation specialist and an evaluation administrative assistant. Each RT3 PLC has been assigned a field support coordinator and an evaluator who is their first contacts for ongoing support in the areas of program development and evaluation/data collection respectively. Formal training opportunities are provided throughout the year, in person and via webinar. Technical support and monitoring of program development take place through site visits, conference calls, email and telephone contacts as needed.
Communities In Schools of Georgia requires that PLC personnel receive and maintain adequate training and/or certification. All PLC staff are expected to understand the PLC model and to work in good faith to implement all its components while utilizing each of the guiding principles to maximize PLC success and achievements. Therefore, it is necessary for each PLC staff member to attend the multi‐day PLC Summer Institute and participate in PLC Roundtables for Academic Coordinators and Services Coordinators twice each year. These formal trainings are also supplemented with webinars and conference calls conducted throughout the school year.
CIS of Georgia field support coordinators and other RT3 Team staff conduct regular site visits to support successful implementation of all aspects of the PLC model, which includes the following components:
Mid‐Year Formative Report on Race to the Top Submitted: April 3rd, 2013 Performance Learning Centers FY2013 Page 3 of 58
Project‐Based Learning – Used to ensure that students engage in all facets of learning. Students develop skills in research methods, writing, use of technology and other forms of media, and collaborating with peers on presentations.
Academic Service Learning – Engages students in service to their communities as a means of enriching their academic learning, promoting personal growth, and helping the students to develop the skills needed for productive citizenship.
Senior Project ‐ The Senior Project is an opportunity for students to demonstrate what they have learned and showcase their achievements. This project must be successfully completed prior to graduation.
Individual Development Plan ‐ Students, in partnership with staff, develop an Individual Development Plan that includes personal, educational, and career goals.
Career discovery – All students participate in career interest inventories, career fairs, and field trips. Guest speakers are frequently invited.
Job shadowing program – 9th and 10th graders may choose two careers to experience.
Internships – 11th and 12th graders may select an internship to prepare for future job search and employment.
Dual enrollment/Post‐secondary option – Students can integrate an associate's degree or a technical degree into the high school diploma track.
Morning Motivation – A daily session designed to establish, maintain, and nurture a positive, safe environment for PLC students to learn, grow, and experience success. Students have the opportunity to lead daily discussions and activities that build applicable presentation and life skills.
Optional Tutorials – Students may voluntarily arrive early or stay after school for tutoring with staff and volunteers.
Charting for Success Advisory Lessons –Charting for Success curriculum guides students through developing a plan of action to continue their education beyond high school. Charting for Success modules address key steps for college and career success. Facilitators provide one‐hour advisory sessions each week with the participation of all students and PLC staff.
Incentives – Each PLC establishes an incentive program that rewards and promotes improvement in attendance, academics, and behavior.
College Preparation – Staff prepares and assists students so that they may take college entrance exams, apply for college and for financial aid, and transition successfully to college.
Mentors – Students are assigned a mentor from the community who works on career development or other areas of interest.
Employment – Staff members connect students to workplace opportunities (e.g., job shadowing, internships, part time jobs, etc.).

Mid‐Year Formative Report on Race to the Top Submitted: April 3rd, 2013 Performance Learning Centers FY2013 Page 4 of 58
Parent/Guardian Involvement – PLC staff members work together with parents/guardians to provide information on their child’s progress, ways they can support their child and the school, and opportunities to voice their comments and concerns.
The field support coordinators provide the academic coordinator (AC) and CIS executive director (ED) with feedback on project and staff performance after each site visit. The field support coordinators also provide advice on the implementation of instructional and non‐academic program components of the PLC model and serve as a link to the district’s central office, PLC network and CIS evaluation department.
Formal Training Opportunities Provided to RT3 PLCs During FY2013
CIS/PLC Summer Network Training 2012
The CIS/PLC Summer Network Training was held June 6th through June 8th for Performance Learning Center staff. The theme for this training was “Mission Possible: Reshaping the Way We Teach and Lead.” Attendees included PLC academic coordinators, learning facilitators, administrative assistants, site coordinators and CIS executive directors from PLC sites statewide. Participants included over 100 staff from PLCs and CIS affiliates, as well as CIS staff and partners.
On Wednesday, June 6th there was New PLC Staff Orientation which covered the basics of PLC operations for any new PLC staff. Thursday’s training was geared towards new and veteran PLC staff, going beyond the basics to explore key issues together and share best practices to make an even bigger impact next year. On Friday, June 8th the keynote address took place, which was given by Bill Milliken, CIS Co‐Founder. The keynote was followed by a CIS/PLC Multi‐Track Training designed as a one‐day drive‐in for all CIS executive directors and site coordinators, in addition to the PLC tracks. A total of 126 PLC staff members, partners, and CISGA staff were served during this event.
Attendees evaluated the Summer Institute based on if the content was relevant to their job, provided knowledge/skills they could apply at their school site, quality of information presented, presentation skills of the trainer, and an overall rating for the session. Across all sessions offered, 99.1% of attendees agreed that the sessions were relevant to their job, with 85.3% answering Strongly Agree. 99.5% agreed that the knowledge/skills provided by the sessions could be applied at their school site, with 81.6% Strongly Agreeing with the statement. 98.4% of respondents rated the quality of the information presented as Good or Excellent, with 80.9% rating it Excellent. The percentage that rated the presentation skills of the trainer as either Good or Excellent was 98.8%, with 83.6% rating it Excellent. 96.9% rated all of the sessions either Good or Excellent, with 80.1% rating them Excellent. Tables of the results of the training evaluations are attached as Appendix A.
Performance Learning Center New Staff Orientation
On October 15th, CIS of Georgia held Performance Learning Center (PLC) New Staff Orientation. This training was designed for new Learning Facilitators and Academic Coordinators who were not able to attend the PLC Summer Training. Newer staff shared their lessons learned and current challenges, asked questions and gained background on the PLC components and learned about proven practices for increasing student success in our unique learning environment. The orientation included a tour of Cobb

Mid‐Year Formative Report on Race to the Top Submitted: April 3rd, 2013 Performance Learning Centers FY2013 Page 5 of 58
PLC and a questions and answers session with their experienced facilitators. The new Richmond County academic coordinator and new learning facilitators from Richmond and Floyd County PLCs were in attendance.
Race to the Top Grant Management Orientations
New CIS executive directors (EDs) and PLC academic coordinators (ACs) were provided with Race to the Top Orientation sessions, held separately at each site. The purpose of these orientations were to ensure that the EDs and ACs were aware of their roles and responsibilities for implementation of the Race to the Top grant. In these sessions, the MOAs were discussed and staff were introduced to required forms and instructed on budgetary reporting procedures and approved expenditures.
Back to School Webinars
At the start of the new school year, two “Back to School” webinars were held to get the PLCs off to a strong start. The training covered planning for the school year and gave PLC staff an opportunity to provide input on the support services they will need in the new school year. Twenty‐two PLC staff members attended the trainings.
Fall PLC Roundtables
PLC Roundtable sessions were held on November 8th at the Marietta City PLC. PLC Staff, CIS Executive Directors and Site Coordinators were in attendance. The meeting included the following topics:
Strengthening the Movement to Increase Student Success in the Local Community presented by Karin Douglas, CIS of Georgia
Overview of Marietta City Schools PLC presented by Tammie Roach, Marietta City Schools
Learning Walk/Tour of Marietta City Schools PLC led by Student Ambassadors
Marietta City Schools PLC Student & Parent Panel facilitated by Shayla Jones, CIS of Marietta‐Cobb County
A Ninth Grade Academy Model to Serve More PLC Students presented by Floyd County PLC and CIS Leaders
Leveraging the PLC Student Survey and CISDM data to Showcase Your Student Performance presented by Linda Kelley, CIS of Georgia
Increasing STEM Funding Opportunities through Strategic Funding Partners presented by Dr. Vickie Perdue Scott
HighPoints Learning Math Tutorial Software to Increase Student Achievement in Math presented by Dr. Vickie Perdue Scott
Brainstorming Roundtables
Twenty‐five PLC staff were in attendance at the Fall Roundtables.
Mid‐Year Formative Report on Race to the Top Submitted: April 3rd, 2013 Performance Learning Centers FY2013 Page 6 of 58
PLC Program Development
In December 2011, Jerry Randolph of Georgia DOE met with several members of CIS of Georgia to review the form used to monitor the PLC Sites’ progress, reviewing and adding an alignment to the Alternative Education Standards.
The RT3 field support and evaluation members worked together to further refine our rubric for PLC program implementation, establishing a developmental timeline for implementation of the components of the model. For each component, expectations were set for the level of proficiency during each semester of the first year, as well as for year 2 and 3 of PLC implementation. This new developmental rubric was first used in site visits from the CIS of Georgia Evaluation team visited in January of 2012. In February and March of 2013, the CIS of Georgia Evaluation Team conducted site visits to each of the RT3 PLCs, with the Carrollton City PLC undergoing its first mid‐year developmental assessment and the Richmond County PLC and Floyd County PLC undergoing their second year developmental assessment.
Summary tables of the assessment results for each of the PLCs by each area of program development can be found on the pages that follow. The assessment coding for each element are shown below.
CODING PL = Planning
NE = Not Evident
EM = Emerging
PR = Proficient
EX = Exemplary
No expectations element should be in place; evidence of active planning to implement and development of needed
resources should be evident and available
Element should be in place, but no evidence of implementation or development of needed documents and/or resources
Element is in place, but implementation is incomplete or uneven; May be: (1) lacking required written protocols, policies,
procedures, documents needed; (2) implemented but not according to a regular timeline or in compliance with established
policies; (3) reaching fewer students than expected
Element is in place, with complete implementation. Required written protocols, policies, procedures, documents are in place
and followed; (2) adherence to regular timelines evident; (3) reaching student populations expected
Proficiency evident with signs of innovation, on‐going planning, regular review and revision for improvement; May also be
given for elements implemented ahead of expected developmental schedule or with greater frequency than expected
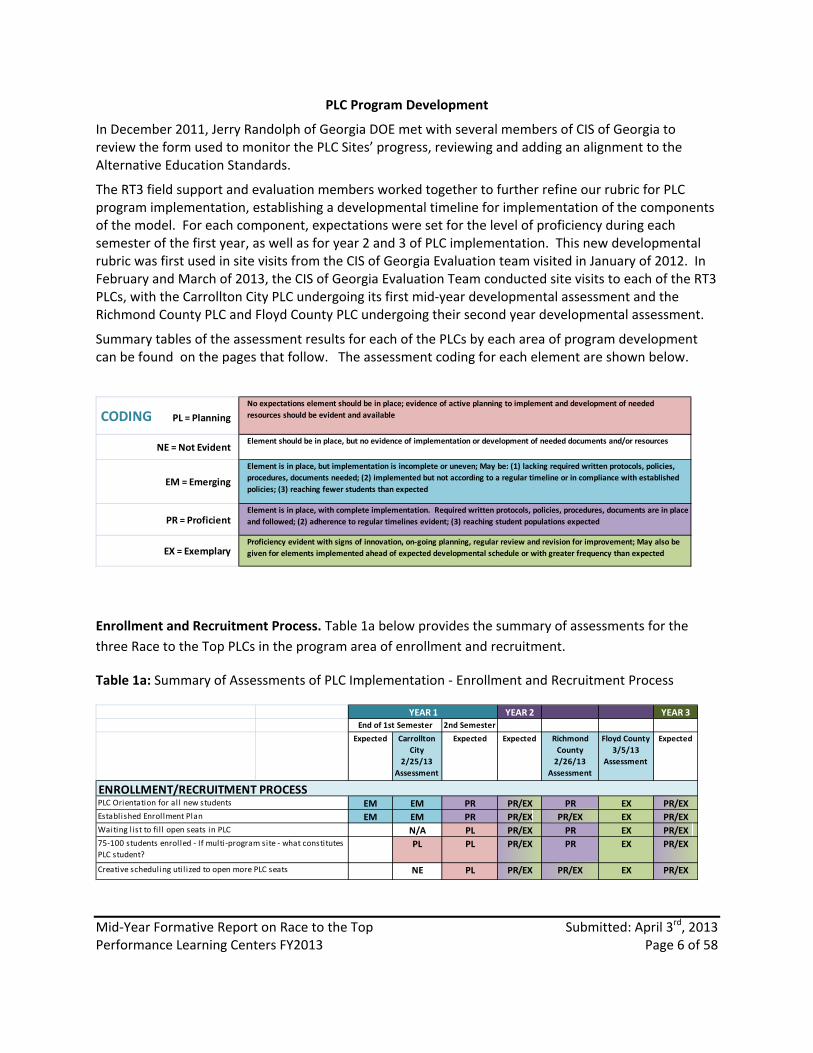
Enrollment and Recruitment Process. Table 1a below provides the summary of assessments for the
three Race to the Top PLCs in the program area of enrollment and recruitment.
Table 1a: Summary of Assessments of PLC Implementation ‐ Enrollment and Recruitment Process
YEAR 2 YEAR 32nd Semester
Expected Carrollton
City
2/25/13
Assessment
Expected Expected Richmond
County
2/26/13
Assessment
Floyd County
3/5/13
Assessment
Expected
EM EM PR PR/EX PR EX PR/EX
EM EM PR PR/EX PR/EX EX PR/EX
N/A PL PR/EX PR EX PR/EX
PL PL PR/EX PR EX PR/EX
NE PL PR/EX PR/EX EX PR/EX
YEAR 1End of 1st Semester
ENROLLMENT/RECRUITMENT PROCESSPLC Orientation for all new students
Established Enrollment Plan
Waiting l ist to fi l l open seats in PLC
75‐100 students enrolled ‐ If multi‐program site ‐ what constitutes
PLC student?
Creative scheduling util ized to open more PLC seats

Mid‐Year Formative Report on Race to the Top Submitted: April 3rd, 2013 Performance Learning Centers FY2013 Page 7 of 58
Carrollton City. As a new PLC, Carrollton City is developing its enrollment and recruitment according to
schedule, with orientation and enrollment plan in the emerging phase, working to develop unique
orientation for the program and establish a better structure for referrals. They have developed a
student handbook and have parent orientation, requiring parents and students to sign off on
expectations. The site had not reached maximum capacity by the end of the first semester and as such,
has not had a waiting list. Initially, the site was not making the best use of the potential for self‐paced
learning by following a more traditional schedule. They are working on developing a web site to
increase awareness of the PLC as an option for students in the district.
Floyd County. The enrollment and recruitment process at Floyd County PLC has been exemplary and
innovative. They have an online orientation that helps potential students to determine if they are a
good fit for the PLC, being able to handle working with on‐line curricula. The PLC has been innovative in
its recruitment processes this year, opening the program to home‐bound student and increasing
capacity by allowing students to “Bring Your Own Computer.” Currently the site does have a waiting list
of around 70 students.
Richmond County. With new leadership in place this year, the Richmond County PLC has made
tremendous progress in enrollment and recruitment. Last year, the PLC was behind schedule in
developing their enrollment process and now they are proficient or better in all areas. The site is being
proactive in identifying potential candidates to recruit for enrollment and working with graduation
coaches at the home schools who make the referrals. The site now offers a single session per day, as
having two sessions was not working well. They now have more minimesters with 2 blocks per day.
Students may attend an extra credit recovery period at the end of the day to further accelerate. The site
has implemented the full student interview process for all incoming students. The CIS site coordinator
provides group orientation to the students including a tour, overview of rules and regulations.
Attendance. Table 1b below provides the summary of assessments for the three Race to the Top PLCs in
the program area of student attendance.
Table 1b: Summary of Assessments of PLC Implementation ‐ Attendance Process
YEAR 2 YEAR 32nd Semester
Expected Carrollton
City
2/25/13
Assessment
Expected Expected Richmond
County
2/26/13
Assessment
Floyd County
3/5/13
Assessment
Expected
PR EM/PR PR PR/EX EM PR PR/EX
PR NE PR PR/EX PR PR PR/EX
EM EM EM PR/EX PR PR PR/EX
EM PL PR/EX PR PR PR/EX
ATTENDANCE (AC/SC)Attendance policy for absences and tardiness
All students made aware of attendance policy and sign form
Review attendance records to offer placement options for students
in violation of attendance policy (EOY Intent Form)
YEAR 1End of 1st Semester
Review attendance policy to determine if it has been effective and
revise as needed prior to start of school year.
Mid‐Year Formative Report on Race to the Top Submitted: April 3rd, 2013 Performance Learning Centers FY2013 Page 8 of 58
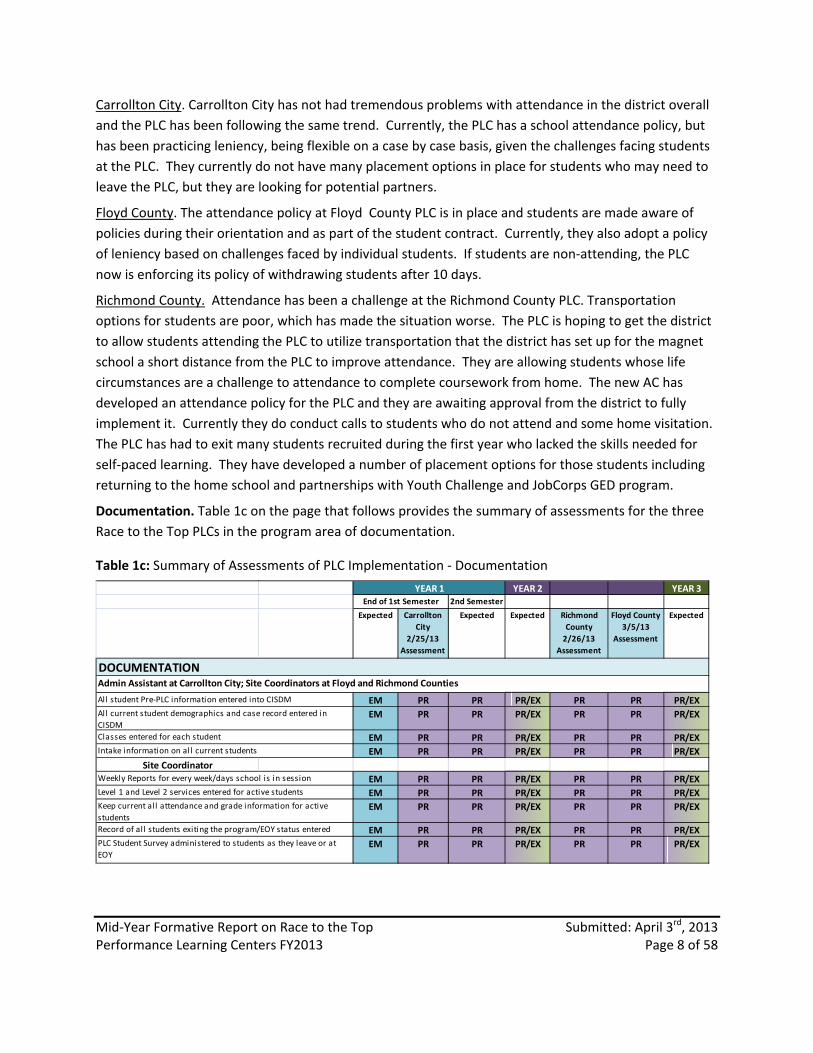
Carrollton City. Carrollton City has not had tremendous problems with attendance in the district overall
and the PLC has been following the same trend. Currently, the PLC has a school attendance policy, but
has been practicing leniency, being flexible on a case by case basis, given the challenges facing students
at the PLC. They currently do not have many placement options in place for students who may need to
leave the PLC, but they are looking for potential partners.
Floyd County. The attendance policy at Floyd County PLC is in place and students are made aware of
policies during their orientation and as part of the student contract. Currently, they also adopt a policy
of leniency based on challenges faced by individual students. If students are non‐attending, the PLC
now is enforcing its policy of withdrawing students after 10 days.
Richmond County. Attendance has been a challenge at the Richmond County PLC. Transportation
options for students are poor, which has made the situation worse. The PLC is hoping to get the district
to allow students attending the PLC to utilize transportation that the district has set up for the magnet
school a short distance from the PLC to improve attendance. They are allowing students whose life
circumstances are a challenge to attendance to complete coursework from home. The new AC has
developed an attendance policy for the PLC and they are awaiting approval from the district to fully
implement it. Currently they do conduct calls to students who do not attend and some home visitation.
The PLC has had to exit many students recruited during the first year who lacked the skills needed for
self‐paced learning. They have developed a number of placement options for those students including
returning to the home school and partnerships with Youth Challenge and JobCorps GED program.
Documentation. Table 1c on the page that follows provides the summary of assessments for the three
Race to the Top PLCs in the program area of documentation.
Table 1c: Summary of Assessments of PLC Implementation ‐ Documentation
YEAR 2 YEAR 32nd Semester
Expected Carrollton
City
2/25/13
Assessment
Expected Expected Richmond
County
2/26/13
Assessment
Floyd County
3/5/13
Assessment
Expected
EM PR PR PR/EX PR PR PR/EX
EM PR PR PR/EX PR PR PR/EX
EM PR PR PR/EX PR PR PR/EX
EM PR PR PR/EX PR PR PR/EX
Site Coordinator
EM PR PR PR/EX PR PR PR/EX
EM PR PR PR/EX PR PR PR/EX
EM PR PR PR/EX PR PR PR/EX
EM PR PR PR/EX PR PR PR/EX
EM PR PR PR/EX PR PR PR/EX
Classes entered for each student
Intake information on all current students
Weekly Reports for every week/days school is in session
Level 1 and Level 2 services entered for active students
DOCUMENTATION
All student Pre‐PLC information entered into CISDM
All current student demographics and case record entered in
CISDM
YEAR 1End of 1st Semester
Admin Assistant at Carrollton City; Site Coordinators at Floyd and Richmond Counties
Keep current all attendance and grade information for active
students
Record of all students exiting the program/EOY status entered
PLC Student Survey administered to students as they leave or at
EOY
Mid‐Year Formative Report on Race to the Top Submitted: April 3rd, 2013 Performance Learning Centers FY2013 Page 9 of 58
Carrollton City. Carrollton City has been quick to develop proficiency in data collection. Data entry is
shared by the PLC administrative assistant, Wanda Todd, and the CIS site coordinator, Shae Holland.
The administrative assistant maintains the student academic data, while the site coordinator maintains
all student intake and service data and is responsible for having students complete exit surveys. The
two coordinate information using googledocs. Data monitoring shows that the site is functioning well
on data collection.
Floyd County. The CIS site coordinator is responsible for all student data entry at the Floyd County PLC.
The site has set up mechanisms and procedures for providing class completion data to the site
coordinator. Data monitoring shows that the site is functioning well on data collection.
Richmond County. During the first year of operations, data access was a major impediment to data
collection at the PLC site. The CIS site coordinator is primarily responsible for data entry and during
their first year, the SC did not have access to the school’s data system which resulted in incomplete data
collection in the CIS data management system (CISDM) during year 1. This issue has been remedied, but
much work had to be done this year to correct past errors and omissions in data entry in CISDM. The
site is now functioning well in the area of data collection. The site coordinator has been having students
complete exit surveys. The site is also taking part in a study of e2020 curriculum and EOCTs.
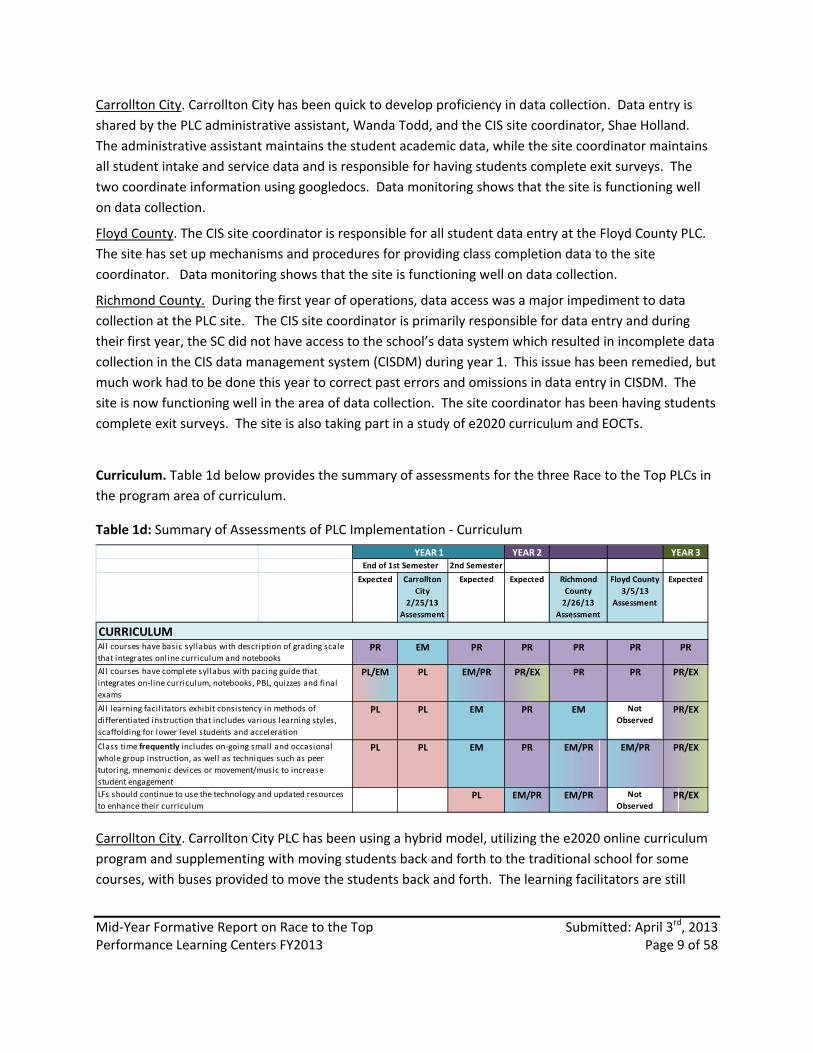
Curriculum. Table 1d below provides the summary of assessments for the three Race to the Top PLCs in
the program area of curriculum.
Table 1d: Summary of Assessments of PLC Implementation ‐ Curriculum
YEAR 2 YEAR 32nd Semester
Expected Carrollton
City
2/25/13
Assessment
Expected Expected Richmond
County
2/26/13
Assessment
Floyd County
3/5/13
Assessment
Expected
CURRICULUMPR EM PR PR PR PR PR
PL/EM PL EM/PR PR/EX PR PR PR/EX
PL PL EM PR EM Not
ObservedPR/EX
PL PL EM PR EM/PR EM/PR PR/EX
PL EM/PR EM/PR Not
ObservedPR/EX
All courses have complete syllabus with pacing guide that
integrates on‐l ine curriculum, notebooks, PBL, quizzes and final
exams
All learning facilitators exhibit consistency in methods of
differentiated instruction that includes various learning styles,
scaffolding for lower level students and acceleration
Class time frequently includes on‐going small and occasional
whole group instruction, as well as techniques such as peer
tutoring, mnemonic devices or movement/music to increase
student engagement
LFs should continue to use the technology and updated resources
to enhance their curriculum
All courses have basic syllabus with description of grading scale
that integrates online curriculum and notebooks
YEAR 1End of 1st Semester
Carrollton City. Carrollton City PLC has been using a hybrid model, utilizing the e2020 online curriculum
program and supplementing with moving students back and forth to the traditional school for some
courses, with buses provided to move the students back and forth. The learning facilitators are still
Mid‐Year Formative Report on Race to the Top Submitted: April 3rd, 2013 Performance Learning Centers FY2013 Page 10 of 58
learning the e2020 system and could use additional support in management of the system to learn more
about sequencing and project‐based learning resources. The site is working to develop pacing guides.
They have begun planning for more “off‐line” time and working in small groups.
Floyd County. Floyd County PLC has operated with 4 full‐time learning facilitators and sharing subject
area specialists with the alternative school, having them work for one period per day at the PLC. All
classes have full syllabi and pacing guides. The teachers who are there full‐time have been engaging
students in small group instruction.
Richmond County. The new academic coordinator at Richmond County PLC has been working to put
many elements that were not implemented the first year into place during this second year. The PLC is
using e2020 and the district has aligned e2020 with the Common Core and this is working well for the
site, placing them on target in implementation of the Common Core. Learning facilitators are beginning
to work on developing syllabi with pacing guides. Small group instruction has commenced with some
learning facilitators, particularly within CTAE courses.
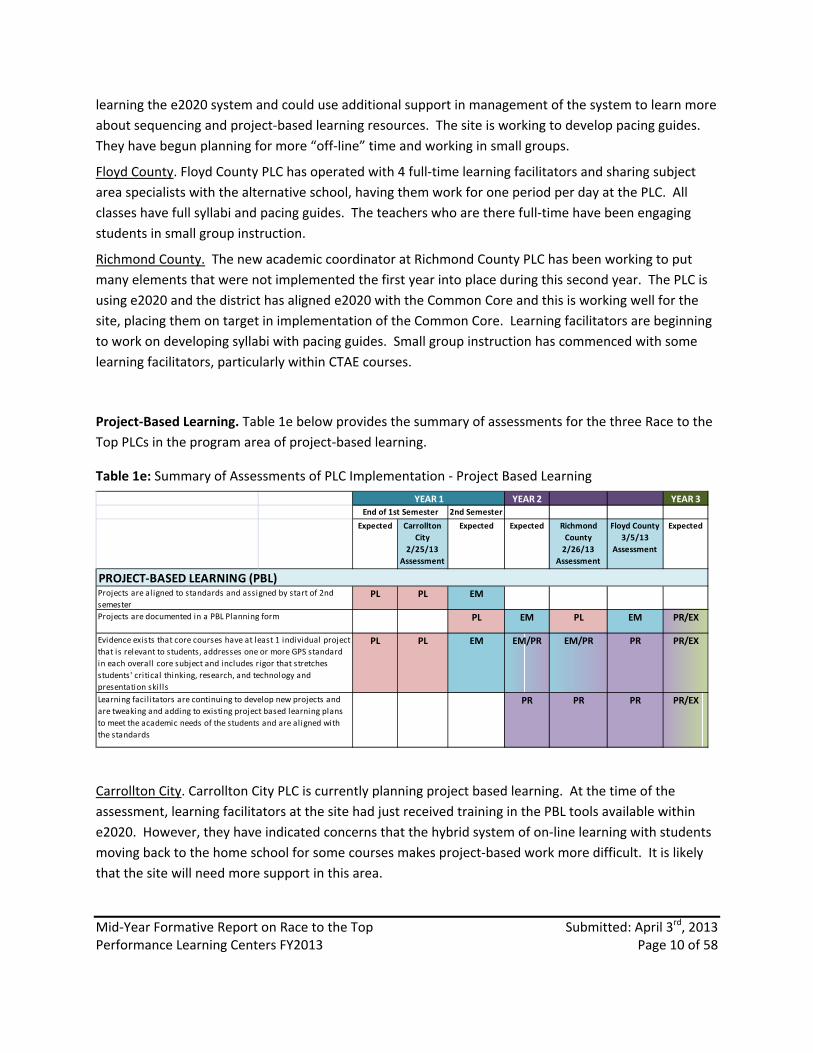
Project‐Based Learning. Table 1e below provides the summary of assessments for the three Race to the
Top PLCs in the program area of project‐based learning.
Table 1e: Summary of Assessments of PLC Implementation ‐ Project Based Learning
YEAR 2 YEAR 32nd Semester
Expected Carrollton
City
2/25/13
Assessment
Expected Expected Richmond
County
2/26/13
Assessment
Floyd County
3/5/13
Assessment
Expected
PL PL EM
PL EM PL EM PR/EX
PL PL EM EM/PR EM/PR PR PR/EX
PR PR PR PR/EX
PROJECT‐BASED LEARNING (PBL)Projects are aligned to standards and assigned by start of 2nd
semester
Projects are documented in a PBL Planning form
Evidence exists that core courses have at least 1 individual project
that is relevant to students, addresses one or more GPS standard
in each overall core subject and includes rigor that stretches
students' critical thinking, research, and technology and
presentation skil ls
Learning facilitators are continuing to develop new projects and
are tweaking and adding to existing project based learning plans
to meet the academic needs of the students and are aligned with
the standards
YEAR 1End of 1st Semester
Carrollton City. Carrollton City PLC is currently planning project based learning. At the time of the
assessment, learning facilitators at the site had just received training in the PBL tools available within
e2020. However, they have indicated concerns that the hybrid system of on‐line learning with students
moving back to the home school for some courses makes project‐based work more difficult. It is likely
that the site will need more support in this area.

Mid‐Year Formative Report on Race to the Top Submitted: April 3rd, 2013 Performance Learning Centers FY2013 Page 11 of 58
Floyd County. Floyd County PLC been involved in project‐based learning since their first year. Students
engage in project‐based learning, often tied into their senior project.
Richmond County. Richmond County PLC has implemented project‐based learning during their second
year. As the PLC has been working to fully implement senior projects, they are hoping in the future to
tie project‐based learning in with these projects. The CTAE learning facilitator works with students in
this area.
Academic Service Learning and Senior Projects. Table 1f below provides the summary of assessments
for the three Race to the Top PLCs in the program areas of academic service learning and senior
projects.
Table 1f: Summary of Assessments of PLC Implementation ‐ Academic Service Learning and Senior Projects
YEAR 2 YEAR 32nd Semester
Expected Carrollton
City
2/25/13
Assessment
Expected Expected Richmond
County
2/26/13
Assessment
Floyd County
3/5/13
Assessment
Expected
PL PL EM PR/EX PR PR PR/EX
EM PR PR PR
PR PR EM
PL PL EM PR EM PR PR
ACADEMIC SERVICE LEARNING (ASL)Staff implements at least one academic service learning project
The PLC offers 2 or more academic service learning opportunities
with all students participating in at least one project
The PLC has offers 3 or more academic service learning
opportunities with all students participating in at least one
project
SENIOR PROJECTSThe Senior Project should be developed and implemented, whereby
complete all four parts of the Senior Projects
YEAR 1End of 1st Semester
Carrollton City. Carrollton City PLC is currently planning academic service learning and senior projects,
but has not implemented. They would like to start a recycling program within the PLC and utilize this as
a project. They will need further support from the CIS of Georgia field support department in
implementing these. Most likely senior projects will not be fully implemented until the second year of
operations.
Floyd County. Floyd County PLC been proficient in Academic Service Learning since they started and they
have moved from emerging to proficient in senior projects. This year, they have had a series of
academic service learning projects that students could participate in and developed a service learning
workbook called “MIA: Mission in Action” Service Learning for use by students. Projects have included
projects on domestic violence, anti‐bullying, a river clean‐up project, a book fair and others. They have
fully implemented senior projects, with all graduates completing these this year. Wherever possible,

Mid‐Year Formative Report on Race to the Top Submitted: April 3rd, 2013 Performance Learning Centers FY2013 Page 12 of 58
project‐based learning, academic service learning and careers and Common Core elements are
incorporated into senior projects.
Richmond County. Richmond County PLC has implemented academic service learning this year. The
science learning facilitator has taken the lead in developing projects, tying them in with each subject
area. So far this year, they have had 3 service learning projects including voter registration, a blood
drive and a garden project. Senior projects are in the emerging stage, and the staff intends to tie these
in with project‐based learning and academic service learning. Pacing has been a challenge with senior
projects and they are hoping to have students actually work on these projects commencing in their
junior year.
Morning Motivation. Table 1g below provides the summary of assessments for the three Race to the
Top PLCs in the program area of Morning Motivation.
Table 1g: Summary of Assessments of PLC Implementation ‐ Morning Motivation
YEAR 2 YEAR 32nd Semester
Expected Carrollton
City
2/25/13
Assessment
Expected Expected Richmond
County
2/26/13
Assessment
Floyd County
3/5/13
Assessment
Expected
EM/PR EM EM/PR PR PR
EM EM PR EM PR PR/EX
PR/EX PL PL PR/EX
MORNING MOTIVATION At least once a week Morning Motivation that is teacher‐led, 10‐20
minutes, organized, upbeat/positive climate and is organized with
good momentum, and interesting. It should include a variety of the
following: music, word/thought of the day, P's, creed, current
event, student/teacher greeting, l i fe skills, daily announcements,
talent showcase, themes, and exercise/nature walks
Students take more responsibility for leading with teacher
approval
Two or more student‐led sessions per week
YEAR 1End of 1st Semester
Carrollton City. Carrollton City PLC did not implement Morning Motivation during the first semester.
The site lacks a large central space to do this. They began implementation during the beginning of
second semester in the homeroom classes over the intercom, including quotes, news and
announcements. Each week a teacher will take responsibility with help from students.
Floyd County. Floyd County PLC began incorporating daily Morning Motivation this year within each
homeroom. Each learning facilitator uses their SmartBoard with a theme for the day and students
provide quotes. Morning Motivation is participatory with students being given reflection time with a
focus on future and goal setting. Their reflections are placed into their portfolios.
Richmond County. Richmond County PLC has implemented Morning Motivation within homerooms
with a monthly whole‐group Morning Motivation. Learning facilitators take the lead, developing the
theme for their homeroom. Students do have some input, but it is not yet truly “student‐led.” They are

Mid‐Year Formative Report on Race to the Top Submitted: April 3rd, 2013 Performance Learning Centers FY2013 Page 13 of 58
working toward developing more student‐led sessions and more large group motivation, but they it has
not been developed to the extent they want it to be.
Advisory/Charting for Success. Table 1h below provides the summary of assessments for the three Race
to the Top PLCs in the program area of Advisory/Charting for Success.
Table 1h: Summary of Assessments of PLC Implementation ‐ Advisory/Charting for Success
YEAR 2 YEAR 32nd Semester
Expected Carrollton
City
2/25/13
Assessment
Expected Expected Richmond
County
2/26/13
Assessment
Floyd County
3/5/13
Assessment
Expected
PR EM/PR PR PR PR/EX EX PR
EM PL PR PR/EX PR/EX EX PR/EX
ADVISORY/CHARTING FOR SUCCESS (LF)
YEAR 1End of 1st Semester
Before the beginning of school: a daily schedule which includes
advisory once a week is developed, with all students assigned to a
teacher‐advisor
Students meet with advisors at least an hour each week to update
their notebooks, Graduation checklist, Individual Development
Plans (IDP) and other advisory materials
Carrollton City. Carrollton City PLC learning facilitators conduct advisement once monthly, with all
students assigned to a particular learning facilitator. For 8th grade students, the CIS site coordinator
conducts advisement. All students are GAcollege411 registered. They want to expand these services
and will likely need support in this area and training in the Charting for Success curricula.
Floyd County. Floyd County PLC has been very innovative in use of technology within their advisement,
employing googledocs to develop online portfolios for each of the students. All learning facilitators at
the PLC have been trained in reading transcripts and work with students in learning to read them and
understand what they need to do to graduate so that no student can say they were unaware of what
they needed to do to graduate. Each student has weekly advisement with Ms. Martin or Mr. Burkhalter.
Within their online portfolios the students maintain their own transcripts of courses completed, and set
weekly goals. During reflection, students assess their progress toward goals and if they do not meet
their goals, must explain why. The online portfolios are shared with and reviewed by all learning
facilitators who can make comments and send communications to the students. The intent is to have
students take ownership of their education. Ms. Winston, the CIS site coordinator, conducts college and
career readiness with the students.
Richmond County. Richmond County PLC has fully implemented advisory this year. The homeroom
teachers are the primary advisors for students. The academic coordinator (AC) has put checks and
balances into place wherein students go first to their homeroom teacher for support, then to Ms. Reid,
the CIS site coordinator, and finally to the AC, Natalie Robinson for help as needed. When students
complete a course, Ms. Reid and Ms. Robinson must sign off before a student can enroll in a new class.

Mid‐Year Formative Report on Race to the Top Submitted: April 3rd, 2013 Performance Learning Centers FY2013 Page 14 of 58
The CIS site coordinator is in charge of Charting for Success and has provided opportunities such as
college fairs and visits to technical college for students. Most of the students now have GAcollege411
accounts.
Career Capstone/Job Shadowing. Table 1i below provides the summary of assessments for the three
Race to the Top PLCs in the program area of Career Capstone/Job Shadowing.
Table 1i: Summary of Assessments of PLC Implementation ‐ Career Capstone/Job Shadowing
YEAR 2 YEAR 32nd Semester
Expected Carrollton
City
2/25/13
Assessment
Expected Expected Richmond
County
2/26/13
Assessment
Floyd County
3/5/13
Assessment
Expected
EM PL EM PR PR PR PR
EM PL PR PR PR PR PR
EM NE PR PR EM PR PR
EM EM PR PR PR PR PR
EM EM PR PR PR PR PR
PR PR PR PR PR
PR PR PR PR
Site Coordinator and Academic Coordinator establish a
partnership with the technical college to get students dually
enrolled
All students (priority 11‐12th grades) discuss and select a
pathway course of study with advisor, Site Coordinator and
technical college high school coordinator
Site Coordinator forms partnerships with local businesses,
agencies and organization in the community to offer internships,
job shadowing, ad mentoring opportunities to PLC students
Site Coordinator schedule group college tours, career/college day,
job shadowing experiences with local businesses (hospitals, etc)
Site Coordinator partners with the technical college to set up
Compass testing for all returning 11th and 12th graders who
haven't tested
1st semester ‐ Advisors identify new students on track to graduate
and interested in dual enrollment. Work towards enroll ing them by
start of 2nd semester
CAREER CAPSTONE/ JOB SHADOWINGSite Coordinator coordinates with the technical college to set up
Compass testing for graduating seniors
End of 1st Semester
YEAR 1
Carrollton City. Carrollton City PLC has been working toward implementing career capstone and job
shadowing. They have met with West Central Technical College and hope to have a partnership with
them soon to do COMPASS testing. They have commenced some campus tours and have had students
participate in job shadowing that is available at the traditional high school.
Floyd County. Floyd County PLC implemented dual enrollment last year. They work with Georgia
Northwestern and Georgia Highlands and have several dually enrolled students. COMPASS testing is
completed at the College and Career Academy and guest speakers are invited to speak to students
about a variety of careers. Many community partners and college representatives come in to visit and
speak with students. Job shadowing is also in place led by CIS. PLC has also tapped into WIA project to
support this area. They have partnered with Berry College and have interns from the college to work
with students.

Mid‐Year Formative Report on Race to the Top Submitted: April 3rd, 2013 Performance Learning Centers FY2013 Page 15 of 58
Richmond County. Richmond County PLC has a relationship with Augusta Technical College which
provides testing for students. They have a partnership for dual enrollment, but transportation is a
barrier to implementation. The site coordinator has arranged college and technical college tours for
students. They have partnered with Junior Achievement for job shadowing. Job shadowing
opportunities have been provided with John Deere, Publix, Crock Center, Walton Options and Habitat
for Humanity.
Incentive Program. Table 1j below provides the summary of assessments for the three Race to the Top
PLCs in the program area of Incentive Program.
Table 1j: Summary of Assessments of PLC Implementation ‐ Incentive Programs
YEAR 2 YEAR 32nd Semester
Expected Carrollton
City 2/25/13
Assessment
Expected Expected Richmond
County
2/26/13
Assessment
Floyd County
3/5/13
Assessment
Expected
EM PR PR PR PR PR PR
PR PR PR
PR PR PR
PR PR PR
PR PR PR
EM PR PR PR PR PR PR
* Good Citizenship (participating in various activities)
*Conduct
Work with local businesses to build upon established partnerships for
donations, awards and incentives
INCENTIVE PROGRAM ‐ Site CoordinatorEstablish and maintain school‐wide incentive program for:
* Attendance
* Academic Achievement
YEAR 1End of 1st Semester
Carrollton City. Carrollton City PLC has performed well in developing incentive programs this year. They
have developed relationships with Papa John’s, Chick‐Fil‐A, Taco Bell and Subway. They have pizza
parties for students who are on track academically with no disciplinary incidents. They have a Tacos for
Grads incentive program with Taco Bell. A Student of the Month program has been implemented.
Students who complete courses are celebrated on a “Got Credits” bulletin board.
Floyd County. Floyd County PLC also has a well‐established incentive program. Local businesses provide
gift cards, and they have prizes for good performance. Students who graduate are celebrated publicly ‐‐
with a graduation walk down the hall and posting of their picture on a mortarboard in their school color.
Richmond County. Richmond County PLC has been able to provide incentives to students in the form of
gift cards. Students are recognized for perfect attendance, and there is a Student of the Minimester.
They want to further develop this and feel that their site coordinator needs more time to devote to
developing business partnerships.

Mid‐Year Formative Report on Race to the Top Submitted: April 3rd, 2013 Performance Learning Centers FY2013 Page 16 of 58
Mentor Program. Table 1k below provides the summary of assessments for the three Race to the Top
PLCs in the program area of Mentor Program.
Table 1k: Summary of Assessments of PLC Implementation ‐ Mentor Programs
YEAR 2 YEAR 32nd Semester
Expected Carrollton
City
2/25/13
Assessment
Expected Expected Richmond
County
2/26/13
Assessment
Floyd County
3/5/13
Assessment
Expected
PL EM EM PR PR PR PR
PL EM EM PR EM EM PR
MENTOR PROGRAM ‐ Site Coordinator
YEAR 1End of 1st Semester
Actively recruiting, screening and training mentors
Students are matched with mentors, either individually or in
groups of 3‐5 students
Carrollton City. Carrollton City PLC has begun implementation of their mentor program with the help of
CIS. West Georgia College has been a source for some mentors. Currently they have 6 regular mentors
in place and have been conducting workshops for recruitment.
Floyd County. Floyd County PLC has had a difficult time fully implementing the mentor program.
Although the CIS affiliate has a long standing mentoring program, the location of the PLC is a barrier to
getting mentors into the site. Staff act as mentors for most students. They still hope to increase the
numbers and place more mentors at the site.
Richmond County. Richmond County PLC has also had difficulty attracting mentors. The CIS site
coordinator has done outreach and trained a large group from a local church, but the mentors never
started. They are currently conducting outreach with Ft. Gordon and hopes to get mentors in the future
from within the military. The biggest challenge is the amount of time that the CIS site coordinator has to
devote to recruiting, training and engaging mentors.
Parent Engagement. Table 1l below provides the summary of assessments for the three Race to the Top
PLCs in the program area of Parent Engagement.
Table 1l: Summary of Assessments of PLC Implementation ‐ Parent Engagement
YEAR 2 YEAR 32nd Semester
Expected Carrollton
City
2/25/13
Assessment
Expected Expected Richmond
County
2/26/13
Assessment
Floyd County
3/5/13
Assessment
Expected
PR PR PR PR PR EX PR
PL PR EM PR PR EX PRAt least two PLC‐provided workshops or other special events are
offered per semester with documented outreach to help ensure
participation
PARENTAL ENGAGEMENTAt least 95% of parents are contacted quarterly via telephone,
email, newsletter, home visits and/or visit the PLC for conferences
YEAR 1End of 1st Semester

Mid‐Year Formative Report on Race to the Top Submitted: April 3rd, 2013 Performance Learning Centers FY2013 Page 17 of 58
Carrollton City. Carrollton City PLC has regular outreach to parents. The CIS site coordinator calls
parents if students do not show up for school and the AC and learning facilitators provide regular
updates to parents. The PLC maintains a googledocs log for parent contacts. They held three parent
events during the first semester including a parent appreciation night, a parent meet‐and‐greet and a
parent holiday luncheon.
Floyd County. Floyd County PLC has done an exemplary job of engaging parents. The PLC holds parent
meetings once a month. Parents attend an orientation to PLC that includes training on helping their
child to be successful and community resources. Parent meetings have covered subjects such as finance
and budgeting and dealing with holiday stress. The PLC hosted a college fair with nine colleges
represented to provide students and their parents assistance in completing the FAFSA form and
information on helping students enter college.
Richmond County. Richmond County PLC has also performed well in engaging parents. Parents are
contacted by the site coordinator, AC and learning facilitators with student progress. Parents receive
weekly progress reports on their students. They have held several parent events including a Parent
Progress Report Night in which they explained to parents how they can monitor student progress. They
plan to hold this training again in the second semester.
Program Refinements in Progress
Preparing for the Common Core‐Georgia Performance Standards Transition:
Last year CIS of Georgia staff investigated how to help the PLC staff transition to the Common Core‐
Georgia Performance Standards (CCGPS). Discussions began with Jerry Randolph and Jan Wiche of
Georgia DOE, and then we participated in Georgia DOE's Elluminate and GPB sessions throughout the
year. West Georgia RESA’s Barbara Bishop invited us to attend her CCGPS training with Carrollton City
staff, but this was not as useful as we had hoped since the event was designed for 6th grade language
arts teachers. We did learn some things from Ms. Bishop that helped us develop a plan for the PLCs that
included monthly forums for PLC Mathematics and ELA Learning Facilitators to discuss the CCGPS
transition with others serving in a similar role. For the first discussions held in March 2012, learning
facilitators were asked to be up‐to‐date on the Elluminate and GPB sessions, to share what support they
are receiving from their districts and RESAs that was helpful, and brainstorm additional supports that CIS
of Georgia might be able to provide. Those calls were poorly attended, with three facilitators attending
the math call (two from the same site) and only one language arts facilitator on the ELA call. This led us
to revise our plan.
CIS of Georgia also contracted with two presenters, Georgia DOE's Mary Lynn Huie and Northeast
Georgia RESA's Kaycie Maddox, to offer full day planning sessions in literacy and math, respectively, at
the PLC Summer Institute in July 2012. The intent was for learning facilitators to build upon Georgia
DOE’s guidance on CCGPS suggested practices and plan to employ those strategies in the PLC setting.

Mid‐Year Formative Report on Race to the Top Submitted: April 3rd, 2013 Performance Learning Centers FY2013 Page 18 of 58
These were excellent sessions, upon which our transition plan has developed. Several of the attendees
have been invited to form our PLC Curriculum Team, after CIS of Georgia's field support, curriculum and
training coordinator further investigated by attending Dr. Huie's Literacy Design Collaborative training in
the fall and spring, the GACIS Fall Conference and the National Association for Alternative Education's
conference. A one‐day consult was also held with Common Core and professional development experts
from Apex Learning.
The objective was defined: to develop tools designed around the PLC instructional model that help
learning facilitators across the PLC network implement the Common Core‐Georgia Performance
Standards (CCGPS ) in our non‐traditional setting. We would tackle not only English/Language Arts (ELA)
and mathematics, but also the literacy and college/career readiness standards that impact the other
subjects.
CIS of Georgia field support coordinators nominated PLC learning facilitators who we regarded as
"experts in their field" to serve on our PLC Curriculum Team, which functions similar to a curriculum
department in a traditional high school, and sought approval from their respective academic
coordinators. Other commitments interfered and the teams developed unevenly with four
representatives each in math and social studies, three in ELA, one in CTAE and none in science. We are
still seeking at least two representatives from science to join us for the next meeting on April 26.
The PLC Curriculum Team's Kick Off Meeting was held March 1, 2013. The goal was to gain clarity on
necessary next steps to create the following to share with other learning facilitators in the PLC network:
at least one sample unit plan with rubrics for each assigned CCGPS course that includes links to
as many of the texts as possible and describes four recommended strategies to use with
students (whole group instruction with interactive whiteboard, whole group instruction with
individual computers, and differentiated instructional strategies). ELA facilitators should focus
on an informational text.
a presentation that will be delivered at PLC Summer Training 2013.
Team members developed teaching tasks for each unit that they shared on a webinar on March 22. The
next meeting on April 26 will feature Dr. Huie conducting an orientation to the Literacy Design
Collaborative's Module Creator, which the ELA, social studies and CTAE facilitators will be using to
construct their lessons. Several more meetings, including a peer review of draft lessons using a rubric
that team members provided input on, are planned between now and the presentation that will be held
July 16, 17 or 18.

Mid‐Year Formative Report on Race to the Top Submitted: April 3rd, 2013 Performance Learning Centers FY2013 Page 19 of 58
First Semester Student Services and Outcomes
Student Data Collection at Performance Learning Centers
Staff at each PLC are required to track processes such as the services delivered to students, student participation in key program components such a advisory and academic service learning. Student progress is monitored in the areas of academic performance, attendance, behavior, promotion/ graduation and plans for the future. There three main data collection tools used for collecting data on the student experience at Performance Learning Center:
Communities In Schools Data Management System (CISDM). CIS provides each PLC with all reporting instruments including an online database system (CISDM) to track student demographics, risk factors, program participation, services and performance in the PLC program. In addition, school‐wide services available to all students are also tracked.
PLC Monthly Report. The PLC monthly report was developed for the new school year, replacing weekly report. In the monthly report, PLCs provide information on student enrollment, including entrances, exits and exit reasons, student attendance, parent and community involvement in the PLC.
Student Surveys. Student surveys provide us with much information and insight into the more subjective aspects of the PLC school experience and its impact on students. Communities In Schools of Georgia administers the surveys online via SurveyMonkey. The online surveys allowed us to provide immediate access to survey results for the academic coordinators and CIS executive directors.
At the Floyd and Richmond County PLCs started during the 2011‐12 school year, the CIS site coordinators alone are responsible for entering information on the student experience at the PLC into CISDM. The Carrollton City PLC which started in the 2012‐13 school year follows a different pattern with data entry tasks shared between the site coordinator and administrative assistant. Each PLC collects and enters student demographics, intake information, baseline (pre‐PLC) behavioral and academic performance data, as well as grades, attendance and discipline during the students’ time at the PLC into the CIS data system. The site coordinator is also asked to track services and student participation in service learning and other essential elements of the program, such as college and career readiness and advisory.
Data Quality for 2012‐13. Challenges were encountered with data collections at the Richmond County PLC during their first year operations, where the lack of an academic coordinator for much of the year resulted in the site coordinator not having access to the district data system. Natalie H. Robinson, the new academic coordinator at the PLC in Richmond, has been very committed to collecting complete data for the 2012‐13 school year. However, as some PLC students are enrolled at the PLC across multiple years, much of the data entered into the database from the previous year had to be corrected to obtain complete data for this school year for those students. Overall, the data quality at Richmond PLC has improved greatly this year.
Mid‐Year Formative Report on Race to the Top Submitted: April 3rd, 2013 Performance Learning Centers FY2013 Page 20 of 58
Data collection at the Carrollton City and Floyd County PLC sites has been quite good this year. The CIS of Georgia evaluation department commenced checks of data quality in fall of this year, comparing enrollment reported in the monthly reports to what has been entered into CISDM. This has allowed us to identify some data challenges and work with the sites on correcting data.
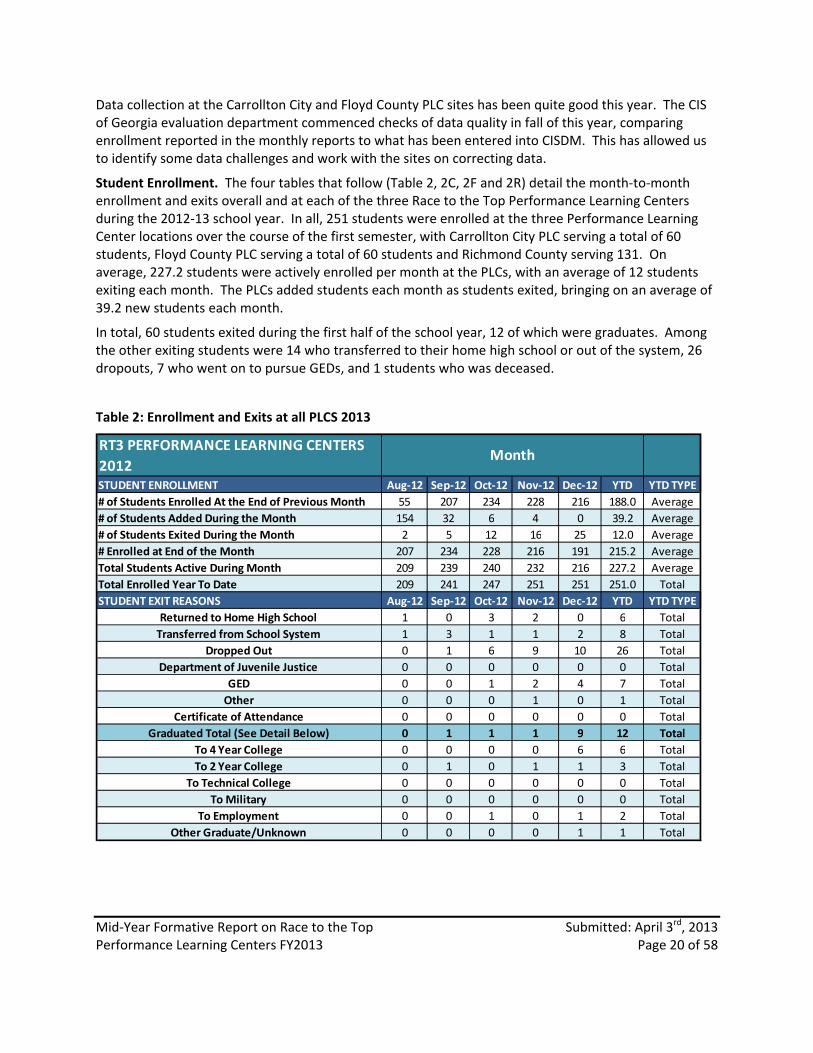
Student Enrollment. The four tables that follow (Table 2, 2C, 2F and 2R) detail the month‐to‐month enrollment and exits overall and at each of the three Race to the Top Performance Learning Centers during the 2012‐13 school year. In all, 251 students were enrolled at the three Performance Learning Center locations over the course of the first semester, with Carrollton City PLC serving a total of 60 students, Floyd County PLC serving a total of 60 students and Richmond County serving 131. On average, 227.2 students were actively enrolled per month at the PLCs, with an average of 12 students exiting each month. The PLCs added students each month as students exited, bringing on an average of 39.2 new students each month.
In total, 60 students exited during the first half of the school year, 12 of which were graduates. Among the other exiting students were 14 who transferred to their home high school or out of the system, 26 dropouts, 7 who went on to pursue GEDs, and 1 students who was deceased.
Table 2: Enrollment and Exits at all PLCS 2013
RT3 PERFORMANCE LEARNING CENTERS
2012STUDENT ENROLLMENT Aug‐12 Sep‐12 Oct‐12 Nov‐12 Dec‐12 YTD YTD TYPE
# of Students Enrolled At the End of Previous Month 55 207 234 228 216 188.0 Average
# of Students Added During the Month 154 32 6 4 0 39.2 Average
# of Students Exited During the Month 2 5 12 16 25 12.0 Average
# Enrolled at End of the Month 207 234 228 216 191 215.2 Average
Total Students Active During Month 209 239 240 232 216 227.2 Average
Total Enrolled Year To Date 209 241 247 251 251 251.0 Total
STUDENT EXIT REASONS Aug‐12 Sep‐12 Oct‐12 Nov‐12 Dec‐12 YTD YTD TYPE
Returned to Home High School 1 0 3 2 0 6 Total
Transferred from School System 1 3 1 1 2 8 Total
Dropped Out 0 1 6 9 10 26 Total
Department of Juvenile Justice 0 0 0 0 0 0 Total
GED 0 0 1 2 4 7 Total
Other 0 0 0 1 0 1 Total
Certificate of Attendance 0 0 0 0 0 0 Total
Graduated Total (See Detail Below) 0 1 1 1 9 12 Total
To 4 Year College 0 0 0 0 6 6 Total
To 2 Year College 0 1 0 1 1 3 Total
To Technical College 0 0 0 0 0 0 Total
To Military 0 0 0 0 0 0 Total
To Employment 0 0 1 0 1 2 Total
Other Graduate/Unknown 0 0 0 0 1 1 Total
Month

Mid‐Year Formative Report on Race to the Top Submitted: April 3rd, 2013 Performance Learning Centers FY2013 Page 21 of 58
Carrollton City PLC Enrollment
At Carrollton City PLC, 60 students were enrolled over the course of the first semester. On average, 57.2
students per month were actively enrolled monthly at the PLC, with an average of 1.4 students exiting
each month. Carrollton City PLC did not add new students each month as students exited, with all new
students entering during the first month of operations.
In total, 7 students exited during the first semester, one of which was a graduate. Carrollton City PLC did document student plans upon graduation, with the graduate having plans to continue on to attend a 2‐year college program.
Among the other exiting students were 3 who transferred out of the system, 1 returning to their home high school, and 2 dropouts.
Table 2C: Enrollment and Exits at Carrollton City PLC 2013
SITE: Carrollton City PLCSTUDENT ENROLLMENT Aug‐12 Sep‐12 Oct‐12 Nov‐12 Dec‐12 YTD YTD TYPE
# of Students Enrolled At the End of Previous Month 0 60 58 55 53 45.2 Average
# of Students Added During the Month 60 0 0 0 0 12.0 Average
# of Students Exited During the Month 0 2 3 2 0 1.4 Average
# Enrolled at End of the Month 60 58 55 53 53 55.8 Average
Total Students Active During Month 60 60 58 55 53 57.2 Average
Total Enrolled Year To Date 60 60 60 60 60 60.0 Total
STUDENT EXIT REASONS Aug‐12 Sep‐12 Oct‐12 Nov‐12 Dec‐12 YTD YTD TYPE
Returned to Home High School 0 0 1 0 0 1 Total
Transferred from School System 0 2 1 0 0 3 Total
Dropped Out 0 0 1 1 0 2 Total
Department of Juvenile Justice 0 0 0 0 0 0 Total
GED 0 0 0 0 0 0 Total
Other 0 0 0 0 0 0 Total
Certificate of Attendance 0 0 0 0 0 0 Total
Graduated Total (See Detail Below) 0 0 0 1 0 1 Total
To 4 Year College 0 0 0 0 0 0 Total
To 2 Year College 0 0 0 1 0 1 Total
To Technical College 0 0 0 0 0 0 Total
To Military 0 0 0 0 0 0 Total
To Employment 0 0 0 0 0 0 Total
Other Graduate/Unknown 0 0 0 0 0 0 Total
Month

Mid‐Year Formative Report on Race to the Top Submitted: April 3rd, 2013 Performance Learning Centers FY2013 Page 22 of 58
Floyd County PLC Enrollment
At Floyd County PLC, 60 students were enrolled over the course of the first semester, an increase of
33.3% over the previous year first semester (45 students). Twenty students enrolled at the end of the
2011‐12 school year returned to the PLC after the summer. On average, 53.2 students per month were
actively enrolled at the PLC, with an average of 2.6 students exiting each month. Floyd PLC added
students each month as students exited, bringing on an average of 8.0 new students each month.
In total, 13 students exited during the first half of the year, five of which were graduates. Floyd County PLC did document student plans upon graduation. Four students left with plans to attend a 2 year college, and 1 was going to pursue employment.
Among the other exiting students were 4 who transferred out of the system, 2 who returned to their home high schools, and 2 dropouts.
Table 2F: Enrollment and Exits at Floyd County PLC 2013
SITE: Floyd County PLCSTUDENT ENROLLMENT Aug‐12 Sep‐12 Oct‐12 Nov‐12 Dec‐12 YTD YTD TYPE
# of Students Enrolled At the End of Previous Month 20 52 51 51 52 45.2 Average
# of Students Added During the Month 34 1 3 2 0 8.0 Average
# of Students Exited During the Month 2 2 3 1 5 2.6 Average
# Enrolled at End of the Month 52 51 51 52 47 50.6 Average
Total Students Active During Month 54 53 54 53 52 53.2 Average
Total Enrolled Year To Date 54 55 58 60 60 60.0 Total
STUDENT EXIT REASONS Aug‐12 Sep‐12 Oct‐12 Nov‐12 Dec‐12 YTD YTD TYPE
Returned to Home High School 1 0 1 0 0 2 Total
Transferred from School System 1 0 0 1 2 4 Total
Dropped Out 0 1 1 0 0 2 Total
Department of Juvenile Justice 0 0 0 0 0 0 Total
GED 0 0 0 0 0 0 Total
Other 0 0 0 0 0 0 Total
Certificate of Attendance 0 0 0 0 0 0 Total
Graduated Total (See Detail Below) 0 1 1 0 3 5 Total
To 4 Year College 0 0 0 0 0 0 Total
To 2 Year College 0 1 0 0 1 2 Total
To Technical College 0 0 0 0 0 0 Total
To Military 0 0 0 0 0 0 Total
To Employment 0 0 1 0 1 2 Total
Other Graduate/Unknown 0 0 0 0 1 1 Total
Month
Mid‐Year Formative Report on Race to the Top Submitted: April 3rd, 2013 Performance Learning Centers FY2013 Page 23 of 58
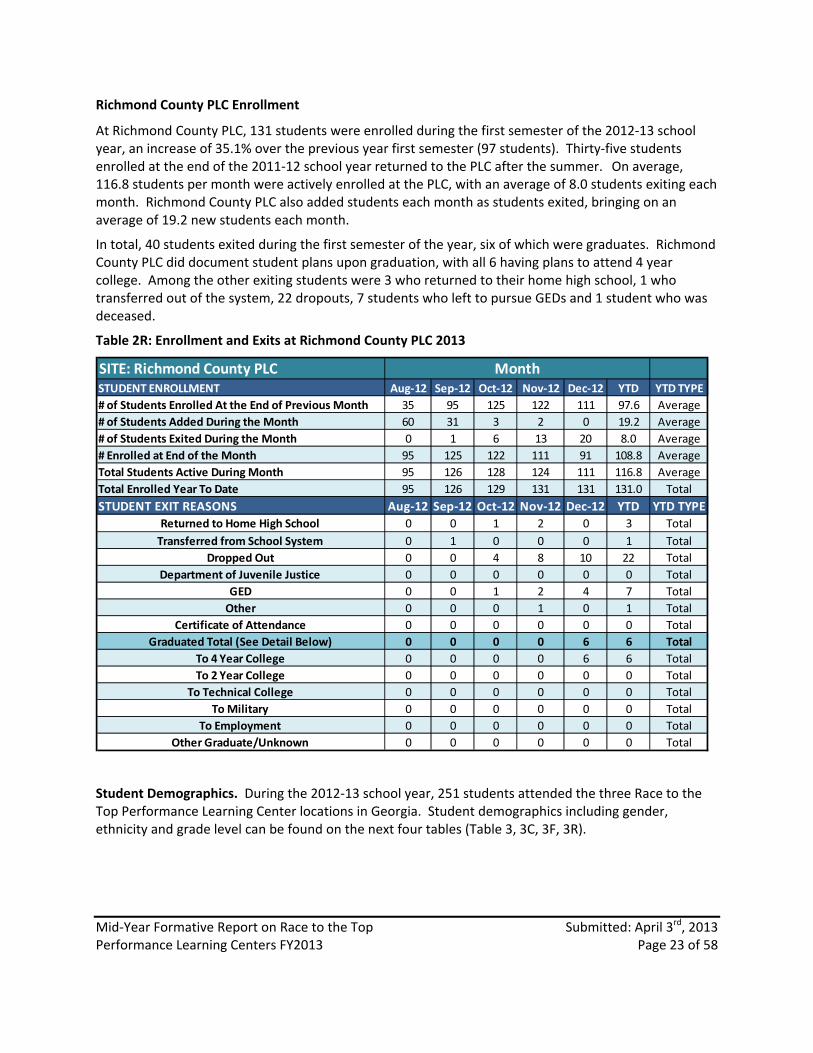
Richmond County PLC Enrollment
At Richmond County PLC, 131 students were enrolled during the first semester of the 2012‐13 school year, an increase of 35.1% over the previous year first semester (97 students). Thirty‐five students enrolled at the end of the 2011‐12 school year returned to the PLC after the summer. On average, 116.8 students per month were actively enrolled at the PLC, with an average of 8.0 students exiting each month. Richmond County PLC also added students each month as students exited, bringing on an average of 19.2 new students each month.
In total, 40 students exited during the first semester of the year, six of which were graduates. Richmond County PLC did document student plans upon graduation, with all 6 having plans to attend 4 year college. Among the other exiting students were 3 who returned to their home high school, 1 who transferred out of the system, 22 dropouts, 7 students who left to pursue GEDs and 1 student who was deceased.
Table 2R: Enrollment and Exits at Richmond County PLC 2013
SITE: Richmond County PLCSTUDENT ENROLLMENT Aug‐12 Sep‐12 Oct‐12 Nov‐12 Dec‐12 YTD YTD TYPE
# of Students Enrolled At the End of Previous Month 35 95 125 122 111 97.6 Average
# of Students Added During the Month 60 31 3 2 0 19.2 Average
# of Students Exited During the Month 0 1 6 13 20 8.0 Average
# Enrolled at End of the Month 95 125 122 111 91 108.8 Average
Total Students Active During Month 95 126 128 124 111 116.8 Average
Total Enrolled Year To Date 95 126 129 131 131 131.0 Total
STUDENT EXIT REASONS Aug‐12 Sep‐12 Oct‐12 Nov‐12 Dec‐12 YTD YTD TYPE
Returned to Home High School 0 0 1 2 0 3 Total
Transferred from School System 0 1 0 0 0 1 Total
Dropped Out 0 0 4 8 10 22 Total
Department of Juvenile Justice 0 0 0 0 0 0 Total
GED 0 0 1 2 4 7 Total
Other 0 0 0 1 0 1 Total
Certificate of Attendance 0 0 0 0 0 0 Total
Graduated Total (See Detail Below) 0 0 0 0 6 6 Total
To 4 Year College 0 0 0 0 6 6 Total
To 2 Year College 0 0 0 0 0 0 Total
To Technical College 0 0 0 0 0 0 Total
To Military 0 0 0 0 0 0 Total
To Employment 0 0 0 0 0 0 Total
Other Graduate/Unknown 0 0 0 0 0 0 Total
Month
Student Demographics. During the 2012‐13 school year, 251 students attended the three Race to the Top Performance Learning Center locations in Georgia. Student demographics including gender, ethnicity and grade level can be found on the next four tables (Table 3, 3C, 3F, 3R).

Mid‐Year Formative Report on Race to the Top Submitted: April 3rd, 2013 Performance Learning Centers FY2013 Page 24 of 58
Ethnicity and Gender. The student population served across the three PLCs during the first semester of the 2013 school year is ethnically diverse, with 61.8% of students being African American, 4.8% Hispanic, 2.4% multi‐racial and 30.7% white. However, closer examination of the individual PLCs shows that the student ethnic populations at each of the PLCs differed greatly (see Tables 3C, 3F and 3R). Overall, Carrollton City and Richmond County PLCs were more ethnically diverse, while the Floyd County PLC student population is primarily white (78.3%).
As to gender, slightly more males were enrolled overall (54.6%) than females (45.4%). This is the reverse of the trend of the 2011‐12 school year. Overall, African American males had the largest enrollment across all PLCs (32.7%), followed by African American females (29.1%), white males (19.1%) and white females (11.6%).
Student Grade Level. Freshmen comprised 25.5% of PLC students, with 22.3% being sophomores, 24.7% being juniors, and 24.7% classified as seniors during the first semester. The Carrollton City PLC also serves 8th graders, who constitute 2.8% of PLC enrolled students.
Table 3: Student Demographics at All PLCs 2013
TOTAL 2013 RT3 PLCs Student Grade Level, Gender and Ethnicity
Gender Ethnicity 8th Grade 9th Grade 10th Grade 11th Grade 12th Grade Total
0 0 0 0 1 1
0.0% 0.0% 0.0% 0.0% 0.4% 0.4%
5 40 34 39 37 155
2.0% 15.9% 13.5% 15.5% 14.7% 61.8%
0 3 3 1 5 12
0.0% 1.2% 1.2% 0.4% 2.0% 4.8%
0 2 3 0 1 6
0.0% 0.8% 1.2% 0.0% 0.4% 2.4%
2 19 16 22 18 77
0.8% 7.6% 6.4% 8.8% 7.2% 30.7%
7 64 56 62 62 251
2.8% 25.5% 22.3% 24.7% 24.7% 100.0%
0 0 0 0 1 1
0.0% 0.0% 0.0% 0.0% 0.4% 0.4%
4 20 15 19 15 73
1.6% 8.0% 6.0% 7.6% 6.0% 29.1%
0 2 2 1 1 6
0.0% 0.8% 0.8% 0.4% 0.4% 2.4%
0 1 3 0 1 5
0.0% 0.4% 1.2% 0.0% 0.4% 2.0%
1 4 9 8 7 29
0.4% 1.6% 3.6% 3.2% 2.8% 11.6%
5 27 29 28 25 114
2.0% 10.8% 11.6% 11.2% 10.0% 45.4%
1 20 19 20 22 82
0.4% 8.0% 7.6% 8.0% 8.8% 32.7%
0 1 1 0 4 6
0.0% 0.4% 0.4% 0.0% 1.6% 2.4%
0 1 0 0 0 1
0.0% 0.4% 0.0% 0.0% 0.0% 0.4%
1 15 7 14 11 48
0.4% 6.0% 2.8% 5.6% 4.4% 19.1%
2 37 27 34 37 137
0.8% 14.7% 10.8% 13.5% 14.7% 54.6%
Multi‐Racial
White
Male Total
Hispanic
Female Total
All
Students
Asian or Pacific
Islander
Hispanic
Multi‐Racial
White
Female Asian or Pacific
Islander
Hispanic
Multi‐Racial
Male
White
Total
Black or African
American
Black or African
American
Black or African
American

Mid‐Year Formative Report on Race to the Top Submitted: April 3rd, 2013 Performance Learning Centers FY2013 Page 25 of 58
Carrollton City PLC Student Ethnicity, Gender and Grade Level
The student population served by Carrollton City PLC during the first semester of the 2013 school year is ethnically diverse, with 61.7% of students being African American, 6.7% Hispanic, 8.3% multi‐racial and 23.3% white. Compared to the district ethnic distribution, African American students are over‐represented at nearly double the district population (31.7% African American in district), and white students constitute about half the percentage attending in the district overall.
As to gender, more females were enrolled at Carrollton City PLC overall (56.7%) than males (43.3%). Overall, African American females had the largest enrollment (35.0%), followed by African American males (26.7%), white males (13.3%) and white females (10.0%).
The Carrollton City PLC serves students from 8th grade to 12th grade. Eighth grade students constitute 11.7% of PLC enrolled students, with 46.7% being freshmen, 15.0% being sophomores, 6.7% being juniors, and 10.0% classified as seniors during the first semester.
Table 3C: Student Demographics at Carrollton City PLC 2013
SITE: Carrollton City PLC
Gender Ethnicity 8th Grade 9th Grade 10th Grade 11th Grade 12th Grade Total
5 19 4 6 3 37
8.3% 31.7% 6.7% 10.0% 5.0% 61.7%
0 1 1 0 2 4
0.0% 1.7% 1.7% 0.0% 3.3% 6.7%
0 2 3 0 0 5
0.0% 3.3% 5.0% 0.0% 0.0% 8.3%
2 6 1 4 1 14
3.3% 10.0% 1.7% 6.7% 1.7% 23.3%
7 28 9 10 6 60
11.7% 46.7% 15.0% 16.7% 10.0% 100.0%
4 9 3 4 1 21
6.7% 15.0% 5.0% 6.7% 1.7% 35.0%
0 1 1 0 1 3
0.0% 1.7% 1.7% 0.0% 1.7% 5.0%
0 1 3 0 0 4
0.0% 1.7% 5.0% 0.0% 0.0% 6.7%
1 4 0 1 0 6
1.7% 6.7% 0.0% 1.7% 0.0% 10.0%
5 15 7 5 2 34
8.3% 25.0% 11.7% 8.3% 3.3% 56.7%
1 10 1 2 2 16
1.7% 16.7% 1.7% 3.3% 3.3% 26.7%
0 0 0 0 1 1
0.0% 0.0% 0.0% 0.0% 1.7% 1.7%
Multi‐Racial 0 1 0 0 0 1
0.0% 1.7% 0.0% 0.0% 0.0% 1.7%
1 2 1 3 1 8
1.7% 3.3% 1.7% 5.0% 1.7% 13.3%
2 13 2 5 4 26
3.3% 21.7% 3.3% 8.3% 6.7% 43.3%
Male
Student Grade Level, Gender and Ethnicity
Female Black or African
American
Hispanic
All
Students
Black or African
American
Hispanic
Multi‐Racial
White
Total
Multi‐Racial
White
Female Total
Hispanic
White
Male Total
Black or African
American

Mid‐Year Formative Report on Race to the Top Submitted: April 3rd, 2013 Performance Learning Centers FY2013 Page 26 of 58
Floyd County PLC Student Ethnicity, Gender and Grade Level
The student population served by Floyd County PLC during the first semester of the 2013 school year is largely white, with 78.3% of students being white, 10.0% African American, 10.0% Hispanic, and 1.7% multi‐racial. While the PLC student population is comprised mostly of white students, minority students are represented at a rate higher than the district average.
As to gender, more males were enrolled at Floyd County PLC overall (53.3%) than females (46.7%). Overall, white males had the largest enrollment (43.3%), followed by white females (35.0%), African American females (6.7%), Hispanic males (5.6%), with African American males and Hispanic females each constituting 3.3% of the student population.
Freshmen comprised 23.3% of Floyd County PLC students, with 28.3% being sophomores, 21.7% being
juniors, and 26.7% classified as seniors during the first semester.
Table 3F: Student Demographics at Floyd County PLC 2013
SITE: Floyd County PLC Student Grade Level, Gender and Ethnicity
Gender Ethnicity 9th Grade 10th Grade 11th Grade 12th Grade Total
2 2 1 1 6
3.3% 3.3% 1.7% 1.7% 10.0%
1 2 1 2 6
1.7% 3.3% 1.7% 3.3% 10.0%
0 0 0 1 1
0.0% 0.0% 0.0% 1.7% 1.7%
11 13 11 12 47
18.3% 21.7% 18.3% 20.0% 78.3%
14 17 13 16 60
23.3% 28.3% 21.7% 26.7% 100.0%
1 1 1 1 4
1.7% 1.7% 1.7% 1.7% 6.7%
0 1 1 0 2
0.0% 1.7% 1.7% 0.0% 3.3%
0 0 0 1 1
0.0% 0.0% 0.0% 1.7% 1.7%
0 8 7 6 21
0.0% 13.3% 11.7% 10.0% 35.0%
1 10 9 8 28
1.7% 16.7% 15.0% 13.3% 46.7%
1 1 0 0 2
1.7% 1.7% 0.0% 0.0% 3.3%
Hispanic 1 1 0 2 4
1.7% 1.7% 0.0% 3.3% 5.6%
0 0 0 0 0
0.0% 0.0% 0.0% 0.0% 0.0%
11 5 4 6 26
18.3% 8.3% 6.7% 10.0% 43.3%
13 7 4 8 32
21.7% 11.7% 6.7% 13.3% 53.3%
Male
Hispanic
Multi‐Racial
White
Total
Black or African
American
Multi‐Racial
White
Male Total
Female Black or African
American
Hispanic
Multi‐Racial
White
Female Total
All
Students
Black or African
American

Mid‐Year Formative Report on Race to the Top Submitted: April 3rd, 2013 Performance Learning Centers FY2013 Page 27 of 58
Richmond County PLC Student Ethnicity, Gender and Grade Level
The student population served by Floyd County PLC during the first semester of the 2013 school year is largely African American, with 85.5% of students being African American, 12.2% white, 1.5% Hispanic, and 0.8% Asian/Pacific Islander. African American students are represented at a rate higher than the district average (72.7% African American). White and Hispanic students are under‐represented relative to the district population.
As to gender, more males were enrolled at Richmond County PLC overall (60.3%) than females (39.7%). Overall, African American males had the largest enrollment (48.9%), followed by African American females (36.6%), and white males (10.7%). White females made up 1.5% of the students, followed by male and female Hispanic students, each constituting 0.8% of the student population.
Freshmen comprised 16.8% of Richmond County PLC students, with 22.9% being sophomores, 29.8%
being juniors, and 30.5% classified as seniors during the first semester.
Table 3R: Student Demographics at Richmond County PLC 2013
SITE: Richmond County PLC Student Grade Level, Gender and Ethnicity
Gender Ethnicity 9th Grade 10th Grade 11th Grade 12th Grade Total
0 0 0 1 1
0.0% 0.0% 0.0% 0.8% 0.8%
19 28 32 33 112
14.5% 21.4% 24.4% 25.2% 85.5%
1 0 0 1 2
0.8% 0.0% 0.0% 0.8% 1.5%
2 2 7 5 16
1.5% 1.5% 5.3% 3.8% 12.2%
22 30 39 40 131
16.8% 22.9% 29.8% 30.5% 100.0%
0 0 0 1 1
0.0% 0.0% 0.0% 0.8% 0.8%
10 11 14 13 48
7.6% 8.4% 10.7% 9.9% 36.6%
1 0 0 0 1
0.8% 0.0% 0.0% 0.0% 0.8%
0 1 0 1 2
0.0% 0.8% 0.0% 0.8% 1.5%
11 12 14 15 52
8.4% 9.2% 10.7% 11.5% 39.7%
9 17 18 20 64
6.9% 13.0% 13.7% 15.3% 48.9%
Hispanic 0 0 0 1 1
0.0% 0.0% 0.0% 0.8% 0.8%
2 1 7 4 14
1.5% 0.8% 5.3% 3.1% 10.7%
11 18 25 25 79
8.4% 13.7% 19.1% 19.1% 60.3%
Total
Male
All
Students
Asian or Pacific
Islander
Black or African
American
Hispanic
White
Black or African
American
White
Male Total
Female Asian or Pacific
Islander
Black or African
American
Hispanic
White
Female Total

Mid‐Year Formative Report on Race to the Top Submitted: April 3rd, 2013 Performance Learning Centers FY2013 Page 28 of 58
Age of Student Population. The tables on the page that follows (Table 4, 4C, 4F, 4R) present age of the student population overall and at each PLC at the start of the 2012‐13 school year, showing the minimum, maximum and average age of PLC students by grade level relative to their expected maximum age if a student is on track for on‐time graduation. For the high school level students, the average age figures indicate student populations that are behind for on‐time graduation, so for many, the self‐paced learning environment at Performance Learning Centers is a final chance of achieving a high school diploma. Freshmen average age was 16, 1 year older than students would be if they had never been retained. Tenth graders were, on average, 1.3 years older than expected, juniors 0.9 years older and seniors 0.6 years older on average.
The maximum ages for the grade levels indicate that some of the students are as much as 4.9 years over the maximum expected age for their grade level. For 9th graders, the highest age reported was 19.9, for sophomores the highest age was 20.2, for juniors 20 and 20.7 for seniors.
Table 4: Student Age by Grade Level, Gender and Ethnicity ‐ All PLCs 2012
2013 RT3 PLCsAge at Beginning of the Year
Expected Max Age 14 15 16 17 18
Gender Ethnicity Average Min Max Average Min Max Average Min Max Average Min Max Average Min Max Average Min Max
Asian or Pacific Islander 20.3 20.3 20.3 20.3 20.3 20.3
Black or African American 13.6 13.1 14.3 16.3 14.1 19.9 17.9 15.4 20.2 18 14.1 20 18.9 17.9 20.6 17.5 13.1 20.6
Hispanic 17 16.4 17.6 17.1 15.4 18.8 17.1 17.1 17.1 17.3 17.3 17.3 17.1 15.4 18.8
Multi‐Racial 14 14 14 16.3 15.5 16.9 18.4 18.4 18.4 16.2 14 18.4
White 13.2 13.2 13.2 14.9 14.2 16.1 16.2 14.9 17.3 17 16.1 17.7 17.9 17.2 19.3 16.6 13.2 19.3
Total Females 13.5 13.1 14.3 16.1 14 19.9 17.1 14.9 20.2 17.7 14.1 20 18.6 17.2 20.6 17.2 13.1 20.6
Black or African American 14.2 14.2 14.2 16 14 19.4 17.8 15.4 20.1 18.4 16.5 19.9 18.8 16.9 20.7 17.7 14 20.7
Hispanic 16.5 16.5 16.5 16.6 16.6 16.6 19.1 18.1 20.7 18.2 16.5 20.7
Multi‐Racial 14.7 14.7 14.7 14.7 14.7 14.7
White 13.7 13.7 13.7 15.7 14.2 17.5 16.9 15.3 19.3 17.8 16.3 19.7 17.9 16.9 19.4 17 13.7 19.7
Total Males 13.9 13.7 14.2 15.9 14 19.4 17.5 15.3 20.1 18.1 16.3 19.9 18.6 16.9 20.7 17.5 13.7 20.7
Asian or Pacific Islander 20.3 20.3 20.3 20.3 20.3 20.3
Black or African American 13.7 13.1 14.3 16.2 14 19.9 17.8 15.4 20.2 18.2 14.1 20 18.9 16.9 20.7 17.6 13.1 20.7
Hispanic 16.8 16.4 17.6 16.9 15.4 18.8 17.1 17.1 17.1 18.7 17.3 20.7 17.7 15.4 20.7
Multi‐Racial 14.4 14 14.7 16.3 15.5 16.9 18.4 18.4 18.4 16 14 18.4
White 13.4 13.2 13.7 15.6 14.2 17.5 16.5 14.9 19.3 17.5 16.1 19.7 17.9 16.9 19.4 16.8 13.2 19.7
Total 13.6 13.1 14.3 16 14 19.9 17.3 14.9 20.2 17.9 14.1 20 18.6 16.9 20.7 17.3 13.1 20.7
Female
Male
Total
Student Grade Level, Gender and Ethnicity9th Grade 10th Grade 11th Grade 12th Grade Total8th Grade
On average, students at Carrollton City PLC did not have as wide a gap in age compared with
expectations. Freshmen were on average 0.2 years younger than the expected maximum age,
sophomores 0.5 years older, juniors 0.5 years younger and seniors 0.1 year older.
The maximum ages for the grade levels indicate that some of the students are as much as 2.8 years over
the maximum expected age for their grade level. For 9th graders, the highest age reported was 16.5, for
sophomores the highest age was 18.2, for juniors 18.1 and 19.7 for seniors. Given that it is possible for
students to earn twice the credits per year at PLC than they would at a traditional school, it is possible
that over 85 percent of the students enrolled at the Carrollton City PLC could graduate on‐time or early.

Mid‐Year Formative Report on Race to the Top Submitted: April 3rd, 2013 Performance Learning Centers FY2013 Page 29 of 58
Table 4C: Student Age by Grade Level, Gender and Ethnicity ‐ Carrollton City PLC 2013
SITE: Carrollton City PLCAge at Beginning of the Year
Expected Max Age 14 15 16 17 18
Gender Ethnicity Average Min Max Average Min Max Average Min Max Average Min Max Average Min Max Average Min Max
Black or African American 13.6 13.1 14.3 14.8 14.1 15.6 16.3 15.4 16.8 16.5 14.1 18.1 19.7 19.7 19.7 15.3 13.1 19.7
Hispanic 16.4 16.4 16.4 18.8 18.8 18.8 17.3 17.3 17.3 17.5 16.4 18.8
Multi‐Racial 14 14 14 16.3 15.5 16.9 15.7 14 16.9
White 13.2 13.2 13.2 14.9 14.2 16.1 16.1 16.1 16.1 14.8 13.2 16.1
Total Females 13.5 13.1 14.3 14.9 14 16.4 16.6 15.4 18.8 16.4 14.1 18.1 18.5 17.3 19.7 15.5 13.1 19.7
Black or African American 14.2 14.2 14.2 14.8 14 15.6 15.4 15.4 15.4 16.7 16.7 16.7 17.6 16.9 18.3 15.3 14 18.3
Hispanic 18.9 18.9 18.9 18.9 18.9 18.9
Multi‐Racial 14.7 14.7 14.7 14.7 14.7 14.7
White 13.7 13.7 13.7 14.6 14.2 15 16.7 16.7 16.7 16.4 16.3 16.4 17.4 17.4 17.4 15.7 13.7 17.4
Total Males 13.9 13.7 14.2 14.8 14 15.6 16.1 15.4 16.7 16.5 16.3 16.7 17.9 16.9 18.9 15.5 13.7 18.9
Black or African American 13.7 13.1 14.3 14.8 14 15.6 16.1 15.4 16.8 16.6 14.1 18.1 18.3 16.9 19.7 15.4 13.1 19.7
Hispanic 16.4 16.4 16.4 18.8 18.8 18.8 18.1 17.3 18.9 17.9 16.4 18.9
Multi‐Racial 14.4 14 14.7 16.3 15.5 16.9 15.5 14 16.9
White 13.4 13.2 13.7 14.8 14.2 16.1 16.7 16.7 16.7 16.4 16.1 16.7 17.4 17.4 17.4 15.4 13.2 17.4
Total 13.6 13.1 14.3 14.8 14 16.4 16.5 15.4 18.8 16.5 14.1 18.1 18.1 16.9 19.7 15.5 13.1 19.7
Female
Male
Total
Student Grade Level, Gender and Ethnicity9th Grade 10th Grade 11th Grade 12th Grade Total8th Grade
Students at Floyd County PLC also did not have as wide a gap in age compared with expectations.
Freshmen were on average 0.7 years older than expected, sophomores 0.4 years older, juniors 0.4 years
older and seniors 0.3 years younger than the expected maximum age at entry.
The maximum ages for the grade levels indicate that some of the students are as much as 2.2 years over
the maximum expected age for their grade level. For 9th graders, the highest age reported was 16.9, for
sophomores the highest age was 18.2, for juniors 18.8 and 18.8 for seniors. Given that it is possible for
students to earn twice the credits per year at PLC than they would at a traditional school, it is possible
that over 80 percent of the students enrolled at the Floyd County PLC have the potential to graduate on‐
time or early.
Table 4F: Student Age by Grade Level, Gender and Ethnicity ‐ Floyd County PLC 2013
SITE: Floyd County PLCAge at Beginning of the Year
Expected Max Age 15 16 17 18
Gender Ethnicity Average Min Max Average Min Max Average Min Max Average Min Max Average Min Max
Black or African American 14.6 14.6 14.6 18.2 18.2 18.2 17 17 17 17.9 17.9 17.9 16.9 14.6 18.2
Hispanic 15.4 15.4 15.4 17.1 17.1 17.1 16.3 15.4 17.1
Multi‐Racial 18.4 18.4 18.4 18.4 18.4 18.4
White 16.2 14.9 17.3 17.2 16.2 17.7 17.7 17.2 18.8 16.9 14.9 18.8
Total Females 14.6 14.6 14.6 16.3 14.9 18.2 17.1 16.2 17.7 17.8 17.2 18.8 16.9 14.6 18.8
Black or African American 15.3 15.3 15.3 16.7 16.7 16.7 16 15.3 16.7
Hispanic 16.5 16.5 16.5 16.6 16.6 16.6 18.3 18.1 18.5 17.4 16.5 18.5
White 15.8 15.1 16.9 16.5 15.3 17.5 18 16.7 18.8 17.4 16.9 18.1 16.6 15.1 18.8
Total Males 15.8 15.1 16.9 16.5 15.3 17.5 18 16.7 18.8 17.6 16.9 18.5 16.7 15.1 18.8
Black or African American 14.9 14.6 15.3 17.4 16.7 18.2 17 17 17 17.9 17.9 17.9 16.6 14.6 18.2
Hispanic 16.5 16.5 16.5 16 15.4 16.6 17.1 17.1 17.1 18.3 18.1 18.5 17 15.4 18.5
Multi‐Racial 18.4 18.4 18.4 18.4 18.4 18.4
White 15.8 15.1 16.9 16.3 14.9 17.5 17.5 16.2 18.8 17.5 16.9 18.8 16.8 14.9 18.8
Total 15.7 14.6 16.9 16.4 14.9 18.2 17.4 16.2 18.8 17.7 16.9 18.8 16.8 14.6 18.8
Total
Female
Student Grade Level, Gender and Ethnicity
Male
Total
10th Grade 11th Grade 12th Grade9th Grade
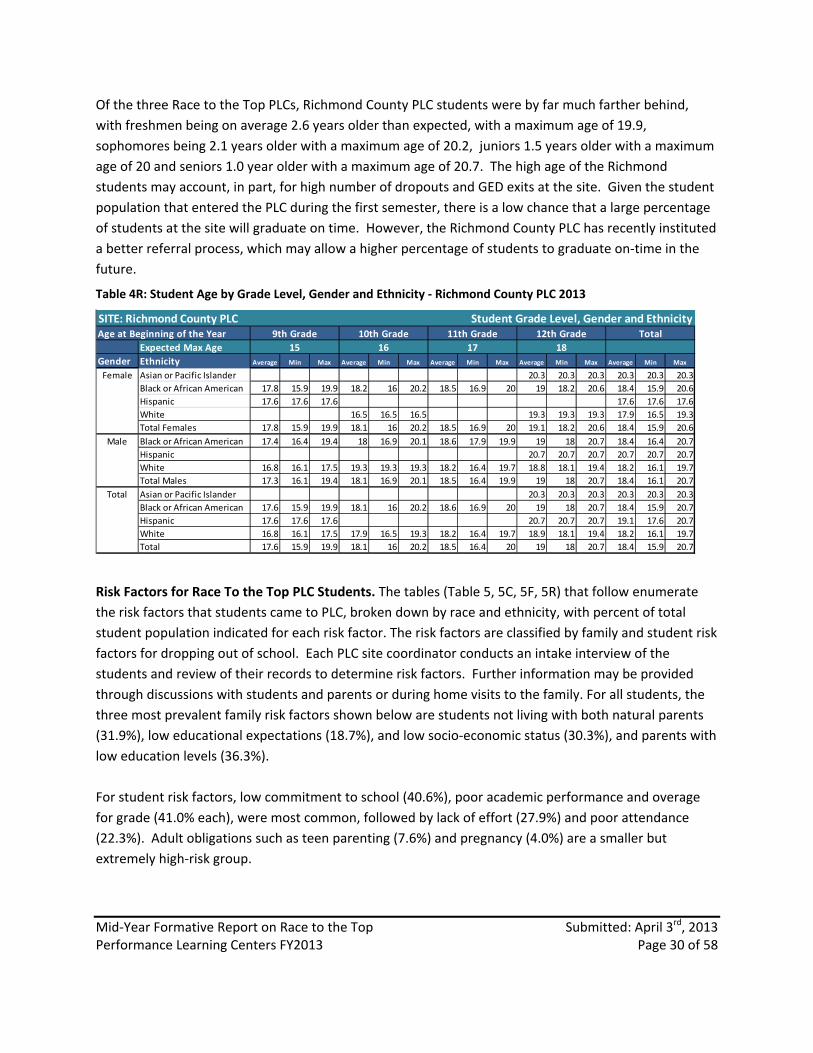
Mid‐Year Formative Report on Race to the Top Submitted: April 3rd, 2013 Performance Learning Centers FY2013 Page 30 of 58
Of the three Race to the Top PLCs, Richmond County PLC students were by far much farther behind,
with freshmen being on average 2.6 years older than expected, with a maximum age of 19.9,
sophomores being 2.1 years older with a maximum age of 20.2, juniors 1.5 years older with a maximum
age of 20 and seniors 1.0 year older with a maximum age of 20.7. The high age of the Richmond
students may account, in part, for high number of dropouts and GED exits at the site. Given the student
population that entered the PLC during the first semester, there is a low chance that a large percentage
of students at the site will graduate on time. However, the Richmond County PLC has recently instituted
a better referral process, which may allow a higher percentage of students to graduate on‐time in the
future.
Table 4R: Student Age by Grade Level, Gender and Ethnicity ‐ Richmond County PLC 2013
SITE: Richmond County PLCAge at Beginning of the Year
Expected Max Age 15 16 17 18
Gender Ethnicity Average Min Max Average Min Max Average Min Max Average Min Max Average Min Max
Asian or Pacific Islander 20.3 20.3 20.3 20.3 20.3 20.3
Black or African American 17.8 15.9 19.9 18.2 16 20.2 18.5 16.9 20 19 18.2 20.6 18.4 15.9 20.6
Hispanic 17.6 17.6 17.6 17.6 17.6 17.6
White 16.5 16.5 16.5 19.3 19.3 19.3 17.9 16.5 19.3
Total Females 17.8 15.9 19.9 18.1 16 20.2 18.5 16.9 20 19.1 18.2 20.6 18.4 15.9 20.6
Black or African American 17.4 16.4 19.4 18 16.9 20.1 18.6 17.9 19.9 19 18 20.7 18.4 16.4 20.7
Hispanic 20.7 20.7 20.7 20.7 20.7 20.7
White 16.8 16.1 17.5 19.3 19.3 19.3 18.2 16.4 19.7 18.8 18.1 19.4 18.2 16.1 19.7
Total Males 17.3 16.1 19.4 18.1 16.9 20.1 18.5 16.4 19.9 19 18 20.7 18.4 16.1 20.7
Asian or Pacific Islander 20.3 20.3 20.3 20.3 20.3 20.3
Black or African American 17.6 15.9 19.9 18.1 16 20.2 18.6 16.9 20 19 18 20.7 18.4 15.9 20.7
Hispanic 17.6 17.6 17.6 20.7 20.7 20.7 19.1 17.6 20.7
White 16.8 16.1 17.5 17.9 16.5 19.3 18.2 16.4 19.7 18.9 18.1 19.4 18.2 16.1 19.7
Total 17.6 15.9 19.9 18.1 16 20.2 18.5 16.4 20 19 18 20.7 18.4 15.9 20.7
Female
Male
Total
9th Grade 10th Grade 11th Grade 12th Grade Total
Student Grade Level, Gender and Ethnicity
Risk Factors for Race To the Top PLC Students. The tables (Table 5, 5C, 5F, 5R) that follow enumerate
the risk factors that students came to PLC, broken down by race and ethnicity, with percent of total
student population indicated for each risk factor. The risk factors are classified by family and student risk
factors for dropping out of school. Each PLC site coordinator conducts an intake interview of the
students and review of their records to determine risk factors. Further information may be provided
through discussions with students and parents or during home visits to the family. For all students, the
three most prevalent family risk factors shown below are students not living with both natural parents
(31.9%), low educational expectations (18.7%), and low socio‐economic status (30.3%), and parents with
low education levels (36.3%).
For student risk factors, low commitment to school (40.6%), poor academic performance and overage
for grade (41.0% each), were most common, followed by lack of effort (27.9%) and poor attendance
(22.3%). Adult obligations such as teen parenting (7.6%) and pregnancy (4.0%) are a smaller but
extremely high‐risk group.

Mid‐Year Formative Report on Race to the Top Submitted: April 3rd, 2013 Performance Learning Centers FY2013 Page 31 of 58
Table 5: Risk Factors ‐ All PLCs 2013
2013 Race To The Top PLC Students
Grand
TotalRisk Factor Type Risk Factor F Total F M Total F M Total F F Total F M Total
0 0 5 2 7 0 3 3 1 0 1 12 15 27 38
0.0% 0.0% 2.0% 0.8% 2.8% 0.0% 1.2% 1.2% 0.4% 0.0% 0.4% 4.8% 6.0% 10.8% 15.1%0 0 2 1 3 1 0 1 0 0 0 1 1 2 6
0.0% 0.0% 0.8% 0.4% 1.2% 0.4% 0.0% 0.4% 0.0% 0.0% 0.0% 0.4% 0.4% 0.8% 2.4%0 0 3 3 6 0 0 0 0 0 0 7 16 23 29
0.0% 0.0% 1.2% 1.2% 2.4% 0.0% 0.0% 0.0% 0.0% 0.0% 0.0% 2.8% 6.4% 9.2% 11.6%
0 0 1 1 2 1 0 1 1 0 1 1 0 1 50.0% 0.0% 0.4% 0.4% 0.8% 0.4% 0.0% 0.4% 0.4% 0.0% 0.4% 0.4% 0.0% 0.4% 2.0%
0 0 3 4 7 1 4 5 1 0 1 12 22 34 47
0.0% 0.0% 1.2% 1.6% 2.8% 0.4% 1.6% 2.0% 0.4% 0.0% 0.4% 4.8% 8.8% 13.5% 18.7%0 0 5 5 10 0 0 0 0 0 0 4 1 5 15
0.0% 0.0% 2.0% 2.0% 4.0% 0.0% 0.0% 0.0% 0.0% 0.0% 0.0% 1.6% 0.4% 2.0% 6.0%
0 0 13 11 24 4 5 9 2 0 2 14 27 41 760.0% 0.0% 5.2% 4.4% 9.6% 1.6% 2.0% 3.6% 0.8% 0.0% 0.8% 5.6% 10.8% 16.3% 30.3%
0 0 27 28 55 2 1 3 3 0 3 6 13 19 800.0% 0.0% 10.8% 11.2% 21.9% 0.8% 0.4% 1.2% 1.2% 0.0% 1.2% 2.4% 5.2% 7.6% 31.9%
0 0 2 5 7 1 4 5 1 0 1 11 16 27 40
0.0% 0.0% 0.8% 2.0% 2.8% 0.4% 1.6% 2.0% 0.4% 0.0% 0.4% 4.4% 6.4% 10.8% 15.9%0 0 1 0 1 0 0 0 0 0 0 0 0 0 1
0.0% 0.0% 0.4% 0.0% 0.4% 0.0% 0.0% 0.0% 0.0% 0.0% 0.0% 0.0% 0.0% 0.0% 0.4%
Family Risk Factors Total 0 0 62 60 122 10 17 27 9 0 9 68 111 179 3370 0 3 1 4 0 0 0 0 0 0 1 6 7 11
0.0% 0.0% 1.2% 0.4% 1.6% 0.0% 0.0% 0.0% 0.0% 0.0% 0.0% 0.4% 2.4% 2.8% 4.4%
0 0 0 0 0 0 0 0 0 0 0 6 3 9 90.0% 0.0% 0.0% 0.0% 0.0% 0.0% 0.0% 0.0% 0.0% 0.0% 0.0% 2.4% 1.2% 3.6% 3.6%
0 0 0 0 0 0 0 0 0 0 0 1 0 1 10.0% 0.0% 0.0% 0.0% 0.0% 0.0% 0.0% 0.0% 0.0% 0.0% 0.0% 0.4% 0.0% 0.4% 0.4%
0 0 1 1 2 0 0 0 0 0 0 3 0 3 5
0.0% 0.0% 0.4% 0.4% 0.8% 0.0% 0.0% 0.0% 0.0% 0.0% 0.0% 1.2% 0.0% 1.2% 2.0%0 0 0 0 0 1 1 2 0 0 0 3 3 6 8
0.0% 0.0% 0.0% 0.0% 0.0% 0.4% 0.4% 0.8% 0.0% 0.0% 0.0% 1.2% 1.2% 2.4% 3.2%
0 0 0 3 3 0 0 0 0 0 0 1 0 1 40.0% 0.0% 0.0% 1.2% 1.2% 0.0% 0.0% 0.0% 0.0% 0.0% 0.0% 0.4% 0.0% 0.4% 1.6%
0 0 9 18 27 1 4 5 1 0 1 11 26 37 70
0.0% 0.0% 3.6% 7.2% 10.8% 0.4% 1.6% 2.0% 0.4% 0.0% 0.4% 4.4% 10.4% 14.7% 27.9%0 0 1 1 2 0 0 0 0 0 0 1 1 2 4
0.0% 0.0% 0.4% 0.4% 0.8% 0.0% 0.0% 0.0% 0.0% 0.0% 0.0% 0.4% 0.4% 0.8% 1.6%1 1 16 30 46 2 4 6 1 0 1 17 31 48 102
0.4% 0.4% 6.4% 12.0% 18.3% 0.8% 1.6% 2.4% 0.4% 0.0% 0.4% 6.8% 12.4% 19.1% 40.6%
0 0 5 1 6 2 3 5 1 0 1 8 15 23 350.0% 0.0% 2.0% 0.4% 2.4% 0.8% 1.2% 2.0% 0.4% 0.0% 0.4% 3.2% 6.0% 9.2% 13.9%
0 0 1 7 8 1 1 2 0 0 0 5 8 13 23
0.0% 0.0% 0.4% 2.8% 3.2% 0.4% 0.4% 0.8% 0.0% 0.0% 0.0% 2.0% 3.2% 5.2% 9.2%0 0 0 0 0 1 0 1 1 0 1 3 4 7 9
0.0% 0.0% 0.0% 0.0% 0.0% 0.4% 0.0% 0.4% 0.4% 0.0% 0.4% 1.2% 1.6% 2.8% 3.6%
1 1 46 49 95 1 2 3 3 1 4 10 19 29 1320.4% 0.4% 18.3% 19.5% 37.8% 0.4% 0.8% 1.2% 1.2% 0.4% 1.6% 4.0% 7.6% 11.6% 52.6%
1 1 24 40 64 0 5 5 0 0 0 10 23 33 1030.4% 0.4% 9.6% 15.9% 25.5% 0.0% 2.0% 2.0% 0.0% 0.0% 0.0% 4.0% 9.2% 13.1% 41.0%
0 0 23 37 60 3 2 5 0 0 0 11 27 38 103
0.0% 0.0% 9.2% 14.7% 23.9% 1.2% 0.8% 2.0% 0.0% 0.0% 0.0% 4.4% 10.8% 15.1% 41.0%0 0 14 11 25 0 2 2 0 0 0 11 18 29 56
0.0% 0.0% 5.6% 4.4% 10.0% 0.0% 0.8% 0.8% 0.0% 0.0% 0.0% 4.4% 7.2% 11.6% 22.3%
0 0 3 0 3 2 0 2 2 0 2 3 0 3 100.0% 0.0% 1.2% 0.0% 1.2% 0.8% 0.0% 0.8% 0.8% 0.0% 0.8% 1.2% 0.0% 1.2% 4.0%
0 0 22 42 64 2 1 3 0 0 0 8 21 29 96
0.0% 0.0% 8.8% 16.7% 25.5% 0.8% 0.4% 1.2% 0.0% 0.0% 0.0% 3.2% 8.4% 11.6% 38.2%0 0 6 3 9 2 1 3 2 0 2 5 0 5 19
0.0% 0.0% 2.4% 1.2% 3.6% 0.8% 0.4% 1.2% 0.8% 0.0% 0.8% 2.0% 0.0% 2.0% 7.6%
Student Risk Factors Total 3 3 174 244 418 18 26 44 11 1 12 118 205 323 800
All Risk Factors Total 3 3 236 304 540 28 43 71 20 1 21 186 316 502 1137
Family
Teenage Parent
Number & Percent of Students with Risk
Factor
Misbehavior
No extracurricular activity
Other
Over age for grade
Poor academic performance
Student
Family disruption
High family mobility
Large number of siblings
Low educational
expectations
Low parent/guardian
contact with school
Low socioeconomic status
Not living with both natural
parents
Sibling has dropped out of
school
Student Risk Factors by Race and Gender
Ethnicity and Gender
Poor attendance
Pregnancy
Black or African
American Hispanic Multi‐Racial WhiteAsian
Lack of family conversations
about school
Parents with low education
levels
Excessive after school work
hours
Excessive social activity out
of school
Learning disability
Retained in grade
Aggressive behavior
Emotional disturbance
High risk behavior (e.g.,
alcohol, drugs, etc.)
High risk peer group (e.g.,
gangs)
Lack of effort
Low commitment to school
Low educational
expectations
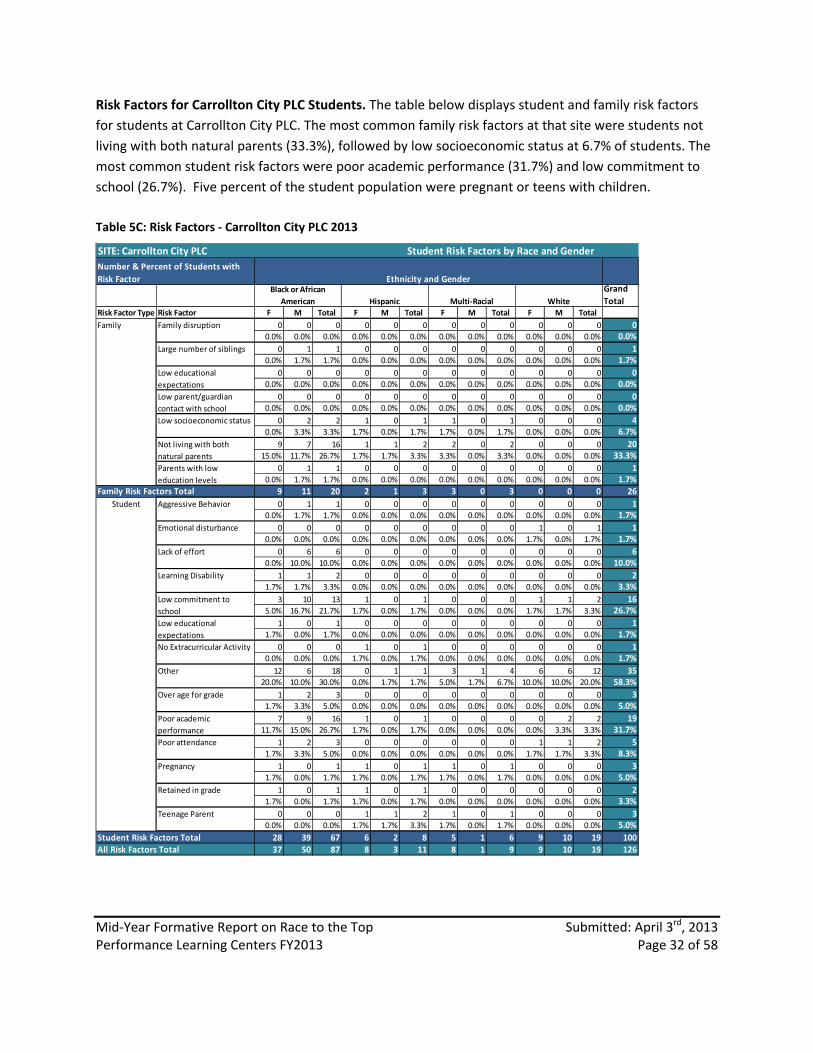
Mid‐Year Formative Report on Race to the Top Submitted: April 3rd, 2013 Performance Learning Centers FY2013 Page 32 of 58
Risk Factors for Carrollton City PLC Students. The table below displays student and family risk factors
for students at Carrollton City PLC. The most common family risk factors at that site were students not
living with both natural parents (33.3%), followed by low socioeconomic status at 6.7% of students. The
most common student risk factors were poor academic performance (31.7%) and low commitment to
school (26.7%). Five percent of the student population were pregnant or teens with children.
Table 5C: Risk Factors ‐ Carrollton City PLC 2013
SITE: Carrollton City PLC Student Risk Factors by Race and Gender
Grand
TotalRisk Factor Type Risk Factor F M Total F M Total F M Total F M Total
0 0 0 0 0 0 0 0 0 0 0 0 00.0% 0.0% 0.0% 0.0% 0.0% 0.0% 0.0% 0.0% 0.0% 0.0% 0.0% 0.0% 0.0%
0 1 1 0 0 0 0 0 0 0 0 0 10.0% 1.7% 1.7% 0.0% 0.0% 0.0% 0.0% 0.0% 0.0% 0.0% 0.0% 0.0% 1.7%
0 0 0 0 0 0 0 0 0 0 0 0 00.0% 0.0% 0.0% 0.0% 0.0% 0.0% 0.0% 0.0% 0.0% 0.0% 0.0% 0.0% 0.0%
0 0 0 0 0 0 0 0 0 0 0 0 00.0% 0.0% 0.0% 0.0% 0.0% 0.0% 0.0% 0.0% 0.0% 0.0% 0.0% 0.0% 0.0%
0 2 2 1 0 1 1 0 1 0 0 0 40.0% 3.3% 3.3% 1.7% 0.0% 1.7% 1.7% 0.0% 1.7% 0.0% 0.0% 0.0% 6.7%
9 7 16 1 1 2 2 0 2 0 0 0 2015.0% 11.7% 26.7% 1.7% 1.7% 3.3% 3.3% 0.0% 3.3% 0.0% 0.0% 0.0% 33.3%
0 1 1 0 0 0 0 0 0 0 0 0 10.0% 1.7% 1.7% 0.0% 0.0% 0.0% 0.0% 0.0% 0.0% 0.0% 0.0% 0.0% 1.7%
Family Risk Factors Total 9 11 20 2 1 3 3 0 3 0 0 0 26
0 1 1 0 0 0 0 0 0 0 0 0 10.0% 1.7% 1.7% 0.0% 0.0% 0.0% 0.0% 0.0% 0.0% 0.0% 0.0% 0.0% 1.7%
0 0 0 0 0 0 0 0 0 1 0 1 10.0% 0.0% 0.0% 0.0% 0.0% 0.0% 0.0% 0.0% 0.0% 1.7% 0.0% 1.7% 1.7%
0 6 6 0 0 0 0 0 0 0 0 0 60.0% 10.0% 10.0% 0.0% 0.0% 0.0% 0.0% 0.0% 0.0% 0.0% 0.0% 0.0% 10.0%
1 1 2 0 0 0 0 0 0 0 0 0 21.7% 1.7% 3.3% 0.0% 0.0% 0.0% 0.0% 0.0% 0.0% 0.0% 0.0% 0.0% 3.3%
3 10 13 1 0 1 0 0 0 1 1 2 165.0% 16.7% 21.7% 1.7% 0.0% 1.7% 0.0% 0.0% 0.0% 1.7% 1.7% 3.3% 26.7%
1 0 1 0 0 0 0 0 0 0 0 0 11.7% 0.0% 1.7% 0.0% 0.0% 0.0% 0.0% 0.0% 0.0% 0.0% 0.0% 0.0% 1.7%
0 0 0 1 0 1 0 0 0 0 0 0 10.0% 0.0% 0.0% 1.7% 0.0% 1.7% 0.0% 0.0% 0.0% 0.0% 0.0% 0.0% 1.7%
12 6 18 0 1 1 3 1 4 6 6 12 3520.0% 10.0% 30.0% 0.0% 1.7% 1.7% 5.0% 1.7% 6.7% 10.0% 10.0% 20.0% 58.3%
1 2 3 0 0 0 0 0 0 0 0 0 31.7% 3.3% 5.0% 0.0% 0.0% 0.0% 0.0% 0.0% 0.0% 0.0% 0.0% 0.0% 5.0%
7 9 16 1 0 1 0 0 0 0 2 2 1911.7% 15.0% 26.7% 1.7% 0.0% 1.7% 0.0% 0.0% 0.0% 0.0% 3.3% 3.3% 31.7%
1 2 3 0 0 0 0 0 0 1 1 2 51.7% 3.3% 5.0% 0.0% 0.0% 0.0% 0.0% 0.0% 0.0% 1.7% 1.7% 3.3% 8.3%
1 0 1 1 0 1 1 0 1 0 0 0 31.7% 0.0% 1.7% 1.7% 0.0% 1.7% 1.7% 0.0% 1.7% 0.0% 0.0% 0.0% 5.0%
1 0 1 1 0 1 0 0 0 0 0 0 21.7% 0.0% 1.7% 1.7% 0.0% 1.7% 0.0% 0.0% 0.0% 0.0% 0.0% 0.0% 3.3%
0 0 0 1 1 2 1 0 1 0 0 0 30.0% 0.0% 0.0% 1.7% 1.7% 3.3% 1.7% 0.0% 1.7% 0.0% 0.0% 0.0% 5.0%
Student Risk Factors Total 28 39 67 6 2 8 5 1 6 9 10 19 100
All Risk Factors Total 37 50 87 8 3 11 8 1 9 9 10 19 126
Aggressive Behavior
Number & Percent of Students with
Risk Factor Ethnicity and GenderBlack or African
American Hispanic Multi‐Racial White
Family Family disruption
Large number of siblings
Low educational
expectations
Low parent/guardian
contact with school
Low socioeconomic status
Not living with both
natural parents
Student
No Extracurricular Activity
Poor attendance
Pregnancy
Retained in grade
Teenage Parent
Emotional disturbance
Lack of effort
Learning Disability
Low commitment to
school
Low educational
expectations
Other
Over age for grade
Poor academic
performance
Parents with low
education levels

Mid‐Year Formative Report on Race to the Top Submitted: April 3rd, 2013 Performance Learning Centers FY2013 Page 33 of 58
Table 5F: Risk Factors ‐ Floyd PLC 2013
SITE: Floyd County PLC Student Risk Factors by Race and Gender
Grand
TotalRisk Factor Type Risk Factor F M Total F M Total F Total F M Total
2 0 2 0 3 3 1 1 12 14 26 323.3% 0.0% 3.3% 0.0% 5.0% 5.0% 1.7% 1.7% 20.0% 23.3% 43.3% 53.3%
1 0 1 0 0 0 0 0 1 0 1 21.7% 0.0% 1.7% 0.0% 0.0% 0.0% 0.0% 0.0% 1.7% 0.0% 1.7% 3.3%
2 2 4 0 0 0 0 0 7 15 22 263.3% 3.3% 6.7% 0.0% 0.0% 0.0% 0.0% 0.0% 11.7% 25.0% 36.7% 43.3%
0 0 0 0 0 0 1 1 1 0 1 20.0% 0.0% 0.0% 0.0% 0.0% 0.0% 1.7% 1.7% 1.7% 0.0% 1.7% 3.3%
2 2 4 1 3 4 1 1 12 22 34 433.3% 3.3% 6.7% 1.7% 5.0% 6.7% 1.7% 1.7% 20.0% 36.7% 56.7% 71.7%
1 0 1 0 0 0 0 0 4 0 4 51.7% 0.0% 1.7% 0.0% 0.0% 0.0% 0.0% 0.0% 6.7% 0.0% 6.7% 8.3%
5 2 7 3 5 8 1 1 14 25 39 558.3% 3.3% 11.7% 5.0% 8.3% 13.3% 1.7% 1.7% 23.3% 41.7% 65.0% 91.7%
1 1 2 0 0 0 1 1 5 7 12 151.7% 1.7% 3.3% 0.0% 0.0% 0.0% 1.7% 1.7% 8.3% 11.7% 20.0% 25.0%
1 2 3 1 4 5 1 1 11 16 27 361.7% 3.3% 5.0% 1.7% 6.7% 8.3% 1.7% 1.7% 18.3% 26.7% 45.0% 60.0%
Family Risk Factors Total 15 9 24 5 15 20 6 6 67 99 166 216
1 0 1 0 0 0 0 0 1 6 7 81.7% 0.0% 1.7% 0.0% 0.0% 0.0% 0.0% 0.0% 1.7% 10.0% 11.7% 13.3%
0 0 0 0 0 0 0 0 5 3 8 80.0% 0.0% 0.0% 0.0% 0.0% 0.0% 0.0% 0.0% 8.3% 5.0% 13.3% 13.3%
0 0 0 0 0 0 0 0 1 0 1 10.0% 0.0% 0.0% 0.0% 0.0% 0.0% 0.0% 0.0% 1.7% 0.0% 1.7% 1.7%
1 0 1 0 0 0 0 0 3 0 3 41.7% 0.0% 1.7% 0.0% 0.0% 0.0% 0.0% 0.0% 5.0% 0.0% 5.0% 6.7%
0 0 0 1 1 2 0 0 3 3 6 80.0% 0.0% 0.0% 1.7% 1.7% 3.3% 0.0% 0.0% 5.0% 5.0% 10.0% 13.3%
0 0 0 0 0 0 0 0 1 0 1 10.0% 0.0% 0.0% 0.0% 0.0% 0.0% 0.0% 0.0% 1.7% 0.0% 1.7% 1.7%
4 1 5 1 4 5 1 1 10 23 33 446.7% 1.7% 8.3% 1.7% 6.7% 8.3% 1.7% 1.7% 16.7% 38.3% 55.0% 73.3%
0 0 0 0 0 0 0 0 1 1 2 20.0% 0.0% 0.0% 0.0% 0.0% 0.0% 0.0% 0.0% 1.7% 1.7% 3.3% 3.3%
1 3 4 1 4 5 1 1 16 26 42 521.7% 5.0% 6.7% 1.7% 6.7% 8.3% 1.7% 1.7% 26.7% 43.3% 70.0% 86.7%
1 1 2 1 3 4 1 1 8 15 23 301.7% 1.7% 3.3% 1.7% 5.0% 6.7% 1.7% 1.7% 13.3% 25.0% 38.3% 50.0%
1 1 2 1 1 2 0 0 5 7 12 161.7% 1.7% 3.3% 1.7% 1.7% 3.3% 0.0% 0.0% 8.3% 11.7% 20.0% 26.7%
0 0 0 0 0 0 1 1 3 4 7 80.0% 0.0% 0.0% 0.0% 0.0% 0.0% 1.7% 1.7% 5.0% 6.7% 11.7% 13.3%
4 2 6 0 4 4 0 0 9 19 28 386.7% 3.3% 10.0% 0.0% 6.7% 6.7% 0.0% 0.0% 15.0% 31.7% 46.7% 63.3%
2 2 4 1 1 2 0 0 10 17 27 333.3% 3.3% 6.7% 1.7% 1.7% 3.3% 0.0% 0.0% 16.7% 28.3% 45.0% 55.0%
2 1 3 0 2 2 0 0 8 17 25 303.3% 1.7% 5.0% 0.0% 3.3% 3.3% 0.0% 0.0% 13.3% 28.3% 41.7% 50.0%
0 0 0 1 0 1 1 1 3 0 3 50.0% 0.0% 0.0% 1.7% 0.0% 1.7% 1.7% 1.7% 5.0% 0.0% 5.0% 8.3%
2 2 4 0 1 1 0 0 6 14 20 253.3% 3.3% 6.7% 0.0% 1.7% 1.7% 0.0% 0.0% 10.0% 23.3% 33.3% 41.7%
0 1 1 1 0 1 1 1 5 0 5 80.0% 1.7% 1.7% 1.7% 0.0% 1.7% 1.7% 1.7% 8.3% 0.0% 8.3% 13.3%
Student Risk Factors Total 19 14 33 8 21 29 6 6 99 155 254 322All Risk Factors Total 34 23 57 13 36 49 12 12 166 254 420 538
Student
Black or African
American Hispanic Multi‐Racial White
Family
Low parent/guardian
contact with school
Low socioeconomic status
Not living with both
natural parents
Parents with low
education levels
Aggressive Behavior
Lack of effort
Low commitment to
school
Low educational
expectations
Teenage Parent
Ethnicity and Gender
Number & Percent of Students with
Risk Factor
Family disruption
Large number of siblings
Low educational
expectations
High family mobility
Lack of family
conversations about
Over age for grade
Poor academic
performance
Poor attendance
Pregnancy
Retained in grade
Learning disability
Misbehavior
No extracurricular activity
Emotional disturbance
High risk peer group (e.g.,
gangs)
Excessive after school
work hours
Excessive social activity
out of school
High risk behavior (e.g.,
alcohol, drugs, etc.)
Risk Factors for Floyd PLC Students. The table above displays student and family risk factors for
students at Floyd PLC. The most common family risk factors were low socioeconomic status at 91.7% of
students, low educational expectations (71.7%), and parents with low education levels at 60%.

Mid‐Year Formative Report on Race to the Top Submitted: April 3rd, 2013 Performance Learning Centers FY2013 Page 34 of 58
For student risk factors, low commitment to school was the most common factor with 86.7% of
students, followed by lack of effort (73.3%) and over age for grade (63.3%). Poor attendance and lack of
effort affected 94% and 91% of all students, both affecting over 90% of students. More than half of the
students had a past history of poor academic performance and attendance. The PLC had the highest
percentage of students who were parents, at 13.3% of the student population.
Table 5R: Risk Factors ‐ Richmond PLC 2013
Grand
TotalRisk Factor Type Risk Factor F Total F M Total F M Total F M Total
0 0 3 2 5 0 0 0 0 1 1 60.0% 0.0% 2.3% 1.5% 3.8% 0.0% 0.0% 0.0% 0.0% 0.8% 0.8% 4.6%
0 0 1 1 2 1 0 1 0 1 1 40.0% 0.0% 0.8% 0.8% 1.5% 0.8% 0.0% 0.8% 0.0% 0.8% 0.8% 3.1%
0 0 1 1 2 0 0 0 0 1 1 30.0% 0.0% 0.8% 0.8% 1.5% 0.0% 0.0% 0.0% 0.0% 0.8% 0.8% 2.3%
0 0 1 0 1 1 0 1 0 0 0 20.0% 0.0% 0.8% 0.0% 0.8% 0.8% 0.0% 0.8% 0.0% 0.0% 0.0% 1.5%
0 0 1 2 3 0 1 1 0 0 0 170.0% 0.0% 0.8% 1.5% 2.3% 0.0% 0.8% 0.8% 0.0% 0.0% 0.0% 13.0%
0 0 4 5 9 0 0 0 0 1 1 100.0% 0.0% 3.1% 3.8% 6.9% 0.0% 0.0% 0.0% 0.0% 0.8% 0.8% 7.6%
0 0 8 7 15 0 0 0 0 2 2 170.0% 0.0% 6.1% 5.3% 11.5% 0.0% 0.0% 0.0% 0.0% 1.5% 1.5% 13.0%
0 0 17 20 37 1 0 1 1 6 7 450.0% 0.0% 13.0% 15.3% 28.2% 0.8% 0.0% 0.8% 0.8% 4.6% 5.3% 34.4%
0 0 1 2 3 0 0 0 0 0 0 30.0% 0.0% 0.8% 1.5% 2.3% 0.0% 0.0% 0.0% 0.0% 0.0% 0.0% 2.3%
0 0 1 0 1 0 0 0 0 0 0 10.0% 0.0% 0.8% 0.0% 0.8% 0.0% 0.0% 0.0% 0.0% 0.0% 0.0% 0.8%
Family Risk Factors Total 0 0 38 40 78 3 1 4 1 12 13 95
0 0 2 0 2 0 0 0 0 0 0 20.0% 0.0% 1.5% 0.0% 1.5% 0.0% 0.0% 0.0% 0.0% 0.0% 0.0% 1.5%
0 0 0 1 1 0 0 0 0 0 0 10.0% 0.0% 0.0% 0.8% 0.8% 0.0% 0.0% 0.0% 0.0% 0.0% 0.0% 0.8%
0 0 0 3 3 0 0 0 0 0 0 30.0% 0.0% 0.0% 2.3% 2.3% 0.0% 0.0% 0.0% 0.0% 0.0% 0.0% 2.3%
0 0 5 11 16 0 0 0 1 3 4 200.0% 0.0% 3.8% 8.4% 12.2% 0.0% 0.0% 0.0% 0.8% 2.3% 3.1% 15.3%
1 1 12 17 29 0 0 0 0 4 4 340.8% 0.8% 9.2% 13.0% 22.1% 0.0% 0.0% 0.0% 0.0% 3.1% 3.1% 26.0%
0 0 3 0 3 1 0 1 0 0 0 40.0% 0.0% 2.3% 0.0% 2.3% 0.8% 0.0% 0.8% 0.0% 0.0% 0.0% 3.1%
0 0 0 4 4 0 0 0 0 1 1 50.0% 0.0% 0.0% 3.1% 3.1% 0.0% 0.0% 0.0% 0.0% 0.8% 0.8% 3.8%
1 1 19 36 55 0 1 1 1 4 5 620.8% 0.8% 14.5% 27.5% 42.0% 0.0% 0.8% 0.8% 0.8% 3.1% 3.8% 47.3%
0 0 14 26 40 1 1 2 1 8 9 510.0% 0.0% 10.7% 19.8% 30.5% 0.8% 0.8% 1.5% 0.8% 6.1% 6.9% 38.9%
0 0 11 8 19 0 0 0 2 0 2 210.0% 0.0% 8.4% 6.1% 14.5% 0.0% 0.0% 0.0% 1.5% 0.0% 1.5% 16.0%
0 0 2 0 2 0 0 0 0 0 0 20.0% 0.0% 1.5% 0.0% 1.5% 0.0% 0.0% 0.0% 0.0% 0.0% 0.0% 1.5%
0 0 19 40 59 1 0 1 2 7 9 690.0% 0.0% 14.5% 30.5% 45.0% 0.8% 0.0% 0.8% 1.5% 5.3% 6.9% 52.7%
0 0 6 2 8 0 0 0 0 0 0 80.0% 0.0% 4.6% 1.5% 6.1% 0.0% 0.0% 0.0% 0.0% 0.0% 0.0% 6.1%
Student Risk Factors Total 3 3 127 191 318 4 3 7 10 40 50 378
Lack of effort
Low commitment to school
Low educational expectations
Misbehavior
Teenage Parent
Low parent/guardian contact
with school
Parents with Low Education
Levels
Sibling has Dropped Out of
School
Aggressive behavior
High risk peer group
Low socioeconomic status
Not living with both natural
parents
Excessive Social Activity Out of
School
Ethnicity and Gender
Number & Percent of Students with Risk
Factor
Family disruption
High family mobility
Low educational expectations
Lack of Family Conversation
About School
Large Number of Siblings
Asian
Student
Black or African
American Hispanic White
Family
Retained in grade
Over age for grade
Poor academic performance
Poor attendance
Pregnancy
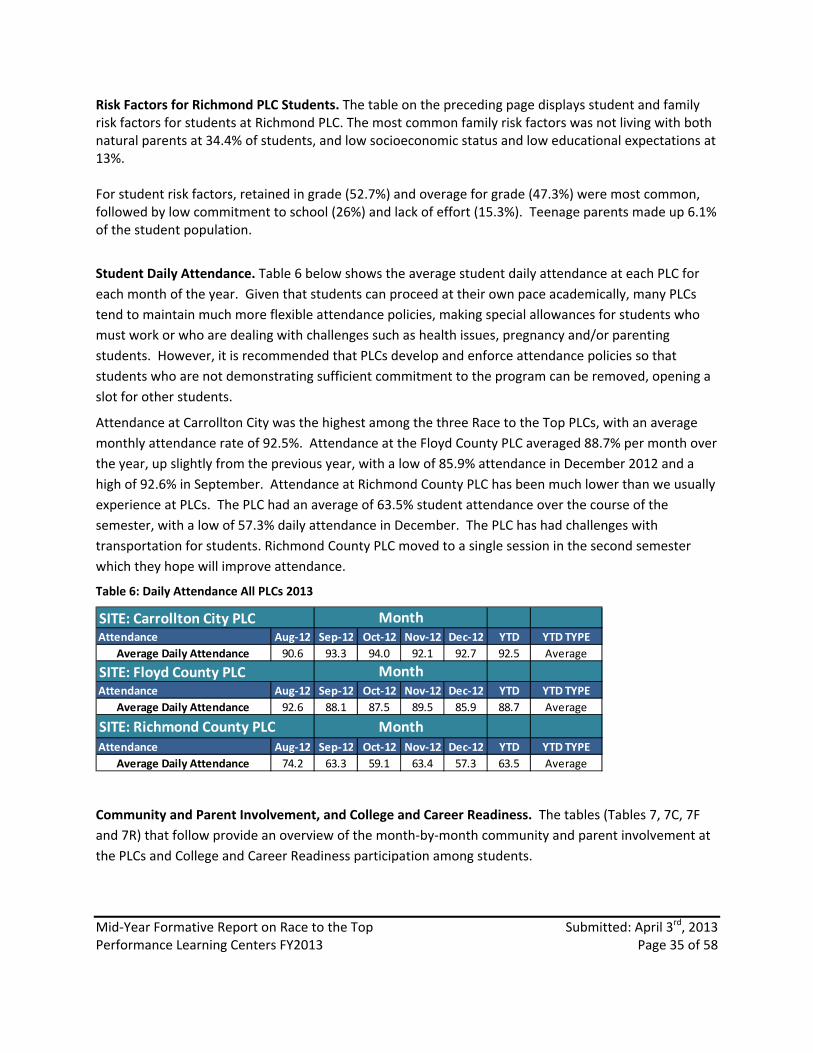
Mid‐Year Formative Report on Race to the Top Submitted: April 3rd, 2013 Performance Learning Centers FY2013 Page 35 of 58
Risk Factors for Richmond PLC Students. The table on the preceding page displays student and family risk factors for students at Richmond PLC. The most common family risk factors was not living with both natural parents at 34.4% of students, and low socioeconomic status and low educational expectations at 13%. For student risk factors, retained in grade (52.7%) and overage for grade (47.3%) were most common, followed by low commitment to school (26%) and lack of effort (15.3%). Teenage parents made up 6.1% of the student population.
Student Daily Attendance. Table 6 below shows the average student daily attendance at each PLC for
each month of the year. Given that students can proceed at their own pace academically, many PLCs
tend to maintain much more flexible attendance policies, making special allowances for students who
must work or who are dealing with challenges such as health issues, pregnancy and/or parenting
students. However, it is recommended that PLCs develop and enforce attendance policies so that
students who are not demonstrating sufficient commitment to the program can be removed, opening a
slot for other students.
Attendance at Carrollton City was the highest among the three Race to the Top PLCs, with an average
monthly attendance rate of 92.5%. Attendance at the Floyd County PLC averaged 88.7% per month over
the year, up slightly from the previous year, with a low of 85.9% attendance in December 2012 and a
high of 92.6% in September. Attendance at Richmond County PLC has been much lower than we usually
experience at PLCs. The PLC had an average of 63.5% student attendance over the course of the
semester, with a low of 57.3% daily attendance in December. The PLC has had challenges with
transportation for students. Richmond County PLC moved to a single session in the second semester
which they hope will improve attendance.
Table 6: Daily Attendance All PLCs 2013
Attendance Aug‐12 Sep‐12 Oct‐12 Nov‐12 Dec‐12 YTD YTD TYPE
Average Daily Attendance 90.6 93.3 94.0 92.1 92.7 92.5 Average
Attendance Aug‐12 Sep‐12 Oct‐12 Nov‐12 Dec‐12 YTD YTD TYPE
Average Daily Attendance 92.6 88.1 87.5 89.5 85.9 88.7 Average
Attendance Aug‐12 Sep‐12 Oct‐12 Nov‐12 Dec‐12 YTD YTD TYPE
Average Daily Attendance 74.2 63.3 59.1 63.4 57.3 63.5 Average
SITE: Carrollton City PLC Month
SITE: Richmond County PLC Month
SITE: Floyd County PLC Month
Community and Parent Involvement, and College and Career Readiness. The tables (Tables 7, 7C, 7F
and 7R) that follow provide an overview of the month‐by‐month community and parent involvement at
the PLCs and College and Career Readiness participation among students.
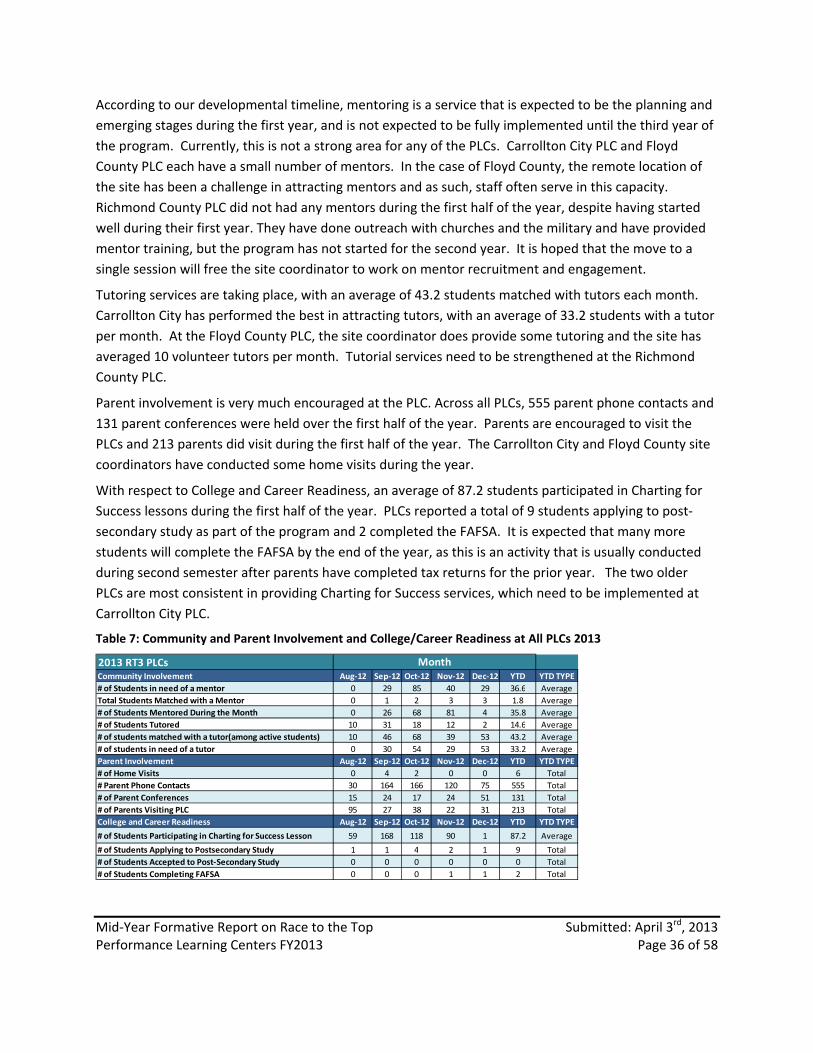
Mid‐Year Formative Report on Race to the Top Submitted: April 3rd, 2013 Performance Learning Centers FY2013 Page 36 of 58
According to our developmental timeline, mentoring is a service that is expected to be the planning and
emerging stages during the first year, and is not expected to be fully implemented until the third year of
the program. Currently, this is not a strong area for any of the PLCs. Carrollton City PLC and Floyd
County PLC each have a small number of mentors. In the case of Floyd County, the remote location of
the site has been a challenge in attracting mentors and as such, staff often serve in this capacity.
Richmond County PLC did not had any mentors during the first half of the year, despite having started
well during their first year. They have done outreach with churches and the military and have provided
mentor training, but the program has not started for the second year. It is hoped that the move to a
single session will free the site coordinator to work on mentor recruitment and engagement.
Tutoring services are taking place, with an average of 43.2 students matched with tutors each month.
Carrollton City has performed the best in attracting tutors, with an average of 33.2 students with a tutor
per month. At the Floyd County PLC, the site coordinator does provide some tutoring and the site has
averaged 10 volunteer tutors per month. Tutorial services need to be strengthened at the Richmond
County PLC.
Parent involvement is very much encouraged at the PLC. Across all PLCs, 555 parent phone contacts and
131 parent conferences were held over the first half of the year. Parents are encouraged to visit the
PLCs and 213 parents did visit during the first half of the year. The Carrollton City and Floyd County site
coordinators have conducted some home visits during the year.
With respect to College and Career Readiness, an average of 87.2 students participated in Charting for
Success lessons during the first half of the year. PLCs reported a total of 9 students applying to post‐
secondary study as part of the program and 2 completed the FAFSA. It is expected that many more
students will complete the FAFSA by the end of the year, as this is an activity that is usually conducted
during second semester after parents have completed tax returns for the prior year. The two older
PLCs are most consistent in providing Charting for Success services, which need to be implemented at
Carrollton City PLC.
Table 7: Community and Parent Involvement and College/Career Readiness at All PLCs 2013
2013 RT3 PLCsCommunity Involvement Aug‐12 Sep‐12 Oct‐12 Nov‐12 Dec‐12 YTD YTD TYPE
# of Students in need of a mentor 0 29 85 40 29 36.6 Average
Total Students Matched with a Mentor 0 1 2 3 3 1.8 Average
# of Students Mentored During the Month 0 26 68 81 4 35.8 Average
# of Students Tutored 10 31 18 12 2 14.6 Average
# of students matched with a tutor(among active students) 10 46 68 39 53 43.2 Average
# of students in need of a tutor 0 30 54 29 53 33.2 Average
Parent Involvement Aug‐12 Sep‐12 Oct‐12 Nov‐12 Dec‐12 YTD YTD TYPE
# of Home Visits 0 4 2 0 0 6 Total
# Parent Phone Contacts 30 164 166 120 75 555 Total
# of Parent Conferences 15 24 17 24 51 131 Total
# of Parents Visiting PLC 95 27 38 22 31 213 Total
College and Career Readiness Aug‐12 Sep‐12 Oct‐12 Nov‐12 Dec‐12 YTD YTD TYPE
# of Students Participating in Charting for Success Lesson 59 168 118 90 1 87.2 Average
# of Students Applying to Postsecondary Study 1 1 4 2 1 9 Total
# of Students Accepted to Post‐Secondary Study 0 0 0 0 0 0 Total
# of Students Completing FAFSA 0 0 0 1 1 2 Total
Month

Mid‐Year Formative Report on Race to the Top Submitted: April 3rd, 2013 Performance Learning Centers FY2013 Page 37 of 58
Table 7C: Community and Parent Involvement and College/Career Readiness ‐ Carrollton City PLC 2013
SITE: Carrollton City PLCCommunity Involvement Aug‐12 Sep‐12 Oct‐12 Nov‐12 Dec‐12 YTD YTD TYPE
# of Students in need of a mentor 0 29 15 0 29 14.6 Average
Total Students Matched with a Mentor 0 0 1 3 1 1.0 Average
# of Students Mentored During the Month 0 0 2 2 2 1.2 Average
# of Students Tutored 0 2 4 2 2 2.0 Average
# of students matched with a tutor(among active students) 0 30 54 29 53 33.2 Average
# of students in need of a tutor 0 30 54 29 53 33.2 Average
Parent Involvement Aug‐12 Sep‐12 Oct‐12 Nov‐12 Dec‐12 YTD YTD TYPE
# of Home Visits 0 0 1 0 0 1 Total
# Parent Phone Contacts 11 60 54 54 15 194 Total
# of Parent Conferences 3 1 8 9 1 22 Total
# of Parents Visiting PLC 50 3 10 9 31 103 Total
College and Career Readiness Aug‐12 Sep‐12 Oct‐12 Nov‐12 Dec‐12 YTD YTD TYPE
# of Students Participating in Charting for Success Lesson 1 0 0 0 1 0.4 Average
# of Students Applying to Postsecondary Study 0 0 0 1 1 2 Total
# of Students Accepted to Post‐Secondary Study 0 0 0 0 0 0 Total
# of Students Completing FAFSA 0 0 0 1 1 2 Total
Month
Table 7F: Community and Parent Involvement and College/Career Readiness ‐ Floyd PLC 2013
SITE: Floyd County PLCCommunity Involvement 8/1/201 Sep‐12 Oct‐12 Nov‐12 Dec‐12 YTD YTD TYPE
# of Students in need of a mentor 0 0 0 0 0 0.0 Average
Total Students Matched with a Mentor 0 1 1 0 2 0.8 Average
# of Students Mentored During the Month 0 1 2 2 2 1.4 Average
# of Students Tutored 10 16 14 10 0 10.0 Average
# of students matched with a tutor(among active students) 10 16 14 10 0 10.0 Average
# of students in need of a tutor 0 0 0 0 0 0.0 Average
Parent Involvement Aug‐12 Sep‐12 Oct‐12 Nov‐12 Dec‐12 YTD YTD TYPE
# of Home Visits 0 0 0 0 0 0 Total
# Parent Phone Contacts 19 52 60 38 60 229 Total
# of Parent Conferences 7 16 2 15 50 90 Total
# of Parents Visiting PLC 15 14 17 8 0 54 Total
College and Career Readiness Aug‐12 Sep‐12 Oct‐12 Nov‐12 Dec‐12 YTD YTD TYPE
# of Students Participating in Charting for Success Lesson 58 51 54 30 0 38.6 Average
# of Students Applying to Postsecondary Study 1 1 4 1 0 7 Total
# of Students Accepted to Post‐Secondary Study 0 0 0 0 0 0 Total
# of Students Completing FAFSA 0 0 0 0 0 0 Total
Month
Table 7R: Community and Parent Involvement and College/Career Readiness ‐ Richmond PLC 2013
SITE: Richmond County PLCCommunity Involvement Aug‐12 Sep‐12 Oct‐12 Nov‐12 Dec‐12 YTD YTD TYPE
# of Students in need of a mentor 0 0 70 40 0 22.0 Average
Total Students Matched with a Mentor 0 0 0 0 0 0.0 Average
# of Students Mentored During the Month 0 25 64 77 0 33.2 Average
# of Students Tutored 0 13 0 0 0 2.6 Average
# of students matched with a tutor(among active students) 0 0 0 0 0 0.0 Average
# of students in need of a teacher 0 0 0 0 0 0.0 Average
Parent Involvement Aug‐12 Sep‐12 Oct‐12 Nov‐12 Dec‐12 YTD YTD TYPE
# of Home Visits 0 4 1 0 0 5 Total
# Parent Phone Contacts 0 52 52 28 0 132 Total
# of Parent Conferences 5 7 7 0 0 19 Total
# of Parents Visiting PLC 30 10 11 5 0 56 Total
College and Career Readiness Aug‐12 Sep‐12 Oct‐12 Nov‐12 Dec‐12 YTD YTD TYPE
# of Students Participating in Charting for Success Lesson 0 117 64 60 0 48.2 Average
# of Students Applying to Postsecondary Study 0 0 0 0 0 0 Total
# of Students Accepted to Post‐Secondary Study 0 0 0 0 0 0 Total
# of Students Completing FAFSA 0 0 0 0 0 0 Total
Month

Mid‐Year Formative Report on Race to the Top Submitted: April 3rd, 2013 Performance Learning Centers FY2013 Page 38 of 58
Student Exit Status. Table 8 shows end of the year status for student by site for the 60 students taking
part in the Race to the Top PLC program who left during the first semester of the 2012‐13 school year.
Among these students, 12 (20.0%) achieved their high school diplomas, with Carrollton City PLC
graduating 1 student, Floyd County PLC graduating 5 students and Richmond County graduating 6
students. Three quarters of the graduates left with plans to continue their education at 2 or 4 year
colleges.
Table 8: Exit Status
Other Exits
PLCDropped
out GED
Work by
Choice Deceased
To 2‐yr
College
To 4‐yr
College
To
Employment
Graduated
Other
Out of
System
To Home
School
All Sites N 25 7 1 1 3 6 2 1 8 6 60
% 41.7% 11.7% 1.7% 1.7% 5.0% 10.0% 3.3% 1.7% 13.3% 10.0% 100.0%
Carrollton City N 2 0 0 0 1 0 0 0 3 1 7
% 28.6% 0.0% 0.0% 0.0% 14.3% 0.0% 0.0% 0.0% 42.9% 14.3% 100.0%
Floyd County N 2 0 0 0 2 0 2 1 4 2 13
% 15.4% 0.0% 0.0% 0.0% 15.4% 0.0% 15.4% 7.7% 30.8% 15.4% 100.0%
Richmond County N 21 7 1 1 0 6 0 0 1 3 40
% 52.5% 17.5% 2.5% 2.5% 0.0% 15.0% 0.0% 0.0% 2.5% 7.5% 100.0%
Graduated TransfersDropout Exits
Total
Fourteen students transferred out of the PLCs, with 6 of those returning to their home schools. One
student exit was a student who was deceased. The most common exits during the first semester where
those which would be classified as dropouts, with a total of 33 students leaving the program for lack of
attendance or academic progress, going on to GED programs or leaving to work. The highest number of
dropouts came from Richmond County PLC, not surprising given the high age of students in the program.
The Richmond County Academic Coordinator has been working with graduation coaches at the home
high schools to identify students who would best benefit from the program. Students who were too old
or not making adequate progress were given the option of entering a GED program.
Table 9 shows the total number of graduates for each PLC site during the first semester. Among the
graduates during the first semester of the 2013 school year was 1 student from Floyd County who
started the year classified as a junior.
Table 9: Number of Graduates First Semester 2012‐13 School Year by PLC Site
All Sites Carrollton City Floyd Richmond
Number of Graduates 12 1 5 6
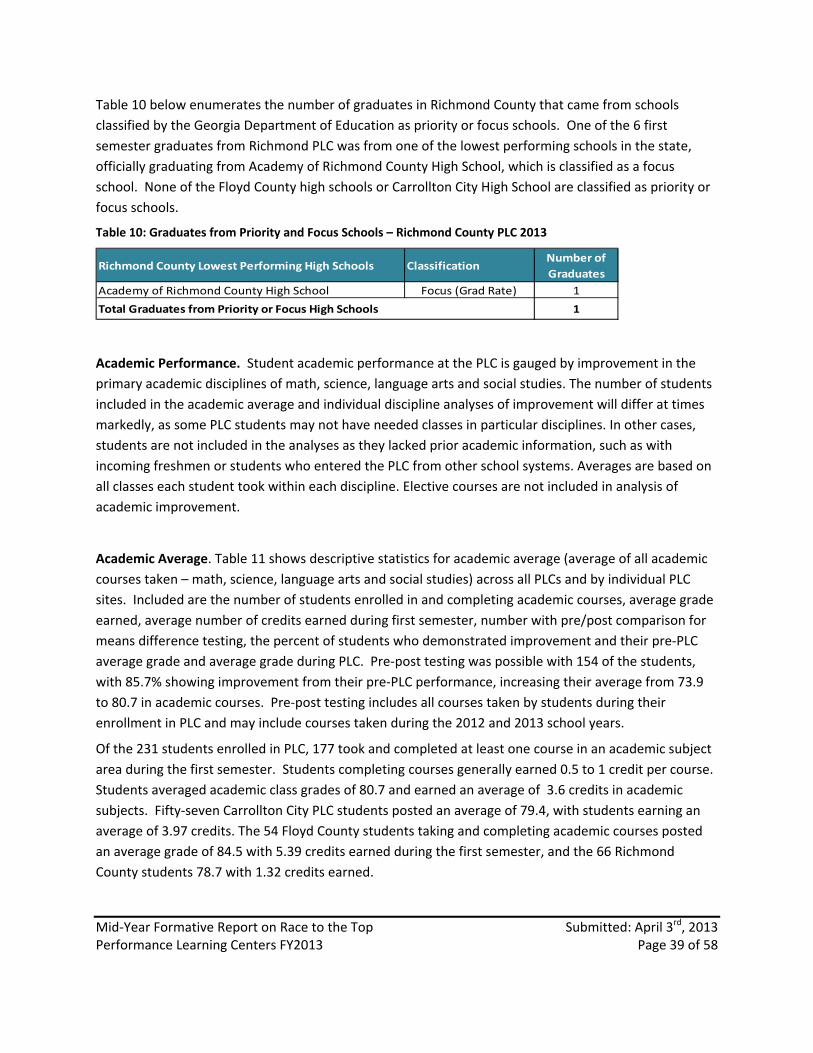
Mid‐Year Formative Report on Race to the Top Submitted: April 3rd, 2013 Performance Learning Centers FY2013 Page 39 of 58
Table 10 below enumerates the number of graduates in Richmond County that came from schools
classified by the Georgia Department of Education as priority or focus schools. One of the 6 first
semester graduates from Richmond PLC was from one of the lowest performing schools in the state,
officially graduating from Academy of Richmond County High School, which is classified as a focus
school. None of the Floyd County high schools or Carrollton City High School are classified as priority or
focus schools.
Table 10: Graduates from Priority and Focus Schools – Richmond County PLC 2013
Richmond County Lowest Performing High Schools ClassificationNumber of
Graduates
Academy of Richmond County High School Focus (Grad Rate) 1
1Total Graduates from Priority or Focus High Schools
Academic Performance. Student academic performance at the PLC is gauged by improvement in the
primary academic disciplines of math, science, language arts and social studies. The number of students
included in the academic average and individual discipline analyses of improvement will differ at times
markedly, as some PLC students may not have needed classes in particular disciplines. In other cases,
students are not included in the analyses as they lacked prior academic information, such as with
incoming freshmen or students who entered the PLC from other school systems. Averages are based on
all classes each student took within each discipline. Elective courses are not included in analysis of
academic improvement.
Academic Average. Table 11 shows descriptive statistics for academic average (average of all academic
courses taken – math, science, language arts and social studies) across all PLCs and by individual PLC
sites. Included are the number of students enrolled in and completing academic courses, average grade
earned, average number of credits earned during first semester, number with pre/post comparison for
means difference testing, the percent of students who demonstrated improvement and their pre‐PLC
average grade and average grade during PLC. Pre‐post testing was possible with 154 of the students,
with 85.7% showing improvement from their pre‐PLC performance, increasing their average from 73.9
to 80.7 in academic courses. Pre‐post testing includes all courses taken by students during their
enrollment in PLC and may include courses taken during the 2012 and 2013 school years.
Of the 231 students enrolled in PLC, 177 took and completed at least one course in an academic subject
area during the first semester. Students completing courses generally earned 0.5 to 1 credit per course.
Students averaged academic class grades of 80.7 and earned an average of 3.6 credits in academic
subjects. Fifty‐seven Carrollton City PLC students posted an average of 79.4, with students earning an
average of 3.97 credits. The 54 Floyd County students taking and completing academic courses posted
an average grade of 84.5 with 5.39 credits earned during the first semester, and the 66 Richmond
County students 78.7 with 1.32 credits earned.

Mid‐Year Formative Report on Race to the Top Submitted: April 3rd, 2013 Performance Learning Centers FY2013 Page 40 of 58
Pre‐post testing was possible with 56 of the Carrollton City students, 44 of the Floyd students and 54 of
the Richmond County Students, with 82.1%, 95.5% and 81.5% showing improvement, respectively.
Table 11: Descriptive Statistics for Academic Courses by Site
Performance Learning Center
Number of Student Enrolled in and
Completing Academic Subject Area Courses
Average in Academic Subjects
Average Credits Earned 1st
Semester 2012
Number with Pre‐Post
Comparison
Percent of Students Improved
Pre‐
Average
Post ‐ Average
All Sites 177 80.7 3.4 154 85.7% 73.9 80.7
Carrollton City 57 79.4 3.97 56 82.1% 73.2 79.5
Floyd 54 84.5 5.39 44 95.5% 74.1 84.8
Richmond 66 78.7 1.32 54 81.5% 74.5 78.7
Table 12 enumerates improvement across both PLCs and by individual PLC in academic average (average
of all academic courses taken). Mean difference testing compares program year PLC academic averages
to performance before entry into the PLC. On average, students in the PLC improved their academic
average to 80.7 from 73.9 prior to PLC, a gain of 6.8 points on average academically. The greatest
change in academic average was at Floyd County PLC, with a mean difference of 10.7. Improvement in
academic average is significant at the p<0.0001 level overall and for each of the PLCs.
Table 12: Paired T‐Test Results for Academic Average
Site
Paired Differences
t
df
Sig.
(2‐tailed)
Mean Differences
(Post – Pre)
Std. Deviation
Std. Error Mean
95% Confidence Interval of the Difference
Lower Upper
2013 RT3 PLC Sites 6.82 8.35 .673 5.49 8.15 10.132 153 .000
Carrollton City 6.29 8.704 1.163 3.96 8.62 5.411 55 .000
Floyd County PLC 10.69 8.664 1.306 8.05 13.32 8.181 43 .000
Richmond County PLC 4.21 6.486 0.883 2.44 5.98 4.767 53 .000
Language Arts. Table 13 shows descriptive statistics for language arts across all PLCs and by individual
PLC sites. Included are the number of students enrolled and completing in language arts courses during
the first semester, average grade in language arts, average number of credits earned, number with
pre/post comparison for means difference testing, the percent of students who demonstrated
improvement compared to pre‐PLC performance and the average pre and post grades in language arts.
Pre‐post testing was possible with 118 of the students, with 73.7% showing improvement. Pre‐post
testing includes all language arts courses taken by students during their enrollment in PLC and may
include courses taken during the 2012 and 2013 school years.
Of the 231 students enrolled in PLC the first semester, 126 took and completed at least one course in
language arts. Students averaged language arts class grades of 79.6 and earned an average of 0.859

Mid‐Year Formative Report on Race to the Top Submitted: April 3rd, 2013 Performance Learning Centers FY2013 Page 41 of 58
credits in that subject area. Carrollton City students posted an average of 76.7 in language arts with an
average of 0.696 credits earned, Floyd County students posted an average grade of 83.7 with average
1.067 credits earned and Richmond County students 80.4 with 0.95 credits earned.
Pre‐post testing was possible with 56 of the Carrollton City students, 32 of the Floyd students and 38 of
the Richmond County Students, with 57.4%, 86.5% and 88.9% showing improvement, respectively.
Table 13: Descriptive Statistics for Language Arts by Site
Performance Learning Center
Number of Student Enrolled in and
Completing Language Arts Courses
Average in Language Arts
Average Credits Earned 1st Semester
Number with Pre‐Post
Comparison
Percent of Students Improved
Pre‐
Average
Post ‐ Average
All Sites 126 79.6 .859 118 73.7% 73.0 80.2
Carrollton City 56 76.7 .696 54 57.4% 73.8 76.5
Floyd 32 83.7 1.067 37 86.5% 70.5 85.3
Richmond 38 80.4 .950 27 88.9% 74.8 80.7
Table 14 enumerates improvement across all PLCs and by individual PLC in the discipline of language
arts. Mean difference testing compares program year PLC language arts averages to performance before
entry into the PLC. On average, students in the PLC improved their language arts average to 80.2 from
73.0 prior to PLC, a gain of 7.24 points on average in language arts. Improvement in language arts
average is significant at the p<0.0001. The greatest change in language arts average was at Floyd
County PLC, with a mean difference of 14.82. Improvement in academic average was significant at the
p<0.0001 level for the Floyd and Richmond County PLCs. Students at Carrollton City showed modest
gains, but the improvement was not statistically significant.
Table 14: Paired T‐Test Results for Language Arts
Site
Paired Differences
t
df
Sig.
(2‐tailed)
Mean Differences
(Post – Pre)
Std. Deviation
Std. Error Mean
95% Confidence Interval of the Difference
Lower Upper
2013 RT3 PLC Sites 7.24 12.53 1.15 4.96 9.53 6.284 117 .000
Carrollton City 2.76 12.686 1.73 ‐0.70 6.22 1.598 53 .116
Floyd County PLC 14.82 12.537 2.06 10.6 19.0 7.195 36 .000
Richmond County PLC 5.84 5.931 1.141 3.49 8.19 5.117 26 .000
Social Studies. Table 15 shows descriptive statistics for social studies across all PLCs and by individual
PLC sites. Included are the number of students enrolled in and completing social studies courses,
average in social studies courses, average number of credits earned, number with pre/post comparison
for means difference testing, the percent of students who demonstrated improvement compared to

Mid‐Year Formative Report on Race to the Top Submitted: April 3rd, 2013 Performance Learning Centers FY2013 Page 42 of 58
pre‐PLC performance and the average pre‐ and post‐ subject area grades. Pre‐post testing was possible
with 120 of the students, with 73.3% showing improvement. Pre‐post testing includes all social studies
courses taken by students during their enrollment in PLC and may include courses taken during the 2012
and 2013 school years.
Of the 231 students enrolled in PLC, 126 took at least one course in social studies. Students averaged
social studies class grades of 80.1 and earned an average of 0.801 credits in that subject area. Carrollton
City students posted an average grade of 79.4 with .535 credits earned, Floyd County students posted an
average grade of 81.9 with average 1.2 credits earned and Richmond County students 79.5 with 0.762
credits earned. Pre‐post testing was possible with 54 of the Carrollton City students, 39 of the Floyd
students and 31 of the Richmond County students, with 70.4%, 81.1% and 69.0% showing improvement,
respectively.
Table 15: Descriptive Statistics for Social Studies by Site
Performance Learning Center
Number of Student Enrolled in and
Completing Social Studies Courses
Average in Social Studies
Average Credits Earned 1st Semester
Number with Pre‐Post
Comparison
Percent of Students Improved
Pre‐
Average
Post ‐ Average
All Sites 126 80.1 .801 120 73.3% 73.5 80.7
Carrollton City 56 79.4 .535 54 70.4% 73.0 79.0
Floyd 37 81.9 1.20 37 81.1% 75.7 83.8
Richmond 34 79.5 .762 29 69.0% 71.5 79.8
Table 16 enumerates improvement across all PLCs and by individual PLC in the discipline of social
studies. Mean difference testing compares program PLC social studies averages to performance before
entry into the PLC. On average, students in the PLC improved their social studies average to 80.7 from
73.5 prior to PLC, a gain of 7.225 points on average in social studies. The greatest change in social
studies was at Richmond County PLC, with a mean difference of 8.3 points. Improvement in social
studies is significant at the p<0.0001 level across all sites and improvement in social studies was
significant at each of the individual PLC sites.
Table 16: Paired T‐Test Results for Social Studies
Site
Paired Differences
t
df
Sig.
(2‐tailed)
Mean Differences
(Post – Pre)
Std. Deviation
Std. Error Mean
95% Confidence Interval of the Difference
Lower Upper
2013 RT3 PLC Sites 7.22 14.34 1.31 4.63 9.81 5.516 119 .000
Carrollton City 6.05 16.75 2.279 1.48 10.62 2.656 53 .010
Floyd County PLC 8.09 10.16 1.670 4.702 11.476 4.844 36 .000
Richmond County PLC 8.3 14.34 2.66 2.83 13.74 3.113 28 .004

Mid‐Year Formative Report on Race to the Top Submitted: April 3rd, 2013 Performance Learning Centers FY2013 Page 43 of 58
Mathematics. Table 17 shows descriptive statistics for mathematics across all PLCs and by individual PLC
sites. Included are the number of students enrolled in and completing mathematics courses, average,
average number of credits earned, number with pre/post comparison for means difference testing, the
percent of students who demonstrated improvement in mathematics compared to pre‐PLC performance
and the average pre‐ and post‐ subject area grades. Pre‐post testing was possible with 97 of the
students, with 72.2% showing improvement. Pre‐post testing includes all mathematics courses taken by
students during their enrollment in PLC and may include courses taken during the 2012 and 2013 school
years.
Of the 231 students enrolled in PLC, 114 took at least one course in mathematics. Students averaged
mathematics class grades of 78.9 and earned 0.874 credits in that subject area during the first semester.
Carrollton City students posted an average grade of 77.3 with 0.75 credits earned, Floyd County
students posted an average grade of 83.2 with average 1.097 credit earned and Richmond County
students 74.03 with an average of 0.714 credit earned. Pre‐post testing was possible with 55 of the
Carrollton City, 31 of the Floyd students and 11 of the Richmond County Students, with 69.1%, 80.6%
and 63.6% showing improvement, respectively.
Table 17: Descriptive Statistics for Mathematics by Site
Performance Learning Center
Number of Student Enrolled in and Completing h
Average in Mathematics
Average Credits Earned 1st Semester
Number with Pre‐Post
Comparison
Percent of Students Improved
Pre‐
Average
Post ‐ Average
All Sites 114 78.9 .874 97 72.2% 73.4 79.5
Carrollton City 56 77.3 .750 55 69.1% 72.5 77.6
Floyd 41 83.2 1.097 31 80.6% 75.5 84.7
Richmond 17 74.03 .714 11 63.6% 71.6 74.3
Table 18 enumerates improvement across both PLCs and by individual PLC in the discipline of
mathematics. Mean difference testing compares program year PLC math averages to performance
before entry into the PLC. On average, students in the PLC improved their math average to 79.5 from
73.4 prior to PLC, a gain of 6.16 points on average in math. Floyd County posted the greatest gains at
9.23. Improvement in math is significant at the p<0.0001 across all PLCs and at Carrollton City and
Floyd County PLCs. Improvement at Richmond County was not statistically significant.
Table 18: Paired T‐Test Results for Mathematics
Site
Paired Differences
t
df
Sig.
(2‐tailed)
Mean Differences
(Post – Pre)
Std. Deviation
Std. Error Mean
95% Confidence Interval of the Difference
Lower Upper
2013 RT3 PLC Sites 6.16 11.60 1.18 3.82 8.50 5.232 119 .000
Carrollton City 5.12 9.79 1.32 2.48 7.77 3.882 54 .000
Floyd County PLC 9.23 13.28 2.39 4.36 14.10 3.871 30 .001
Richmond County PLC 2.7 14.04 4.23 ‐6.7 12.13 .638 10 .538

Mid‐Year Formative Report on Race to the Top Submitted: April 3rd, 2013 Performance Learning Centers FY2013 Page 44 of 58
Science. Table 19 shows descriptive statistics for science across all PLCs and by individual PLC sites. Included are the number of students enrolled in and completing science courses, average in science, average number of credits earned in science during first semester, number with pre/post comparison for means difference testing, the percent of students who demonstrated improvement compared to pre‐PLC performance and the average pre‐ and post‐ subject area grades. Pre‐post testing was possible with 112 of the students, with 63.4% showing improvement. Pre‐post testing includes all science courses taken by students during their enrollment in PLC and may include courses taken during the 2012 and 2013 school years.
Of the 231 students enrolled in PLC, 131 took at least one course in science. Students averaged science class grades of 78.7 and earned 0.827 credits in that subject area. Carrollton City students posted an average of 76.1 with 0.563 credits earned, Floyd County students posted an average grade of 83.4 with average 1.2 credits earned and Richmond County students 79.5 with 0.8 credits earned. Pre‐post testing was possible with 55 of the Carrollton City students, 35 of the Floyd students and 22 of the Richmond County Students, with 50.9%, 85.7% and 59.1% showing improvement, respectively.
Table 19: Descriptive Statistics for Science by Site
Performance Learning Center
Number of Student Enrolled in and Completing
Science Courses
Average in Science
Average Credits Earned 1st Semester
Number with Pre‐Post
Comparison
Percent of Students Improved
Pre‐
Average
Post ‐ Average
All Sites 131 78.7 .827 112 63.4% 74.1 78.8
Carrollton City 56 76.1 .563 55 50.9% 73.6 76.3
Floyd 47 83.4 1.20 35 85.7% 73.9 84.5
Richmond 34 79.5 .824 22 59.1% 75.6 76.1
Table 20 enumerates improvement across all PLCs and by individual PLC in the discipline of science. Mean difference testing compares program PLC science averages to performance before entry into the PLC. On average, students in the PLC improved their science average to 78.8 from 74.1 prior to PLC, an average gain of 4.75 points on average in science. Improvement in science is significant at the p<0.001 overall and for Floyd County. The levels of improvement in science at Carrollton City and Richmond County were not statistically significant.
Table 20: Paired T‐Test Results for Science
Site
Paired Differences
t
df
Sig.
(2‐tailed)
Mean Differences
(Post – Pre)
Std. Deviation
Std. Error Mean
95% Confidence Interval of the Difference
Lower Upper
2013 RT3 PLC Sites 4.75 13.73 1.30 2.175 7.316 3.658 111 .000
Carrollton City 2.76 15.81 2.13 ‐1.517 7.033 1.293 54 .201
Floyd County PLC 10.56 12.01 2.03 6.439 14.687 5.05 34 .000
Richmond County PLC .46 5.830 1.24 ‐2.126 3.044 .369 21 .716

Mid‐Year Formative Report on Race to the Top Submitted: April 3rd, 2013 Performance Learning Centers FY2013 Page 45 of 58
Elective Courses. Table 21 shows descriptive statistics for electives across all PLCs and by individual PLC sites. Included are the number of students enrolled in and completing electives courses, average in elective courses, and average number of elective course credits earned during the first semester.
Of the 231 students enrolled in PLC, 116 took and completed at least one elective course. Students averaged elective class grades of 82.64 and earned an average of 1.76 credits on average in elective courses. Carrollton County students posted an average of 82.89 and earned an average of 1.47 credits in electives, Floyd County students posted an average grade of 87.17 with average 2.39 credits earned and Richmond County students 76.59 with 0.964 credits earned.
Table 21: Descriptive Statistics for Electives by Site
Performance
Learning Center
Number of Student
Enrolled in and
completing Elective
Courses
Average in
Electives
Average Credits
Earned 1st
Semester
All Sites 116 82.64 1.76
Carrollton City 57 82.89 1.47
Floyd 45 87.17 2.39
Richmond 14 76.59 .964
Student Survey Results. At the end of the year at PLC or as students exit the PLC throughout the year,
students are asked to complete a survey to gain their impressions of the PLC environment and how they
feel about themselves at the PLC. A total of 18 of the 60 students who exited during the first semester
were surveyed across the three PLC sites: 4 at Carrollton City, 4 at Floyd County, and 10 at Richmond
County. The results of the surveys received are presented on the pages that follow.
Grade Levels of PLC Student Respondents. Below is a chart of the number of respondents based on
grade level. Overall, the majority of the surveys completed by Floyd County students were graduating
seniors. Richmond PLC’s surveys were completed by three 9th and 10th graders, two 12th graders and 2
graduating seniors. Carrollton City had one 8th and 9th grader who completed the survey, along with two
graduating seniors. Overall, 44% of respondents were graduating seniors.
Table 22: First Semester Student Surveys: Grade Level
Grade LevelCarrollton
CityFloyd Richmond All Sites
8th 25% 0% 0% 6%
9th 25% 0% 30% 22%
10th 0% 0% 30% 17%
11th 0% 0% 0% 0%
12th 0% 0% 20% 11%
12th ‐Graduating 50% 100% 20% 44%
Number of cases 4 4 10 18

Mid‐Year Formative Report on Race to the Top Submitted: April 3rd, 2013 Performance Learning Centers FY2013 Page 46 of 58
Post‐Secondary Plans. Table 23 displays the percent of graduating seniors who indicated that they plan
to continue their education by attending college, technical college or military. All graduating seniors
indicated that they did plan to continue their educations. Table 24 indicates whether students were
accepted into a post‐secondary program at the time of graduation. While all of the graduating students
indicated that they plan to continue their education, none of respondents had actually been accepted
into a post‐secondary program at the time of the survey.
Table 23: First Semester Student Surveys: Plans upon graduation
100.0% 100.0% 100.0% 100.0%
.0% .0% .0% .0%
2 4 2 8
Carrollton
CityFloyd Richmond All Sites
Do you have plans to continue your
education by attending college,
technical college, or the military?
Yes
No
Number of cases
Table 24: First Semester Student Surveys: Acceptance to Post‐Secondary Options
.0% .0% .0% .0%
100.0% 100.0% 100.0% 100.0%
2 4 2 8
Carrollton
CityFloyd Richmond All Sites
Yes
No
Number of cases
Have you already been accepted
into college, technical college, or
through the military?
Pursuing Post‐Secondary Options. Table 25 below depicts what post‐secondary options the graduating
students indicated that they plan to pursue. Students are given the option of selecting any options that
they plan to pursue, such as attending both 2 and 4‐year colleges. Overall, 50% of students indicated
they plan to obtain an associate’s degree, 38% of students plan to attend 4‐year college, 50% plan to
attend 2‐year college and 13% indicated that they plan to attend a Technical College‐Diploma Program.
Table 25: First Semester Student Surveys: Planned Post‐Secondary Options
Which post‐secondary option(s) do
you plan to pursue?
Carrollton
CityFloyd Richmond All Sites
4‐yr college 0% 25% 100% 38%
2‐yr college 100% 50% 0% 50%
Technical college‐Associate's Degree 100% 50% 0% 50%
Technical college‐Diploma Program 0% 25% 0% 13%
Military 0% 0% 0% 0%
Number of cases 2 4 2 8

Mid‐Year Formative Report on Race to the Top Submitted: April 3rd, 2013 Performance Learning Centers FY2013 Page 47 of 58
Paying for Post‐Secondary Education. Table 26 presents graduate plans to pay for their post‐secondary
education. Overall, it does appear that most of graduates do have clear plans as to how they will pay for
education. At Carrollton City PLC, all of the graduating seniors indicated that they have submitted FAFSA
applications. At Floyd County PLC, 75% plan to use the HOPE Scholarship to pay for their education, 50%
HOPE Grants, 75% relying on their parents/guardians will help with financial costs and 50% intending to
work to pay for post‐secondary education. At Richmond County PLC, one student indicated that they will
use HOPE Scholarship, while another has submitted a FAFSA application. Across all sites, HOPE
Scholarships/ HOPE Grants are the most common sources of funding for post‐secondary education,
followed by FAFSA and parent assistance (38% each) and financing through work (25%).
Table 26: First Semester Student Surveys: Plans to Pay for Post‐Secondary Education
How do you plan to pay for your post‐
secondary education?
Carrollton
CityFloyd Richmond All Sites
HOPE Scholarship 0% 75% 50% 50%
HOPE Grant 0% 50% 0% 25%
Submitted FAFSA application 100% 0% 50% 38%
Private Loan 0% 0% 0% 0%
Parent/Guardian Financial Assistance 0% 75% 0% 38%
Military 0% 0% 0% 0%
Work 0% 50% 0% 25%
Other 0% 0% 0% 0%
Number of cases 2 4 2 8
Student Survey Questions for All Students
Tables 27 and 28 below show how respondents feel they have changed since being a student at the PLC.
Eighty‐nine percent of students across both sites indicated that they “Agree Somewhat” or “Strongly
Agree” with the statement that their grades have improved since being at the PLC. Of the individual
sites, students at Floyd County PLC were most likely to indicate that they “Strongly Agree” that they
have improved their grades.
With respect to improvement in attendance overall, responses varied greatly, with 56% indicating that
they had improved their attendance and 44% indicating that they did not improve. Students at
Carrollton City and Richmond County PLCs were most likely to indicate that they had improved their
attendance since entering PLC.
Nearly all (89%) of the students indicated that they are more focused on school work at the PLC, with
just 2 students (one each from Floyd and Richmond County PLCs) disagreeing with the statement.
With respect to wanting to graduate from high school, 89% of students across all schools agreed they
want to graduate from high school.

Mid‐Year Formative Report on Race to the Top Submitted: April 3rd, 2013 Performance Learning Centers FY2013 Page 48 of 58
Table 27: First Semester Student Surveys: Changes in Student since starting PLC
Since Starting at the
PLC:Site
Strongly
Disagree
Disagree
Somewhat
Agree
Somewhat
Strongly
Agree
Number
of Cases
All Sites 11% 0% 56% 33% 18
Carrollton City 0% 0% 50% 50% 4
Floyd 25% 0% 0% 75% 4
Richmond 10% 0% 80% 10% 10
All Sites 6% 38% 19% 38% 16
Carrollton City 0% 33% 0% 67% 3
Floyd 33% 33% 0% 33% 3
Richmond 0% 40% 30% 30% 10
All Sites 6% 6% 22% 67% 18
Carrollton City 0% 0% 25% 75% 4
Floyd 25% 0% 0% 75% 4
Richmond 0% 10% 30% 60% 10
All Sites 6% 6% 11% 78% 18
Carrollton City 0% 25% 0% 75% 4
Floyd 25% 0% 0% 75% 4
Richmond 0% 0% 20% 80% 10
My grades have
improved.
I have improved my
school attendance
I am more focused on
my school work.
I want to graduate
from high school
Table 28 provides student responses to the statement that they “get into less trouble” since attending
PLC. Across all PLCs 23% of students indicated that their behavior had not been a problem, and 71%
indicated that they have improved their behavior and get in less trouble since they entered the PLC.
Seventy‐five percent of student respondents from Carrollton City and Floyd County indicated they
improved their behavior, followed by Richmond County at 66% improving.
Table 28: First Semester Student Surveys: Improvement in Behavior
Since Starting at the
PLC:Site
Not Applicable,
Never in Trouble
Strongly
Disagree
Disagree
Somewhat
Agree
Somewhat
Strongly
Agree
Number
of Cases
All Sites 23% 0% 6% 12% 59% 17
Carrollton City 25% 0% 0% 0% 75% 4
Floyd 25% 0% 0% 0% 75% 4
Richmond 23% 0% 11% 22% 44% 9
I get into less trouble.
Tables 29 and 30 summarize student responses to questions concerning the environment at PLC.
A goal of the PLC is to create a supportive and caring environment in which students can excel. Across
all sites, 95% of PLC students “Agreed Somewhat” or “Strongly Agreed” that at the PLC the teachers and
staff care about them. Overall, only one student at Richmond County PLC responded that they did not
feel that the staff and teachers care about them.
Since students who come to PLC have been unsuccessful within the traditional school environment, it is
the hope of the program that students will come to know that they can be successful as students. For all

Mid‐Year Formative Report on Race to the Top Submitted: April 3rd, 2013 Performance Learning Centers FY2013 Page 49 of 58
sites, 94% of students chose “Agree Somewhat” or “Strongly Agree” to the survey statement “I know
that I can be academically successful.” Only one student from Floyd County PLC indicated that they did
not feel they could be successful in the PLC environment.
As part of the PLC Roadmap to Success, students at the PLC are actively encouraged to plan for their
futures. Students in the PLC establish goals for their futures and are given assistance in developing plans
to achieve those goals. Under “I have developed new goals for my future,” 78% of all respondents
indicated that they had developed goals for the future. At the individual PLC sites, the majority (75% or
more) at each PLC indicated that they had developed future goals since coming to PLC.
It is important for students to feel accomplished and have confidence as a good student in order to
succeed in the classroom. Eighty‐nine percent of students from all three PLCs agreed to “I am a good
student” and “I am able to complete more school work.”
Table 29: First Semester Student Surveys: PLC Environment
At the PLC:Site Strongly
Disagree
Disagree
Somewhat
Agree
Somewhat
Strongly
Agree
Number
of Cases
All Sites 0% 6% 39% 56% 18
Carrollton City 0% 0% 50% 50% 4
Floyd 0% 0% 25% 75% 4
Richmond 0% 10% 40% 50% 10
All Sites 6% 0% 22% 72% 18
Carrollton City 0% 0% 50% 50% 4
Floyd 25% 0% 0% 75% 4
Richmond 0% 0% 20% 80% 10
All Sites 6% 17% 6% 72% 18
Carrollton City 0% 25% 0% 75% 4
Floyd 25% 0% 0% 75% 4
Richmond 0% 20% 10% 70% 10
All Sites 6% 6% 22% 67% 18
Carrollton City 0% 0% 25% 75% 4
Floyd 25% 0% 0% 75% 4
Richmond 0% 10% 30% 60% 10
All Sites 6% 6% 33% 56% 18
Carrollton City 0% 0% 50% 50% 4
Floyd 25% 0% 0% 75% 4
Richmond 0% 10% 40% 50% 10
The teachers and staff
care about me.
I know that I can be
academically
successful.
I have developed new
goals for my future.
I am a good student.
I am able to complete
more school work.

Mid‐Year Formative Report on Race to the Top Submitted: April 3rd, 2013 Performance Learning Centers FY2013 Page 50 of 58
The Classroom Environment at the PLC Encourages Learning. A classroom environment conducive to
learning is important for a student to be successful in school, and 70% of students “Agreed” or “Strongly
Agreed” that the classroom environment at the PLC encourages learning. Only one student from Floyd
County PLC disagreed.
Table 30: First Semester Student Surveys: Classroom Environment
The classroom environment at
the PLC encourages learning.
Strongly
DisagreeDisagree
Neither
Agree or
Disagree
Agree Strongly
Agree
Number
of Cases
All Sites 6% 0% 24% 29% 41% 17
Carrollton City 0% 0% 0% 100% 0% 3
Floyd 25% 0% 0% 0% 75% 4
Richmond 0% 0% 40% 20% 40% 10
How safe do you feel at the Performance Learning Center. A safe place to learn and grow is extremely
important for all students. Table 31 below provides responses to safety in the PLC. Across all PLCs, 83%
of students indicated that they feel safe at the PLC. No student at any site indicated that they do not
feel at all safe at the PLC.
Table 31: First Semester Student Surveys: Safety
Carrollton
CityFloyd Richmond All Sites
0% 0% 0% 0%
33% 25% 10% 18%
33% 25% 20% 24%
33% 50% 70% 59%
3 4 10 17
How safe do you feel at the
Performance Learning Center?
Not Safe at All
Very Safe
Number of cases
Somewhat Safe
Mostly Safe
Would you recommend the Performance Learning Center to other students. In terms of
recommending the PLC to other students, 94% of the students across all Performance Learning Centers
would recommend it. Only one student from Floyd PLC would not recommend the school to others.
Table 32: First Semester Student Surveys: Recommend the Program
Carrollton
CityFloyd Richmond All Sites
100% 100% 90% 94%
0% 0% 10% 6%
4 4 10 18
Yes
No
Number of cases
Would you recommend the
Performance Learning Center to
other students?
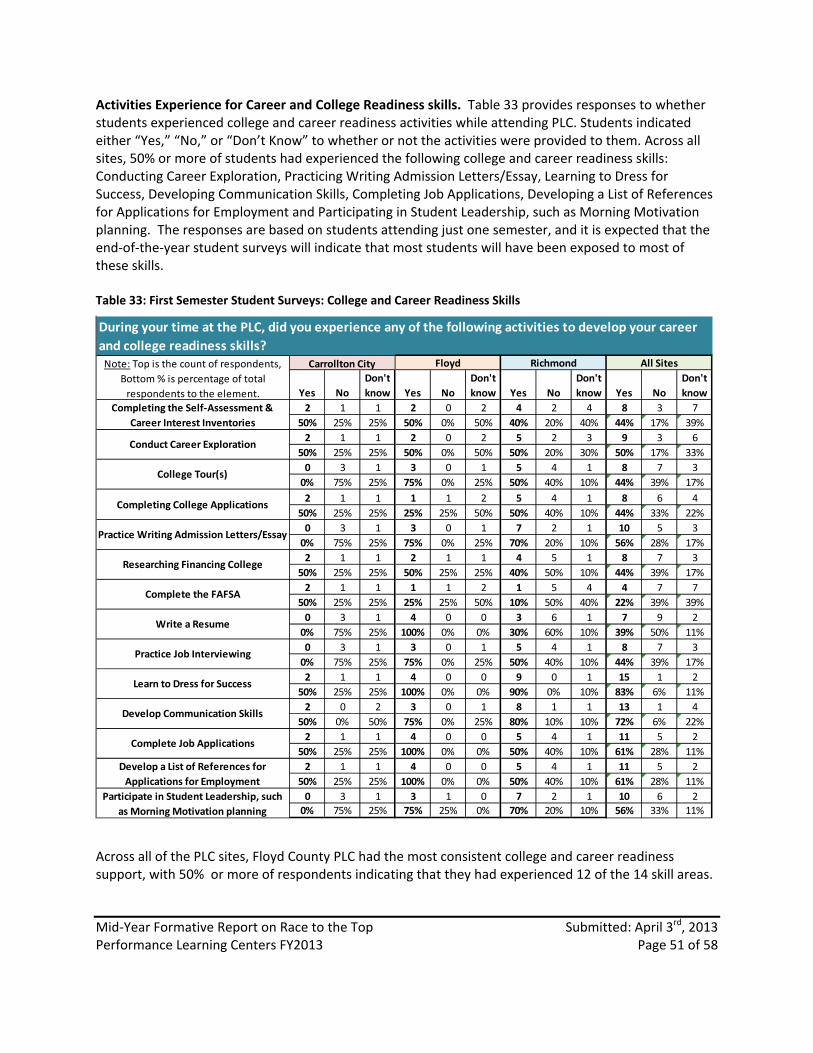
Mid‐Year Formative Report on Race to the Top Submitted: April 3rd, 2013 Performance Learning Centers FY2013 Page 51 of 58
Activities Experience for Career and College Readiness skills. Table 33 provides responses to whether students experienced college and career readiness activities while attending PLC. Students indicated either “Yes,” “No,” or “Don’t Know” to whether or not the activities were provided to them. Across all sites, 50% or more of students had experienced the following college and career readiness skills: Conducting Career Exploration, Practicing Writing Admission Letters/Essay, Learning to Dress for Success, Developing Communication Skills, Completing Job Applications, Developing a List of References for Applications for Employment and Participating in Student Leadership, such as Morning Motivation planning. The responses are based on students attending just one semester, and it is expected that the end‐of‐the‐year student surveys will indicate that most students will have been exposed to most of these skills. Table 33: First Semester Student Surveys: College and Career Readiness Skills
Yes No
Don't
know Yes No
Don't
know Yes No
Don't
know Yes No
Don't
know
2 1 1 2 0 2 4 2 4 8 3 7
50% 25% 25% 50% 0% 50% 40% 20% 40% 44% 17% 39%
2 1 1 2 0 2 5 2 3 9 3 6
50% 25% 25% 50% 0% 50% 50% 20% 30% 50% 17% 33%
0 3 1 3 0 1 5 4 1 8 7 3
0% 75% 25% 75% 0% 25% 50% 40% 10% 44% 39% 17%
2 1 1 1 1 2 5 4 1 8 6 4
50% 25% 25% 25% 25% 50% 50% 40% 10% 44% 33% 22%
0 3 1 3 0 1 7 2 1 10 5 3
0% 75% 25% 75% 0% 25% 70% 20% 10% 56% 28% 17%
2 1 1 2 1 1 4 5 1 8 7 3
50% 25% 25% 50% 25% 25% 40% 50% 10% 44% 39% 17%
2 1 1 1 1 2 1 5 4 4 7 7
50% 25% 25% 25% 25% 50% 10% 50% 40% 22% 39% 39%
0 3 1 4 0 0 3 6 1 7 9 2
0% 75% 25% 100% 0% 0% 30% 60% 10% 39% 50% 11%
0 3 1 3 0 1 5 4 1 8 7 3
0% 75% 25% 75% 0% 25% 50% 40% 10% 44% 39% 17%
2 1 1 4 0 0 9 0 1 15 1 2
50% 25% 25% 100% 0% 0% 90% 0% 10% 83% 6% 11%
2 0 2 3 0 1 8 1 1 13 1 4
50% 0% 50% 75% 0% 25% 80% 10% 10% 72% 6% 22%
2 1 1 4 0 0 5 4 1 11 5 2
50% 25% 25% 100% 0% 0% 50% 40% 10% 61% 28% 11%
2 1 1 4 0 0 5 4 1 11 5 2
50% 25% 25% 100% 0% 0% 50% 40% 10% 61% 28% 11%
0 3 1 3 1 0 7 2 1 10 6 2
0% 75% 25% 75% 25% 0% 70% 20% 10% 56% 33% 11%
Participate in Student Leadership, such
as Morning Motivation planning
Write a Resume
Practice Job Interviewing
Learn to Dress for Success
Develop Communication Skills
Complete Job Applications
Develop a List of References for
Applications for Employment
All SitesNote: Top is the count of respondents,
Bottom % is percentage of total
respondents to the element.
During your time at the PLC, did you experience any of the following activities to develop your career
and college readiness skills?
Complete the FAFSA
Completing the Self‐Assessment &
Career Interest Inventories
Floyd Richmond
Conduct Career Exploration
College Tour(s)
Completing College Applications
Practice Writing Admission Letters/Essay
Researching Financing College
Carrollton City
Across all of the PLC sites, Floyd County PLC had the most consistent college and career readiness support, with 50% or more of respondents indicating that they had experienced 12 of the 14 skill areas.

Mid‐Year Formative Report on Race to the Top Submitted: April 3rd, 2013 Performance Learning Centers FY2013 Page 52 of 58
Conclusions
All of the Race to the Top PLCs are progressing largely as expected according to the PLC developmental
timeline. In its first year, Carrollton City PLC has introduced the first middle school students into the PLC
and has maintained close ties with the traditional school, allowing students to return for individual
courses and extracurricular activities. We will see how this impacts the model. Floyd County PLC has
continued to build on a strong start and continues to innovate in student advisement and monitoring.
Richmond County PLC, after a difficult first year due to absence of an academic coordinator, has made
great strides in implementing the model under the leadership of the new AC.
In the first half of the year, 12 students graduated through the three Race to the Top PLCs. Student
performance indicates that students at the PLCs are performing much better within this environment.
There are some elements of the model continue to be challenges including recruitment and placement
of mentors. Sites are making efforts to implement the Common Core into the PLC curriculum and CIS of
Georgia is commencing work to assist in these efforts. CIS of Georgia will continue to work with these
sites to support full implementation of the model.
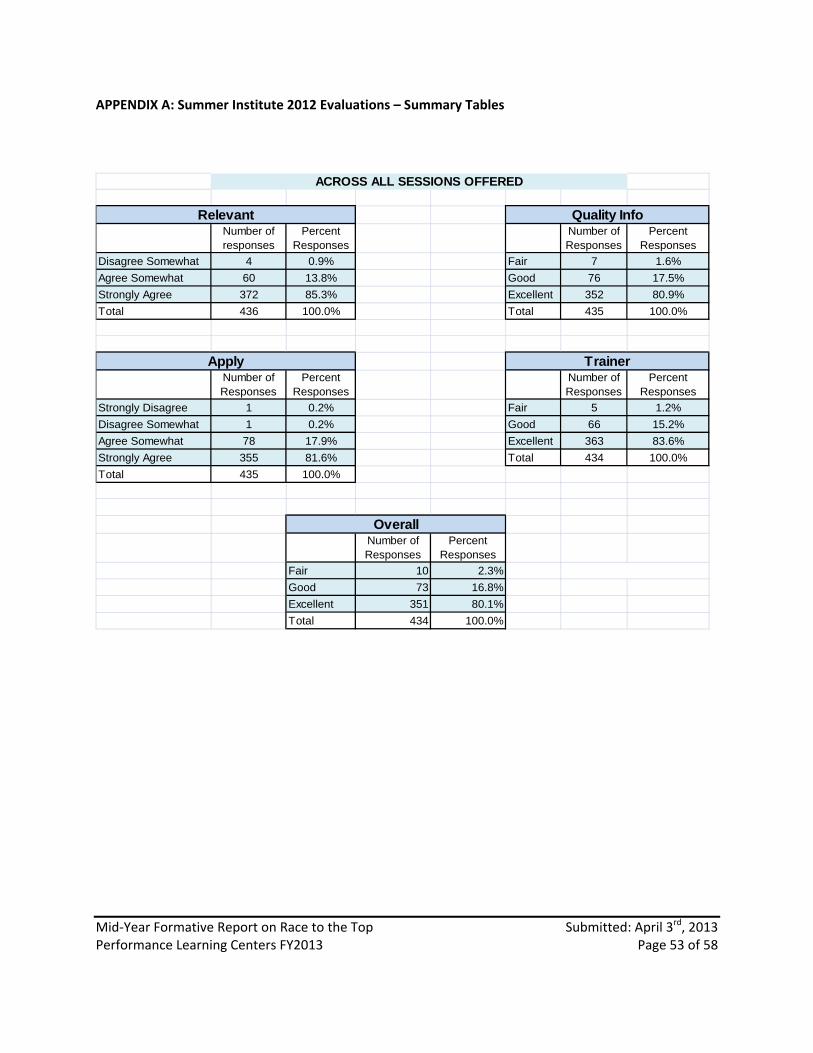
Mid‐Year Formative Report on Race to the Top Submitted: April 3rd, 2013 Performance Learning Centers FY2013 Page 53 of 58
APPENDIX A: Summer Institute 2012 Evaluations – Summary Tables
Number of responses
Percent Responses
Number of Responses
Percent Responses
Disagree Somewhat 4 0.9% Fair 7 1.6%
Agree Somewhat 60 13.8% Good 76 17.5%
Strongly Agree 372 85.3% Excellent 352 80.9%
Total 436 100.0% Total 435 100.0%
Number of Responses
Percent Responses
Number of Responses
Percent Responses
Strongly Disagree 1 0.2% Fair 5 1.2%
Disagree Somewhat 1 0.2% Good 66 15.2%
Agree Somewhat 78 17.9% Excellent 363 83.6%
Strongly Agree 355 81.6% Total 434 100.0%
Total 435 100.0%
Number of Responses
Percent Responses
Fair 10 2.3%
Good 73 16.8%
Excellent 351 80.1%
Total 434 100.0%
Overall
ACROSS ALL SESSIONS OFFERED
Quality Info
Trainer
Relevant
Apply

Mid‐Year Formative Report on Race to the Top Submitted: April 3rd, 2013 Performance Learning Centers FY2013 Page 54 of 58
Session Ratings – Relevance of Session to Job
Count Row N % Count Row N % Count Row N % Count Row N %
Attitude Science 0 0.00% 0 0.00% 11 100.00% 11 100.00%
Breakfast Keynote: Bill Milliken, Co-Founder and Vice Chairman of Communities in Schools 0 0.00% 4 6.90% 54 93.10% 58 100.00%
Capstone 0 0.00% 5 33.30% 10 66.70% 15 100.00%
CIS Site Coordinators: Reframing Out Work to Include Student Engagement and Principles 0 0.00% 3 12.00% 22 88.00% 25 100.00%
College Career Readiness: Charting for Success 0 0.00% 6 22.20% 21 77.80% 27 100.00%
College/Careeer Readiness Track: Creating Pathways of Access and Success for Underrepresented Students 0 0.00% 1 9.10% 10 90.90% 11 100.00%
College/Career Readiness Track: Just Dual It! 1 11.10% 0 0.00% 8 88.90% 9 100.00%
Instructional Day: Using PLC Curriculum Resources to Design Your Courses and Integrating Project-Based Learning 0 0.00% 3 21.40% 11 78.60% 14 100.00%
Intake Process Interviewing Potential Students 1 4.50% 3 13.60% 18 81.80% 22 100.00%
Keynote - Practical Classroom Strategies0 0.00% 0 0.00% 23 100.00% 23 100.00%
Keynote: Personal Learning Networks 2 6.10% 8 24.20% 23 69.70% 33 100.00%
Life Skills through Morning Motivation 0 0.00% 1 5.90% 16 94.10% 17 100.00%
Lions, Otters, Beavers, Retrievers...Oh My! 0 0.00% 1 7.10% 13 92.90% 14 100.00%
MATH Learning Facilitators: Math CCGPS Implementation Workshop 0 0.00% 0 0.00% 4 100.00% 4 100.00%
PLC Coordinators and CIS Executive Directors: Reshaping the Way We Lead 0 0.00% 2 10.00% 18 90.00% 20 100.00%
PLC Enhancement/Expansion Opportunity Track: ACT's College Readiness Solutions 0 0.00% 2 20.00% 8 80.00% 10 100.00%
PLC Enhancement/Expansion Opportunity Track: Apex Learning 0 0.00% 0 0.00% 2 100.00% 2 100.00%
PLC Enhancement/Expansion Opportunity Track: Classroom, Inc.'s Virtual Internship
0 0.00% 6 66.70% 3 33.30% 9 100.00%
PLC Learning Facilitators: Using LDC to Make the CCGPS Transition Easier 0 0.00% 4 50.00% 4 50.00% 8 100.00%
PLC School Leadership Creative Scheduling and PLC Data Reporting 0 0.00% 0 0.00% 7 100.00% 7 100.00%
Round Robin for Academic Coordinators 0 0.00% 0 0.00% 6 100.00% 6 100.00%
Round Robin for Executive Directors 0 0.00% 0 0.00% 2 100.00% 2 100.00%
Round Robin for Mathematics Learning Facilitators 0 0.00% 0 0.00% 6 100.00% 6 100.00%
Round Robin for Science Learning Facilitators 0 0.00% 0 0.00% 5 100.00% 5 100.00%
Round Robin for Site Coordinators 0 0.00% 3 33.30% 6 66.70% 9 100.00%
Round Robin for Social Studies Learning Facilitators 0 0.00% 0 0.00% 7 100.00% 7 100.00%
Senior Project Video 0 0.00% 4 16.70% 20 83.30% 24 100.00%
The Power of Peace Project 0 0.00% 0 0.00% 7 100.00% 7 100.00%
Welcome - CIS PLC from the Beginning 0 0.00% 3 17.60% 14 82.40% 17 100.00%
Who Am I Online - Creating your 21st Century Internet Presence 0 0.00% 1 7.10% 13 92.90% 14 100.00%
Session NameSession content was relevant to my job.
Disagree Somewhat Agree Somewhat Strongly Agree Total

Mid‐Year Formative Report on Race to the Top Submitted: April 3rd, 2013 Performance Learning Centers FY2013 Page 55 of 58
Session Ratings – This session provided me with knowledge/skills I will be able to apply at my school
site.
Session Name Count Row N % Count Row N % Count Row N % Count Row N % Count Row N %
Attitude Science 0 0 0 0 0 0.0% 11 100.0% 11 100.0%
Breakfast Keynote: Bill Milliken, Co‐Founder and Vice
Chairman of Communities in Schools0 0 0 0 6 10.3% 52 89.7% 58 100.0%
Capstone 0 0 0 0 6 40.0% 9 60.0% 15 100.0%
CIS Site Coordinators: Reframing Out Work to Include
Student Engagement and Principles0 0 0 0 3 12.0% 22 88.0% 25 100.0%
College Career Readiness: Charting for Success 0 0 0 0 6 22.2% 21 77.8% 27 100.0%
College/Careeer Readiness Track: Creating Pathways of
Access and Success for Underrepresented Students0 0 0 0 2 18.2% 9 81.8% 11 100.0%
College/Career Readiness Track: Just Dual It! 0 0 0 0 0 0.0% 9 100.0% 9 100.0%
Instructional Day: Using PLC Curriculum Resources to Design
Your Courses and Integrating Project‐Based Learning
0 0 0 0 4 28.6% 10 71.4% 14 100.0%
Intake Process Interviewing Potential Students 0 0 0 0 4 18.2% 18 81.8% 22 100.0%
Keynote ‐ Practical Classroom Strategies 0 0 0 0 0 0.0% 23 100.0% 23 100.0%
Keynote: Personal Learning Networks 0 0 1 3.0% 16 48.5% 16 48.5% 33 100.0%
Life Skills through Morning Motivation 0 0 0 0 2 11.8% 15 88.2% 17 100.0%
Lions, Otters, Beavers, Retrievers...Oh My! 0 0 0 0 0 0.0% 14 100.0% 14 100.0%
MATH Learning Facilitators: Math CCGPS Implementation
Workshop0 0 0 0 0 0.0% 4 100.0% 4 100.0%
PLC Coordinators and CIS Executive Directors: Reshaping the
Way We Lead0 0 0 0 5 25.0% 15 75.0% 20 100.0%
PLC Enhancement/Expansion Opportunity Track: ACT's
College Readiness Solutions0 0 0 0 1 10.0% 9 90.0% 10 100.0%
PLC Enhancement/Expansion Opportunity Track: Apex
Learning0 0 0 0 0 0.0% 2 100.0% 2 100.0%
PLC Enhancement/Expansion Opportunity Track: Classroom,
Inc.'s Virtual Internship0 0 0 0 5 55.6% 4 44.4% 9 100.0%
PLC Learning Facilitators: Using LDC to Make the CCGPS
Transition Easier1 12.5% 0 0 5 62.5% 2 25.0% 8 100.0%
PLC School Leadership Creative Scheduling and PLC Data
Reporting0 0 0 0 0 0.0% 7 100.0% 7 100.0%
Round Robin for Academic Coordinators 0 0 0 0 0 0.0% 6 100.0% 6 100.0%
Round Robin for Executive Directors 0 0 0 0 0 0.0% 2 100.0% 2 100.0%
Round Robin for Mathematics Learning Facilitators 0 0 0 0 0 0.0% 6 100.0% 6 100.0%
Round Robin for Science Learning Facilitators 0 0 0 0 0 0.0% 5 100.0% 5 100.0%
Round Robin for Site Coordinators 0 0 0 0 3 33.3% 6 66.7% 9 100.0%
Round Robin for Social Studies Learning Facilitators 0 0 0 0 0 0.0% 7 100.0% 7 100.0%
Senior Project Video 0 0 0 0 3 12.5% 21 87.5% 24 100.0%
The Power of Peace Project 0 0 0 0 0 0.0% 6 100.0% 6 100.0%
Welcome ‐ CIS PLC from the Beginning 0 0 0 0 5 29.4% 12 70.6% 17 100.0%
Who Am I Online ‐ Creating your 21st Century Internet
Presence0 0 0 0 2 14.3% 12 85.7% 14 100.0%
Total
Apply
Strongly Disagree Disagree Somewhat Agree Somewhat Strongly Agree

Mid‐Year Formative Report on Race to the Top Submitted: April 3rd, 2013 Performance Learning Centers FY2013 Page 56 of 58
Session Ratings – How would you rate the quality of the information presented?
Session Name Count Row N % Count Row N % Count Row N % Count Row N % Count Row N %
Attitude Science 0 0.0% 0 0.0% 0 0.0% 11 100.0% 11 100.0%
Breakfast Keynote: Bill Milliken, Co‐Founder and
Vice Chairman of Communities in Schools0 0.0% 0 0.0% 5 8.6% 53 91.4%
58100.0%
Capstone 0 0.0% 1 6.7% 4 26.7% 10 66.6% 15 100.0%
CIS Site Coordinators: Reframing Out Work to
Include Student Engagement and Principles0 0.0% 1 4.2% 2 8.3% 21 87.5%
24100.0%
College Career Readiness: Charting for Success 0 0.0% 0 0.0% 6 22.2% 21 77.8% 27 100.0%
College/Careeer Readiness Track: Creating
Pathways of Access and Success for
Underrepresented Students
0 0.0% 0 0.0% 2 18.2% 9 81.8%
11
100.0%
College/Career Readiness Track: Just Dual It! 0 0.0% 0 0.0% 0 0.0% 9 100.0% 9 100.0%
Instructional Day: Using PLC Curriculum
Resources to Design Your Courses and
Integrating Project‐Based Learning
0 0.0% 1 7.1% 3 21.4% 10 71.5%
14
100.0%
Intake Process Interviewing Potential Students 0 0.0% 0 0.0% 5 22.7% 17 77.3% 22 100.0%
Keynote ‐ Practical Classroom Strategies 0 0.0% 0 0.0% 0 0.0% 23 100.0% 23 100.0%
Keynote: Personal Learning Networks 0 0.0% 3 9.1% 9 27.3% 21 63.6% 33 100.0%
Life Skills through Morning Motivation 0 0.0% 0 0.0% 4 23.5% 13 76.5% 17 100.0%
Lions, Otters, Beavers, Retrievers...Oh My! 0 0.0% 0 0.0% 1 7.1% 13 92.9% 14 100.0%
MATH Learning Facilitators: Math CCGPS
Implementation Workshop0 0.0% 0 0.0% 0 0.0% 4 100.0%
4100.0%
PLC Coordinators and CIS Executive Directors:
Reshaping the Way We Lead0 0.0% 1 5.0% 5 25.0% 14 70.0%
20100.0%
PLC Enhancement/Expansion Opportunity Track:
ACT's College Readiness Solutions0 0.0% 0 0.0% 3 30.0% 7 70.0%
10100.0%
PLC Enhancement/Expansion Opportunity Track:
Apex Learning0 0.0% 0 0.0% 0 0.0% 2 100.0%
2100.0%
PLC Enhancement/Expansion Opportunity Track:
Classroom, Inc.'s Virtual Internship0 0.0% 0 0.0% 5 55.6% 4 44.4%
9100.0%
PLC Learning Facilitators: Using LDC to Make the
CCGPS Transition Easier0 0.0% 0 0.0% 6 75.0% 2 25.0%
8100.0%
PLC School Leadership Creative Scheduling and
PLC Data Reporting0 0.0% 0 0.0% 0 0.0% 7 100.0%
7100.0%
Round Robin for Academic Coordinators 0 0.0% 0 0.0% 2 33.3% 4 66.7% 6 100.0%
Round Robin for Executive Directors 0 0.0% 0 0.0% 0 0.0% 2 100.0% 2 100.0%
Round Robin for Mathematics Learning
Facilitators0 0.0% 0 0.0% 1 16.7% 5 83.3%
6100.0%
Round Robin for Science Learning Facilitators 0 0.0% 0 0.0% 1 20.0% 4 80.0% 5 100.0%
Round Robin for Site Coordinators 0 0.0% 0 0.0% 3 33.3% 6 66.7% 9 100.0%
Round Robin for Social Studies Learning
Facilitators0 0.0% 0 0.0% 0 0.0% 7 100.0%
7100.0%
Senior Project Video 0 0.0% 0 0.0% 5 20.8% 19 79.2% 24 100.0%
The Power of Peace Project 0 0.0% 0 0.0% 0 0.0% 7 100.0% 7 100.0%
Welcome ‐ CIS PLC from the Beginning 0 0.0% 0 0.0% 2 11.8% 15 88.2% 17 100.0%
Who Am I Online ‐ Creating your 21st Century
Internet Presence0 0.0% 0 0.0% 2 14.3% 12 85.7%
14100.0%
Quality Info
Poor Fair Good Excellent Total

Mid‐Year Formative Report on Race to the Top Submitted: April 3rd, 2013 Performance Learning Centers FY2013 Page 57 of 58
Session Ratings – How would you rate the presentation skills of the trainer?
Session Name Count Row N % Count Row N % Count Row N % Count Row N % Count Row N %
Attitude Science 0 0.0% 0 0.0% 0 0.0% 11 100.0% 11 100.0%
Breakfast Keynote: Bill Milliken, Co‐Founder
and Vice Chairman of Communities in Schools0 0.0% 0 0.0% 4 6.9% 54 93.1%
58100.0%
Capstone 0 0.0% 0 0.0% 6 40.0% 9 60.0% 15 100.0%
CIS Site Coordinators: Reframing Out Work to
Include Student Engagement and Principles0 0.0% 0 0.0% 4 16.0% 21 84.0%
25100.0%
College Career Readiness: Charting for Success 0 0.0% 0 0.0% 4 14.8% 23 85.2% 27 100.0%
College/Careeer Readiness Track: Creating
Pathways of Access and Success for
Underrepresented Students
0 0.0% 0 0.0% 2 18.2% 9 81.8%
11
100.0%
College/Career Readiness Track: Just Dual It! 0 0.0% 0 0.0% 0 0.0% 9 100.0% 9 100.0%
Instructional Day: Using PLC Curriculum
Resources to Design Your Courses and
Integrating Project‐Based Learning
0 0.0% 0 0.0% 3 21.4% 11 78.6%
14
100.0%
Intake Process Interviewing Potential Students 0 0.0% 0 0.0% 4 18.2% 18 81.8% 22 100.0%
Keynote ‐ Practical Classroom Strategies 0 0.0% 0 0.0% 0 0.0% 23 100.0% 23 100.0%
Keynote: Personal Learning Networks 0 0.0% 3 9.1% 8 24.2% 22 66.7% 33 100.0%
Life Skills through Morning Motivation 0 0.0% 0 0.0% 2 11.8% 15 88.2% 17 100.0%
Lions, Otters, Beavers, Retrievers...Oh My! 0 0.0% 0 0.0% 1 7.1% 13 92.9% 14 100.0%
MATH Learning Facilitators: Math CCGPS
Implementation Workshop0 0.0% 0 0.0% 0 0.0% 4 100.0%
4100.0%
PLC Coordinators and CIS Executive Directors:
Reshaping the Way We Lead0 0.0% 1 5.3% 5 26.3% 13 68.4%
19100.0%
PLC Enhancement/Expansion Opportunity
Track: ACT's College Readiness Solutions0 0.0% 0 0.0% 2 20.0% 8 80.0%
10100.0%
PLC Enhancement/Expansion Opportunity
Track: Apex Learning0 0.0% 0 0.0% 0 0.0% 2 100.0%
2100.0%
PLC Enhancement/Expansion Opportunity
Track: Classroom, Inc.'s Virtual Internship0 0.0% 0 0.0% 3 33.3% 6 66.7%
9100.0%
PLC Learning Facilitators: Using LDC to Make
the CCGPS Transition Easier0 0.0% 0 0.0% 5 62.5% 3 37.5%
8100.0%
PLC School Leadership Creative Scheduling and
PLC Data Reporting0 0.0% 0 0.0% 0 0.0% 7 100.0%
7100.0%
Round Robin for Academic Coordinators 0 0.0% 1 16.7% 1 16.7% 4 66.6% 6 100.0%
Round Robin for Executive Directors 0 0.0% 0 0.0% 0 0.0% 2 100.0% 2 100.0%
Round Robin for Mathematics Learning
Facilitators0 0.0% 0 0.0% 1 16.7% 5 83.3%
6100.0%
Round Robin for Science Learning Facilitators 0 0.0% 0 0.0% 1 20.0% 4 80.0% 5 100.0%
Round Robin for Site Coordinators 0 0.0% 0 0.0% 2 22.2% 7 77.8% 9 100.0%
Round Robin for Social Studies Learning
Facilitators0 0.0% 0 0.0% 1 14.3% 6 85.7%
7100.0%
Senior Project Video 0 0.0% 0 0.0% 4 16.7% 20 83.3% 24 100.0%
The Power of Peace Project 0 0.0% 0 0.0% 0 0.0% 7 100.0% 7 100.0%
Welcome ‐ CIS PLC from the Beginning 0 0.0% 0 0.0% 2 12.5% 14 87.5% 16 100.0%
Who Am I Online ‐ Creating your 21st Century
Internet Presence0 0.0% 0 0.0% 1 7.1% 13 92.9%
14100.0%
TrainerPoor Fair Good Excellent Total

Mid‐Year Formative Report on Race to the Top Submitted: April 3rd, 2013 Performance Learning Centers FY2013 Page 58 of 58
Session Ratings – OVERALL RATINGS
Count Row N % Count Row N % Count Row N % Count Row N % Count Row N %
Attitude Science 0 0.0% 0 0.0% 0 0.0% 11 100.0% 11 100.0%
Breakfast Keynote: Bill Milliken, Co‐Founder
and Vice Chairman of Communities in Schools0 0.0% 0 0.0% 5 8.6% 53 91.4% 58 100.0%
Capstone 0 0.0% 1 6.7% 5 33.3% 9 60.0% 15 100.0%
CIS Site Coordinators: Reframing Out Work to
Include Student Engagement and Principles0 0.0% 1 4.0% 4 16.0% 20 80.0% 25 100.0%
College Career Readiness: Charting for Success0 0.0% 0 0.0% 7 25.9% 20 74.1% 27 100.0%
College/Careeer Readiness Track: Creating
Pathways of Access and Success for
Underrepresented Students
0 0.0% 0 0.0% 2 18.2% 9 81.8% 11 100.0%
College/Career Readiness Track: Just Dual It! 0 0.0% 0 0.0% 0 0.0% 9 100.0% 9 100.0%
Instructional Day: Using PLC Curriculum
Resources to Design Your Courses and
Integrating Project‐Based Learning
0 0.0% 1 7.1% 3 21.4% 10 71.5% 14 100.0%
Intake Process Interviewing Potential Students0 0.0% 0 0.0% 5 22.7% 17 77.3% 22 100.0%
Keynote ‐ Practical Classroom Strategies 0 0.0% 0 0.0% 0 0.0% 23 100.0% 23 100.0%
Keynote: Personal Learning Networks 0 0.0% 5 15.1% 7 21.2% 21 63.7% 33 100.0%
Life Skills through Morning Motivation 0 0.0% 0 0.0% 3 17.6% 14 82.4% 17 100.0%
Lions, Otters, Beavers, Retrievers...Oh My! 0 0.0% 0 0.0% 1 7.1% 13 92.9% 14 100.0%g
Implementation Workshop 0 0.0% 0 0.0% 0 0.0% 4 100.0% 4 100.0%
PLC Coordinators and CIS Executive Directors:
Reshaping the Way We Lead0 0.0% 1 5.3% 4 21.0% 14 73.7% 19 100.0%
PLC Enhancement/Expansion Opportunity
Track: ACT's College Readiness Solutions0 0.0% 0 0.0% 2 20.0% 8 80.0% 10 100.0%
PLC Enhancement/Expansion Opportunity
Track: Apex Learning0 0.0% 0 0.0% 0 0.0% 2 100.0% 2 100.0%
PLC Enhancement/Expansion Opportunity
Track: Classroom, Inc.'s Virtual Internship0 0.0% 0 0.0% 5 55.6% 4 44.4% 9 100.0%
PLC Learning Facilitators: Using LDC to Make
the CCGPS Transition Easier0 0.0% 1 12.5% 6 75.0% 1 12.5% 8 100.0%
PLC School Leadership Creative Scheduling and
PLC Data Reporting 0 0.0% 0 0.0% 0 0.0% 7 100.0% 7 100.0%
Round Robin for Academic Coordinators 0 0.0% 0 0.0% 1 16.7% 5 83.3% 6 100.0%
Round Robin for Executive Directors 0 0.0% 0 0.0% 0 0.0% 2 100.0% 2 100.0%
Round Robin for Mathematics Learning
Facilitators0 0.0% 0 0.0% 1 16.7% 5 83.3% 6 100.0%
Round Robin for Science Learning Facilitators 0 0.0% 0 0.0% 1 20.0% 4 80.0% 5 100.0%
Round Robin for Site Coordinators 0 0.0% 0 0.0% 3 33.3% 6 66.7% 9 100.0%
Round Robin for Social Studies Learning
Facilitators0 0.0% 0 0.0% 1 14.3% 6 85.7% 7 100.0%
Senior Project Video 0 0.0% 0 0.0% 3 12.5% 21 87.5% 24 100.0%
The Power of Peace Project 0 0.0% 0 0.0% 0 0.0% 7 100.0% 7 100.0%
Welcome ‐ CIS PLC from the Beginning 0 0.0% 0 0.0% 2 12.5% 14 87.5% 16 100.0%
Who Am I Online ‐ Creating your 21st Century
Internet Presence0 0.0% 0 0.0% 2 14.3% 12 85.7% 14 100.0%
Session NameOverall by Sessions
Poor Fair Good Excellent Total