in-person survey 2017-18 - national core indicators › upload › core...in-person survey 2017-18...
TRANSCRIPT

In-Person Survey 2017-18
Part II:
• NCI History and Activities
• Methodology
• Data Analysis
• Appendices

ii
Table of Contents
Overview of National Core Indicators .................................................................................................... 2
State Participation ..........................................................................................................................................................................................3
Figure A. NCI State Participation 2017-18 ............................................................................................................................................... 3 The Core Indicators .......................................................................................................................................................................................3
Figure B. In-person Survey Indicators: Domains and Sub-Domains ............................................................................................ 5 How NCI Data Are Used ...............................................................................................................................................................................5
Administration ...................................................................................................................................... 8
Proxy Respondents ........................................................................................................................................................................................8
Surveyor Training ..........................................................................................................................................................................................9
Criteria for Exclusion of Responses ..................................................................................................................................................... 10
Sampling .......................................................................................................................................................................................................... 11
Figure C. Valid Surveys and Response Rates by State 2017-18 ................................................................................................... 13 Data Management and Analysis .......................................................................................................... 15
Weighting ........................................................................................................................................................................................................ 15
Significance Testing .................................................................................................................................................................................... 16
Outcome Adjustment ................................................................................................................................................................................. 17
Scale Development ...................................................................................................................................................................................... 18
Appendix A ......................................................................................................................................... 20
Survey changes from 2016-17 to 2017-18 ....................................................................................................................................... 20
Table A1. Survey Changes 2016-17 to 2017-18: Pre-Survey and Background Information .......................................... 20 SC-2 Face-to-face Scheduling Status : ............................................................................................................................................ 20
Table A2. Survey Changes 2016-17 to 2017-18: Employment .................................................................................................... 23 Table A3. Survey Changes 2016-17 to 2017-18: Funding .............................................................................................................. 23 Table A4. Survey Changes 2016-17 to 2017-18: Section II ........................................................................................................... 24
Appendix B ......................................................................................................................................... 26
Rules for Recoding and Combining Variables to Compute Core Indicators ........................................................................ 26
Table B1. Background Information Variables Used to Adjust Outcomes ................................................................................ 27 Table B2. Outcome Variables -- Rules for Analysis............................................................................................................................ 29
Appendix C .......................................................................................................................................... 40
Sampling procedures ................................................................................................................................................................................. 40
Table C1. State sampling information (included populations) .................................................................................................... 41 Appendix D ......................................................................................................................................... 50
Un-collapsed and unadjusted data by state ...................................................................................................................................... 50
Table D1. Who chose (or picked) the place where you live? (if not living the family home) ........................................... 51 Table D2. Did you choose (or pick) the people you live with (or did you choose to live by yourself)? (if not living the family home)........................................................................................................................................................................................................ 52 Table D3. Who chose (or picked) the place where you work? (among those with a job in the community) ............ 53 Table D4. Chose or had some input in choosing day program or workshop (adjusted variable; among those determined to attend a day program or workshop; ‘person made the choice’ and ‘person had some input’ responses; proxy respondents were allowed for this question) ± º ^ ................................................................................................................................ 54 Table D5. Do you choose (or pick) your staff? ..................................................................................................................................... 55 Table D6. Who decides your daily schedule? ....................................................................................................................................... 56 Table D7. Who decides how you spend your free time? ................................................................................................................. 57 Table D8. Do you choose what you buy with your spending money? ....................................................................................... 58 Table D9. Can you change your case manager/service coordinator if you want to? ......................................................... 59

iii
Table D10. Was in community paid job (individual with or without public services, group supported or community job in a business that primarily hires people with disabilities )...................................................................................................... 60 Table D11. Bi-weekly hours and wage (not including benefits and before taxes or deductions) information among those with a paid individual community job with or without publicly funded supports................................................. 61 Table D12. Bi-weekly hours and wage information among those with a paid group job with or without publicly funded supports .................................................................................................................................................................................................. 62 Table D13. Bi-weekly hours and wage information among those with a paid job in the community that primarily hires people with disabilities ...................................................................................................................................................................... 63 Table D14. How long has this person been working at his/her current job? (among those with a paid community job) .......................................................................................................................................................................................................................... 64 Table D15. Does this person receive paid time off (e.g., vacation, holiday, or sick time) at his/her job? (among those with a paid community job) .......................................................................................................................................................................... 65 Table D16. Would you like to have a job in the community? (among those with no paid community job) ............... 66 Table D17. Is community employment a goal in this person's service plan? ........................................................................ 67 Table D18. Do you take classes, training, or do something to help you get a job, get a better job, or do better at the job you have now? ............................................................................................................................................................................................ 68 Table D19. Do you go to a day program or sheltered workshop?............................................................................................... 69 Table D20. Do you volunteer? ..................................................................................................................................................................... 70 Table D21. Is this person currently using a self-directed supports option? .......................................................................... 71 Table D22. Who makes decisions about how your budget for services is used? (among those using a self-direction option) ................................................................................................................................................................................................................... 72 Table D23. Do you hire and manage your staff? (among those using a self-direction option) ........................................ 73 Table D24. Can you make changes to your budget/services if you need to? (among those using a self-direction option) ................................................................................................................................................................................................................... 74 Table D25. Do you have enough help deciding how to use your budget/services? (among those using a self-direction option) ................................................................................................................................................................................................................... 75 Table D26. Do you get information about how much money is left in your budget/services? (among those using a self-direction option) ........................................................................................................................................................................................ 76 Table D27. Is the information easy to understand? (among those using a self-direction option and who receive information about money left in their budget/services) ................................................................................................................... 77 Table D28. How often do you get information about how much money is left in your budget/services? (among those using a self-direction option and who receive information about money left in their budget/services) ........... 78 Table D29. How many times did you go shopping in the past month? .................................................................................... 79 Table D30. Who did you usually go shopping with? º ∞ ................................................................................................................. 80 Table D31. How many times did you go out on errands or appointments in the past month ....................................... 81 Table D32. Who did you usually go with when you went on errands or appointments? º ∞ ........................................ 82 Table D33. How many times did you go out for entertainment in the past month? .......................................................... 83 Table D34. Who did you usually go with when you went out for entertainment? º ∞ ..................................................... 84 Table D35. How many times did you go out to a restaurant or coffee shop in the past month? .................................. 85 Table D36. Who did you usually go with when you went to restaurants or coffee shops? º ∞ ..................................... 86 Table D37. How many times did you go out to a religious service or spiritual practice in the past month? .......... 87 Table D38. Who did you usually go with to religious/spiritual practices? º ∞ .................................................................... 88 Table D39. Do you participate as a member of community groups in your community? ................................................ 89 Table D40. Who did you participate in community groups with? º ∞ ..................................................................................... 90 Table D41. In the past year, did you go away on vacation? ........................................................................................................... 91 Table D42. Who did you usually go on vacation with? º ∞ ............................................................................................................ 92 Table D43. Are you able to go out and do the things you like to do? ......................................................................................... 93 Table D44. Do you get to do the things you like to do as much as you want to? .................................................................. 94 Table D45. When you are at home, do you have enough things you like to do? .................................................................. 95 Table D46. Do you have friends you like to talk to or do things with? ..................................................................................... 96 Table D47. Do you have a best friend, or someone you are really close to? .......................................................................... 97 Table D48. Do you want more help to make or keep in contact with your friends? .......................................................... 98 Table D49. Can you see your friends when you want to? ............................................................................................................... 99 Table D50. Do you have other ways of talking, chatting or communicating with your friends when you cannot see them? ................................................................................................................................................................................................................... 100 Table D51. Can you see and/or communicate with your family when you want to? (among those who do not live in the family home) ............................................................................................................................................................................................. 101 Table D52. Do you ever feel lonely? ...................................................................................................................................................... 102

iv
Table D53. Can you go on a date if you want to? ............................................................................................................................. 103 Table D54. Do you like your home or where you live? ................................................................................................................. 104 Table D55. What don’t you like about where you live? ................................................................................................................ 105 Table D56. Would you like to live somewhere else?...................................................................................................................... 106 Table D57. Do you like where you work? (among those with a paid community job) ..................................................... 107 Table D58. Do you want to work somewhere else? (among those with a paid community job) ................................. 108 Table D59. Attends a day program or workshop and wants to go more, less, or the same amount of time ........ 109 Table D60. Services and Supports help person live a good life................................................................................................. 110 Table D61. Have you met your case manager/service coordinator? ..................................................................................... 111 Table D62. Does your case manager/service coordinator ask what you want? ............................................................... 112 Table D63. Are you able to contact your case manager/service coordinator when you want to? ........................... 113 Table D64. Do your staff come and leave when they are supposed to? ................................................................................ 114 Table D65. Did you take part in the last service planning meeting? ...................................................................................... 115 Table D66. At the service planning meeting, did you know what was being talked about? ........................................ 116 Table D67. Did the service planning meeting include the people you wanted to be there? ........................................ 117 Table D68. Were you able to choose the services that you get as part of your service plan? ..................................... 118 Table D69. Do you have a way to get places you need to go? .................................................................................................... 119 Table D70. Are you able to get places when you want to do something outside your home, like going out to see friends, for entertainment, or to do something fun? ..................................................................................................................... 120 Table D71. Do you feel that your staff have the right training to meet your needs? (does not include responses from proxies who were staff) ................................................................................................................................................................................ 121 Table D72. Does this person have a primary care doctor or primary care practitioner? ............................................. 122 Table D73. Overall, how would you describe your health? ........................................................................................................ 123 Table D74. When was his/her last complete annual physical exam? .................................................................................... 124 Table D75. When was his/her last dentist exam? ........................................................................................................................... 125 Table D76. When was the last time this person had an eye exam/vision screening? .................................................... 126 Table D77. When was the last time this person had a hearing test? ...................................................................................... 127 Table D78. If female, when was her last Pap test screening? (among women 21 and older) ....................................... 128 Table D79. If female, when was her last mammogram? (among women age 40 and over) .......................................... 129 Table D80. When was the last time this person had a screening for colorectal cancer (among people age 50 and over) ∞ ............................................................................................................................................................................................................... 130 Table D81. During the last 12 months, has this person had a flu vaccination?.................................................................. 131 Table D82. Takes at least one medication to treat mood disorders, anxiety, psychotic disorders and/or behavior challenge ............................................................................................................................................................................................................ 132 Table D83. Does this person currently take medications to treat mood disorders, anxiety, and/or psychotic disorders? ......................................................................................................................................................................................................... 133 Table D84. How many medications does this person currently take to treat mood disorders, anxiety, and/or psychotic disorders? .................................................................................................................................................................................... 134 Table D85. Does this person currently take medications for behavioral challenges? .................................................... 135 Table D86. How many medications does this person currently take medications for behavioral challenges? .. 136 Table D87. Does this person have a behavior plan? ...................................................................................................................... 137 Table D88. Has a behavior plan (among those who take medication for a behavior challenge) .................................. 138 Table D89. How often do you exercise or do physical activity for at least 10 minutes at a time? º ......................... 139 Table D90. How often do you exercise or do physical activity that makes the muscles in your arms, legs, back or chest work hard? º ........................................................................................................................................................................................ 140 Table D91. Body Mass Index (BMI) category (BMI calculated using data on weight and height) .............................. 141 Table D92. Does this person use nicotine or tobacco products? .............................................................................................. 142 Table D93. Do you have a key to your home? ................................................................................................................................... 143 Table D94. Do people let you know before they come into your home? .............................................................................. 144 Table D95. Can you lock your bedroom if you want to?............................................................................................................... 145 Table D96. Do people let you know before coming into your bedroom? ............................................................................. 146 Table D97. Do you have a place to be alone in your home? ........................................................................................................ 147 Table D98. Can you be alone with friends or visitors at your home? ..................................................................................... 148 Table D99. Are there rules about having friends or visitors in your home? ....................................................................... 149 Table D100. Do people read your mail or email without asking you first? ......................................................................... 150 Table D101. Can you use the phone and internet when you want to?................................................................................... 151 Table D102. Do your staff treat you with respect? ......................................................................................................................... 152 Table D103. Have you ever participated in a self-advocacy group meeting, conference, or event? ........................ 153

v
Table D104. Have you voted? (in local, state, or federal election) ............................................................................................ 154 Table D105. Are there any places where you feel afraid or scared? ∞ ................................................................................. 155 Table D106. If you ever feel afraid, is there someone you can talk to? ................................................................................. 156

National Core Indicators™
NCI History and Activities | 1
I. NCI History and Activities

National Core Indicators™
NCI History and Activities | 2
Overview of National Core Indicators
In December 1996, the National Association of State Directors of Developmental Disabilities Services
(NASDDDS), in collaboration with the Human Services Research Institute (HSRI), launched the Core
Indicators Project (CIP). The aim of the project was to support state developmental disabilities
operating agencies in the development and implementation of performance and outcome
indicators—and related data collection strategies—so that they could measure service delivery
system performance. This effort, now called National Core Indicators (NCI), strives to provide states
with valid and reliable tools to help improve system performance and better serve people with
intellectual and developmental disabilities and their families. Moreover, NASDDDS’ active
sponsorship of NCI facilitates pooled knowledge, expertise, and resources among the states.
In 1997, 15 states convened to discuss the scope and content of a potential performance
measurement framework. Directors and staff from these 15 states worked to identify the major
domains and sub-domains of performance, indicators, measures, and data sources. The original 61
indicators, developed through a consensus process, were intended to provide a system-level
“snapshot” of how well each state was performing. The states were guided by a set of criteria that
was designed to select indicators that were:
1. Measurable
2. Related to issues the states had some ability to influence
3. Important to all individuals they served, regardless of level of disability or residential setting.
During this initial phase, data collection protocols were developed and field-tested, including a face-
to-face In-person Survey1 (for individuals age 18 and older who were receiving services) and a mail-
out Adult Family Survey (for families who have an adult family member living at home). Seven states
volunteered to pilot test the indicators. Eight additional states served on the Steering Committee.
Since the initial field test, NCI has expanded its scope to include outcomes of services for children
with intellectual and developmental disabilities and their families. In addition, NCI continues to
develop and refine the indicators and expand state participation. For more information about NCI
states, technical reports, and other resources, please visit http://www.nationalcoreindicators.org.
1 Formerly named ‘Adult Consumer Survey’

National Core Indicators™
NCI History and Activities | 3
State Participation
During the 2017-18 data collection cycle, 46 states, the District of Columbia and 22 sub-state entities
participated in NCI. State participation is entirely voluntary, and the participating states are shown in
the chart below. NCI states do not participate in all surveys each year.
Figure A. NCI State Participation 2017-18
The Core Indicators
The Core Indicators are the standard measures used across states to assess the outcomes of services
provided to individuals and families. Indicators address key areas of concern, including employment,
respect/rights, service planning, community inclusion, choice, and health and safety. An example of a
Core Indicator would be, “The proportion of people who have a paid job in the community. ”To see
the entire list of Core Indicators, please visit http://www.nationalcoreindicators.org/indicators.
Each survey instrument is designed to measure certain Core Indicators. While most indicators
correspond to a single survey question, a few refer to clusters of related questions. For example, the
indicator that measures Community Inclusion (the proportion of people who regularly participate in
everyday integrated activities in their communities) is measured by several survey questions that
ask about several separate community activities.

National Core Indicators™
NCI History and Activities | 4
The current set of performance indicators includes approximately 100 consumer, family, system, and
health and safety outcomes—outcomes that are important to understanding the overall health of
public developmental disabilities agencies. Indicators are organized across five broad domains:
Individual Outcomes; Health, Welfare and Rights; Staff Stability and Competency; Family Outcomes;
and System Performance. Each domain is broken down into sub-domains (see Figure B on the
following page). Three data sources are used to assess outcomes: the In-person Survey, three Family
Surveys, and a Staff Stability Survey (e.g., staff turnover).
The indicators have remained generally consistent over the last several years and thus can be used to
analyze system-level trends over time. However, the NCI program is a dynamic effort that allows for
measures to be added, dropped, or changed to reflect current and future priorities of participating
states.
The data collection tools used to gather indicator data are regularly refined and tested to ensure they
remain valid, reliable, and applicable to current issues within the field. Details on the design and
testing of this tool are provided in the next section of this report.
Domains and Sub-Domains
The following table lists the domains and sub-domains covered by the NCI In-person Survey
indicators.

National Core Indicators™
NCI History and Activities | 5
Figure B. In-person Survey Indicators: Domains and Sub-Domains
Domain Sub-Domain Concern Statement
Individual Outcomes
Work People have support to find and maintain community integrated employment.
Community Inclusion, Participation and Leisure
People have support to participate in everyday community activities.
Choice and Decision-Making
People make choices about their lives and are actively engaged in planning their services and supports.
Self Determination People have authority and are supported to direct and
manage their own services.
Relationships People have friends and relationships.
Satisfaction People are satisfied with the services and supports they
receive.
Health, Welfare, and Rights
Safety People are safe from abuse, neglect, and injury.
Health People secure needed health services.
Medications Medications are managed effectively and appropriately.
Wellness People are supported to maintain healthy habits.
Respect/Rights People receive the same respect and protections as
others in the community.
System Performance
Service Coordination
Service coordinators are accessible, responsive, and support the person's participation in service planning.
Access Publicly funded services are readily available to
individuals who need and qualify for them.
How NCI Data Are Used
The Core Indicators provide information for quality management and are intended to be used in
conjunction with other state data sources, such as risk management information, regional level
performance data, results of provider monitoring processes, and administrative information
gathered at the individual service coordination level. States typically use the indicator data to inform
strategic planning, produce legislative reports, and prioritize quality improvement initiatives. Some
states use NCI as a data source for supplemental performance measures in their home and
community-based services (HCBS) waiver quality management systems and include the information

National Core Indicators™
NCI History and Activities | 6
in support of evidentiary reports to the Centers for Medicare & Medicaid Services (CMS). Many states
share the indicator data with stakeholder groups such as Quality Councils and use the stakeholder
feedback to help set priorities and establish policy direction. It is also important to note that states do
not use the information in a punitive way to sanction service providers, nor do they use the results to
remediate individual issues (unless specifically requested by the participant or required by law as in
the case of suspected abuse, neglect, or mistreatment).
For more information on how to use these data for quality improvement, please see this handbook:
Using National Core Indicators for Quality Improvement Initiatives.2
Caution and Limitations
This report does not provide benchmarks for acceptable or unacceptable levels of performance.
Rather, it is up to each state to decide whether its score or percentage is an acceptable performance
level. States that fall into the “Significantly Below NCI Average” tier on any scale or indicator are not
necessarily underperforming; instead, this placement indicates only that the state’s scale score or
indicator percentage is significantly lower than the average of all states—where “significantly”
means “not due to chance.” The results tables throughout this report display states’ scores relative to
one another and show which states tend to have similar results. Notably, the difference between a
“Significantly Below NCI Average” state and the average across the other states may be very small,
and it is up to public managers, policy-makers, and other stakeholders to decide whether a state’s
result relative to the NCI Average suggests that changes or further investigation are necessary.
Moreover, the NCI Average should be interpreted as a multi-state “norm” that describes average
levels of performance or satisfaction across the participating states. In some instances there are few
significant differences among the states; this denotes that the majority of states are performing
similarly. Instances in which several states’ results are especially high (considerably above the
average level) indicate the levels of performance or satisfaction achieved in those states might define
a level of performance that may serve as a guidepost for other states.
Data from previous years are not presented in this report. Comparisons of results from year to year
should be made with caution: even slight changes in wording or response options of certain
questions may affect comparability of results from one year to the next; the mix of participating
states differs slightly each year and may affect the NCI Averages; and states draw new samples each
year rather than following the same group of individuals.
Also critical to note is that differences by state in requirements for eligibility for DD services may also
be reflected in differences in the NCI data.
2 Located on the National Core Indicators website: www.nationalcoreindicators.org → Resources →Technical Reports

Methodology | 7
II. Methodology
Methodology | 8
Administration
A key principle of NCI is the importance of gathering information directly from service
recipients. The indicators are meant to apply to all individuals receiving services,
regardless of disability type, and NCI administration protocols dictate that every person
selected into the sample is given an opportunity to respond and no one is prescreened or
predetermined to be unable to respond. Moreover, survey questions should not be marked
“not applicable” on the basis of a person’s level of ability.
Information for the In-person Survey is collected via a direct conversation with the person
receiving services. Additionally, background information is primarily collected from the
individual’s record. Section I questions, which pertain to personal experiences and require
subjective responses, may only be answered by the individual receiving services. Section II
of the survey—which consists of objective questions on the individual’s involvement in the
community, their choices, respect and rights, and their access to services—allows for the
use of “proxy” or other respondents who know the individual well (such as a family
member or friend).
Proxy Respondents
Studies have found that the greatest discrepancies between individual and proxy responses
occur when the information being collected is subjective (i.e., related to how a person feels;
proxies would be aware of the correct answers only if the individual had previously
expressed his or her feelings).3 Questions relating to observable behaviors tend to have
higher levels of agreement between the proxy and the individual. By excluding proxies, a
large percentage of individuals (most of whom are unable to respond) would be
unrepresented in the data. Thus, the NCI project determined at the outset that proxy
respondents would be used, though only for specific questions and only in situations where
the individual surveyed either could not effectively communicate with the surveyor or
chose to have a proxy respondent.
As mentioned, the use of proxy respondents for the NCI tool is limited to questions in
Section II, which relates to observable and/or measurable items: Community Inclusion,
3 Magaziner, Jay, Sheryl Zimmerman, Ann L. Gruber-Baldini, J. Richard Hebel, and Kathleen M. Fox. "Proxy Reporting in
Five Areas of Functional Status Comparison with Self-Reports and Observations of Performance." American Journal of Epidemiology 146.5 (1997): 418-28.

Methodology | 9
Choices, Respect/Rights, and Access to Needed Services. These questions deal with
everyday occurrences on which others may reliably report. State records are also used to
report objective data on an individual’s health status and exam history as well as
employment status; this information is collected in the Background Section of the survey.
NCI has taken steps to ensure that the responses gathered are as accurate as possible. First,
it is important to make the questions as accessible as possible to increase participation by
all individuals. NCI attempts to make the language in the In-person Survey as easy to
understand as possible and includes suggested rephrasing for questions that may be
nuanced or more difficult to understand. The NCI surveys are also routinely revised based
on feedback from states, self-advocates, families, and surveyors who are administering the
tool. Secondly, it is important to establish a set of standards for proxy respondents. NCI
aims to increase the reliability of proxy responses by allowing only those people who know
the individual well (family, friends, staff, etc.) to serve as proxy respondents. To avoid
conflict, service coordinators are not allowed to respond as proxies. Further, if both the
individual and a proxy respondent answer a question, the individual’s answer is recorded
so long as his/her answer is deemed reliable by the surveyor. Surveyors also keep track of
who responds to each question—the individual or the proxy—and the proxy’s relationship
to the individual.
Surveyor Training
States employ a variety of individuals to conduct the face-to-face meetings for the NCI In-
person Survey. To avoid conflict, surveys cannot be administered by the individual’s
service provider, relative, personal case manager, staff member, or other close contact.
Given this constraint, states often use university students, state staff, private contractors,
advocacy organizations, and individuals with disabilities and their families to conduct the
surveys.
HSRI and NASDDDS staff provide two sets of trainings each year: a more comprehensive
training for new states and states with mostly or all new surveyors and a web-based
refresher training for surveyors who have recently participated in the In-person Survey.
Typically, instruction takes the form of a “train-the-trainer” session, whereby staff from the
state’s lead agency and/or those managing the surveyors provide training to new hires
throughout the year. The goal of trainings is to provide a standardized training to ensure
uniform application of the survey.

Methodology | 10
Trainings consist of a detailed review of the survey tool and an overview of general
surveying techniques. Trainers are given a packet of standardized materials to be used at
the on-site training sessions. An additional session reviews the process for entering survey
data in the Online Data Entry Survey Application (ODESA).
Criteria for Exclusion of Responses
All individuals selected in the survey sample are given an opportunity to participate in a
face-to-face meeting. There are no prescreening procedures. Exclusion of responses occurs
at the time of data analysis by HSRI, based on the criteria described below. There is no
threshold of number of answers to be given in order to consider a survey complete.
Surveys are excluded from analysis of questions occurring in Section I if:
1) The surveyor indicated that the individual receiving supports did not respond
validly to questions in Section I.
2) All questions in Section I were missing or marked n/a or Don’t Know.
Surveys are excluded from analysis of questions occurring in Section II if:
1) The individual receiving supports was marked as the respondent to all questions in
Section II but Section I was deemed invalid (for one of the reasons above).
2) No questions were answered in Section II.
The total number of valid In-person Surveys administered in 2017-18 was 25,671.
Responses for Section I
Only individuals receiving services may answer questions in Section I. As shown in Figure
D, 72.4% of individuals in the total 2017-18 sample were able to respond to Section I of the
direct meeting; valid responses by state ranged from 44.8% to 95.3%.
Responses for Section II
Section II allows for multiple respondents who know the individual well (e.g., family, friend,
support worker) to provide answers. If an individual’s responses were excluded from
Section I in the final analysis, responses from Section II were also excluded if the individual
was the only respondent to Section II. For 2017-18, the valid response rate (proxies
included) to Section II was 99.4%.

Methodology | 11
Sampling
Each state is instructed to attempt to complete a minimum of 400 surveys with a random
sample of individuals over the age of 18 who are receiving at least one publicly funded
service besides case management. A sample size of 400 guarantees valid comparisons to be
made across states with a 95% confidence level and a margin of error of +/- 5%, no matter
how large the service population size. A 95% confidence level and a margin of error of +/-
5% is mandatory for each state’s sample to be included in this report. Most states sample
more than 400 individuals to account for refusals and surveys that may be deemed invalid.
Figure D presents the number of surveys completed by state. A more detailed description
of each state’s sampling strategy can be found in Appendix C.
Methodology | 12
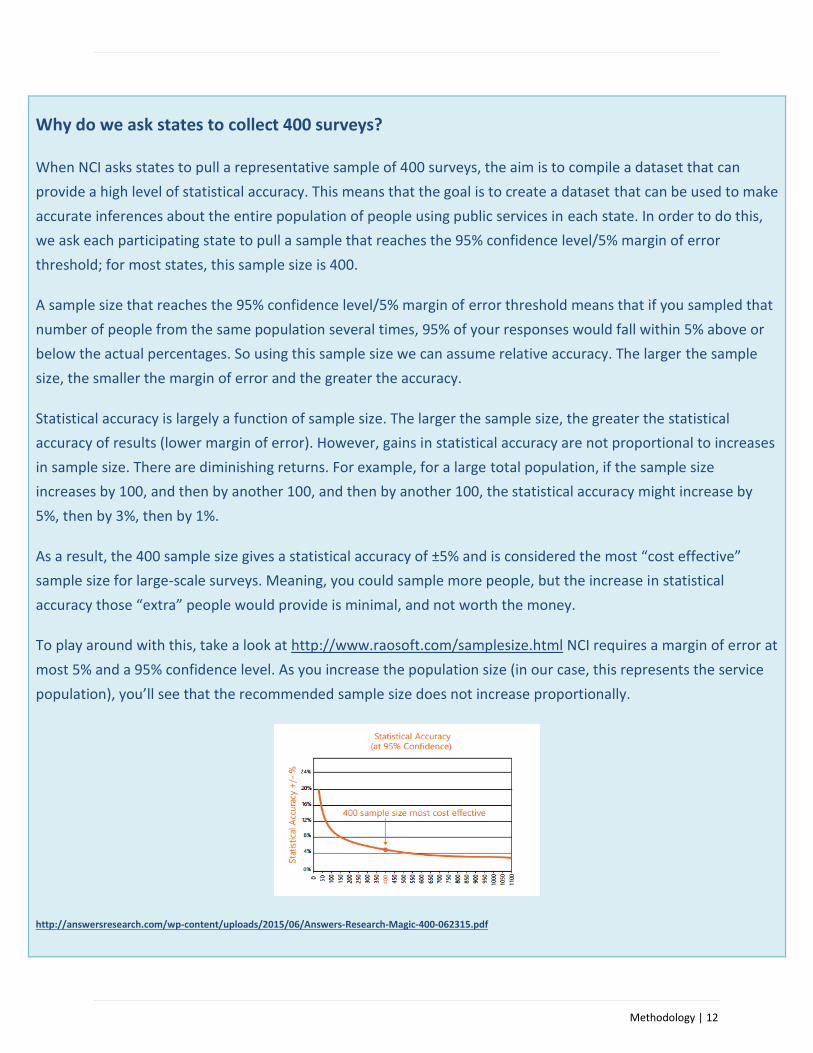
Why do we ask states to collect 400 surveys?
When NCI asks states to pull a representative sample of 400 surveys, the aim is to compile a dataset that can
provide a high level of statistical accuracy. This means that the goal is to create a dataset that can be used to make
accurate inferences about the entire population of people using public services in each state. In order to do this,
we ask each participating state to pull a sample that reaches the 95% confidence level/5% margin of error
threshold; for most states, this sample size is 400.
A sample size that reaches the 95% confidence level/5% margin of error threshold means that if you sampled that
number of people from the same population several times, 95% of your responses would fall within 5% above or
below the actual percentages. So using this sample size we can assume relative accuracy. The larger the sample
size, the smaller the margin of error and the greater the accuracy.
Statistical accuracy is largely a function of sample size. The larger the sample size, the greater the statistical
accuracy of results (lower margin of error). However, gains in statistical accuracy are not proportional to increases
in sample size. There are diminishing returns. For example, for a large total population, if the sample size
increases by 100, and then by another 100, and then by another 100, the statistical accuracy might increase by
5%, then by 3%, then by 1%.
As a result, the 400 sample size gives a statistical accuracy of ±5% and is considered the most “cost effective”
sample size for large-scale surveys. Meaning, you could sample more people, but the increase in statistical
accuracy those “extra” people would provide is minimal, and not worth the money.
To play around with this, take a look at http://www.raosoft.com/samplesize.html NCI requires a margin of error at
most 5% and a 95% confidence level. As you increase the population size (in our case, this represents the service
population), you’ll see that the recommended sample size does not increase proportionally.
http://answersresearch.com/wp-content/uploads/2015/06/Answers-Research-Magic-400-062315.pdf

Methodology | 13
Figure C. Valid Surveys and Response Rates by State 2017-18
% Valid Answers to Section I
% Valid Answers to Section II
Number of Valid Surveys
Completed
% of Total Sample Size (N)
AL 85.8% 100.0% 381 1.5%
AR 83.3% 100.0% 405 1.6%
AZ 67.3% 99.8% 493 1.9%
CA 65.7% 99.8% 8280 32.3%
CO 95.3% 99.5% 405 1.6%
CT 79.0% 99.2% 371 1.4%
DC 44.8% 100.0% 416 1.6%
DE 69.3% 97.6% 415 1.6%
FL 66.1% 99.8% 969 3.8%
GA 61.2% 99.2% 477 1.9%
IL 74.1% 99.2% 370 1.4%
IN 81.1% 100.0% 739 2.9%
KS 67.6% 99.7% 395 1.5%
KY 67.6% 100.0% 417 1.6%
LA 78.8% 100.0% 439 1.7%
MA 75.4% 100.0% 423 1.6%
ME 85.2% 99.7% 399 1.6%
MI 64.5% 99.7% 650 2.5%
MN 74.3% 98.5% 401 1.6%
MO 68.0% 99.8% 400 1.6%
NC 52.6% 99.9% 667 2.6%
NE 80.5% 100.0% 420 1.6%
NV 81.0% 100.0% 395 1.5%
NY 64.6% 100.0% 515 2.0%
OH 76.3% 99.6% 766 3.0%
OK 69.3% 99.8% 400 1.6%
OR 73.8% 99.8% 428 1.7%
PA 72.5% 99.2% 708 2.8%
RI 81.4% 99.4% 354 1.4%
SC 87.5% 100.0% 447 1.7%
TN 72.8% 98.9% 464 1.8%
UT 65.1% 98.0% 401 1.6%
VA 63.1% 99.8% 810 3.2%
VT 79.8% 97.0% 331 1.3%
WI 64.8% 97.4% 987 3.8%
WY 66.2% 98.2% 333 1.3%
Total 72.4% 99.4% 25,671 100.0%

Data Analysis | 14
III. Data Analysis

Data Analysis | 15
Data Management and Analysis
HSRI coordinates the NCI data management and analysis. All states enter data into the
Online Data Entry Survey Application (ODESA) system; HSRI staff subsequently download
the data into an SPSS data file. This data file is then “cleaned” (reviewed for completeness
and compliance with standard NCI formats) and invalid responses are eliminated. Files
from individual states are then merged into a single SPSS file. The merged file from 2017-
18 was used for all analyses in this report.
Below is a summary of the statistical procedures used to analyze the In-person Survey data.
Weighting
Statistically, the term “average” refers to a calculated central or middle value of a set of
numbers. In NCI reports, we use “NCI average” to demonstrate the typical performance of
all the states that conducted the survey. Prior to the 2016-17 survey cycle, the NCI average
was calculated as the simple arithmetic mean of all state means (an approach known as
“average of averages”). Last year, the approach was enhanced to consider the relative
numbers of people receiving services through participating states’ systems. The NCI
averages contained in this report are “weighted” means; their calculations reflect the
relative population sizes of participating states, as well as the sample sizes.
Applying statistical weights allows a state that provides services to a larger number of
people (but is represented in the data by a sample of the same size as other states) to have
a higher influence on the overall NCI average—that is, the state’s contribution to the NCI
average is proportional to its service population. The weights used in calculations for this
report were developed using each participating state’s number of survey respondents and
its total survey-eligible population.
When a state’s sampling strategy is to identify and interview survey participants using
simple random sampling or proportional stratified random sampling, each completed
survey in the state gets assigned the same weight. In some cases, when a state’s sampling
strategy departs markedly from simple random or proportional, it may be necessary for
completed surveys in the state to be assigned different weights based on which sampling
strata they correspond to. For example, if a state intentionally oversampled one or more of
its sub-populations or geographical regions to be disproportionately represented in the
survey sample, it may be necessary to develop and apply different weights for surveys

Data Analysis | 16
completed in those sub-populations or regions. The procedure for calculating weights is
similar but uses the number of completed surveys and service population sizes in each
stratum (i.e., sub-population or region) separately. WI and CA are weighted in this way
in 2017-18.
Significance Testing
For each of the non-adjusted items in this report, each state’s percentage was compared to
the weighted NCI Average (described above), and the differences between the two were
tested for both statistical significance as well as effect sizes. Effect sizes are used in
addition to statistical significance because statistical significance of a state’s result depends,
in part, on the size of the state’s sample: the larger the sample, the more likely it is that
even a small difference will be found statistically significant. A statistically significant
difference for a state with a large sample size, in and by itself, does not necessarily mean
there is a practically significant difference. The inclusion of effect sizes as a new criterion
allows us to present “meaningfully significant” results, which take into consideration the
magnitude or size of the differences.
The state percentages in this report are categorized into one of the three classes:
1. Significantly above the NCI average, where the difference between the state’s
percentage and the weighted NCI average a) was in favor of the state, b) was
statistically significant (i.e., p <.01), and c) met the effect size criterion (i.e.,
Cohen’s d > 0.2, see below for details);
2. Within the NCI average range, where the difference between the state’s
percentage and the weighted NCI average was a) not statistically significant (i.e.,
p ≥.01), or b) did not meet the effect size criterion (i.e., Cohen’s d ≤ 0.2);
3. Significantly below the NCI average, where the difference between the state’s
percentage and the weighted NCI average a) was in favor of the NCI average, b)
was statistically significant (i.e., p <.01), and c) met the effect size criterion
(i.e., Cohen’s d > 0.2);
For all unadjusted outcome data, tables are formatted so that all states are listed in
descending order of percentage and are categorized as statistically significantly above the
NCI Average, within the range of the NCI Average, and significantly below the NCI Average.
No symbol was used for the state’s percentage being “within” the NCI average range due to
lack of statistical significance (i.e., p ≥.01).
Data Analysis | 17
Technical Details
The comparisons were done through one sample T-tests using the weighted NCI average as
the benchmark. A conservative cut-off point (alpha) of p < .01 was used to detect
statistically significant differences. Effect sizes are calculated using the formula: Cohen's d= 2𝑡
√𝑑𝑓 . A cutoff point of Cohen’s d= 0.2 was chosen for the effect size to be considered
“meaningfully significant,” following the standard interpretation offered by Cohen (1988)
that Cohen’s d of 0.8 = large, 0.5= moderate, and 0.2= at least a small effect.
Outcome Adjustment
Outcome adjustment or “risk adjustment” is a statistical process used to control for
differences in the individual characteristics of people who completed the NCI Survey across
states. This procedure allows for more legitimate state comparisons by effectively “leveling
the playing field.” This analysis helps account for the fact that states have different
eligibility definitions for services and may have samples with different characteristics. Only
those indicators that are likely to be affected by individual characteristics were adjusted
(e.g., indicators in the Choice sub-domains). For example, a person who has limited
mobility and is older may be less likely to choose where they live. On the other hand, such
characteristics should not affect whether a person has friends or staff who are respectful.
The indicators are risk-adjusted using the following characteristics: age, level of intellectual
disability, level of mobility, and whether any behavioral supports are needed to prevent
self-injury, disruptive, or destructive behavior. Risk adjustment was only done on Choice
items for this report. In prior years, Community Inclusion items were also risk adjusted;
however, due to the change in reporting structure, those items are no longer risk adjusted.
Beginning in 2014-15, primary means of expression, health, and mental illness/psychiatric
diagnosis were not used as risk-adjustors since they were not significant predictors of
outcomes in the survey questions. In this report, results for indicators that were adjusted
are labeled as such, and unadjusted results for these indicators are presented in Appendix
D.
Outcome adjustment was performed using logistic regression for the choice indicators and
linear regression for the choice indicators. This statistical analysis produces a predicted
value that one would expect to observe given the individual’s characteristics. The state’s
average observed rate (i.e., the state average prior to risk-adjustment) was adjusted by the
average predicted rate to produce the risk-adjusted rate. As a result of this procedure, state
Data Analysis | 18
differences in adjusted values reflect true state differences rather than differences due to
the demographic or characteristic makeup of state service populations.
Scale Development
Scales are used to combine responses from multiple similar questions into one variable. In
this way we can measure an overarching concept rather than specific elements of the
concept. For the Adult Consumer Survey, scales are used for the Choice and Decision-
Making sub-domain. To create a scale, statistical tests are required to ensure that the
multiple items share common properties. Scales were created using factor analysis.
The Choice and Decision-Making sub-domain was divided into two scales: Life Decisions
and Everyday Choices; additionally, one Community Inclusion scale was produced by
adding four of the items. Scales were created by averaging the items within each category.4
Higher scale scores represent higher levels of choice. The scales were also risk-adjusted.
Each scale’s reliability was assessed using Cronbach’s alpha. The scales had an adequate
level of internal consistency and reliability.
Collapsing Data
For many of the indicators in this report, only “yes” responses are analyzed and reported
for state to state comparisons and significance testing. However, there are several
indicators for which the “yes” response was collapsed with the middle response (for
example, a “sometimes” response, or a “some input” response) to form the “yes” indicator
category which was then analyzed and subsequently reported. For example, for choice
indicators, responses “person chose” and “person had some input” were collapsed into one
“yes, person chose” category. For those indicators, the two responses were considered to
be equally indicative of a positive outcome. Appendix B contains the collapsing and
recoding rules for all indicators and risk-adjustment variables.
4 Indicators used for scales are listed in the corresponding sections.

Appendices | 19
IV. Appendices
• A: Survey changes from 2016-17 to 2017-18
• B: Recoding instructions
• C: Sampling procedures
• D: Unadjusted and un-collapsed data

Appendices | 20
Appendix A
Survey changes from 2016-17 to 2017-18 Table A1. Survey Changes 2016-17 to 2017-18: Pre-Survey and Background Information
Question Change
Name of Survey tool: ADULT CONSUMER SURVEY ADULT IN-PERSON SURVEY
SC-1 to SC 4 Added page at beginning of survey collecting “meta data”
SC-2 Face-to-face Scheduling Status :
If the face-to-face survey was not scheduled, please enter the reason why:
o Contact information is incorrect o Contact information is correct, but the person could not be reached o Refused by individual receiving supports o Refused by guardian and/or parent o Deceased o Other reason survey could not be scheduled:
Added question about survey status to track unscheduled surveys.

Appendices | 21
Question Change
I-6 If this person has a legal/court-appointed guardian, what is the guardian’s relationship to the individual?
o 98. Not Applicable o Family o Friend o Employee of state or guardianship agency o Financial institution (e.g., bank) o Non-profit guardianship agency o For-profit guardianship agency o Other o 99. Don’t know
Added response options
BI-28 Has this person received screening for colorectal cancer?
o 98. Not applicable – individual is under age 50 or over age 75 o Colonoscopy within the past 10 year o 2.Flexible sigmoidoscopy within the past 5 years o Testing for colorectal cancer with stool sample, using a Fecal
Occult Blood Test (FOBT) or Fecal Immunochemical Test (FIT) in the past year
o Has never had screening for colorectal cancer or screening was more than 10 years ago
o 99. Don't know
Question and response options changed
Appendices | 22
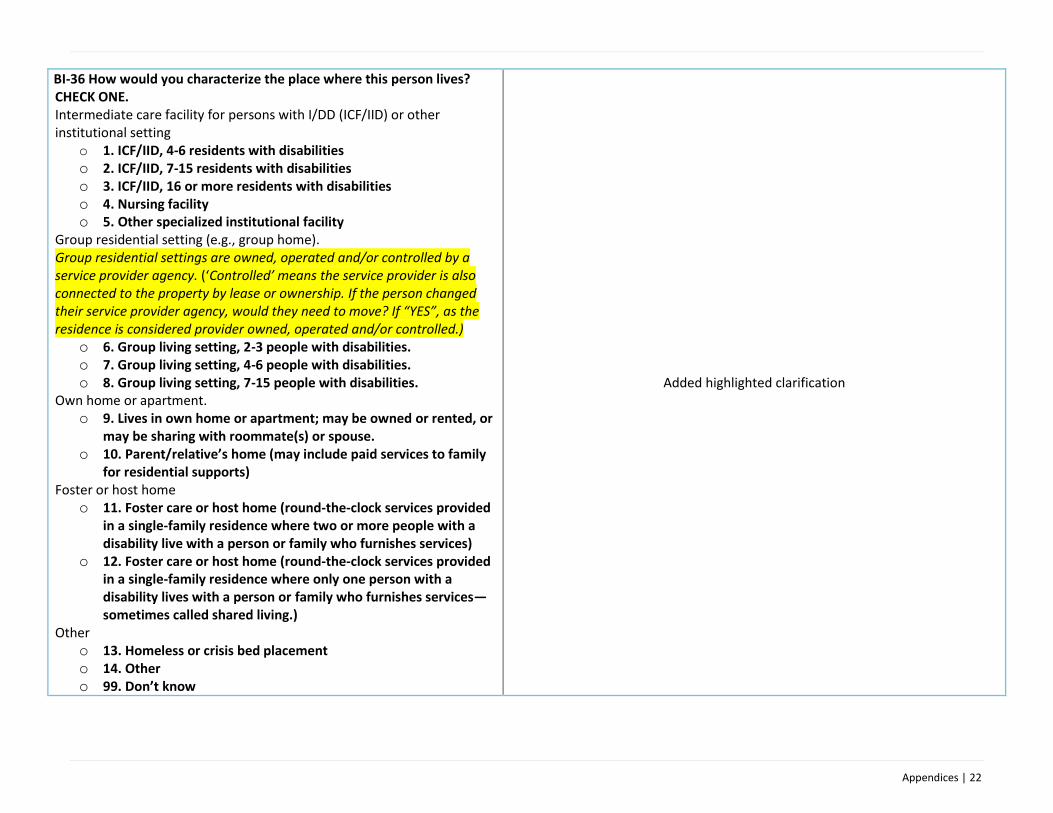
BI-36 How would you characterize the place where this person lives? CHECK ONE. Intermediate care facility for persons with I/DD (ICF/IID) or other institutional setting
o 1. ICF/IID, 4-6 residents with disabilities o 2. ICF/IID, 7-15 residents with disabilities o 3. ICF/IID, 16 or more residents with disabilities o 4. Nursing facility o 5. Other specialized institutional facility
Group residential setting (e.g., group home). Group residential settings are owned, operated and/or controlled by a service provider agency. (‘Controlled’ means the service provider is also connected to the property by lease or ownership. If the person changed their service provider agency, would they need to move? If “YES”, as the residence is considered provider owned, operated and/or controlled.)
o 6. Group living setting, 2-3 people with disabilities. o 7. Group living setting, 4-6 people with disabilities. o 8. Group living setting, 7-15 people with disabilities.
Own home or apartment. o 9. Lives in own home or apartment; may be owned or rented, or
may be sharing with roommate(s) or spouse. o 10. Parent/relative’s home (may include paid services to family
for residential supports) Foster or host home
o 11. Foster care or host home (round-the-clock services provided in a single-family residence where two or more people with a disability live with a person or family who furnishes services)
o 12. Foster care or host home (round-the-clock services provided in a single-family residence where only one person with a disability lives with a person or family who furnishes services—sometimes called shared living.)
Other o 13. Homeless or crisis bed placement o 14. Other o 99. Don’t know
Added highlighted clarification

Appendices | 23
Table A2. Survey Changes 2016-17 to 2017-18: Employment
Question Change
Employment matrix:BI-43-48 b) option
Now clarifies that NCI is asking about the number of hours spent doing
job/activity
Employment matrix:BI-43-48 c) option
Now asks about HOURLY wages (instead of biweekly). Except for Paid work in a
facility based setting (BI-47) which still asks about total wages (to account for
piece-work)
BI-46 Paid work in a community business that primarily hires people with disabilities. In this job, the employees with disabilities interact with the non-disabled population; this job is NOT in a traditional sheltered workshop and is NOT an enclave. Some examples include bakeries, carwashes, thrift stores, etc.
New category
BI-47 Paid work performed in a facility-based setting
(e.g., traditional sheltered workshop or work activity center; the location has been developed specifically to provide work activity exclusively for people with disabilities and people may be paid sub-minimum wage. )
Description clarified
Table A3. Survey Changes 2016-17 to 2017-18: Funding
Question Change
BI-56 What is the funding source for supports for this person? (Please obtain this information from a state data system or official record if possible.)
o 1. ICF/IID (Intermediate Care Facility for individuals with intellectual disabilities) Funded
o 2. Medicaid HCBS Waiver-Funded Services o 3. Medicaid State Plan Funded Services
Now a “check all that apply” Response option 4 has been clarified
Appendices | 24
o 4. Exclusively supported by State Funds (no Medicaid services beyond health care)
o 99. Don’t know
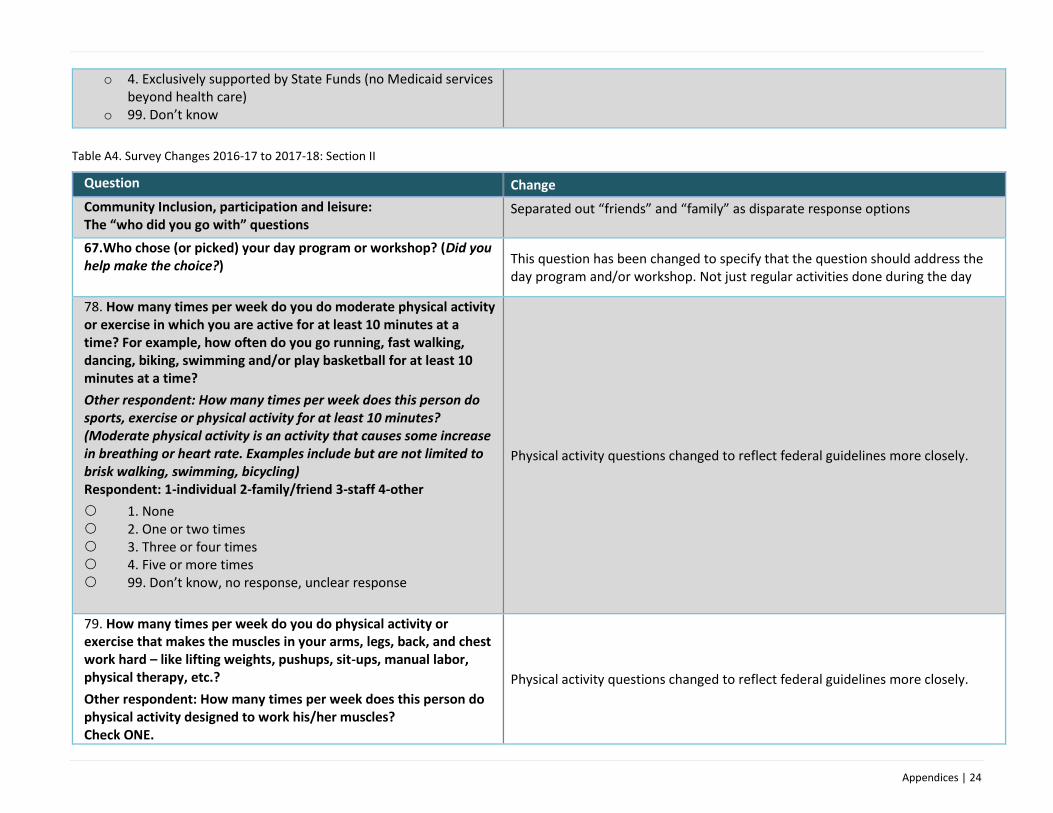
Table A4. Survey Changes 2016-17 to 2017-18: Section II
Question Change
Community Inclusion, participation and leisure: The “who did you go with” questions
Separated out “friends” and “family” as disparate response options
67.Who chose (or picked) your day program or workshop? (Did you help make the choice?)
This question has been changed to specify that the question should address the day program and/or workshop. Not just regular activities done during the day
78. How many times per week do you do moderate physical activity or exercise in which you are active for at least 10 minutes at a time? For example, how often do you go running, fast walking, dancing, biking, swimming and/or play basketball for at least 10 minutes at a time?
Other respondent: How many times per week does this person do sports, exercise or physical activity for at least 10 minutes? (Moderate physical activity is an activity that causes some increase in breathing or heart rate. Examples include but are not limited to brisk walking, swimming, bicycling) Respondent: 1-individual 2-family/friend 3-staff 4-other
1. None 2. One or two times 3. Three or four times 4. Five or more times 99. Don’t know, no response, unclear response
Physical activity questions changed to reflect federal guidelines more closely.
79. How many times per week do you do physical activity or exercise that makes the muscles in your arms, legs, back, and chest work hard – like lifting weights, pushups, sit-ups, manual labor, physical therapy, etc.?
Other respondent: How many times per week does this person do physical activity designed to work his/her muscles? Check ONE.
Physical activity questions changed to reflect federal guidelines more closely.

Appendices | 25
Respondent: 1-individual 2-family/friend 3-staff 4-other
1. None 2. One or two times 3. Three or four times 4. Five or more times 99. Don’t know, no response, unclear response
Self-Directed Supports module:
Changed questions 83-88 so that they’re asked of the person OR THE PROXY. We are attempting to assess the self-direction experience, about which a proxy may be able to provide personal insight.

Appendices | 26
Appendix B
Rules for Recoding and Combining Variables to Compute Core Indicators
Please note, an expanded guide for variable reporting (including information on how data are filtered) is
available upon request through HSRI. Please email Dorothy at [email protected] for more info.

Appendices | 27
Table B1. Background Information Variables
Demographics
Table label in body of report Variable name used in calculation
How it’s filtered in the body of the report
Tested for significance?
Urban/Rural METROCAT ‘Don’t Know’ shown No
Age (Variable used for risk adjustment)
AGE Survey asks for month and year of birth. Age calculated.
No
Age Category Age_categ Categorical variable created for the following categories:
• 18 thru 22
• 23 thru 34
• 35 thru 54
• 55 thru 74
• 75 and above.
• Unknown
No
Gender GENDER In 16-17 added “other” response option
No
Marital Status MARSTAT ‘Don’t Know’ shown No
Person is a parent PARENT15_1 PARENT15_2 PARENT15_3 PARENT15_99
‘Don’t Know’ shown No
Race
RACE Categorical variable created using variables: RACE15_AMERIN RACE15_ASIAN RACE15_BLACK RACE15_HAWAII RACE15_WHITE RACE15_LATINO RACE15_OTHER RACE15_DK “Two or more races” variable created by identifying the cases that have at least two races reported
‘Don’t Know’ shown No
Type of Residence TYPEHOME16 ‘Don’t Know’ shown No
Length of residence RESIDLEN17 ‘Don’t Know’ shown No
Person’s residence owned or controlled by provider agency
CONTPROV16 ‘Don’t Know’ shown No
Person named on lease LEASE16 ‘Don’t Know’ shown No
Person owns his or her own home
OWNHOME15 ‘Don’t Know’ shown No
Diagnosis of ID DIAGMR ‘Don’t Know’ shown No
Level of ID (Variable used for risk adjustment)
LEVELMR08 Unknown and unspecified shown; filtered for those with a diagnosis of ID (DIAGMR=2)
No

Appendices | 28
Table label in body of report Variable name used in calculation
How it’s filtered in the body of the report
Tested for significance?
Other Disabilities DXMIPDMD13 DXMIPDAD13 DXMIPDBC13 DXMIPDPD13 DXMIPDOTH13 DXAUTISM0813 DXCP13 DXBI13 DXNEURO13 DXCHEMDP13 DXDOWN0813 PRWISYND13 DXFETALALCH15 DXVISION15 DXHEARING15 DXNONE13
‘Don’t Know’ included in denominators
No
Health variables HCCARVAS HCDIAB HCCANCER HCHIBP HCHICHL HCDYSPH15 HCPRESULC HCALZHEIM15 HCORALDENTAL16 HCSLEEPAPNEA16 HCOTHER
‘Don’t Know’ included in denominators
No
Preferred Means of Expression EXPRESS15 ‘Don’t Know’ shown No
Language LANGUAGE No
Mobility (Variable used for risk adjustment)
MOBILITY08 ‘Don’t Know’ shown No
Support to Manage Self Injurious Behavior (Variable used for risk adjustment)
SELFINJ08 ‘Don’t Know’ shown No
Support to Manage Disruptive Behavior (Variable used for risk adjustment)
DISBEH08 ‘Don’t Know’ shown No
Support to Manage Destructive Behavior (Variable used for risk adjustment)
UNCPBEH08 ‘Don’t Know’ shown No
Guardianship LGLSTAT15 ‘Don’t Know’ shown No
Relationship of guardian GUARDRELAT17 ‘Don’t Know’ shown No

Appendices | 29
Table B2. Outcome Variables -- Rules for Analysis
Sub-domain: Choice and Decision-making
Table label in body of report Variable name used in calculation
How it’s filtered in the body of the report
Tested for significance?
Proportion of people who reported they chose or had some input in choosing where they live if not living in the family home (Adjusted Variable)
CHOSHOME2 Recoded variable in which response options are: 0 no 1 had at least some input
Filtered for Section II (INVL_CR2_15=0) and for residence type (typehome16 not equal to 5 (parent or relative’s home) Risk adjusted
No
Proportion of people who reported they chose or had some input in choosing their roommates if not living in the family home (Adjusted Variable)
HOUSEMATES2 Recoded variable in which response options are: 0 no 1 had at least some input
Filtered for Section II (INVL_CR2_15=0) and for residence type (typehome16 not equal to 5 (parent or relative’s home) Risk adjusted
No
Proportion of people reported to have a job in the community and who reported they chose or had some input in choosing their job* (Adjusted Variable) * reported for those who were determined to have a paid community job from Background section
CHOSJOB2 Recoded variable in which response options are: 0 no 1 had at least some input
Filtered for Section II (INVL_CR2_15=0) and for PAIDCOMMJOB_y =1 Risk adjusted
No
Proportion of people who reported they have a day program or activity and chose or had some input in choosing their day program or activity (Adjusted Variable)
CHOOSDAY2 Recoded variable in which response options are: 0 no 1 had at least some input
Filtered for Section II (INVL_CR2_15=0) Risk adjusted
No
Proportion of people who reported they choose or help decide their daily schedule (Adjusted Variable)
SCHEDULE2 Recoded variable in which response options are: 0 no 1 had at least some input
Filtered for Section II (INVL_CR2_15=0) Risk adjusted
No
Proportion of people who reported they choose or help decide how to spend free time (Adjusted Variable)
FREETIME2 Recoded variable in which response options are: 0 no 1 had at least some input
Filtered for Section II (INVL_CR2_15=0) Risk adjusted
No
Proportion of people who reported they chose or help decide what to buy with their spending money (Adjusted Variable)
CHOOSBUY2 Recoded variable in which response options are: 0 no 1 had at least some input
Filtered for Section II (INVL_CR2_15=0) Risk adjusted
No
Proportion of people who reported they can change their case manager/service coordinator
CHANGECM2 Recoded variable in which response options are: 0 no 1 had at least some input
Filtered for Section II (INVL_CR2_15=0)
Yes
Proportion of people who reported they chose or were aware they could request to change their staff
CHOOSSTAF2 Recoded variable in which response options are: 0=no 1 chose staff or were aware they could request to change staff
Filtered for Section II (INVL_CR2_15=0) Risk adjusted
Yes

Appendices | 30
Sub-domain: Work
Table label in body of report Variable name used in calculation How it’s filtered in the body of the report
Tested for significance?
Proportion of people who were reported to have a job in the community* * reported for those who were determined to have a paid community job from Background section
PAIDCOMMJOB_y Variable created indicating those who have at least one of the following marked “yes”
1) PAIDCOMMJOBIND15 2) PAIDCOMMJOBGRP15 3) PAIDCOMMBIZ
Creates and makes DK missing
Yes
Proportion of people who were reported to have a job in the community by type of employment support* * reported for those who were determined to have a paid community job from Background section
commwork_type_Individual commwork_type_Group Variables created to identify types of paid jobs in the community and whether public support is received for that job. Variables created using 1) PAIDCOMMJOBIND15 and PCJISERV15 2) PAIDCOMMJOBGRP15 3) PAIDCOMMBIZ
Filtered for PAIDCOMMJOB_y =1
No
Average number of bi-weekly hours by type of community employment support
Filter separately for commwork_type_Individual=1 commwork_type_Individual=2 and commwork_type_Group=1 and PAIDCOMMBIZ=2 Then compare means with the variable PCJIHOURS15 or PCJGHOURS15 (for commwork_type_group=1)
Filtered for PAIDCOMMJOB_y =1
No
Average hourly wages by type of community employment support
Filter separately for commwork_type_Individual=1, commwork_type_Individual=2 and commwork_type_Group=1 and PAIDCOMMBIZ=2 Then compare means with the variable PCJIWAGES17 or PCJGWAGES17 (for commwork_type_group=1) and PCBIZWAGE (for Paidcommbiz=2)
Filtered for PAIDCOMMJOB_y =1
No
Average length of employment in current job for people who were reported to have a job in the community
Calculated variable using JOBYRS and JOBMOS to equal total months
No
Proportion of people who were reported to have a job in the community and received paid timeoff
PDTIMEOFF2 Recoded variable in which response options are: 0 'no' 1 'receives paid time off.
Filtered for PAIDCOMMJOB_y =1
Yes
Proportion of people who were reported to have a job in the community in the four most common types of employment
JOBTYPE Filtered for PAIDCOMMJOB_y =1
No

Appendices | 31
Table label in body of report Variable name used in calculation How it’s filtered in the body of the report
Tested for significance?
Proportion of people who were reported not to have a job in the community and who reported they would like a job in the community* (“yes” responses only) *reported for those who were determined to not have a community job from Background section
LIKEAJOB2 Recoded variable in which response options are: 0 no, in-between 1 yes.
Filtered for Filtered for PAIDCOMMJOB_y =0 and Section I valid (INVL_CR1_15=0)
Yes
Proportion of people who were reported to have community employment as a goal in their service plan
IEGOAL2 Recoded variable in which response options are: 0 'no' 1 'integrated employment in service plan'.
Yes
Proportion of people who report taking classes or training to help get a job, or get a better job
TRAINING2 Recoded variable in which response options are: 0 'no' 1 ‘yes'.
Filtered for Section I (INVL_CR1_15=0)
Yes
Proportion of people who reported going to a day program or regular activity
HAVEDAYACT2 Recoded variable in which response options are: 0 'no' 1 ‘yes'.
Filtered for Section I (INVL_CR1_15=0)
Yes
Proportion of people who reported doing volunteer work
VOLUNT2 Recoded variable in which response options are: 0 'no' 1 ‘yes'.
Filtered for Section I (INVL_CR1_15=0)
Yes
Sub-domain: Self Determination
Table label in body of report Variable name used in calculation
How it’s filtered in the body of the report
Tested for significance?
Proportion of people who were reported to be using a self-directed supports option
SELFDRCT2 Recoded variable in which response options are: 0 'no' 1 ‘yes'.
Yes
Proportion of people self-directing who reported they make decisions about how budget for services is used
BUDGDEC2 Recoded variable in which response options are: 0 no 1 yes.
Filtered for Section 2 (INVL_CR2_15=0)and SELFDRCT2=1
Yes
Proportion of people self-directing who reported participates in decisions about using budget, hiring staff or managing services (“yes” responses only)
PARTDEC16
Filtered for Section 2 (INVL_CR2_15=0) and SELFDRCT2=1
No
Proportion of people self-directing who reported they hire and manage their staff
HIRESTAFF2 Recoded variable in which response options are: 1 Yes 0 No, maybe
Filtered for Section 2 (INVL_CR2_15=0) and SELFDRCT2=1
Yes

Appendices | 32
Proportion of people self-directing who reported they have enough help deciding how to use their budget/services
ENUFHELP2 Recoded variable in which response options are: 1 Yes, have enough help 0 No, want more help or maybe, not sure.
Filtered for Section 2 (INVL_CR2_15=0) and SELFDRCT2=1
Yes
Proportion of people self-directing who reported they receive information about money that’s left in budget
ENUFINFO2 Recoded variable in which response options are: 1 Yes 0 No, maybe, not sure.
Filtered for Section 2 (INVL_CR2_15=0) and SELFDRCT2=1
Yes
Proportion of people self-directing who report they get enough information about their budget/services and information is easy to understand
INFOUNDERST2 Recoded variable in which response options are: 1 Yes 0 No, maybe, not sure.
Filtered for Section 2 (INVL_CR2_15=0) and SELFDRCT2=1 and ENUFINFO15=2 or ENUFINFO15=3
Yes
Sub-domain: Community Inclusion, Participation and Leisure
Table label in body of report
Variable name used in calculation
How it’s filtered in the body of the report
Tested for significance?
Proportion of people who report being able to go out and do the things they like to do (yes responses only)
GOOUT2 Recoded variable in which response options are: 0 No, in-between 1 yes.
Filtered for Section I (INVL_CR1_15=0)
Yes
Proportion of people who report being able to go out and do the things they like to do enough (yes responses only)
GOOUTENOUGH2 Recoded variable in which response options are: 0 No 1 Yes.
Filtered for Section I (INVL_CR1_15=0)
Yes
Proportion of people who report that they have enough things to do at home (yes only)
HOMETODO2 Recoded variable in which response options are: 0 Not enough, in the middle 1 Yes
Filtered for Section I (INVL_CR1_15=0)
Yes
Proportion of people who reported going shopping at least once in the past month
SHOPPING15_2 Recoded variable in which response options are: 0 no, 0 times 1 at least once in past month.
Filtered for Section II (INVL_CR2_15=0)
Yes
Proportion of people who reported going errands at least once in the past month
ERRANDS15_2 Recoded variable in which response options are: 0 no, 0 times 1 at least once in past month.
Filtered for Section II (INVL_CR2_15=0)
Yes
Proportion of people who reported going entertainment at least once in the past month
ENTERTAN15_2 Recoded variable in which response options are: 0 no, 0 times 1 at least once in past month.
Filtered for Section II (INVL_CR2_15=0)
Yes
Proportion of people who reported going out to eat at least once in the past month
EATOUT15_2 Recoded variable in which response options are: 0 no, 0 times 1 at least once in past month.
Filtered for Section II (INVL_CR2_15=0)
Yes
Proportion of people who reported going to religious services or spiritual practice at least once in the past month
RELIGION15_2 Recoded variable in which response options are: 0 no, 0 times 1 at least once in past month.
Filtered for Section II (INVL_CR2_15=0)
Yes

Appendices | 33
Proportion of people who reported participating in community groups (yes response only)
Commact2 Recoded variable in which response options are: 0 no 1 yes
Filtered for Section II (INVL_CR2_15=0)
Yes
Proportion of people who reported having gone on vacation in the past year (yes only)
VACATION2 Recoded variable in which response options are: 0 no 1 yes
Filtered for Section II (INVL_CR2_15=0)
Yes
Sub-domain: Relationships
Table label in body of report
Variable name used in calculation
How it’s filtered in the body of the report
Tested for significance?
Proportion of people who reported they have friends who are not staff or family members (“yes, not staff or family” only)
HASFRNDS2 Recoded variable in which response options are: 0 no, only staff or family 1 yes, not staff or family.
Filtered for Section I (INVL_CR1_15=0)
Yes
Proportion of people who reported they have a best friend (may be staff or family)
BESTFRIEND2 Recoded variable in which response options are: 0 No, does not have a best friend 1 Yes, has a best friend.
Filtered for Section I (INVL_CR1_15=0)
Yes
Proportion of people who reported they have family they see and the support needed to see their family when they want to (“yes” responses only)
SEEFAMLY2 Recoded variable in which response options are: 0 no, sometimes 1 yes, whenever wants to, or chooses not to see family.
Filtered for Section I (INVL_CR1_15=0) and only analyzed for people not living with parent/family
Yes
Proportion of people who reported they have friends (may be staff or family) and the support needed to see their friends when they want to (“yes” responses only)
SEEFRNDS2 Recoded variable in which response options are: 0 No, often unable to see friends, Sometimes cannot see friends when wants 1 Yes.
Filtered for Section I (INVL_CR1_15=0)
Yes
Proportion of people who want more help to keep in contact with friends
FRNDSHELP2 Recoded variable in which response options are: 0 No, 1 Yes, maybe.
Filtered for Section I (INVL_CR1_15=0)
Yes
Reasons why can’t see friends WHYSEEFRNDS15 Filtered for Section I (INVL_CR1_15=0) and SEEFRNDS2=0
No
Proportion of people who reported they had other ways of communicating with friends (‘yes, but not often’ and ‘yes, often’ responses)
FRNDSCOMM2 Recoded variable in which response options are: 0 No, Sometimes 1 Yes
Filtered for Section I (INVL_CR1_15=0)
Yes
Proportion of people who reported they can go on a date if they want to or can date with some restriction (“yes, can date” responses)
CANDATE2 Recoded variable in which response options are: 0 No, Yes but with restrictions 1 Yes or is married living with partner
Filtered for Section I (INVL_CR1_15=0)
Yes
Proportion of people who reported they feel lonely at least half the time** (“often” responses)
LONELY2_15 Recoded variable in which response options are: 0 no, not often, or sometimes 1 yes, often.
Filtered for Section I (INVL_CR1_15=0)
Yes

Appendices | 34
Sub-domain: Satisfaction
Table label in body of report
Variable name used in calculation
How it’s filtered in the body of the report
Tested for significance?
Proportion of people who reported they like their home (“yes” responses only)
LIKEHOME2 Recoded variable in which response options are: 0 no, in-between 1 yes.
Filtered for Section I (INVL_CR1_15=0)
Yes
Proportion of people who report disliking where they live for reasons indicated.
DONTLIKE15_1 DONTLIKE15_2 DONTLIKE15_3 DONTLIKE15_4 DONTLIKE15_5 DONTLIKE15_6 DONTLIKE15_7 DONTLIKE15_10 DONTLIKE15_11 DONTLIKE15_OTHER DONTLIKE15_99
Filtered for Section I (INVL_CR1_15=0)
No
Proportion of people who reported they would like to live somewhere else (“yes” responses only)
HOMEELSE2 Recoded variable in which response options are: 0 no, in-between 1 yes.
Filtered for Section I (INVL_CR1_15=0)
Yes
Proportion of people who were reported to have a job in the community and who reported they like where they work (“yes” responses only)* * reported for those who were determined to have a paid community job from Background section
LIKEJOB2 Recoded variable in which response options are: 0 no, in-between 1 yes.
Filtered for Section I (INVL_CR1_15=0) and for PAIDCOMMJOB_y =1
Yes
Proportion of people who were reported to have a job in the community and who reported they want to work somewhere else*(“yes” responses only) * reported for those who were determined to have a paid community job from Background section
JOBELSE2 Recoded variable in which response options are: 0 no, in-between 1 yes.
Filtered for Section I (INVL_CR1_15=0) and for PAIDCOMMJOB_y =1
Yes
Proportion of people who reported that they want to go to their day program less (“less” responses only)
LESSDAYACT16 Filtered for Section I (INVL_CR1_15=0) and havedayact2=1
Proportion of people who reported that services and supports were helping them live a good life (“yes” responses only)
GOODLIFE2 Recoded variable in which response options are: 0 No, in between 1 Yes.
Filtered for Section I (INVL_CR1_15=0)
Yes

Appendices | 35
Sub-domain: Service Coordination
Table label in body of report Variable name used in calculation
How it’s filtered in the body of the report
Tested for significance?
Proportion of people who reported they met their service coordinator/case manager (“yes” responses only)
KNOWSCM2 Recoded variable in which response options are: 0 maybe, no 1 yes.
Filtered for Section I (INVL_CR1_15=0)
Yes
Proportion of people who reported their service coordinator/case manager asks them what they want (“yes” responses only)
ASKIMPOR2 Recoded variable in which response options are: 0 sometimes, no 1 yes.
Filtered for Section I (INVL_CR1_15=0)
Yes
Proportion of people who reported their service coordinator/case manager gets them back right away (”yes” responses only)
GETSBACK2 Recoded variable in which response options are: 0 No, sometimes 1 Yes.
Filtered for Section I (INVL_CR1_15=0)
Yes
Proportion of people who reported taking part in the last service planning meeting (“yes” responses only)
MSPLAN2 Recoded variable in which response options are: 0 No 1 Yes, or had option but chose not to.
Filtered for Section I (INVL_CR1_15=0)
Yes
Proportion of people who reported that they understood what was discussed in last service planning meeting (“yes” responses only)
PLANUNDRSTND2 Recoded variable in which response options are: 0 No, in-between 1 Yes.
Filtered for Section I (INVL_CR1_15=0)
Yes
Proportion of people who reported that service planning meeting included people the person wanted to be there (“yes” responses only)
PEOPLEWANT2 Recoded variable in which response options are: 0 No, in-between 1 Yes.
Filtered for Section I (INVL_CR1_15=0)
Yes
Proportion of people who reported that they were able to choose the services that were received as part of service plan (“yes” responses only)
PLANCHOOSE2 Recoded variable in which response options are: 0 No, had some input 1 Yes
Filtered for Section I (INVL_CR1_15=0)
Yes
Proportion of people who reported support workers come and leave when they are supposed to (“yes” responses only)
SWORKCOME2 Recoded variable in which response options are: 0 No, maybe not sure 1 Yes.
Filtered for Section I (INVL_CR1_15=0)
Yes
Proportion of people who reported they always they have a way to get places when they need to go somewhere (“yes” responses only)
TRANSPORT2 Recoded variable in which response options are: 0 No almost never, sometimes 1 Yes, almost always.
Filtered for Section I (INVL_CR1_15=0)
Yes
Proportion of people who reported they always they have a way to get places when they want to do something for fun (“yes” responses only)
GETPLACES2 Recoded variable in which response options are: 0 No almost never, sometimes 1 Yes, almost always.
Yes

Appendices | 36
Sub-domain: Access
Table label in body of report
Variable name used in calculation
How it’s filtered in the body of the report
Tested for significance?
Proportion of people who reported their staff have adequate training to meet their needs (“yes” responses only)
STFTRN2 Recoded variable in which response options are: 1 yes 0 no, maybe.
Filtered for Section II (INVL_CR2_15=0)
Yes
Proportion of people who report needing additional services
ADDSERVEDSCCM ADDSERVEDRESFAM ADDSERVEDTR ADDSERVEDJOBS13 ADDSERVEDDAY ADDSERVEDEDU ADDSERVEDHC ADDSERVEDDC13 ADDSERVEDHOUS ADDSERVEDRES ADDSERVEDSOC ADDSERVEDCOMM ADDSERVEDENV ADDSERVEDBENE ADDSERVEDOTH
Filtered for Section II (INVL_CR2_15=0)
No
Sub-domain: Health
Table label in body of report
Variable name used in calculation
How it’s filtered in the body of the report
Tested for significance?
Proportion of people who were reported to have a primary care doctor
PRIMDOC2_woDK Removes DK responses and Recoded variable in which response options are: 0 'doesnt have a primary doc' 1 'has a primary doc'.
Yes
Proportion of people who were reported to be in poor health (“poor health” response only)
Health_poor Recoded variable in which 0 ‘excellent or very good’ or ‘fairly good’ 1 poor
INVL_CR2_15=0 Yes
Proportion of people who were reported to have had a complete physical exam in the past year (“within the past year” responses)
physexam2 Recoded variable in which response options are: 0 'not in past year' 1 'in past year'.
Yes
Proportion of people who were reported to have had a dental exam in the past year (“within the past year” or “within the past six months” responses)
dentvis2 Recoded variable in which response options are: 0 'not in past year' 1 'in past year'.
Yes
Proportion of people who were reported to have had an eye exam in the past year (“within the past year” responses)
EYEEXAM2 Recoded variable in which response options are: 0 'not in past year' 1 'in past year'.
Yes
Proportion of people who were reported to have had a hearing test in the past five years (“within the past five years” responses)
HEARTEST2 Recoded variable in which response options are: 0 'not in the past 5 years'
Yes

Appendices | 37
1 'hearing test in the past 5 years'. Proportion of women over age 21 who were reported to have had a Pap test in the past three years (“within the past three years” or less responses)
PAPTEST2 Recoded variable in which response options are: 0 more than 3 years 1 in past 3 years.
Filtered for GENDER=2 and age>=21
Yes
Proportion of women over 40 who were reported to have had a mammogram test in the past two years (“within the past two years” or “within past year” responses)
MAMMO2 Recoded variable in which response options are: 1 'in last 2 years' 0 'more than 2 years'.
Filtered for GENDER=2 and AGE>=40
Yes
Proportion of people 50 or over who were reported to have had a colorectal cancer screening in the past year (“within the past year” responses)
CCSCREEN17_98 CCSCREEN17_1 CCSCREEN17_2 CCSCREEN17_3 CCSCREEN17_4 CCSCREEN17_99
Filtered for AGE>=50
Yes
Proportion of people who were reported to have had a flu vaccine in the past year (“within the past year “responses)
FLUVACC2 Recoded variable in which response options are: 0 'not in the past year' 1 'flu vaccine in the past year'.
Yes
Sub-domain: Wellness
Table label in body of report
Variable name used in calculation
How it’s filtered in the body of the report
Tested for significance?
Proportion of people who take at least one med for mood disorder, anxiety, psychotic disorder, behavioral challenges
Totmeds Recoded variable using MEDS15 and MEDBEHAV 0 'No meds' 1 'At least one kind'.
Yes
Proportion of people who were reported to take medication for at least one of the following: mood disorders, anxiety, psychotic disorders**
meds_mood Recoded variable in which response options are: 0 'No meds for mood, anxiety, psychotic' 1 'Takes meds for mood, anxiety, psychotic'.
Yes
Number of meds taken for at least one of the following: mood disorders, anxiety, psychotic disorders
NUMMEDS No
Proportion of people who were reported to take medication for behavior challenges
meds_behav Recoded variable in which response options are: 0 'No meds for behavior challenges' 1 'Takes meds for behavior challenges'.
Yes
Number of meds taken for behavior challenges
NUMBEMEDS No
Proportion of people who were reported to engage in regular physical activity at least sometimes
PHYSACT_1x Recoded variable in which response options are: 1 yes, at least one time per week 0 no.
Filtered for Section II (INVL_CR2_15=0)
Yes
Proportion of people in each BMI category
MUSCLEACT_1x Recoded variable in which response options are: 1 yes, at least one time per week 0 no.
Filtered for Section II (INVL_CR2_15=0)
Yes

Appendices | 38
Proportion of people in each BMI category
BMI_categ BMI variable created using formula: BMI=(Weight/(height in inches*height in inches))*703 Creates categories for BMI 1 'underweight' 2 'normal' 3 'overweight' 4 'obese'.
No
Proportion of people who were reported to chew or smoke tobacco
TOBACCO2 Recoded variable in which response options are: 0 'no' 1 'uses tobacco products'.
Yes
Proportion of people reported to have a behavior plan
BehPlan_yes Recoded variable in which response options are: 0 'No' 1 'Yes'.
Yes
Sub-domain: Rights and Respect
Table label in body of report
Variable name used in calculation
How it’s filtered in the body of the report
Tested for significance?
Proportion of people who reported people always knock before entering home (“yes” responses only)
ENTERHM2 Recoded variable in which response options are: 1 yes 0 sometimes, no.
Filtered for Section I (INVL_CR1_15=0)
Yes
Proportion of people who reported people always knock before entering bedroom (“yes” responses only)
ENTERBRM2 Recoded variable in which response options are: 1 yes 0 sometimes, no.
Filtered for Section I (INVL_CR1_15=0)
Yes
Proportion of people who reported they could be alone at home with visitors (“yes” responses only)
ALONEGST2 Recoded variable in which response options are: 1 yes 0 no.
Filtered for Section 1 (INVL_CR1_15=0)
Yes
Proportion of people who reported they have enough privacy at home
BEALONE2 Recoded variable in which response options are: 1 yes 0 no.
Filtered for Section I (INVL_CR1_15=0)
Yes
Proportion of people who reported people never read their mail without permission** (“no” responses only)
MAILOPEN2 Recoded variable in which response options are: 1 yes 0 no.
Filtered for Section 1 (INVL_CR1_15=0)
Yes
Proportion of people who reported they can use phone and internet without restriction (“yes without restriction” response only)
USEPHONE2 Recoded variable in which response options are: 1 yes 0 no.
Filtered for Section 1 (INVL_CR1_15=0)
Yes

Appendices | 39
Table label in body of report
Variable name used in calculation
How it’s filtered in the body of the report
Tested for significance?
Proportion of people who have a place to be alone (can have time to self) (yes responses only)
BEALONE2 Recoded variable in which response options are: 1 yes 0 no.
Filtered for Section 1 (INVL_CR1_15=0)
Yes
Proportion of people who reported their staff treat them with respect (“yes” responses only)
STAF2 Recoded variable in which response options are: 1 yes 0 no, sometimes, some staff.
Filtered for Section I (INVL_CR1_15=0)
Yes
Proportion of people who reported they have attended a self-advocacy event, or chose not to (“yes” and “chose not to” responses)
SELFADVO2 Recoded variable in which response options are: 0 no 1 had opportunity, yes.
Filtered for Section II (INVL_CR2_15=0)
Yes
Proportion of people who report having a key to their home (“yes” responses only)
KEY2 Recoded variable in which response options are: 1 Yes 0 No, maybe not sure.
Filtered for Section II (INVL_CR2_15=0)
Yes
Proportion of people who report they can lock their bedroom (“yes” responses only)
LOCK2 Recoded variable in which response options are: 1 Yes 0 No, maybe not sure.
Filtered for Section II (INVL_CR2_15=0)
Yes
Proportion of people who report having voted (“Yes” and “had opportunity” only)
VOTE2 Recoded variable in which response options are: 1 Yes or had opportunity to register to vote but chose not to 0 No.
Filtered for Section II (INVL_CR2_15=0)
Yes
Proportion of people who report that there are rules about having friends or visitors (“yes” responses only)
VISITRULES2 Recoded variable in which response options are: 0 No 1 Yes
Filtered for Section I (INVL_CR1_15=0)
Yes
Sub-domain: Safety
Table label in body of report
Variable name used in calculation
How it’s filtered in the body of the report
Tested for significance?
Proportion of people who report that there is at least one place where he/she feels afraid.
Afraid_yes Recoded variable in which response options are: 0 'No' 1 'Yes, either in home, day program, work, community, transport, or other'.
Filtered for Section I (INVL_CR1_15=0)
Yes
Proportion of people who reported they have someone to go to for help if they feel scared (“yes” responses only)
AFRAIDHELP2 Recoded variable in which response options are: 0 no, maybe 1 yes.
Filtered for Section I (INVL_CR1_15=0)
Yes
Appendices | 40
Appendix C
Sampling procedures
Please note, Table C2 includes detailed sample information regarding populations states excluded from
the sample.

Appendices | 41
Table C1. State sampling information
State Names of programs Funding Sources Adults only? Description of the population
Individual program population
Total NCI IPS 2017-18 sample number
AL ID and LAH waiver HCBS 1915(c) Supports approximately 100 people under 18 (not included in NCI sample)
Adults over 18 with ID 5,222
AZ HCBS Waiver 1115 Children are also included in the Waiver
Persons with IDD, EP, CP, Autism
14,783
AR Waiver HCBS 1915 (c) Yes
Adults over age 18 with ID/DD
4,000
CA 128,796
CO HCBS-DD 1915 (c) All adults age 18 and over, enrolled in HCBS-DD who receive at least one service other than case management.
3,247
6,658
HCBS-SLS 1915 (c) All adults age 18 and over, enrolled in HCBS-SLS who receive at least one service other than case management.
2,769
State-SLS State General Fund All adults age 18 and over, enrolled in State-SLS who receive at least one service other than case management.
642
CT Comprehensive Waiver 1915(c) Yes Adults 18 and over with ID/DD
5,220
11,124
Individual and Family Supports Waiver
1915(c) Yes Adults 18 and over with ID/DD
3,576
Employment and Day Supports Waiver
1915(c) Yes Adults 18 and over with ID/DD
1,087
ICF/ID Participants ICF/ID Yes Adults 18 and over with ID/DD
742
Non-Waivered State Funded Yes Individuals who are not enrolled in an HCBS waiver but are receiving at least one funded service in addition to Case Management
499
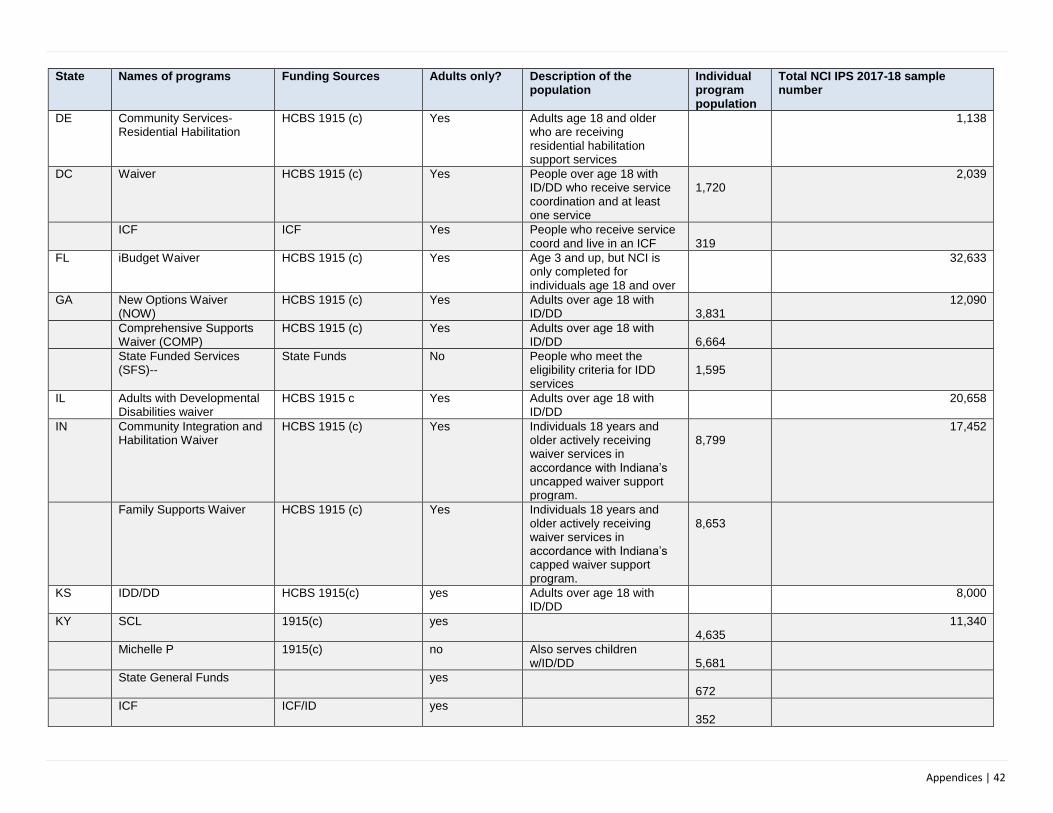
Appendices | 42
State Names of programs Funding Sources Adults only? Description of the population
Individual program population
Total NCI IPS 2017-18 sample number
DE Community Services-Residential Habilitation
HCBS 1915 (c) Yes Adults age 18 and older who are receiving residential habilitation support services
1,138
DC Waiver HCBS 1915 (c) Yes People over age 18 with ID/DD who receive service coordination and at least one service
1,720
2,039
ICF ICF Yes People who receive service coord and live in an ICF
319
FL iBudget Waiver HCBS 1915 (c) Yes Age 3 and up, but NCI is only completed for individuals age 18 and over
32,633
GA New Options Waiver (NOW)
HCBS 1915 (c) Yes Adults over age 18 with ID/DD
3,831
12,090
Comprehensive Supports Waiver (COMP)
HCBS 1915 (c) Yes Adults over age 18 with ID/DD
6,664
State Funded Services (SFS)--
State Funds No People who meet the eligibility criteria for IDD services
1,595
IL Adults with Developmental Disabilities waiver
HCBS 1915 c Yes Adults over age 18 with ID/DD
20,658
IN Community Integration and Habilitation Waiver
HCBS 1915 (c) Yes Individuals 18 years and older actively receiving waiver services in accordance with Indiana’s uncapped waiver support program.
8,799
17,452
Family Supports Waiver HCBS 1915 (c) Yes Individuals 18 years and older actively receiving waiver services in accordance with Indiana’s capped waiver support program.
8,653
KS IDD/DD HCBS 1915(c) yes Adults over age 18 with ID/DD
8,000
KY SCL 1915(c) yes 4,635
11,340
Michelle P 1915(c) no Also serves children w/ID/DD
5,681
State General Funds yes 672
ICF ICF/ID yes 352

Appendices | 43
State Names of programs Funding Sources Adults only? Description of the population
Individual program population
Total NCI IPS 2017-18 sample number
LA New Opportunities Waiver (NOW)
HCBS 1915 (c) No. Children from the age of 3 and older may also qualify.
Individuals with a qualifying diagnosis of intellectual or developmental disability.
8,379
15,871
Supports Waiver (SW) HCBS 1915 (c) yes Individuals with a qualifying diagnosis of intellectual or developmental disability.
1,860
Residential Options Waiver (ROW)
HCBS 1915 (c) No, this waiver is open to all ages.
Individuals with a qualifying diagnosis of intellectual or developmental disability.
18
ICF/IID (Public/Private, large/small)
ICF/IID No. Individuals under the age of 18 may qualify for services.
Individuals with a qualifying diagnosis of intellectual or developmental disability.
4,530
State-funded State Plan No. Individuals under the age of 18 may qualify for services.
Individuals with a qualifying diagnosis of intellectual or developmental disability.
1,084
ME Case Management (Medicaid)
Medicaid State Plan No. Case Management is an entitlement for all persons who qualify for developmental services.
6,426
MA Waivers (5): ABI MFP Adult Intensive Community Living Adult Supports
HCBS 1915 Adults over age 22 with ID/DD/ABI
15,734
20,266
State plan Adults over age 22 with ID/DD
4,532
MI 3 HCBS 1915 (c), 1915 (i ), and State Plan
yes Adults over age of 18 with ID/DD
35,575
MN HCBS Waivers and State Plan Home Care
HCBS 1915 and State Plan
Yes Adults over age of 18 with ID/DD
23,591
MO Entire DD population of adults 18 and older who receive at least one authorized service in addition to support coordination.
HCBS 1915(c), State Plan, General Revenue
Yes Adults 18 and older with ID/DD
18,702
NE Comprehensive Waiver 1915(c) No This program serves adults and children for both residential and day services
3,211
4,384

Appendices | 44
State Names of programs Funding Sources Adults only? Description of the population
Individual program population
Total NCI IPS 2017-18 sample number
Adult Day Waiver 1915 (c) Yes This program supports adults only for their day service needs.
877
ICF/IDs Yes This program serves adults for both residential and day services
296
NV Nevada ID/RC HCBS Waiver
HCBS 1915 (c) No, this program supports people of all ages
Adults and Children with ID/DD
2,091
NY NY OPWDD Comprehensive Waiver
HCBS 1915 (c) Adults and Children with ID/DD
Individuals with ID/DD 103,000
NC All Medicaid and state-funded I/DD services
ICF/ID, HCBS waivers, Medicaid State Plan, state fundedservices
No Adults over 18 years with ID/DD
15,500
OH Waiver 1915 (c ) No, includes children
Public (county boards of dd services)
35,000
41,000
ICFID 1915 (c ) No, includes children
Private facilities 6,000
OK Community Waiver-Residential
HCBS 1915(c) No. Adults and children with ID/DD.
2,227
4,897
Community Waiver-Non-residential
HCBS 1915(c) No. Adults and children with ID/DD.
589
Homeward Bound HCBS 1915(c) Yes. Adults over age 18 with ID/DD.
599
In-Home Supports HCBS 1915(c) Yes. Adults over age 18 with ID/DD.
1,482
OR Natural Home with Day Supports
Waiver for case management and Community First Choice State Plan for Day supports
Yes Adults 18 years and older, who live in their own home or family’s home, receiving case management, as well as paid Day Support
1
14,523
Natural Home with Day Supports and Employment Services
Waiver for case management and employment services Community First Choice State Plan for Day supports
Yes Adults 18 years and older, who live in their own home or family’s home, receiving case management, as well as both paid Day Support and Competitive Integrated Employment; Employment Path Services; Individual Employment Support; Job coaching; Job Development; Small Group Employment Support services.
21

Appendices | 45
State Names of programs Funding Sources Adults only? Description of the population
Individual program population
Total NCI IPS 2017-18 sample number
Natural Home with Employment Services Only
Waiver for all services Yes Adults 18 years and older, who live in their own home or family’s home, receiving case management, as well as Competitive Integrated Employment; Employment Path Services; Individual Employment Support; Job coaching; Job Development; Small Group Employment Support services
378
Natural Home with In Home Supports Only
Waiver for case management and Community First Choice State Plan for in home services
Yes Adults 18 years and older, who live in their own home or family’s home, receiving case management, as well as supports with ADLs and IADLs.
5,718
Natural Home with Day Supports and In Home Supports
Waiver for case management and Community First Choice State Plan for in home services and Day supports
Yes Adults 18 years and older, who live in their own home or family’s home, receiving case management, as well as supports with ADLs and IADLs and paid Day Support services.
834
Natural Home with Day Supports, In Home Supports and Employment Services
Waiver for case management and employment and Community First Choice State Plan for in home services and Day Supports
Yes Adults 18 years and older, who live in their own home or family’s home, receiving case management, as well as supports with ADLs and IADLs and both paid Day Support and Competitive Integrated Employment; Employment Path Services; Individual Employment Support; Job coaching; Job Development; Small Group Employment Support services.
244

Appendices | 46
State Names of programs Funding Sources Adults only? Description of the population
Individual program population
Total NCI IPS 2017-18 sample number
Natural Home with In Home Supports and Employment Services
Waiver for case management and employment and Community First Choice State Plan for in home services
Yes Adults 18 years and older, who live in their own home or family’s home, receiving case management, as well as supports with ADLs and IADLs and Competitive Integrated Employment; Employment Path Services; Individual Employment Support; Job coaching; Job Development; Small Group Employment Support services.
998
24 Hour Residential Services for Adults
Waiver for case management and Community First Choice State Plan
Yes Adults living in group home setting, generally 5 or fewer in a home
2,791
Supported Living Services for Adults
Waiver for case management and Community First Choice State Plan
Yes Adults living in the residence of choice within their community with the levels of support based on needs and preferences which may include up to 24 hours per day of paid supports
674
Adult Foster Care Waiver for case management and Community First Choice State Plan
Yes Adults living in a safe and secure home in which services and supports are provided
2,794
Stabilization and Crisis Unit Waiver for case management and Community First Choice State Plan
Yes Adults in crisis and living in a safe and secure home in which services and supports are provided
70
PA Consolidated Waiver HCBS 1915(c) Yes Adults over age 18 with ID/DD
17,600
43,700
Person/Family-Directed Supports (P/FDS) Waiver
HCBS 1915(c) Yes Adults over age 18 with ID/DD
12,800
Base Funds State Yes Adults over age 18 with ID/DD
10,600
ICF/ID(state-operated and privately-operated)
ICF/ID Yes Adults over age 18 with ID/DD
2,700
RI HCBS waiver - All populations will be included – sample will be drawn from the whole census.
Adults over age 21 with ID/DD
3,600

Appendices | 47
State Names of programs Funding Sources Adults only? Description of the population
Individual program population
Total NCI IPS 2017-18 sample number
SC Residential Services; Day and Employment Services; In-home supports
HCB Waiver (1915(c)) and State Funded; HCB (1915(c)) and State Funded Waiver; HCB Waiver (1915(c)) and State Funded
Yes to all three Adults age 18 and over receiving residential services in a DDSN contracted residential setting. (The number in the State funded category will be limited.) Adults age 18 and over receiving Day and Employment Services through a DDSN contracted provider. (The number in the State funded category will be limited.) Adults age 18 and over receiving In-home supports through a DDSN contracted provider. (The number in the State funded category will be limited.)
8,656
TN Main Waiver HCBS 1915(c) Adults over 18 with ID/DD 4,948
8,709
CAC Waiver HCBS 1915(c) Adults over 18 with ID/DD 1,673
Self Determination Waiver HCBS 1915(c) Adults over 18 with ID/DD 1,192
ICFs ICF public and private 896
UT Community Supports Waiver/Acquired Brain Injury Waiver
HCBS 1915(c) No, also ABI and children
Adults over the age of 18 with ID/DD
4,600
4,870
Utah State Developmental Center (USDC)
ICF/ID Yes Adults over the age of 18 with ID/DD
200
State funded State funds 70
VT Waiver HCBS – Global Commitment for Health (1115)
Adults with developmental disabilities (ID and/or ASD) age 18 and over, in services for one year or more, no longer in high school.
2,740

Appendices | 48
State Names of programs Funding Sources Adults only? Description of the population
Individual program population
Total NCI IPS 2017-18 sample number
VA Building Independence Waiver; Family & Individual Waiver; Community Living Waiver
1915c YES Provides day support, personal assistance, prevocational, residential support, respite, supported employment, consumer directed services facilitation, assistive technology, companion services, crisis stabilization, crisis supervision, environmental mods, PERS, skilled nursing, therapeutic consultation, transition for individuals, in-home residential, personal care, services facilitation, family/caregiver training, day support
10,244
WI Family Care HCBS 1915(b/c), The program is for adults only and includes other target groups with disabilities.
Adults 18 and up with a functional screen level of care with IDD/DD who are living in allowable settings (Family Care enrollees may also receive institutional state plan services, but may not reside in an Institution for Mental Disease)
19,959
26,354
Include, Respect, I Self-Direct (IRIS)
HCBS 1915(c); enrollees may also self-direct personal care through a 1915(j) state plan amendment
The program is for adults only and includes other target groups with disabilities.
Adults 18 and up with a functional screen level of care with IDD/DD who are living in allowable waiver settings (IRIS enrollees may live in a home-based setting, residential care apartment complex, or adult family home, but not a community-based residential facility or institution, aside from short-term institutional stays such 5747+as a rehabilitation stay in a nursing home)
5,747
Include, Respect, I Self-Direct (IRIS)

Appendices | 49
State Names of programs Funding Sources Adults only? Description of the population
Individual program population
Total NCI IPS 2017-18 sample number
Partnership 1932(a) state plan program including 1915(c) waiver services
The program is for adults only and includes other target groups with disabilities.
Adults 18 and up with a functional screen level of care with IDD/DD who are living in allowable settings (Family Care enrollees may also receive institutional state plan services, but may not reside in an Institution for Mental Disease)
648 Partnership
WY Acquired Brain Injury Waiver
HCBS 1915(c) Adults 18+ with an ABI 128
1,682
Comprehensive Waiver HCBS 1915(c) No – waiver supports individuals from birth to death
Adults 18+ with an ID/DD 1,356
Supports Waiver HCBS 1915(c) No – waiver supports individuals from birth to death
Adults 18+ with an ID/DD 198
Total 692,314

Appendices | 50
Appendix D
Un-collapsed and unadjusted data by state
Note: outcomes for states with fewer than 20 respondents to an item are not displayed as “n/a”; data are
still included in the total percentage.

Appendices | 51
Choice and Decision-Making (unadjusted, un-weighted and un-collapsed)
Table D1. Who chose (or picked) the place where you live? (if not living the family home)
State Person made
the choice Person had some input
Someone else chose
N
AL 20.8% 35.5% 43.7% 231
AZ 24.7% 31.7% 43.5% 186
AR 28.9% 46.9% 24.3% 239
CA 25.4% 27.2% 47.5% 4,327
CO 22.2% 41.2% 36.6% 153
CT 18.8% 30.7% 50.5% 218
DE 28.0% 31.1% 40.8% 289
DC 9.6% 34.3% 56.1% 271
FL 32.6% 40.4% 27.1% 436
GA 32.7% 38.5% 28.8% 226
IL 21.7% 37.0% 41.3% 189
IN 50.7% 34.6% 14.7% 217
KS 29.7% 41.3% 29.0% 269
KY 18.2% 42.1% 39.7% 214
LA 22.4% 20.1% 57.5% 268
ME 40.9% 27.0% 32.0% 281
MA 21.5% 37.5% 41.0% 293
MI 19.7% 31.8% 48.6% 381
MN 18.9% 39.6% 41.4% 227
MO 17.4% 35.5% 47.1% 310
NE 18.5% 42.9% 38.5% 275
NV 40.4% 24.0% 35.6% 275
NY 22.5% 28.7% 48.8% 289
NC 15.2% 32.8% 52.0% 244
OH 39.1% 31.4% 29.4% 350
OK 39.0% 35.4% 25.6% 254
OR 29.4% 29.4% 41.1% 180
PA 28.1% 28.7% 43.2% 303
RI 27.2% 30.9% 41.9% 191
SC 35.6% 10.0% 54.4% 270
TN 22.5% 40.9% 36.6% 276
UT 36.6% 16.7% 46.8% 216
VT 28.1% 39.3% 32.6% 178
VA 18.4% 45.0% 36.6% 484
WI 25.1% 29.2% 45.7% 346
WY 30.6% 32.8% 36.6% 235
Total 26.7% 33.4% 39.9% 13,591

Appendices | 52
Table D2. Did you choose (or pick) the people you live with (or did you choose to live by yourself)? (if not living the family home)
State Person made
the choice Person had some input
Someone else chose
N
AL 14.3% 19.6% 66.1% 230
AZ 21.0% 22.6% 56.5% 186
AR 46.2% 16.0% 37.8% 238
CA 26.1% 13.9% 60.0% 4,169
CO 17.9% 29.8% 52.3% 151
CT 18.1% 19.0% 62.9% 210
DE 24.9% 34.8% 40.3% 293
DC 5.9% 34.9% 59.1% 269
FL 29.1% 26.6% 44.3% 436
GA 26.3% 31.8% 41.9% 217
IL 15.5% 26.8% 57.7% 194
IN 60.9% 21.9% 17.2% 215
KS 26.8% 37.0% 36.2% 265
KY 16.7% 16.7% 66.7% 216
LA 21.6% 12.7% 65.6% 259
ME 35.9% 17.6% 46.6% 262
MA 21.6% 21.0% 57.4% 291
MI 17.6% 23.8% 58.6% 370
MN 13.3% 19.7% 67.0% 233
MO 22.1% 32.8% 45.1% 308
NE 23.4% 40.3% 36.3% 273
NV 32.7% 26.5% 40.8% 272
NY 19.2% 11.5% 69.3% 287
NC 11.4% 24.9% 63.7% 245
OH 43.2% 19.9% 36.9% 352
OK 49.0% 26.7% 24.3% 255
OR 23.5% 21.9% 54.6% 183
PA 29.3% 16.2% 54.5% 297
RI 27.1% 20.8% 52.1% 192
SC 28.0% 4.8% 67.2% 271
TN 27.0% 38.3% 34.8% 282
UT 33.0% 16.5% 50.5% 212
VT 36.0% 29.8% 34.3% 178
VA 12.6% 24.2% 63.2% 475
WI 37.3% 7.4% 55.3% 351
WY 36.5% 25.7% 37.8% 230
Total 26.4% 23.2% 50.4% 13,367

Appendices | 53
Table D3. Who chose (or picked) the place where you work? (among those with a job in the community)
State Person made
the choice Person had some input
Someone else chose
N
AL n/a n/a n/a n/a
AZ 42.2% 42.2% 15.6% 64
AR 55.0% 35.0% 10.0% 40
CA 48.5% 35.0% 16.5% 1,230
CO 31.4% 58.6% 10.0% 70
CT 33.1% 48.3% 18.6% 118
DE 43.6% 38.2% 18.2% 55
DC 22.2% 70.4% 7.4% 27
FL 88.5% 10.3% 1.1% 87
GA 76.0% 24.0% 0 25
IL 44.4% 47.2% 8.3% 36
IN 66.7% 31.8% 1.6% 129
KS 70.5% 26.2% 3.3% 61
KY 61.0% 36.6% 2.4% 41
LA 43.8% 37.5% 18.8% 48
ME 58.8% 36.3% 4.9% 102
MA 42.3% 43.3% 14.4% 97
MI 45.8% 36.1% 18.1% 83
MN 29.2% 46.7% 24.1% 137
MO 44.4% 50.0% 5.6% 36
NE 40.0% 52.5% 7.5% 160
NV 57.5% 27.5% 15.0% 40
NY 50.0% 41.4% 8.6% 58
NC 37.5% 40.9% 21.6% 88
OH 60.8% 33.8% 5.4% 148
OK 44.2% 40.6% 15.2% 138
OR 29.9% 58.2% 11.9% 67
PA 51.9% 39.6% 8.5% 106
RI 31.5% 56.2% 12.4% 89
SC 47.3% 32.4% 20.3% 74
TN 60.3% 30.2% 9.5% 63
UT 53.6% 39.3% 7.1% 84
VT 44.9% 41.1% 14.0% 107
VA 43.3% 45.0% 11.7% 60
WI 33.9% 54.8% 11.3% 124
WY 50.0% 41.1% 8.9% 90
Total 47.5% 41.4% 11.1% 3,998

Appendices | 54
Table D4. Chose or had some input in choosing day program or workshop (adjusted variable; among those determined to attend a day program or workshop; ‘person made the choice’ and ‘person had some input’ responses; proxy respondents were allowed for this question) ± º ^
State Person made
the choice Person had some input
Someone else chose
N
AL 16.8% 34.2% 49.0% 351
AZ 20.6% 42.3% 37.1% 267
AR 33.9% 39.8% 26.2% 221
CA 18.2% 30.7% 51.2% 4,983
CO 24.5% 37.6% 37.9% 282
CT 17.1% 33.3% 49.6% 252
DE 39.2% 23.6% 37.3% 212
DC 4.6% 37.3% 58.1% 351
FL 36.2% 45.9% 17.9% 442
GA 27.2% 50.9% 22.0% 346
IL 23.8% 33.9% 42.2% 277
IN 35.3% 40.6% 24.1% 357
KS 32.2% 48.3% 19.6% 317
KY 18.6% 51.4% 30.0% 253
LA 20.6% 30.7% 48.7% 238
ME 46.9% 27.1% 26.0% 277
MA 19.2% 35.5% 45.3% 276
MI 20.8% 31.7% 47.5% 322
MN 24.4% 39.0% 36.6% 254
MO 30.6% 42.5% 26.9% 186
NE 11.8% 49.8% 38.4% 331
NV 39.3% 28.8% 31.9% 295
NY 16.2% 23.4% 60.4% 333
NC 12.3% 37.7% 50.0% 310
OH 34.3% 36.4% 29.3% 516
OK 18.0% 41.4% 40.5% 111
OR 31.0% 30.3% 38.7% 142
PA 28.3% 29.4% 42.3% 357
RI 21.2% 39.4% 39.4% 264
SC 21.0% 10.8% 68.3% 315
TN 29.2% 38.1% 32.7% 168
UT 28.9% 32.3% 38.8% 232
VT 33.3% 31.2% 35.5% 93
VA 17.1% 48.4% 34.5% 498
WI 25.6% 31.2% 43.2% 433
WY 23.6% 33.2% 43.2% 199
Total 25.0% 36.1% 38.9% 15,061
± Question changed in 2017-18 survey tool to only include individuals who attended a day program or sheltered workshop º Analysis of this question changed from previous years; now based on those determined in the Background Information to attend an unpaid community activity, unpaid paid facility activity or paid facility activity

Appendices | 55
Table D5. Do you choose (or pick) your staff?
State Person chose
staff
Staff are assigned but
can be changed if
requested by person
Someone else chose
N
AL 0.5% 74.6% 24.9% 374
AZ 26.2% 45.4% 28.3% 381
AR 34.5% 53.3% 12.3% 383
CA 11.6% 48.8% 39.6% 6,258
CO 15.9% 64.6% 19.5% 308
CT 16.1% 35.1% 48.9% 305
DE 13.5% 68.6% 17.9% 363
DC 9.0% 55.5% 35.5% 400
FL 39.9% 41.3% 18.9% 848
GA 10.9% 59.3% 29.9% 442
IL 14.8% 43.1% 42.1% 318
IN 35.3% 55.0% 9.8% 666
KS 13.8% 69.1% 17.2% 349
KY 32.5% 12.3% 55.2% 406
LA 13.9% 50.0% 36.1% 402
ME 6.6% 78.0% 15.4% 364
MA 22.5% 44.3% 33.2% 386
MI 21.4% 45.0% 33.5% 513
MN 14.2% 33.9% 51.9% 345
MO 17.6% 57.6% 24.7% 380
NE 13.3% 60.5% 26.2% 390
NV 19.0% 64.4% 16.6% 337
NY 12.4% 39.8% 47.7% 394
NC 27.0% 42.2% 30.8% 559
OH 22.1% 53.2% 24.7% 624
OK 27.3% 54.5% 18.2% 352
OR 31.9% 36.2% 31.9% 376
PA 12.2% 42.5% 45.4% 551
RI 21.8% 49.5% 28.7% 317
SC 28.5% 54.2% 17.3% 428
TN 18.1% 67.3% 14.6% 419
UT 25.1% 50.4% 24.5% 371
VT 29.7% 44.0% 26.3% 266
VA 17.1% 36.5% 46.4% 737
WI 25.5% 28.1% 46.4% 768
WY 26.8% 41.7% 31.5% 302
Total 20.2% 50.0% 29.8% 21,382

Appendices | 56
Table D6. Who decides your daily schedule?
State Person makes
the choice Person has some input
Someone else chooses
N
AL 56.6% 35.1% 8.2% 376
AZ 38.9% 36.7% 24.4% 488
AR 48.6% 41.7% 9.7% 393
CA 51.8% 30.3% 17.9% 8,207
CO 58.5% 26.4% 15.1% 398
CT 43.3% 32.6% 24.1% 344
DE 59.5% 30.7% 9.8% 388
DC 29.0% 37.5% 33.6% 411
FL 56.2% 37.1% 6.7% 923
GA 55.6% 40.2% 4.2% 453
IL 51.7% 32.6% 15.7% 350
IN 69.4% 24.8% 5.8% 726
KS 54.8% 30.5% 14.7% 374
KY 62.5% 31.0% 6.5% 413
LA 43.3% 32.2% 24.6% 423
ME 63.5% 32.7% 3.8% 395
MA 59.9% 31.3% 8.8% 409
MI 52.0% 31.2% 16.9% 635
MN 55.5% 28.9% 15.6% 391
MO 60.9% 34.3% 4.8% 394
NE 49.0% 42.4% 8.5% 410
NV 63.7% 21.4% 14.9% 369
NY 50.8% 33.5% 15.7% 496
NC 38.4% 36.3% 25.3% 617
OH 65.2% 23.8% 10.9% 751
OK 55.6% 29.3% 15.0% 399
OR 62.9% 23.7% 13.4% 426
PA 57.2% 28.6% 14.2% 661
RI 52.5% 33.1% 14.3% 335
SC 44.9% 46.7% 8.4% 441
TN 53.4% 28.7% 17.9% 425
UT 53.1% 30.1% 16.8% 382
VT 60.1% 23.6% 16.3% 313
VA 38.4% 46.4% 15.1% 799
WI 55.8% 23.9% 20.2% 949
WY 55.7% 27.7% 16.6% 314
Total 53.6% 32.1% 14.3% 24,978

Appendices | 57
Table D7. Who decides how you spend your free time?
State Person makes
the choice Person has some input
Someone else chooses
N
AL 72.7% 19.9% 7.4% 377
AZ 55.5% 29.4% 15.1% 490
AR 80.7% 14.6% 4.8% 398
CA 67.1% 22.2% 10.7% 8,195
CO 71.8% 19.9% 8.3% 397
CT 58.1% 31.5% 10.4% 346
DE 84.0% 11.4% 4.7% 387
DC 29.9% 42.2% 27.9% 408
FL 65.9% 29.8% 4.3% 921
GA 73.0% 24.8% 2.2% 455
IL 70.3% 22.4% 7.3% 357
IN 86.4% 11.6% 2.1% 727
KS 74.1% 19.2% 6.7% 375
KY 68.6% 26.1% 5.3% 414
LA 77.4% 13.8% 8.9% 429
ME 70.7% 25.6% 3.6% 386
MA 69.0% 25.4% 5.7% 406
MI 73.1% 19.8% 7.1% 636
MN 75.1% 18.5% 6.4% 390
MO 73.8% 23.9% 2.3% 397
NE 61.7% 34.9% 3.4% 410
NV 72.9% 20.2% 6.9% 376
NY 68.1% 22.2% 9.8% 501
NC 62.1% 27.0% 10.9% 623
OH 75.9% 18.5% 5.6% 756
OK 82.9% 12.6% 4.5% 398
OR 78.1% 14.5% 7.4% 421
PA 70.6% 22.1% 7.3% 670
RI 67.8% 25.4% 6.8% 338
SC 89.2% 8.4% 2.5% 443
TN 77.8% 17.0% 5.3% 436
UT 66.0% 26.3% 7.7% 377
VT 72.5% 19.1% 8.4% 309
VA 62.7% 31.3% 6.0% 798
WI 66.5% 21.5% 12.0% 950
WY 71.1% 20.3% 8.6% 315
Total 70.6% 22.0% 7.3% 25,012

Appendices | 58
Table D8. Do you choose what you buy with your spending money?
State Person makes
the choice
Person has help choosing
what to buy or has set
limits
Someone else chooses
N
AL 65.3% 27.2% 7.5% 375
AZ 34.2% 37.0% 28.8% 486
AR 36.9% 53.4% 9.7% 401
CA 46.0% 36.3% 17.7% 8,162
CO 49.0% 33.5% 17.5% 394
CT 49.3% 37.0% 13.7% 343
DE 21.8% 68.9% 9.3% 376
DC 29.5% 37.9% 32.7% 404
FL 44.2% 42.9% 13.0% 910
GA 56.9% 38.1% 5.1% 452
IL 59.7% 25.9% 14.5% 352
IN 64.8% 28.5% 6.6% 722
KS 57.3% 39.5% 3.2% 377
KY 63.9% 31.7% 4.4% 413
LA 58.0% 30.2% 11.8% 431
ME 65.4% 29.0% 5.6% 393
MA 54.6% 36.9% 8.5% 401
MI 57.8% 29.1% 13.1% 635
MN 55.0% 35.4% 9.6% 387
MO 59.8% 34.6% 5.6% 396
NE 37.7% 52.4% 10.0% 401
NV 62.6% 24.9% 12.5% 369
NY 51.0% 32.7% 16.3% 492
NC 48.0% 36.4% 15.6% 621
OH 63.3% 28.4% 8.3% 744
OK 67.2% 22.9% 9.9% 393
OR 64.1% 24.9% 10.9% 421
PA 61.3% 27.7% 11.0% 657
RI 52.8% 40.1% 7.1% 337
SC 81.1% 13.9% 5.0% 439
TN 57.4% 30.6% 12.0% 432
UT 51.3% 36.4% 12.3% 382
VT 69.0% 22.6% 8.4% 310
VA 48.1% 40.7% 11.2% 794
WI 50.2% 31.5% 18.4% 937
WY 59.5% 31.3% 9.2% 316
Total 54.3% 34.2% 11.5% 24,855

Appendices | 59
Table D9. Can you change your case manager/service coordinator if you want to?
State Yes No N
AL 90.1% 9.9% 365
AZ 89.8% 10.2% 431
AR 98.1% 1.9% 376
CA 90.3% 9.7% 7,162
CO 88.2% 11.8% 306
CT 76.5% 23.5% 264
DE 77.7% 22.3% 274
DC 68.4% 31.6% 392
FL 97.3% 2.7% 864
GA 93.2% 6.8% 340
IL 81.4% 18.6% 258
IN 95.7% 4.3% 695
KS 93.6% 6.4% 328
KY 96.7% 3.3% 363
LA 73.0% 27.0% 374
ME 92.5% 7.5% 334
MA 77.2% 22.8% 285
MI 89.4% 10.6% 558
MN 78.0% 22.0% 287
MO 90.3% 9.7% 321
NE 84.4% 15.6% 262
NV 82.6% 17.4% 328
NY 88.0% 12.0% 451
NC 83.0% 17.0% 499
OH 92.2% 7.8% 670
OK 88.0% 12.0% 349
OR 86.5% 13.5% 363
PA 85.2% 14.8% 526
RI 84.1% 15.9% 264
SC 94.6% 5.4% 407
TN 92.7% 7.3% 384
UT 91.4% 8.6% 338
VT 80.6% 19.4% 237
VA 86.1% 13.9% 691
WI 90.6% 9.4% 748
WY 89.6% 10.4% 297
Total 87.1% 12.9% 21,391

Appendices | 60
Work (un-collapsed)
Table D10. Was in community paid job (individual with or without public services, group supported or community job in a business that primarily hires people with disabilities )
State No Yes N
AL 93.9% 6.1% 374
AZ 84.0% 16.0% 476
AR 88.9% 11.1% 387
CA 84.3% 15.7% 8228
CO 75.5% 24.5% 339
CT 57.1% 42.9% 343
DE 81.5% 18.5% 390
DC 90.7% 9.3% 398
FL 90.0% 10.0% 941
GA 93.8% 6.2% 465
IL 88.0% 12.0% 357
IN 81.4% 18.6% 735
KS 79.7% 20.3% 370
KY 84.8% 15.2% 394
LA 85.0% 15.0% 401
ME 66.6% 33.4% 362
MA 72.9% 27.1% 395
MI 83.5% 16.5% 594
MN 61.5% 38.5% 379
MO 90.9% 9.1% 396
NE 56.7% 43.3% 404
NV 85.9% 14.1% 384
NY 86.7% 13.3% 490
NC 81.8% 18.2% 615
OH 75.5% 24.5% 694
OK n/a n/a n/a
OR** 40.3% 59.7% 129
PA 81.3% 18.7% 587
RI 67.4% 32.6% 304
SC 77.3% 22.7% 392
TN 82.2% 17.8% 427
UT 74.7% 25.3% 384
VT 64.0% 36.0% 331
VA 88.5% 11.5% 771
WI** n/a n/a n/a
WY 68.3% 31.7% 325
Total 78.4% 21.6% 22961
** Due to limitations in data availability regarding paid community jobs that primarily hire individuals
with disabilities, OR and WI are not included in this chart.

Appendices | 61
Table D11. Bi-weekly hours and wage (not including benefits and before taxes or deductions) information among those with a paid individual community job with or without publicly funded supports
State
Number of hours worked during a typical two-week
period in paid individual job N
Hourly wage at paid individual job during a
typical two-week period N
AL n/a n/a n/a n/a
AR 31.1 30 $ 8.86 30
AZ n/a n/a n/a n/a
CA 37.8 728 $11.60 624
CO 24.7 43 $10.85 32
CT 29.3 26 $10.78 24
DC 38.8 27 $11.79 20
DE 35.0 49 $ 9.80 46
FL 30.7 81 $ 9.57 50
GA n/a n/a n/a n/a
IL 25.8 31 $ 9.27 20
IN 30.1 119 $ 8.73 66
KS 25.1 43 $ 7.95 31
KY 19.2 51 $ 8.30 42
LA 28.9 26 $ 8.47 24
MA 29.8 68 $11.63 66
ME 16.6 93 $10.23 80
MI 24.8 52 $ 8.78 45
MN 33.8 92 $10.14 57
MO 30.7 29 $ 7.86 28
NC 19.6 88 $ 7.95 69
NE 28.3 101 $ 9.70 102
NV n/a n/a n/a n/a
NY 26.7 45 $11.42 45
OH 32.6 104 $ 9.03 94
OK 29.9 41 $ 7.76 41
OR 19.5 28 $11.61 28
PA 27.6 62 $ 9.05 34
RI 19.0 66 $10.61 64
SC 26.2 31 n/a n/a
TN 20.6 50 $ 7.73 38
UT 22.4 64 $ 8.16 58
VA 24.5 30 n/a n/a
VT 18.3 117 $11.07 117
WI 21.6 120 $ 8.78 120
WY 28.1 80 $ 9.46 76
Total 27.6 2,677 $ 9.50 2,266

Appendices | 62
Table D12. Bi-weekly hours and wage information among those with a paid group job with or without publicly funded supports
State
Number of hours
worked during a
typical two-week period
in paid group job N
Hourly wage at paid
group job during a
typical two-week period N
AL n/a n/a n/a n/a
AR n/a n/a n/a n/a
AZ 28.1 33 $7.98 26
CA 32.5 356 $10.91 285
CO 19.0 29 $9.79 20
CT 24.6 75 $7.78 66
DC n/a n/a n/a n/a
DE n/a n/a n/a n/a
FL n/a n/a n/a n/a
GA n/a n/a n/a n/a
IL n/a n/a n/a n/a
IN n/a n/a n/a n/a
KS n/a n/a n/a n/a
KY n/a n/a n/a n/a
LA 31.6 27 $4.89 23
MA 16.0 33 $10.95 32
ME n/a n/a n/a n/a
MI 20.9 26 $8.23 23
MN 28.4 27 n/a n/a
MO n/a n/a n/a n/a
NC n/a n/a n/a n/a
NE 23.2 38 $8.87 36
NV 39.4 23 $7.82 23
NY n/a n/a n/a n/a
OH 34.0 43 $8.27 36
OK 43.2 42 $5.59 42
OR 20.7 23 $11.12 23
PA n/a n/a n/a n/a
RI n/a n/a n/a n/a
SC 28.5 28 n/a n/a
TN n/a n/a n/a n/a
UT 25.6 25 $6.45 21
VA 35.2 29 $6.26 24
WI n/a n/a n/a n/a
WY n/a n/a n/a n/a
Total 24.5 1,019 $8.18 848

Appendices | 63
Table D13. Bi-weekly hours and wage information among those with a paid job in the community that primarily hires people with disabilities
State
Number of hours
worked during a
typical two-week period in a paid job
in athe community
that primarily
hires people with
disabilities N
Hourly wage during a
typical two-week period in a paid job
in athe community
that primarily
hires people with
disabilities N
AL n/a n/a n/a n/a
AR n/a n/a n/a n/a
AZ n/a n/a n/a n/a
CA 31.73 158 11.36 132
CO n/a n/a n/a n/a
CT n/a n/a n/a n/a
DC n/a n/a n/a n/a
DE n/a n/a n/a n/a
FL n/a n/a n/a n/a
GA n/a n/a n/a n/a
IL n/a n/a n/a n/a
IN n/a n/a n/a n/a
KS n/a n/a n/a n/a
KY n/a n/a n/a n/a
LA n/a n/a n/a n/a
MA n/a n/a n/a n/a
ME n/a n/a n/a n/a
MI n/a n/a n/a n/a
MN 29.21 34 n/a n/a
MO n/a n/a n/a n/a
NC 18.10 20 n/a n/a
NE 24.41 40 8.82 39
NV n/a n/a n/a n/a
NY n/a n/a n/a n/a
OH n/a n/a n/a n/a
OK 46.41 79 4.65 78
PA n/a n/a n/a n/a
RI n/a n/a n/a n/a
SC n/a n/a n/a n/a
TN n/a n/a n/a n/a
UT n/a n/a n/a n/a
VA n/a n/a n/a n/a
WY n/a n/a n/a n/a
Total 29.97 331 8.28 249

Appendices | 64
Table D14. How long has this person been working at his/her current job? (among those with a paid community job)
State Average Months
N
AL n/a n/a
AZ 56.4 50
AR 68.8 32
CA 75.2 1241
CO 50.3 76
CT 95.5 109
DE 80.2 37
DC n/a n/a
FL 82.4 85
GA 118.2 26
IL 82.3 35
IN 90.7 132
KS 52.0 55
KY 45.0 47
LA 104.0 47
ME 64.1 98
MA 100.5 100
MI 59.5 77
MN 100.6 111
MO 54.3 35
NE 68.4 173
NV 47.4 47
NY 57.1 56
NC 64.0 93
OH 73.5 134
OK 78.3 148
PA 54.9 62
RI 73.3 86
SC 56.2 55
TN 51.8 53
UT 58.4 79
VT 65.8 119
VA 54.3 65
WY 50.2 96
Total 69.8 3659

Appendices | 65
Table D15. Does this person receive paid time off (e.g., vacation, holiday, or sick time) at his/her job? (among those with a paid community job)
State No Yes
AL n/a n/a n/a
AZ 76.6% 23.4% 47
AR 62.1% 37.9% 29
CA 60.4% 39.6% 1,169
CO 80.9% 19.1% 47
CT 53.5% 46.5% 86
DE 56.1% 43.9% 41
DC n/a n/a n/a
FL 75.3% 24.7% 80
GA 70.4% 29.6% 27
IL 64.7% 35.3% 34
IN 77.1% 22.9% 118
KS 74.1% 25.9% 54
KY 84.2% 15.8% 39
LA 92.3% 7.7% 39
ME 86.6% 13.4% 82
MA 51.6% 48.4% 94
MI 79.2% 20.8% 71
MN 67.6% 32.4% 108
MO 82.9% 17.1% 36
NE 83.4% 16.6% 163
NV 69.4% 30.6% 35
NY 56.0% 44.0% 50
NC 84.9% 15.1% 73
OH 57.5% 42.5% 113
OK 87.8% 12.2% 148
PA 77.3% 22.7% 56
RI 66.3% 33.7% 83
SC 81.7% 18.3% 71
TN 84.4% 15.6% 45
UT 93.8% 6.2% 81
VT 89.0% 11.0% 91
VA 79.3% 20.7% 58
WY 83.2% 16.8% 101
Total 74.7% 25.3% 3,369

Appendices | 66
Table D16. Would you like to have a job in the community? (among those with no paid community job)
No Yes In between
AL 38.2% 46.9% 14.9% 288
AZ 58.5% 37.4% 4.1% 147
AR 32.4% 55.2% 12.4% 259
CA 41.6% 45.9% 12.5% 3622
CO 39.7% 41.9% 18.4% 136
CT 51.6% 40.7% 7.7% 91
DE 26.4% 71.7% 1.9% 159
DC 29.8% 64.0% 6.1% 114
FL 60.0% 30.9% 9.1% 460
GA 56.9% 31.6% 11.6% 225
IL 44.6% 43.1% 12.3% 204
IN 54.1% 39.8% 6.1% 410
KS 49.0% 35.6% 15.4% 149
KY 77.3% 18.7% 3.9% 203
LA 47.6% 46.4% 6.0% 166
ME 27.5% 68.5% 4.0% 149
MA 48.9% 43.5% 7.6% 131
MI 38.2% 53.1% 8.7% 207
MN 40.2% 49.5% 10.3% 107
MO 60.7% 33.3% 5.9% 219
NE 56.1% 28.0% 15.9% 107
NV 42.7% 50.7% 6.6% 227
NY 34.0% 57.2% 8.8% 215
NC 32.7% 60.0% 7.3% 165
OH 50.6% 40.7% 8.7% 253
OK 32.7% 57.9% 9.3% 107
OR 50.0% 40.0% 10.0% 20
PA 65.6% 29.9% 4.5% 221
RI 31.5% 61.3% 7.2% 111
SC 59.5% 37.1% 3.4% 205
TN 58.2% 39.3% 2.6% 196
UT 30.5% 63.8% 5.7% 105
VT 39.4% 48.5% 12.1% 132
VA 46.9% 45.7% 7.3% 341
WY 44.5% 47.3% 8.2% 110
Total 45.7% 45.9% 8.5% 9961

Appendices | 67
Table D17. Is community employment a goal in this person's service plan?
State No Yes
AL 76.5% 23.5% 370
AZ 80.5% 19.5% 471
AR 80.0% 20.0% 380
CA 70.6% 29.4% 7742
CO 77.2% 22.8% 342
CT 66.0% 34.0% 359
DE 63.5% 36.5% 351
DC 45.5% 54.5% 365
FL 81.3% 18.7% 931
GA 91.8% 8.2% 463
IL 83.6% 16.4% 359
IN 79.5% 20.5% 716
KS 74.7% 25.3% 368
KY 78.7% 21.3% 390
LA 80.3% 19.7% 412
ME 61.9% 38.1% 383
MA 75.3% 24.7% 396
MI 78.4% 21.6% 634
MN 49.6% 50.4% 357
MO 81.5% 18.5% 395
NE 33.3% 66.7% 381
NV 75.2% 24.8% 371
NY 68.9% 31.1% 488
NC 78.4% 21.6% 638
OH 58.8% 41.2% 679
OK 49.8% 50.3% 400
OR 40.5% 59.5% 173
PA 76.0% 24.0% 616
RI 21.9% 78.1% 302
SC 76.0% 24.0% 413
TN 68.4% 31.6% 434
UT 62.5% 37.5% 355
VT 59.9% 40.1% 329
VA 76.8% 23.2% 779
WI 19.9% 80.1% 256
WY 64.1% 35.9% 320
Total 69.8% 30.2% 23118
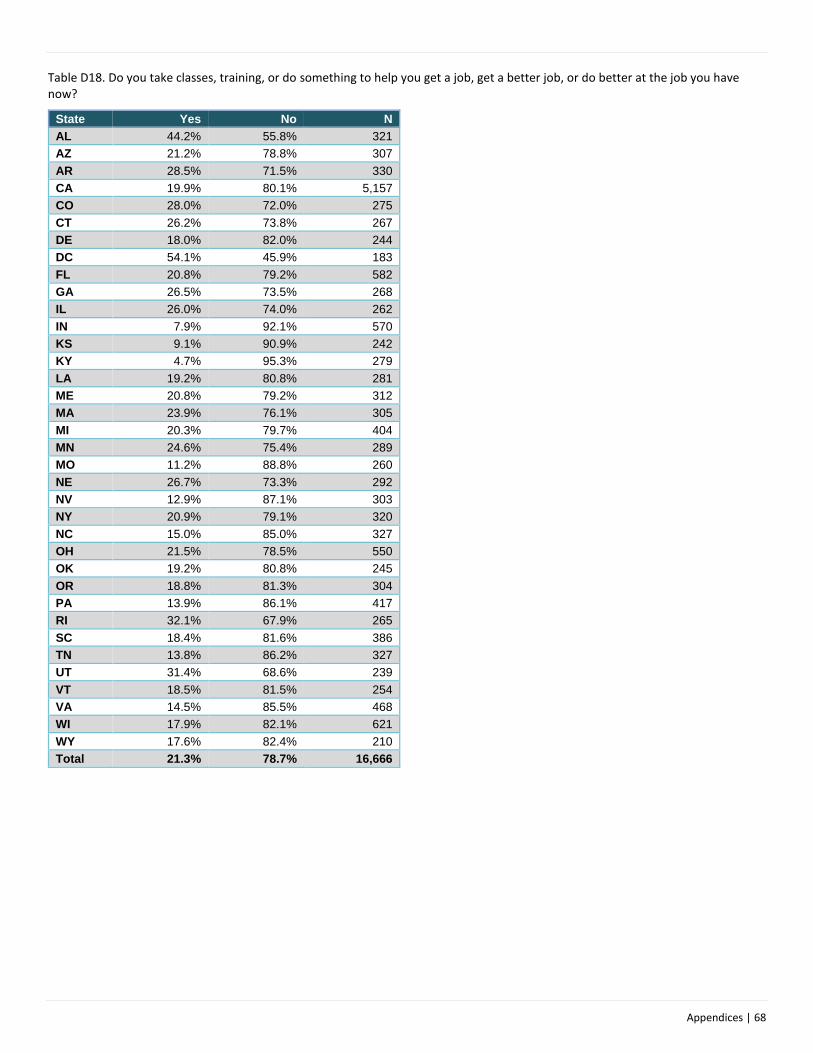
Appendices | 68
Table D18. Do you take classes, training, or do something to help you get a job, get a better job, or do better at the job you have now?
State Yes No N
AL 44.2% 55.8% 321
AZ 21.2% 78.8% 307
AR 28.5% 71.5% 330
CA 19.9% 80.1% 5,157
CO 28.0% 72.0% 275
CT 26.2% 73.8% 267
DE 18.0% 82.0% 244
DC 54.1% 45.9% 183
FL 20.8% 79.2% 582
GA 26.5% 73.5% 268
IL 26.0% 74.0% 262
IN 7.9% 92.1% 570
KS 9.1% 90.9% 242
KY 4.7% 95.3% 279
LA 19.2% 80.8% 281
ME 20.8% 79.2% 312
MA 23.9% 76.1% 305
MI 20.3% 79.7% 404
MN 24.6% 75.4% 289
MO 11.2% 88.8% 260
NE 26.7% 73.3% 292
NV 12.9% 87.1% 303
NY 20.9% 79.1% 320
NC 15.0% 85.0% 327
OH 21.5% 78.5% 550
OK 19.2% 80.8% 245
OR 18.8% 81.3% 304
PA 13.9% 86.1% 417
RI 32.1% 67.9% 265
SC 18.4% 81.6% 386
TN 13.8% 86.2% 327
UT 31.4% 68.6% 239
VT 18.5% 81.5% 254
VA 14.5% 85.5% 468
WI 17.9% 82.1% 621
WY 17.6% 82.4% 210
Total 21.3% 78.7% 16,666

Appendices | 69
Table D19. Do you go to a day program or sheltered workshop?
State Yes No N
AL 90.8% 9.2% 326
AZ 62.2% 37.8% 307
AR 58.4% 41.6% 332
CA 52.7% 47.3% 5,318
CO 66.2% 33.8% 281
CT 59.4% 40.6% 281
DE 72.9% 27.1% 266
DC 82.8% 17.2% 186
FL 47.9% 52.1% 606
GA 78.1% 21.9% 279
IL 78.9% 21.1% 270
IN 50.6% 49.4% 589
KS 82.1% 17.9% 262
KY 65.2% 34.8% 282
LA 55.4% 44.6% 296
ME 80.1% 19.9% 332
MA 64.9% 35.1% 313
MI 49.6% 50.4% 415
MN 52.7% 47.3% 296
MO 52.6% 47.4% 266
NE 77.6% 22.4% 335
NV 76.6% 23.4% 316
NY 58.1% 41.9% 327
NC 54.4% 45.6% 340
OH 63.9% 36.1% 568
OK 27.8% 72.2% 252
OR 30.0% 70.0% 307
PA 52.0% 48.0% 440
RI 73.6% 26.4% 280
SC 71.6% 28.4% 391
TN 39.9% 60.1% 331
UT 57.8% 42.2% 256
VT 26.6% 73.4% 256
VA 63.5% 36.5% 502
WI 28.6% 71.4% 637
WY 55.3% 44.7% 215
Total 60.0% 40.0% 17,256
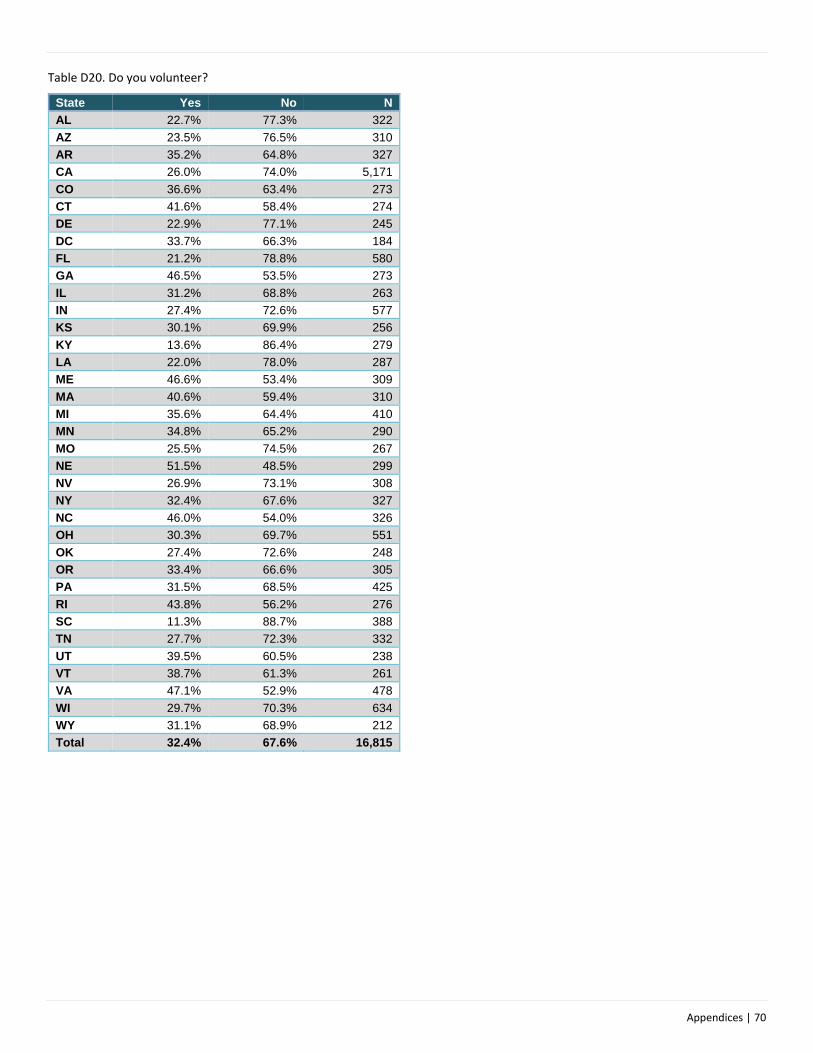
Appendices | 70
Table D20. Do you volunteer?
State Yes No N
AL 22.7% 77.3% 322
AZ 23.5% 76.5% 310
AR 35.2% 64.8% 327
CA 26.0% 74.0% 5,171
CO 36.6% 63.4% 273
CT 41.6% 58.4% 274
DE 22.9% 77.1% 245
DC 33.7% 66.3% 184
FL 21.2% 78.8% 580
GA 46.5% 53.5% 273
IL 31.2% 68.8% 263
IN 27.4% 72.6% 577
KS 30.1% 69.9% 256
KY 13.6% 86.4% 279
LA 22.0% 78.0% 287
ME 46.6% 53.4% 309
MA 40.6% 59.4% 310
MI 35.6% 64.4% 410
MN 34.8% 65.2% 290
MO 25.5% 74.5% 267
NE 51.5% 48.5% 299
NV 26.9% 73.1% 308
NY 32.4% 67.6% 327
NC 46.0% 54.0% 326
OH 30.3% 69.7% 551
OK 27.4% 72.6% 248
OR 33.4% 66.6% 305
PA 31.5% 68.5% 425
RI 43.8% 56.2% 276
SC 11.3% 88.7% 388
TN 27.7% 72.3% 332
UT 39.5% 60.5% 238
VT 38.7% 61.3% 261
VA 47.1% 52.9% 478
WI 29.7% 70.3% 634
WY 31.1% 68.9% 212
Total 32.4% 67.6% 16,815

Appendices | 71
Self-Determination (un-collapsed)
Table D21. Is this person currently using a self-directed supports option?
State Yes No N
AL 0.5% 99.5% 377
AZ 55.9% 44.1% 483
AR 0.0% 100.0% 403
CA 0.2% 99.8% 8,264
CO 0.0% 100.0% 405
CT 14.0% 86.0% 364
DE 0.0% 100.0% 407
DC 0.0% 100.0% 410
FL 13.6% 86.4% 969
GA 4.2% 95.8% 471
IL 32.0% 68.0% 362
IN 0.0% 100.0% 736
KS 22.2% 77.8% 383
KY 34.4% 65.6% 404
LA 2.4% 97.6% 413
ME 0.0% 100.0% 394
MA 0.7% 99.3% 417
MI 17.7% 82.3% 633
MN 8.5% 91.5% 401
MO 3.5% 96.5% 400
NE 18.1% 81.9% 415
NV 0.0% 100.0% 393
NY 8.3% 91.7% 496
NC 2.1% 97.9% 631
OH 2.0% 98.0% 693
OK 2.5% 97.5% 400
OR 34.1% 65.9% 428
PA 10.7% 89.3% 627
RI 10.9% 89.1% 322
SC 3.7% 96.3% 401
TN 10.2% 89.8% 442
UT 24.5% 75.5% 396
VT 34.4% 65.6% 331
VA 0.0% 100.0% 810
WI 47.4% 52.6% 985
WY 6.9% 93.1% 331
Total 11.8% 88.2% 25,197
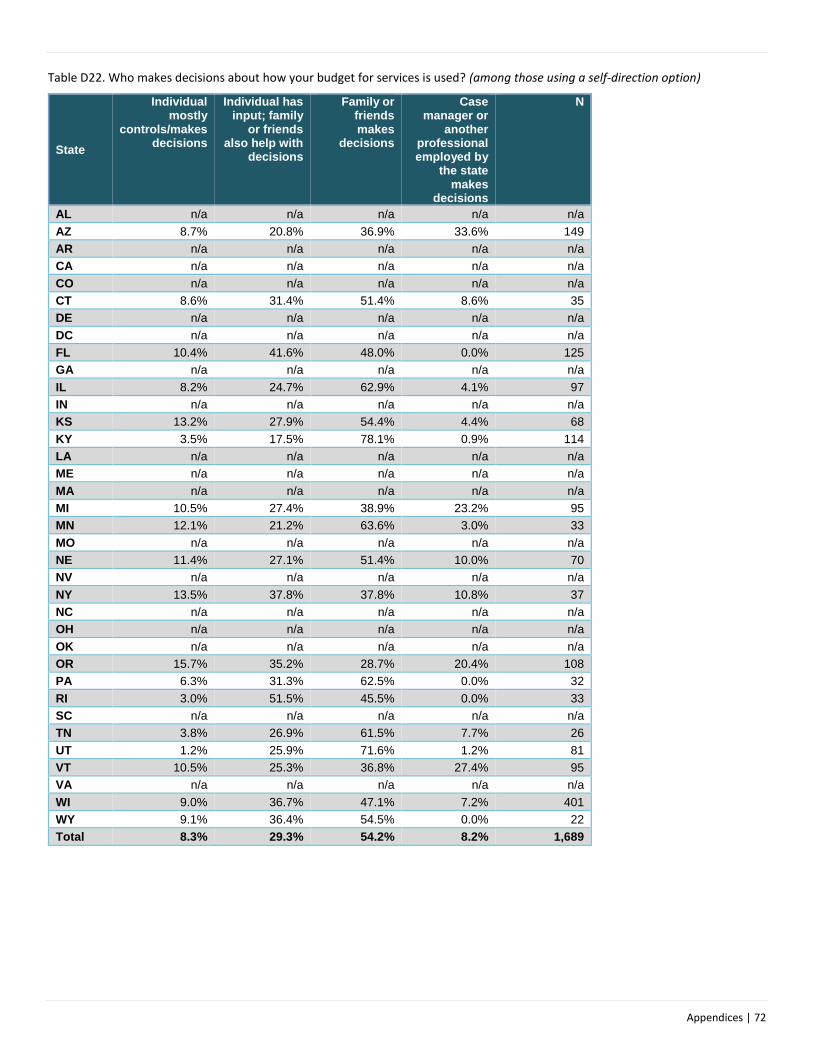
Appendices | 72
Table D22. Who makes decisions about how your budget for services is used? (among those using a self-direction option)
State
Individual mostly
controls/makes decisions
Individual has input; family
or friends also help with
decisions
Family or friends makes
decisions
Case manager or
another professional employed by
the state makes
decisions
N
AL n/a n/a n/a n/a n/a
AZ 8.7% 20.8% 36.9% 33.6% 149
AR n/a n/a n/a n/a n/a
CA n/a n/a n/a n/a n/a
CO n/a n/a n/a n/a n/a
CT 8.6% 31.4% 51.4% 8.6% 35
DE n/a n/a n/a n/a n/a
DC n/a n/a n/a n/a n/a
FL 10.4% 41.6% 48.0% 0.0% 125
GA n/a n/a n/a n/a n/a
IL 8.2% 24.7% 62.9% 4.1% 97
IN n/a n/a n/a n/a n/a
KS 13.2% 27.9% 54.4% 4.4% 68
KY 3.5% 17.5% 78.1% 0.9% 114
LA n/a n/a n/a n/a n/a
ME n/a n/a n/a n/a n/a
MA n/a n/a n/a n/a n/a
MI 10.5% 27.4% 38.9% 23.2% 95
MN 12.1% 21.2% 63.6% 3.0% 33
MO n/a n/a n/a n/a n/a
NE 11.4% 27.1% 51.4% 10.0% 70
NV n/a n/a n/a n/a n/a
NY 13.5% 37.8% 37.8% 10.8% 37
NC n/a n/a n/a n/a n/a
OH n/a n/a n/a n/a n/a
OK n/a n/a n/a n/a n/a
OR 15.7% 35.2% 28.7% 20.4% 108
PA 6.3% 31.3% 62.5% 0.0% 32
RI 3.0% 51.5% 45.5% 0.0% 33
SC n/a n/a n/a n/a n/a
TN 3.8% 26.9% 61.5% 7.7% 26
UT 1.2% 25.9% 71.6% 1.2% 81
VT 10.5% 25.3% 36.8% 27.4% 95
VA n/a n/a n/a n/a n/a
WI 9.0% 36.7% 47.1% 7.2% 401
WY 9.1% 36.4% 54.5% 0.0% 22
Total 8.3% 29.3% 54.2% 8.2% 1,689

Appendices | 73
Table D23. Do you hire and manage your staff? (among those using a self-direction option)
State Yes Maybe No N
AL n/a n/a n/a n/a
AZ 28.1% 0.0% 71.9% 32
AR n/a n/a n/a n/a
CA n/a n/a n/a n/a
CO n/a n/a n/a n/a
CT 69.6% 8.7% 21.7% 23
DE n/a n/a n/a n/a
DC n/a n/a n/a n/a
FL 98.0% 1.0% 1.0% 101
GA n/a n/a n/a n/a
IL 76.5% 5.9% 17.6% 34
IN n/a n/a n/a n/a
KS 73.8% 14.3% 11.9% 42
KY 81.8% 13.6% 4.5% 22
LA n/a n/a n/a n/a
ME n/a n/a n/a n/a
MA n/a n/a n/a n/a
MI 71.9% 0.0% 28.1% 64
MN n/a n/a n/a n/a
MO n/a n/a n/a n/a
NE 60.0% 13.3% 26.7% 60
NV 64.3% 14.3% 21.4% 28
NY n/a n/a n/a n/a
NC n/a n/a n/a n/a
OH n/a n/a n/a n/a
OK n/a n/a n/a n/a
OR 73.1% 2.6% 24.4% 78
PA n/a n/a n/a n/a
RI 92.9% 7.1% 0.0% 28
SC n/a n/a n/a n/a
TN n/a n/a n/a n/a
UT 87.5% 3.1% 9.4% 64
VT 63.5% 7.7% 28.8% 52
VA n/a n/a n/a n/a
WI 60.1% 8.7% 31.2% 218
WY n/a n/a n/a n/a
Total 72.6% 9.7% 17.7% 940

Appendices | 74
Table D24. Can you make changes to your budget/services if you need to? (among those using a self-direction option)
State Yes Maybe No N
AL n/a n/a n/a n/a
AZ 74.1% 22.2% 3.7% 31
AR n/a n/a n/a n/a
CA n/a n/a n/a n/a
CO n/a n/a n/a n/a
CT 79.2% 12.5% 8.3% 23
DE n/a n/a n/a n/a
DC n/a n/a n/a n/a
FL 97.0% 2.0% 1.0% 100
GA n/a n/a n/a n/a
IL 83.3% 13.9% 2.8% 36
IN n/a n/a n/a n/a
KS 65.1% 23.3% 11.6% 44
KY 90.5% 9.5% 0.0% 22
LA n/a n/a n/a n/a
ME n/a n/a n/a n/a
MA n/a n/a n/a n/a
MI 80.0% 9.2% 10.8% 64
MN n/a n/a n/a n/a
MO n/a n/a n/a n/a
NE 62.1% 31.0% 6.9% 59
NV n/a n/a n/a n/a
NY 92.9% 7.1% 0.0% 28
NC n/a n/a n/a n/a
OH n/a n/a n/a n/a
OK n/a n/a n/a n/a
OR 76.3% 11.8% 11.8% 76
PA n/a n/a n/a n/a
RI 69.0% 20.7% 10.3% 28
SC n/a n/a n/a n/a
TN n/a n/a n/a n/a
UT 95.3% 3.1% 1.6% 65
VT 72.2% 16.7% 11.1% 56
VA n/a n/a n/a n/a
WI 79.3% 13.7% 7.0% 225
WY n/a n/a n/a n/a
Total 76.9% 16.3% 6.8% 952

Appendices | 75
Table D25. Do you have enough help deciding how to use your budget/services? (among those using a self-direction option)
State Yes Maybe No N
AL n/a n/a n/a n/a
AZ 64.5% 32.3% 3.2% 31
AR n/a n/a n/a n/a
CA n/a n/a n/a n/a
CO n/a n/a n/a n/a
CT 95.7% 4.3% 0.0% 23
DE n/a n/a n/a n/a
DC n/a n/a n/a n/a
FL 96.0% 4.0% 0.0% 100
GA n/a n/a n/a n/a
IL 94.4% 5.6% 0.0% 36
IN n/a n/a n/a n/a
KS 88.6% 6.8% 4.5% 44
KY 81.8% 18.2% 0.0% 22
LA n/a n/a n/a n/a
ME n/a n/a n/a n/a
MA n/a n/a n/a n/a
MI 85.9% 4.7% 9.4% 64
MN n/a n/a n/a n/a
MO n/a n/a n/a n/a
NE 44.1% 10.2% 45.8% 59
NV n/a n/a n/a n/a
NY 78.6% 10.7% 10.7% 28
NC n/a n/a n/a n/a
OH n/a n/a n/a n/a
OK n/a n/a n/a n/a
OR 92.1% 1.3% 6.6% 76
PA n/a n/a n/a n/a
RI 85.7% 3.6% 10.7% 28
SC n/a n/a n/a n/a
TN n/a n/a n/a n/a
UT 92.3% 6.2% 1.5% 65
VT 85.7% 10.7% 3.6% 56
VA n/a n/a n/a n/a
WI 92.4% 2.2% 5.3% 225
WY n/a n/a n/a n/a
Total 85.6% 10.1% 4.4% 952

Appendices | 76
Table D26. Do you get information about how much money is left in your budget/services? (among those using a self-direction option)
State Yes Maybe No N
AL n/a n/a n/a n/a
AZ 53.6% 35.7% 10.7% 28
AR n/a n/a n/a n/a
CA n/a n/a n/a n/a
CO n/a n/a n/a n/a
CT 83.3% 8.3% 8.3% 24
DE n/a n/a n/a n/a
DC n/a n/a n/a n/a
FL 96.0% 4.0% 0.0% 99
GA n/a n/a n/a n/a
IL 74.3% 20.0% 5.7% 35
IN n/a n/a n/a n/a
KS 75.6% 12.2% 12.2% 41
KY 81.8% 18.2% 0.0% 22
LA n/a n/a n/a n/a
ME n/a n/a n/a n/a
MA n/a n/a n/a n/a
MI 79.7% 3.1% 17.2% 64
MN n/a n/a n/a n/a
MO n/a n/a n/a n/a
NE 19.0% 8.6% 72.4% 58
NV n/a n/a n/a n/a
NY 89.3% 3.6% 7.1% 28
NC n/a n/a n/a n/a
OH n/a n/a n/a n/a
OK n/a n/a n/a n/a
OR 60.0% 5.0% 35.0% 80
PA n/a n/a n/a n/a
RI 79.3% 13.8% 6.9% 29
SC n/a n/a n/a n/a
TN n/a n/a n/a n/a
UT 93.8% 4.7% 1.6% 64
VT 78.2% 5.5% 16.4% 55
VA n/a n/a n/a n/a
WI 85.8% 4.9% 9.3% 225
WY n/a n/a n/a n/a
Total 73.7% 16.2% 13.0% 946

Appendices | 77
Table D27. Is the information easy to understand? (among those using a self-direction option and who receive information about money left in their budget/services)
State Yes Maybe No N
AL n/a n/a n/a n/a
AZ 69.6% 30.4% 0.0% 23
AR n/a n/a n/a n/a
CA n/a n/a n/a n/a
CO n/a n/a n/a n/a
CT 90.5% 4.8% 4.8% 21
DE n/a n/a n/a n/a
DC n/a n/a n/a n/a
FL 88.7% 9.3% 2.1% 97
GA n/a n/a n/a n/a
IL 71.9% 25.0% 3.1% 32
IN n/a n/a n/a n/a
KS 83.3% 16.7% 0.0% 36
KY 72.7% 18.2% 9.1% 22
LA n/a n/a n/a n/a
ME n/a n/a n/a n/a
MA n/a n/a n/a n/a
MI 71.7% 13.2% 15.1% 53
MN n/a n/a n/a n/a
MO n/a n/a n/a n/a
NE n/a n/a n/a n/a
NV n/a n/a n/a n/a
NY 69.2% 23.1% 7.7% 26
NC n/a n/a n/a n/a
OH n/a n/a n/a n/a
OK n/a n/a n/a n/a
OR 81.6% 14.3% 4.1% 49
PA n/a n/a n/a n/a
RI 70.4% 14.8% 14.8% 27
SC n/a n/a n/a n/a
TN n/a n/a n/a n/a
UT 61.9% 22.2% 15.9% 63
VT 69.6% 17.4% 13.0% 46
VA n/a n/a n/a n/a
WI 65.7% 19.9% 14.4% 201
WY n/a n/a n/a n/a
Total 69.5% 19.9% 10.6% 791

Appendices | 78
Table D28. How often do you get information about how much money is left in your budget/services? (among those using a self-direction option and who receive information about money left in their budget/services)
State At least every three months
About once a year
Once a year or less
N
AL n/a n/a n/a n/a
AZ n/a n/a n/a n/a
AR n/a n/a n/a n/a
CA n/a n/a n/a n/a
CO n/a n/a n/a n/a
CT n/a n/a n/a n/a
DE n/a n/a n/a n/a
DC n/a n/a n/a n/a
FL 98.0% 2.0% 0.0% 99
GA n/a n/a n/a n/a
IL 55.2% 17.2% 27.6% 29
IN n/a n/a n/a n/a
KS 84.4% 12.5% 3.1% 32
KY 80.0% 5.0% 15.0% 20
LA n/a n/a n/a n/a
ME n/a n/a n/a n/a
MA n/a n/a n/a n/a
MI 72.9% 10.4% 16.7% 48
MN n/a n/a n/a n/a
MO n/a n/a n/a n/a
NE n/a n/a n/a n/a
NV n/a n/a n/a n/a
NY 76.0% 16.0% 8.0% 25
NC n/a n/a n/a n/a
OH n/a n/a n/a n/a
OK n/a n/a n/a n/a
OR 44.7% 19.1% 36.2% 47
PA n/a n/a n/a n/a
RI 76.9% 11.5% 11.5% 26
SC n/a n/a n/a n/a
TN n/a n/a n/a n/a
UT 89.1% 9.4% 1.6% 64
VT 88.9% 0.0% 11.1% 36
VA n/a n/a n/a n/a
WI 93.1% 3.7% 3.2% 189
WY n/a n/a n/a n/a
Total 78.0% 11.8% 10.2% 731

Appendices | 79
Community Inclusion (un-collapsed and un-weighted)
Table D29. How many times did you go shopping in the past month?
State 0 times 1-2 times 3-4 times More than 5
times N
AL 13.6% 42.0% 38.8% 5.6% 376
AZ 17.2% 28.3% 24.0% 30.4% 487
AR 6.5% 14.6% 29.8% 49.1% 403
CA 11.1% 29.6% 27.9% 31.4% 8,211
CO 8.4% 21.2% 33.5% 36.8% 391
CT 5.7% 30.5% 34.2% 29.6% 351
DE 15.3% 39.3% 23.1% 22.3% 346
DC 10.9% 37.6% 36.4% 15.2% 396
FL 8.7% 35.8% 28.8% 26.7% 930
GA 5.2% 38.2% 33.3% 23.3% 442
IL 6.5% 34.1% 36.3% 23.1% 355
IN 6.0% 18.7% 26.6% 48.6% 728
KS 8.0% 32.2% 41.0% 18.9% 376
KY 5.1% 40.7% 49.9% 4.3% 415
LA 15.4% 34.6% 27.3% 22.7% 428
ME 3.8% 11.4% 24.1% 60.8% 395
MA 9.3% 31.0% 31.3% 28.5% 400
MI 13.3% 24.6% 29.9% 32.2% 639
MN 8.6% 26.9% 31.3% 33.2% 383
MO 7.6% 24.7% 30.6% 37.1% 396
NE 9.2% 18.1% 43.4% 29.4% 415
NV 9.4% 29.6% 27.5% 33.4% 371
NY 13.9% 31.2% 25.8% 29.0% 503
NC 10.1% 27.2% 24.2% 38.5% 615
OH 7.1% 30.1% 29.9% 32.9% 750
OK 13.4% 23.7% 30.1% 32.8% 396
OR 9.0% 18.9% 25.2% 46.9% 424
PA 7.9% 30.9% 29.4% 31.7% 656
RI 9.4% 24.9% 29.9% 35.8% 341
SC 20.8% 39.5% 21.7% 18.0% 433
TN 10.7% 29.6% 31.0% 28.7% 422
UT 11.3% 27.0% 25.2% 36.5% 381
VT 9.4% 11.9% 22.6% 56.1% 310
VA 7.5% 20.3% 26.4% 45.8% 795
WI 17.2% 26.5% 27.4% 28.8% 940
WY 5.1% 21.1% 36.1% 37.7% 313
Total 9.9% 28.0% 30.4% 31.7% 24,913

Appendices | 80
Table D30. Who did you usually go shopping with? º ∞
State Alone Friends Family Housemates Staff Other N
AL 0.5% 8.5% 38.7% 26.4% 57.9% 7.2% 375
AZ 1.2% 8.0% 56.3% 9.7% 41.3% 0.2% 487
AR 3.5% 14.2% 39.8% 5.7% 77.1% 0.2% 402
CA 15.4% 12.4% 47.7% 18.6% 46.3% 1.0% 8,261
CO 12.8% 9.5% 51.3% 12.8% 48.7% 0.3% 390
CT 4.8% 10.8% 40.2% 20.2% 72.6% 1.4% 351
DE 3.8% 0.3% 6.1% 25.1% 79.5% 0.3% 346
DC 3.3% 9.3% 25.0% 7.3% 68.9% 0.5% 396
FL 6.4% 7.8% 48.7% 16.8% 54.9% 0.3% 926
GA 1.4% 13.1% 38.9% 25.8% 81.9% 1.4% 442
IL 8.5% 11.9% 52.3% 29.4% 45.2% 0.8% 354
IN 6.2% 6.5% 68.0% 1.7% 61.4% 1.1% 725
KS 2.7% 8.0% 31.2% 19.7% 65.6% 0.8% 375
KY 1.9% 7.0% 48.2% 4.3% 66.7% 0.2% 415
LA 1.9% 5.4% 37.1% 27.7% 65.7% 0.9% 426
ME 14.0% 12.2% 31.0% 15.0% 80.7% 1.5% 394
MA 7.8% 9.0% 30.6% 25.8% 67.7% 0.0% 399
MI 6.0% 10.7% 40.6% 22.5% 59.3% 2.0% 636
MN 10.2% 9.1% 37.3% 18.5% 68.7% 0.5% 383
MO 4.0% 7.3% 26.3% 35.4% 81.3% 1.0% 396
NE 7.0% 14.7% 40.5% 29.2% 70.8% 0.7% 415
NV 8.4% 4.6% 30.8% 23.0% 70.0% 0.5% 370
NY 14.5% 9.9% 36.0% 22.5% 50.1% 1.6% 503
NC 2.4% 6.7% 54.4% 13.2% 66.4% 0.8% 614
OH 7.6% 7.8% 52.0% 10.2% 51.9% 0.4% 748
OK 2.3% 2.0% 31.6% 13.4% 62.6% 0.5% 396
OR 18.4% 8.3% 35.8% 13.7% 67.7% 0.2% 424
PA 8.4% 8.1% 37.8% 9.2% 55.4% 0.8% 653
RI 6.2% 11.2% 39.6% 17.8% 70.1% 0.0% 338
SC 4.6% 5.1% 30.5% 17.6% 49.0% 2.1% 433
TN 1.4% 1.9% 24.1% 23.9% 74.7% 0.7% 419
UT 6.0% 5.0% 38.3% 20.2% 63.5% 1.0% 381
VT 9.0% 8.4% 42.3% 5.5% 63.2% 4.5% 310
VA 1.9% 7.6% 40.1% 33.7% 75.4% 0.9% 793
WI 9.9% 8.7% 54.6% 5.6% 29.5% 0.6% 940
WY 10.6% 15.7% 36.9% 22.4% 80.4% 0.3% 312
Total 6.5% 8.5% 39.5% 18.0% 63.7% 1.0% 24,928
ºResponse options changed in 2017-18, “family” and “friends” are now captured as separate categories ∞Categories are not mutually exclusive

Appendices | 81
Table D31. How many times did you go out on errands or appointments in the past month
State 0 times 1-2 times 3-4 times More than 5
times N
AL 15.5% 71.7% 11.2% 1.6% 375
AZ 11.0% 35.6% 32.1% 21.3% 489
AR 8.2% 31.0% 26.6% 34.2% 403
CA 18.4% 46.0% 21.0% 14.7% 8,143
CO 12.5% 39.4% 24.8% 23.3% 391
CT 9.1% 35.7% 26.9% 28.3% 350
DE 7.9% 48.4% 27.3% 16.4% 341
DC 9.2% 57.2% 22.8% 10.8% 390
FL 13.3% 53.3% 21.4% 12.1% 920
GA 20.9% 56.1% 18.6% 4.4% 431
IL 11.4% 50.0% 21.9% 16.8% 352
IN 11.6% 43.9% 19.1% 25.3% 722
KS 15.1% 48.5% 23.6% 12.9% 365
KY 3.4% 33.0% 59.0% 4.6% 415
LA 11.7% 41.4% 31.1% 15.9% 428
ME 9.5% 38.1% 24.3% 28.1% 391
MA 9.5% 38.1% 30.3% 22.1% 399
MI 15.6% 40.9% 23.7% 19.7% 633
MN 10.4% 39.7% 29.9% 20.0% 375
MO 12.9% 36.5% 24.9% 25.7% 389
NE 14.9% 41.0% 26.6% 17.6% 410
NV 11.8% 52.6% 21.9% 13.7% 365
NY 16.4% 41.9% 23.4% 18.2% 499
NC 13.1% 35.9% 26.5% 24.5% 616
OH 13.1% 44.7% 24.6% 17.6% 740
OK 4.8% 24.2% 26.8% 44.2% 396
OR 10.6% 29.2% 21.2% 39.0% 415
PA 6.3% 47.4% 26.1% 20.2% 652
RI 7.8% 40.0% 25.1% 27.2% 335
SC 29.5% 55.0% 8.2% 7.3% 427
TN 15.7% 40.7% 25.2% 18.4% 413
UT 20.3% 43.7% 15.7% 20.3% 375
VT 7.6% 24.7% 24.7% 43.1% 304
VA 12.0% 40.8% 22.8% 24.4% 786
WI 20.9% 36.4% 22.1% 20.6% 940
WY 9.8% 37.3% 25.5% 27.5% 306
Total 12.5% 42.2% 24.6% 20.6% 24,681

Appendices | 82
Table D32. Who did you usually go with when you went on errands or appointments? º ∞
State Alone Friends Family Housemates Staff Other N
AL 2.1% 38.1% 9.4% 52.3% 1.6% 373
AZ 2.0% 5.3% 58.6% 7.6% 41.0% 0.4% 488
AR 1.5% 2.2% 39.2% 1.0% 73.3% 0.0% 401
CA 14.3% 6.0% 41.4% 9.9% 37.6% 0.6% 8,251
CO 9.7% 7.4% 47.6% 8.4% 42.7% 0.3% 391
CT 5.2% 8.0% 39.1% 12.6% 63.5% 0.6% 348
DE 2.4% 0.0% 3.5% 12.1% 89.4% 0.6% 339
DC 7.4% 7.2% 22.8% 5.9% 68.2% 0.5% 390
FL 6.1% 4.9% 44.7% 10.2% 49.1% 0.0% 915
GA 1.4% 2.6% 29.6% 12.9% 58.5% 0.5% 426
IL 6.9% 7.4% 47.4% 16.6% 41.7% 0.9% 350
IN 4.9% 3.1% 62.9% 1.1% 43.5% 0.4% 719
KS 4.4% 6.6% 29.4% 12.4% 56.9% 1.1% 364
KY 1.7% 5.1% 48.7% 2.7% 68.0% 0.5% 415
LA 2.6% 4.1% 34.4% 23.2% 67.3% 0.5% 419
ME 14.5% 3.1% 24.0% 4.1% 67.2% 0.5% 387
MA 10.6% 3.8% 26.4% 15.3% 65.1% 0.5% 398
MI 5.9% 6.9% 37.7% 12.3% 53.8% 0.5% 626
MN 10.7% 3.2% 31.2% 9.9% 64.5% 0.3% 375
MO 2.8% 3.1% 19.8% 24.7% 74.6% 0.5% 389
NE 5.9% 7.1% 35.0% 22.9% 63.3% 0.5% 406
NV 6.9% 1.1% 31.3% 9.1% 62.4% 0.3% 364
NY 14.7% 5.8% 33.3% 13.7% 46.0% 1.0% 496
NC 3.1% 3.3% 48.9% 9.1% 59.2% 0.5% 615
OH 8.8% 6.5% 46.3% 6.8% 43.8% 0.7% 738
OK 2.3% 2.5% 35.4% 11.6% 67.2% 0.5% 396
OR 17.8% 2.9% 32.3% 8.4% 62.7% 0.2% 415
PA 7.4% 5.1% 39.6% 4.6% 53.7% 0.8% 646
RI 6.6% 5.1% 40.4% 12.6% 64.7% 0.3% 334
SC 2.8% 0.7% 22.5% 2.8% 46.6% 0.9% 427
TN 1.5% 0.7% 21.2% 14.1% 73.7% 0.2% 411
UT 5.1% 2.4% 37.8% 7.5% 49.9% 0.8% 373
VT 12.5% 6.3% 35.0% 4.6% 65.7% 5.6% 303
VA 2.0% 1.9% 35.7% 19.5% 65.1% 0.5% 785
WI 13.9% 6.5% 50.9% 3.5% 25.3% 0.3% 940
WY 11.8% 11.2% 32.9% 11.8% 69.4% 0.7% 304
Total 6.8% 4.6% 36.2% 10.4% 58.2% 0.7% 24,717
ºResponse options changed in 2017-18, “family” and “friends” are now captured as separate categories ∞Categories are not mutually exclusive

Appendices | 83
Table D33. How many times did you go out for entertainment in the past month?
State 0 times 1-2 times 3-4 times More than 5
times N
AL 25.3% 45.2% 23.9% 5.6% 376
AZ 24.2% 29.5% 25.4% 20.9% 488
AR 10.7% 22.9% 28.6% 37.8% 402
CA 29.1% 38.3% 19.4% 13.2% 8,189
CO 29.0% 36.6% 16.5% 17.8% 393
CT 15.1% 39.1% 25.7% 20.0% 350
DE 31.7% 36.3% 17.8% 14.2% 366
DC 5.7% 46.2% 34.3% 13.8% 405
FL 22.3% 40.3% 20.4% 17.0% 934
GA 16.6% 36.4% 33.5% 13.5% 451
IL 25.3% 47.5% 16.1% 11.1% 360
IN 28.0% 28.1% 18.1% 25.8% 729
KS 17.1% 34.6% 34.1% 14.2% 381
KY 12.6% 26.3% 55.8% 5.3% 414
LA 19.2% 42.8% 21.5% 16.6% 428
ME 41.3% 36.2% 13.6% 9.0% 390
MA 24.6% 32.9% 25.1% 17.5% 395
MI 25.0% 35.9% 19.4% 19.7% 635
MN 22.1% 34.3% 23.9% 19.7% 385
MO 23.7% 33.6% 19.6% 23.2% 393
NE 7.0% 37.8% 32.0% 23.2% 413
NV 21.6% 38.6% 21.9% 17.8% 370
NY 34.3% 36.1% 15.5% 14.1% 498
NC 23.3% 34.7% 21.0% 21.0% 619
OH 18.1% 38.7% 22.3% 20.9% 750
OK 14.6% 23.0% 24.7% 37.6% 396
OR 28.5% 26.8% 21.3% 23.4% 418
PA 25.5% 41.4% 19.8% 13.3% 652
RI 20.5% 38.6% 20.2% 20.8% 337
SC 37.7% 36.1% 18.0% 8.2% 438
TN 24.5% 28.5% 26.4% 20.6% 428
UT 19.2% 33.9% 17.3% 29.7% 381
VT 22.7% 31.8% 17.9% 27.6% 308
VA 17.0% 31.9% 23.0% 28.1% 794
WI 33.1% 35.2% 17.6% 14.1% 940
WY 13.3% 38.6% 23.7% 24.4% 308
Total 22.5% 35.4% 23.2% 18.9% 24,914

Appendices | 84
Table D34. Who did you usually go with when you went out for entertainment? º ∞
State Alone Friends Family Housemates Staff Other N
AL 29.6% 30.7% 29.3% 58.9% 7.7%
AZ 1.6% 17.6% 50.4% 9.4% 39.8% 0.2%
AR 4.0% 34.2% 44.6% 6.0% 72.1% 0.0%
CA 6.8% 19.3% 36.9% 16.8% 33.8% 1.2%
CO 5.1% 23.7% 38.9% 10.4% 35.4% 0.5%
CT 3.4% 24.1% 38.1% 21.8% 58.2% 2.0%
DE 1.9% 3.9% 6.1% 22.6% 62.3% 0.0%
DC 3.0% 16.4% 21.1% 6.7% 80.1% 0.5%
FL 2.9% 17.2% 41.4% 19.7% 46.1% 0.8%
GA 1.6% 22.8% 33.1% 24.6% 73.8% 1.1%
IL 3.9% 19.5% 38.2% 27.9% 35.7% 1.4%
IN 1.9% 14.3% 47.6% 1.8% 45.4% 1.4%
KS 4.2% 21.1% 28.9% 26.3% 57.4% 1.1%
KY 2.2% 6.0% 41.8% 4.6% 64.0% 0.2%
LA 1.4% 7.3% 34.3% 34.8% 64.1% 0.2%
ME 2.6% 19.0% 14.9% 11.5% 41.5% 1.0%
MA 3.8% 19.4% 23.2% 29.6% 55.6% 0.8%
MI 3.0% 18.6% 35.5% 23.4% 50.9% 1.4%
MN 5.5% 22.3% 33.8% 22.3% 49.6% 0.5%
MO 2.0% 18.6% 21.9% 32.1% 65.8% 2.3%
NE 1.5% 35.4% 44.4% 36.1% 69.3% 5.4%
NV 8.1% 17.6% 30.9% 31.2% 52.8% 0.8%
NY 6.4% 18.5% 22.7% 23.3% 42.5% 1.0%
NC 1.8% 11.5% 42.0% 15.7% 56.4% 1.0%
OH 4.9% 23.3% 40.9% 11.9% 47.1% 1.5%
OK 2.0% 13.2% 31.4% 17.0% 60.5% 0.5%
OR 8.0% 13.7% 29.9% 10.1% 45.8% 0.2%
PA 3.2% 14.6% 30.7% 8.5% 45.1% 1.2%
RI 2.7% 22.7% 29.0% 16.4% 60.0% 0.9%
SC 1.4% 12.1% 17.2% 21.7% 41.0% 8.0%
TN 0.9% 8.0% 17.1% 23.2% 66.0% 0.5%
UT 2.6% 15.2% 36.2% 23.4% 58.5% 1.3%
VT 4.9% 23.4% 34.1% 4.9% 50.3% 3.9%
VA 0.8% 16.2% 32.5% 35.9% 65.1% 1.5%
WI 4.4% 23.0% 44.9% 6.9% 21.6% 0.5%
WY 4.6% 32.7% 35.0% 20.3% 64.7% 0.7%
Total 3.4% 18.8% 32.8% 19.1% 53.8% 1.3%
ºResponse options changed in 2017-18, “family” and “friends” are now captured as separate categories ∞Categories are not mutually exclusive

Appendices | 85
Table D35. How many times did you go out to a restaurant or coffee shop in the past month?
State 0 times 1-2 times 3-4 times More than 5
times N
AL 7.7% 30.1% 49.3% 12.8% 375
AZ 25.6% 30.1% 17.8% 26.4% 488
AR 9.0% 21.2% 25.7% 44.1% 401
CA 15.2% 32.0% 26.7% 26.2% 8,180
CO 11.1% 29.6% 27.1% 32.2% 395
CT 11.4% 33.5% 33.5% 21.6% 352
DE 21.5% 35.7% 30.0% 12.8% 367
DC 13.2% 37.0% 31.6% 18.1% 408
FL 11.1% 32.6% 29.3% 27.0% 926
GA 8.0% 37.9% 36.4% 17.7% 451
IL 11.5% 38.8% 27.5% 22.2% 356
IN 10.2% 14.9% 26.8% 48.1% 727
KS 12.5% 28.6% 39.3% 19.6% 377
KY 6.5% 25.3% 58.3% 9.9% 415
LA 16.9% 34.3% 27.5% 21.3% 432
ME 15.0% 28.7% 24.1% 32.2% 394
MA 9.2% 25.4% 29.2% 36.2% 401
MI 14.8% 30.5% 28.4% 26.2% 633
MN 12.0% 31.3% 31.1% 25.6% 383
MO 11.9% 28.0% 26.3% 33.8% 396
NE 8.7% 28.8% 28.1% 34.4% 413
NV 16.2% 36.4% 22.6% 24.8% 371
NY 17.6% 33.3% 23.0% 26.1% 499
NC 10.4% 25.6% 24.8% 39.1% 616
OH 9.3% 29.3% 26.3% 35.1% 752
OK 10.1% 18.4% 23.2% 48.4% 397
OR 11.9% 22.3% 27.3% 38.5% 421
PA 11.5% 36.8% 27.9% 23.8% 660
RI 7.0% 23.1% 26.3% 43.6% 342
SC 19.1% 36.9% 24.6% 19.4% 439
TN 10.2% 26.7% 28.3% 34.8% 420
UT 15.2% 32.8% 20.4% 31.5% 387
VT 10.2% 26.7% 23.5% 39.7% 315
VA 9.3% 26.4% 24.8% 39.5% 803
WI 21.2% 32.4% 23.5% 22.9% 944
WY 7.7% 25.9% 31.3% 35.1% 313
Total 12.5% 29.6% 28.7% 29.2% 24,949

Appendices | 86
Table D36. Who did you usually go with when you went to restaurants or coffee shops? º ∞
State Alone Friends Family Housemates Staff Other N
AL 0.8% 26.3% 39.4% 35.9% 71.0% 12.6% 373
AZ 1.2% 13.8% 53.6% 8.8% 35.3% 0.8% 487
AR 3.0% 32.9% 50.1% 7.7% 72.8% 0.0% 401
CA 11.3% 19.9% 49.4% 19.3% 39.6% 1.4% 8,240
CO 10.6% 26.3% 54.7% 12.2% 44.8% 0.3% 395
CT 6.9% 21.5% 44.1% 18.6% 59.3% 1.1% 349
DE 1.1% 2.8% 10.2% 31.5% 70.7% 0.8% 362
DC 4.9% 13.3% 25.8% 6.4% 70.8% 0.5% 407
FL 2.8% 19.5% 51.8% 22.6% 52.7% 0.9% 920
GA 0.9% 21.6% 41.1% 25.8% 84.0% 2.7% 450
IL 7.1% 23.2% 53.0% 29.7% 39.4% 0.6% 353
IN 4.0% 13.3% 66.5% 2.5% 55.6% 1.7% 723
KS 2.1% 17.8% 39.0% 26.5% 58.6% 0.8% 377
KY 1.7% 7.5% 45.8% 5.1% 65.9% 0.2% 413
LA 2.1% 8.7% 37.5% 29.7% 63.2% 0.2% 427
ME 5.3% 21.6% 27.4% 14.2% 61.2% 1.5% 394
MA 7.5% 18.8% 32.3% 33.1% 64.7% 0.3% 399
MI 4.1% 18.6% 45.4% 22.7% 54.6% 0.6% 630
MN 7.8% 20.1% 47.0% 24.5% 58.0% 0.5% 383
MO 2.0% 17.3% 29.4% 34.5% 76.1% 1.0% 394
NE 6.3% 28.8% 50.8% 37.3% 67.8% 2.9% 413
NV 10.4% 14.7% 40.1% 30.5% 50.4% 0.5% 367
NY 12.0% 17.0% 38.5% 27.5% 48.9% 2.4% 499
NC 2.1% 11.2% 53.6% 16.9% 66.6% 1.3% 616
OH 5.5% 20.0% 51.9% 12.6% 51.5% 1.1% 746
OK 2.5% 11.6% 38.3% 18.4% 63.0% 1.0% 397
OR 13.1% 18.9% 38.9% 12.4% 59.4% 1.0% 419
PA 3.7% 14.3% 40.2% 9.1% 51.1% 0.6% 657
RI 5.6% 28.6% 44.0% 19.2% 72.9% 0.9% 339
SC 2.3% 11.2% 29.2% 28.2% 51.3% 5.0% 439
TN 1.0% 7.4% 26.0% 26.0% 75.4% 1.0% 419
UT 3.1% 11.4% 41.0% 20.0% 58.7% 0.8% 385
VT 5.1% 20.6% 43.2% 5.7% 61.6% 4.1% 315
VA 1.3% 14.9% 43.6% 38.8% 70.0% 1.0% 800
WI 6.3% 21.6% 56.7% 6.6% 24.2% 0.4% 944
WY 8.7% 28.0% 41.5% 22.8% 72.7% 1.0% 311
Total 4.9% 17.9% 42.2% 20.7% 59.5% 1.5% 24,943
ºResponse options changed in 2017-18, “family” and “friends” are now captured as separate categories ∞Categories are not mutually exclusive
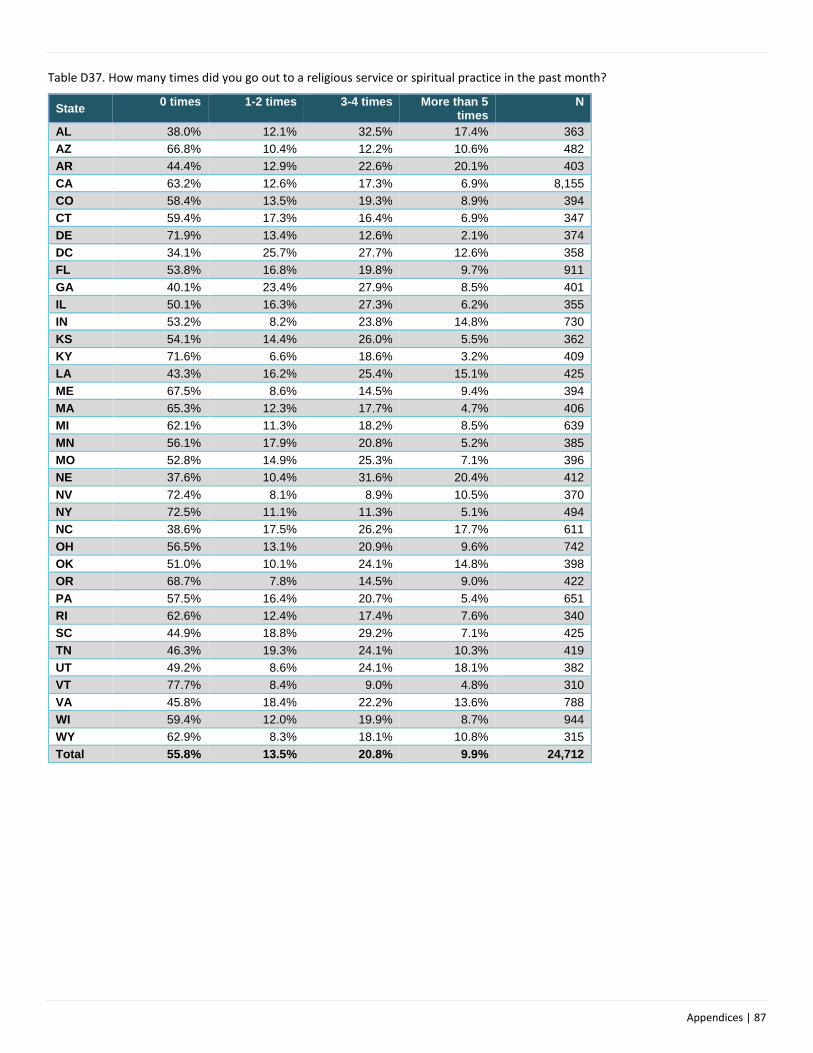
Appendices | 87
Table D37. How many times did you go out to a religious service or spiritual practice in the past month?
State 0 times 1-2 times 3-4 times More than 5
times N
AL 38.0% 12.1% 32.5% 17.4% 363
AZ 66.8% 10.4% 12.2% 10.6% 482
AR 44.4% 12.9% 22.6% 20.1% 403
CA 63.2% 12.6% 17.3% 6.9% 8,155
CO 58.4% 13.5% 19.3% 8.9% 394
CT 59.4% 17.3% 16.4% 6.9% 347
DE 71.9% 13.4% 12.6% 2.1% 374
DC 34.1% 25.7% 27.7% 12.6% 358
FL 53.8% 16.8% 19.8% 9.7% 911
GA 40.1% 23.4% 27.9% 8.5% 401
IL 50.1% 16.3% 27.3% 6.2% 355
IN 53.2% 8.2% 23.8% 14.8% 730
KS 54.1% 14.4% 26.0% 5.5% 362
KY 71.6% 6.6% 18.6% 3.2% 409
LA 43.3% 16.2% 25.4% 15.1% 425
ME 67.5% 8.6% 14.5% 9.4% 394
MA 65.3% 12.3% 17.7% 4.7% 406
MI 62.1% 11.3% 18.2% 8.5% 639
MN 56.1% 17.9% 20.8% 5.2% 385
MO 52.8% 14.9% 25.3% 7.1% 396
NE 37.6% 10.4% 31.6% 20.4% 412
NV 72.4% 8.1% 8.9% 10.5% 370
NY 72.5% 11.1% 11.3% 5.1% 494
NC 38.6% 17.5% 26.2% 17.7% 611
OH 56.5% 13.1% 20.9% 9.6% 742
OK 51.0% 10.1% 24.1% 14.8% 398
OR 68.7% 7.8% 14.5% 9.0% 422
PA 57.5% 16.4% 20.7% 5.4% 651
RI 62.6% 12.4% 17.4% 7.6% 340
SC 44.9% 18.8% 29.2% 7.1% 425
TN 46.3% 19.3% 24.1% 10.3% 419
UT 49.2% 8.6% 24.1% 18.1% 382
VT 77.7% 8.4% 9.0% 4.8% 310
VA 45.8% 18.4% 22.2% 13.6% 788
WI 59.4% 12.0% 19.9% 8.7% 944
WY 62.9% 8.3% 18.1% 10.8% 315
Total 55.8% 13.5% 20.8% 9.9% 24,712

Appendices | 88
Table D38. Who did you usually go with to religious/spiritual practices? º ∞
State Alone Friends Family Housemates Staff Other N
AL 3.9% 4.2% 35.2% 8.0% 23.8% 1.4% 361
AZ 1.7% 2.9% 25.5% 2.5% 7.1% 0.0% 482
AR 3.5% 18.9% 28.9% 1.7% 29.1% 0.2% 402
CA 4.4% 6.0% 24.4% 4.1% 7.5% 0.4% 8,250
CO 3.6% 8.9% 23.2% 6.4% 15.3% 0.5% 392
CT 2.3% 4.9% 22.6% 5.5% 13.6% 0.9% 345
DE 2.4% 0.5% 4.3% 6.2% 18.9% 0.3% 371
DC 5.3% 10.1% 24.9% 5.3% 41.7% 0.3% 357
FL 3.0% 6.5% 30.5% 8.5% 14.4% 1.0% 909
GA 2.0% 4.0% 34.1% 11.3% 25.3% 0.5% 399
IL 1.1% 9.6% 34.0% 4.8% 8.5% 0.6% 353
IN 3.7% 4.9% 36.2% 0.4% 8.5% 1.1% 729
KS 4.4% 7.2% 23.2% 8.0% 19.1% 0.3% 362
KY 1.5% 1.5% 14.5% 3.2% 13.5% 0.2% 408
LA 2.1% 2.8% 29.0% 17.9% 36.6% 0.0% 424
ME 5.1% 8.6% 14.5% 1.5% 10.7% 0.0% 394
MA 2.5% 3.0% 17.5% 4.3% 14.3% 0.3% 400
MI 3.0% 6.0% 21.7% 7.2% 12.9% 0.9% 637
MN 4.9% 4.9% 23.9% 7.8% 17.9% 0.3% 385
MO 3.3% 8.1% 18.2% 10.9% 25.3% 1.0% 396
NE 2.4% 11.7% 38.6% 13.8% 24.3% 14.8% 412
NV 6.5% 3.0% 12.5% 0.8% 7.6% 1.1% 369
NY 3.9% 3.9% 16.7% 5.3% 9.1% 0.2% 492
NC 1.6% 5.7% 38.4% 11.5% 26.4% 0.3% 610
OH 2.7% 7.6% 27.2% 3.4% 12.0% 0.1% 740
OK 2.3% 5.8% 23.6% 6.0% 23.6% 1.0% 398
OR 6.4% 8.3% 15.2% 1.9% 8.8% 0.2% 422
PA 2.5% 5.4% 23.4% 2.8% 14.3% 0.8% 645
RI 2.9% 4.4% 22.9% 3.5% 10.3% 0.3% 340
SC 3.3% 7.8% 24.1% 9.2% 20.8% 2.1% 424
TN 1.4% 2.2% 24.5% 8.9% 33.1% 0.2% 417
UT 3.7% 6.5% 33.5% 3.4% 16.8% 0.8% 382
VT 2.3% 3.2% 12.6% 0.0% 6.1% 0.6% 310
VA 1.4% 8.4% 25.4% 16.0% 28.9% 1.0% 788
WI 4.2% 7.9% 29.2% 2.3% 5.6% 0.6% 944
WY 4.8% 8.9% 21.3% 1.6% 11.5% 0.3% 314
Total 3.2% 6.2% 24.3% 6.0% 17.3% 1.0% 24,763
ºResponse options changed in 2017-18, “family” and “friends” are now captured as separate categories ∞Categories are not mutually exclusive

Appendices | 89
Table D39. Do you participate as a member of community groups in your community?
State Yes No N
AL 16.9% 83.1% 373
AZ 33.1% 66.9% 486
AR 36.6% 63.4% 399
CA 20.8% 79.2% 8,173
CO 28.3% 71.7% 396
CT 51.1% 48.9% 354
DE 6.1% 93.9% 376
DC 25.0% 75.0% 400
FL 45.4% 54.6% 933
GA 46.3% 53.7% 447
IL 44.4% 55.6% 356
IN 34.0% 66.0% 729
KS 47.3% 52.7% 368
KY 6.6% 93.4% 409
LA 26.6% 73.4% 425
ME 24.7% 75.3% 385
MA 35.3% 64.7% 397
MI 31.3% 68.7% 636
MN 42.5% 57.5% 386
MO 34.0% 66.0% 397
NE 42.6% 57.4% 413
NV 30.5% 69.5% 380
NY 24.6% 75.4% 501
NC 42.7% 57.3% 613
OH 34.1% 65.9% 744
OK 30.4% 69.6% 398
OR 31.2% 68.8% 423
PA 40.7% 59.3% 646
RI 35.6% 64.4% 334
SC 44.7% 55.3% 438
TN 29.3% 70.7% 426
UT 47.3% 52.7% 387
VT 40.1% 59.9% 304
VA 44.0% 56.0% 789
WI 35.3% 64.7% 937
WY 31.4% 68.6% 312
Total 33.9% 66.1% 24,870
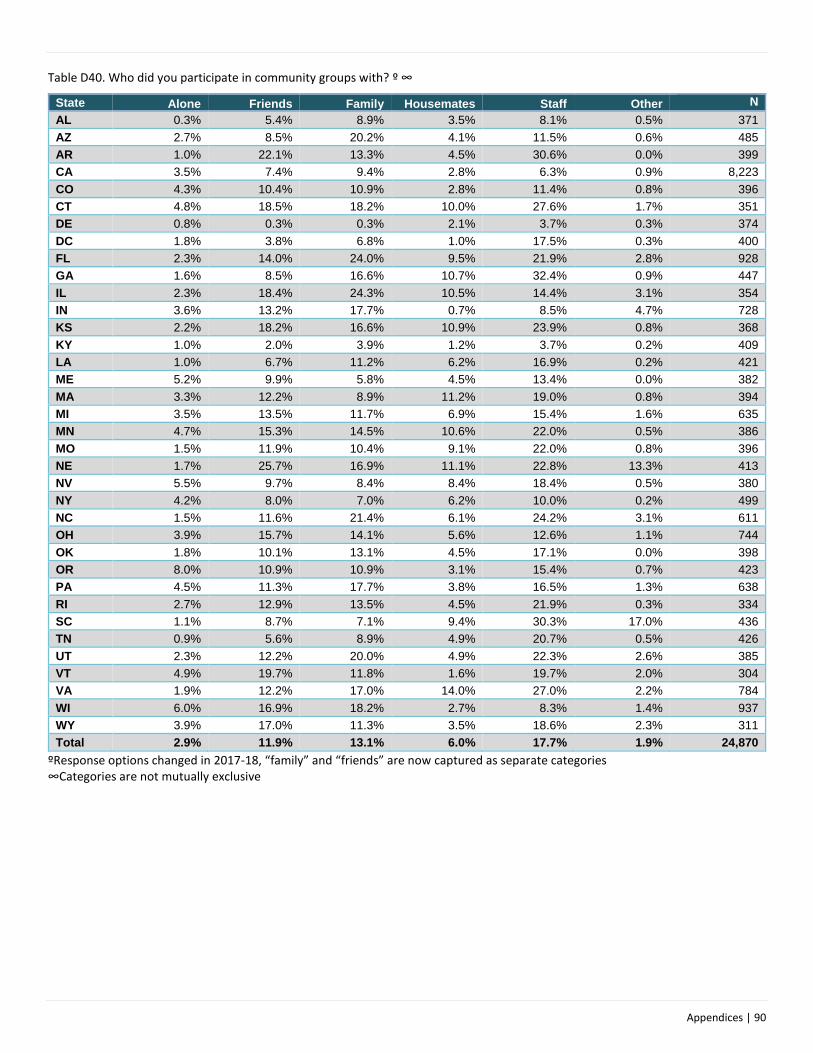
Appendices | 90
Table D40. Who did you participate in community groups with? º ∞
State Alone Friends Family Housemates Staff Other N
AL 0.3% 5.4% 8.9% 3.5% 8.1% 0.5% 371
AZ 2.7% 8.5% 20.2% 4.1% 11.5% 0.6% 485
AR 1.0% 22.1% 13.3% 4.5% 30.6% 0.0% 399
CA 3.5% 7.4% 9.4% 2.8% 6.3% 0.9% 8,223
CO 4.3% 10.4% 10.9% 2.8% 11.4% 0.8% 396
CT 4.8% 18.5% 18.2% 10.0% 27.6% 1.7% 351
DE 0.8% 0.3% 0.3% 2.1% 3.7% 0.3% 374
DC 1.8% 3.8% 6.8% 1.0% 17.5% 0.3% 400
FL 2.3% 14.0% 24.0% 9.5% 21.9% 2.8% 928
GA 1.6% 8.5% 16.6% 10.7% 32.4% 0.9% 447
IL 2.3% 18.4% 24.3% 10.5% 14.4% 3.1% 354
IN 3.6% 13.2% 17.7% 0.7% 8.5% 4.7% 728
KS 2.2% 18.2% 16.6% 10.9% 23.9% 0.8% 368
KY 1.0% 2.0% 3.9% 1.2% 3.7% 0.2% 409
LA 1.0% 6.7% 11.2% 6.2% 16.9% 0.2% 421
ME 5.2% 9.9% 5.8% 4.5% 13.4% 0.0% 382
MA 3.3% 12.2% 8.9% 11.2% 19.0% 0.8% 394
MI 3.5% 13.5% 11.7% 6.9% 15.4% 1.6% 635
MN 4.7% 15.3% 14.5% 10.6% 22.0% 0.5% 386
MO 1.5% 11.9% 10.4% 9.1% 22.0% 0.8% 396
NE 1.7% 25.7% 16.9% 11.1% 22.8% 13.3% 413
NV 5.5% 9.7% 8.4% 8.4% 18.4% 0.5% 380
NY 4.2% 8.0% 7.0% 6.2% 10.0% 0.2% 499
NC 1.5% 11.6% 21.4% 6.1% 24.2% 3.1% 611
OH 3.9% 15.7% 14.1% 5.6% 12.6% 1.1% 744
OK 1.8% 10.1% 13.1% 4.5% 17.1% 0.0% 398
OR 8.0% 10.9% 10.9% 3.1% 15.4% 0.7% 423
PA 4.5% 11.3% 17.7% 3.8% 16.5% 1.3% 638
RI 2.7% 12.9% 13.5% 4.5% 21.9% 0.3% 334
SC 1.1% 8.7% 7.1% 9.4% 30.3% 17.0% 436
TN 0.9% 5.6% 8.9% 4.9% 20.7% 0.5% 426
UT 2.3% 12.2% 20.0% 4.9% 22.3% 2.6% 385
VT 4.9% 19.7% 11.8% 1.6% 19.7% 2.0% 304
VA 1.9% 12.2% 17.0% 14.0% 27.0% 2.2% 784
WI 6.0% 16.9% 18.2% 2.7% 8.3% 1.4% 937
WY 3.9% 17.0% 11.3% 3.5% 18.6% 2.3% 311
Total 2.9% 11.9% 13.1% 6.0% 17.7% 1.9% 24,870
ºResponse options changed in 2017-18, “family” and “friends” are now captured as separate categories ∞Categories are not mutually exclusive

Appendices | 91
Table D41. In the past year, did you go away on vacation?
State Yes No N
AL 43.3% 56.7% 363
AZ 42.8% 57.2% 481
AR 50.6% 49.4% 403
CA 42.3% 57.7% 8,195
CO 55.6% 44.4% 392
CT 56.2% 43.8% 354
DE 40.5% 59.5% 368
DC 79.2% 20.8% 389
FL 43.3% 56.7% 923
GA 35.1% 64.9% 425
IL 46.0% 54.0% 352
IN 49.3% 50.7% 728
KS 36.0% 64.0% 375
KY 21.7% 78.3% 411
LA 34.8% 65.2% 422
ME 44.4% 55.6% 390
MA 52.5% 47.5% 400
MI 40.8% 59.2% 640
MN 50.4% 49.6% 383
MO 41.3% 58.7% 395
NE 50.2% 49.8% 416
NV 42.7% 57.3% 379
NY 48.4% 51.6% 498
NC 57.4% 42.6% 610
OH 49.3% 50.7% 748
OK 43.0% 57.0% 395
OR 57.4% 42.6% 420
PA 42.5% 57.5% 651
RI 44.4% 55.6% 340
SC 50.3% 49.7% 429
TN 30.4% 69.6% 428
UT 57.3% 42.7% 386
VT 61.0% 39.0% 315
VA 53.9% 46.1% 788
WI 43.4% 56.6% 949
WY 57.1% 42.9% 315
Total 47.1% 52.9% 24,856

Appendices | 92
Table D42. Who did you usually go on vacation with? º ∞
State Alone Friends Family Housemates Staff Other N
AL 0.0% 3.6% 28.6% 8.9% 13.9% 3.9% 360
AZ 0.4% 3.5% 37.1% 1.9% 5.4% 0.4% 480
AR 0.0% 7.5% 38.2% 0.5% 15.2% 0.5% 401
CA 1.8% 5.4% 32.1% 3.4% 6.8% 0.8% 8,225
CO 2.6% 6.9% 40.3% 3.1% 12.8% 0.8% 392
CT 1.7% 8.2% 36.3% 6.2% 17.3% 1.7% 353
DE 1.6% 2.7% 18.3% 3.3% 17.5% 1.4% 366
DC 0.5% 12.3% 22.1% 6.9% 59.1% 0.0% 389
FL 0.2% 3.6% 32.9% 7.1% 8.9% 0.4% 919
GA 0.5% 1.2% 24.6% 4.5% 10.9% 0.0% 423
IL 1.1% 5.7% 36.2% 2.6% 4.3% 0.6% 351
IN 1.2% 3.7% 42.5% 0.1% 5.2% 0.6% 725
KS 0.3% 6.4% 26.1% 1.9% 7.2% 0.3% 375
KY 0.2% 1.7% 14.1% 0.7% 9.0% 0.0% 410
LA 0.2% 1.2% 28.1% 4.5% 9.0% 0.0% 420
ME 1.6% 8.6% 20.3% 5.2% 20.3% 0.3% 384
MA 1.0% 8.8% 29.0% 9.1% 21.7% 1.0% 397
MI 0.9% 5.5% 31.7% 4.5% 6.7% 1.6% 638
MN 2.3% 7.0% 32.6% 6.3% 13.8% 2.3% 383
MO 0.8% 9.6% 22.3% 8.4% 15.7% 1.5% 394
NE 1.2% 9.4% 36.1% 7.9% 18.0% 1.9% 416
NV 3.7% 5.0% 30.0% 4.5% 6.6% 0.8% 377
NY 2.8% 5.6% 28.7% 8.4% 13.9% 1.6% 498
NC 0.7% 4.8% 45.4% 5.1% 15.3% 0.5% 608
OH 1.3% 5.5% 34.8% 3.6% 12.0% 0.5% 748
OK 0.5% 4.8% 27.7% 2.3% 14.2% 1.0% 394
OR 4.1% 4.6% 38.0% 5.5% 19.5% 0.7% 416
PA 0.9% 4.3% 28.8% 2.8% 10.2% 0.9% 645
RI 2.1% 4.7% 34.2% 2.1% 7.4% 0.3% 339
SC 0.0% 4.0% 35.0% 7.7% 14.3% 2.6% 428
TN 0.5% 1.6% 20.6% 3.0% 10.1% 0.7% 427
UT 0.3% 6.8% 43.5% 4.2% 14.1% 1.0% 384
VT 5.1% 11.5% 35.4% 2.2% 22.9% 2.9% 314
VA 1.4% 5.9% 31.8% 13.0% 23.2% 1.0% 786
WI 2.4% 5.5% 34.0% 0.9% 5.1% 1.2% 949
WY 1.9% 10.8% 39.8% 4.1% 17.5% 1.9% 314
Total 1.3% 5.8% 31.6% 4.6% 14.0% 1.0% 24,828
ºResponse options changed in 2017-18, “family” and “friends” are now captured as separate categories ∞Categories are not mutually exclusive

Appendices | 93
Table D43. Are you able to go out and do the things you like to do?
State Yes In-between No N
AL 76.2% 18.9% 5.0% 323
AZ 84.1% 11.3% 4.5% 309
AR 92.5% 6.6% 0.9% 333
CA 82.2% 14.4% 3.4% 5,129
CO 79.7% 15.6% 4.7% 276
CT 88.3% 11.0% 0.7% 282
DE 84.2% 11.5% 4.3% 234
DC 71.4% 25.9% 2.7% 185
FL 83.8% 15.0% 1.2% 592
GA 88.9% 9.6% 1.5% 271
IL 82.6% 15.4% 1.9% 259
IN 93.4% 5.0% 1.6% 580
KS 84.5% 13.6% 1.9% 264
KY 95.0% 5.0% 0.0% 281
LA 88.6% 8.0% 3.5% 289
ME 79.6% 17.6% 2.8% 323
MA 85.9% 11.5% 2.6% 312
MI 83.8% 13.8% 2.5% 407
MN 85.8% 11.1% 3.0% 296
MO 88.6% 9.8% 1.5% 264
NE 79.1% 18.6% 2.3% 306
NV 80.5% 12.3% 7.1% 308
NY 80.3% 16.5% 3.2% 310
NC 86.7% 11.4% 1.8% 332
OH 86.3% 10.8% 2.9% 554
OK 83.5% 11.0% 5.5% 254
OR 83.9% 13.0% 3.1% 292
PA 91.4% 7.2% 1.4% 431
RI 86.9% 10.5% 2.5% 275
SC 94.1% 3.6% 2.3% 387
TN 93.9% 4.6% 1.5% 327
UT 82.1% 16.3% 1.6% 251
VT 87.5% 10.1% 2.3% 257
VA 87.7% 10.5% 1.8% 488
WI 71.5% 20.6% 8.0% 613
WY 82.4% 14.3% 3.3% 210
Total 84.9% 12.3% 2.8% 16,804

Appendices | 94
Table D44. Do you get to do the things you like to do as much as you want to?
State Yes No N
AL 50.7% 49.3% 304
AZ 82.0% 18.0% 284
AR 81.2% 18.8% 329
CA 81.8% 18.2% 4,734
CO 73.5% 26.5% 253
CT 78.9% 21.1% 270
DE 73.1% 26.9% 216
DC 75.4% 24.6% 179
FL 82.6% 17.4% 558
GA 88.9% 11.1% 261
IL 79.0% 21.0% 252
IN 86.9% 13.1% 543
KS 79.1% 20.9% 249
KY 96.1% 3.9% 280
LA 79.8% 20.2% 277
ME 68.8% 31.2% 301
MA 79.6% 20.4% 285
MI 74.4% 25.6% 386
MN 73.6% 26.4% 276
MO 83.5% 16.5% 255
NE 64.7% 35.3% 272
NV 71.2% 28.8% 278
NY 73.7% 26.3% 293
NC 73.3% 26.7% 315
OH 78.5% 21.5% 516
OK 77.4% 22.6% 234
OR 67.8% 32.2% 276
PA 89.0% 11.0% 400
RI 78.3% 21.7% 254
SC 91.1% 8.9% 370
TN 90.0% 10.0% 319
UT 79.9% 20.1% 234
VT 69.3% 30.7% 244
VA 74.5% 25.5% 459
WI 70.0% 30.0% 553
WY 73.0% 27.0% 196
Total 77.5% 22.5% 15,705

Appendices | 95
Table D45. When you are at home, do you have enough things you like to do?
State Yes In the middle No N
AL 78.6% 18.0% 3.4% 323
AZ 82.4% 14.1% 3.4% 319
AR 85.2% 10.2% 4.5% 332
CA 84.0% 11.8% 4.2% 5,221
CO 80.5% 12.8% 6.7% 282
CT 83.8% 8.6% 7.6% 278
DE 58.1% 17.0% 24.9% 241
DC 85.9% 10.3% 3.8% 185
FL 88.6% 8.6% 2.7% 590
GA 85.4% 12.8% 1.8% 274
IL 88.9% 5.7% 5.4% 261
IN 91.9% 5.4% 2.8% 579
KS 81.8% 9.1% 9.1% 264
KY 94.6% 5.0% 0.4% 280
LA 85.0% 8.7% 6.3% 286
ME 62.9% 26.4% 10.7% 318
MA 88.3% 8.8% 2.9% 307
MI 82.6% 13.0% 4.4% 409
MN 89.5% 6.8% 3.7% 296
MO 83.5% 12.6% 3.8% 261
NE 73.0% 22.4% 4.6% 304
NV 72.4% 15.6% 12.0% 308
NY 84.7% 8.0% 7.3% 327
NC 85.3% 9.1% 5.6% 339
OH 86.5% 8.7% 4.8% 561
OK 71.7% 16.7% 11.6% 258
OR 75.9% 15.9% 8.1% 295
PA 91.0% 5.3% 3.7% 434
RI 82.1% 14.2% 3.6% 274
SC 92.2% 3.9% 3.9% 385
TN 92.1% 3.0% 4.9% 328
UT 82.1% 11.1% 6.7% 252
VT 79.8% 12.6% 7.6% 262
VA 90.3% 7.8% 1.8% 487
WI 78.8% 15.3% 5.8% 633
WY 84.9% 13.2% 1.9% 212
Total 82.9% 11.4% 5.7% 16,965

Appendices | 96
Relationships (un-collapsed and un-weighted)
Table D46. Do you have friends you like to talk to or do things with?
State
Yes, has friends who are not staff
or family
Yes, all friends ar
estaff or family or
cannot determine
No, does not have friends
N
AL 88.6% 4.6% 6.8% 325
AZ 61.5% 24.3% 14.2% 325
AR 91.8% 6.4% 1.8% 330
CA 73.4% 12.6% 13.9% 5,257
CO 82.4% 9.5% 8.1% 284
CT 74.0% 18.5% 7.5% 281
DE 77.6% 10.2% 12.2% 245
DC 62.2% 33.5% 4.3% 185
FL 81.2% 11.5% 7.4% 584
GA 82.4% 13.6% 4.0% 272
IL 79.6% 14.7% 5.7% 265
IN 83.4% 6.5% 10.1% 585
KS 80.2% 14.0% 5.8% 257
KY 62.1% 34.8% 3.2% 282
LA 80.0% 9.3% 10.7% 290
ME 87.5% 7.6% 4.9% 327
MA 83.5% 7.1% 9.4% 310
MI 80.3% 8.5% 11.2% 412
MN 79.8% 11.3% 8.9% 292
MO 85.3% 8.6% 6.0% 266
NE 74.1% 23.5% 2.5% 324
NV 67.3% 13.5% 19.2% 312
NY 71.3% 13.1% 15.6% 327
NC 74.0% 14.9% 11.0% 335
OH 86.9% 6.4% 6.7% 564
OK 78.8% 15.1% 6.2% 259
OR 74.8% 10.3% 14.8% 310
PA 78.4% 13.3% 8.3% 435
RI 81.1% 13.5% 5.5% 275
SC 88.7% 7.2% 4.1% 390
TN 80.7% 10.8% 8.4% 332
UT 78.8% 12.5% 8.6% 255
VT 83.5% 11.4% 5.1% 255
VA 84.1% 9.8% 6.1% 490
WI 78.3% 9.6% 12.1% 636
WY 83.0% 10.4% 6.6% 212
Total 78.9% 12.8% 8.2% 17,085

Appendices | 97
Table D47. Do you have a best friend, or someone you are really close to?
State Yes No N
AL 82.3% 17.7% 322
AZ 61.8% 38.2% 309
AR 85.7% 14.3% 329
CA 67.2% 32.8% 5,065
CO 72.4% 27.6% 275
CT 71.3% 28.7% 268
DE 71.4% 28.6% 238
DC 81.0% 19.0% 184
FL 75.9% 24.1% 535
GA 70.6% 29.4% 255
IL 73.0% 27.0% 256
IN 66.0% 34.0% 565
KS 78.3% 21.7% 240
KY 50.0% 50.0% 278
LA 71.7% 28.3% 286
ME 79.0% 21.0% 309
MA 70.6% 29.4% 296
MI 71.9% 28.1% 402
MN 73.0% 27.0% 285
MO 76.0% 24.0% 254
NE 79.6% 20.4% 285
NV 65.1% 34.9% 301
NY 60.0% 40.0% 325
NC 72.9% 27.1% 321
OH 78.1% 21.9% 530
OK 83.4% 16.6% 247
OR 69.1% 30.9% 298
PA 72.0% 28.0% 404
RI 76.2% 23.8% 260
SC 86.3% 13.7% 388
TN 69.3% 30.7% 323
UT 76.9% 23.1% 247
VT 76.0% 24.0% 250
VA 79.8% 20.2% 465
WI 69.8% 30.2% 615
WY 75.2% 24.8% 202
Total 73.3% 26.7% 16,412

Appendices | 98
Table D48. Do you want more help to make or keep in contact with your friends?
State Yes Maybe No N
AL 50.0% 22.5% 27.5% 324
AZ 28.5% 5.8% 65.7% 312
AR 18.2% 5.8% 76.0% 329
CA 29.5% 9.2% 61.3% 4,954
CO 34.7% 11.6% 53.7% 268
CT 46.3% 5.5% 48.2% 272
DE 62.9% 1.2% 35.9% 248
DC 44.3% 12.4% 43.2% 185
FL 31.0% 8.1% 60.9% 565
GA 21.8% 18.0% 60.2% 266
IL 37.6% 10.1% 52.3% 258
IN 25.7% 1.8% 72.5% 557
KS 29.2% 5.9% 64.8% 253
KY 11.5% 5.8% 82.7% 278
LA 31.0% 7.8% 61.2% 281
ME 44.6% 10.2% 45.2% 294
MA 48.6% 7.9% 43.5% 292
MI 36.2% 12.9% 50.9% 395
MN 35.3% 6.0% 58.7% 283
MO 30.3% 8.6% 61.1% 244
NE 35.2% 17.8% 47.0% 287
NV 54.5% 8.3% 37.2% 301
NY 34.4% 7.5% 58.1% 320
NC 42.3% 7.8% 49.8% 319
OH 34.7% 5.9% 59.4% 544
OK 61.2% 5.0% 33.9% 242
OR 53.8% 4.9% 41.3% 286
PA 27.6% 4.6% 67.8% 395
RI 48.3% 6.7% 45.0% 269
SC 28.2% 1.0% 70.7% 386
TN 28.6% 6.8% 64.6% 325
UT 46.3% 5.8% 47.9% 240
VT 45.5% 4.9% 49.6% 246
VA 33.6% 10.3% 56.1% 456
WI 29.0% 9.5% 61.5% 600
WY 33.2% 11.1% 55.8% 208
Total 37.0% 8.2% 54.8% 16,282
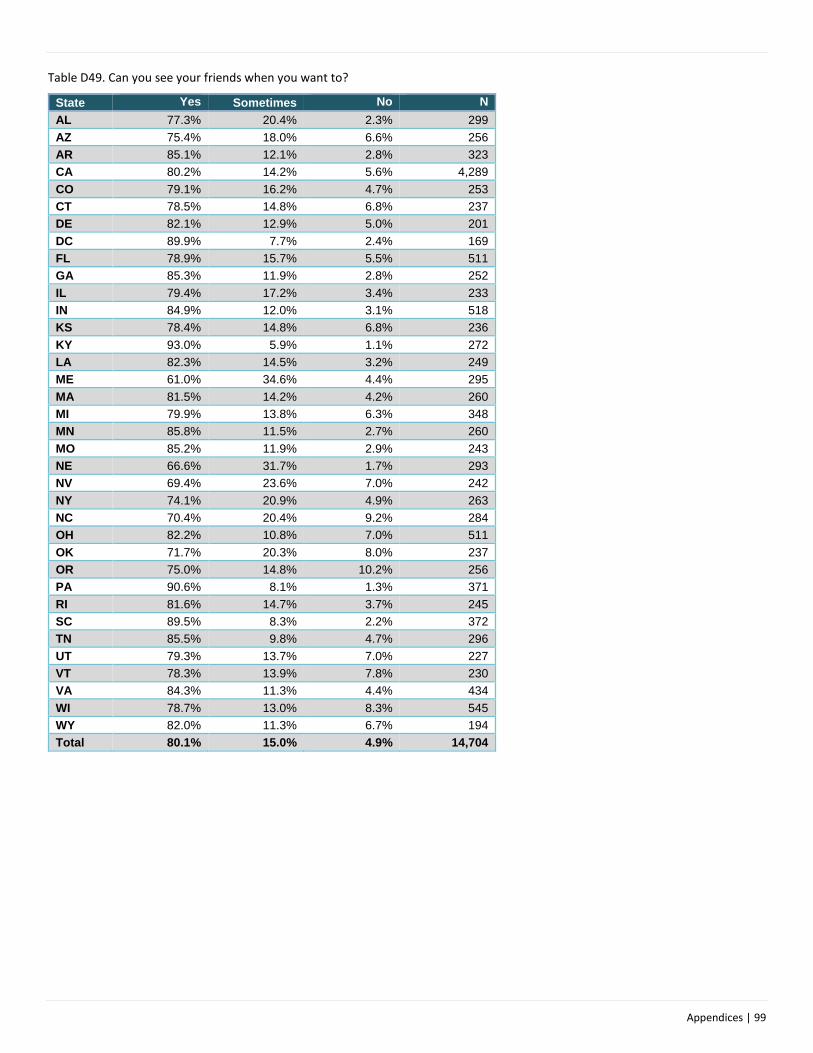
Appendices | 99
Table D49. Can you see your friends when you want to?
State Yes Sometimes No N
AL 77.3% 20.4% 2.3% 299
AZ 75.4% 18.0% 6.6% 256
AR 85.1% 12.1% 2.8% 323
CA 80.2% 14.2% 5.6% 4,289
CO 79.1% 16.2% 4.7% 253
CT 78.5% 14.8% 6.8% 237
DE 82.1% 12.9% 5.0% 201
DC 89.9% 7.7% 2.4% 169
FL 78.9% 15.7% 5.5% 511
GA 85.3% 11.9% 2.8% 252
IL 79.4% 17.2% 3.4% 233
IN 84.9% 12.0% 3.1% 518
KS 78.4% 14.8% 6.8% 236
KY 93.0% 5.9% 1.1% 272
LA 82.3% 14.5% 3.2% 249
ME 61.0% 34.6% 4.4% 295
MA 81.5% 14.2% 4.2% 260
MI 79.9% 13.8% 6.3% 348
MN 85.8% 11.5% 2.7% 260
MO 85.2% 11.9% 2.9% 243
NE 66.6% 31.7% 1.7% 293
NV 69.4% 23.6% 7.0% 242
NY 74.1% 20.9% 4.9% 263
NC 70.4% 20.4% 9.2% 284
OH 82.2% 10.8% 7.0% 511
OK 71.7% 20.3% 8.0% 237
OR 75.0% 14.8% 10.2% 256
PA 90.6% 8.1% 1.3% 371
RI 81.6% 14.7% 3.7% 245
SC 89.5% 8.3% 2.2% 372
TN 85.5% 9.8% 4.7% 296
UT 79.3% 13.7% 7.0% 227
VT 78.3% 13.9% 7.8% 230
VA 84.3% 11.3% 4.4% 434
WI 78.7% 13.0% 8.3% 545
WY 82.0% 11.3% 6.7% 194
Total 80.1% 15.0% 4.9% 14,704

Appendices | 100
Table D50. Do you have other ways of talking, chatting or communicating with your friends when you cannot see them?
State Yes Sometimes No N
AL 78.7% 11.3% 10.0% 301
AZ 75.6% 11.8% 12.6% 262
AR 83.9% 11.2% 5.0% 322
CA 83.7% 4.6% 11.7% 4,266
CO 78.7% 3.9% 17.3% 254
CT 79.0% 6.3% 14.7% 238
DE 89.3% 1.5% 9.2% 196
DC 81.4% 5.1% 13.6% 177
FL 89.8% 5.3% 4.9% 509
GA 83.3% 8.0% 8.8% 251
IL 79.4% 4.3% 16.3% 233
IN 86.6% 1.4% 12.0% 492
KS 89.9% 6.8% 3.4% 237
KY 85.2% 7.4% 7.4% 271
LA 82.2% 4.5% 13.4% 247
ME 75.7% 9.7% 14.6% 288
MA 84.9% 4.3% 10.9% 258
MI 82.0% 4.7% 13.3% 338
MN 85.9% 3.1% 10.9% 256
MO 94.2% 1.7% 4.2% 240
NE 77.0% 10.6% 12.4% 274
NV 83.4% 5.0% 11.6% 241
NY 80.9% 8.1% 11.0% 272
NC 79.8% 3.9% 16.3% 282
OH 84.3% 3.9% 11.7% 511
OK 79.4% 8.0% 12.6% 238
OR 80.9% 4.3% 14.8% 256
PA 85.8% 2.8% 11.4% 359
RI 83.4% 5.3% 11.3% 247
SC 90.6% 1.4% 8.0% 361
TN 73.1% 10.4% 16.5% 297
UT 83.3% 3.9% 12.7% 228
VT 80.0% 5.1% 14.9% 235
VA 82.6% 3.7% 13.7% 432
WI 87.9% 3.7% 8.4% 547
WY 85.3% 7.3% 7.3% 191
Total 83.0% 5.7% 11.4% 14,607

Appendices | 101
Table D51. Can you see and/or communicate with your family when you want to? (among those who do not live in the family home)
State Yes Sometimes No N
AL 67.0% 24.7% 8.2% 194
AZ 85.0% 9.3% 5.6% 107
AR 90.0% 5.7% 4.3% 211
CA 80.5% 12.6% 6.9% 2,724
CO 83.1% 9.3% 7.6% 118
CT 81.2% 14.1% 4.7% 170
DE 84.4% 6.4% 9.2% 218
DC 71.8% 22.7% 5.5% 110
FL 81.7% 14.7% 3.7% 300
GA 77.6% 20.8% 1.6% 125
IL 68.8% 18.8% 12.3% 138
IN 89.7% 2.6% 7.7% 195
KS 82.3% 11.3% 6.5% 186
KY 51.4% 41.2% 7.4% 148
LA 82.0% 11.1% 6.9% 189
ME 73.5% 19.2% 7.3% 245
MA 89.4% 8.3% 2.3% 216
MI 78.8% 15.5% 5.7% 245
MN 90.1% 5.2% 4.7% 191
MO 84.1% 11.9% 4.0% 201
NE 81.4% 15.4% 3.2% 188
NV 77.7% 14.4% 7.9% 229
NY 73.5% 15.9% 10.6% 189
NC 82.1% 13.2% 4.6% 151
OH 80.6% 10.4% 9.0% 268
OK 84.3% 8.1% 7.6% 172
OR 83.3% 6.7% 10.0% 120
PA 88.9% 6.4% 4.7% 171
RI 76.0% 16.0% 8.0% 150
SC 89.6% 5.6% 4.8% 270
TN 87.2% 5.7% 7.1% 211
UT 75.4% 14.0% 10.5% 171
VT 81.2% 13.6% 5.2% 154
VA 81.4% 12.6% 6.0% 317
WI 85.0% 9.8% 5.2% 307
WY 78.8% 12.5% 8.8% 160
Total 80.5% 12.9% 6.5% 9,459

Appendices | 102
Table D52. Do you ever feel lonely?
State Yes, often Sometimes No, not often N
AL 10.1% 37.9% 52.1% 317
AZ 6.9% 29.6% 63.5% 318
AR 6.1% 29.0% 64.9% 328
CA 11.7% 32.3% 56.1% 5,138
CO 9.4% 37.5% 53.1% 277
CT 11.5% 32.2% 56.3% 270
DE 16.9% 28.8% 54.3% 243
DC 13.5% 37.8% 48.6% 185
FL 7.8% 35.8% 56.4% 562
GA 5.6% 31.1% 63.3% 270
IL 9.8% 33.6% 56.6% 256
IN 12.0% 22.7% 65.4% 560
KS 14.1% 41.0% 44.9% 256
KY 2.1% 23.1% 74.7% 281
LA 9.3% 35.0% 55.7% 280
ME 13.9% 40.7% 45.4% 317
MA 12.4% 29.9% 57.7% 291
MI 10.4% 40.2% 49.5% 396
MN 12.1% 28.0% 59.9% 289
MO 6.3% 37.2% 56.5% 253
NE 6.7% 33.8% 59.5% 284
NV 17.6% 32.4% 50.0% 306
NY 11.0% 35.2% 53.8% 318
NC 11.4% 32.8% 55.7% 332
OH 11.1% 31.9% 56.9% 548
OK 21.1% 28.3% 50.6% 247
OR 16.0% 40.3% 43.7% 293
PA 4.3% 30.3% 65.4% 419
RI 13.7% 33.2% 53.1% 271
SC 6.1% 40.8% 53.2% 380
TN 11.1% 21.9% 67.0% 324
UT 15.3% 40.6% 44.2% 249
VT 11.0% 38.6% 50.4% 254
VA 9.2% 28.3% 62.5% 459
WI 14.8% 35.4% 49.8% 630
WY 11.5% 43.8% 44.7% 208
Total 10.9% 33.6% 55.4% 16,609

Appendices | 103
Table D53. Can you go on a date if you want to?
State
Yes, sees family
whenever wants, or
chooses not to see family
Sometimes No N
AL 67.0% 24.7% 8.2% 194
AZ 85.0% 9.3% 5.6% 107
AR 90.0% 5.7% 4.3% 211
CA 80.5% 12.6% 6.9% 2,724
CO 83.1% 9.3% 7.6% 118
CT 81.2% 14.1% 4.7% 170
DE 84.4% 6.4% 9.2% 218
DC 71.8% 22.7% 5.5% 110
FL 81.7% 14.7% 3.7% 300
GA 77.6% 20.8% 1.6% 125
IL 68.8% 18.8% 12.3% 138
IN 89.7% 2.6% 7.7% 195
KS 82.3% 11.3% 6.5% 186
KY 51.4% 41.2% 7.4% 148
LA 82.0% 11.1% 6.9% 189
ME 73.5% 19.2% 7.3% 245
MA 89.4% 8.3% 2.3% 216
MI 78.8% 15.5% 5.7% 245
MN 90.1% 5.2% 4.7% 191
MO 84.1% 11.9% 4.0% 201
NE 81.4% 15.4% 3.2% 188
NV 77.7% 14.4% 7.9% 229
NY 73.5% 15.9% 10.6% 189
NC 82.1% 13.2% 4.6% 151
OH 80.6% 10.4% 9.0% 268
OK 84.3% 8.1% 7.6% 172
OR 83.3% 6.7% 10.0% 120
PA 88.9% 6.4% 4.7% 171
RI 76.0% 16.0% 8.0% 150
SC 89.6% 5.6% 4.8% 270
TN 87.2% 5.7% 7.1% 211
UT 75.4% 14.0% 10.5% 171
VT 81.2% 13.6% 5.2% 154
VA 81.4% 12.6% 6.0% 317
WI 85.0% 9.8% 5.2% 307
WY 78.8% 12.5% 8.8% 160
Total 80.5% 12.9% 6.5% 9,459

Appendices | 104
Satisfaction (un-collapsed)
Table D54. Do you like your home or where you live?
State Yes In-between No N
AL 93.5% 3.7% 2.8% 325
AZ 93.7% 3.6% 2.7% 331
AR 92.1% 5.2% 2.7% 330
CA 89.0% 7.0% 4.1% 5,403
CO 88.3% 7.4% 4.2% 283
CT 91.3% 4.2% 4.5% 288
DE 84.9% 7.5% 7.5% 279
DC 84.2% 7.6% 8.2% 184
FL 91.7% 5.4% 2.9% 613
GA 95.8% 2.8% 1.4% 283
IL 92.1% 4.9% 3.0% 267
IN 94.1% 2.9% 3.0% 593
KS 87.9% 7.6% 4.5% 264
KY 95.0% 3.9% 1.1% 281
LA 89.0% 5.0% 6.0% 300
ME 84.4% 12.0% 3.6% 333
MA 85.8% 8.2% 6.0% 318
MI 91.4% 5.8% 2.9% 417
MN 87.5% 8.8% 3.7% 296
MO 90.4% 5.6% 4.1% 270
NE 90.1% 7.2% 2.7% 333
NV 84.5% 7.6% 7.9% 316
NY 84.8% 8.5% 6.7% 328
NC 91.1% 4.9% 4.0% 349
OH 90.9% 4.7% 4.4% 569
OK 91.2% 4.4% 4.4% 272
OR 85.3% 9.0% 5.8% 312
PA 92.2% 4.0% 3.8% 449
RI 88.5% 6.3% 5.2% 286
SC 93.6% 1.8% 4.6% 390
TN 93.2% 4.2% 2.7% 336
UT 89.9% 5.4% 4.7% 258
VT 88.2% 7.3% 4.6% 262
VA 92.7% 4.7% 2.6% 507
WI 85.6% 9.1% 5.3% 637
WY 86.0% 8.8% 5.1% 215
Total 89.7% 6.0% 4.3% 17,477
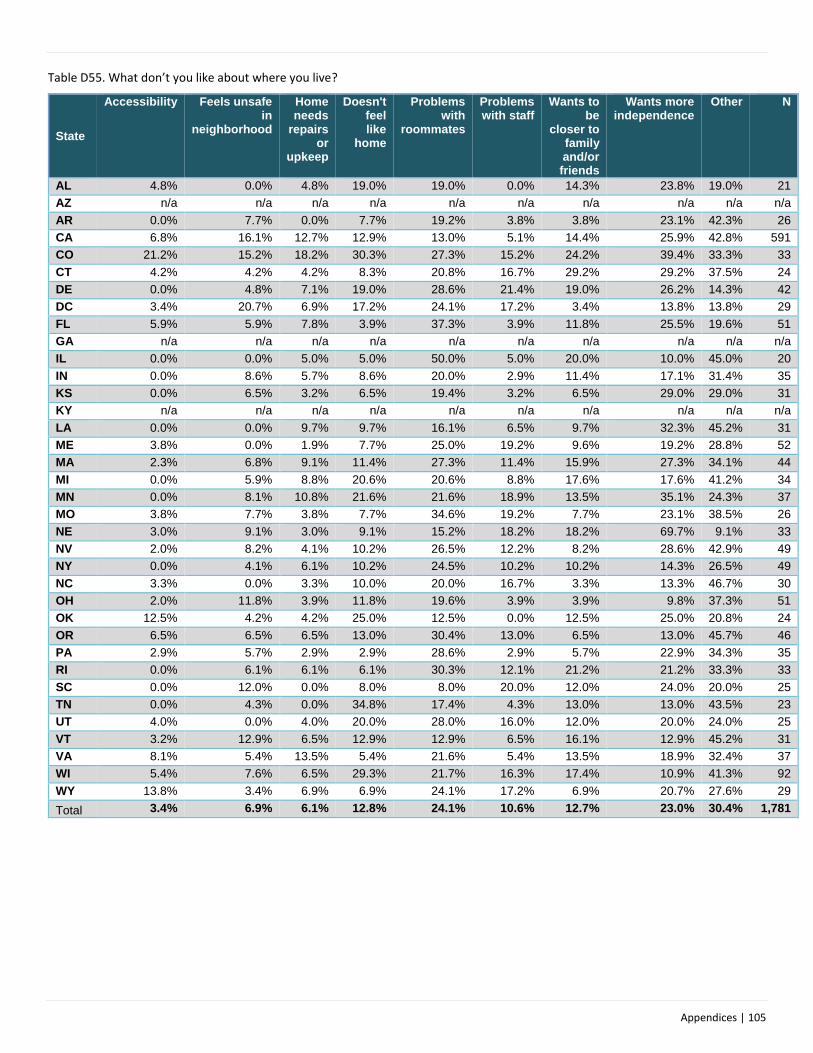
Appendices | 105
Table D55. What don’t you like about where you live?
State
Accessibility Feels unsafe in
neighborhood
Home needs
repairs or
upkeep
Doesn't feel like
home
Problems with
roommates
Problems with staff
Wants to be
closer to family and/or friends
Wants more independence
Other N
AL 4.8% 0.0% 4.8% 19.0% 19.0% 0.0% 14.3% 23.8% 19.0% 21
AZ n/a n/a n/a n/a n/a n/a n/a n/a n/a n/a
AR 0.0% 7.7% 0.0% 7.7% 19.2% 3.8% 3.8% 23.1% 42.3% 26
CA 6.8% 16.1% 12.7% 12.9% 13.0% 5.1% 14.4% 25.9% 42.8% 591
CO 21.2% 15.2% 18.2% 30.3% 27.3% 15.2% 24.2% 39.4% 33.3% 33
CT 4.2% 4.2% 4.2% 8.3% 20.8% 16.7% 29.2% 29.2% 37.5% 24
DE 0.0% 4.8% 7.1% 19.0% 28.6% 21.4% 19.0% 26.2% 14.3% 42
DC 3.4% 20.7% 6.9% 17.2% 24.1% 17.2% 3.4% 13.8% 13.8% 29
FL 5.9% 5.9% 7.8% 3.9% 37.3% 3.9% 11.8% 25.5% 19.6% 51
GA n/a n/a n/a n/a n/a n/a n/a n/a n/a n/a
IL 0.0% 0.0% 5.0% 5.0% 50.0% 5.0% 20.0% 10.0% 45.0% 20
IN 0.0% 8.6% 5.7% 8.6% 20.0% 2.9% 11.4% 17.1% 31.4% 35
KS 0.0% 6.5% 3.2% 6.5% 19.4% 3.2% 6.5% 29.0% 29.0% 31
KY n/a n/a n/a n/a n/a n/a n/a n/a n/a n/a
LA 0.0% 0.0% 9.7% 9.7% 16.1% 6.5% 9.7% 32.3% 45.2% 31
ME 3.8% 0.0% 1.9% 7.7% 25.0% 19.2% 9.6% 19.2% 28.8% 52
MA 2.3% 6.8% 9.1% 11.4% 27.3% 11.4% 15.9% 27.3% 34.1% 44
MI 0.0% 5.9% 8.8% 20.6% 20.6% 8.8% 17.6% 17.6% 41.2% 34
MN 0.0% 8.1% 10.8% 21.6% 21.6% 18.9% 13.5% 35.1% 24.3% 37
MO 3.8% 7.7% 3.8% 7.7% 34.6% 19.2% 7.7% 23.1% 38.5% 26
NE 3.0% 9.1% 3.0% 9.1% 15.2% 18.2% 18.2% 69.7% 9.1% 33
NV 2.0% 8.2% 4.1% 10.2% 26.5% 12.2% 8.2% 28.6% 42.9% 49
NY 0.0% 4.1% 6.1% 10.2% 24.5% 10.2% 10.2% 14.3% 26.5% 49
NC 3.3% 0.0% 3.3% 10.0% 20.0% 16.7% 3.3% 13.3% 46.7% 30
OH 2.0% 11.8% 3.9% 11.8% 19.6% 3.9% 3.9% 9.8% 37.3% 51
OK 12.5% 4.2% 4.2% 25.0% 12.5% 0.0% 12.5% 25.0% 20.8% 24
OR 6.5% 6.5% 6.5% 13.0% 30.4% 13.0% 6.5% 13.0% 45.7% 46
PA 2.9% 5.7% 2.9% 2.9% 28.6% 2.9% 5.7% 22.9% 34.3% 35
RI 0.0% 6.1% 6.1% 6.1% 30.3% 12.1% 21.2% 21.2% 33.3% 33
SC 0.0% 12.0% 0.0% 8.0% 8.0% 20.0% 12.0% 24.0% 20.0% 25
TN 0.0% 4.3% 0.0% 34.8% 17.4% 4.3% 13.0% 13.0% 43.5% 23
UT 4.0% 0.0% 4.0% 20.0% 28.0% 16.0% 12.0% 20.0% 24.0% 25
VT 3.2% 12.9% 6.5% 12.9% 12.9% 6.5% 16.1% 12.9% 45.2% 31
VA 8.1% 5.4% 13.5% 5.4% 21.6% 5.4% 13.5% 18.9% 32.4% 37
WI 5.4% 7.6% 6.5% 29.3% 21.7% 16.3% 17.4% 10.9% 41.3% 92
WY 13.8% 3.4% 6.9% 6.9% 24.1% 17.2% 6.9% 20.7% 27.6% 29
Total 3.4% 6.9% 6.1% 12.8% 24.1% 10.6% 12.7% 23.0% 30.4% 1,781

Appendices | 106
Table D56. Would you like to live somewhere else?
State Yes In-between No N
AL 23.8% 6.2% 70.1% 324
AZ 12.7% 6.8% 80.5% 323
AR 37.8% 8.8% 53.4% 328
CA 25.7% 13.6% 60.6% 5,231
CO 26.3% 13.7% 60.1% 278
CT 24.0% 7.4% 68.6% 271
DE 40.2% 3.0% 56.8% 264
DC 37.9% 6.0% 56.0% 182
FL 16.9% 10.5% 72.7% 593
GA 10.7% 6.3% 83.0% 271
IL 28.2% 8.3% 63.5% 266
IN 22.7% 8.7% 68.5% 572
KS 22.0% 17.7% 60.2% 254
KY 6.9% 3.6% 89.5% 276
LA 33.1% 9.0% 57.9% 290
ME 31.8% 9.9% 58.3% 314
MA 29.2% 10.8% 60.0% 305
MI 28.1% 9.4% 62.6% 406
MN 24.8% 10.7% 64.5% 290
MO 20.2% 11.6% 68.2% 267
NE 18.5% 11.4% 70.0% 297
NV 36.3% 7.5% 56.2% 306
NY 31.3% 15.8% 52.8% 316
NC 27.9% 7.9% 64.2% 330
OH 29.4% 9.0% 61.6% 557
OK 37.2% 5.1% 57.7% 253
OR 36.3% 8.0% 55.7% 300
PA 15.4% 6.7% 77.9% 434
RI 30.2% 9.8% 60.0% 275
SC 22.7% 6.2% 71.1% 387
TN 17.0% 4.3% 78.6% 323
UT 29.0% 10.2% 60.8% 245
VT 26.9% 8.3% 64.8% 253
VA 22.4% 8.4% 69.2% 478
WI 25.0% 7.3% 67.7% 631
WY 26.2% 16.4% 57.5% 214
Total 26.0% 9.0% 65.0% 16,904

Appendices | 107
Table D57. Do you like where you work? (among those with a paid community job)
State Yes In-between No N
AL n/a n/a n/a n/a
AZ 92.9% 3.6% 3.6% 56
AR 90.5% 7.1% 2.4% 42
CA 88.9% 8.9% 2.3% 1,150
CO 86.4% 10.6% 3.0% 66
CT 92.2% 5.2% 2.6% 116
DE 90.0% 8.0% 2.0% 50
DC 95.5% 4.5% 0.0% 22
FL 90.9% 4.5% 4.5% 88
GA 95.5% 4.5% 0.0% 22
IL 100.0% 0.0% 0.0% 34
IN 88.7% 9.7% 1.6% 124
KS 100.0% 0.0% 0.0% 56
KY 95.2% 0.0% 4.8% 42
LA 93.2% 6.8% 0.0% 44
ME 90.3% 8.6% 1.1% 93
MA 96.9% 1.0% 2.1% 96
MI 88.9% 6.9% 4.2% 72
MN 88.2% 10.1% 1.7% 119
MO 88.9% 8.3% 2.8% 36
NE 91.7% 8.3% 0.0% 156
NV 83.3% 11.9% 4.8% 42
NY 92.7% 5.5% 1.8% 55
NC 95.9% 2.7% 1.4% 73
OH 86.5% 9.9% 3.5% 141
OK 92.1% 3.5% 4.4% 114
OR 91.7% 8.3% 0.0% 60
PA 94.9% 2.0% 3.0% 99
RI 94.2% 5.8% 0.0% 86
SC 94.6% 5.4% 0.0% 74
TN 94.9% 3.4% 1.7% 59
UT 88.4% 9.3% 2.3% 86
VT 85.3% 12.8% 1.8% 109
VA 94.5% 1.8% 3.6% 55
WI 89.6% 7.8% 2.6% 115
WY 92.9% 6.0% 1.2% 84
Total 91.8% 6.2% 2.0% 3,753

Appendices | 108
Table D58. Do you want to work somewhere else? (among those with a paid community job)
State Yes In-between No N
AL n/a n/a n/a n/a
AZ 17.9% 8.9% 73.2% 56
AR 19.5% 14.6% 65.9% 41
CA 30.2% 15.6% 54.2% 1,136
CO 31.3% 12.5% 56.3% 64
CT 22.2% 12.0% 65.8% 117
DE 26.0% 10.0% 64.0% 50
DC 22.7% 9.1% 68.2% 22
FL 18.2% 9.1% 72.7% 88
GA 13.6% 4.5% 81.8% 22
IL 30.3% 9.1% 60.6% 33
IN 18.3% 10.8% 70.8% 120
KS 13.0% 18.5% 68.5% 54
KY 9.8% 0.0% 90.2% 41
LA 24.4% 13.3% 62.2% 45
ME 31.6% 9.5% 58.9% 95
MA 28.6% 9.2% 62.2% 98
MI 32.9% 5.7% 61.4% 70
MN 31.6% 10.5% 57.9% 114
MO 11.1% 13.9% 75.0% 36
NE 16.8% 18.8% 64.4% 149
NV 40.5% 11.9% 47.6% 42
NY 22.6% 15.1% 62.3% 53
NC 38.7% 8.0% 53.3% 75
OH 28.6% 7.9% 63.6% 140
OK 48.6% 8.1% 43.2% 111
OR 45.0% 6.7% 48.3% 60
PA 18.1% 8.5% 73.4% 94
RI 25.9% 15.3% 58.8% 85
SC 21.6% 4.1% 74.3% 74
TN 23.7% 1.7% 74.6% 59
UT 30.5% 6.1% 63.4% 82
VT 35.4% 7.1% 57.6% 99
VA 21.2% 5.8% 73.1% 52
WI 19.5% 10.6% 69.9% 113
WY 27.2% 13.6% 59.3% 81
Total 25.7% 9.8% 64.5% 3,688

Appendices | 109
Table D59. Attends a day program or workshop and wants to go more, less, or the same amount of time
State Wants to
spend more time there
Happy with the amount of
time spends there
Wants to spend less time there
Does not want to spend any time there
N
AL 12.5% 75.3% 10.8% 1.4% 295
AZ 12.3% 65.6% 19.6% 2.5% 163
AR 12.2% 59.0% 25.0% 3.7% 188
CA 18.6% 67.6% 11.3% 2.5% 2,589
CO 23.3% 60.6% 12.8% 3.3% 180
CT 18.8% 65.6% 13.6% 1.9% 154
DE 18.0% 55.1% 16.9% 10.1% 178
DC 34.4% 54.3% 9.3% 2.0% 151
FL 8.6% 83.6% 6.0% 1.9% 268
GA 4.2% 88.8% 6.1% 0.9% 214
IL 17.7% 67.5% 13.3% 1.5% 203
IN 17.0% 73.1% 9.2% 0.7% 283
KS 10.8% 67.0% 19.2% 3.0% 203
KY 3.3% 81.2% 15.5% 0.0% 181
LA 16.6% 73.8% 9.0% 0.7% 145
ME 18.1% 74.1% 6.9% 0.8% 259
MA 15.6% 65.1% 16.1% 3.1% 192
MI 25.8% 66.3% 7.4% 0.5% 190
MN 24.3% 54.2% 17.4% 4.2% 144
MO 11.7% 78.8% 8.0% 1.5% 137
NE 11.9% 68.6% 17.3% 2.2% 226
NV 17.5% 64.6% 14.3% 3.6% 223
NY 14.5% 75.3% 7.5% 2.7% 186
NC 24.3% 63.0% 11.6% 1.2% 173
OH 18.4% 68.9% 11.0% 1.7% 354
OK 25.4% 49.3% 25.4% 0.0% 67
OR 27.9% 59.3% 8.1% 4.7% 86
PA 11.0% 81.3% 6.2% 1.4% 209
RI 21.1% 65.3% 12.1% 1.6% 190
SC 9.8% 77.2% 10.9% 2.2% 276
TN 19.2% 70.4% 8.8% 1.6% 125
UT 15.1% 62.6% 15.1% 7.2% 139
VT 27.7% 60.0% 10.8% 1.5% 65
VA 12.9% 78.3% 7.5% 1.4% 295
WI 20.7% 67.6% 9.5% 2.2% 179
WY 19.3% 60.5% 16.7% 3.5% 114
Total 17.2% 68.0% 12.4% 2.4% 9,224

Appendices | 110
Table D60. Services and Supports help person live a good life
State Yes In-between No N
AL 93.2% 6.2% 0.6% 324
AZ 92.5% 5.3% 2.2% 322
AR 95.2% 3.9% 0.9% 331
CA 86.9% 10.1% 3.0% 5,122
CO 88.3% 8.4% 3.3% 274
CT 90.3% 6.9% 2.9% 277
DE 88.0% 7.3% 4.7% 234
DC 88.0% 8.7% 3.3% 184
FL 95.9% 3.6% 0.5% 580
GA 96.3% 2.9% 0.7% 273
IL 94.2% 4.6% 1.2% 259
IN 97.3% 2.0% 0.7% 558
KS 91.3% 7.2% 1.5% 264
KY 97.8% 0.4% 1.8% 278
LA 92.9% 5.7% 1.4% 281
ME 88.5% 9.3% 2.2% 322
MA 87.5% 9.3% 3.2% 312
MI 91.9% 7.6% 0.5% 409
MN 93.8% 5.2% 1.0% 291
MO 93.5% 5.4% 1.1% 261
NE 84.9% 12.6% 2.5% 317
NV 87.9% 8.8% 3.3% 307
NY 84.8% 12.7% 2.5% 316
NC 91.9% 4.8% 3.3% 334
OH 92.8% 5.8% 1.4% 555
OK 92.8% 3.2% 4.0% 250
OR 89.5% 7.2% 3.3% 304
PA 91.2% 7.6% 1.2% 409
RI 93.8% 4.7% 1.5% 274
SC 96.1% 2.8% 1.0% 388
TN 96.4% 2.4% 1.2% 335
UT 94.4% 4.4% 1.2% 252
VT 91.4% 7.4% 1.2% 257
VA 92.2% 6.7% 1.0% 477
WI 86.1% 10.9% 3.0% 624
WY 93.5% 5.1% 1.4% 214
Total 91.8% 6.3% 1.9% 16,769
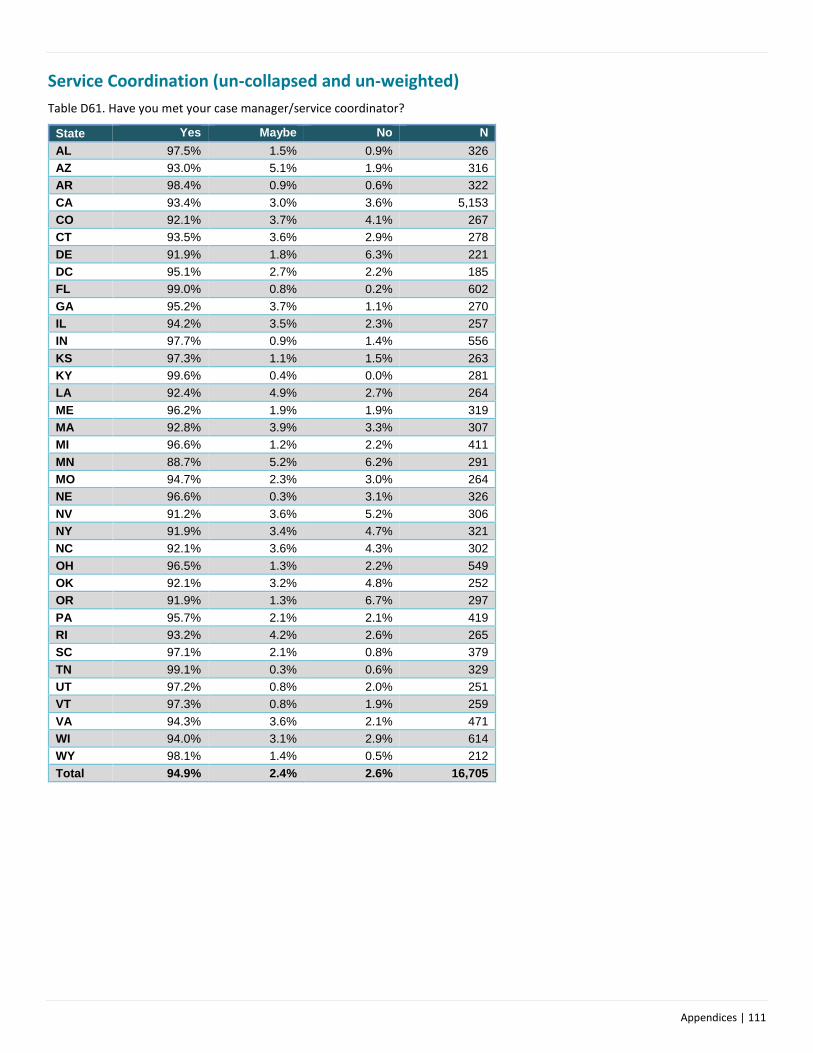
Appendices | 111
Service Coordination (un-collapsed and un-weighted)
Table D61. Have you met your case manager/service coordinator?
State Yes Maybe No N
AL 97.5% 1.5% 0.9% 326
AZ 93.0% 5.1% 1.9% 316
AR 98.4% 0.9% 0.6% 322
CA 93.4% 3.0% 3.6% 5,153
CO 92.1% 3.7% 4.1% 267
CT 93.5% 3.6% 2.9% 278
DE 91.9% 1.8% 6.3% 221
DC 95.1% 2.7% 2.2% 185
FL 99.0% 0.8% 0.2% 602
GA 95.2% 3.7% 1.1% 270
IL 94.2% 3.5% 2.3% 257
IN 97.7% 0.9% 1.4% 556
KS 97.3% 1.1% 1.5% 263
KY 99.6% 0.4% 0.0% 281
LA 92.4% 4.9% 2.7% 264
ME 96.2% 1.9% 1.9% 319
MA 92.8% 3.9% 3.3% 307
MI 96.6% 1.2% 2.2% 411
MN 88.7% 5.2% 6.2% 291
MO 94.7% 2.3% 3.0% 264
NE 96.6% 0.3% 3.1% 326
NV 91.2% 3.6% 5.2% 306
NY 91.9% 3.4% 4.7% 321
NC 92.1% 3.6% 4.3% 302
OH 96.5% 1.3% 2.2% 549
OK 92.1% 3.2% 4.8% 252
OR 91.9% 1.3% 6.7% 297
PA 95.7% 2.1% 2.1% 419
RI 93.2% 4.2% 2.6% 265
SC 97.1% 2.1% 0.8% 379
TN 99.1% 0.3% 0.6% 329
UT 97.2% 0.8% 2.0% 251
VT 97.3% 0.8% 1.9% 259
VA 94.3% 3.6% 2.1% 471
WI 94.0% 3.1% 2.9% 614
WY 98.1% 1.4% 0.5% 212
Total 94.9% 2.4% 2.6% 16,705

Appendices | 112
Table D62. Does your case manager/service coordinator ask what you want?
State Yes Sometimes No N
AL 96.9% 1.9% 1.2% 321
AZ 92.9% 4.0% 3.0% 297
AR 93.3% 5.5% 1.2% 327
CA 83.7% 9.1% 7.3% 4,837
CO 84.7% 9.2% 6.0% 249
CT 84.5% 8.5% 7.0% 271
DE 81.0% 8.2% 10.8% 195
DC 83.1% 13.1% 3.8% 183
FL 96.7% 2.7% 0.5% 584
GA 89.8% 6.7% 3.5% 255
IL 88.8% 8.7% 2.5% 242
IN 97.2% 1.5% 1.3% 542
KS 89.3% 6.3% 4.3% 253
KY 91.8% 7.1% 1.1% 281
LA 92.7% 3.4% 3.8% 262
ME 85.8% 7.4% 6.8% 296
MA 82.6% 10.8% 6.6% 287
MI 89.8% 8.1% 2.0% 393
MN 81.8% 8.7% 9.5% 264
MO 90.7% 5.2% 4.0% 248
NE 86.3% 11.3% 2.5% 284
NV 78.4% 7.1% 14.5% 296
NY 83.8% 10.4% 5.7% 297
NC 85.0% 5.7% 9.3% 280
OH 92.0% 4.8% 3.2% 524
OK 83.8% 10.0% 6.1% 229
OR 81.3% 8.8% 9.9% 273
PA 93.2% 2.8% 4.0% 398
RI 87.5% 8.5% 4.0% 248
SC 96.6% 1.9% 1.6% 377
TN 96.3% 1.9% 1.9% 324
UT 89.4% 5.7% 4.9% 245
VT 83.1% 7.9% 9.1% 242
VA 91.2% 5.3% 3.5% 453
WI 84.4% 8.2% 7.4% 582
WY 92.9% 4.3% 2.9% 210
Total 88.4% 6.7% 4.9% 15,849

Appendices | 113
Table D63. Are you able to contact your case manager/service coordinator when you want to?
State Yes Sometimes No N
AL 85.2% 7.2% 7.5% 318
AZ 84.2% 6.6% 9.2% 273
AR 95.1% 4.3% 0.6% 328
CA 84.0% 8.2% 7.8% 4,706
CO 87.6% 6.6% 5.8% 242
CT 85.3% 4.7% 10.1% 258
DE 72.7% 2.0% 25.3% 198
DC 82.9% 13.8% 3.3% 181
FL 96.0% 2.3% 1.6% 555
GA 90.0% 5.2% 4.8% 230
IL 87.5% 9.1% 3.4% 232
IN 94.9% 0.9% 4.3% 467
KS 88.7% 7.4% 3.9% 256
KY 92.9% 5.7% 1.4% 280
LA 88.5% 5.5% 5.9% 253
ME 90.0% 5.9% 4.2% 289
MA 85.9% 7.4% 6.7% 283
MI 87.8% 5.1% 7.1% 393
MN 85.8% 6.1% 8.0% 261
MO 86.5% 4.2% 9.3% 215
NE 92.2% 6.6% 1.2% 258
NV 73.2% 9.8% 17.1% 287
NY 85.6% 8.1% 6.3% 285
NC 87.2% 2.6% 10.3% 273
OH 91.2% 4.0% 4.8% 525
OK 81.2% 4.3% 14.5% 234
OR 85.8% 5.1% 9.1% 274
PA 88.4% 5.2% 6.4% 329
RI 88.3% 6.6% 5.1% 256
SC 96.0% 1.9% 2.1% 378
TN 94.7% 1.5% 3.7% 323
UT 83.8% 6.9% 9.3% 247
VT 87.3% 5.5% 7.2% 237
VA 82.3% 3.9% 13.8% 458
WI 87.5% 6.4% 6.2% 582
WY 89.5% 5.7% 4.8% 210
Total 87.4% 5.6% 7.0% 15,374

Appendices | 114
Table D64. Do your staff come and leave when they are supposed to?
State Yes Sometimes,
or some staff No N

Appendices | 115
Table D65. Did you take part in the last service planning meeting?
State
Yes Had opportunity,
but chose not o
No N
AL 96.3% 1.2% 2.5% 321
AZ 97.0% 1.9% 1.1% 267
AR 96.1% 1.6% 2.3% 309
CA 97.3% 1.4% 1.3% 4,285
CO 89.5% 5.9% 4.6% 219
CT 94.7% 1.6% 3.7% 243
DE 98.7% 0.0% 1.3% 155
DC 95.4% 2.3% 2.3% 175
FL 99.4% 0.2% 0.4% 544
GA 100.0% 0.0% 0.0% 264
IL 97.4% 0.9% 1.7% 233
IN 97.7% 1.0% 1.3% 479
KS 99.6% 0.0% 0.4% 253
KY 97.8% 2.2% 0.0% 272
LA 96.3% 2.0% 1.6% 244
ME 99.6% 0.0% 0.4% 284
MA 95.9% 0.7% 3.4% 293
MI 98.4% 0.3% 1.3% 371
MN 97.5% 0.8% 1.7% 238
MO 96.7% 0.8% 2.5% 244
NE 98.5% 1.1% 0.4% 273
NV 97.7% 0.4% 1.9% 258
NY 96.8% 2.5% 0.7% 284
NC 97.0% 0.0% 3.0% 268
OH 97.8% 0.4% 1.8% 490
OK 98.6% 0.0% 1.4% 217
OR 96.9% 0.4% 2.7% 257
PA 98.3% 1.1% 0.6% 357
RI 97.9% 0.0% 2.1% 240
SC 99.2% 0.0% 0.8% 373
TN 89.0% 2.9% 8.1% 310
UT 97.5% 0.0% 2.5% 203
VT 89.4% 2.2% 8.4% 179
VA 98.4% 0.9% 0.7% 441
WI 95.6% 1.2% 3.3% 517
WY 95.5% 3.0% 1.5% 198
Total 96.8% 1.1% 2.0% 14,558

Appendices | 116
Table D66. At the service planning meeting, did you know what was being talked about?
State Yes In-between No N
AL 84.0% 13.1% 2.9% 306
AZ 82.5% 14.3% 3.2% 252
AR 71.6% 24.3% 4.1% 296
CA 83.6% 13.8% 2.6% 4,041
CO 84.1% 11.6% 4.2% 189
CT 81.9% 13.1% 5.0% 221
DE 86.3% 7.9% 5.8% 139
DC 89.1% 9.1% 1.8% 165
FL 89.2% 10.2% 0.6% 518
GA 83.5% 14.6% 2.0% 254
IL 87.7% 8.2% 4.1% 219
IN 85.9% 9.1% 5.1% 453
KS 85.8% 11.3% 2.8% 247
KY 93.6% 5.3% 1.1% 264
LA 87.1% 8.9% 4.0% 224
ME 86.8% 8.8% 4.4% 273
MA 87.5% 11.4% 1.1% 271
MI 75.7% 16.9% 7.3% 354
MN 79.3% 15.4% 5.3% 227
MO 84.6% 12.2% 3.2% 221
NE 72.0% 23.8% 4.2% 261
NV 79.2% 11.7% 9.2% 240
NY 81.4% 15.6% 3.0% 269
NC 89.8% 7.3% 2.8% 246
OH 85.8% 11.4% 2.8% 464
OK 74.4% 18.2% 7.4% 203
OR 83.1% 10.0% 6.9% 231
PA 84.6% 13.0% 2.5% 324
RI 78.9% 17.6% 3.5% 227
SC 94.4% 3.6% 1.9% 360
TN 80.9% 16.9% 2.2% 272
UT 85.5% 9.8% 4.7% 193
VT 83.4% 11.7% 4.8% 145
VA 82.2% 13.9% 3.9% 411
WI 84.4% 10.9% 4.7% 486
WY 78.9% 15.1% 5.9% 185
Total 83.6% 12.5% 3.9% 13,651
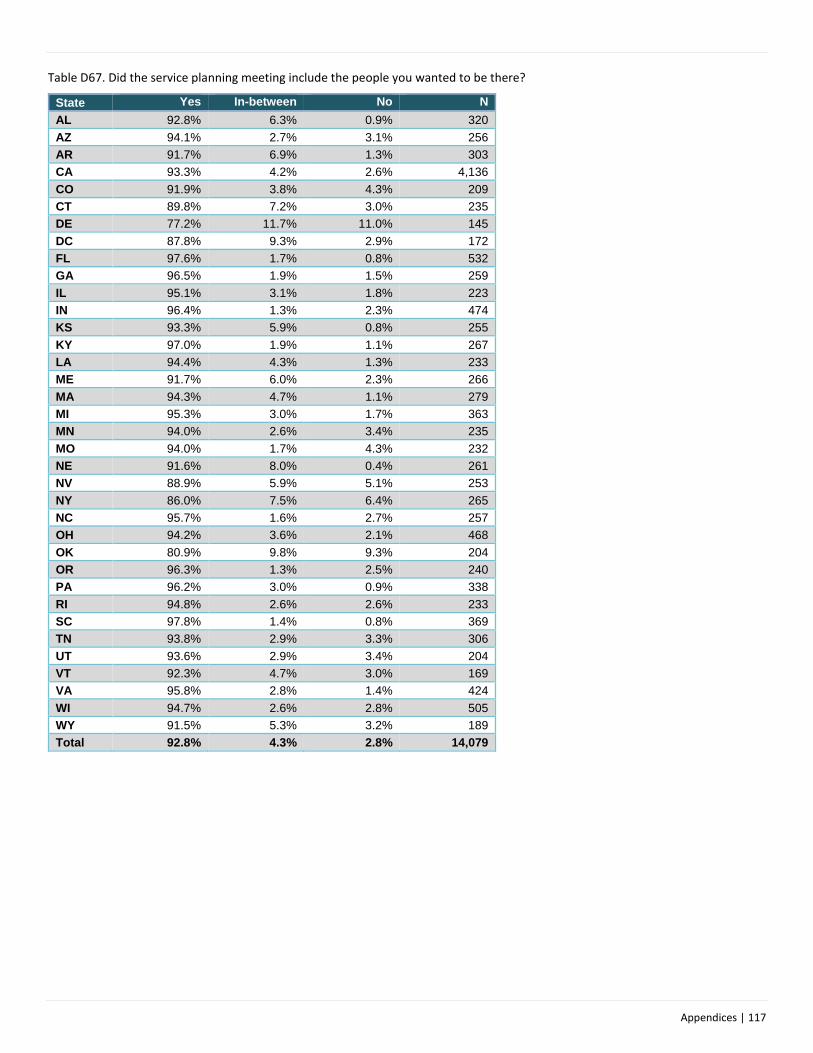
Appendices | 117
Table D67. Did the service planning meeting include the people you wanted to be there?
State Yes In-between No N
AL 92.8% 6.3% 0.9% 320
AZ 94.1% 2.7% 3.1% 256
AR 91.7% 6.9% 1.3% 303
CA 93.3% 4.2% 2.6% 4,136
CO 91.9% 3.8% 4.3% 209
CT 89.8% 7.2% 3.0% 235
DE 77.2% 11.7% 11.0% 145
DC 87.8% 9.3% 2.9% 172
FL 97.6% 1.7% 0.8% 532
GA 96.5% 1.9% 1.5% 259
IL 95.1% 3.1% 1.8% 223
IN 96.4% 1.3% 2.3% 474
KS 93.3% 5.9% 0.8% 255
KY 97.0% 1.9% 1.1% 267
LA 94.4% 4.3% 1.3% 233
ME 91.7% 6.0% 2.3% 266
MA 94.3% 4.7% 1.1% 279
MI 95.3% 3.0% 1.7% 363
MN 94.0% 2.6% 3.4% 235
MO 94.0% 1.7% 4.3% 232
NE 91.6% 8.0% 0.4% 261
NV 88.9% 5.9% 5.1% 253
NY 86.0% 7.5% 6.4% 265
NC 95.7% 1.6% 2.7% 257
OH 94.2% 3.6% 2.1% 468
OK 80.9% 9.8% 9.3% 204
OR 96.3% 1.3% 2.5% 240
PA 96.2% 3.0% 0.9% 338
RI 94.8% 2.6% 2.6% 233
SC 97.8% 1.4% 0.8% 369
TN 93.8% 2.9% 3.3% 306
UT 93.6% 2.9% 3.4% 204
VT 92.3% 4.7% 3.0% 169
VA 95.8% 2.8% 1.4% 424
WI 94.7% 2.6% 2.8% 505
WY 91.5% 5.3% 3.2% 189
Total 92.8% 4.3% 2.8% 14,079
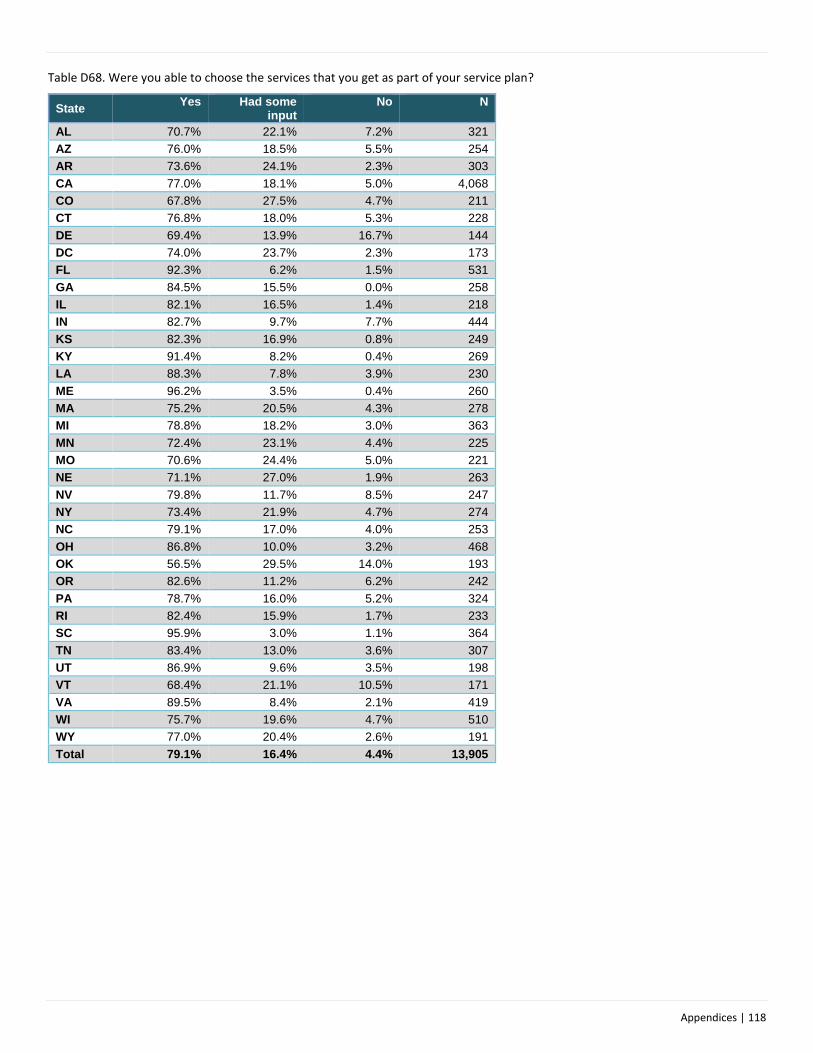
Appendices | 118
Table D68. Were you able to choose the services that you get as part of your service plan?
State Yes Had some
input No N
AL 70.7% 22.1% 7.2% 321
AZ 76.0% 18.5% 5.5% 254
AR 73.6% 24.1% 2.3% 303
CA 77.0% 18.1% 5.0% 4,068
CO 67.8% 27.5% 4.7% 211
CT 76.8% 18.0% 5.3% 228
DE 69.4% 13.9% 16.7% 144
DC 74.0% 23.7% 2.3% 173
FL 92.3% 6.2% 1.5% 531
GA 84.5% 15.5% 0.0% 258
IL 82.1% 16.5% 1.4% 218
IN 82.7% 9.7% 7.7% 444
KS 82.3% 16.9% 0.8% 249
KY 91.4% 8.2% 0.4% 269
LA 88.3% 7.8% 3.9% 230
ME 96.2% 3.5% 0.4% 260
MA 75.2% 20.5% 4.3% 278
MI 78.8% 18.2% 3.0% 363
MN 72.4% 23.1% 4.4% 225
MO 70.6% 24.4% 5.0% 221
NE 71.1% 27.0% 1.9% 263
NV 79.8% 11.7% 8.5% 247
NY 73.4% 21.9% 4.7% 274
NC 79.1% 17.0% 4.0% 253
OH 86.8% 10.0% 3.2% 468
OK 56.5% 29.5% 14.0% 193
OR 82.6% 11.2% 6.2% 242
PA 78.7% 16.0% 5.2% 324
RI 82.4% 15.9% 1.7% 233
SC 95.9% 3.0% 1.1% 364
TN 83.4% 13.0% 3.6% 307
UT 86.9% 9.6% 3.5% 198
VT 68.4% 21.1% 10.5% 171
VA 89.5% 8.4% 2.1% 419
WI 75.7% 19.6% 4.7% 510
WY 77.0% 20.4% 2.6% 191
Total 79.1% 16.4% 4.4% 13,905
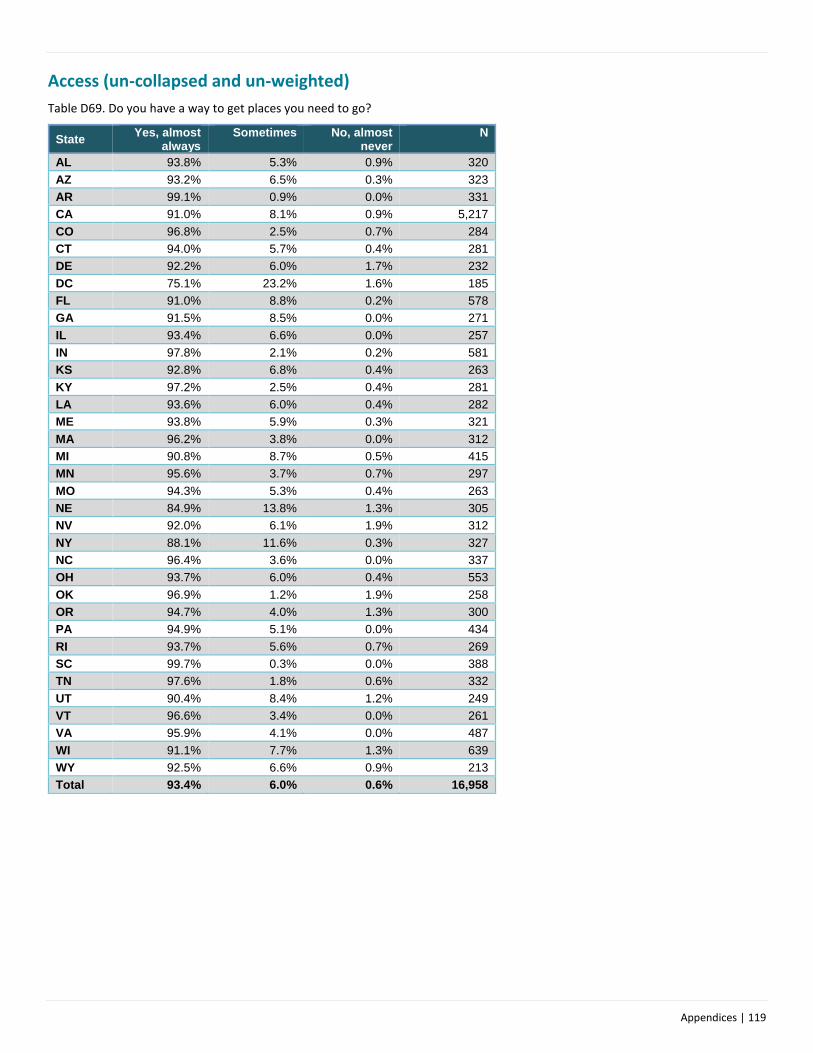
Appendices | 119
Access (un-collapsed and un-weighted)
Table D69. Do you have a way to get places you need to go?
State Yes, almost
always Sometimes No, almost
never N
AL 93.8% 5.3% 0.9% 320
AZ 93.2% 6.5% 0.3% 323
AR 99.1% 0.9% 0.0% 331
CA 91.0% 8.1% 0.9% 5,217
CO 96.8% 2.5% 0.7% 284
CT 94.0% 5.7% 0.4% 281
DE 92.2% 6.0% 1.7% 232
DC 75.1% 23.2% 1.6% 185
FL 91.0% 8.8% 0.2% 578
GA 91.5% 8.5% 0.0% 271
IL 93.4% 6.6% 0.0% 257
IN 97.8% 2.1% 0.2% 581
KS 92.8% 6.8% 0.4% 263
KY 97.2% 2.5% 0.4% 281
LA 93.6% 6.0% 0.4% 282
ME 93.8% 5.9% 0.3% 321
MA 96.2% 3.8% 0.0% 312
MI 90.8% 8.7% 0.5% 415
MN 95.6% 3.7% 0.7% 297
MO 94.3% 5.3% 0.4% 263
NE 84.9% 13.8% 1.3% 305
NV 92.0% 6.1% 1.9% 312
NY 88.1% 11.6% 0.3% 327
NC 96.4% 3.6% 0.0% 337
OH 93.7% 6.0% 0.4% 553
OK 96.9% 1.2% 1.9% 258
OR 94.7% 4.0% 1.3% 300
PA 94.9% 5.1% 0.0% 434
RI 93.7% 5.6% 0.7% 269
SC 99.7% 0.3% 0.0% 388
TN 97.6% 1.8% 0.6% 332
UT 90.4% 8.4% 1.2% 249
VT 96.6% 3.4% 0.0% 261
VA 95.9% 4.1% 0.0% 487
WI 91.1% 7.7% 1.3% 639
WY 92.5% 6.6% 0.9% 213
Total 93.4% 6.0% 0.6% 16,958

Appendices | 120
Table D70. Are you able to get places when you want to do something outside your home, like going out to see friends, for entertainment, or to do something fun?
State Yes, almost
always Sometimes No, almost
never N
AL 81.8% 16.9% 1.2% 325
AZ 88.2% 10.6% 1.2% 321
AR 85.0% 14.7% 0.3% 333
CA 82.2% 14.9% 2.9% 5,145
CO 80.1% 15.9% 4.0% 276
CT 83.5% 14.7% 1.8% 279
DE 83.9% 12.5% 3.6% 224
DC 71.4% 26.9% 1.6% 182
FL 80.5% 18.8% 0.7% 579
GA 83.0% 15.9% 1.1% 271
IL 77.6% 20.8% 1.5% 259
IN 91.4% 8.0% 0.5% 573
KS 77.3% 19.2% 3.5% 260
KY 95.7% 3.5% 0.7% 282
LA 90.1% 8.5% 1.4% 282
ME 75.4% 23.3% 1.3% 309
MA 87.8% 9.2% 3.0% 304
MI 82.2% 16.1% 1.7% 411
MN 85.8% 11.2% 3.1% 295
MO 89.4% 9.1% 1.5% 264
NE 59.5% 36.6% 3.9% 306
NV 78.2% 15.3% 6.5% 308
NY 77.9% 17.8% 4.3% 326
NC 86.7% 10.6% 2.7% 331
OH 87.6% 8.8% 3.6% 555
OK 89.3% 8.7% 2.0% 252
OR 83.6% 11.9% 4.4% 293
PA 90.4% 9.4% 0.2% 427
RI 79.1% 16.8% 4.0% 273
SC 94.6% 3.4% 2.1% 388
TN 94.3% 4.5% 1.2% 331
UT 86.2% 10.5% 3.2% 247
VT 79.9% 15.4% 4.7% 254
VA 87.5% 11.7% 0.8% 479
WI 76.1% 15.2% 8.7% 631
WY 84.2% 14.8% 1.0% 209
Total 83.5% 14.0% 2.5% 16,784

Appendices | 121
Table D71. Do you feel that your staff have the right training to meet your needs? (does not include responses from proxies who were staff)
State Yes, almost
always Sometimes No, almost
never N
AL 94.3% 4.3% 1.3% 300
AZ 89.3% 7.4% 3.3% 337
AR 95.1% 4.6% 0.3% 345
CA 87.4% 9.8% 2.8% 4,698
CO 78.8% 18.8% 2.4% 292
CT 89.4% 6.0% 4.6% 216
DE 91.4% 4.6% 4.1% 197
DC 92.9% 5.5% 1.6% 182
FL 92.7% 6.5% 0.8% 728
GA 93.1% 6.5% 0.4% 261
IL 91.1% 6.5% 2.3% 214
IN 91.4% 6.6% 2.0% 663
KS 89.5% 8.9% 1.6% 258
KY 93.9% 1.9% 4.2% 309
LA 88.0% 7.4% 4.6% 284
ME 84.2% 12.7% 3.1% 322
MA 90.4% 8.2% 1.4% 281
MI 86.5% 9.0% 4.5% 356
MN 91.7% 4.3% 4.0% 302
MO 94.1% 5.1% 0.8% 254
NE 77.5% 20.5% 2.0% 302
NV 80.6% 13.0% 6.3% 315
NY 87.5% 8.6% 3.9% 304
NC 89.7% 8.4% 1.9% 427
OH 90.0% 7.0% 3.0% 501
OK 94.4% 4.2% 1.4% 213
OR 81.9% 11.6% 6.5% 276
PA 93.3% 4.4% 2.2% 405
RI 88.8% 7.4% 3.7% 269
SC 96.7% 1.7% 1.7% 361
TN 94.6% 3.7% 1.7% 295
UT 92.1% 6.1% 1.8% 279
VT 84.8% 9.3% 5.8% 257
VA 91.3% 6.5% 2.2% 584
WI 87.9% 8.4% 3.7% 783
WY 86.3% 10.0% 3.6% 249
Total 89.5% 7.7% 2.8% 16,619

Appendices | 122
Health (un-collapsed)
Table D72. Does this person have a primary care doctor or primary care practitioner?
State Yes No N
AL 99.2% 0.8% 378
AZ 97.3% 2.7% 479
AR 97.3% 2.7% 403
CA 96.9% 3.1% 8,257
CO 99.4% 0.6% 349
CT 98.6% 1.4% 367
DE 98.7% 1.3% 398
DC 99.5% 0.5% 394
FL 98.3% 1.7% 958
GA 97.9% 2.1% 470
IL 98.4% 1.6% 367
IN 98.6% 1.4% 738
KS 99.5% 0.5% 387
KY 99.8% 0.2% 412
LA 96.3% 3.7% 434
ME 98.5% 1.5% 394
MA 97.6% 2.4% 415
MI 98.5% 1.5% 647
MN 96.9% 3.1% 385
MO 98.5% 1.5% 399
NE 94.5% 5.5% 400
NV 98.2% 1.8% 385
NY 97.8% 2.2% 507
NC 98.5% 1.5% 660
OH 97.2% 2.8% 714
OK 97.3% 2.8% 400
OR 96.5% 3.5% 397
PA 95.8% 4.2% 647
RI 97.4% 2.6% 311
SC 96.6% 3.4% 436
TN 93.7% 6.3% 443
UT 97.2% 2.8% 388
VT 99.1% 0.9% 331
VA 98.5% 1.5% 794
WI 96.1% 3.9% 942
WY 97.5% 2.5% 319
Total 97.7% 2.3% 25,105

Appendices | 123
Table D73. Overall, how would you describe your health?
State Excellent Very Good Fairly Good Poor N
AL 8.7% 66.5% 23.7% 1.1% 379
AZ 15.8% 48.8% 31.7% 3.7% 486
AR 20.8% 44.5% 32.5% 2.3% 400
CA 19.3% 47.8% 30.3% 2.5% 8,208
CO 23.4% 48.7% 23.9% 4.1% 394
CT 28.7% 48.3% 21.6% 1.4% 352
DE 20.8% 49.0% 27.2% 3.1% 390
DC 24.1% 57.9% 17.5% 0.5% 411
FL 14.5% 50.7% 32.1% 2.6% 946
GA 15.9% 55.5% 26.7% 2.0% 454
IL 18.7% 60.7% 18.1% 2.5% 359
IN 17.3% 52.2% 27.6% 3.0% 736
KS 10.4% 42.8% 44.4% 2.4% 376
KY 3.4% 31.2% 55.3% 10.1% 414
LA 17.3% 50.8% 30.4% 1.4% 427
ME 23.9% 49.9% 23.4% 2.8% 393
MA 24.5% 49.0% 24.3% 2.2% 412
MI 18.2% 49.2% 29.3% 3.3% 632
MN 19.2% 55.1% 22.6% 3.1% 385
MO 17.6% 50.9% 29.0% 2.5% 397
NE 26.0% 41.7% 28.0% 4.3% 415
NV 26.9% 38.6% 30.1% 4.5% 376
NY 24.7% 49.9% 23.7% 1.8% 503
NC 21.1% 48.7% 28.6% 1.6% 622
OH 23.3% 48.2% 26.0% 2.5% 759
OK 19.0% 52.6% 27.3% 1.0% 399
OR 18.1% 46.1% 31.5% 4.3% 419
PA 20.4% 48.9% 28.1% 2.7% 663
RI 20.8% 47.1% 28.4% 3.8% 342
SC 16.5% 56.5% 25.8% 1.2% 430
TN 16.0% 49.0% 31.5% 3.5% 451
UT 21.5% 51.0% 24.4% 3.1% 386
VT 22.5% 47.3% 27.0% 3.2% 311
VA 18.8% 51.2% 27.7% 2.4% 799
WI 17.2% 39.6% 35.4% 7.8% 944
WY 18.4% 43.0% 35.1% 3.5% 316
Total 19.3% 49.1% 28.6% 3.0% 25,086

Appendices | 124
Table D74. When was his/her last complete annual physical exam?
State In the past
year One year ago
or more N
AL 95.8% 4.2% 380
AZ 86.8% 13.2% 447
AR 97.7% 2.3% 388
CA 83.6% 16.4% 8,102
CO 91.0% 9.0% 310
CT 96.4% 3.6% 330
DE 87.3% 12.7% 362
DC 53.8% 46.2% 392
FL 93.4% 6.6% 957
GA 89.0% 11.0% 462
IL 79.8% 20.2% 331
IN 91.5% 8.5% 714
KS 80.2% 19.8% 369
KY 92.6% 7.4% 367
LA 94.6% 5.4% 427
ME 90.0% 10.0% 391
MA 84.7% 15.3% 406
MI 88.4% 11.6% 570
MN 61.1% 38.9% 373
MO 89.8% 10.2% 394
NE 84.7% 15.3% 399
NV 80.7% 19.3% 378
NY 87.0% 13.0% 471
NC 92.3% 7.7% 611
OH 88.2% 11.8% 568
OK 95.3% 4.8% 400
OR 88.4% 11.6% 372
PA 92.6% 7.4% 618
RI 91.4% 8.6% 269
SC 91.1% 8.9% 395
TN 88.7% 11.3% 432
UT 90.1% 9.9% 353
VT 92.0% 8.0% 327
VA 81.1% 18.9% 778
WI 88.9% 11.1% 906
WY 82.0% 18.0% 328
Total 87.3% 12.7% 24,077

Appendices | 125
Table D75. When was his/her last dentist exam?
State Within the
last six months
Within the past year
One year ago or more
N
AL 51.6% 30.6% 17.8% 343
AZ 44.9% 35.8% 19.3% 399
AR 49.3% 33.9% 16.8% 298
CA 51.7% 26.6% 21.8% 8,024
CO 62.1% 19.7% 18.2% 330
CT 64.2% 31.2% 4.6% 324
DE 31.0% 67.4% 1.6% 319
DC 21.6% 46.7% 31.7% 334
FL 42.1% 42.2% 15.8% 939
GA 38.1% 41.5% 20.4% 417
IL 42.2% 32.4% 25.3% 296
IN 64.6% 21.2% 14.2% 717
KS 42.0% 35.4% 22.6% 314
KY 40.3% 46.3% 13.4% 335
LA 47.9% 29.6% 22.4% 361
ME 39.9% 32.0% 28.1% 366
MA 51.9% 35.0% 13.0% 391
MI 44.3% 30.3% 25.4% 465
MN 54.1% 16.8% 29.1% 381
MO 48.8% 38.9% 12.3% 383
NE 58.9% 29.7% 11.3% 397
NV 22.9% 35.1% 42.0% 350
NY 53.5% 31.5% 14.9% 409
NC 57.7% 23.9% 18.4% 582
OH 34.1% 45.0% 21.0% 496
OK 62.8% 19.8% 17.5% 400
OR 61.8% 19.5% 18.7% 359
PA 54.8% 30.5% 14.7% 564
RI 59.0% 31.3% 9.7% 227
SC 57.0% 31.4% 11.6% 363
TN 58.3% 30.3% 11.4% 412
UT 38.4% 43.6% 18.0% 328
VT 66.1% 20.4% 13.5% 289
VA 36.0% 26.7% 37.3% 692
WI 50.4% 21.1% 28.5% 911
WY 46.7% 31.9% 21.4% 323
Total 48.6% 32.4% 19.0% 22,838

Appendices | 126
Table D76. When was the last time this person had an eye exam/vision screening?
State Within past
year Within past
2 years Within past
3 years Within past
5 years 5 or more years ago
Has never had a vision
screening
N
AL 56.1% 30.8% 7.4% 2.2% 2.9% 0.6% 312
AZ 59.9% 26.5% 4.0% 3.7% 4.2% 1.6% 377
AR 66.7% 18.1% 5.6% 2.2% 6.3% 1.1% 270
CA 52.0% 21.6% 6.4% 4.1% 8.8% 7.1% 7,748
CO 51.9% 23.8% 12.6% 6.3% 5.4% 0.0% 239
CT 68.3% 23.8% 4.2% 1.9% 1.9% 0.0% 265
DE 75.3% 23.7% 1.1% 0.0% 0.0% 0.0% 279
DC 42.8% 38.9% 12.7% 3.1% 0.4% 2.2% 229
FL 48.4% 34.5% 4.4% 4.0% 5.8% 3.0% 910
GA 66.3% 20.5% 3.5% 1.2% 3.2% 5.5% 347
IL 60.3% 27.2% 4.3% 5.4% 2.3% 0.4% 257
IN 53.1% 28.2% 5.4% 3.7% 6.6% 3.0% 708
KS 58.3% 29.0% 6.7% 2.8% 3.2% 0.0% 283
KY 74.6% 13.6% 3.1% 3.1% 4.7% 1.0% 295
LA 66.6% 16.0% 4.3% 2.6% 8.0% 2.6% 350
ME 41.9% 35.1% 13.7% 4.9% 3.6% 0.8% 365
MA 49.7% 36.6% 6.5% 2.6% 2.3% 2.3% 352
MI 50.5% 28.0% 4.8% 3.8% 7.6% 5.3% 396
MN 57.6% 18.3% 7.6% 6.1% 10.5% 0.0% 344
MO 70.6% 24.5% 2.9% 0.8% 1.0% 0.3% 384
NE 64.3% 25.7% 4.7% 2.2% 2.5% 0.5% 401
NV 53.2% 29.9% 4.5% 2.5% 7.0% 2.9% 314
NY 62.5% 22.4% 3.8% 3.0% 6.0% 2.3% 397
NC 49.9% 25.6% 6.9% 3.4% 9.0% 5.2% 465
OH 57.0% 29.3% 5.5% 2.9% 4.2% 1.1% 451
OK 65.7% 10.6% 4.5% 3.5% 13.1% 2.5% 397
OR 49.5% 19.9% 5.2% 6.1% 13.8% 5.5% 327
PA 70.0% 23.1% 2.0% 2.2% 2.0% 0.8% 510
RI 61.4% 26.4% 3.6% 3.6% 3.0% 2.0% 197
SC 78.7% 17.1% 0.3% 1.8% 1.5% 0.6% 334
TN 70.0% 18.9% 4.6% 2.4% 3.0% 1.1% 370
UT 49.2% 28.6% 7.0% 6.5% 8.0% 0.5% 199
VT 51.9% 33.9% 6.4% 4.3% 2.6% 0.9% 233
VA 51.8% 23.6% 3.1% 4.9% 12.4% 4.1% 386
WI 60.7% 18.8% 4.3% 3.3% 8.1% 4.8% 911
WY 57.8% 29.5% 7.1% 3.7% 1.6% 0.3% 322
Total 59.0% 25.1% 5.4% 3.4% 5.2% 2.0% 20,924

Appendices | 127
Table D77. When was the last time this person had a hearing test?
State Within past 5
years 5 years ago or
more Has never
had a hearing test
N
AL 63.9% 13.7% 22.4% 183
AZ 72.3% 20.8% 6.9% 303
AR 57.1% 36.7% 6.2% 177
CA 49.0% 28.5% 22.5% 7,103
CO 85.7% 14.3% 0.0% 70
CT 85.5% 11.5% 3.0% 165
DE 86.4% 13.6% 0.0% 110
DC 87.7% 6.4% 5.9% 203
FL 48.2% 39.3% 12.5% 763
GA 54.1% 20.1% 25.8% 244
IL 66.7% 27.2% 6.2% 162
IN 34.0% 47.0% 19.0% 626
KS 57.9% 36.8% 5.3% 133
KY 60.1% 26.1% 13.8% 188
LA 57.4% 29.3% 13.3% 263
ME 41.7% 34.4% 23.9% 218
MA 63.1% 25.2% 11.7% 282
MI 55.5% 28.9% 15.6% 256
MN 58.1% 41.9% 0.0% 217
MO 52.2% 23.3% 24.5% 249
NE 73.8% 22.2% 4.0% 374
NV 39.1% 28.1% 32.8% 235
NY 67.6% 24.0% 8.4% 358
NC 50.8% 33.7% 15.5% 323
OH 52.5% 31.3% 16.2% 259
OK 36.5% 34.9% 28.6% 378
OR 30.6% 40.3% 29.1% 278
PA 84.0% 10.2% 5.8% 325
RI 65.5% 20.4% 14.2% 113
SC 64.7% 21.0% 14.4% 167
TN 85.5% 11.6% 2.9% 311
UT 55.9% 38.6% 5.5% 127
VT 65.2% 29.3% 5.5% 164
VA 47.7% 36.0% 16.3% 258
WI 38.6% 32.1% 29.3% 791
WY 29.4% 52.9% 17.6% 170
Total 59.0% 27.5% 13.5% 16,546

Appendices | 128
Table D78. If female, when was her last Pap test screening? (among women 21 and older)
State Within past
year Within past
2 years Within past
3 years Within past
5 years 5 or more years ago
Has never had a Pap test
N
AL 46.4% 17.9% 3.6% 8.9% 7.1% 16.1% 112
AZ 36.4% 14.5% 4.5% 4.5% 10.9% 29.1% 110
AR 48.1% 18.5% 6.2% 3.7% 11.1% 12.3% 81
CA 28.2% 14.8% 5.7% 4.0% 9.3% 38.0% 2,933
CO 12.5% 29.2% 8.3% 29.2% 20.8% 0.0% 24
CT 55.7% 20.6% 8.2% 4.1% 6.2% 5.2% 97
DE 58.9% 26.3% 5.3% 3.2% 4.2% 2.1% 95
DC 32.7% 45.5% 14.5% 5.5% 1.8% 0.0% 55
FL 35.9% 17.7% 7.7% 3.6% 5.2% 29.8% 362
GA 43.0% 16.3% 4.4% 3.7% 7.4% 25.2% 135
IL 37.9% 21.2% 9.1% 1.5% 7.6% 22.7% 66
IN 28.9% 10.5% 6.1% 7.9% 7.0% 39.5% 228
KS 28.9% 18.6% 6.2% 9.3% 11.3% 25.8% 97
KY 40.3% 16.9% 9.1% 7.8% 13.0% 13.0% 77
LA 48.2% 13.5% 7.1% 7.1% 7.8% 16.3% 141
ME 30.7% 20.8% 6.9% 4.0% 12.9% 24.8% 101
MA 28.9% 21.5% 7.4% 11.1% 19.3% 11.9% 135
MI 40.1% 14.6% 4.4% 5.1% 10.2% 25.5% 137
MN 17.7% 18.8% 12.5% 11.5% 39.6% 0.0% 96
MO 38.8% 14.9% 6.7% 6.7% 9.7% 23.1% 134
NE 18.6% 7.8% 10.9% 15.5% 19.4% 27.9% 129
NV 41.9% 15.2% 2.9% 1.0% 7.6% 31.4% 105
NY 39.2% 16.7% 4.2% 6.7% 6.7% 26.7% 120
NC 33.3% 13.1% 5.9% 7.2% 9.2% 31.4% 153
OH 42.0% 17.6% 6.9% 5.3% 7.6% 20.6% 131
OK 24.9% 16.0% 6.5% 5.9% 14.2% 32.5% 169
OR 25.0% 11.8% 2.9% 5.9% 13.2% 41.2% 68
PA 42.0% 24.6% 5.1% 4.3% 8.7% 15.2% 138
RI 49.0% 18.4% 2.0% 6.1% 6.1% 18.4% 49
SC 52.9% 12.9% 3.5% 3.5% 12.9% 14.1% 85
TN 32.5% 23.0% 7.9% 7.1% 10.3% 19.0% 126
UT 36.8% 7.9% 7.9% 10.5% 18.4% 18.4% 38
VT 35.4% 18.2% 11.1% 7.1% 15.2% 13.1% 99
VA 35.9% 13.5% 2.6% 10.3% 13.5% 24.4% 156
WI 32.2% 11.7% 7.4% 4.5% 14.4% 29.8% 376
WY 30.4% 28.4% 4.9% 2.0% 15.7% 18.6% 102
Total 36.4% 18.0% 6.6% 6.8% 11.5% 20.6% 7,260

Appendices | 129
Table D79. If female, when was her last mammogram? (among women age 40 and over)
State Within past
year Within past
2 years Within past
3 years Within past
5 years 5 or more years ago
Has never had a
mammogram
N
AL 54.9% 14.6% 6.1% 7.3% 2.4% 14.6% 82
AZ 35.2% 27.8% 3.7% 5.6% 7.4% 20.4% 54
AR 50.0% 16.7% 7.1% 7.1% 7.1% 11.9% 42
CA 50.5% 17.1% 5.2% 3.3% 5.4% 18.5% 1,505
CO 25.0% 25.0% 10.7% 25.0% 14.3% 0.0% 28
CT 63.2% 22.4% 6.6% 1.3% 3.9% 2.6% 76
DE 64.6% 20.0% 6.2% 6.2% 1.5% 1.5% 65
DC 40.0% 42.5% 12.5% 2.5% 0.0% 2.5% 40
FL 55.6% 17.2% 6.1% 3.3% 0.6% 17.2% 180
GA 72.4% 10.5% 0.0% 5.3% 3.9% 7.9% 76
IL 53.7% 18.5% 13.0% 3.7% 1.9% 9.3% 54
IN 51.0% 13.3% 2.0% 5.1% 3.1% 25.5% 98
KS 41.9% 27.9% 7.0% 4.7% 7.0% 11.6% 43
KY 57.9% 26.3% 0.0% 5.3% 7.9% 2.6% 38
LA 65.2% 14.1% 0.0% 3.3% 4.3% 13.0% 92
ME 49.2% 29.5% 9.8% 1.6% 1.6% 8.2% 61
MA 42.2% 27.5% 5.9% 3.9% 12.7% 7.8% 102
MI 54.6% 16.5% 4.1% 6.2% 4.1% 14.4% 97
MN 63.2% 14.7% 5.9% 5.9% 10.3% 0.0% 68
MO 61.4% 14.5% 3.6% 3.6% 3.6% 13.3% 83
NE 31.7% 19.0% 7.9% 4.8% 1.6% 34.9% 63
NV 56.3% 20.8% 2.1% 2.1% 4.2% 14.6% 48
NY 60.3% 17.6% 1.5% 2.9% 5.9% 11.8% 68
NC 46.6% 26.0% 1.4% 5.5% 4.1% 16.4% 73
OH 57.1% 20.2% 6.0% 3.6% 4.8% 8.3% 84
OK 46.7% 16.2% 4.8% 2.9% 4.8% 24.8% 105
OR 54.5% 18.2% 6.1% 3.0% 6.1% 12.1% 33
PA 67.6% 16.7% 1.0% 2.9% 2.0% 9.8% 102
RI 68.8% 16.7% 6.3% 4.2% 0.0% 4.2% 48
SC 71.4% 14.3% 4.8% 4.8% 0.0% 4.8% 63
TN 59.6% 19.1% 3.4% 4.5% 4.5% 9.0% 89
UT 48.3% 20.7% 6.9% 13.8% 3.4% 6.9% 29
VT 56.3% 20.3% 3.1% 1.6% 7.8% 10.9% 64
VA 53.2% 9.6% 7.4% 7.4% 9.6% 12.8% 94
WI 49.3% 16.9% 4.9% 1.3% 11.6% 16.0% 225
WY 39.6% 29.2% 2.1% 2.1% 6.3% 20.8% 48
Total 53.3% 19.9% 5.1% 4.9% 5.0% 11.7% 4,120

Appendices | 130
Table D80. When was the last time this person had a screening for colorectal cancer (among people age 50 and over) ∞
State
Colonoscopy within past 10
years
Flexible sigmoidoscopy
within past 5 years
Fecal occult blood test
Never had a screening or
screening was more
than 10 years ago
N
AL 33.8% 1.4% 2.0% 18.9% 148
AZ 26.1% 1.1% 8.0% 21.6% 88
AR 22.8% 0.0% 5.3% 10.5% 114
CA 31.1% 2.2% 9.1% 32.1% 2,356
CO 22.4% 1.7% 0.0% 0.0% 116
CT 53.6% 1.8% 6.5% 5.4% 168
DE 37.4% 1.0% 1.0% 0.5% 195
DC 27.2% 1.0% 0.0% 1.0% 206
FL 42.2% 2.0% 3.3% 32.8% 244
GA 29.3% 0.0% 0.0% 16.8% 167
IL 27.0% 0.9% 1.8% 12.6% 111
IN 37.1% 0.0% 2.0% 32.5% 151
KS 23.4% 0.9% 6.3% 16.2% 111
KY 28.9% 0.0% 0.0% 14.9% 114
LA 33.3% 2.6% 9.2% 13.7% 153
ME 31.7% 0.8% 1.7% 11.7% 120
MA 48.4% 3.2% 2.1% 16.8% 190
MI 26.0% 0.4% 1.6% 10.4% 250
MN 30.7% 0.0% 0.7% 0.0% 153
MO 52.0% 0.7% 5.4% 20.3% 148
NE 40.2% 0.8% 28.0% 19.7% 132
NV 22.8% 1.0% 2.0% 29.7% 101
NY 45.7% 1.8% 4.3% 9.1% 164
NC 43.6% 2.0% 4.0% 10.1% 149
OH 22.4% 0.0% 3.4% 11.6% 232
OK 55.1% 0.7% 4.8% 36.1% 147
OR 17.0% 1.5% 5.2% 12.6% 135
PA 26.0% 0.0% 2.4% 6.9% 246
RI 34.4% 0.0% 5.7% 10.7% 122
SC 34.9% 0.0% 0.5% 7.0% 186
TN 33.2% 1.6% 4.7% 12.6% 190
UT 31.5% 0.0% 0.0% 6.5% 92
VT 47.2% 0.0% 6.5% 11.1% 108
VA 28.1% 0.3% 3.3% 10.0% 299
WI 39.2% 1.1% 4.8% 24.1% 357
WY 27.0% 1.1% 2.2% 19.1% 89
Total 33.7% 0.9% 4.1% 14.6% 8,052
∞ Categories are not mutually exclusive

Appendices | 131
Table D81. During the last 12 months, has this person had a flu vaccination?
State Yes No N
AL 71.0% 29.0% 283
AZ 74.0% 26.0% 285
AR 82.2% 17.8% 269
CA 67.9% 32.1% 8,046
CO 75.7% 24.3% 107
CT 92.8% 7.2% 236
DE 88.1% 11.9% 268
DC 28.4% 71.6% 225
FL 59.8% 40.2% 915
GA 72.7% 27.3% 363
IL 73.1% 26.9% 201
IN 60.3% 39.7% 711
KS 82.5% 17.5% 291
KY 73.8% 26.2% 244
LA 85.2% 14.8% 317
ME 83.5% 16.5% 242
MA 77.0% 23.0% 309
MI 77.4% 22.6% 394
MN 100.0% 0.0% 133
MO 87.2% 12.8% 368
NE 81.4% 18.6% 382
NV 54.0% 46.0% 252
NY 78.9% 21.1% 374
NC 74.3% 25.7% 447
OH 69.6% 30.4% 335
OK 72.8% 27.2% 397
OR 68.5% 31.5% 371
PA 79.9% 20.1% 319
RI 95.0% 5.0% 218
SC 83.7% 16.3% 252
TN 79.2% 20.8% 284
UT 90.0% 10.0% 190
VT 84.6% 15.4% 228
VA 86.7% 13.3% 482
WI 72.0% 28.0% 926
WY 73.7% 26.3% 274
Total 76.6% 23.4% 19,938

Appendices | 132
Medications (un-collapsed and un-weighted)
Table D82. Takes at least one medication to treat mood disorders, anxiety, psychotic disorders and/or behavior challenge
State Yes No N
AL 60.3% 39.7% 375
AZ 39.8% 60.2% 480
AR 55.8% 44.2% 385
CA 38.5% 61.5% 8,261
CO 57.8% 42.2% 322
CT 52.3% 47.7% 354
DE 67.7% 32.3% 347
DC 47.2% 52.8% 392
FL 46.6% 53.4% 954
GA 49.5% 50.5% 467
IL 52.8% 47.2% 358
IN 46.5% 53.5% 727
KS 64.8% 35.2% 381
KY 60.6% 39.4% 393
LA 58.2% 41.8% 407
ME 57.3% 42.7% 370
MA 60.0% 40.0% 402
MI 57.5% 42.5% 616
MN 58.6% 41.4% 372
MO 69.4% 30.6% 399
NE 53.3% 46.7% 396
NV 54.6% 45.4% 377
NY 50.2% 49.8% 472
NC 53.3% 46.7% 642
OH 47.5% 52.5% 669
OK 60.2% 39.8% 397
PA 52.8% 47.2% 619
RI 60.6% 39.4% 277
SC 51.7% 48.3% 420
TN 58.5% 41.5% 407
UT 63.6% 36.4% 382
VT 56.1% 43.9% 328
VA 60.6% 39.4% 797
WI 61.9% 38.1% 535
WY 53.6% 46.4% 323
Total 55.4% 44.6% 23,803

Appendices | 133
Table D83. Does this person currently take medications to treat mood disorders, anxiety, and/or psychotic disorders?
State Yes No N
AL 55.7% 44.3% 375
AZ 37.6% 62.4% 476
AR 51.1% 48.9% 378
CA 34.6% 65.4% 8,262
CO 52.2% 47.8% 320
CT 49.3% 50.7% 355
DE 60.7% 39.3% 346
DC 44.0% 56.0% 398
FL 42.0% 58.0% 959
GA 45.1% 54.9% 470
IL 46.5% 53.5% 357
IN 42.0% 58.0% 727
KS 60.6% 39.4% 383
KY 57.2% 42.8% 395
LA 50.9% 49.1% 403
ME 55.0% 45.0% 371
MA 58.0% 42.0% 398
MI 54.2% 45.8% 616
MN 56.0% 44.0% 373
MO 65.8% 34.2% 398
NE 41.6% 58.4% 397
NV 51.1% 48.9% 378
NY 46.0% 54.0% 472
NC 49.1% 50.9% 647
OH 45.2% 54.8% 677
OK 55.9% 44.1% 397
PA 50.1% 49.9% 621
RI 55.6% 44.4% 275
SC 48.6% 51.4% 418
TN 54.8% 45.2% 418
UT 59.7% 40.3% 380
VT 55.0% 45.0% 327
VA 55.8% 44.2% 794
WI 58.8% 41.2% 536
WY 51.4% 48.6% 323
Total 51.3% 48.7% 23,820

Appendices | 134
Table D84. How many medications does this person currently take to treat mood disorders, anxiety, and/or psychotic disorders?
State 1-2
medications 3-4
medications 5-10
medications 11 or more
medications N
AL 64.7% 27.5% 7.7% 0.0% 207
AZ 64.0% 29.7% 6.4% 0.0% 172
AR 71.1% 27.4% 1.6% 0.0% 190
CA 61.6% 26.0% 10.4% 2.0% 2,699
CO 70.9% 27.7% 1.4% 0.0% 148
CT 79.5% 18.7% 1.8% 0.0% 171
DE 69.7% 28.5% 1.8% 0.0% 165
DC 90.1% 9.9% 0.0% 0.0% 151
FL 78.8% 19.5% 1.7% 0.0% 401
GA 59.8% 31.1% 9.1% 0.0% 209
IL 80.0% 17.0% 3.0% 0.0% 165
IN 81.2% 17.2% 1.3% 0.3% 303
KS 69.1% 24.3% 6.5% 0.0% 230
KY 67.1% 29.6% 3.2% 0.0% 216
LA 65.2% 30.3% 4.5% 0.0% 198
ME 70.4% 22.6% 6.5% 0.5% 186
MA 54.9% 35.0% 8.8% 1.3% 226
MI 60.6% 32.0% 7.1% 0.3% 325
MN 63.6% 24.7% 10.6% 1.0% 198
MO 66.3% 28.3% 5.4% 0.0% 258
NE 70.6% 27.0% 2.5% 0.0% 163
NV 69.7% 27.7% 2.7% 0.0% 188
NY 75.9% 18.5% 5.6% 0.0% 195
NC 72.6% 24.1% 3.3% 0.0% 307
OH 75.0% 20.6% 4.4% 0.0% 272
OK 59.5% 32.0% 8.6% 0.0% 222
PA 63.3% 27.3% 9.4% 0.0% 297
RI 64.5% 31.9% 2.9% 0.7% 138
SC 62.9% 28.9% 8.1% 0.0% 197
TN 67.3% 29.8% 3.0% 0.0% 168
UT 64.1% 23.8% 12.1% 0.0% 223
VT 77.0% 21.3% 1.7% 0.0% 178
VA 63.7% 28.5% 7.8% 0.0% 421
WI 66.0% 28.5% 5.5% 0.0% 309
WY 74.2% 22.7% 3.1% 0.0% 163
Total 69.0% 25.7% 5.1% 0.2% 10,259

Appendices | 135
Table D85. Does this person currently take medications for behavioral challenges?
State Yes No N
AL 25.3% 74.7% 380
AZ 24.4% 75.6% 480
AR 30.7% 69.3% 387
CA 15.5% 84.5% 8,250
CO 24.9% 75.1% 301
CT 25.1% 74.9% 362
DE 46.2% 53.8% 331
DC 33.9% 66.1% 375
FL 19.0% 81.0% 953
GA 16.3% 83.7% 467
IL 30.7% 69.3% 361
IN 18.5% 81.5% 724
KS 37.5% 62.5% 376
KY 20.6% 79.4% 394
LA 31.3% 68.7% 428
ME 20.8% 79.2% 371
MA 23.1% 76.9% 407
MI 26.4% 73.6% 622
MN 29.6% 70.4% 371
MO 28.3% 71.7% 396
NE 38.5% 61.5% 397
NV 26.9% 73.1% 375
NY 26.3% 73.7% 475
NC 30.9% 69.1% 628
OH 13.8% 86.2% 673
OK 21.2% 78.8% 397
PA 17.5% 82.5% 622
RI 32.2% 67.8% 270
SC 29.0% 71.0% 431
TN 26.9% 73.1% 394
UT 37.3% 62.7% 381
VT 15.6% 84.4% 327
VA 30.2% 69.8% 789
WI 26.2% 73.8% 531
WY 19.0% 81.0% 327
Total 26.3% 73.7% 23,753

Appendices | 136
Table D86. How many medications does this person currently take medications for behavioral challenges?
State 1-2
medications 3-4
medications 5-10
medications 11 or more
medications N
AL 74.7% 22.1% 2.1% 1.1% 95
AZ 74.8% 20.9% 4.3% 0.0% 115
AR 77.4% 20.9% 1.7% 0.0% 115
CA 71.5% 21.3% 6.6% 0.6% 1,241
CO 82.6% 15.9% 1.4% 0.0% 69
CT 89.9% 10.1% 0.00% 0.0% 89
DE 78.4% 19.8% 1.8% 0.0% 111
DC 89.2% 10.8% 0.00% 0.0% 111
FL 86.1% 11.7% 2.2% 0.0% 180
GA 59.2% 28.9% 11.8% 0.0% 76
IL 86.5% 12.6% 0.9% 0.0% 111
IN 88.0% 10.5% 1.5% 0.0% 133
KS 82.1% 14.3% 3.6% 0.0% 140
KY 81.8% 15.6% 2.6% 0.0% 77
LA 66.7% 28.0% 5.3% 0.0% 132
ME 82.4% 7.4% 8.8% 1.5% 68
MA 78.3% 16.3% 4.3% 1.1% 92
MI 73.1% 21.9% 4.4% 0.6% 160
MN 80.4% 13.7% 5.9% 0.0% 102
MO 80.9% 12.7% 6.4% 0.0% 110
NE 74.5% 24.2% 1.3% 0.0% 153
NV 72.7% 24.2% 3.0% 0.0% 99
NY 84.3% 14.8% 0.9% 0.0% 108
NC 80.0% 15.8% 4.2% 0.0% 190
OH 81.1% 17.8% 1.1% 0.0% 90
OK 79.8% 19.0% 1.2% 0.0% 84
PA 80.0% 13.3% 6.7% 0.0% 105
RI 84.4% 15.6% 0.0% 0.0% 77
SC 62.2% 26.9% 10.9% 0.0% 119
TN 83.8% 15.0% 1.3% 0.0% 80
UT 73.6% 17.9% 7.9% 0.7% 140
VT 92.0% 8.0% 0.0% 0.0% 50
VA 80.3% 13.5% 6.3% 0.0% 223
WI 72.8% 25.7% 1.5% 0.0% 136
WY 74.6% 22.0% 3.4% 0.0% 59
Total 78.9% 17.4% 3.6% 0.2% 5,040

Appendices | 137
Table D87. Does this person have a behavior plan?
State Yes No N
AL 22.6% 77.4% 381
AZ 18.7% 81.3% 492
AR 40.9% 59.1% 396
CA 28.4% 71.6% 7957
CO 28.7% 71.3% 328
CT 44.8% 55.2% 364
DE 66.1% 33.9% 386
DC 52.7% 47.3% 387
FL 15.5% 84.5% 961
GA 8.6% 91.4% 475
IL 39.5% 60.5% 365
IN 39.3% 60.7% 730
KS 57.3% 42.7% 382
KY 27.3% 72.7% 406
LA 25.6% 74.4% 426
ME 9.4% 90.6% 394
MA 22.1% 77.9% 408
MI 17.3% 82.7% 636
MN 38.2% 61.8% 364
MO 11.5% 88.5% 399
NE 33.8% 66.2% 393
NV 38.6% 61.4% 386
NY 33.5% 66.5% 493
NC 24.2% 75.8% 653
OH 8.2% 91.8% 736
OK 32.5% 67.5% 400
OR 23.9% 76.1% 423
PA 30.6% 69.4% 640
RI 35.8% 64.2% 296
SC 18.6% 81.4% 440
TN 25.3% 74.7% 438
UT 39.4% 60.6% 393
VT 26.6% 73.4% 331
VA 20.2% 79.8% 798
WI 11.9% 88.1% 539
WY 24.9% 75.1% 329
Total 29.0% 71.0% 24325

Appendices | 138
Table D88. Has a behavior plan (among those who take medication for a behavior challenge)
State Yes No N
AL 61.5% 38.5% 96
AZ 55.6% 44.4% 117
AR 88.0% 12.0% 117
CA 72.2% 27.8% 1,232
CO 57.4% 42.6% 68
CT 85.6% 14.4% 90
DE 96.7% 3.3% 152
DC 96.8% 3.2% 125
FL 46.7% 53.3% 180
GA 34.2% 65.8% 76
IL 76.1% 23.9% 109
IN 77.3% 22.7% 132
KS 89.4% 10.6% 141
KY 58.8% 41.3% 80
LA 47.7% 52.3% 130
ME 26.7% 73.3% 75
MA 58.2% 41.8% 91
MI 36.0% 64.0% 161
MN 71.3% 28.7% 101
MO 26.1% 73.9% 111
NE 76.7% 23.3% 146
NV 80.2% 19.8% 101
NY 72.4% 27.6% 123
NC 50.0% 50.0% 194
OH 32.3% 67.7% 93
OK 61.9% 38.1% 84
PA 72.0% 28.0% 107
RI 70.9% 29.1% 86
SC 50.0% 50.0% 122
TN 53.3% 46.7% 105
UT 69.7% 30.3% 142
VT 62.7% 37.3% 51
VA 43.8% 56.2% 235
WI 34.8% 65.2% 135
WY 58.1% 41.9% 62
Total 61.5% 38.5% 5,170

Appendices | 139
Wellness (un-collapsed and un-weighted)
Table D89. How often do you exercise or do physical activity for at least 10 minutes at a time? º
State None One or two
times Three or four
times Five or more
times N
AL 26.7% 31.0% 24.9% 17.5% 378
AZ 28.7% 25.2% 18.2% 27.9% 484
AR 20.9% 16.8% 24.1% 38.2% 398
CA 29.3% 23.1% 18.4% 29.1% 8,180
CO 25.4% 28.0% 21.4% 25.2% 393
CT 16.3% 36.4% 19.8% 27.5% 349
DE 36.5% 26.3% 18.2% 19.0% 384
DC 6.3% 46.7% 26.3% 20.7% 411
FL 33.1% 31.1% 16.9% 18.9% 940
GA 15.3% 45.8% 23.7% 15.3% 452
IL 22.4% 34.0% 17.8% 25.8% 353
IN 34.3% 25.5% 19.5% 20.7% 729
KS 22.3% 31.2% 19.1% 27.4% 372
KY 54.9% 20.1% 20.4% 4.6% 412
LA 27.8% 24.2% 18.4% 29.6% 425
ME 24.7% 31.1% 22.2% 21.9% 392
MA 19.6% 32.9% 17.8% 29.7% 404
MI 26.5% 28.2% 19.5% 25.8% 635
MN 23.1% 29.4% 21.0% 26.5% 377
MO 34.5% 22.3% 11.9% 31.2% 394
NE 14.4% 39.7% 23.1% 22.8% 403
NV 26.1% 30.8% 17.4% 25.8% 380
NY 29.6% 25.0% 20.2% 25.2% 504
NC 19.3% 19.4% 22.2% 39.2% 618
OH 24.5% 26.8% 20.1% 28.6% 751
OK 45.9% 15.5% 16.0% 22.6% 399
OR 23.5% 22.1% 17.0% 37.4% 417
PA 29.4% 27.0% 14.1% 29.5% 660
RI 14.1% 33.2% 18.8% 33.8% 340
SC 25.9% 21.5% 20.6% 32.0% 441
TN 21.3% 22.2% 19.0% 37.4% 436
UT 20.7% 22.8% 16.5% 40.1% 382
VT 16.6% 24.4% 24.4% 34.5% 307
VA 24.5% 23.8% 18.8% 32.9% 791
WI 30.1% 22.3% 18.7% 28.9% 937
WY 20.5% 31.1% 14.1% 34.3% 312
Total 25.4% 27.7% 19.5% 27.4% 24,940
ºQuestion changed from previous years to reflect federal guidelines on physical activity more closely

Appendices | 140
Table D90. How often do you exercise or do physical activity that makes the muscles in your arms, legs, back or chest work hard? º
State None One or two
times Three or four
times Five or more
times N
AL 78.3% 13.0% 6.3% 2.4% 378
AZ 51.1% 22.9% 11.2% 14.8% 481
AR 69.9% 15.2% 5.7% 9.2% 402
CA 68.2% 15.1% 8.2% 8.5% 8159
CO 62.7% 19.2% 9.5% 8.7% 391
CT 45.2% 24.9% 13.2% 16.8% 334
DE 82.6% 9.2% 4.2% 4.0% 379
DC 42.7% 33.9% 17.3% 6.1% 410
FL 64.6% 21.2% 6.9% 7.3% 932
GA 56.7% 28.7% 8.1% 6.5% 446
IL 62.2% 14.8% 10.2% 12.8% 352
IN 73.4% 14.2% 6.2% 6.2% 725
KS 63.1% 27.6% 3.9% 5.4% 355
KY 64.5% 16.2% 16.7% 2.7% 414
LA 65.5% 16.4% 6.6% 11.5% 426
ME 57.8% 22.0% 9.0% 11.3% 391
MA 53.3% 21.8% 10.0% 15.0% 400
MI 65.2% 14.6% 9.0% 11.2% 632
MN 54.9% 22.6% 10.0% 12.6% 381
MO 66.9% 15.3% 7.6% 10.2% 393
NE 42.4% 40.7% 9.2% 7.7% 413
NV 70.4% 17.9% 5.0% 6.6% 379
NY 65.7% 18.1% 10.1% 6.2% 504
NC 62.0% 16.7% 11.8% 9.5% 618
OH 69.5% 14.2% 7.7% 8.6% 745
OK 73.1% 9.3% 4.5% 13.1% 398
OR 73.4% 13.4% 6.2% 7.0% 417
PA 54.5% 19.3% 9.0% 17.2% 657
RI 49.6% 23.6% 8.6% 18.3% 339
SC 85.9% 5.2% 3.9% 5.0% 440
TN 54.9% 17.1% 10.9% 17.1% 432
UT 55.4% 16.4% 8.7% 19.5% 379
VT 51.6% 21.9% 14.7% 11.8% 306
VA 68.9% 16.0% 7.2% 7.9% 782
WI 60.3% 18.5% 7.8% 13.4% 935
WY 56.7% 22.1% 10.3% 10.9% 312
64.5% 17.5% 8.5% 9.5% 24837
ºNew question in 2017-18

Appendices | 141
Table D91. Body Mass Index (BMI) category (BMI calculated using data on weight and height)
State Underweight Healthy Overweight Obese N
AL 4.0% 20.0% 31.7% 44.3% 375
AZ 5.9% 37.2% 29.0% 27.9% 341
AR 5.8% 24.9% 26.7% 42.6% 397
CA 5.3% 32.8% 28.9% 33.0% 8,268
CO 7.6% 38.2% 27.6% 26.6% 369
CT 2.9% 36.2% 23.2% 37.7% 207
DE 2.6% 30.3% 31.1% 36.1% 380
DC 5.4% 33.6% 25.6% 35.3% 351
FL 5.9% 34.8% 31.7% 27.6% 798
GA 4.3% 31.6% 34.2% 29.9% 351
IL 3.9% 28.5% 25.7% 41.9% 358
IN 6.8% 25.2% 27.8% 40.1% 705
KS 2.0% 29.2% 27.5% 41.3% 346
KY 4.6% 26.5% 24.7% 44.3% 393
LA 4.3% 34.6% 27.2% 33.8% 393
ME 4.5% 24.7% 28.5% 42.3% 267
MA 2.8% 34.8% 28.1% 34.3% 391
MI 5.9% 34.8% 25.3% 34.1% 558
MN 5.1% 29.1% 30.5% 35.3% 354
MO 5.1% 27.2% 29.7% 37.9% 390
NE 5.6% 37.1% 26.8% 30.5% 410
NV 4.5% 28.3% 26.0% 41.2% 381
NY 6.0% 28.8% 30.4% 34.8% 448
NC 8.3% 33.0% 25.7% 33.0% 530
OH 5.8% 29.6% 30.2% 34.4% 500
OK 6.0% 30.8% 26.8% 36.5% 400
OR 4.0% 25.1% 28.6% 42.3% 350
PA 5.8% 28.3% 27.4% 38.6% 329
RI 4.3% 28.2% 35.0% 32.5% 280
SC 2.6% 29.2% 29.2% 39.0% 267
TN 6.4% 29.7% 27.2% 36.6% 404
UT 7.0% 34.9% 27.6% 30.5% 370
VT 2.7% 31.3% 26.7% 39.2% 329
VA 5.4% 30.9% 28.4% 35.3% 570
WI 5.2% 28.1% 28.0% 38.7% 911
WY 4.7% 33.5% 28.5% 33.2% 316
Total 5.0% 30.6% 28.3% 36.2% 22,787

Appendices | 142
Table D92. Does this person use nicotine or tobacco products?
State Yes No N
AL 8.5% 91.5% 377
AZ 4.2% 95.8% 477
AR 9.6% 90.4% 397
CA 5.5% 94.5% 8,177
CO 8.6% 91.4% 397
CT 3.9% 96.1% 357
DE 7.7% 92.3% 363
DC 4.1% 95.9% 364
FL 4.3% 95.7% 954
GA 3.9% 96.1% 463
IL 5.3% 94.7% 360
IN 6.0% 94.0% 730
KS 11.1% 88.9% 380
KY 14.9% 85.1% 404
LA 6.2% 93.8% 389
ME 9.1% 90.9% 385
MA 5.7% 94.3% 406
MI 6.6% 93.4% 636
MN 8.5% 91.5% 388
MO 8.3% 91.7% 396
NE 8.1% 91.9% 408
NV 6.3% 93.8% 384
NY 5.0% 95.0% 497
NC 4.5% 95.5% 644
OH 13.0% 87.0% 694
OK 9.5% 90.5% 400
OR 11.3% 88.7% 391
PA 7.0% 93.0% 615
RI 3.9% 96.1% 331
SC 9.8% 90.2% 430
TN 6.1% 93.9% 444
UT 8.0% 92.0% 388
VT 9.1% 90.9% 329
VA 5.7% 94.3% 768
WI 11.6% 88.4% 946
WY 8.8% 91.2% 319
Total 7.5% 92.5% 24,788

Appendices 143
Respect and Rights (un-collapsed and unweighted)
Table D93. Do you have a key to your home?
State Yes Maybe No N
AL 53.9% 2.4% 43.7% 371
AR 87.4% 0.3% 12.4% 396
AZ 39.4% 1.2% 59.3% 487
CA 43.8% 0.4% 55.7% 8,202
CO 52.5% 2.0% 45.4% 394
CT 44.3% 0.9% 54.8% 352
DC 44.3% 3.2% 52.5% 402
DE 50.5% 0.0% 49.5% 380
FL 54.5% 1.5% 44.0% 926
GA 38.5% 2.2% 59.3% 418
IL 39.3% 0.9% 59.9% 349
IN 59.4% 0.7% 39.9% 729
KS 56.6% 3.0% 40.4% 369
KY 40.0% 1.2% 58.8% 410
LA 37.9% 0.9% 61.2% 430
MA 48.2% 0.8% 51.0% 396
ME 74.0% 0.8% 25.2% 389
MI 41.4% 0.5% 58.1% 635
MN 44.5% 0.5% 54.9% 384
MO 43.4% 0.8% 55.8% 394
NC 41.2% 0.8% 58.0% 619
NE 81.8% 0.0% 18.2% 407
NV 63.1% 1.0% 35.9% 382
NY 46.3% 0.4% 53.3% 505
OH 57.0% 0.8% 42.2% 747
OK 40.5% 0.5% 59.0% 398
OR 62.9% 0.7% 36.4% 423
PA 46.4% 0.8% 52.9% 647
RI 51.2% 1.5% 47.4% 342
SC 48.5% 1.1% 50.3% 435
TN 47.1% 3.0% 49.9% 429
UT 45.4% 0.8% 53.8% 381
VA 52.9% 0.6% 46.5% 796
VT 59.2% 0.0% 40.8% 314
WI 49.7% 1.1% 49.3% 940
WY 64.1% 1.9% 34.0% 315
Total 51.4% 1.1% 47.5% 24,893

Appendices 144
Table D94. Do people let you know before they come into your home?
State Yes Sometimes No N
AL 93.5% 4.6% 1.9% 324
AR 91.8% 6.4% 1.8% 330
AZ 81.6% 15.8% 2.5% 316
CA 92.1% 5.0% 3.0% 5,146
CO 89.7% 6.6% 3.7% 272
CT 90.5% 5.3% 4.2% 283
DC 85.4% 9.7% 4.9% 185
DE 83.0% 10.4% 6.6% 259
FL 93.8% 3.1% 3.1% 579
GA 88.2% 10.7% 1.1% 271
IL 93.4% 5.0% 1.6% 258
IN 93.7% 3.3% 3.0% 574
KS 86.4% 10.1% 3.5% 257
KY 95.7% 1.1% 3.2% 281
LA 93.8% 3.5% 2.8% 288
MA 90.9% 5.2% 3.9% 309
ME 83.8% 11.5% 4.8% 314
MI 93.2% 4.9% 1.9% 411
MN 90.0% 5.9% 4.1% 290
MO 91.5% 5.0% 3.5% 258
NC 91.6% 4.2% 4.2% 333
NE 95.8% 2.8% 1.4% 287
NV 87.3% 6.3% 6.3% 300
NY 84.6% 9.4% 6.0% 319
OH 90.7% 5.7% 3.7% 547
OK 86.0% 9.1% 4.9% 264
OR 86.9% 7.0% 6.0% 298
PA 91.9% 6.0% 2.1% 430
RI 86.6% 7.6% 5.8% 277
SC 96.7% 2.3% 1.0% 389
TN 94.7% 3.1% 2.2% 323
UT 91.2% 5.0% 3.8% 239
VA 93.7% 4.8% 1.5% 475
VT 87.7% 7.9% 4.3% 253
WI 93.1% 3.8% 3.0% 625
WY 87.0% 8.2% 4.8% 208
Total 90.2% 6.3% 3.5% 16,772

Appendices 145
Table D95. Can you lock your bedroom if you want to?
State Yes Maybe No N
AL 56.0% 20.9% 23.1% 359
AR 62.3% 3.4% 34.3% 350
AZ 49.3% 4.0% 46.8% 477
CA 39.3% 1.7% 59.0% 7,772
CO 45.1% 4.1% 50.8% 364
CT 44.9% 11.1% 43.9% 305
DC 29.3% 6.5% 64.3% 400
DE 62.5% 1.9% 35.6% 376
FL 73.9% 3.5% 22.5% 875
GA 73.5% 6.3% 20.2% 396
IL 43.9% 4.7% 51.3% 337
IN 50.7% 4.0% 45.4% 681
KS 54.3% 9.5% 36.3% 317
KY 66.3% 4.4% 29.3% 389
LA 38.4% 2.2% 59.4% 414
MA 65.2% 1.8% 33.0% 382
ME 42.7% 3.9% 53.4% 307
MI 43.9% 2.5% 53.6% 608
MN 52.9% 3.1% 44.0% 357
MO 50.8% 4.0% 45.2% 374
NC 53.5% 3.6% 42.9% 609
NE 49.9% 3.8% 46.3% 369
NV 53.8% 3.3% 42.9% 333
NY 37.5% 3.9% 58.6% 485
OH 48.0% 4.9% 47.1% 690
OK 33.7% 1.8% 64.5% 386
OR 66.2% 1.0% 32.7% 385
PA 44.9% 4.5% 50.5% 594
RI 44.0% 3.1% 52.9% 323
SC 70.6% 0.9% 28.5% 428
TN 52.8% 7.3% 39.9% 426
UT 51.0% 3.6% 45.4% 361
VA 62.0% 2.5% 35.5% 761
VT 49.5% 3.6% 46.9% 277
WI 46.9% 3.6% 49.5% 877
WY 62.5% 2.6% 34.9% 272
Total 52.0% 4.4% 43.6% 23,416

Appendices 146
Table D96. Do people let you know before coming into your bedroom?
State Yes Sometimes No N
AL 82.7% 9.3% 8.0% 324
AR 87.7% 7.8% 4.5% 333
AZ 86.9% 8.1% 5.0% 321
CA 83.8% 8.9% 7.3% 5,000
CO 76.3% 14.3% 9.4% 266
CT 82.2% 8.0% 9.8% 275
DC 80.6% 10.6% 8.9% 180
DE 84.2% 6.9% 8.9% 259
FL 89.7% 5.9% 4.4% 574
GA 94.8% 3.0% 2.2% 271
IL 79.7% 9.8% 10.5% 256
IN 83.2% 9.0% 7.7% 542
KS 77.9% 12.9% 9.2% 249
KY 91.3% 5.4% 3.2% 277
LA 89.0% 5.7% 5.3% 283
MA 86.2% 7.3% 6.6% 289
ME 82.7% 11.0% 6.4% 283
MI 83.7% 6.9% 9.4% 393
MN 85.0% 8.8% 6.2% 273
MO 88.6% 6.7% 4.7% 255
NC 82.6% 9.1% 8.2% 328
NE 87.1% 7.7% 5.2% 286
NV 82.9% 8.4% 8.7% 299
NY 78.5% 14.2% 7.3% 303
OH 79.8% 8.1% 12.1% 529
OK 74.2% 8.7% 17.0% 264
OR 81.9% 8.2% 9.9% 282
PA 89.2% 6.4% 4.4% 408
RI 84.4% 6.9% 8.8% 262
SC 92.2% 1.3% 6.5% 384
TN 80.7% 14.8% 4.5% 331
UT 80.5% 9.7% 9.7% 226
VA 89.5% 6.0% 4.5% 484
VT 88.2% 5.5% 6.3% 238
WI 84.9% 6.9% 8.2% 597
WY 88.1% 6.4% 5.4% 202
Total 84.5% 8.2% 7.4% 16,326

Appendices 147
Table D97. Do you have a place to be alone in your home?
State Yes No N
AL 96.6% 3.4% 323
AR 96.7% 3.3% 332
AZ 96.6% 3.4% 323
CA 94.3% 5.7% 5,239
CO 98.9% 1.1% 279
CT 95.1% 4.9% 283
DC 94.0% 6.0% 184
DE 96.1% 3.9% 258
FL 98.0% 2.0% 597
GA 99.6% 0.4% 282
IL 96.9% 3.1% 262
IN 96.6% 3.4% 584
KS 95.0% 5.0% 259
KY 95.3% 4.7% 279
LA 92.7% 7.3% 287
MA 98.4% 1.6% 314
ME 97.5% 2.5% 321
MI 95.1% 4.9% 409
MN 97.6% 2.4% 291
MO 98.1% 1.9% 262
NC 97.9% 2.1% 335
NE 98.6% 1.4% 292
NV 95.5% 4.5% 311
NY 95.1% 4.9% 324
OH 95.7% 4.3% 560
OK 95.0% 5.0% 262
OR 96.1% 3.9% 311
PA 97.3% 2.7% 438
RI 95.7% 4.3% 278
SC 95.6% 4.4% 387
TN 94.6% 5.4% 335
UT 96.8% 3.2% 249
VA 98.4% 1.6% 493
VT 94.5% 5.5% 256
WI 97.1% 2.9% 628
WY 99.5% 0.5% 215
Total 96.5% 3.5% 17,042

Appendices 148
Table D98. Can you be alone with friends or visitors at your home?
State Yes No N
AL 90.1% 9.9% 302
AR 86.6% 13.4% 328
AZ 74.9% 25.1% 287
CA 84.0% 16.0% 4,611
CO 86.2% 13.8% 224
CT 77.6% 22.4% 245
DC 80.1% 19.9% 176
DE 71.9% 28.1% 199
FL 83.6% 16.4% 512
GA 86.3% 13.7% 248
IL 77.0% 23.0% 230
IN 62.0% 38.0% 513
KS 86.2% 13.8% 254
KY 95.2% 4.8% 273
LA 84.2% 15.8% 266
MA 88.6% 11.4% 271
ME 85.6% 14.4% 270
MI 83.2% 16.8% 370
MN 81.3% 18.8% 272
MO 84.5% 15.5% 245
NC 75.9% 24.1% 278
NE 78.0% 22.0% 254
NV 77.9% 22.1% 271
NY 80.6% 19.4% 288
OH 86.2% 13.8% 514
OK 80.9% 19.1% 236
OR 75.1% 24.9% 289
PA 88.2% 11.8% 380
RI 77.0% 23.0% 244
SC 82.4% 17.6% 381
TN 84.4% 15.6% 307
UT 75.7% 24.3% 230
VA 91.2% 8.8% 441
VT 85.5% 14.5% 214
WI 92.5% 7.5% 588
WY 88.4% 11.6% 199
Total 82.5% 17.5% 15,210

Appendices 149
Table D99. Are there rules about having friends or visitors in your home?
State Yes No N
AL 11.2% 88.8% 303
AR 34.9% 65.1% 324
AZ 36.9% 63.1% 274
CA 31.4% 68.6% 4,398
CO 43.0% 57.0% 221
CT 43.7% 56.3% 229
DC 46.9% 53.1% 175
DE 47.8% 52.2% 182
FL 19.2% 80.8% 496
GA 21.3% 78.7% 244
IL 36.2% 63.8% 218
IN 37.4% 62.6% 486
KS 36.0% 64.0% 253
KY 9.4% 90.6% 277
LA 32.8% 67.2% 250
MA 25.9% 74.1% 259
ME 24.2% 75.8% 256
MI 37.4% 62.6% 353
MN 34.2% 65.8% 275
MO 25.4% 74.6% 232
NC 53.8% 46.2% 260
NE 54.1% 45.9% 244
NV 45.2% 54.8% 263
NY 41.3% 58.7% 283
OH 38.9% 61.1% 499
OK 39.8% 60.2% 226
OR 44.0% 56.0% 273
PA 20.4% 79.6% 362
RI 43.8% 56.2% 226
SC 58.9% 41.1% 370
TN 30.9% 69.1% 304
UT 42.1% 57.9% 221
VA 27.7% 72.3% 411
VT 29.6% 70.4% 203
WI 28.9% 71.1% 584
WY 31.4% 68.6% 194
Total 35.2% 64.8% 14,628

Appendices 150
Table D100. Do people read your mail or email without asking you first?
State Yes No N
AL 7.2% 92.8% 293
AR 9.9% 90.1% 324
AZ 9.1% 90.9% 265
CA 9.8% 90.2% 4,732
CO 9.9% 90.1% 233
CT 21.0% 79.0% 233
DC 26.8% 73.2% 153
DE 11.0% 89.0% 209
FL 13.6% 86.4% 493
GA 12.1% 87.9% 257
IL 20.9% 79.1% 239
IN 8.0% 92.0% 549
KS 14.0% 86.0% 250
KY 5.5% 94.5% 275
LA 9.4% 90.6% 266
MA 20.2% 79.8% 287
ME 8.1% 91.9% 284
MI 13.9% 86.1% 366
MN 7.4% 92.6% 272
MO 13.2% 86.8% 227
NC 8.9% 91.1% 302
NE 13.0% 87.0% 254
NV 18.2% 81.8% 286
NY 12.7% 87.3% 284
OH 14.7% 85.3% 524
OK 22.1% 77.9% 235
OR 10.3% 89.7% 281
PA 8.3% 91.7% 396
RI 20.7% 79.3% 256
SC 7.7% 92.3% 376
TN 7.5% 92.5% 267
UT 15.2% 84.8% 223
VA 14.0% 86.0% 436
VT 11.1% 88.9% 243
WI 8.2% 91.8% 571
WY 14.4% 85.6% 195
Total 12.7% 87.3% 15,336

Appendices 151
Table D101. Can you use the phone and internet when you want to?
State Yes No N
AL 89.6% 10.4% 316
AR 92.3% 7.7% 324
AZ 75.9% 24.1% 294
CA 90.5% 9.5% 4,944
CO 93.4% 6.6% 259
CT 87.0% 13.0% 261
DC 87.6% 12.4% 177
DE 92.5% 7.5% 228
FL 89.0% 11.0% 546
GA 91.5% 8.5% 258
IL 92.4% 7.6% 237
IN 92.5% 7.5% 535
KS 89.4% 10.6% 245
KY 92.4% 7.6% 277
LA 90.9% 9.1% 276
MA 93.6% 6.4% 296
ME 95.2% 4.8% 290
MI 91.0% 9.0% 366
MN 89.9% 10.1% 288
MO 93.3% 6.7% 253
NC 91.4% 8.6% 313
NE 84.6% 15.4% 279
NV 86.8% 13.2% 302
NY 93.8% 6.2% 307
OH 92.6% 7.4% 540
OK 85.1% 14.9% 249
OR 88.8% 11.2% 295
PA 89.6% 10.4% 386
RI 90.4% 9.6% 251
SC 93.0% 7.0% 374
TN 86.8% 13.2% 288
UT 87.2% 12.8% 234
VA 91.9% 8.1% 456
VT 83.1% 16.9% 237
WI 93.4% 6.6% 603
WY 89.2% 10.8% 204
Total 89.9% 10.1% 15,988
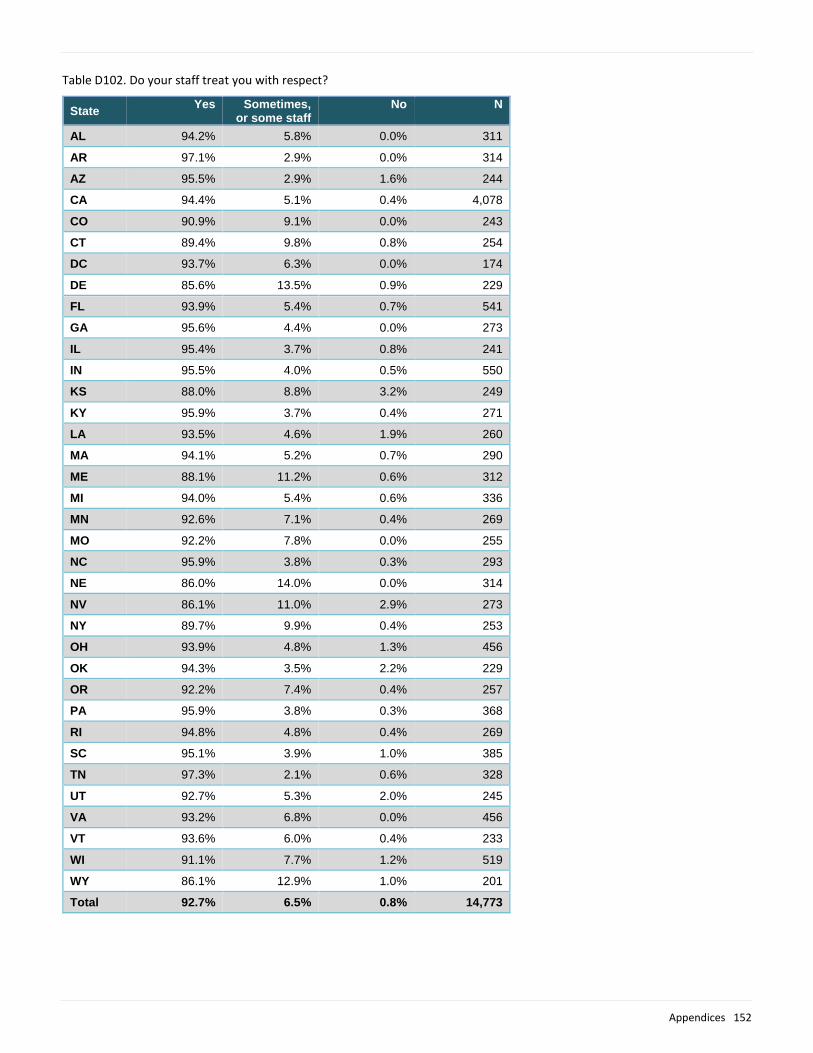
Appendices 152
Table D102. Do your staff treat you with respect?
State Yes Sometimes,
or some staff No N
AL 94.2% 5.8% 0.0% 311
AR 97.1% 2.9% 0.0% 314
AZ 95.5% 2.9% 1.6% 244
CA 94.4% 5.1% 0.4% 4,078
CO 90.9% 9.1% 0.0% 243
CT 89.4% 9.8% 0.8% 254
DC 93.7% 6.3% 0.0% 174
DE 85.6% 13.5% 0.9% 229
FL 93.9% 5.4% 0.7% 541
GA 95.6% 4.4% 0.0% 273
IL 95.4% 3.7% 0.8% 241
IN 95.5% 4.0% 0.5% 550
KS 88.0% 8.8% 3.2% 249
KY 95.9% 3.7% 0.4% 271
LA 93.5% 4.6% 1.9% 260
MA 94.1% 5.2% 0.7% 290
ME 88.1% 11.2% 0.6% 312
MI 94.0% 5.4% 0.6% 336
MN 92.6% 7.1% 0.4% 269
MO 92.2% 7.8% 0.0% 255
NC 95.9% 3.8% 0.3% 293
NE 86.0% 14.0% 0.0% 314
NV 86.1% 11.0% 2.9% 273
NY 89.7% 9.9% 0.4% 253
OH 93.9% 4.8% 1.3% 456
OK 94.3% 3.5% 2.2% 229
OR 92.2% 7.4% 0.4% 257
PA 95.9% 3.8% 0.3% 368
RI 94.8% 4.8% 0.4% 269
SC 95.1% 3.9% 1.0% 385
TN 97.3% 2.1% 0.6% 328
UT 92.7% 5.3% 2.0% 245
VA 93.2% 6.8% 0.0% 456
VT 93.6% 6.0% 0.4% 233
WI 91.1% 7.7% 1.2% 519
WY 86.1% 12.9% 1.0% 201
Total 92.7% 6.5% 0.8% 14,773
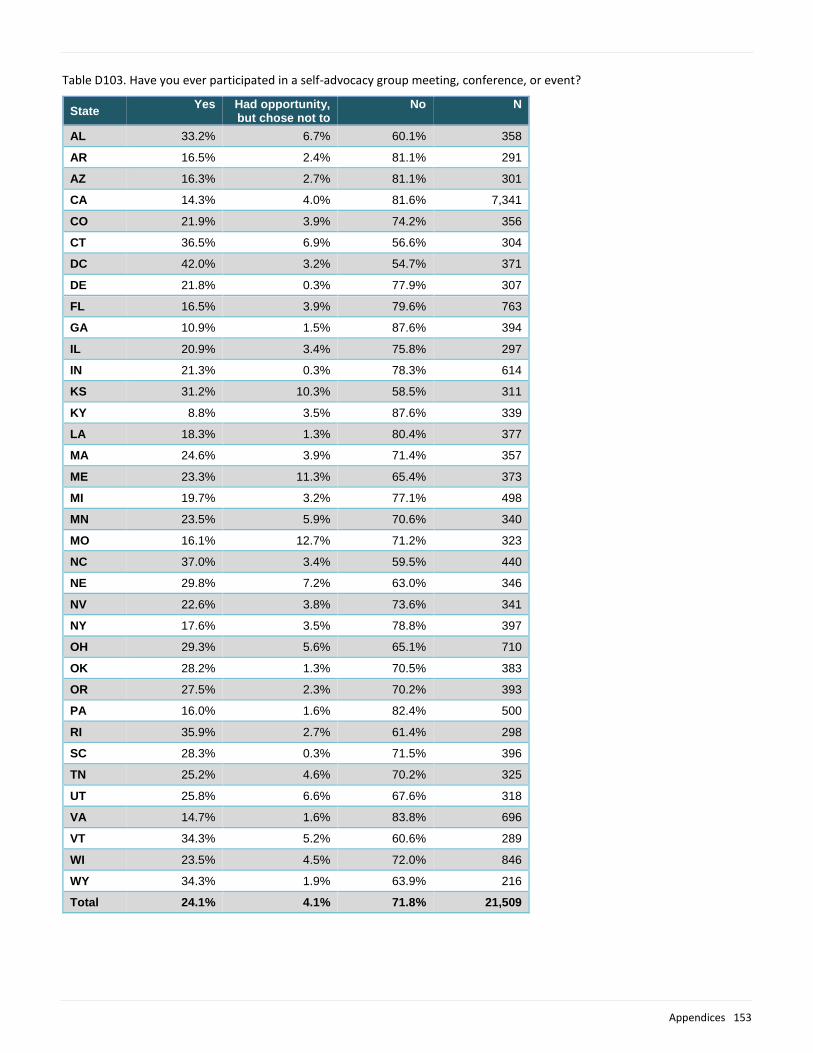
Appendices 153
Table D103. Have you ever participated in a self-advocacy group meeting, conference, or event?
State Yes Had opportunity,
but chose not to No N
AL 33.2% 6.7% 60.1% 358
AR 16.5% 2.4% 81.1% 291
AZ 16.3% 2.7% 81.1% 301
CA 14.3% 4.0% 81.6% 7,341
CO 21.9% 3.9% 74.2% 356
CT 36.5% 6.9% 56.6% 304
DC 42.0% 3.2% 54.7% 371
DE 21.8% 0.3% 77.9% 307
FL 16.5% 3.9% 79.6% 763
GA 10.9% 1.5% 87.6% 394
IL 20.9% 3.4% 75.8% 297
IN 21.3% 0.3% 78.3% 614
KS 31.2% 10.3% 58.5% 311
KY 8.8% 3.5% 87.6% 339
LA 18.3% 1.3% 80.4% 377
MA 24.6% 3.9% 71.4% 357
ME 23.3% 11.3% 65.4% 373
MI 19.7% 3.2% 77.1% 498
MN 23.5% 5.9% 70.6% 340
MO 16.1% 12.7% 71.2% 323
NC 37.0% 3.4% 59.5% 440
NE 29.8% 7.2% 63.0% 346
NV 22.6% 3.8% 73.6% 341
NY 17.6% 3.5% 78.8% 397
OH 29.3% 5.6% 65.1% 710
OK 28.2% 1.3% 70.5% 383
OR 27.5% 2.3% 70.2% 393
PA 16.0% 1.6% 82.4% 500
RI 35.9% 2.7% 61.4% 298
SC 28.3% 0.3% 71.5% 396
TN 25.2% 4.6% 70.2% 325
UT 25.8% 6.6% 67.6% 318
VA 14.7% 1.6% 83.8% 696
VT 34.3% 5.2% 60.6% 289
WI 23.5% 4.5% 72.0% 846
WY 34.3% 1.9% 63.9% 216
Total 24.1% 4.1% 71.8% 21,509

Appendices 154
Table D104. Have you voted? (in local, state, or federal election)
State Yes Had opportunity,
but chose not to No N
AL 41.2% 6.8% 52.0% 369
AR 30.8% 0.8% 68.4% 399
AZ 16.0% 3.1% 80.8% 480
CA 25.5% 3.6% 70.9% 8,050
CO 38.8% 4.7% 56.6% 387
CT 35.8% 4.7% 59.5% 341
DC 35.3% 0.8% 63.9% 385
DE 50.9% 6.6% 42.5% 320
FL 30.9% 5.3% 63.9% 914
GA 16.7% 4.6% 78.7% 432
IL 45.4% 6.2% 48.4% 337
IN 36.9% 0.6% 62.6% 719
KS 36.2% 9.9% 53.9% 343
KY 4.0% 2.0% 94.0% 402
LA 35.2% 1.0% 63.8% 420
MA 41.0% 6.0% 53.0% 383
ME 45.9% 0.8% 53.3% 381
MI 28.5% 6.9% 64.5% 606
MN 34.0% 6.1% 59.9% 377
MO 12.9% 3.1% 84.0% 387
NC 39.0% 4.0% 57.0% 602
NE 37.5% 7.2% 55.3% 389
NV 32.8% 21.8% 45.4% 372
NY 36.7% 1.9% 61.4% 485
OH 43.3% 8.5% 48.2% 728
OK 21.8% 2.9% 75.3% 381
OR 45.3% 7.4% 47.3% 404
PA 32.0% 11.9% 56.0% 646
RI 53.1% 4.3% 42.6% 324
SC 49.4% 0.2% 50.4% 417
TN 24.1% 4.4% 71.4% 406
UT 31.6% 0.6% 67.9% 358
VA 28.0% 3.8% 68.2% 782
VT 38.6% 4.5% 56.8% 308
WI 40.6% 2.7% 56.7% 931
WY 37.5% 3.3% 59.2% 304
Total 34.3% 4.8% 60.9% 24,269

Appendices 155
Safety (un-collapsed and un-weighted)
Table D105. Are there any places where you feel afraid or scared? ∞
State Home Day
program Work Walking in
the community
In transport Other N
AL 1.2% 1.5% 0.0% 0.9% 0.0% 1.8% 326
AR 4.0% 1.8% 1.2% 7.0% 4.3% 4.6% 329
AZ 2.2% 1.5% 0.3% 3.4% 3.4% 9.0% 323
CA 3.2% 1.5% 0.9% 6.9% 3.5% 9.0% 5,430
CO 3.5% 4.2% 2.1% 8.8% 7.4% 8.4% 285
CT 3.9% 2.5% 2.5% 5.7% 3.6% 8.6% 280
DC 3.8% 2.2% 0.5% 6.5% 2.7% 3.8% 185
DE 5.7% 2.7% 0.8% 4.2% 1.9% 4.6% 262
FL 2.1% 0.8% 0.5% 2.9% 0.6% 3.4% 617
GA 0.7% 0.0% 0.0% 1.4% 0.3% 1.0% 286
IL 3.3% 1.8% 0.4% 5.1% 3.3% 6.3% 272
IN 2.2% 0.8% 0.3% 1.3% 0.7% 3.9% 593
KS 6.4% 3.7% 0.0% 8.2% 1.5% 3.7% 267
KY 0.7% 1.4% 0.4% 2.5% 0.0% 0.4% 281
LA 5.2% 1.2% 0.0% 2.3% 1.2% 8.5% 343
MA 5.7% 5.7% 0.7% 7.4% 5.1% 3.7% 296
ME 5.0% 1.5% 0.3% 5.6% 2.1% 10.3% 340
MI 3.6% 1.2% 0.7% 3.3% 2.9% 11.2% 418
MN 5.0% 1.3% 2.3% 8.7% 4.4% 9.4% 298
MO 3.0% 1.1% 0.7% 3.0% 1.5% 6.0% 267
NC 2.3% 0.9% 0.0% 2.6% 0.3% 15.8% 348
NE 2.7% 1.5% 0.3% 7.5% 4.5% 12.8% 335
NV 9.7% 2.8% 2.8% 10.1% 5.0% 8.8% 318
NY 2.7% 1.2% 0.3% 6.7% 4.3% 9.7% 329
OH 3.1% 1.7% 1.2% 5.1% 2.1% 7.5% 572
OK 5.3% 1.5% 2.3% 3.0% 1.1% 3.4% 265
OR 6.3% 0.3% 0.3% 7.6% 4.8% 11.1% 315
PA 3.0% 1.4% 1.0% 2.2% 1.2% 4.6% 500
RI 5.9% 2.8% 1.7% 6.3% 4.5% 4.9% 287
SC 3.3% 1.3% 0.0% 1.0% 0.5% 2.0% 391
TN 2.1% 0.6% 0.0% 1.2% 1.5% 7.4% 337
UT 7.7% 3.1% 3.1% 7.7% 6.2% 10.0% 260
VA 4.5% 1.8% 1.0% 4.9% 2.8% 9.6% 509
VT 7.6% 1.1% 3.8% 15.2% 8.7% 16.7% 264
WI 4.5% 1.4% 0.5% 9.1% 5.3% 5.5% 640
WY 4.2% 3.2% 0.9% 9.7% 1.4% 13.4% 216
Total 4.0% 1.8% 0.9% 5.4% 2.9% 7.2% 17,584
∞ Categories are not mutually exclusive
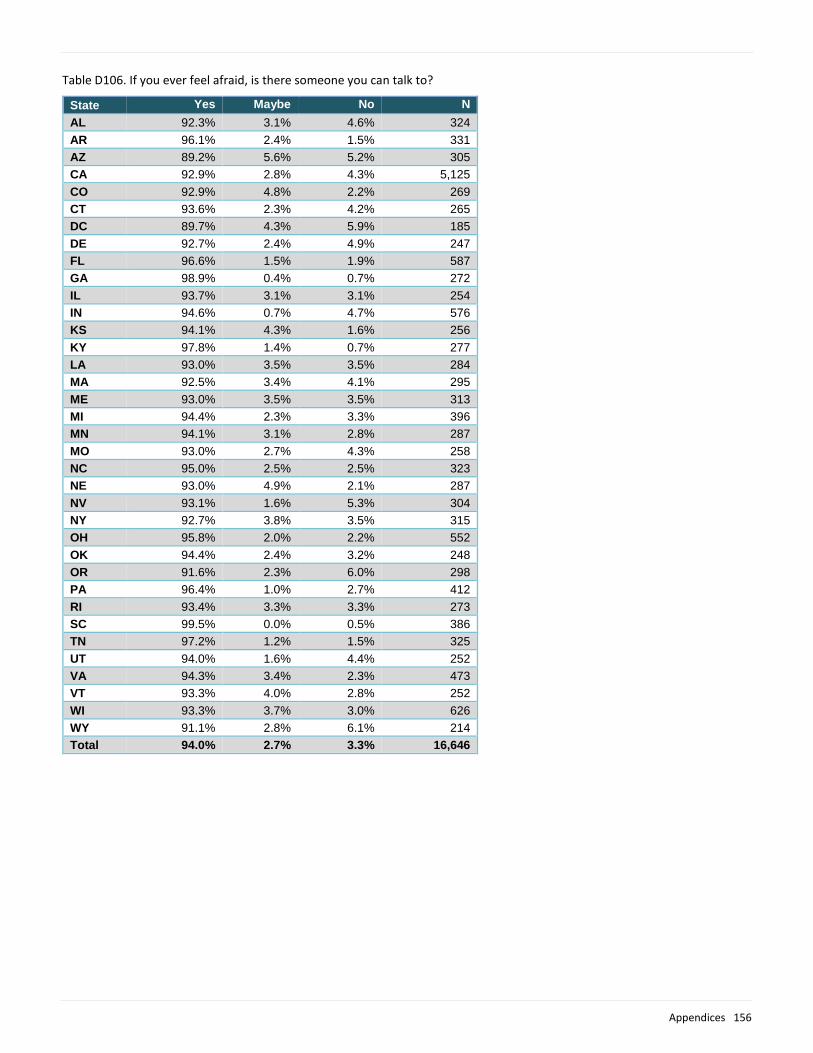
Appendices 156
Table D106. If you ever feel afraid, is there someone you can talk to?
State Yes Maybe No N
AL 92.3% 3.1% 4.6% 324
AR 96.1% 2.4% 1.5% 331
AZ 89.2% 5.6% 5.2% 305
CA 92.9% 2.8% 4.3% 5,125
CO 92.9% 4.8% 2.2% 269
CT 93.6% 2.3% 4.2% 265
DC 89.7% 4.3% 5.9% 185
DE 92.7% 2.4% 4.9% 247
FL 96.6% 1.5% 1.9% 587
GA 98.9% 0.4% 0.7% 272
IL 93.7% 3.1% 3.1% 254
IN 94.6% 0.7% 4.7% 576
KS 94.1% 4.3% 1.6% 256
KY 97.8% 1.4% 0.7% 277
LA 93.0% 3.5% 3.5% 284
MA 92.5% 3.4% 4.1% 295
ME 93.0% 3.5% 3.5% 313
MI 94.4% 2.3% 3.3% 396
MN 94.1% 3.1% 2.8% 287
MO 93.0% 2.7% 4.3% 258
NC 95.0% 2.5% 2.5% 323
NE 93.0% 4.9% 2.1% 287
NV 93.1% 1.6% 5.3% 304
NY 92.7% 3.8% 3.5% 315
OH 95.8% 2.0% 2.2% 552
OK 94.4% 2.4% 3.2% 248
OR 91.6% 2.3% 6.0% 298
PA 96.4% 1.0% 2.7% 412
RI 93.4% 3.3% 3.3% 273
SC 99.5% 0.0% 0.5% 386
TN 97.2% 1.2% 1.5% 325
UT 94.0% 1.6% 4.4% 252
VA 94.3% 3.4% 2.3% 473
VT 93.3% 4.0% 2.8% 252
WI 93.3% 3.7% 3.0% 626
WY 91.1% 2.8% 6.1% 214
Total 94.0% 2.7% 3.3% 16,646

Appendices 157
[LAST PAGE]