in partnership with - iswan...board ships, both seafarers and shipping companies are integral to...
TRANSCRIPT
1
Hydration Campaign
In partnership with:
Published: August 2018
2
Contents
Introduction to the Campaign 4
Background to NAKILAT 5
Method and limitations of pilot campaign 6
Method 6
Statistical Method 6
Limitations 8
Results 8
Experimental Ship Results 10
Experimental Ship: Drink Type 12
Experimental Ship: Quiz Results 12
Ship 2 Results 12
Ship 2: Drink Type 14
Ship 2: Quiz Results 14
Ship 3 Results 15
Ship 3: Drink Type 16
Ship 3: Quiz Results 17
Ship 4 Results 17
Ship 4: Drink Type 18
Ship 4: Quiz Results 19
Conclusion 19
Page
3
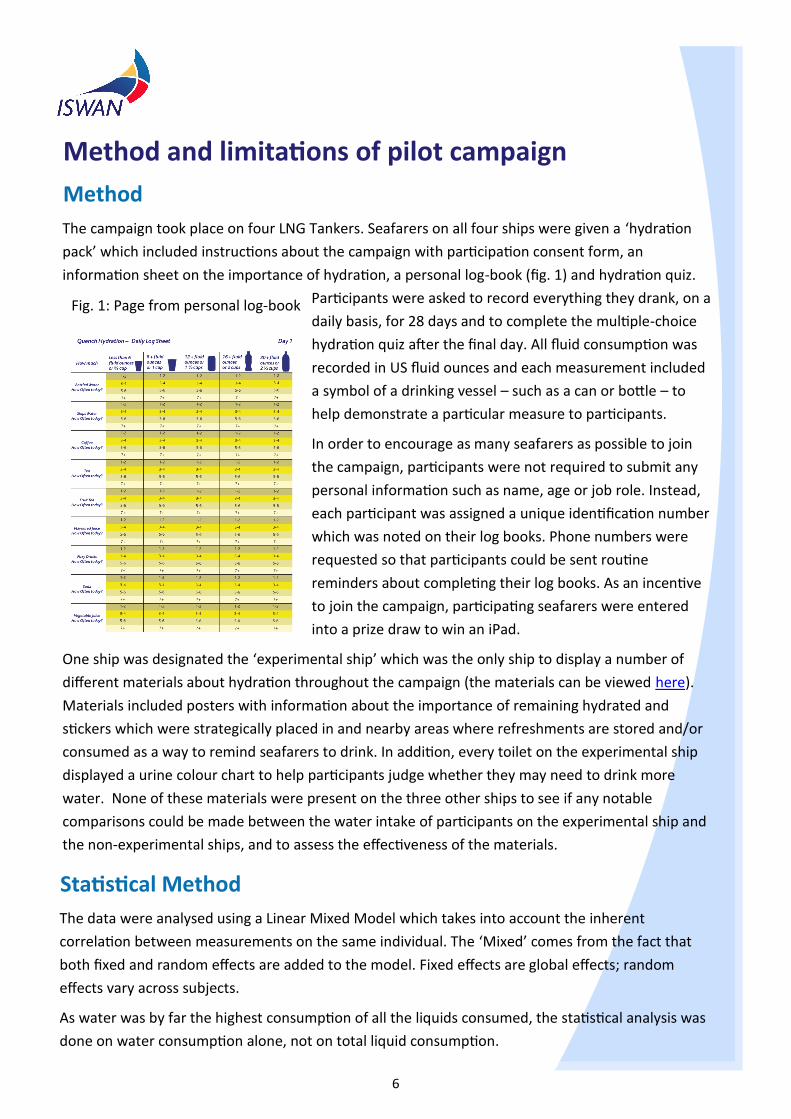
Fig. 1: Page from personal log-book 6
Fig. 2: Estimates for fixed effects in statistical analysis 7
Fig. 3: Hypothesis tests to determine whether there was a difference between ships 7
Fig. 4: Average total water consumption over time on each ship 9
Fig. 5: Comparison of day 1 and day 28 results for each ship 9
Fig. 6: Average individual water consumption on experimental ship 10
Fig. 7: Model-predicted average water intake vs recorded intake on experimental ship 11
Fig. 8: Fluid intake by drink type on experimental ship 12
Fig. 9: Average individual water consumption on ship 2 12
Fig. 10: Model-predicted average water intake vs recorded intake on ship 2 13
Fig. 11: Fluid intake by drink type on ship 2 14
Fig. 12: Average individual water consumption on ship 3 15
Fig. 13: Model-predicted average water intake vs recorded intake on ship 3 16
Fig. 14: Fluid intake by drink type on ship 3 16
Fig. 15: Average individual water consumption on ship 4 17
Fig. 16: Model-predicted average water intake vs recorded intake on ship 4 18
Fig. 17: Fluid intake by drink type on ship 4 18
List of Figures Page
4
Hydration Campaign Observations and Findings
This report gives an overview of the International Seafarers’ Welfare and Assistance Network’s
(ISWAN) pilot Hydration Campaign which went ahead over a 28-day period in Spring/Summer 2017.
It discusses the campaign’s findings and considers recommendations for future work on promoting
the importance of hydration to seafarers on board. As is the case with all health promotion on
board ships, both seafarers and shipping companies are integral to successfully improving health. It
is hoped this report will help to encourage other shipping companies to promote the importance of
hydration to their seafarers.
ISWAN would like to thank Nakilat for their participation in this campaign and all of their assistance
with co-ordinating the campaign materials, as well as the seafarers who gave up their time to be
part of this pilot. We’d also like to thank Georgina Robinson who designed the campaign and all of
the important materials to inform seafarers about hydration.
Introduction to the Campaign ISWAN has a long history of working to improve the
health of seafarers, first through its predecessor the
International Committee on Seafarers Welfare (ICSW),
which initiated the long-running Seafarers’ Health
Information Programme (SHIP). In order to ensure health resources remain useful and relevant to
seafarers, ISWAN has been committed to investigating other areas where improvements in
knowledge may help seafarers to make healthier life choices. One such area is knowledge about
the importance of hydration and the negative impacts of dehydration on health.
Working on board can present seafarers with factors that may make it challenging to remain
adequately hydrated. Some job roles are physically demanding and, for Engineers especially,
working in very hot environments can be common. A possible lack of fresh fruit and vegetables (a
good source of water), and distrust of water on board because of taste or appearance can put
seafarers at risk of dehydration. Some anecdotal evidence also suggests that the inconvenience of
taking a toilet break due to workload or distance to the toilet can mean that seafarers consciously
decide to drink less.
At present little research exists on the hydration of seafarers, but experiences of those who have
been to sea, or who work to support seafarers, suggest that dehydration at sea can be common.
There are also fairly high instances of diseases among seafarers which can be linked to, and
caused – or made worse – by dehydration. Therefore, an encouragement for seafarers to
consume more liquids is helpful to their general health and to productive work on board.
5
In order to investigate this area further, ISWAN worked with Cognitive Behavioural Therapist Georgina Robinson to design a pilot campaign to:
1. Provide seafarers with the right tools and information to encourage them to stay hydrated on board
2. Gather data on the drink types and volume consumed by seafarers on board over a 28-day period
3. Attempt to draw conclusions about the effectiveness of certain campaign materials
The campaign went ahead on four Nakilat LNG tankers with a total of 73 seafarer participants who
recorded everything they drank for 28 days. At the end of the campaign, participants took a quiz to
assess their basic knowledge of hydration.
Results showed that overall, seafarers on all four vessels recorded seemingly adequate levels of
water intake with more than half of the participants recording an average increase in water
consumption over the course of the campaign. More detailed analysis of results is discussed below.
Background to NAKILAT Established in 2004, Nakilat is a Qatari-owned shipping and maritime company
providing the critical transportation link in the State of Qatar’s LNG supply
chain. The company’s LNG shipping fleet is the largest in the world, comprising of 65 LNG vessels.
Nakilat also owns one FSRU vessel and four large LPG carriers, with the latter operated by its in-
house ship management arm, Nakilat Shipping Qatar Limited (NSQL). In addition to its core shipping
activities, Nakilat operates the ship repair and construction facilities at Erhama Bin Jaber Al Jalahma
Shipyard in Ras Laffan Industrial City via two strategic joint ventures: Nakilat-Keppel Offshore &
Marine (N-KOM) and Nakilat Damen Shipyards Qatar (NDSQ). It also provides shipping agency
services through Nakilat Agency Company (NAC) at all Qatari ports and terminals, as well as towage
and other marine support services through its joint venture Nakilat SvitzerWijsmuller (NSW) for
vessels at the Port of Ras Laffan and around Qatar’s Halul Island. Nakilat’s comprehensive business
portfolio of shipping and maritime services complements its vision to be a global leader and
provider of choice for energy transportation and maritime services.
Qatar’s summer climate is very hot and humid with summer temperatures ranging between 30-50
degrees Celsius and an average humidity level of 25-75%. This kind of climate creates a potentially
challenging situation for our seafarers who may be exposed to these conditions whilst loading in
Ras Laffan. Therefore, our company is very focused on Heat Stress Management and hydration is an
important factor in our programme. Our seafarers are encouraged to know the major symptoms of
heat stress and to drink plenty of water at regular intervals as a good practice to minimize the risks.
As members of ISWAN since July 2015, we were delighted to be invited to participate in the Quench
Hydration Project as we believed that we could add value to the process through our wealth of
experience. We are also planning to introduce ISWAN’s Seafarers’ Health Information Programme
(SHIP) across our fleet in the coming months.
6
Method and limitations of pilot campaign
The campaign took place on four LNG Tankers. Seafarers on all four ships were given a ‘hydration
pack’ which included instructions about the campaign with participation consent form, an
information sheet on the importance of hydration, a personal log-book (fig. 1) and hydration quiz.
Participants were asked to record everything they drank, on a
daily basis, for 28 days and to complete the multiple-choice
hydration quiz after the final day. All fluid consumption was
recorded in US fluid ounces and each measurement included
a symbol of a drinking vessel – such as a can or bottle – to
help demonstrate a particular measure to participants.
In order to encourage as many seafarers as possible to join
the campaign, participants were not required to submit any
personal information such as name, age or job role. Instead,
each participant was assigned a unique identification number
which was noted on their log books. Phone numbers were
requested so that participants could be sent routine
reminders about completing their log books. As an incentive
to join the campaign, participating seafarers were entered
into a prize draw to win an iPad.
One ship was designated the ‘experimental ship’ which was the only ship to display a number of
different materials about hydration throughout the campaign (the materials can be viewed here).
Materials included posters with information about the importance of remaining hydrated and
stickers which were strategically placed in and nearby areas where refreshments are stored and/or
consumed as a way to remind seafarers to drink. In addition, every toilet on the experimental ship
displayed a urine colour chart to help participants judge whether they may need to drink more
water. None of these materials were present on the three other ships to see if any notable
comparisons could be made between the water intake of participants on the experimental ship and
the non-experimental ships, and to assess the effectiveness of the materials.
Method
Fig. 1: Page from personal log-book
The data were analysed using a Linear Mixed Model which takes into account the inherent
correlation between measurements on the same individual. The ‘Mixed’ comes from the fact that
both fixed and random effects are added to the model. Fixed effects are global effects; random
effects vary across subjects.
As water was by far the highest consumption of all the liquids consumed, the statistical analysis was
done on water consumption alone, not on total liquid consumption.
Statistical Method
7
The two fixed effects included in the model were ship and a ship*time interaction term. The ship
parameter is simply the intercept (average water intake) for each ship and the interaction term
describes how the water intake changes over time across ships.
Due to the large variation in baseline values for total daily water intake, a random intercept was
included in the model. This assigns each subject its own intercept; a deviation from the mean
intercept that persists over time. A random time slope was also included in the model as there was
a noticeable difference in trends between individuals.
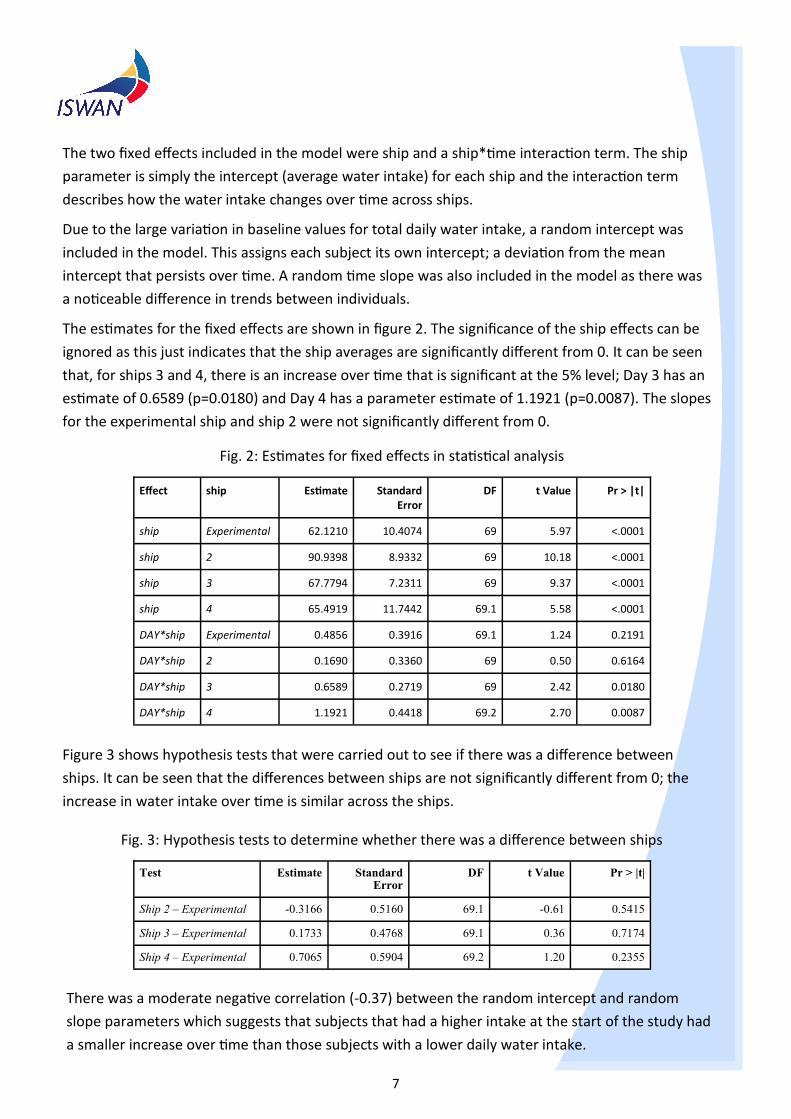
The estimates for the fixed effects are shown in figure 2. The significance of the ship effects can be
ignored as this just indicates that the ship averages are significantly different from 0. It can be seen
that, for ships 3 and 4, there is an increase over time that is significant at the 5% level; Day 3 has an
estimate of 0.6589 (p=0.0180) and Day 4 has a parameter estimate of 1.1921 (p=0.0087). The slopes
for the experimental ship and ship 2 were not significantly different from 0.
Fig. 2: Estimates for fixed effects in statistical analysis
Effect ship Estimate Standard Error
DF t Value Pr > |t|
ship Experimental 62.1210 10.4074 69 5.97 <.0001
ship 2 90.9398 8.9332 69 10.18 <.0001
ship 3 67.7794 7.2311 69 9.37 <.0001
ship 4 65.4919 11.7442 69.1 5.58 <.0001
DAY*ship Experimental 0.4856 0.3916 69.1 1.24 0.2191
DAY*ship 2 0.1690 0.3360 69 0.50 0.6164
DAY*ship 3 0.6589 0.2719 69 2.42 0.0180
DAY*ship 4 1.1921 0.4418 69.2 2.70 0.0087
Figure 3 shows hypothesis tests that were carried out to see if there was a difference between
ships. It can be seen that the differences between ships are not significantly different from 0; the
increase in water intake over time is similar across the ships.
Test Estimate Standard Error
DF t Value Pr > |t|
Ship 2 – Experimental -0.3166 0.5160 69.1 -0.61 0.5415
Ship 3 – Experimental 0.1733 0.4768 69.1 0.36 0.7174
Ship 4 – Experimental 0.7065 0.5904 69.2 1.20 0.2355
Fig. 3: Hypothesis tests to determine whether there was a difference between ships
There was a moderate negative correlation (-0.37) between the random intercept and random
slope parameters which suggests that subjects that had a higher intake at the start of the study had
a smaller increase over time than those subjects with a lower daily water intake.
8
There are some limitations that should be noted:
1. There are no other known studies about the drinking habits of seafarers that the findings from
this campaign can be compared with
2. The campaign was co-ordinated remotely, with one company only. In providing anonymity,
the specific job functions and ranks of the respondents are unknown
3. It is impossible to determine an individual’s water requirements without knowledge of their
metabolism, physical activity, health status and other environmental factors. Therefore the
data gathered as part of this campaign cannot draw conclusions about whether the water
intake recorded by seafarers met their individual requirements during this period. Seafarers
participating in the campaign were given a general guideline that they should attempt to
consume around 2 litres (68 US fl oz) of water during a fairly sedentary day, so any comments
in the results relate to that guidance
4. The results were reliant on participants recording their fluid intake accurately
5. The participating shipping company – Nakilat – was already committed to raising awareness of
the importance of hydration among their crew before the campaign began and some of their
previous company campaign materials were still present on all ships. This meant it was
difficult to draw conclusions about the effectiveness of the campaign-specific materials on the
experimental ship
6. Although there is nothing to suggest that any aspect of the campaign was misunderstood by
participants, all campaign materials were produced in English and many participants will
speak English as a second language
Limitations
Results The units of measurement for liquid consumption were US fluid ounces (fl oz). In the results,
comparisons are made with litres (given the advice to drink around 2 litres of water during a fairly
sedentary day). One litre is the equivalent of 34 fl oz.
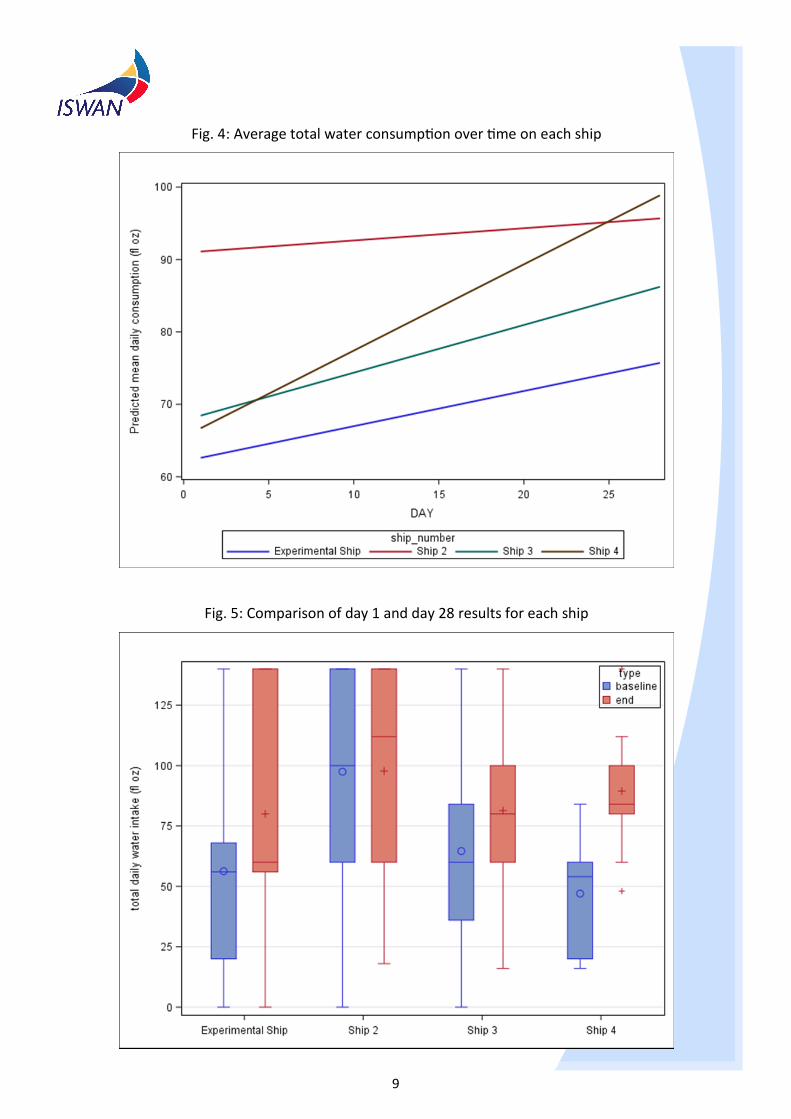
There were a total of 73 seafarers participating in the Hydration Campaign for the entire 28 days
across all four ships. As shown in figures 4 and 5, all ships recorded an average increase in the total
volume of water consumed during this time but in some cases, extremely high (> 4 litres / 135 fl oz)
and extremely low (<1 litre / 34 fl oz) daily intakes were recorded by individuals.
Despite the presence of additional campaign materials on the experimental ship, we did not see the
largest increase in water consumption on this ship.
Choice of drink did not vary greatly, with water being the top choice on all four ships and some
slight variance in the popularity of coffee, tea, fruit juice and soda.
9
Fig. 4: Average total water consumption over time on each ship
Fig. 5: Comparison of day 1 and day 28 results for each ship
10
The end of campaign quiz results showed a good level of awareness about the importance of
hydration generally. However, 12/73 participants (16%) thought you could survive for a month
without water. Most of these participants (9/12) consistently recorded the lowest water intake of
all seafarers taking part: five of these participants recorded a consumption of < 68 fl oz (2 litres) per
day for more than half of the campaign; two recorded a consumption of < 34 fl oz (1 litre) for most
of the campaign and two participants recorded next to no water consumption on two or more days
of the campaign. Interestingly, the ship which recorded the largest average increase in water intake
over the course of campaign (ship 4) had the highest average quiz score of all ships. Participants on
this ship also recorded the lowest average intake on day 1 of the campaign (50 fl oz).
Experimental Ship Results
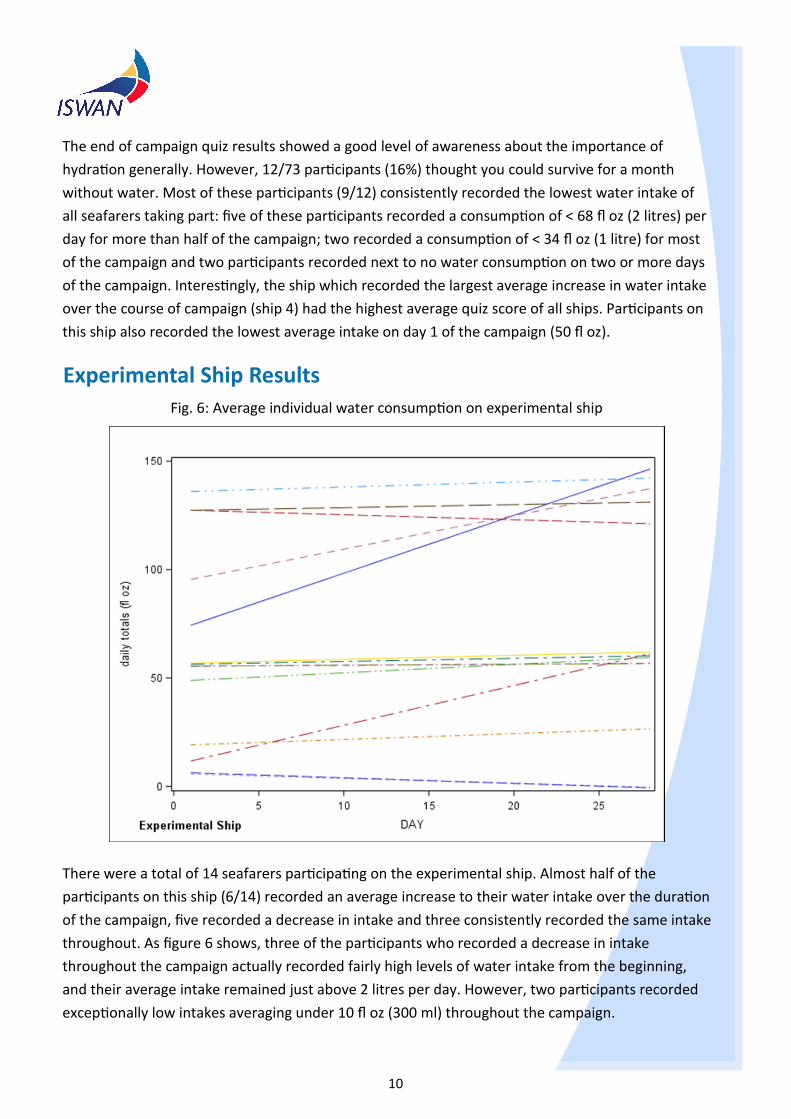
There were a total of 14 seafarers participating on the experimental ship. Almost half of the
participants on this ship (6/14) recorded an average increase to their water intake over the duration
of the campaign, five recorded a decrease in intake and three consistently recorded the same intake
throughout. As figure 6 shows, three of the participants who recorded a decrease in intake
throughout the campaign actually recorded fairly high levels of water intake from the beginning,
and their average intake remained just above 2 litres per day. However, two participants recorded
exceptionally low intakes averaging under 10 fl oz (300 ml) throughout the campaign.
Fig. 6: Average individual water consumption on experimental ship
11
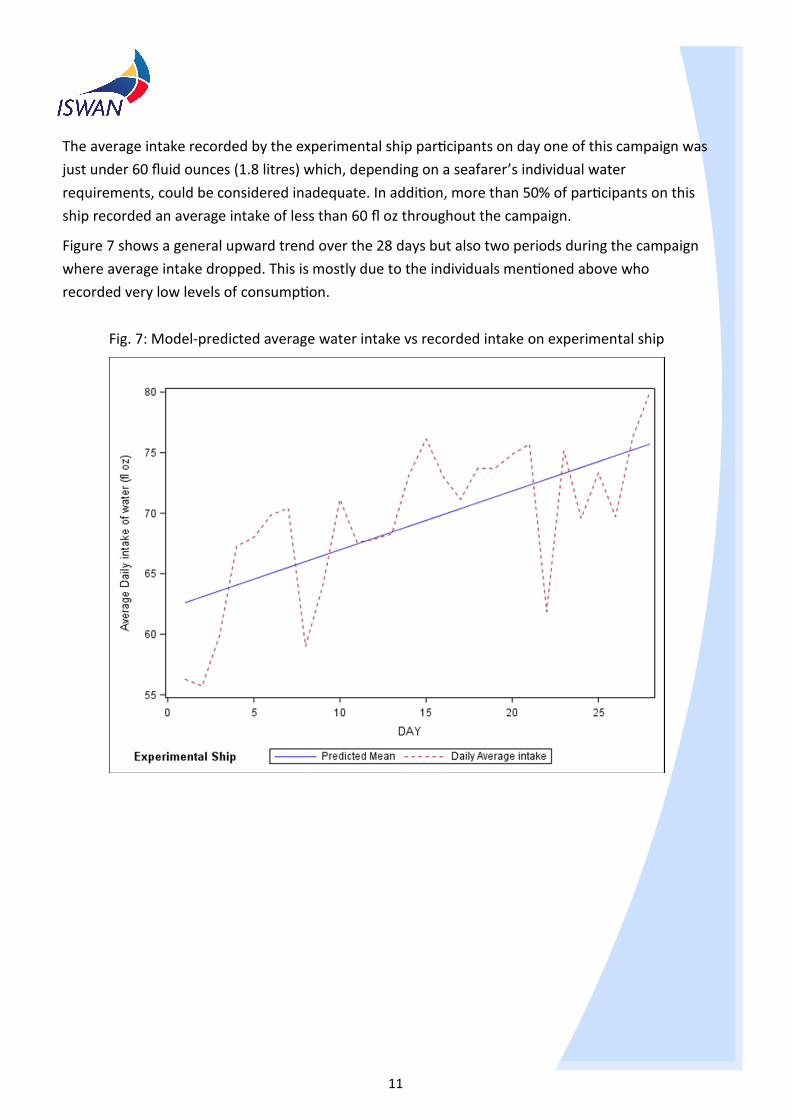
The average intake recorded by the experimental ship participants on day one of this campaign was
just under 60 fluid ounces (1.8 litres) which, depending on a seafarer’s individual water
requirements, could be considered inadequate. In addition, more than 50% of participants on this
ship recorded an average intake of less than 60 fl oz throughout the campaign.
Figure 7 shows a general upward trend over the 28 days but also two periods during the campaign
where average intake dropped. This is mostly due to the individuals mentioned above who
recorded very low levels of consumption.
Fig. 7: Model-predicted average water intake vs recorded intake on experimental ship
12
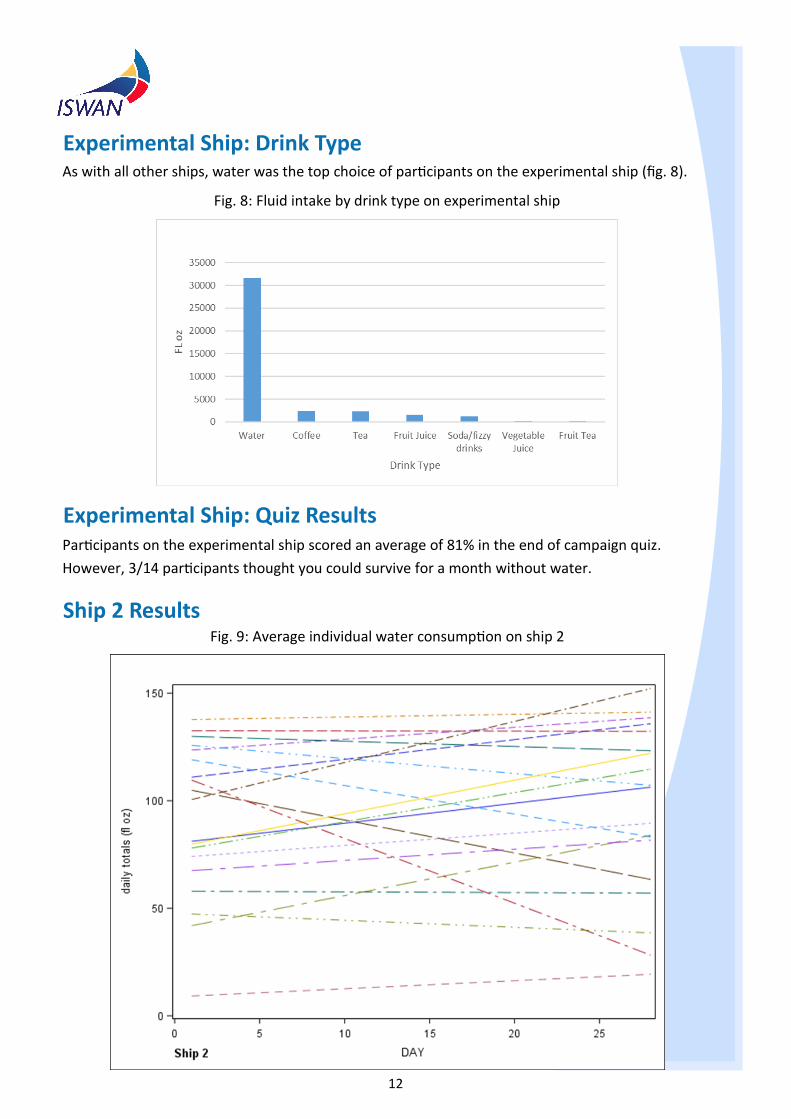
Fig. 8: Fluid intake by drink type on experimental ship
As with all other ships, water was the top choice of participants on the experimental ship (fig. 8).
Experimental Ship: Drink Type
Ship 2 Results Fig. 9: Average individual water consumption on ship 2
Participants on the experimental ship scored an average of 81% in the end of campaign quiz.
However, 3/14 participants thought you could survive for a month without water.
Experimental Ship: Quiz Results
13
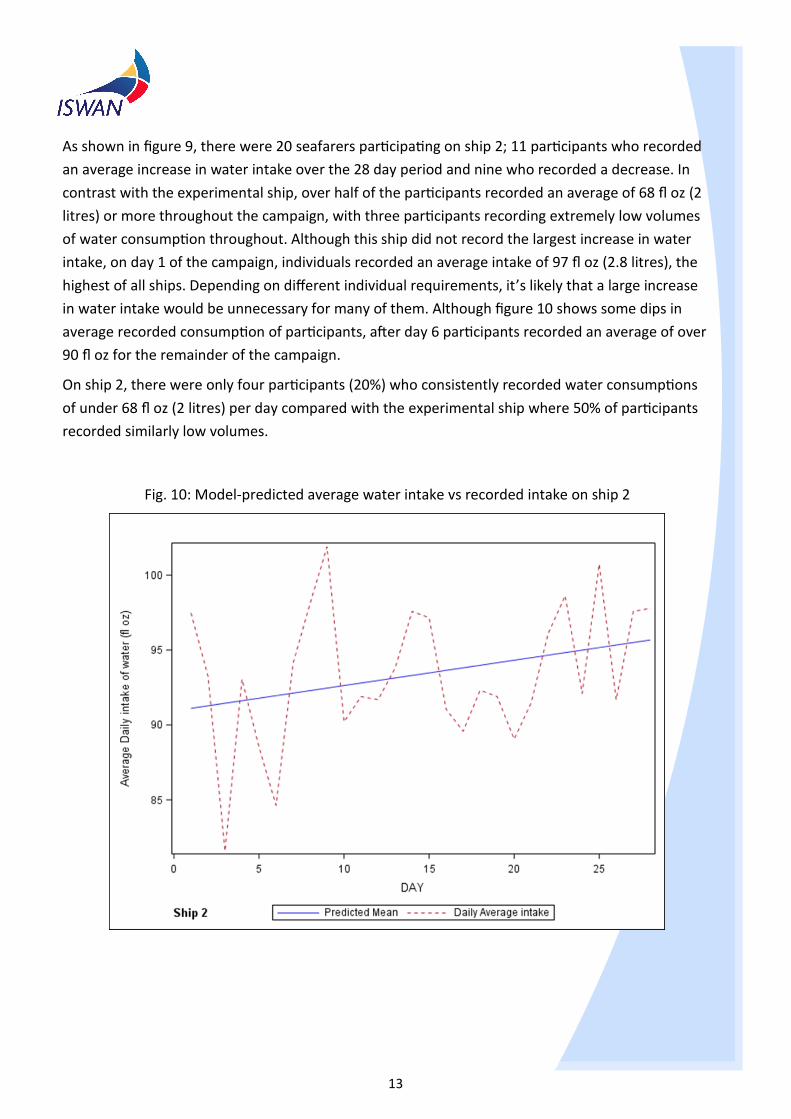
As shown in figure 9, there were 20 seafarers participating on ship 2; 11 participants who recorded
an average increase in water intake over the 28 day period and nine who recorded a decrease. In
contrast with the experimental ship, over half of the participants recorded an average of 68 fl oz (2
litres) or more throughout the campaign, with three participants recording extremely low volumes
of water consumption throughout. Although this ship did not record the largest increase in water
intake, on day 1 of the campaign, individuals recorded an average intake of 97 fl oz (2.8 litres), the
highest of all ships. Depending on different individual requirements, it’s likely that a large increase
in water intake would be unnecessary for many of them. Although figure 10 shows some dips in
average recorded consumption of participants, after day 6 participants recorded an average of over
90 fl oz for the remainder of the campaign.
On ship 2, there were only four participants (20%) who consistently recorded water consumptions
of under 68 fl oz (2 litres) per day compared with the experimental ship where 50% of participants
recorded similarly low volumes.
Fig. 10: Model-predicted average water intake vs recorded intake on ship 2
14
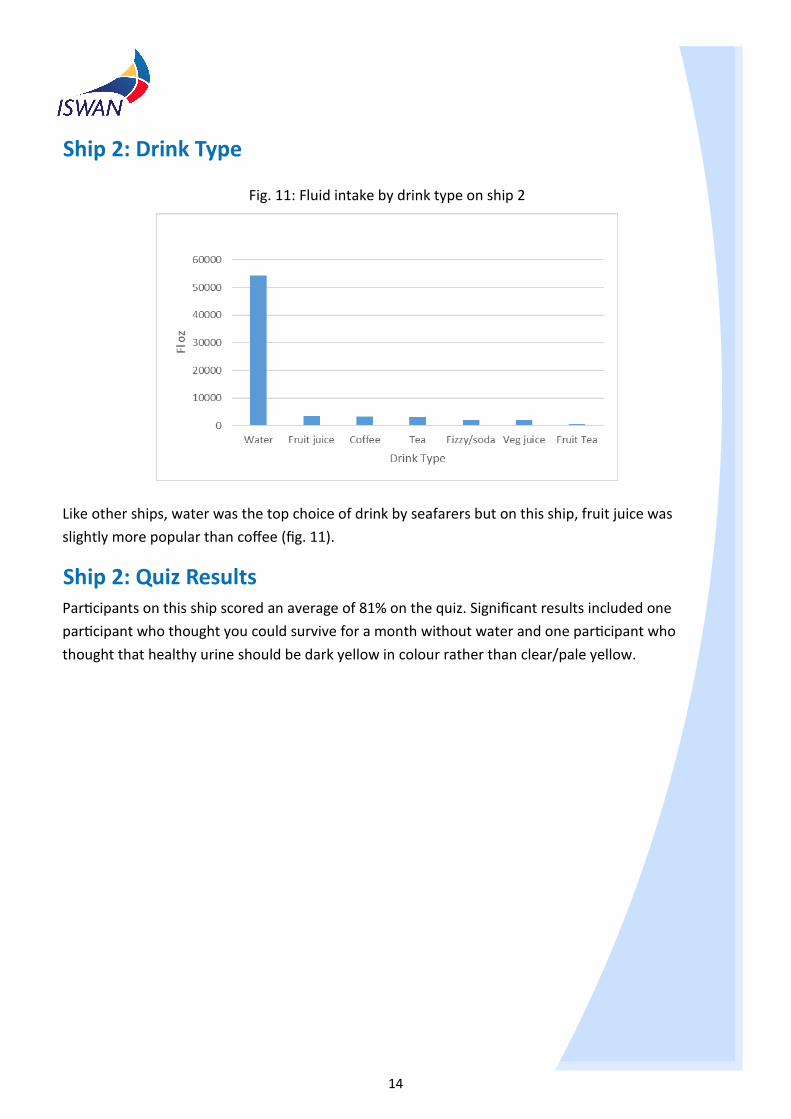
Fig. 11: Fluid intake by drink type on ship 2
Like other ships, water was the top choice of drink by seafarers but on this ship, fruit juice was
slightly more popular than coffee (fig. 11).
Ship 2: Drink Type
Ship 2: Quiz Results Participants on this ship scored an average of 81% on the quiz. Significant results included one
participant who thought you could survive for a month without water and one participant who
thought that healthy urine should be dark yellow in colour rather than clear/pale yellow.
15
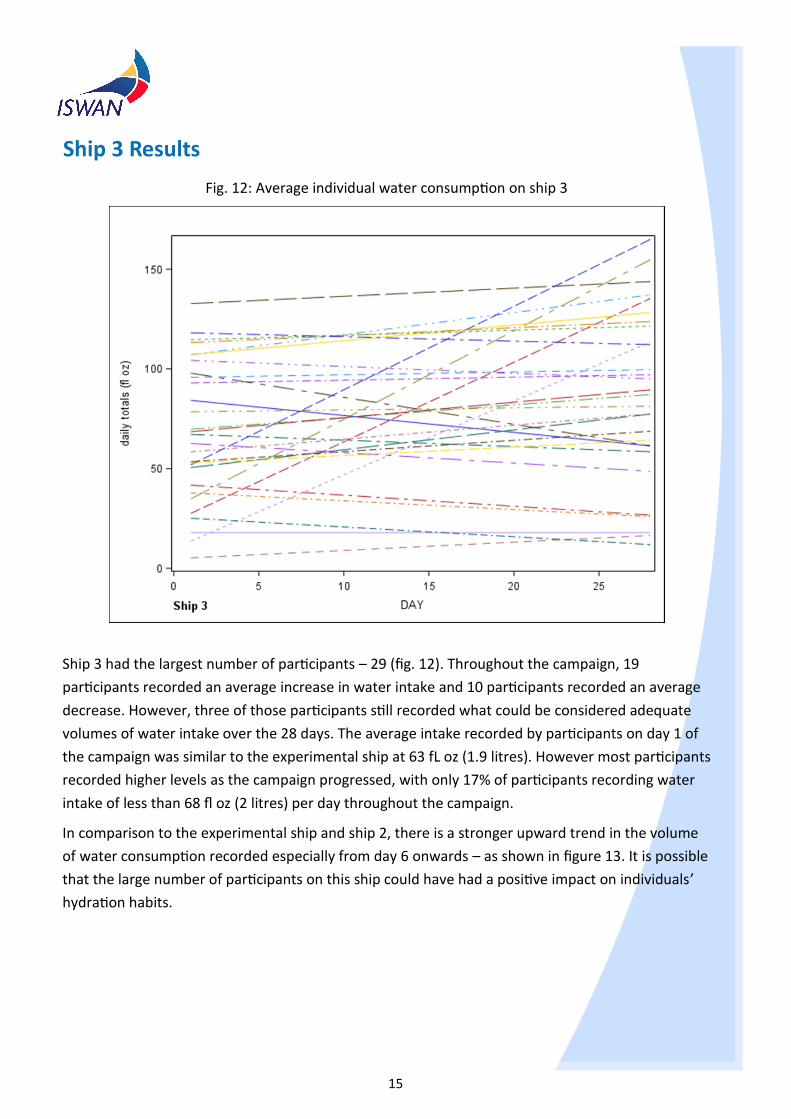
Ship 3 had the largest number of participants – 29 (fig. 12). Throughout the campaign, 19
participants recorded an average increase in water intake and 10 participants recorded an average
decrease. However, three of those participants still recorded what could be considered adequate
volumes of water intake over the 28 days. The average intake recorded by participants on day 1 of
the campaign was similar to the experimental ship at 63 fL oz (1.9 litres). However most participants
recorded higher levels as the campaign progressed, with only 17% of participants recording water
intake of less than 68 fl oz (2 litres) per day throughout the campaign.
In comparison to the experimental ship and ship 2, there is a stronger upward trend in the volume
of water consumption recorded especially from day 6 onwards – as shown in figure 13. It is possible
that the large number of participants on this ship could have had a positive impact on individuals’
hydration habits.
Ship 3 Results
Fig. 12: Average individual water consumption on ship 3
16
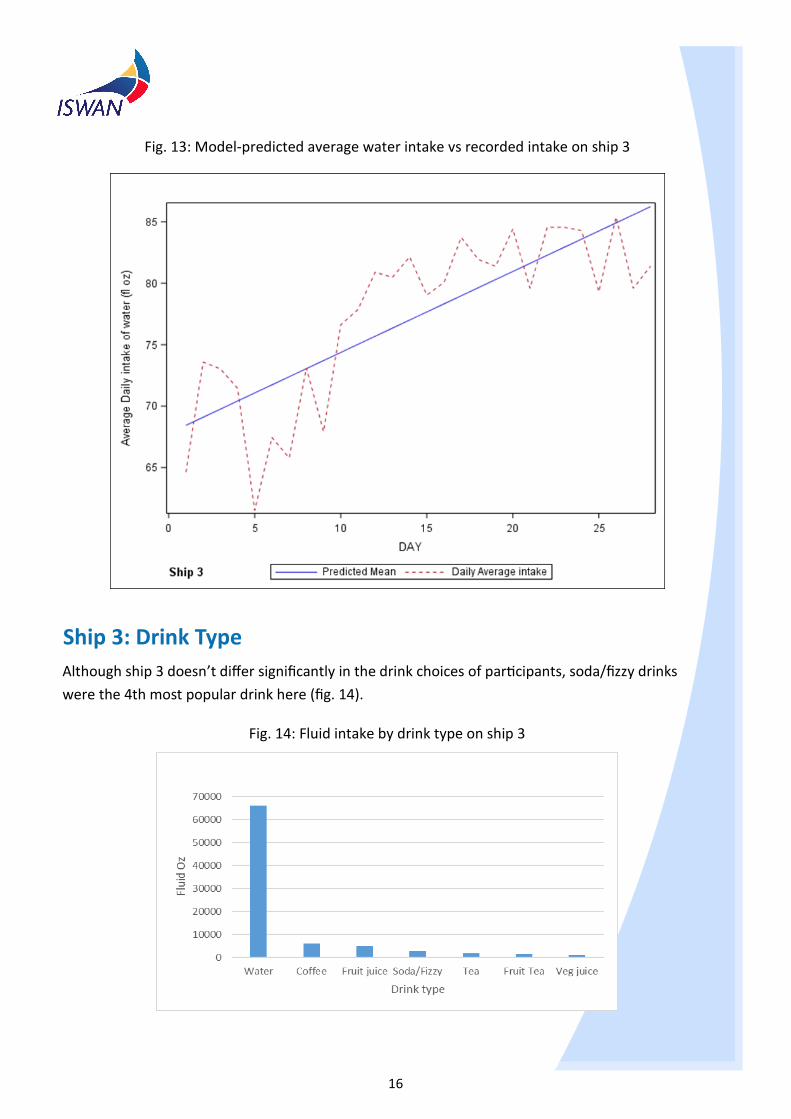
Fig. 14: Fluid intake by drink type on ship 3
Although ship 3 doesn’t differ significantly in the drink choices of participants, soda/fizzy drinks
were the 4th most popular drink here (fig. 14).
Ship 3: Drink Type
Fig. 13: Model-predicted average water intake vs recorded intake on ship 3
17
Ship 3 had the lowest average score out of all ships at 70% with 7/29 participants (25%) who
thought that you could survive for a month without water. Just over 10 % of participants (3/29)
thought that fizzy drinks help to protect your teeth and gums, selecting that answer instead of
water. This is interesting because soda/fizzy drinks were more popular on this ship than any other
ship. Finally, 5/29 (17%) did not know that the colour of healthy urine is pale yellow or clear.
Ship 3: Quiz Results
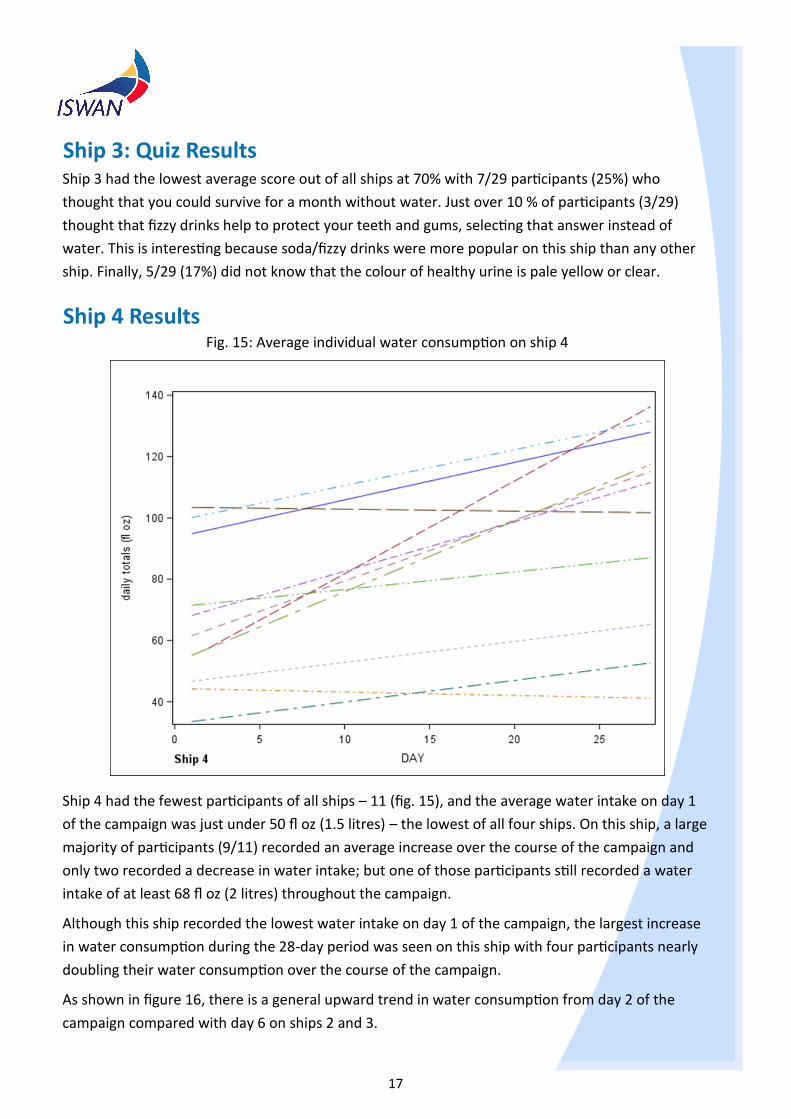
Ship 4 Results Fig. 15: Average individual water consumption on ship 4
Ship 4 had the fewest participants of all ships – 11 (fig. 15), and the average water intake on day 1
of the campaign was just under 50 fl oz (1.5 litres) – the lowest of all four ships. On this ship, a large
majority of participants (9/11) recorded an average increase over the course of the campaign and
only two recorded a decrease in water intake; but one of those participants still recorded a water
intake of at least 68 fl oz (2 litres) throughout the campaign.
Although this ship recorded the lowest water intake on day 1 of the campaign, the largest increase
in water consumption during the 28-day period was seen on this ship with four participants nearly
doubling their water consumption over the course of the campaign.
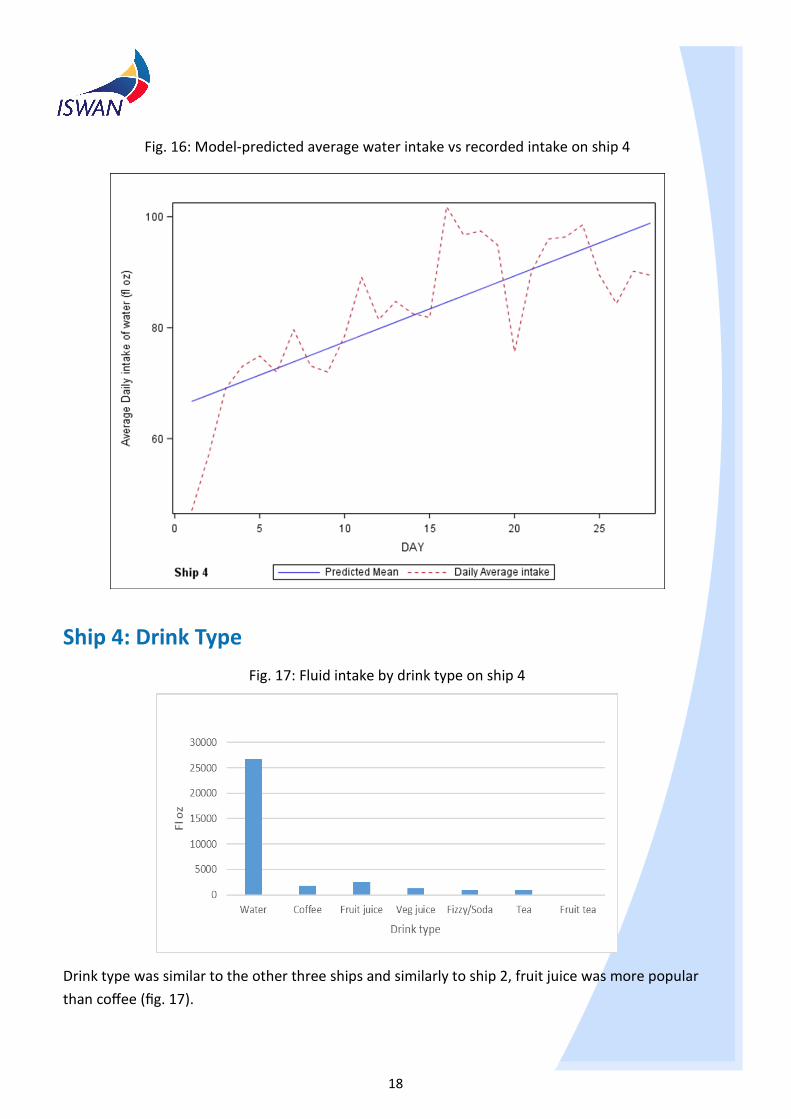
As shown in figure 16, there is a general upward trend in water consumption from day 2 of the
campaign compared with day 6 on ships 2 and 3.
18
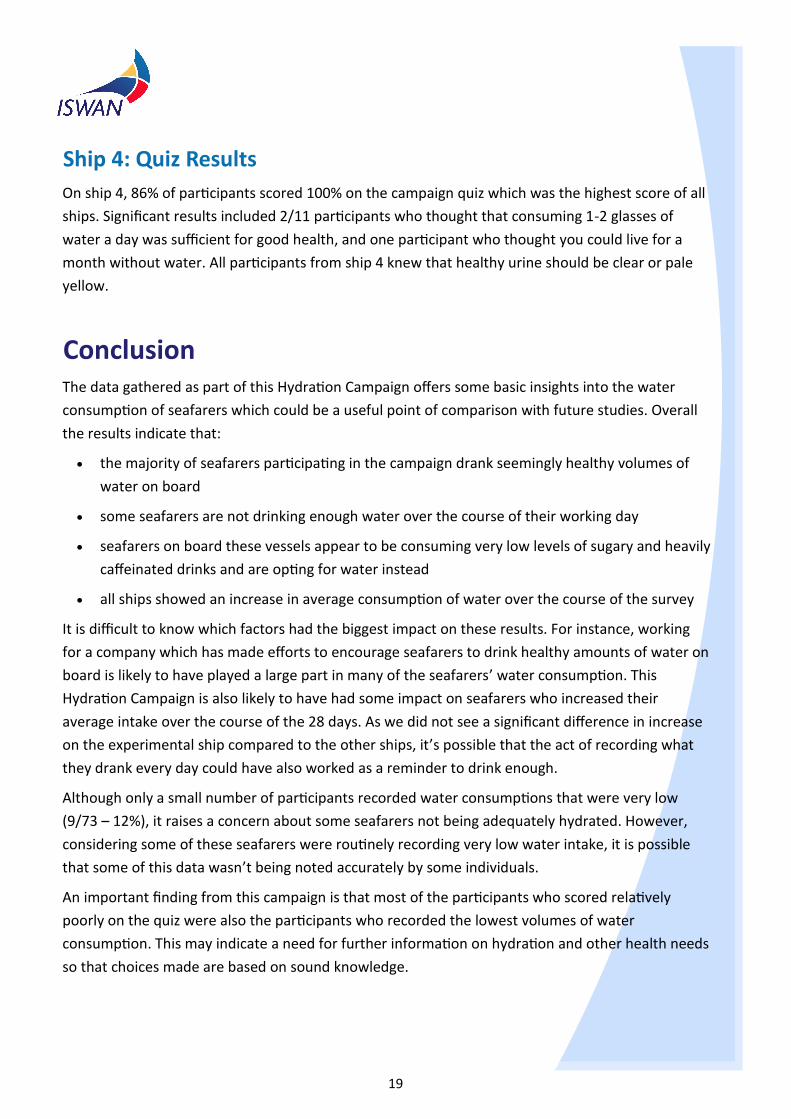
Fig. 17: Fluid intake by drink type on ship 4
Drink type was similar to the other three ships and similarly to ship 2, fruit juice was more popular
than coffee (fig. 17).
Ship 4: Drink Type
Fig. 16: Model-predicted average water intake vs recorded intake on ship 4
19
On ship 4, 86% of participants scored 100% on the campaign quiz which was the highest score of all
ships. Significant results included 2/11 participants who thought that consuming 1-2 glasses of
water a day was sufficient for good health, and one participant who thought you could live for a
month without water. All participants from ship 4 knew that healthy urine should be clear or pale
yellow.
Ship 4: Quiz Results
Conclusion The data gathered as part of this Hydration Campaign offers some basic insights into the water
consumption of seafarers which could be a useful point of comparison with future studies. Overall
the results indicate that:
the majority of seafarers participating in the campaign drank seemingly healthy volumes of
water on board
some seafarers are not drinking enough water over the course of their working day
seafarers on board these vessels appear to be consuming very low levels of sugary and heavily
caffeinated drinks and are opting for water instead
all ships showed an increase in average consumption of water over the course of the survey
It is difficult to know which factors had the biggest impact on these results. For instance, working
for a company which has made efforts to encourage seafarers to drink healthy amounts of water on
board is likely to have played a large part in many of the seafarers’ water consumption. This
Hydration Campaign is also likely to have had some impact on seafarers who increased their
average intake over the course of the 28 days. As we did not see a significant difference in increase
on the experimental ship compared to the other ships, it’s possible that the act of recording what
they drank every day could have also worked as a reminder to drink enough.
Although only a small number of participants recorded water consumptions that were very low
(9/73 – 12%), it raises a concern about some seafarers not being adequately hydrated. However,
considering some of these seafarers were routinely recording very low water intake, it is possible
that some of this data wasn’t being noted accurately by some individuals.
An important finding from this campaign is that most of the participants who scored relatively
poorly on the quiz were also the participants who recorded the lowest volumes of water
consumption. This may indicate a need for further information on hydration and other health needs
so that choices made are based on sound knowledge.
20
There are a number of ways this issue could be highlighted among seafarers. First and foremost is
the ease of access to drinking water at all times of the day. In any busy work environment on board
or ashore, it can be easy to go for long periods without drinking enough water so it is essential that
barriers to accessing water are minimised or eliminated. Another consideration is the food available
on board; if meals served contain too much salt and/or sugar, or do not include suitable portions of
vegetables, seafarers will be more at risk of dehydration. There are inexpensive materials which
shipping companies can use on board to help encourage seafarers to think about the impact of
hydration on their overall health. The materials used on the experimental ship in this campaign can
be viewed here.
It would be interesting and useful to follow up this study with wider reaching investigations and
more in-depth analyses of the issue of hydration on board. These could include:
Conducting similar studies on vessels where no previous hydration campaigns exist
Encouraging shipping companies to run their own hydration campaigns and pool results
Running a wide-reaching survey with focus groups of seafarers to further test hydration habits
on board, including investigation into barriers to drinking enough water, and knowledge of
the importance of adequate hydration to health
In-depth on-board research to investigate the environment and assess both barriers and
facilitators to adequate water consumption on board
For further information about the Hydration Campaign and ISWAN’s health resources, please
contact [email protected].