in-house report - apps.dtic.mil · p(r) =kr-p (1) where r is the particle radius, p is the exponent...
TRANSCRIPT
RADC-TR-83-286In-House ReportDecember 1983
STHE EFFECTS OF A L 0 W-A L TITUDESNUCLEAR BURST ON MILLIMETERSWAVE PROPA GA TION
Edward E. Altshuler
APPROVED FOR PUBLIC RELEASE; DISTRIBUTION UNLIMITED
DTICC.LECTEJUL 03 IM5
ROME AIR DEVELOPMENT CENTER0Air Force Systems Command
Griffiss Air Force Base, NY 13441
P5 06, 10 220
.- . -.- . - / - . • . . . - - . - . . ,7 -:-, : -: .: .- . - - . : . - . . . . - .. . .: . . - .. . . - . . . . " .. . - . - - . - , -. -.-- . . . - .
"This report has been reviewed by the RADC Public Affairs Office (PA) and
I.s releasable to the National Technical Information Service (NTIS). At NTIS
It will be releasable to the general public, including foreign nations.
RADC-TR-83-286 has been reviewed and is approved for publication.
APPROVED:
JOHN E. RASMUSSENChief, Propagation BranchElectromagnetic Sciences Division
APPRVD,
ALNC. SCHELLChief, Electromagnetic Sciences Division
AWeess Fo r 70? FOR THE COMMANDER:
DTIC TAB JOHN A. RITZUnannoUnced Acting Chief, Plans Office
DiStribution4
Availability C 3des
IAvail a/orDit Specal t!
If your address has changed or if you wish to be removed from the RADCmailing list, or if the addressee is no longer employed by your organization,please notify RADC (EEPS) Hanscom AFB MA 01731. This will assist us inmaintaining a current mailing list.
Do not return copies of this report unless contractual obligations or noticeson a specific document requires that it be returned.
tq-
UnclassifiedSECURITY CLASSIFICATION 0OF THIS PAGEL
REPORT DOCUMENTATION PAGE1I& REPORT SECURITY CLASSIFICATION lb. RESTRICTIVE MA14KINGS
Unclassified__________________21L SECURITY CLASSIFICATION AUTHORITY 3. DISTRISUTION/AVAILABILITY OF REPORT
2b. ECLSS~ICAIONDOWNRADNG CHEULEApproved for public reltase:Sb ECASIIATOIDWORDN/ACEOL distribution unlimited.
4. PERFORMING ORANIZATION REPORT NUMBER(S) 5. MONITORING ORGANIZATION REPORT NIJMBEA(SI
RADC -TR -83 -286 _____
S..NAE O PRFOMIG OGAIZTION Pb.0 OFICE SYMBOL 74L NAME OF MONITORING ORGANIZATIONRome Air Developmenit r
Center j (E'E PS') ____________________
Sc. ADDRESS (047. Stoic and ZIP? Code) 7b. ADDRESS (City. State and ZIP Code)Hanscom AFB 1Massachusetts 01731
B..NAM O FUOIO/SONSRIG S. FF ICE SYMBOL 9. PROCUREMENT INSTRUMENT IDENTIFICATION NUMBERORGANIZATION 'fitepcb.
Sc. A.OORES3 (City. State and ZIP Code) 10. SOURCE OF FUNDING NOS.
PROGRAM PROJECT TASK WORK UNITELEMENT NO . No . NO. NoD.
11 IL icue62702F 4600 16 07
13&. TYPE OF REPORT 13b TIME COVEREO 1.DATE OF REPORT (Yr.. Mo.. ay ISPAGE COUNT
1?. COSATI CODES I&. SUBJECT TERMS (Con tinue on rawrsy if necasorj and identify by block nunmber)FIEL GRUP UB.OR.Dust attenuation Nuclear burst dust
Millimeter wavelengths19. ABSTRACT IComlnue., on ,vocra. if nresuay "nd identify by block numbe,1r
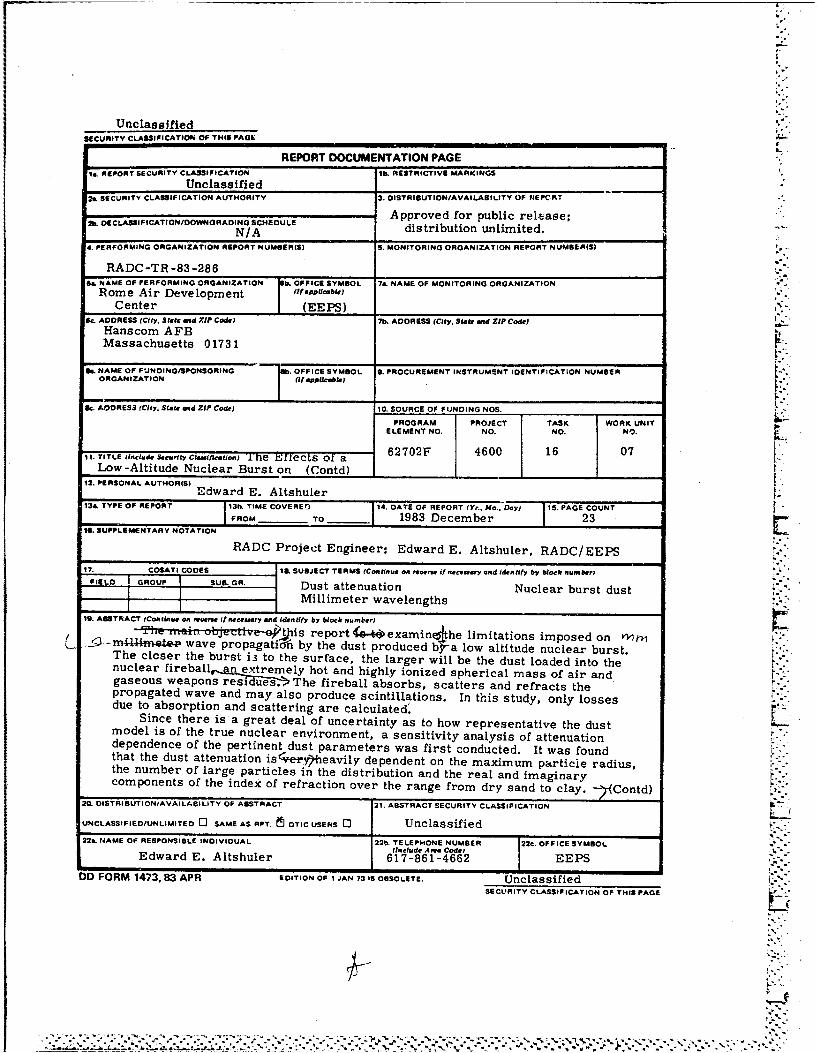
Tl1~~~~~~~~~~~ ~L~Lrds ~~l eot 4 ~xmnthe limitations imposed on ni'vir/_2-~mU4I4rn.at wave propagaticflh by the dust produced br-a low altitude nuclear burst.The closer the burst is to the surface. the larger will be the dust loaded into thenuclear fireball,_a n e~xtremely hot and highly ionized spherical mass of air andgaseous wea pons resid~ues§` The fireball absorbs, scatters and refracts thepropagated wave and may also produce scintillations. In this study, only lossesdue to absorption and scattering are calculated'
Since there is a great deal of uncertainty as to how representative the dustmodel is of the true nuclear environment, a sensitivity analysis of attenuationdependence of the pertinent dust parameters was first conducted. It was foundthat the dust attenuation isl;i'&'heavily dependent on the maximum particle radius,the number of large particles in the distribution and the real and imaginarycomponents of the index of refraction over the range from dry sand to clay. '7Contd)
20. DISTRIBUTION/AVAILABILITY OF ABSTRACT 21. ABSTRACT SECURITY CLASSIFICATION
UNCLASSIFIED/UNLIMITED 0 SAME AS RFT. ElOTIC USERS 0 Unclassified22.. NAME OF RESPON4SIBLE INDIVIDUAL 22b. TELEPHONE NUMBER I22c. OFFICE SYMBOLL
(include Areva Code)Edward E. Altshuler 617-861-4662 I EEPSDO FORM 1473, 83 APR EDITION OF I JAN 73 IS OBSOLETE. Unclassified
SECURITY CLASSIFICATION OP THIS PAGE
UnclassifiedSECURITY CLASSIFICATION OF THIS PAG0E(nn Dole Da Atrr.0
11. Contd
Millimeter Wave Propagation
----------------------------------------------------------------------
1-h Contd)
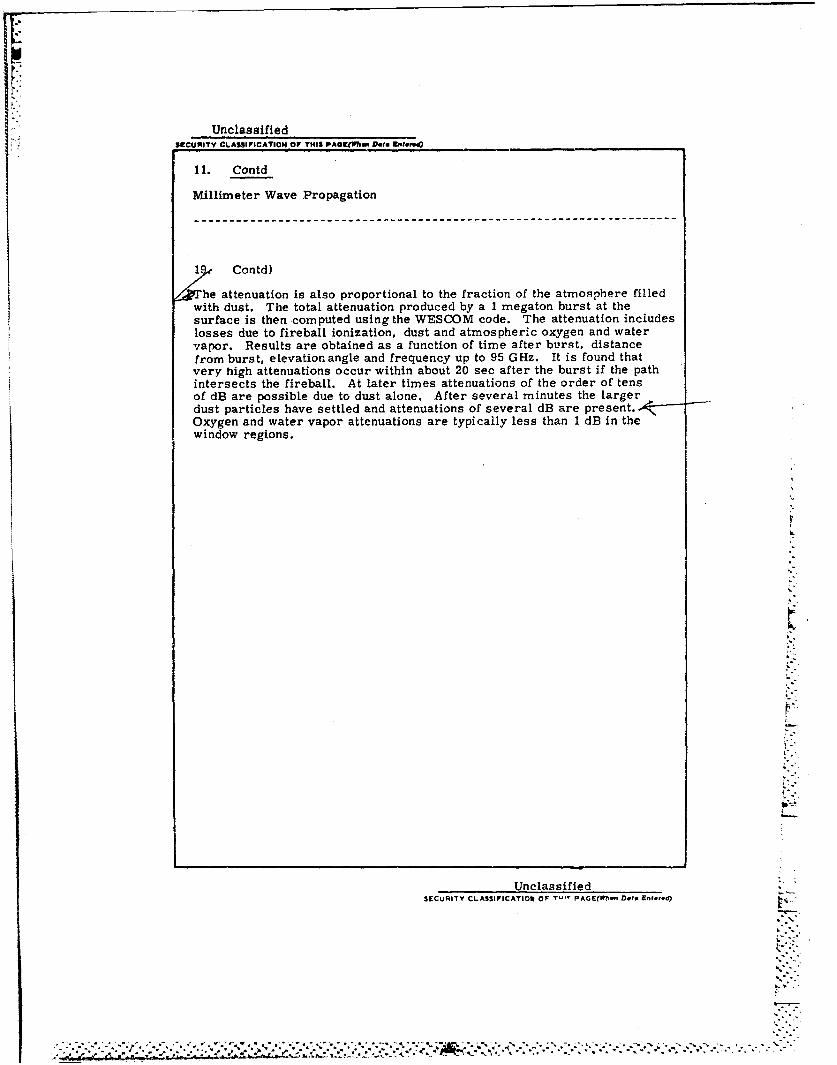
he attenuation is also proportional to the fraction of the atmosphere filledwith dust. The total attenuation produced by a I megaton burst at thesurface is then computed using the WESCOM code. The attenuation includeslosses due to fireball ionization, dust and atmospheric oxygen and watervapor. Results are obtained as a function of time after burst, distancefrom burst, elevation angle and frequency up to 95 G Hz. It is found thatvery high attenuations occur within about 20 sec after the burst if the pathintersects the fireball. At later times attenuations of the order of tensof dB are possible due to dust alone. After several minutes the largerdust particles have settled and attenuations of several dB are present.Oxygen and water vapor attenuations are typically less than 1 dB in thewindow regions.
UnclassifiedSECURITY CLASSIFICATION OF Tu- PAGE(nortn Dots En.1-cd)
~[.

I
Contents
1.INTRODUCTION 1
2. PARTICLE SIZE DISTRIBUTION 2
3. ATTENUATION OF DUST PARTICLES 3
3. 1 Dependence of Dust Attenuation on MinimumParticle Radius 6
ii
3. 2 Dependence of Dust Attenuation and Albedo onMaximum Particle Radius 7
3. 3 Dependence of Dust Attenuation on the PowerLaw Exponent 9
3.4 Dependence of Dust Attenuation and Albedo onIhepIndex of Refraction 10
3.5 Dependence of Dust Attenuation on Density of Particles 13
4. ATTENUATION PRODUCED BY A NUCLEAR BURST 13
5. CONCLUSIONS 18
V
L
- -.°"
- / Illustrations
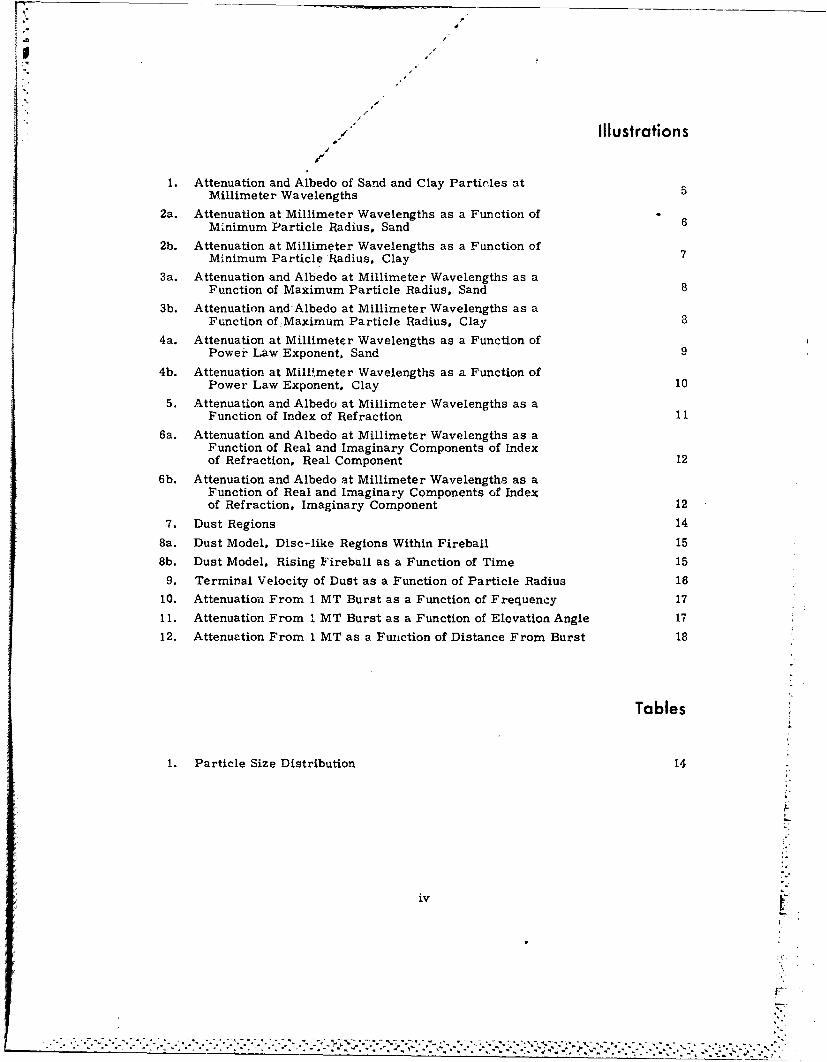
1. Attenuation and Albedo of Sand and Clay Partinles at5Millimeter Wavelengths5
2a. Attenuation at Millimeter Wavelengths as a Function of6Minimum Particle Radius, Sand
2b. Attenuation at Millimeter Wavelengths as a Function ofMinimum Particle. Radius. Clay
3a. Attenuation and Albedo at Millimeter Wavelengths as aFunction of Maximum Particle Radius. Sand 8
3b. Attenuation and Albedo at Millimeter Wavelengths as aFunction of..Maximum Particle Radius. Clay 8
4a. Attenuation at Millimeter Wavelengths as a Function ofPower Law Exponent, Sand9
4b. Attenuation at Millimeter Wavelengths as a Function ofPower Law Exponent, Clay 10
5. Attenuation and Albedo at Millimeter Wavelengths as aFunction of Index of Refraction 11
6a. Attenuation and Albedo at Millimeter Wavelengths as aFunction of Real and Imaginary Components of Indexof Refraction, Real Component 12
6b. Attenuation and Albedo at Millimeter Wavelengths as aFunction of Real and Imaginary Components of Indexof Refraction, Imaginary Component 12
7. Dust Regions 14
8a. Dust Model, Disc-like Regions Within Fireball 158b. Dust Model, Rising Fireball as a Function of Time 15
9. Terminal Velocity of Dust as a Function of Particle Radius 1610. Attenuationi From 1 MT Burst as a Function of Frequency 17
11. Attenuation From I MT Burst as a Function of Elevation Angle 17
12. Attenuation From 1 MT as a Fuiction of Distance From Burst 18
Tables
1. Particle Size Distribution 14
iv
j 6a Atenutio andAlbdo t MllieterWavlenthsas

The Effects of a Low-Altitude Nuclear
Burst on Millimeter Wave Propagation
1. INTRODUCTION
In this report the limitations imposed on millirneter waves by a low altitude
nuclear burst are examined. Associated with the burst is a fireball, an extremely
hot and highly ionized spherical mass of air and gaseous weapon residues. The
fireball grows rapidly and because of its intense heat some of the soil and other
material in the area are vaporized and taken into the fireball; strong afterwinds
cause large amounts of dirt and debris to be sucked up as the fireball rises.
In order to estimate the effects of dust on the performance of a millimeter
wave system it is necessary to first develop a dust model. Since there is a great .
deal of uncertainty as to how representative the model is of the true nuclear environ-
ment, a sensitivity analysis of the attenuation dependence on pertinent dust
parameters is conducted. It is assumed that the dust particle sizes follow a power
law distribution. Then the attenuation is computed as a function of minimum par-
ticle radius, maximum particle radius, particle size distribution, index of refrac-
tion and density. t- Mie formulation is used to calculate the absorption and scatter-
ing losses produced by dust.
The total attenuation produced by a 1 Megaton surface burst is then computed
using the WESCOM code. The attenuation consists of contributions due to fireball
(Received for publication 1 February 1985)
1/'
.- '.. . . . . . . . .
ionization, dust and atmospheric oxygen and water vapor. Attenuations are obtained
as a function of time after burst, distance from burst, elevation angle and fre-
quency.
2. PARTICLE SIZE DISTRIBUTION
The sizes of dust particles are often represented by a power law probability
distribution of the form
P(r) =kr-p (1)
where r is the particle radius, p is the exponent and k is a constant, selected such
that P(r) is a proper probability distribution. For some applications a log-normal
distribution of particle sizes is used since it provides a better model of the very
small particles. For this study, however, we will show that the actual distribution
of the very small dust particles does not significantly affect the attenuation so the
power law distribution is suitable.
Thusrmrmax
k f rp dr=1. (2)rmin-
Solving for k we have a.
k (3) a.
min max
where rin and r are the minimum and maximum particle radii respectively.
The total number of particles of radius r is then
N(r) = NTP(r) (4)
where N is the total number of dust particles,T
MN- = (5)
T bVPb V'':-'
2
-a....... *.... - .°~
. ' > . 2 " • : : :; : ' . . . ' : : ' : 2 " : : , " 2 ': 2 : ' ' " 2 " . ' " " 2 " 2 : '- " -L ' " 2 : • : 2 - " " 2 • 2 " -' * " : - ' 2 -' . " " ' ." , - " ; " • : " ' ' - : ; : " . " " " . " . . -.-*' "
I,•
and
MT= total mass of particulates.
Pb= bulk density of particulate material,
V = mean volume of a particulate.
Then
N(r) = MT. (6)
P (4/3 rr r-(p- 1) r mp -)ITbrmin -max
It can be shown that
-(p- 4 ) -(p- 4 )
r3 p-i r min max
mm r max
F inally,
MT (p-4) r-pN/3r) p r-p")
rmin max J
3. ATTENUATION OF DUST PARTICLES
Millimeter waves incident on atmospheric particulates undergo absorption and
scattering, the degree of each being dependent on the size, shape and complexdielectric constant of the particle and the wavelength and polarization of the wave.
An expression for calculating the absorption and scattering from a dielectric spherewas first derived by Mie. It has the form
Qt =- _- Re (2n + 1) (as + bs) (9)n
1. Mie, G. (1908) Contribution to the optics of suspended media specifically colloialmetal suspensions (in German), Ann. Physik, 25:377 -445.
3- .e7
• •!i ! !•
where Qt the extinction cross section. represents losses due to both absorption Qa"
ari scatfering Q and as and bsn are very complicated functions of the spherical5 n n
Bessel t:, : ms •UriA correspond to the magnetic and electric modes of the particle
respectively. Qt has the dimension of area and is usually expressed as cm .
Physically, if a wave having a flux density of S W/cm2 is incident on the particle,
then S X Qt is the power absorbed and scattered.
When the size of a dust particle is very small with respect to wavelength, then
the Rayleigh approximation is valid, For this case
Q 8I 2 r 3 Im n (10)a = A
Q 128ir5 rr6 n.- 12
It is seen that the absorption is inversely proportional to the wavelength while the
scattering loss is inversely proportional to the fourth power of the wavelength; thus
when the wavelength is large compared to the particle size, the absorption domin-
ates and scattering losses are often assumed negligible. Furthermore, since the
absorption is proportional to the particle volume, the total attenuation is propor-
tional to the total volume of dust.
As the dust particles become larger, then the Rayleigh approximation is no
longer valid and the Mie formulation must be used. Both absorption and scattering
cross sections continue to increase with particle size. Finally, after reaching a
peak the total cross section begins to level off and would eventually approach a
value of twice the geometric cross section of the particle when it is very large with
respect to wavelength. 2 Thus we note that as the particle becomes larger the
extinction cross section which was initially proportional to the particle volume
becomes proportional to the particle cross sectional area.
The attenuation coefficient is equal to
00 4
a= f N(r) Qt dr. (12)o
-3This expression is in nepers/cm; if r and Qt have units of cm and N(r) is in cm "
In order to convert to dB/km a multiplicative factor (f 4. 343 X 105 must be
introduced.
2. Van De Hulst, H. C. (1957) Light Scattering by Small Particles, Wiley, New York.
4r
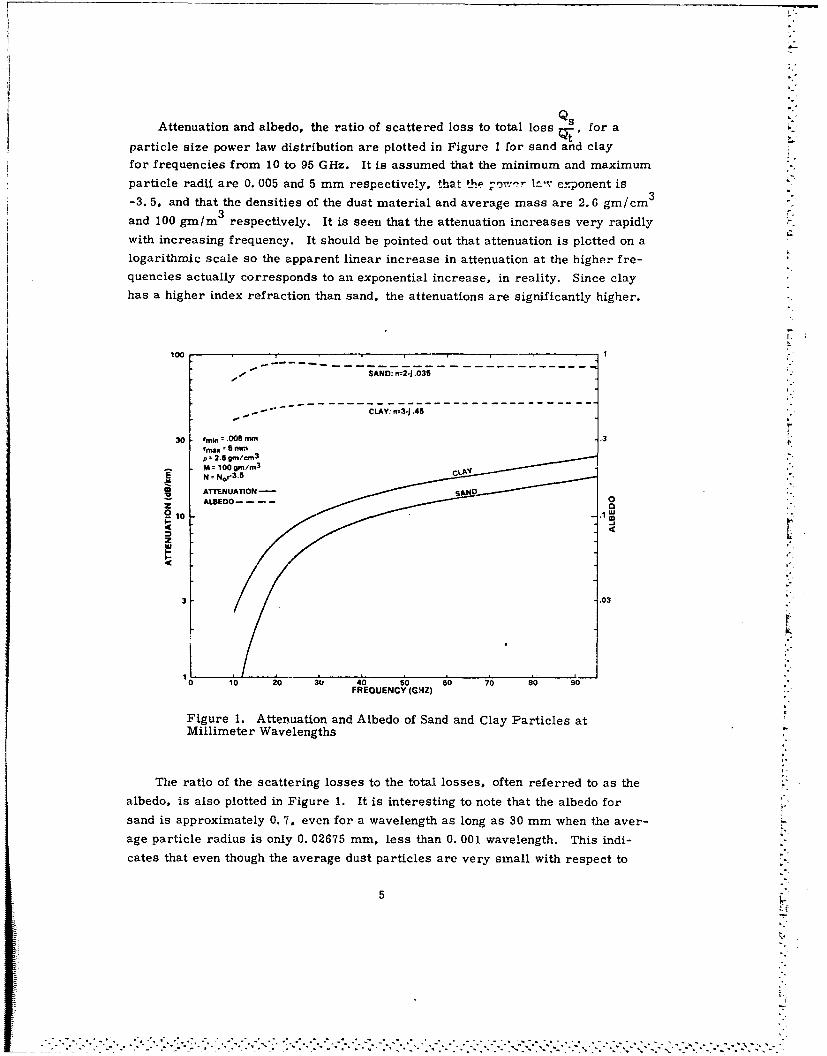
Attenuation and albedo, the ratio of scattered loss to total loss , for a
particle size power law distribution are plotted in Figure I for sand and clayfor frequencies from 10 to 95 GHz. It is assumed that the minimum and maximum
particle radii are 0. 005 and 5 mm respectively, that 1_ --',r exponent is
-3. 5, and that the densities of the dust material and average mass are 2.6 gm/cm3
3and 100 gm/m3 respectively. It is seen that the attenuation increases very rapidly
with increasing frequency. It should be pointed out that attenuation is plctted on alogarithmic scale so the apparent linear increase in attenuation at the higher fre-quencies actually corresponds to an exponential increase, in reality. Since clay
has a higher index refraction than sand, the attenuations are significantly higher.
Ls
1001
- -" - SAND: n=2-j.035
-" - CLAY: n-3-1.45• r
30 rmln =.00D mm 3;_ tn,. = 5 nwnp=2.6 gm/crm3 ,"
M =100 9m/m3 CLAVr •"
N NNor3-5
S ATTENUATION-
ALSEDO- - --- 0
10
4
3 .03
0 10 20 30 40 s0 60 70 80 90FREQUENCY (GHZ)
Figure 1. Attenuation and Albedo of Sand and Clay Particles atMillimeter Wavelengths
The ratio of the scattering losses to the total losses, often referred to as the
albedo, is also plotted in Figure 1. It is interesting to note that the albedo for
sand is approximately 0. 7, even for a wavelength as long as 30 mm when the aver-
age particle radius is only 0. 02675 mm, less than 0. 001 wavelength. This indi-
cates that even though the average dust particles are very small with respect to
5.
wavelength the scattering losses are certainly not negligible as compared to the
absc.-ptioii because of the limited number of large particles that are present. This
issue is discussed later when the results of the albedo dependence on maximum
particle radius are presented.
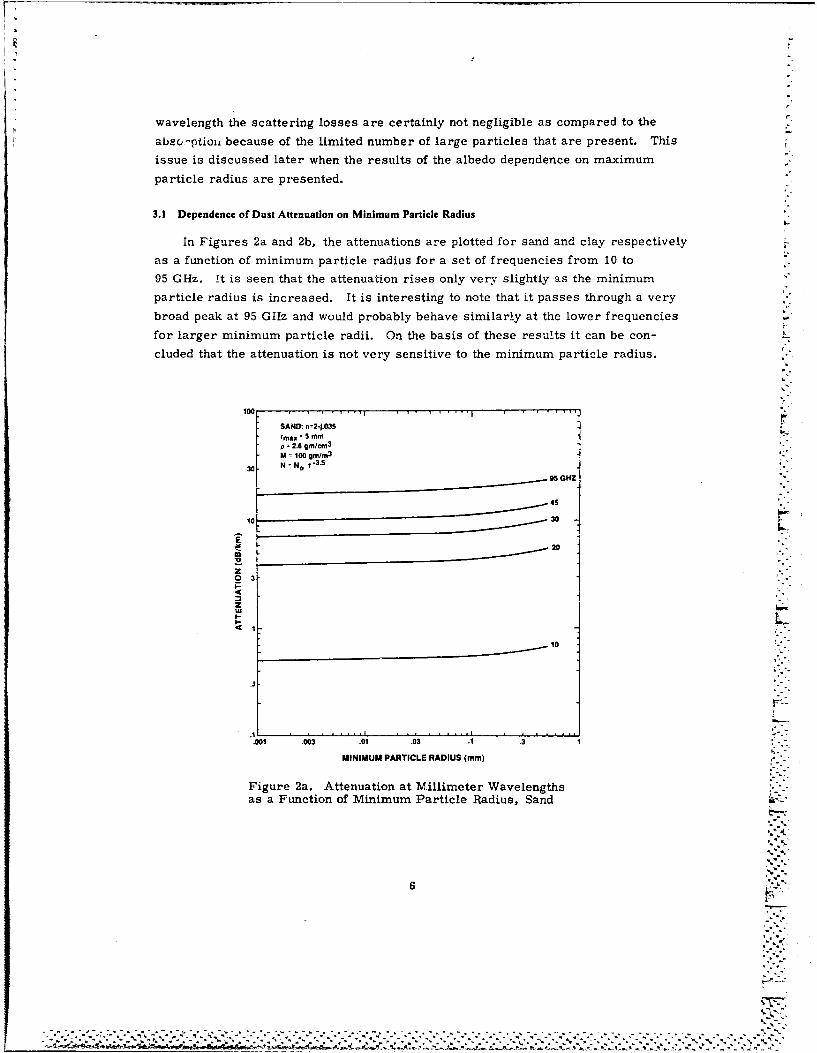
3.1 Dependence of Dust Attenuation on Minimum Particle Radius
In Figures 2a and 2b, the attenuations are plotted for sand and clay respectively
as a function of minimum particle radius for a set of frequencies from 10 to
95 GHz. it is seen that the attenuation rises only very slightly as the minimum
particle radius is increased. It is interesting to note that it passes through a very
broad peak at 95 GHz and would probably behave similarly at the lower frequencies
for larger minimum particle radii. On the basis of these results it can be con-
cluded that the attenuation is not very sensitive to the minimum particle radius.
100 ,..,... ........ I.....
SAND: n=2-1.03Srmrax 5 5 mmp 2.6 gm/Cm
3
M 100 gm/m3
30 N N. -3.5
95 GHZ
45
0 .30
20
z03
z
........................ .......................',I '• .,.i . . . :'.001 .003 .01 .03 .1 .3 1
MINIMUM PARTICLE RADIUS (mm)
Figure 2a. Attenuation at Millimeter Wavelengthsas a Function of Minimum Particle Radius, Sand
6
t'
100 ," - 1+ r. •
CLAY: n 3•-A5
p 2r4 pnllm3
1A jIo gm/mSwN No r -3.530 :.
S_ GHZ
45
30
10 20
E
0 3-
4 1
.001 .003 .01 1 .3 1
MINIMUM PARTICLE RADIUS (mm)
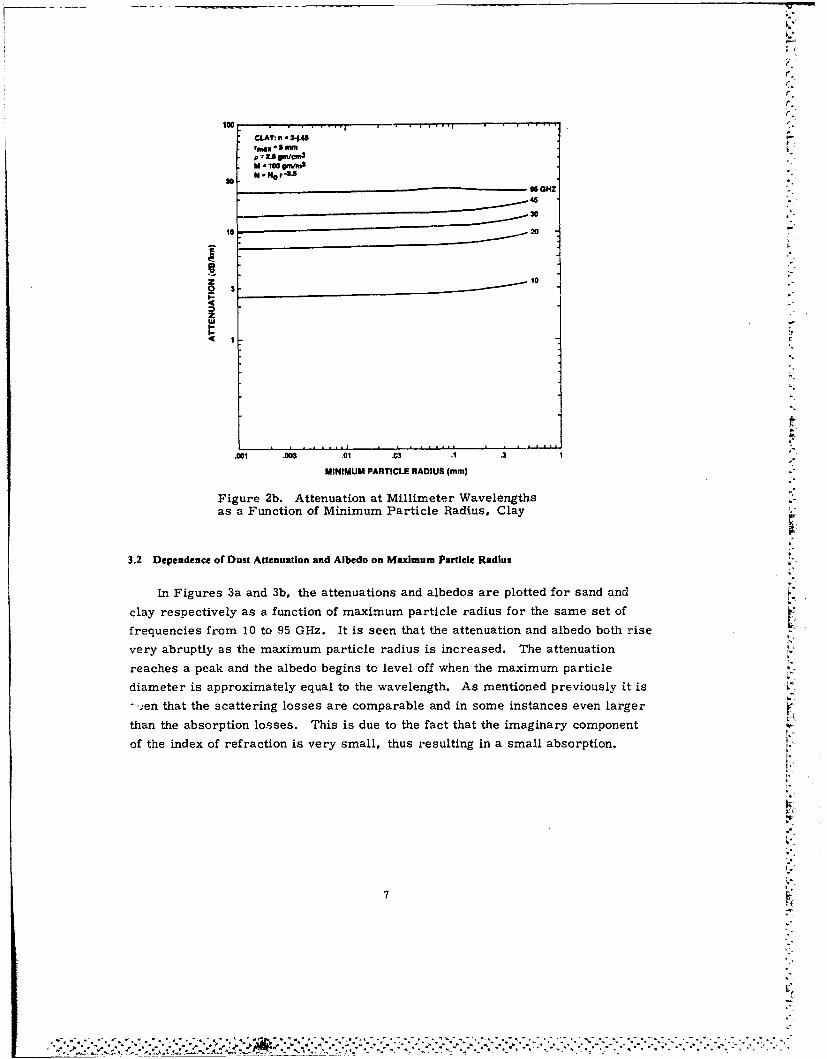
Figure 2b. Attenuation at Millimeter Wavelengths
as a Function of Minimum Particle Radius, Clay
3.2 Dependence of Dust Attenuation and Albedo on Maximum Particle Radius
In Figures 3a and 3b, the attenuations and albedos are plotted for sand and
clay respectively as a function of maximum particle radius for the same set of
frequencies from 10 to 95 GHz. It is seen that the attenuation and albedo both rise
very abruptly as the maximum particle radius is increased. The attenuation
reaches a peak and the albedo begins to level off when the maximum particle
diameter is approximately equal to the wavelength. As mentioned previously it is
.--en that the scattering losses are comparable and in some instances even larger rthan the absorption losses. This is due to the fact that the imaginary component
of the index of refraction is very small, thus resulting in a small absorption.
7.**..*.*. ~------------------------
~ ~ -. . . . . . - - -. - - *- ..

1001SAND: wi2+J035-- -------rlnIn -. 005 nmm.,
Fp..2.6 gm/cm3
f
30 = McN,3
.5 960147/ 451 30, 2 10 ' .3ATTENUATION- / 950HNZ
10 .5
220
.01
Iit.3 1.003
MAXIMUM PARTICLE RADIUS (mm)
Figure 3a. Attenuation and Albedo at Millimeter Wavelengths asa Function of Maximum Particle Radius, Sand
100 V.CLAY: n=3+j45[M~ =m.005 mmMzOgm/cm
3
30- N zN~r3S 3
10 .5
z0F0 .03 M
4
4 1 .01
.3 , ,0095 GHZ1 415, /30 '20 ,'1000
01 .03I I I 001.01 03 . .3 3 1 30 100
MAXIMUM PARTICLE RADIUS (mm)
Figure 3b. Attenuation and Albedo at Millimeter Wavelengths asa Function of Maximum Particle Radius, Clay
8
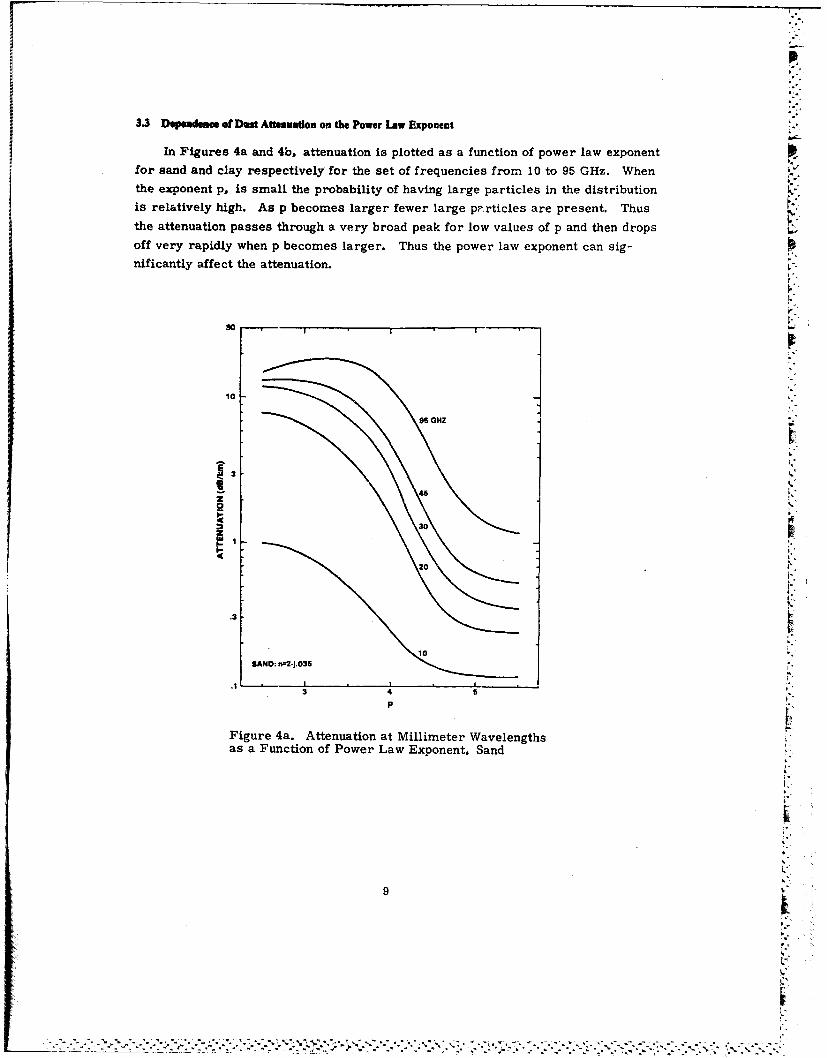
3.3 Depeadeee of Dust Attenuadon on the Power Law Exponent
In Figures 4a and 4b, attenuation is plotted as a function of power law exponent
for sand and clay respectively for the set of frequencies from 10 to 95 GHz. When
the exponent p, is small the probability of having large particles in the distributionis relatively high. As p becomes larger fewer large pF,.rticles are present. Thus I.
the attenuation passes through a very broad peak for low values of p and then dropsoff very rapidly when p becomes larger. Thus the power law exponent can sig-
nificantly affect the attenuation.
30 --
10
III95 GHZ "
.3
46;
3 4.3z
SAND: n=2-1.036 -
3 4 5 !
Figure 4a. Attenuation at Millimeter Wavelengthsas a Function of Power Law Exponent, Sand
9.9L
I-
. . . . . . . . .. '. * -- - ~........

30
23
220I-4
CLAY: n=3-j.45
.3
.1 I
3 4
P
Figure 4b. Attenuation at Millimeter Wavelengthsas a Function of Power Law Exponent, Clay
3.4 Dependence of Dust Attenuation and AIbedo on the Index of Refraction
In Figure 5, the attenuation and albedo are plotted as a function of index of
refraction n= n1 - jn 2, for the set of frequencies from 10 to 95 GHz. Both the realand imaginary components of the index of refraction are increased linearly uo thatthe particulates have an index of refraction that corresponds to dry sand for thelowest values and water for the highest values. It is seen that the attenuation
increases and the albedo decreases sharply as the particulates change from dry
sand to clay and then both essentially level off as the real and imaginary compo-
nents are increased further. The attenuation and albedo are examined more closely
in Figure 6. In Figure 6a, the imaginary component is fixed at n 2 = 0.2 and the
real component is varied from 1. 6 to 3.4; in Figure 6b, the real component is
fixed at n 1 =2.5, and the imaginary component is varied from zero to 0. 6. For
both cases the attenuation increases gradually as either of the components of index
of refraction is increased. Based on the curves for the albedo it is seen that
10 r
- - -- -- - ---
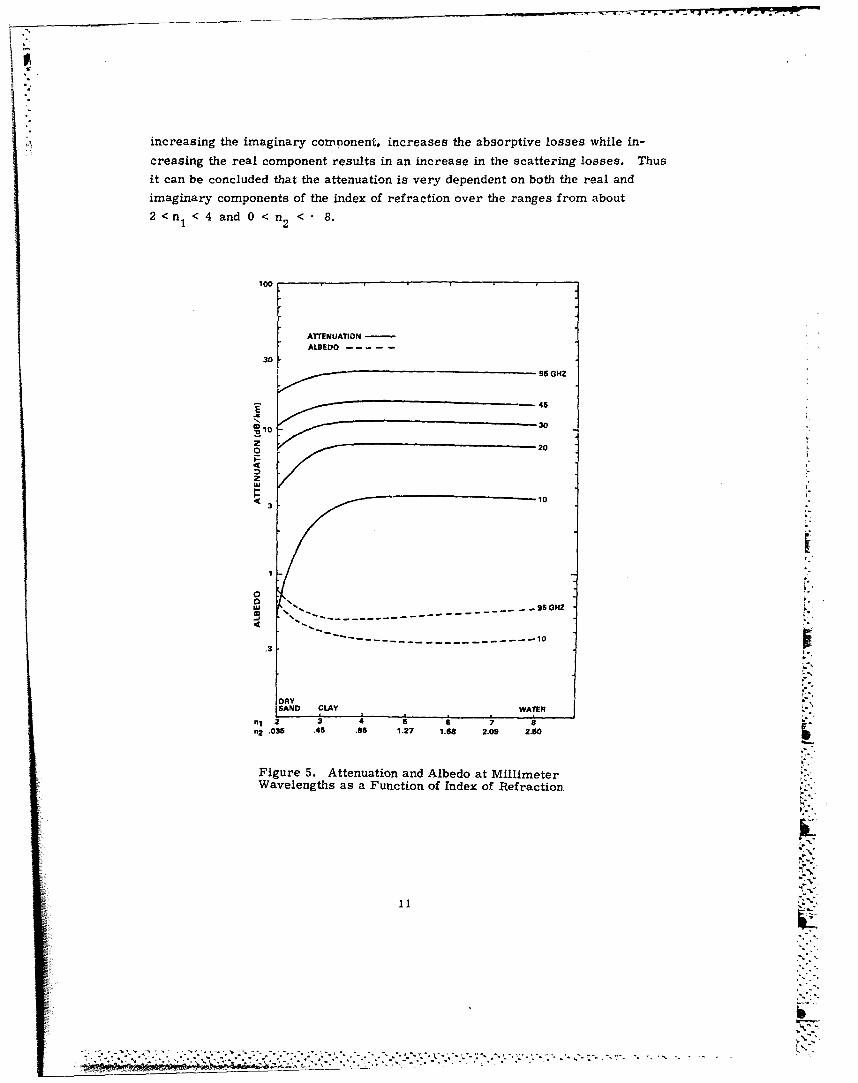
increasing the imaginary component. increases the absorptive losses while in-
creasing the real component results in an increase in the scattering losses. Thus
it can be concluded that the attenuation is very dependent on both the real and
imaginary components of the index of refraction over the ranges from about
2 <n1 < 4 and 0 < n2 < 8.
100
ATTENUATION -
ALBEDO-
30f 95 GHZ
10 30
z020
4
10
.3i -
DRY ,SANDo CLAY WATRe "
"n2 .035 .45 .86 1.27 1.68 2.09 2.60
Figure 5. Attenuation and Albedo at MillimeterWavelengths as a Function of Index of Refraction
11 ,x
Sb
L'~

20
464
1.8 2.0 2. .126 260. .
20
95 0H
0 945
03
Figu 6 re6. Ateuio an20 APbed at Milmte1ae
n2 =.
2~' rmi'.0
S ff A L D I m - n r C o m p o n e n t
ATENATO -TEU
N:ý
n I-
"Fg r a-tAtnuto n2leoatMli ee ae
12
------------------------------------------ ofa . . .
3.5 Dependence of Dust Attenuation on Densilty of Particles
In Eq. (5) it is seen that the total number of dust particles is directly propor-
tional to the total mass of the particles MT. divided by the bulk density pb of the
individual particles. In this formulation a single scattering model is used so the
attenuation is directly proportional to the number of particles as seen in Eq. (12)
and therefe-re directly proportional to MT/Pb. Thus any uncertainty in either the
total mass or particle density will produce a corresponding error in the attenuation.
4. ATTENUATION PRODUCED BY A NUCLEAR BURST
As mentioned previously associated with the nuclear burst is a fireball. The
initial electron density within the fireball is extremely high and for a period of
about 20 sec blacks out the propagated wave. After that time, beta radiation from
the radioactive debris within the fireball may sustain sufficiently high ionization
levels to absorb millimeter wave signals for several minutes. Thus the two prin-
cipal sources that attenuate the propagated wave are fireball ionization and dust.
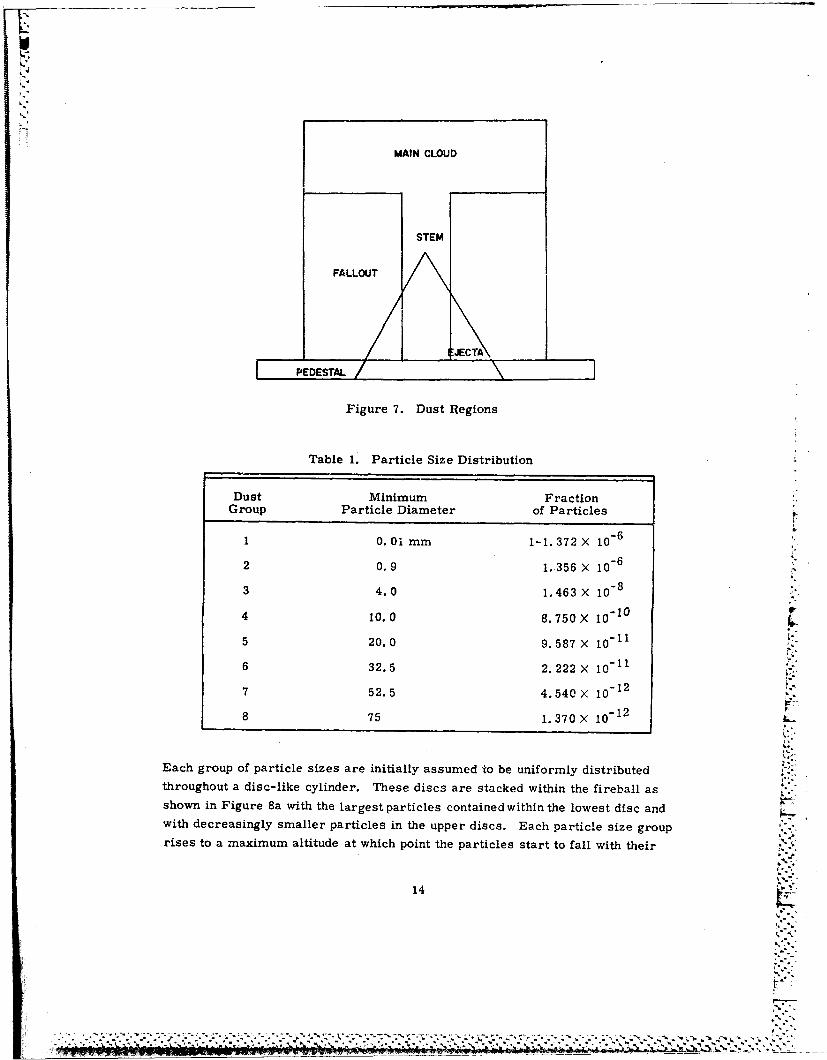
The nuclear explosion dust model is often divided into five distinct regions
which are modeled somewhat crudely in Figure 7. The ejecta region consists of
relatively large particles of dust and debris thrown out of the crater; settling
occurs quickly and its importance diminishes in about a minute or so. The blast
wave produces a low level dust region often referred to as the pedestal or sweep-
up layer. This region has high dust densities for about a minute also; lower
densities exist for many minutes later. The cylindrical stem region forms after
the establishment of the fireball vortex and lasts for several minutes. The mush-
room shaped cloud or main cloud is the major dust region and exists for many
minutes. Finally, the main cloud transcends into the fallout region which exists
for a long period of time.
In this study the Weapons Effects on Satellite Communications code (WESCOM)
is used. It utliizes environment, propagation and signal processing models
developed by the Defense Nuclear Agency (DNA) and attempts to provide a best
estimate of the quantities being modeled. Included along with ionization and dust
losses are the oxygen and water vapor losses of the ambient troposphere.
The WESCOM dust model is a somewhat simplified model in that it assumes
that all the dust is initially contained within the fireball and then forms a main cloud
which eventually becomes the fallout region. 3 The stem and pedestal are not in-
cluded in the WESCOM dust model. Dust particulates within the fireball are divided
into the eight partic~e size ranges shown in Table 1.
3. Thompson, . . (1980) Dust Clouds - Models and Propagation Effects, Pro- %ceedings of Submillimeter Atmospheric Propagation Applicable to Radar andMissile Systems, Redstone Arsenal, Alabama, TR-80-3, pp. 114-117.
13
.. 'w
MAIN CLOUD
STEM
FALLOUT
NJECTA
PEDESTAL
Figure 7. Dust Regions
Table 1. Particle Size Distribution
Dust Minimum Fraction
Group Particle Diameter of Particles
1 0.01 mm 1-1. 372 X 106
2 0.9 1..356 X 10 6
3 4.0 1.463X 10"8
4 10.0 8.750 X 10
5 20.0 9. 587 X 10i
6 32.5 2. 222 X 10-1-12 '
7 52.5 4. 540 X 101
8 75 1.370X 10⁻¹²
Each group of particle sizes are initially assumed to be uniformly distributedthroughout a disc-like cylinder. These discs are stacked within the fireball asshown in Figure 8a with the largest particles contained within the lowest disc andwith decreasingly smaller particles in the upper discs. Each particle size grouprises to a maximum altitude at which point the particles start to fall with their
14 ".'
*_... * -.
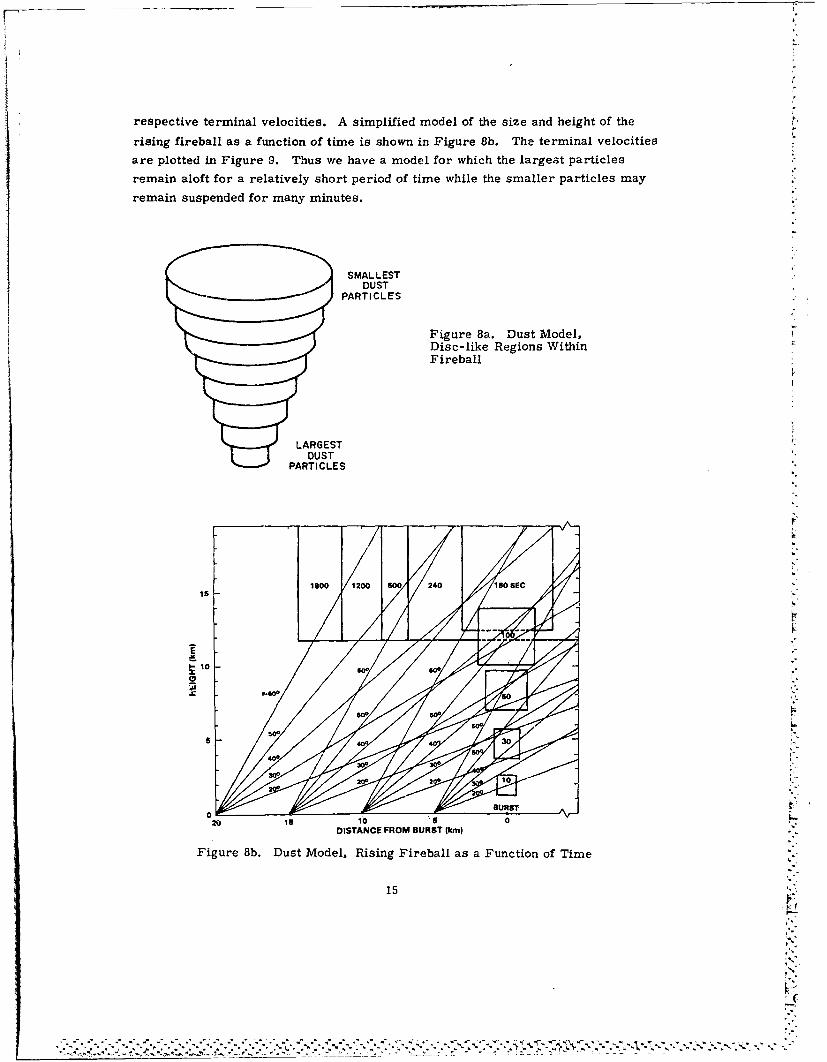
respective terminal velocities. A simplified model of the size and height of the
rising fireball as a function of time is shown in Figure 8b. The terminal velocities
are plotted in Figure 9. Thus we have a model for which the largest particles
remain aloft for a relatively short period of time while the smaller particles may
remain suspended for many minutes.
SMALLESTDUST
PARTICLES
Figure 8a. Dust Model,Disc-like Regions WithinFireball
SLARGEUST •
PARTICLES
1300 1200 600 240 IS0 SEC
-0
zw
BUST
DISTANCE FROM BURST (kin)
Figure 8b. Dust Model, Rising Fireball as a Function of Time
15
(
30
10
3
. 3.
7.
DIAMETER (cm)
Figure 9. Terminal Velocity of Dust as a Functionof Particle Radius
A set of attenuations were computed, using the WESCOM code, as a function
of frequency, elevation angle, distance from the burst and time after burst for a
megaton surface burst. In Figure 10 the attenuation is plotted as a function of -. "
time for a slant path 30° above the horizon, distance from burst of 10 km and fre-
quencies of 10, 20, 45 and 95 GHz. It is seen that the attenuation has essentially
two peaks; the first peak occurs about 35 sec after the burst and is caused by the
dust rising through the antenna beam, the broader and lower attenuation second
peak is due to the settling dust passing through the beam again. As expected, dust
attenuation increases significantly with frequency.
In Figure 11 the angle dependence of the attenuation is examined for the same
conditions at a frequency of 45 GHz. As expected the first peak occurs earliest
and the attenuation is highest for the lowest elevation angle. Also the separation
in time of the peaks decreases with increasing elevation angle.
In Figure 12 the distance dependence of the attenuation is plotted for the same
conditions for a fixed elevation angle of 300. It is seen that the highest attenuations
occur earliest for distances closest to the burst and then decrease and occur at
later times as the distance from the burst is increased.
16
S.. ..--
100
wISCOU
D - 10 KM30
I MT
10
0 \Figure 10. Attenuation From.. 3" 1 MT Burst as a FunctionS'K.
. Gof Frequency
...... '-.... -. ---
.3
.7..10 30 I0U 300 1000 3000
TIME (SECI
100
WIESCOM
0 2010K
30 DIK
I UTO= 3003
10 400
I •=-: ",e Figure 11. Attenuation From
_o 1 MT Burst as a Functionof Elevation Angle
...................... . .... ..............--- ----.. .-I --- --.-..- .
.3
100 300 1000 3000TIME (SEC)
17
I.........
100
WESC0M
KMA
F 45 GHZ30
I IWI
; 3
N-.-" ......
11
10
3Y-\
0 3O0
100
30
TIME (SEC)
Figure 12. Attenuation From 1 MT Burst asa Function of Distance From Burst
In general it is seen that high attenuations occur at all frequencies as the rising
dust cloud passes through the antenna beam. For low elevation angles and dis-
tances close to the burst these attenuations may exceed 100 dB. Attenuations
produced by the falling dust are significantly lower and do not generally exceed 5 dB.
5. CONCLUSIONS
Upon examining the effects of dust on slant path propagation at millimeter wave-
lengths it has been shown that the attenuation is heavily dependent on the maximum
particle radius, the number of large particles in the distribution and the real and
imaginary components of the index of refraction in the range from dry sand to clay.
The attenuation is also directly proportional to the fraction of the atmosphere filled
with dust. Dust attenuations, while low at frequencies below 10 GHz increase
significantly at millimeter wavelengths.
For the WESCOM code, the computed attenuations behave as would be expected.
Very large attenuations occur immediately after the burst due to fireball ionization
18
-. .,
.*
and dust when the antenna beam is close to the fireball. At later times the attenua-
tion is caused mostly by dust. The attenuation due to oxygen and water vapor is
typically less than 1 dB in the window region.
Gn the basis of these results it appears that if the antenna beam intersects the
fireball within the first 20 sec after the burst, then attenuations greater than
100 dB are likely, and the lower frequencies are attenuated more than the higher
frequencies because the losses are due predominantly to fireball ionization. For
this reason it would seem that the very early dust model is not too critical since
the attenuations are always prohibitive. At times from about 20 sec to several
minutes, the period after ionization losses have essentially disappeared, but duringwhich dust losses can be tens of dB's, the accuracy of iha dust model parameters
discussed above can significantly influence the results. Finally, when the dust
settles, although attenuations of the order of several dB are likely, it would seem
that it should be possible to model these more accurately than those at earlier times
since the terminal velocities of the dust particles are known. Since only the very
small particles remain suspended the size distribution is less critical and only the
density and index of refraction of the dust are important.
l7
19
"y,
= -
MISSION* Of
Rome Air Development CenterRADC ptan4 and ex~ecutes tzes&ea,%.ch, devetopment, te~stand ze.tected acquisi.ti.on p'Log,%am~ inf 6cppo/tt o~j
*Command, Conttot, Commnunications and Inteet-Lgence.(C3.1) activit.Zez. Techni..caZ and engi.nee4-ing,scuppo'rtt wi&thin a,%ea4 ad competence iA p'toviLded toESV Ptog.'Lam O.Licez (P045) and othe'L ESV etementAto peVjo'Lm e66ect-i.ve acquizti~on o6 C3 1 systems.The a'LeaA o6 technica.C competence -LncZtdecommuni.cations, command and contJtot, batttemanagement, indo,%mation p'toceszing, zut~veitZtanceze~oz intettigence data cotLZection and handZing,
*6zotid .state sciLences, etec~t'omagnetics, andp~topagatic'n, and eZect'Lanic, maintainabLtityr,and con'pat.ZbLPJig.
Printed byUnited States Air ForceHanscom AFB, Mass. 01731