in-depth survey report · in-depth survey report . ... introduction ... (sargent et al., 2009)....
TRANSCRIPT

In-Depth Survey Report
Evaluation of Enclosed Reactor for the Production of Aligned Carbon Nanotubes William A. Heitbrink1, Ph.D., C.I.H.
Li-Ming Lo1, Ph.D.
Catherine Beaucham2, M.P.H.
Christopher Sparks2, M.S.
1Division of Applied Research and Technology Engineering and Physical Hazards Branch
2Education and Information Division
EPHB Report No. 356-17a
November 2012
DEPARTMENT OF HEALTH AND HUMAN SERVICES Centers for Disease Control and Prevention National Institute for Occupational Safety and Health

EPHB Report No.356-17a
Page ii
Site Surveyed: Nanomaterial manufacturing facility, Midwestern USA
NAICS Code: 325199
Survey Dates: February 23, 2012
Surveys Conducted By: William A. Heitbrink, NIOSH/DART/EPHB
Li-Ming Lo, NIOSH/DART/EPHB
Catherine Beaucham, NIOSH/EID
Christopher Sparks, NIOSH/EID

EPHB Report No.356-17a
Page iii
Disclaimer Mention of any company or product does not constitute endorsement by NIOSH. In addition, citations to websites external to NIOSH do not constitute NIOSH endorsement of the sponsoring organizations or their programs or products. Furthermore, NIOSH is not responsible for the content of these websites. All web addresses referenced in this document were accessible as of the publication date.

EPHB Report No.356-17a
Page iv
Table of Contents
Disclaimer ........................................................................................ iii Abstract ............................................................................................ v
Introduction ...................................................................................... 1
Background .................................................................................... 1
Potential Health Effects .................................................................... 1
Published Regulations ...................................................................... 3
Plant Description ................................................................................ 4
Manufacturing Processes .................................................................. 4
Process Description .......................................................................... 4
Control Measures............................................................................. 8
Methodology...................................................................................... 9
Ventilation Measurements................................................................. 9
Air Filter Sampling ........................................................................... 9
Aerosol Measurements ................................................................... 10
Results ........................................................................................... 12
Ventilation Measurements............................................................... 12
Air Filter Sampling ......................................................................... 12
Aerosol Measurements ................................................................... 14
Conclusions and Recommendations .................................................... 18
References ...................................................................................... 20

EPHB Report No.356-17a
Page v
Abstract The study site produces aligned carbon nanotubes in an enclosed reactor (Easy Tube 3000, First Nano, Ronkonkoma, NY). Carbon nanotubes are produced so that they are aligned in one direction on a substrate. These are termed “aligned carbon nanotubes” and they stand on end like the bristles on a brush. Aligned carbon nanotubes can have different physical properties in longitudinal as opposed to other directions (Lan, Wang, & Ren, 2011). This property is used to enhance the electrical and mechanical characteristics. Hazard control for this reactor is largely integral to the equipment’s design and is intended to contain dangerous air contaminants. Ventilation is used as a secondary, redundant control measure that removes any process leakage, thermal decomposition products from the reactor exterior, and heat from the enclosed spaces around the reactor. The vertically aligned carbon nanotubes are formed on a substrate. The carbon nanotubes can be spun into a thread that may replace copper wire. Researchers from the National Institute for Occupational Safety and Health (NIOSH) conducted a study at this site to evaluate the ability of the Easy Tube 3000 reactor to control worker exposure to carbon nanotubes and to determine whether spinning of the vertically aligned carbon nanotubes into a fiber or thread emitted carbon nanotubes into the workplace air. Air flows in the Easy Tube 3000 system were measured with a hot-wire anemometer (Velocicalc plus model 8386, TSI Inc., Shoreview MN). These direct reading instruments were used to monitor particle number and mass concentrations in the worker’s breathing zone and near active production processes: a Fast Mobility Particle Sizer spectrometer (FMPS, Model 3091, TSI Inc.), the Condensation Particle Counter (CPC, Model 3007, TSI Inc.) and an aerosol photometer (DustTrak, Model 8533, TSI, Inc.). Air samples were collected to determine the elemental carbon (EC) concentrations (NIOSH method 5040) and the number concentration of fibers (NIOSH method 7402) on the worker and near the processes we studied. The concentration measurements suggested that the operation of the equipment did not contribute to air contamination in the workplace. Individual fibers were not detected in the workplace air, and elemental carbon concentrations were less than 1 µg/m3. The number concentrations of particles smaller than 100 nm were less than 20,000 particles/cm3, which is typical of ambient air pollution (background). Total mass concentrations were less than the typical PM10 concentrations reported by the local air pollution control agency. However, there were some brief concentration spikes that exceeded 0.1 mg/m3 for periods of 3-4 seconds. Such peaks could be caused by process leakage or the re-suspension of dust in the sampling hose. These results indicate that the Easy Tube 3000 was effectively designed and built to prevent process emissions

EPHB Report No.356-17a
Page vi
into the workplace. Furthermore, the static pressure in the systems enclosure was -0.03 inches of water relative to the room; which should prevent leakage out of the enclosure.

EPHB Report No.356-17a
Page 1
Introduction
Background
The purpose of this study, funded by the NIOSH Nanotechnology Research Center (NTRC), is to investigate the effectiveness of control measures used by nanomaterial manufacturers. This site survey was collaboratively conducted by NIOSH researchers from the Engineering and Physical Hazards Branch (EPHB) within the Division of Applied Research and Technology (DART) and from the NTRC Field Studies Team within the NIOSH Education and Information Division (EID). Potential risks associated with nanoparticle exposure from toxicological research of engineered nanomaterials have been reported (Buzea, Blandino, & Robbie, 2007; European Agency for Safety and Health at Work, 2009; ISO, 2008; Safe Work Australia, 2009a). Consequently, workplace controls have been recommended to prevent or minimize exposure to engineered nanomaterials (Safe Work Australia, 2009b). At this site, NIOSH researchers focused on hazard control, specifically, the control of worker exposure to airborne carbon nanotubes (CNTs). This report addresses the findings from these measurements. Ventilation measurements, integrated filter samples, and real-time instruments were used to assess the ability of a commercially available reactor to control worker exposures to airborne nanomaterials. This reactor was designed to minimize the emissions of air contaminants into the workplace air. The study results will lead to better recommendations for nano-specific engineering controls during manufacturing and handling of nanomaterials in workplaces.
Objectives:
• Evaluate the ability of a commercially available reactor (EasyTube® 3000, First Nano, Ronkonkoma, NY) to manufacture aligned carbon nanotubes with minimal emissions of carbon nanotubes into the workplace air.
• Investigate the potential for individual nanoparticles to be released when spinning aligned nanotubes into a thread. These emissions could cause worker exposure to carbon nanotubes.
Potential Health Effects
Currently there are no studies reported in the literature of adverse health effects in workers producing or using CNTs or carbon nanofibers (CNFs). The

EPHB Report No.356-17a
Page 2
concern about worker exposure to CNTs or CNFs arises from results of animal studies. Several studies in rodents have shown: (1) an equal or greater potency of CNTs compared to other inhaled particles known to be hazardous to exposed workers (ultrafine carbon black, crystalline silica, and asbestos) in causing adverse lung effects including pulmonary inflammation and fibrosis (Shvedova et al., 2005); (2) the early onset and persistence of pulmonary fibrosis observed in CNT-exposed animals in short-term and subchronic studies (Pauluhn, 2010; Porter et al., 2010; Shvedova, et al., 2005); and (3) the reduced lung clearance in rats exposed to low mass concentrations of CNTs (Hubbs et al., 1997). Findings of acute pulmonary inflammation and interstitial fibrosis have also been observed in mice exposed to CNFs (Hubbs, et al., 1997; Kisin, Murray, & Sargent, 2010). In addition, the long and thin structure of some CNTs and CNFs dimensionally resemble asbestos fibers, and multi-walled carbon nanotubes (MWCNTs) have been observed to migrate from pulmonary alveoli to the pleura tissue which is the same site in which malignant mesothelioma can develop due to asbestos exposure (Hubbs, et al., 1997; Kisin, et al., 2010; Porter, et al., 2010). Animal studies have also shown asbestos-type pathology associated with exposure to longer, straighter CNT structures (Poland et al., 2008; Takagi et al., 2008), and in vitro cell studies have shown that single-walled carbon nanotubes (SWCNTs) can cause genotoxicity and abnormal chromosome number due to interference with mitosis (cell division)(Sargent et al., 2009). Mesothelial tumors have been reported in a susceptible strain of mice after intraperitoneal injection of longer MWCNTs (10-20 µm in length) but not by short MWCNTs (<1 µm in length) (Muller et al., 2009). Some evidence indicates that CNTs with certain metals (nickel, 26%) and with higher metal content (17.7% vs. 0.2% Fe) are more toxic and fibrogenic (Lam, James, McCluskey, & Hunter, 2004; Pauluhn, 2010; Shvedova et al., 2008). However, both unpurified and purified (low metal content) CNTs were associated with early-onset and persistent pulmonary fibrosis and other adverse lung effects.
Some literature indicates that nanotube surface chemistry and structure may affect the toxicity of carbon nanotubes:
(1) Surface area and surface chemistry of CNTs: Tian et al. has found that the material with the smallest surface area (SWCNTs in this case) is more toxic than other tested materials (Tian, Cui, Schwarz, Estrada, & Kobayashi, 2006). Their results also give a good explanation for the effect of CNT purification: the refining process changes the aggregation state of CNTs and then modifies the surface chemistry. Instead of particle number concentration and surface

EPHB Report No.356-17a
Page iv
Table of Contents
Disclaimer ........................................................................................ iii Abstract ............................................................................................ v
Introduction ...................................................................................... 1
Background .................................................................................... 1
Potential Health Effects .................................................................... 1
Published Regulations ...................................................................... 3
Plant Description ................................................................................ 4
Manufacturing Processes .................................................................. 4
Process Description .......................................................................... 4
Control Measures............................................................................. 8
Methodology...................................................................................... 9
Ventilation Measurements................................................................. 9
Air Filter Sampling ........................................................................... 9
Aerosol Measurements ................................................................... 10
Results ........................................................................................... 12
Ventilation Measurements............................................................... 12
Air Filter Sampling ......................................................................... 12
Aerosol Measurements ................................................................... 14
Conclusions and Recommendations .................................................... 18
References ...................................................................................... 20

EPHB Report No.356-17a
Page v
Abstract The study site produces aligned carbon nanotubes in an enclosed reactor (Easy Tube 3000, First Nano, Ronkonkoma, NY). Carbon nanotubes are produced so that they are aligned in one direction on a substrate. These are termed “aligned carbon nanotubes” and they stand on end like the bristles on a brush. Aligned carbon nanotubes can have different physical properties in longitudinal as opposed to other directions (Lan, Wang, & Ren, 2011). This property is used to enhance the electrical and mechanical characteristics. Hazard control for this reactor is largely integral to the equipment’s design and is intended to contain dangerous air contaminants. Ventilation is used as a secondary, redundant control measure that removes any process leakage, thermal decomposition products from the reactor exterior, and heat from the enclosed spaces around the reactor. The vertically aligned carbon nanotubes are formed on a substrate. The carbon nanotubes can be spun into a thread that may replace copper wire. Researchers from the National Institute for Occupational Safety and Health (NIOSH) conducted a study at this site to evaluate the ability of the Easy Tube 3000 reactor to control worker exposure to carbon nanotubes and to determine whether spinning of the vertically aligned carbon nanotubes into a fiber or thread emitted carbon nanotubes into the workplace air. Air flows in the Easy Tube 3000 system were measured with a hot-wire anemometer (Velocicalc plus model 8386, TSI Inc., Shoreview MN). These direct reading instruments were used to monitor particle number and mass concentrations in the worker’s breathing zone and near active production processes: a Fast Mobility Particle Sizer spectrometer (FMPS, Model 3091, TSI Inc.), the Condensation Particle Counter (CPC, Model 3007, TSI Inc.) and an aerosol photometer (DustTrak, Model 8533, TSI, Inc.). Air samples were collected to determine the elemental carbon (EC) concentrations (NIOSH method 5040) and the number concentration of fibers (NIOSH method 7402) on the worker and near the processes we studied. The concentration measurements suggested that the operation of the equipment did not contribute to air contamination in the workplace. Individual fibers were not detected in the workplace air, and elemental carbon concentrations were less than 1 µg/m3. The number concentrations of particles smaller than 100 nm were less than 20,000 particles/cm3, which is typical of ambient air pollution (background). Total mass concentrations were less than the typical PM10 concentrations reported by the local air pollution control agency. However, there were some brief concentration spikes that exceeded 0.1 mg/m3 for periods of 3-4 seconds. Such peaks could be caused by process leakage or the re-suspension of dust in the sampling hose. These results indicate that the Easy Tube 3000 was effectively designed and built to prevent process emissions

EPHB Report No.356-17a
Page 1
Introduction
Background
The purpose of this study, funded by the NIOSH Nanotechnology Research Center (NTRC), is to investigate the effectiveness of control measures used by nanomaterial manufacturers. This site survey was collaboratively conducted by NIOSH researchers from the Engineering and Physical Hazards Branch (EPHB) within the Division of Applied Research and Technology (DART) and from the NTRC Field Studies Team within the NIOSH Education and Information Division (EID). Potential risks associated with nanoparticle exposure from toxicological research of engineered nanomaterials have been reported (Buzea, Blandino, & Robbie, 2007; European Agency for Safety and Health at Work, 2009; ISO, 2008; Safe Work Australia, 2009a). Consequently, workplace controls have been recommended to prevent or minimize exposure to engineered nanomaterials (Safe Work Australia, 2009b). At this site, NIOSH researchers focused on hazard control, specifically, the control of worker exposure to airborne carbon nanotubes (CNTs). This report addresses the findings from these measurements. Ventilation measurements, integrated filter samples, and real-time instruments were used to assess the ability of a commercially available reactor to control worker exposures to airborne nanomaterials. This reactor was designed to minimize the emissions of air contaminants into the workplace air. The study results will lead to better recommendations for nano-specific engineering controls during manufacturing and handling of nanomaterials in workplaces.
Objectives:
• Evaluate the ability of a commercially available reactor (EasyTube® 3000, First Nano, Ronkonkoma, NY) to manufacture aligned carbon nanotubes with minimal emissions of carbon nanotubes into the workplace air.
• Investigate the potential for individual nanoparticles to be released when spinning aligned nanotubes into a thread. These emissions could cause worker exposure to carbon nanotubes.
Potential Health Effects
Currently there are no studies reported in the literature of adverse health effects in workers producing or using CNTs or carbon nanofibers (CNFs). The

EPHB Report No.356-17a
Page 2
concern about worker exposure to CNTs or CNFs arises from results of animal studies. Several studies in rodents have shown: (1) an equal or greater potency of CNTs compared to other inhaled particles known to be hazardous to exposed workers (ultrafine carbon black, crystalline silica, and asbestos) in causing adverse lung effects including pulmonary inflammation and fibrosis (Shvedova et al., 2005); (2) the early onset and persistence of pulmonary fibrosis observed in CNT-exposed animals in short-term and subchronic studies (Pauluhn, 2010; Porter et al., 2010; Shvedova, et al., 2005); and (3) the reduced lung clearance in rats exposed to low mass concentrations of CNTs (Hubbs et al., 1997). Findings of acute pulmonary inflammation and interstitial fibrosis have also been observed in mice exposed to CNFs (Hubbs, et al., 1997; Kisin, Murray, & Sargent, 2010). In addition, the long and thin structure of some CNTs and CNFs dimensionally resemble asbestos fibers, and multi-walled carbon nanotubes (MWCNTs) have been observed to migrate from pulmonary alveoli to the pleura tissue which is the same site in which malignant mesothelioma can develop due to asbestos exposure (Hubbs, et al., 1997; Kisin, et al., 2010; Porter, et al., 2010). Animal studies have also shown asbestos-type pathology associated with exposure to longer, straighter CNT structures (Poland et al., 2008; Takagi et al., 2008), and in vitro cell studies have shown that single-walled carbon nanotubes (SWCNTs) can cause genotoxicity and abnormal chromosome number due to interference with mitosis (cell division)(Sargent et al., 2009). Mesothelial tumors have been reported in a susceptible strain of mice after intraperitoneal injection of longer MWCNTs (10-20 µm in length) but not by short MWCNTs (<1 µm in length) (Muller et al., 2009). Some evidence indicates that CNTs with certain metals (nickel, 26%) and with higher metal content (17.7% vs. 0.2% Fe) are more toxic and fibrogenic (Lam, James, McCluskey, & Hunter, 2004; Pauluhn, 2010; Shvedova et al., 2008). However, both unpurified and purified (low metal content) CNTs were associated with early-onset and persistent pulmonary fibrosis and other adverse lung effects.
Some literature indicates that nanotube surface chemistry and structure may affect the toxicity of carbon nanotubes:
(1) Surface area and surface chemistry of CNTs: Tian et al. has found that the material with the smallest surface area (SWCNTs in this case) is more toxic than other tested materials (Tian, Cui, Schwarz, Estrada, & Kobayashi, 2006). Their results also give a good explanation for the effect of CNT purification: the refining process changes the aggregation state of CNTs and then modifies the surface chemistry. Instead of particle number concentration and surface

EPHB Report No.356-17a
Page 3
area, specific surface area and mass explained toxicological results (Murray et al., 2012).
(2) CNT structure: Long MWCNTs exhibit asbestos-like hazards, but short
and tangled MWCNTs do not show any significant toxicity (Poland, et al., 2008). The presumption of the risk associated with long CNTs is that macrophages cannot completely engulf (or phagocytose) long fibers to clear them from tissues; however, effective phagocytosis is completed for short or tangled CNTs to clear them through the lymphatic system (Kostarelos, 2008).
Though additional research is needed to further elucidate the mechanisms of biological responses to CNTs and CNFs, these findings of adverse respiratory effects in animals indicate the need for precautionary measures to limit the risk of occupational lung diseases in workers with potential exposure to CNTs and CNFs.
CNTs and CNFs are currently used in numerous industrial and biomedical applications, including electronics, lithium-ion batteries, solar cells, super capacitors, reinforced plastics, micro-fabrication conjugated polymer activators, biosensors, enhanced electron-scanning microscopy imaging techniques, and in pharmaceutical/biomedical devices for bone grafting, tissue repair, drug delivery, and medical diagnostics. CNTs and CNFs can be encountered in facilities ranging from research laboratories and production plants to operations where CNTs and CNFs are processed, used, disposed, or recycled. The extent of worker exposure to CNTs and CNFs is poorly understood, but workplace exposure measurements of CNTs (Bello et al., 2008; Evans, Ku, Birch, & Dunn, 2010; Han, Andrews, & Gairola, 2010; Lee, Kim, Chisholm, Slaven, & Harper, 2010; M. Methner, Hodson, Dames, & Geraci, 2009; M. M. Methner et al., 2007; Tsai et al., 2009) indicate the potential for worker exposure.
Published Regulations
Currently, OSHA has not published an occupational exposure limit for CNTs. The available toxicological information regarding health effects of CNT exposure resulted in the development of a NIOSH current intelligence bulletin (CIB) specific to occupational exposure to CNTs and CNFs. The draft NIOSH CIB on CNTs contains a proposed REL of 7 µg/m3 of elemental carbon contribution from CNTs, based on the results of animal studies and the

EPHB Report No.356-17a
Page 4
lowest quantifiable concentration using the current suggested NIOSH Manual of Analytical Methods (NMAM) Method 5040 (NIOSH, 2010). This REL is only a proposed limit and has not yet been published. This REL may change prior to final publication due to advances both in health effects studies and analytical techniques. Others have recommended occupational exposure limits for carbon nanotubes:
1. Bayer has established an OEL of 0.05 mg/m3 for Baytubes® (multiwalled CNTs) (Bayer MaterialScience, 2010).
2. For Nanocyl CNTs, the no-effect concentration in air was estimated to be 2.5 μg/m³ for an 8 hr/day exposure (Nanocyl, 2009).
3. In the British Standards Institute guide (BSI, 2007), a benchmark exposure level (BEL) of 0.01 fiber per milliliter (fiber/mL) for insoluble fibrous nanomaterials (such as carbon nanotubes and nanowires) has been recommended.
Plant Description
Manufacturing Processes
The study site is a small company with fewer than 10 employees. The company produces vertically aligned carbon nanotubes for use in electronics. These vertically aligned carbon nanotubes are processed into a fiber or thread that is highly electrically conductive, and also flexible, bendable, fatigue resistant, and load bearing for multifunctional applications. This product is intended to be a replacement for copper wire.
Process Description
At this site, aligned carbon nanotubes are manufactured in an Easy Tube 3000 reactor (First Nano, Ronkonkoma, NY 11779). The aligned carbon nanotubes are spun into a thread for inclusion in other products. Other companies typically take the products manufactured by the study site and spin yarns or threads to be used as a high performance replacement for copper wire. Figure 1 illustrates the layout of the study site.
The Easy Tube 3000 System (Figure 2 and Figure 3) is a digitally controlled reactor. The only human interaction during the operation of this reactor occurs during the loading and unloading of the reactor. To load the reactor, the access door is opened, and the collection substrates are mounted on a holder which moves into the reactor. At this point, the reactor is sealed.

EPHB Report No.356-17a
Page 5
Then, gases such as argon, helium, methane, ethane, ethylene, acetylene, and hydrogen flow into the reactor and, in the presence of a special catalyst, form aligned carbon nanotubes on the substrate. Operating conditions for the reactor are digitally controlled. At the end the process, the reactor opens and the collection substrate is moved into the loading/unloading port. The substrate is then placed in a container for shipping.
Figure 1. Layout of the study site.

EPHB Report No.356-17a
Page 6
Figure 2. Diagram of the front of the Easy Tube 3000 reactor. This system is 71 inches high, 159 inches wide and had depth of 32 inches. The air exhausted from the enclosure is discharged to the outside of the building.

EPHB Report No.356-17a
Page 7
Figure 3. Photograph of the front of the Easy Tube 3000 reactor. The enclosure containing the iris valves is the loading compartment.
For testing purposes, the aligned carbon nanotubes are occasionally spun into a thread (Figure 4). To start this process, strands of carbon nanotubes are manually pulled off the substrate and wrapped around a metal bobbin. Then, a motor rotates the bobbin and pulls multiple strands of carbon nanotubes off of the collection substrate and twist these strands of carbon nanotubes into a thread.
Figure 4. Producing thread from aligned carbon nanotubes.
EPHB Report No.356-17a
Page 8
Control Measures
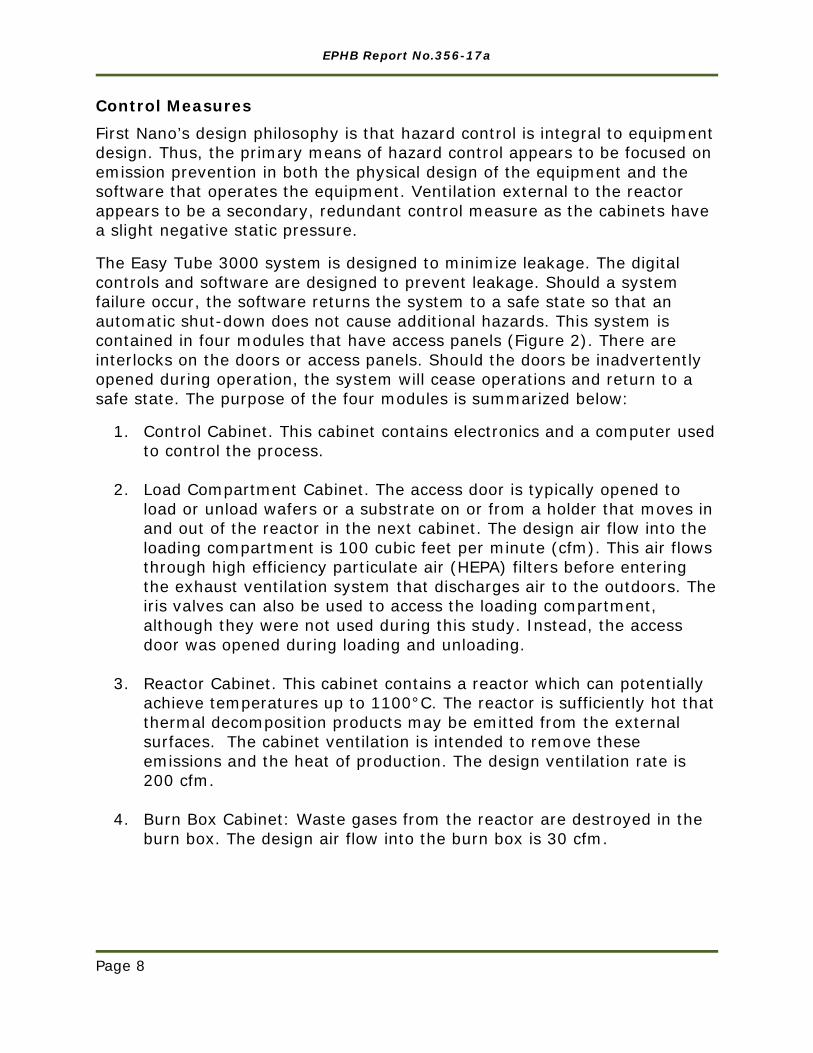
First Nano’s design philosophy is that hazard control is integral to equipment design. Thus, the primary means of hazard control appears to be focused on emission prevention in both the physical design of the equipment and the software that operates the equipment. Ventilation external to the reactor appears to be a secondary, redundant control measure as the cabinets have a slight negative static pressure.
The Easy Tube 3000 system is designed to minimize leakage. The digital controls and software are designed to prevent leakage. Should a system failure occur, the software returns the system to a safe state so that an automatic shut-down does not cause additional hazards. This system is contained in four modules that have access panels (Figure 2). There are interlocks on the doors or access panels. Should the doors be inadvertently opened during operation, the system will cease operations and return to a safe state. The purpose of the four modules is summarized below:
1. Control Cabinet. This cabinet contains electronics and a computer used to control the process.
2. Load Compartment Cabinet. The access door is typically opened to load or unload wafers or a substrate on or from a holder that moves in and out of the reactor in the next cabinet. The design air flow into the loading compartment is 100 cubic feet per minute (cfm). This air flows through high efficiency particulate air (HEPA) filters before entering the exhaust ventilation system that discharges air to the outdoors. The iris valves can also be used to access the loading compartment, although they were not used during this study. Instead, the access door was opened during loading and unloading.
3. Reactor Cabinet. This cabinet contains a reactor which can potentially achieve temperatures up to 1100°C. The reactor is sufficiently hot that thermal decomposition products may be emitted from the external surfaces. The cabinet ventilation is intended to remove these emissions and the heat of production. The design ventilation rate is 200 cfm.
4. Burn Box Cabinet: Waste gases from the reactor are destroyed in the burn box. The design air flow into the burn box is 30 cfm.

EPHB Report No.356-17a
Page 9
Methodology
Ventilation Measurements
Air velocities were measured using a hotwire anemometer (Velocicalc plus model 8386, TSI Inc, Shoreview MN). These measurements were made by placing the anemometer at the hood face, perpendicular to the air flow, and recording the velocity. Details for the air flow measurements are listed below:
1. For the reactor, the anemometer’s probe was positioned directly over the inlet slots. These slots were located above the loading module and behind the filter module.
2. For product loading and unloading module, air velocities were measured in front of the slots in the clear plastic access panel.
3. For the burn box, air velocities at the inlet port were measured.
To obtain volumetric air flow, estimated air flow is simply the product of air velocity times the slot area. Because the anemometer’s probe was larger than the slot area for air flow into the loading and reactor modules, the probe was positioned in front of the slot. Thus, these measurements may understate the air flow.
Static pressures relative to the room were measured with the Velocicalc plus which incorporates an electronic manometer. A hose from the negative static pressure port was inserted through holes or slots in the cabinets.
Air Filter Sampling Five sets of filter-based samples were deployed. Background samples were collected outside of the building (under an overhang) and inside the main office. Two additional area samples were staged in the research/production area. One set-up was an “at source” set-up and was located next to the opening of the access door. The other was located on the “spinning” table (Figure 1). In the late morning, while spinning took place, new filters were placed on the pumps to differentiate between particles migrating from the CNT synthesis process and the particles from the spinning process. One personal sample was used throughout the day by 3 employees, performing 4 different tasks, to get a representative sample of a full 8-hour shift.

EPHB Report No.356-17a
Page 10
Filter-based air samples were collected using Universal XR Model PCXR4 air sampling pumps (SKC Inc., Eighty Four, PA). The pumps operated at known flow rates ranging from 3.2 to 4.2 liters per minute (lpm). All pumps were calibrated before and after sampling. Sampling times ranged from 105 to 480 minutes (volume of air sampled ranged from 931 to 1826 liters) and were based on full-shift evaluation or on the time needed to complete the task/process being evaluated.
Air samples to determine the airborne mass concentration of elemental carbon were collected on 25-millimeter (mm) diameter, open-face Quartz fiber filters (QFF) and analyzed according to NMAM 5040 for Elemental Carbon (Diesel Particulate)(NIOSH, 1994). Seven media blanks were processed for the LOD and LOQ determination of 0.08 µg/filter and 0.25 µg/filter, respectively. All sample results for the 25-mm cassettes are based on an effective sampling area of 3.46 square centimeters.
Alongside each mass-based air sample, an additional air sample was collected on a 25-mm diameter, open-face mixed cellulose ester (MCE) filter and analyzed for CNTs using transmission electron microscopy (TEM) with energy dispersive spectroscopy (EDS) in a manner similar to NMAM 7402 (NIOSH, 1994). Three 3-mm copper TEM grids from each sample were examined at low magnification to determine loading and preparation quality. The counting is stopped when 100 structures have been counted or when 40 grid openings have been examined. TEM with EDS provides an indication of the relative abundance of nanostructures per sample, which is then converted to nanostructures per volume of air. The analysis also provides an indication of other characteristics such as size, shape, chemical composition, and degree of agglomeration.
Aerosol Measurements Direct-reading instruments used in real-time mode can help identify major emission sources to assess the efficiency of control measures in the nanomanufacturing workplace. They provide continuous measurements of concentrations that can be correlated with the specific production equipment and work processes. Because of the lack of established exposure criteria, measurements of number, size, mass, and surface area concentrations of nanomaterials are needed (Mark, 2007). The instruments listed in Table 1 were used to measure particle concentrations in this survey: the FMPS spectrometer, the CPC, and a DustTrak aerosol monitor. The clocks for each of these instruments were synchronized.

EPHB Report No.356-17a
Page 11
Table 1. Direct-reading instruments used in this study
Instrument Name
Metrics Specifications
FMPS (Model 3091, TSI Inc.)
Number 1). Determining number size distributions with an array of electrometers. 2). As particle size increases from 5.6 to 560 nm, the maximum number concentration decreases from107 to 105 particles/cm3 and the minimum detectable concentration, for a 1 second sample, decreases from about 300 to 2 particles/cm3. 3). Size range from 5.6 to 560 nm.
CPC (Model 3007, TSI Inc.)
Number 1). Condensation particle counter 2). Measure number concentration in the range 10 nm to 1000 nm. 3). Concentration range of 0 to 100,000 particles/cm3.
DustTrak (Model 8533, TSI, Inc.)
Mass 1). Single channel basic photometric instrument. 2). Size range from 0.1 µm to ~15 µm (size segregated mass fractions for PM1, PM2.5, respirable, PM10 and total) for concentration range from 0.001 to 150 mg/m3.
The instruments listed in Table 1 were mounted on a cart. These measurements are termed ‘process measurements’. Approximately 3-foot lengths of conductive plastic hoses were positioned as described below:
1. During loading and/or unloading from the reactor, the hose was positioned near the workers face.
2. During reactor operation, the instruments were set in front of the Easy Tube 3000 reactor.
3. During spinning operations in an adjacent room, the hose was held in the workers breathing zone.
During tasks one and three, the worker activities were video-taped and the aerosol measurements were taken. The clocks on the camera and

EPHB Report No.356-17a
Page 12
instruments were synchronized to within 1-2 seconds. The videotapes and measurements were reviewed to identify the tasks that occurred during exposure peaks.
Results
Ventilation Measurements
The measured and design airflows into the cabinets are summarized in
Table 2. There is an obvious difference between the measured and design air flow rates. As mentioned in the Methods section, the anemometer probe needed to be positioned in front of the small slots and this probably causes an under measurement of the air flow. In addition, the measured air flow rates do not include the air that flows between the access panels and the cabinet’s frame. Gaskets are not used to seal this gap and air will flow through these gaps. Assuming the pressure loss through the gaps in the enclosure function as ventilation slots, the pressure loss should be 2.78 velocity pressures (ACGIH, 2010). This suggests that the air velocities through gaps in the enclosure or cabinet are 420 fpm. Thus, the observed are flows in
Table 2 are likely to be low as they do not consider the airflow into the gaps. An air velocity into the gaps of 420 fpm should prevent air contaminants from leaking out of the enclosure.
Table 2. Exhaust ventilation rates for the Easy Tube 3000 reactor.
Location Design specifications (cfm)
Observed air flow (cfm)
Observed static pressure in enclosure (inch-water)
Load compartment 100 84 -0.03
Reactor compartment 200 143 -0.03
Burn box cabinet 30 24 -0.03
Air Filter Sampling A total of 12 filter-based air samples (6 for EC; 6 for TEM analysis) were collected during several tasks (Table 3). Fibers were not detected on the

EPHB Report No.356-17a
Page 13
samples collected for TEM analysis. As documented in Table 3, all of the filter-based air samples analyzed for EC yielded results above the analytical limit of detection (LOD) of 0.08 µg/sample and the limit of quantification (LOQ) of 0.25 µg/sample. The two field blanks yielded a non-detectable measurement. All of the measured concentrations were below the NIOSH proposed REL of 7 µg/m3. The results ranged from 0.27 to 0.83 µg/m3. The highest measurement (0.83 µg/m3) was the outdoor background, collected adjacent to the building in a parking lot. Outdoor EC values are usually correlated with the average daily traffic volume. The second highest result (0.47 µg/m3) was a personal breathing zone sample, worn by three different operators throughout the day for a total of 398 minutes (excluding lunch break). The “at source” sample collected during the spinning task yielded 0.32 µg/m3 after 226 minutes of sampling. The background air samples collected in the office (0.2 µg/m3) and in the production area (0.27 µg/m3), and the “at source” sample collected on top of the furnace reactor chamber (0.29 µg/m3) had nearly equal concentrations. Furthermore, ambient concentrations of EC are typically in the 1−3 µg/m3 range (Birch, 2003). Therefore, we can probably assume that the EC concentration does not represent CNTs. Based on the EC concentrations and TEM data, there is no supportable evidence of a release of CNT by either the reactor or the spinning operation.
Table 3. Concentrations of Elemental Carbon (EC)
Sample Description Air Volume Sampled (L)
EC Air Concentration (µg/m3)
EC % of Total Carbon
Production Source (on top of Furnace) 1821 0.29 3%
Indoor Background (By Spinning) 1064 0.27 2%
Indoor Background (Office) 1826 0.29 3%
Outdoor Background 1682 0.83 13% PBZ (worn during all tasks) 1669 0.47 3%
At Source Sample (Spinning) 931 0.32 2%

EPHB Report No.356-17a
Page 14
Aerosol Measurements
The real-time results are presented in Figures 5-8. The tasks during specific times are listed in Table 4. Particle number concentrations measured by the FMPS and the CPC are presented in Figure 5 and Figure 6. There are some notable concentration spikes in these graphs. However, the number concentrations are below those reported for the ambient environment. Ambient 24-hour particle number concentrations reportedly average between 5,000 and 24,000 particles/cm3 in the 10-500 nm range (Stanier, Khlystov, & Pandis, 2004). Thus, the particle number concentrations could be explained by ambient air pollution. Table 4. Labels describing activities during selected time periods
Task Time period Description 1 7:33 to 8:15 background 2 8:15 to 8:21 substrate preparation room 3 8:21 to 8:40 around machine 4 8:40 to 9:15 spinning area 5 8:15 to 11:28 front of machine and machine running. 6 11:28 to 11:46 unload load/ reactor 7 11:46 to 11:56 move 8 11:56 to12:25 spinning area
9 12:26 to 14:33 In front of reactor during routine operation.
10 14:33 to 14:38 unload reactor
Mass concentrations are presented in Figure 7 and Figure 8. Overall, the average mass concentration in Figure 7 averaged 0.005 mg/m3 for the process and 0.004 mg/m3 for the background. The local air pollution control agency, the Hamilton County Department of Environmental Services, reported that ambient PM10 concentrations ranged between 0.006 and 0.060 mg/m3 (Hamilton County Department of Environmental Services, 2011). Most measurements in Figure 7 are below ambient PM10 concentrations. However, there are concentration spikes in Figure 7 that clearly exceed ambient air pollution. This could be due to intermittent emissions from the process equipment or from dust re-suspended from the conductive tubing. The worker was videotaped during the events described by tasks 6, 8, and 10. For the time period described by tasks 6 and 8, noticeable concentration spikes did occur. As exemplified by Figure 8, these concentration spikes typically last 2−4 seconds. The concentration spike shown in Figure 8 occurred during the unloading of the CNTs during the

EPHB Report No.356-17a
Page 15
event described by task 10 in Table 4 and in Figure 7. The worker was standing in front of the open access door for loading the reactor. The sampling hose positioned between the worker and the side wall, just inside the open loading access door (Figure 2). This concentration spike could be related to the process, or it could have been caused by the motion of the hose hitting the sidewall of the cabinet.
Figure 5. Number concentration measured with the FMPS near the process being studied.

EPHB Report No.356-17a
Page 16
Figure 6. Particle number concentrations measured with the CPC.

EPHB Report No.356-17a
Page 17
Figure 7. Total mass concentration measured with the DustTrak.

EPHB Report No.356-17a
Page 18
Figure 8. Mass concentration spike during task 10 in Table 4. This data was obtained from the DustTrak’s concentration spike occurred while the holder for the collection substrate was moving out of the reaction chamber. The width of this concentration spike is 3-4 seconds. Note, the concentration measurement are discrete measurements which are recorded every second with an instrument time constant of 1 second.
Conclusions and Recommendations The available real-time and filter-based concentration measurements indicated leakage from the Easy Tube 3000 reactor was not detected. This demonstrates that the design philosophy of the reactor is very useful for preventing and controlling worker exposure to CNTs. The spinning of CNTs was done without any attempt to control worker exposure to CNTs. The small scale spinning process did not generate measurable quantities of airborne CNTs. However, as production rates, scale, and speeds increase, exposures to carbon nanotubes during spinning operations may increase. Good occupational safety and health practice dictates that exposure measurements and assessment be conducted when process changes occur (American National Standards Institute, 2005).

EPHB Report No.356-17a
Page 19
As shown in Figure 4, the spinning operation is partially enclosed with plexiglass. Potential emissions could be collected by performing the task in a ventilated booth that delivers air contaminants through HEPA filters and exhaust the air outside the building. However, the design details would need to be developed.
The available measurements do not indicate the need for respiratory protection. During the site visit, some employees opted to wear surgical masks during certain tasks, which should not be used as respiratory protection. We suggest a voluntary use program be implemented at the study site, and that employees may choose to wear filtering face piece respirators (P-95 or equivalent) provided by themselves or the employer. In the workplace, the OSHA respiratory protection standard (29CFR1910.134) is applicable, and this standard addresses the voluntary use of respirators specifically in 29CFR1910.134 (c)(2)(i and ii).

EPHB Report No.356-17a
Page 20
References
ACGIH. (2010). Industrial ventilation: a manual of recommended practice for design (27 ed.). Cincinnati, Ohio: American Conference of Governmental Industrial Hygienists
American National Standards Institute. (2005). American national standard for occupational safety and health management systems-ANSI/AIHA Z10-2005: American Industrial Hygiene Association, Fairfax Va.
Bayer MaterialScience. (2010). Occupational exposure limit (OEL) for Baytubes defined by Bayer MaterialScience. Leverkusen, Germany: Bayer MaterialScience.
Bello, D., Hart, A. J., Ahn, K., Hallock, M., Yamamoto, N., Garcia, E. J., . . . Wardle, B. L. (2008). Particle exposure levels during CVD growth and subsequent handling of vertically-aligned carbon nanotube films. Carbon, 46(6), 974-977.
Birch, M. E. (2003). Monitoring of Diesel Particulate Exposure in the Workplace, In:NIOSH Manual of Analytical Methods (NMAM), 4TH Edition - 3rd Supplement. (94-113). Cincinnati Ohio: Retrieved from http://www.cdc.gov/niosh/docs/2003-154/pdfs/chapter-q.pdf
BSI. (2007). Nanotechnologies - Part 2: Guide to safe handling and disposal of manufactured nanomaterials. PD 6699-2:2007: British Standards Institution.
Buzea, C., Blandino, I. I. P., & Robbie, K. (2007). Nanomaterials and nanoparticles: Sources and toxicity. Biointerphases, 2(4), MR17-MR172. doi: Doi 10.1116/1.2815690
European Agency for Safety and Health at Work. (2009). Literature review: workplace exposure to nanoparticles. 89 pages.
Evans, D. E., Ku, B. K., Birch, M. E., & Dunn, K. H. (2010). Aerosol monitoring during carbon nanofiber production: mobile direct-reading sampling. Annals of Occupational Hygiene, 54(5), 514-531.
Hamilton County Department of Environmental Services. (2011). 2010 AIR QUALITY DATA REPORT. 250 William Howard Taft Road, Cincinnati, Ohio 45219.
Han, S. G., Andrews, R., & Gairola, C. G. (2010). Acute pulmonary response of mice to multi-wall carbon nanotubes. Inhalation toxicology, 22(4), 340-347.
Hubbs, A., Castranova, V., Ma, J., Frazer, D., Siegel, P., Ducatman, B., . . . Van Dyke, C. (1997). Acute lung injury induced by a commercial leather conditioner. Toxicology and Applied Pharmacology, 143(1), 37-46.
ISO. (2008). Nanotechnologies -- Health and safety practices in occupational settings relevant to nanotechnologies. ISO/TR 12885:2008: International Organization for Standardization.
Kisin, E., Murray, A., & Sargent, L. (2010). Pulmonary response, oxidative stress and genotoxicity induced by carbon nanofibers. Toxicologist, 114(1), 169.
Kostarelos, K. (2008). The long and short of carbon nanotube toxicity. Nature Biotech, 26(7), 774-776.

EPHB Report No.356-17a
Page 21
Lam, C. W., James, J. T., McCluskey, R., & Hunter, R. L. (2004). Pulmonary toxicity of single-wall carbon nanotubes in mice 7 and 90 days after intratracheal instillation. Toxicological Sciences, 77(1), 126-134.
Lan, Y., Wang, Y., & Ren, Z. (2011). Physics and applications of aligned carbon nanotubes. Advances in Physics, 60(4), 553-678.
Lee, T., Kim, S. W., Chisholm, W. P., Slaven, J., & Harper, M. (2010). Performance of high flow rate samplers for respirable particle collection. Annals of Occupational Hygiene, 54(6), 697-709.
Mark, D. (2007). Occupational exposure to nanoparticles and nanotubes. In R. E. Hester & R. M. Harrison (Eds.), Nanotechnology: consequences for human health and the environment (pp. 50-80): RSC Publishing.
Methner, M., Hodson, L., Dames, A., & Geraci, C. (2009). Nanoparticle emission assessment technique (NEAT) for the identification and measurement of potential inhalation exposure to engineered nanomaterials—Part B: Results from 12 field studies. Journal of occupational and environmental hygiene, 7(3), 163-176.
Methner, M. M., Birch, M. E., Evans, D. E., Ku, B. K., Crouch, K., & Hoover, M. D. (2007). Identification and characterization of potential sources of worker exposure to carbon nanofibers during polymer composite laboratory operations. Journal of occupational and environmental hygiene, 4(12), 125-130.
Muller, J., Delos, M., Panin, N., Rabolli, V., Huaux, F., & Lison, D. (2009). Absence of carcinogenic response to multiwall carbon nanotubes in a 2-year bioassay in the peritoneal cavity of the rat. Toxicological Sciences, 110(2), 442-448.
Murray, A. R., Kisin, E. R., Tkach, A. V., Yanamala, N., Mercer, R. R., Young, S. H., . . . Shvedova, A. A. (2012). Factoring-in agglomeration of carbon nanotubes and nanofibers for better prediction of their toxicity versus asbestos. Particle and Fibre Toxicology, 9(1), 10.
Nanocyl. (2009). Resonsible care and nanomaterials case study Paper presented at the European Responsible Care Conference, Prague. www.cefic.be/Files/Downloads/04_Nanocyl.pdf
NIOSH. (1994). ASBESTOS by TEM Method 7402. Cincinnati Ohio: Retrieved from http://www.cdc.gov/niosh/docs/2003-154/pdfs/7402.pdf.
NIOSH. (2010). NIOSH Current Intelligence Bulletin: Occupational Exposure to Carbon Nanotubes and Nanofibers (DHHS (NIOSH) Publication No. 2010-XXX (draft)). Retrieved from http://www.cdc.gov/niosh/docket/review/docket161A/.
Pauluhn, J. (2010). Subchronic 13-week inhalation exposure of rats to multiwalled carbon nanotubes: toxic effects are determined by density of agglomerate structures, not fibrillar structures. Toxicological Sciences, 113(1), 226-242.
Poland, C. A., Duffin, R., Kinloch, I., Maynard, A., Wallace, W. A. H., Seaton, A., . . . Donaldson, K. (2008). Carbon nanotubes introduced into the abdominal cavity of mice show asbestos-like pathogenicity in a pilot study. Nature Nanotechnology, 3(7), 423-428. doi: DOI 10.1038/nnano.2008.111
Porter, D. W., Hubbs, A. F., Mercer, R. R., Wu, N., Wolfarth, M. G., Sriram, K., . . . Friend, S. (2010). Mouse pulmonary dose-and time course-responses

EPHB Report No.356-17a
Page 22
induced by exposure to multi-walled carbon nanotubes. Toxicology, 269(2-3), 136-147.
Safe Work Australia. (2009a). Engineered nanomaterials: a review of the toxicology and health hazards. 163 pages.
Safe Work Australia. (2009b). Engineered Nanomaterials: Evidence on the Effectiveness of Workplace Controls to Prevent Exposure. 75 pages.
Sargent, L., Shvedova, A., Hubbs, A., Salisbury, J., Benkovic, S., Kashon, M., . . . Friend, S. (2009). Induction of aneuploidy by single‐walled carbon nanotubes. Environmental and molecular mutagenesis, 50(8), 708-717.
Shvedova, A. A., Kisin, E., Murray, A. R., Johnson, V. J., Gorelik, O., Arepalli, S., . . . Sussman, N. (2008). Inhalation vs. aspiration of single-walled carbon nanotubes in C57BL/6 mice: inflammation, fibrosis, oxidative stress, and mutagenesis. American Journal of Physiology-Lung Cellular and Molecular Physiology, 295(4), L552-L565.
Shvedova, A. A., Kisin, E. R., Mercer, R., Murray, A. R., Johnson, V. J., Potapovich, A. I., . . . Schwegler-Berry, D. (2005). Unusual inflammatory and fibrogenic pulmonary responses to single-walled carbon nanotubes in mice. American Journal of Physiology-Lung Cellular and Molecular Physiology, 289(5), L698-L708.
Stanier, C. O., Khlystov, A. Y., & Pandis, S. N. (2004). Ambient aerosol size distributions and number concentrations measured during the Pittsburgh Air Quality Study (PAQS). Atmospheric Environment, 38(20), 3275-3284.
Takagi, A., Hirose, A., Nishimura, T., Fukumori, N., Ogata, A., Ohashi, N., . . . Kanno, J. (2008). Induction of mesothelioma in p53+/-mouse by intraperitoneal application of multi-wall carbon nanotube. Journal of Toxicological Sciences, 33(1), 105-116.
Tian, F. R., Cui, D. X., Schwarz, H., Estrada, G. G., & Kobayashi, H. (2006). Cytotoxicity of single-wall carbon nanotubes on human fibroblasts. Toxicology in Vitro, 20(7), 1202-1212. doi: DOI 10.1016/j.tiv.2006.03.008
Tsai, S. J., Hofmann, M., Hallock, M., Ada, E., Kong, J., & Ellenbecker, M. (2009). Characterization and evaluation of nanoparticle release during the synthesis of single-walled and multiwalled carbon nanotubes by chemical vapor deposition. Environmental Science & Technology, 43(15), 6017-6023.

Delivering on the Nation’s promise: Safety and health at work for all people through research and prevention.
To receive NIOSH documents or other information about occupational safety and health topics, contact NIOSH at
1-800-CDC-INFO (1-800-232-4636)
TTY: 1-888-232-6348
E-mail: [email protected]
or visit the NIOSH Web site at www.cdc.gov/niosh
For a monthly update on news at NIOSH, subscribe to NIOSH eNews by visiting www.cdc.gov/niosh/eNews
SAFER ● HEALTHIER ● PEOPLE