in-depth survey report · in-depth survey report . field evaluation of a niosh mini-baghouse...
TRANSCRIPT
In-Depth Survey Report
Field Evaluation of a NIOSH Mini-Baghouse Assembly for Control of Silica Dust on Sand Movers
Barbara M. Alexander, Eric J. Esswein, Michael G. Gressel, Jerry L. Kratzer, H. Amy Feng, Bradley King, Arthur L. Miller, and Emanuele Cauda
Division of Applied Research and Technology Engineering and Physical Hazards Branch EPHB Report No. 373-11a Southwestern Energy (SWN) North Little Rock, Arkansas
February 2015
DEPARTMENT OF HEALTH AND HUMAN SERVICES Centers for Disease Control and Prevention National Institute for Occupational Safety and Health

EPHB Report No. 373-11a
Site Surveyed: SWN Sand Company
NAICS Code: 211111
Survey Dates: November 18 – 21, 2013
Surveys Conducted By: Eric Esswein, Bradley King, Michael Gressel, Jerry Kratzer, Arthur Miller, Emanuele Cauda
Employer Representatives Contacted: Allen Green, Ted Hunter, Tom Huetter and Jim Bolander
Contractor Representatives: N/A
Page ii

EPHB Report No. 373-11a
Disclaimer Mention of any company or product does not constitute endorsement by NIOSH. In addition, citations to websites external to NIOSH do not constitute NIOSH endorsement of the sponsoring organizations or their programs or products. Furthermore, NIOSH is not responsible for the content of these websites. All Web addresses referenced in this document were accessible as of the publication date.
Page iii
EPHB Report No. 373-11a
Table of Contents
Disclaimer ........................................................................................ iii Abstract ............................................................................................ v
Introduction ...................................................................................... 1
Background for Control Technology Studies ........................................ 1
Background for this Study ................................................................ 1
Risks for Chemical Exposures in Unconventional Oil and Gas Extraction ........ 1
Silica-Related Disease ............................................................................ 2
Plant and Process Description .............................................................. 3
Hydraulic Fracturing ......................................................................... 3
Occupational Exposure Limits and Health Effects ................................. 4
Methodology...................................................................................... 6
Control Technology ............................................................................ 7
Results and Data Analysis ................................................................... 8
Discussion ......................................................................................... 9
Performance of the Mini-Baghouse ..................................................... 9
Freshly Fractured Silica .................................................................. 11
Limitations of the Study ................................................................. 11
Conclusions and Recommendations .................................................... 12
Acknowledgements .......................................................................... 13
References ...................................................................................... 14
Appendices ..................................................................................... 18
Tables .......................................................................................... 18
Figures ......................................................................................... 21
Complete Dataset ............................................................................ 34
Page iv

EPHB Report No. 373-11a
Abstract Exposure risks to worker health at unconventional oil and gas extraction sites can include chemicals and inhalation of respirable crystalline silica. National Institute for Occupational Safety and Health (NIOSH) researchers have identified concentrations of respirable crystalline silica at hydraulic fracturing sites that can be over 10 times higher than the Occupational Safety and Health Administration (OSHA) Permissible Exposure Limit (PEL). NIOSH research has identified at least 7 point sources where silica dust can be generated.
Engineering controls have been proposed by NIOSH to limit dust generation at some of the known locations of most concern. One of these controls is a NIOSH-developed mini-baghouse assembly, to be mounted on the thief hatches on top of the sand mover, one of the largest sources of dust generation. This report details the results of a trial of the NIOSH mini-baghouse that occurred at Southwestern Energy (SWN) Sand Company in North Little Rock, Arkansas, November 18 – 21, 2013.
A bulk sample of the dust collected by the baghouse assembly showed the likely presence of freshly fractured quartz, a particularly hazardous form of respirable crystalline silica. Air samples collected at locations on and around the sand mover with and without the mini-baghouse in place were analyzed for respirable dust and respirable crystalline silica. Results indicate that the mini-baghouse effectively reduced both respirable dust and respirable crystalline silica downwind of the thief hatches. Reduction of airborne respirable dust ranged from 85% to 98%, and reductions in airborne respirable crystalline silica ranged from 79% to 99%.
Design changes are proposed to increase the durability and performance of the mini-baghouse, including an improved bag clamp mechanism and improved filter fabric with a modified air-to-cloth ratio. Future trials are planned to determine additional dust concentration reductions achieved through these design changes.
Page v
EPHB Report No. 373-11a
Introduction
Background for Control Technology Studies The National Institute for Occupational Safety and Health (NIOSH) is the primary Federal agency engaged in occupational safety and health research. Located in the Department of Health and Human Services, it was established by the Occupational Safety and Health Act of 1970. This legislation mandated NIOSH to conduct a number of research and education programs separate from the standard setting and enforcement functions carried out by the Occupational Safety and Health Administration (OSHA) in the Department of Labor. An important area of NIOSH research deals with methods for controlling occupational exposure to potential chemical and physical hazards. The Engineering and Physical Hazards Branch (EPHB) of the Division of Applied Research and Technology has been given the lead within NIOSH to study the engineering aspects of health hazard prevention and control.
Since 1976, EPHB has conducted a number of assessments of health hazard control technology on the basis of industry, common industrial process, or specific control techniques. Examples of these completed studies include the foundry industry; various chemical manufacturing or processing operations; spray painting; and the recirculation of exhaust air. The objective of each of these studies has been to document and evaluate effective control techniques for potential health hazards in the industry or process of interest, and to create a more general awareness of the need for or availability of an effective system of hazard control measures.
These studies involve a number of steps or phases. Initially, surveys are conducted to determine exposure to workers. The reports from these surveys are then used as a basis for choosing effective hazard control measures. The hazard control measures are tested to determine their effectiveness. Ultimately, the information from these research activities builds the data base of publicly available information on hazard control techniques for use by health professionals who are responsible for preventing occupational illness and injury.
Background for this Study
Risks for Chemical Exposures in Unconventional Oil and Gas Extraction Although occupational exposure to respirable crystalline silica is a well-established hazard in mining, sandblasting, foundry work, and construction, it has not been well-recognized as a hazard associated with oil and gas extraction. [Amandus & Costello, 1991; Amandus, Shy, Castellan, Blair, & Heineman, 1995; Chen et al., 2005; Chen et al., 2012; Cox-Ganser, Burchfiel, Fekedulegn, Andrew, & Ducatman, 2009; Echt, Sieber, Jones, & Jones, 2002; Echt & Sieber, 2002; Froines, Wegman, & Dellenbaugh, 1986; Goldstein et al., 2014; Hnizdo, Murray, & Klempman, 1997; Landrigan, Cherniack, Lewis, Catlett, & Hornung, 1986; Laney, Petsonk, & Attfield, 2010; Morfeld et al., 2014; NIOSH, 1992; Park et al., 2002; Perez-Alonso et al., 2014; Rosenman et al., 1996; Steenland et al., 2001] Hydraulic fracturing involves
Page 1

EPHB Report No. 373-11a
high pressure injection of large volumes of water (about 95%) and silica sand or “proppant” (about 4 – 5%) and a much smaller quantity (typically around 1%) of treatment chemicals to enhance existing fissures and create new cracks in tight oil and gas formations. After release of hydraulic pressure, the proppant holds the cracks open, so that gas or oil can flow freely from the formation. In addition to silica sand, resin-coated sand or ceramic proppant may also be used, depending on the formation.
The American Petroleum Institute (API) has a standard for sand used as proppant. Proppant sand must be 99+% silica, within a certain range of mesh sizes, smooth-edged and highly spherical. It must also pass tests of crush resistance, low acid solubility and low turbidity. [API, 2008] Although hydraulic fracturing has been in use since the 1940s, its use for recovering oil and gas from tight formations has skyrocketed in the last 10 years due to the use of directional and horizontal drilling techniques coupled with high volume, high pressure hydraulic fracturing. U.S. production of dry natural gas alone increased by 27% from 2002 to 2012. [USEIA, 2014]
As part of a NIOSH research program to evaluate risks for chemical exposures to land-based oil and gas workers [NIOSH, 2010a], NIOSH researchers were the first to systematically evaluate risks for occupational exposures on hydraulic fracturing sites across the U.S.. Identified exposure risks include respirable crystalline silica in hydraulic fracturing and volatile organic compounds (VOCs) in flowback operations. [Esswein, Breitenstein, Snawder, Kiefer, & Sieber, 2013; Esswein et al., 2014] (See Figure 1.)
Silica-Related Disease Silica (SiO2) is found in a variety of crystalline and non-crystalline forms. The most common forms of crystalline silica are quartz, cristobalite and tridymite, with quartz being far and away the most common. [NTP, 2011] Inhalation of respirable crystalline silica is most closely identified with the disease silicosis, a scarring of the lungs that causes difficulty in breathing. Acute silicosis can develop in weeks to months following exposure to very high concentrations (tens of milligrams per cubic meter) of respirable crystalline silica. Long-term exposure to much lower concentrations of respirable crystalline silica can lead to accelerated or chronic silicosis years to decades later. Silicosis is also a risk factor for developing tuberculosis, kidney and skin disease. Workers exposed to respirable crystalline silica also have higher rates of other respiratory diseases, such as chronic bronchitis and emphysema. [NIOSH, 2002]
Inhalation of quartz and cristobalite, two of the most common crystalline forms, can lead to cancer. [NTP, 2011] In a study of diatomaceous earth workers published in 2001, the risk of mortality from lung cancer increased with increasing exposure to respirable crystalline silica dust (cristobalite). [Rice et al., 2001] In a study of Vermont granite workers, increasing crystalline silica dust exposure was associated with lung cancer. [Attfield & Costello, 2004] A study of industrial sand workers in North America showed increasing risk of silicosis and lung cancer with increasing
Page 2
EPHB Report No. 373-11a
exposure to respirable silica. [McDonald, McDonald, Hughes, Rando, & Weill, 2005] In Chinese workers at metal mines and pottery factories, long-term exposure to silica dust increased the mortality rate due to respiratory diseases, lung cancer and cardiovascular disease. [Chen et al., 2012]
The International Agency for Research on Cancer (IARC) classifies crystalline silica dust, in the form of quartz or cristobalite, as carcinogenic to humans, based on studies such as the ones mentioned above, as well as animal experiments. [IARC, 2012] The U.S. National Toxicology Program (NTP) also classifies respirable crystalline silica as a known human carcinogen. [NTP, 2011]
Plant and Process Description
Hydraulic Fracturing Unconventional oil and gas wells are hydraulically fractured in multiple stages. Each stage requires the use of hundreds of thousands of pounds of proppant. Proppant (typically silica sand) is typically delivered on site in dry bulk by tractor-trailers. A fan-compressor pneumatically transfers proppant from the delivery trailer to multi-bin storage and handling units called sand movers.
Two inspection hatches (or “thief hatches”) are typically located along the top of each bin on a sand mover. These hatches are either left open or unlatched when proppant is being transferred into the bins, to allow for release of pneumatic pressure from the bin. Underneath the bins, the sand mover has a conveyor belt onto which sand is discharged and conveyed ultimately into a blender truck. In the blender, proppant is mixed with water and other additives before high pressure pumping and injection into the hydrocarbon formation. Often, multiple sand movers are in use; and the sand movers deposit sand onto a separate transfer belt for delivery to the blender. Sand mover operators work from one of two stations: on the top rear of the sand mover, above the location where sand emerges from under the sand mover on the conveyor belt; or at the lower front of the sand mover. [Esswein et al., 2013]
NIOSH researchers collected personal breathing zone air samples for workers at 11 hydraulic fracturing sites in 2010 and 2011. Job classification was found to associate with exposures to silica. Sand Mover and Transfer Belt Operators had the highest risks for exposures to respirable crystalline silica, due to their proximity to point sources of sand dust generation. Figure 2 shows a Sand Mover Operator at his work station. Exposures to Sand Mover Operators were sometimes more than ten times higher than occupational exposure limits, exceeding the assigned protection factor (APF) of 10 for half-face elastomeric or filtering-facepiece respirators. At one hydraulic fracturing site, a portion of the silica sand was replaced with ceramic proppant, and risks for exposures to respirable crystalline silica were notably lower.
Page 3

EPHB Report No. 373-11a
Pneumatic transfer of sand enhances generation of silica dust aerosols. NIOSH researchers identified at least seven primary point sources of dust generation/release. [OSHA, 2012] They are:
• Thief hatches on top of the sand movers during filling
• Uncapped side fill ports on sand movers during filling
• Vehicular traffic on the site
• Transfer belt under the sand movers
• Sand being dropped or mixed in the belt or blender area
• Transfer belts between the sand movers and the blender
• The end of the sand mover conveyor belt
Several engineering controls were proposed to limit the generation of silica-containing dusts. These included a mini-baghouse assembly on the sand mover hatches, skirting and shrouding at the base of the sand mover and near the conveyor belt, and capping unused fill ports. [Esswein et al., 2013] NIOSH evaluated one of these controls, the mini-baghouse retrofit assembly, at an SWN sand mine in North Little Rock, Arkansas on November 18 – 21, 2013. This report presents the results of that evaluation. Other technologies are needed to control silica aerosol emissions from other sources.
Occupational Exposure Limits and Health Effects As a guide to the evaluation of the hazards posed by workplace exposures, NIOSH investigators use mandatory and recommended occupational exposure limits (OELs) when evaluating chemical, physical, and biological agents in the workplace. Generally, OELs suggest levels of exposure to which most workers may be exposed up to 10 hours per day, 40 hours per week for a working lifetime without experiencing adverse health effects. It is, however, important to note that not all workers will be protected from adverse health effects even though their exposures are maintained below these levels. A small percentage may experience adverse health effects because of individual susceptibility, a pre-existing medical condition, and/or hypersensitivity (allergy).
In addition, some hazardous substances may act in combination with other workplace exposures, the general environment, or with medications or personal habits of the worker to produce health effects even if the occupational exposures are controlled at the level set by the exposure limit. Combined effects are often not considered in the OEL. Also, some substances are absorbed by direct contact with the skin and mucous membranes, and thus can increase the overall exposure. Finally, OELs may change over the years as new information on the toxic effects of an agent become available. [Plog, 2012]
Page 4
EPHB Report No. 373-11a
Most OELs are expressed as a time-weighted average (TWA) exposure. A TWA exposure refers to the average airborne concentration of a substance during a normal 8- to 10-hour workday. Some substances have recommended short-term exposure limits (STELs) or ceiling values (C) which are intended to supplement the TWA where there are recognized toxic effects from higher exposures over the short-term. [Plog, 2012]
In the U.S., OELs are established by Federal agencies, professional organizations, state and local governments, and other entities. NIOSH Recommended Exposure Limits (RELs) are based on a critical review of the scientific and technical information available on the prevalence of health effects, the existence of safety and health risks, and the adequacy of methods to identify and control hazards [NIOSH, 2010b]. They are developed using a weight of evidence approach and formal peer review process. The U.S. Department of Labor OSHA Permissible Exposure Limits (PELs) [OSHA, 2006] are OELs that are legally enforceable in covered workplaces under the Occupational Safety and Health Act. Other OELs that are commonly used and cited in the U.S. include the Threshold Limit Values (TLVs®) recommended by the American Conference of Governmental Industrial Hygienists (ACGIH®), a professional organization [ACGIH, 2014]. ACGIH TLVs are considered voluntary guidelines for use by industrial hygienists and others trained in this discipline “to assist in the control of health hazards.” Workplace Environmental Exposure Levels (WEELs®) are recommended OELs that were historically developed by the American Industrial Hygiene Association (AIHA), another professional organization. In 2013, WEEL development was transferred to the Occupational Alliance for Risk Science (OARS). WEELs have been established for some chemicals “when no other legal or authoritative limits exist.” [AIHA, 2014].
OSHA requires an employer to furnish employees a place of employment that is free from recognized hazards that are causing or are likely to cause death or serious physical harm [OSHA, 2004]. Thus, employers are required to comply with OSHA PELs. Some hazardous agents do not have PELs, however, and for others, the PELs do not reflect the most current health-based information. Thus, NIOSH investigators encourage employers to consider the other OELs in making risk assessment and risk management decisions to best protect the health of their employees. NIOSH investigators also encourage the use of the traditional hierarchy of controls approach to eliminating or minimizing identified workplace hazards. This includes, in preferential order, the use of: (1) substitution or elimination of the hazardous agent, (2) engineering controls (e.g., local exhaust ventilation, process enclosure, dilution ventilation) (3) administrative controls (e.g., limiting time of exposure, employee training, work practice changes, medical surveillance), and (4) personal protective equipment (e.g., respiratory protection, gloves, eye protection, hearing protection). [NIOSH, 2010c]
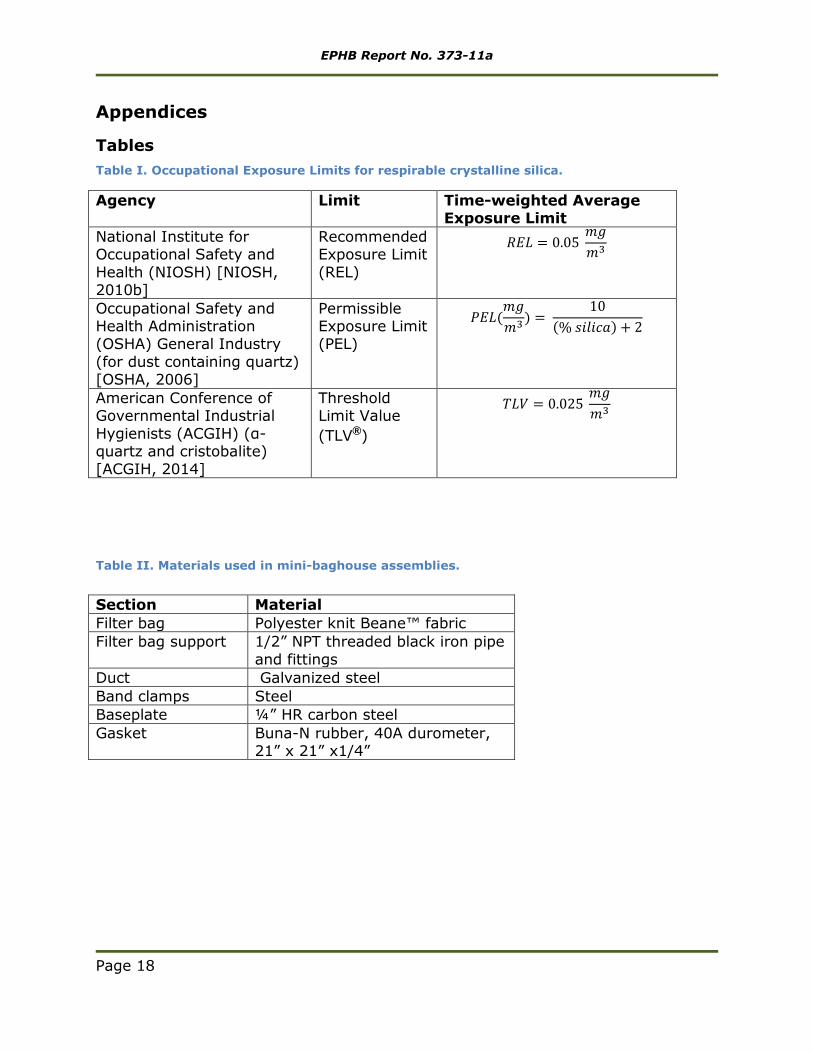
Respirable crystalline silica consists of particles small enough to be inhaled deep into the lungs. The particles are essentially all smaller than 10 micrometers (µm) in aerodynamic diameter. [OSHA, 2012] Occupational exposure limits for respirable crystalline silica vary. The major U.S. exposure limits are summarized in Table I.
Page 5

EPHB Report No. 373-11a
The OSHA PEL for dust containing quartz is expressed as an equation:
𝑃𝑃𝑃𝑃𝑃𝑃(𝑚𝑚𝑚𝑚𝑚𝑚3) =
10(% 𝑠𝑠𝑠𝑠𝑠𝑠𝑠𝑠𝑠𝑠𝑠𝑠) + 2
For pure respirable quartz, the OSHA PEL is approximately 0.1 mg/m3. Where workers are exposed to respirable crystalline silica at or above the REL (0.05 mg/m3), NIOSH recommends minimizing risks by substituting less hazardous materials and using engineering controls to limit exposures. If substitution and engineering controls cannot limit exposures to a level less than the REL, respiratory protection should be used in accordance with a written respiratory protection program, including medical clearance and fit testing. [NIOSH, 2002]
Methodology Researchers from NIOSH evaluated a NIOSH-developed and fabricated mini-baghouse retrofit assembly for control of silica dust generation from sand moving machinery on November 18 – 21, 2013 at an SWN sand mine in North Little Rock, Arkansas. Eight NIOSH mini-baghouse retrofit assemblies were fabricated in-house by NIOSH and installed on each of eight thief hatches atop an NOV-APPCO FS-30 “Frac Sander” (i.e., sand mover). Figure 3 shows a photo of the FS-30 sand mover with the mini-baghouse assemblies installed.
The study design involved collection of area air samples for respirable particulates and respirable crystalline silica, with the mini baghouse installed and absent, while one bin on the FS-30 was filled with 40/70 mesh silica sand proppant. Eight trials were conducted. Each trial consisted of a pair of bin filling “runs”: one with the mini-baghouse control present, and one with the control absent. Each of the 4 sand bins on the FS-30 has a different volumetric internal capacity; bins #2 and #3 were randomly chosen for the test evaluations using a random number generator. The experimental design was intended to evenly sample from bins #2 and #3. Therefore, in the first half of the runs, bin #2 was filled with sand, and in the other half, bin #3 was filled. In addition, a ninth trial was conducted, in which all 4 bins of the sand mover were filled simultaneously. The results of the final trial were not compared to the other trials because of the difference in operating conditions.
Samples for respirable particulates and crystalline silica were collected using SKC® XR 5000® personal sampling pumps connected in-line to BGI® Model GK 2.69 size-selective cyclones. Samples were collected on tared 5 micron (µm) poly vinyl chloride (PVC) filters in three-piece 37-mm polystyrene sampling cassettes. The tops of the cassettes were removed to make it possible to attach the cyclones. The sampling trains were calibrated on-site, pre- and post-sampling to 4.2 liters per minute to collect the respirable fraction of dust as per BGI specifications.
Air samples were collected at 12 different sampling locations. Six locations were on top of the sand mover (at each of the four corners and at two locations towards the middle of the FS-30), and six locations were on the ground at personal breathing zone height. Sampling locations are marked on a diagram in Figure 4. Photos of the
Page 6
EPHB Report No. 373-11a
air sampling trains are found in Figures 5 – 7. A total of 192 air samples were collected over four days. Half of the air samples (96) were collected while using the mini-baghouse, and half were collected with the mini-baghouse absent. Temperature, relative humidity, and wind speed and direction were recorded continuously during each sample period.
After all samples were collected, the PVC filters were delivered to an analytical laboratory (Bureau Veritas, Novi, Michigan) where they were analyzed for respirable dust according to NIOSH method 0600, and for respirable crystalline silica according to NIOSH Method 7500. [NIOSH, 2003] For the respirable dust analysis, the filters were equilibrated for 2 hours and static charges were neutralized before the filters were weighed.
For the respirable crystalline silica analysis, the filter was removed from the air-sampling cassette and folded two times to retain the particulate inside. It was then moistened with a drop of isopropyl alcohol, and the filter holder was wiped with the filter to collect any sample that was clinging to the holder. The PVC filter was dissolved, and the sample particulate was transferred to a silver-membrane filter. X-ray diffraction was used to determine the mass of the cristobalite, quartz and tridymite forms of crystalline silica that were present.
In addition to air samples, a bulk sample of the dust collected by the mini-baghouse was collected and sent to an AIHA-accredited analytical laboratory (Bureau Veritas, Kennesaw, Georgia) for examination of particle count, size and shape using a scanning electron microscope (SEM).
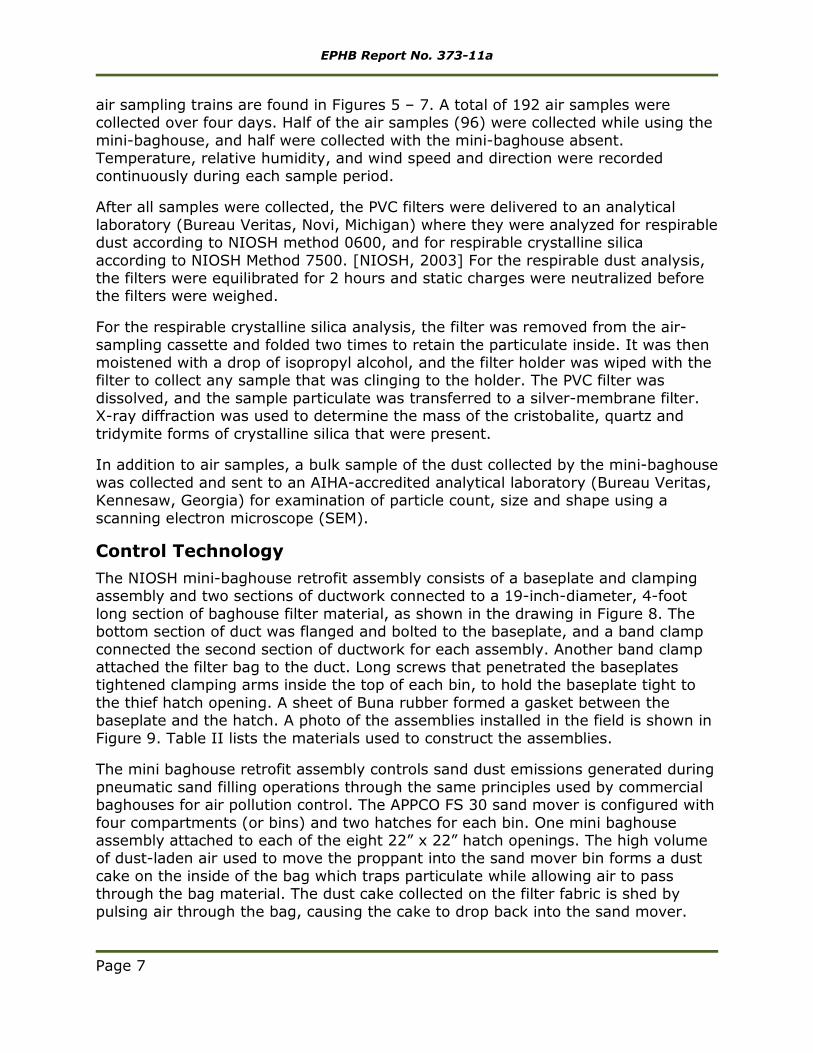
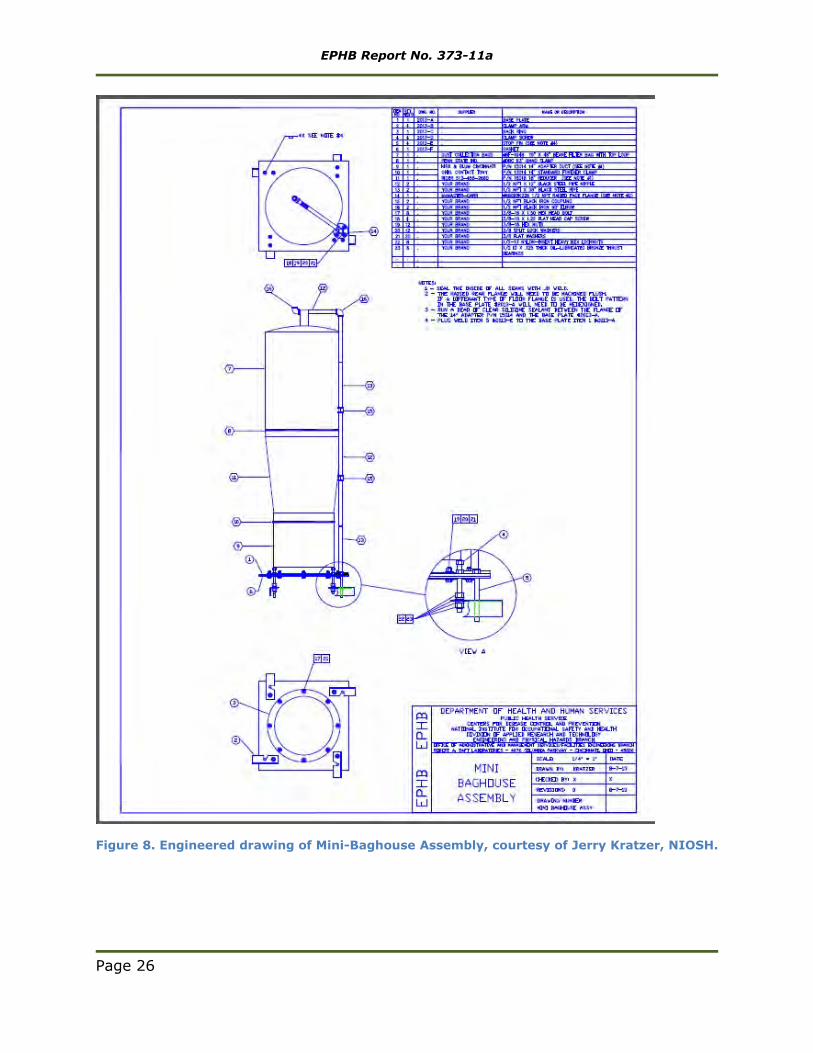
Control Technology The NIOSH mini-baghouse retrofit assembly consists of a baseplate and clamping assembly and two sections of ductwork connected to a 19-inch-diameter, 4-foot long section of baghouse filter material, as shown in the drawing in Figure 8. The bottom section of duct was flanged and bolted to the baseplate, and a band clamp connected the second section of ductwork for each assembly. Another band clamp attached the filter bag to the duct. Long screws that penetrated the baseplates tightened clamping arms inside the top of each bin, to hold the baseplate tight to the thief hatch opening. A sheet of Buna rubber formed a gasket between the baseplate and the hatch. A photo of the assemblies installed in the field is shown in Figure 9. Table II lists the materials used to construct the assemblies.
The mini baghouse retrofit assembly controls sand dust emissions generated during pneumatic sand filling operations through the same principles used by commercial baghouses for air pollution control. The APPCO FS 30 sand mover is configured with four compartments (or bins) and two hatches for each bin. One mini baghouse assembly attached to each of the eight 22” x 22” hatch openings. The high volume of dust-laden air used to move the proppant into the sand mover bin forms a dust cake on the inside of the bag which traps particulate while allowing air to pass through the bag material. The dust cake collected on the filter fabric is shed by pulsing air through the bag, causing the cake to drop back into the sand mover.
Page 7

EPHB Report No. 373-11a
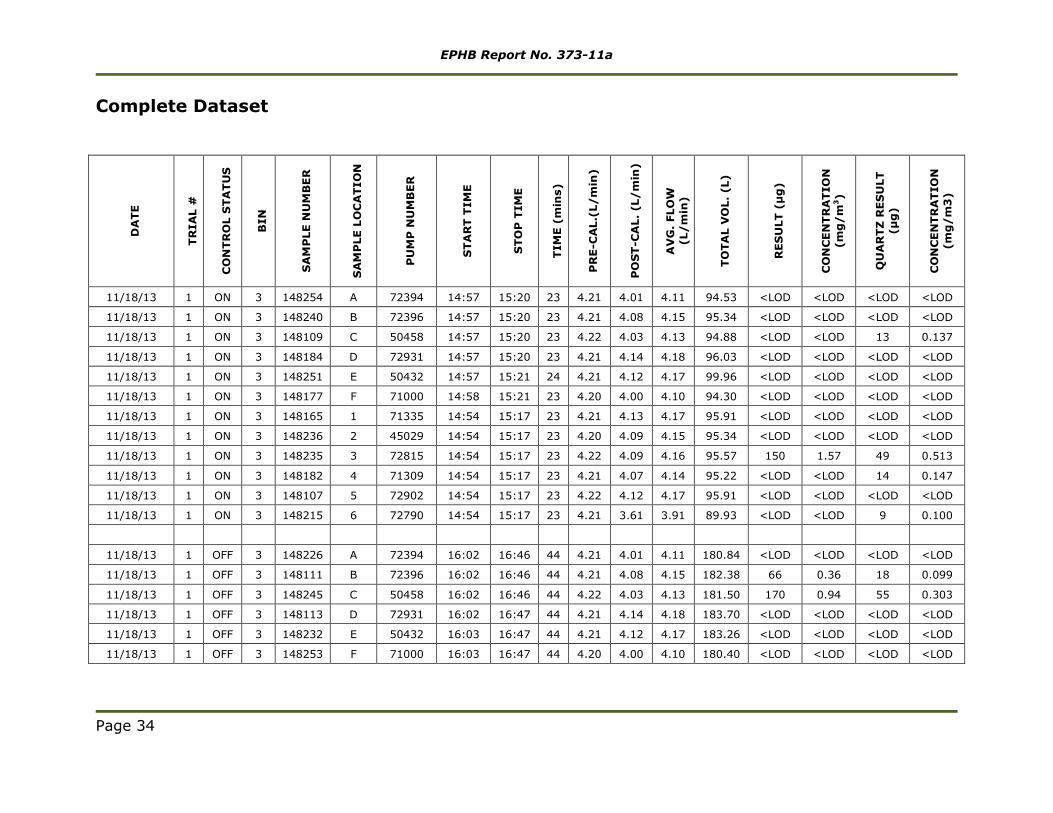
Results and Data Analysis Air samples were collected for respirable particulates and silica for the time required for bin filling operations. Sampling locations are labeled in Figure 4. One of the two Sand Mover Operator positions was near the location of sample 4 on top of the sand mover; the other was between sample locations 2 and F, at ground level. For analysis purposes, the sampling locations were treated separately, with sampling locations on top of the sand mover being combined into “Group 1” (locations 1 – 6) and sampling locations on the ground level being combined into “Group 2” (locations A – F). In the first 4 trials, bin 3 of the sand mover was filled with sand; in the last 4 trials, bin 2 of the sand mover was filled with sand.
Fill times for each run varied from 23 to 53 minutes. The concentrations for dust and for crystalline silica were determined by dividing the weight collected on the filter, as determined by the analytical laboratory, by the total volume of dust-laden air (product of the collection time and the volumetric flowrate) pulled through the air sampling pump. Quartz was the only form of silica detected by laboratory analyses. Weather data for all trials are presented in Tables III and IV. The runs in the tables are labeled with a trial number and whether the control was on or off.
NIOSH analytical methods include the analytical limit of detection (LOD), or the concentration at which a substance can be said to be definitely present. A related, and typically threefold greater value, is the analytical limit of quantitation (LOQ), at which analytes can be definitively quantified. Above the LOQ, the false negative rate is negligible unless certain interfering substances are present. [NIOSH, 2003]
Seventy-nine percent of all air samples collected in trials 1 – 8 of this investigation were less than the LOD (<LOD) for respirable dust and forty-four percent of samples were <LOD for respirable crystalline silica. This was believed to be a result of the prevailing winds during the trials. In stagnant air, more of the air samples would be expected to be above the LOD.
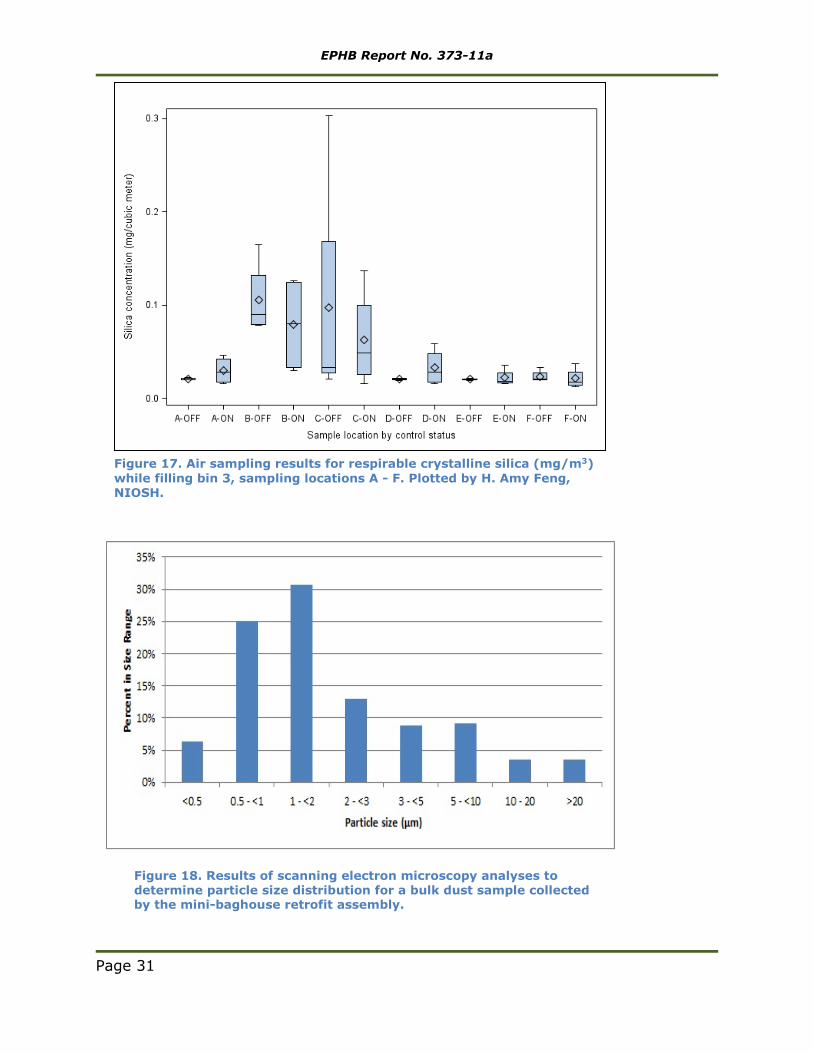
For respirable dust, the LOD for most samples was 50 micrograms, and for respirable crystalline silica, it was 5 micrograms. The LOQ for most samples of respirable dust was 150 micrograms, and the LOQ for respirable crystalline silica was 17 micrograms. For calculation and statistical purposes, numerical values for samples <LOD can be estimated using a value such as the LOD divided by the square root of 2 (i.e., divided by 1.414) [Hornung & Reed, 1990], and this approximation was used in the boxplots in Figures 10 – 17.
For the 96 area air samples for respirable dust, ninety of ninety-six (93.7%) collected using the mini-baghouse were <LOD. Fifty of ninety-six (52.1%) were <LOD for respirable crystalline silica. Of the 96 area samples collected with the control absent, 63 of 96 (65.6%) were <LOD for respirable dust; and 34 of 96 (35.4%) were <LOD for respirable crystalline silica. In the boxplots (Figures 10 – 17), concentrations are presented by sampling location and whether the control was on or off (1-off, 1-on, etc.). SAS/STAT 12.1 (SAS Institute, Inc., Cary, NC) was used to prepare the boxplots.
Page 8
EPHB Report No. 373-11a
Because the number of data points <LOD was so large, data were analyzed by a maximum likelihood estimation method (MLE) using the NLMIXED procedure in SAS/STAT 12.1 (SAS Institute, Inc., Cary, NC) according to the method described by Jin et al. for datasets with repeated measures containing large numbers of non-detectable values. MLE is a statistical method used to fit models and estimate the distribution of measurements <LOD when the data fit a lognormal distribution, which is typically the case for airborne particulates. The resulting MLE parameter estimates can be used to calculate the geometric mean and the geometric standard deviation of the data set. The MLE method results in less bias than substituting a constant value, such as the LOD divided by the square root of 2. The method performs well with datasets in which up to 80% of values are <LOD. [Jin, Hein, Deddens, & Hines, 2011]
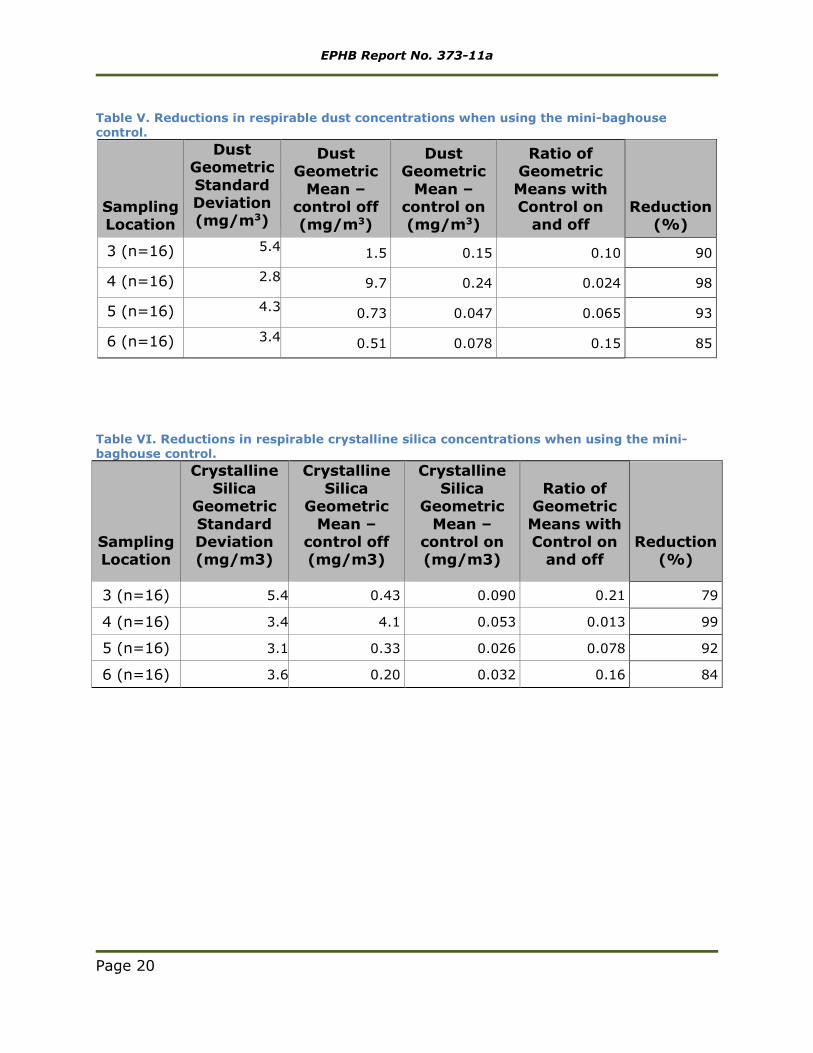
To calculate the effectiveness of the mini-baghouse control, only data from the four locations with the highest measured concentrations of respirable dust and crystalline silica (i.e., locations 3, 4, 5 and 6) were used; all of these locations were atop the sand mover. Even at these locations, three of the sixteen samples taken without the mini-baghouse in place resulted in concentrations of respirable crystalline silica <LOD, and nine of the sixteen samples for respirable dust were <LOD. The likely explanation for this is the presence of wind acting to dilute or disperse the aerosol concentration to <LOD. Using the method of Jin et al. [Jin et al., 2011] made it possible to calculate percent reductions in dust concentration for this dataset, in spite of the high number of concentrations below the LOD. As shown in Tables V and VI, significant reductions in respirable dust and in respirable crystalline silica were achieved at these sampling locations by use of the mini-baghouse. Reductions in respirable dust ranged from 85% to 98%, while reductions in respirable crystalline silica ranged from 79% to 99% at these sampling locations.
The bulk sample collected from the filter bags was notably finer than the 40/70 mesh sand transferred into the sand mover. The bulk sample particulate had the appearance and feel of talcum powder, which suggests that some degree of proppant disintegration occurs from pneumatic transport. This is likely due to frictional and impact forces on the sand as it is pneumatically conveyed from the sand delivery truck into the sand mover. The size range of the filter bag bulk sample, shown in Figure 18, indicates that the greatest percentage of particles were between 1 and 2 microns. One SEM examination of a sample of collected particles showed that the particles included a mixture of both smooth and angular shapes and that some of the larger particles in that sample (in a range of 10 to 50 µm in size) appeared to be broken. An SEM image is shown in Figure 19.
Discussion
Performance of the Mini-Baghouse It is evident from the relative scales of Figures 10 – 17 that concentrations of respirable dust and crystalline silica measured at air sampling locations on top of the sand mover (locations 1 – 6) were higher than those measured at ground level
Page 9

EPHB Report No. 373-11a
(locations A – F). This is to be expected from the characteristics of respirable particles. Respirable aerosols are typically buoyant in air; they settle at rates much slower than larger, non-respirable particles and consequently can remain airborne, disperse, and travel longer distances from point sources compared to larger and heavier aerosols. Because the dust was released from thief hatches approximately 10 feet above the ground, respirable particles might have been diluted by wind or may have been transported from the release point before reaching the near-ground level of the samplers located proximal to the sand movers. This may explain why respirable particulate concentrations measured at ground level locations near the sand mover were comparatively (and consistently) lower compared to respirable dust and silica concentrations collected at sampling locations atop the sand mover.
Average wind directions during testing varied from 7.64o to 64.10o (See Tables II and III.). Because the average wind direction was always in the same quadrant, some of the sampling locations were always upwind, and dust and crystalline silica concentrations at those locations were always low, whether the mini-baghouse was in use or not. Airborne dust at those locations likely came from a different source than the thief hatches, such as from the ground. The measured concentrations at those locations were not affected by the engineering control on the thief hatches, and were not used in calculations of its effectiveness in reducing airborne respirable dust.
All of the area air samples collected near the Sand Mover Operator’s station (sampling location 4) atop the sand mover were above the LOD for both respirable dust and crystalline silica when the NIOSH mini-baghouse retrofit assembly was not used. Conversely, when the mini-baghouse was in place, only 2 of 8 samples at this same location were above the LOD for respirable dust and 5 of the 8 samples were above the LOD for respirable silica. The percent reduction for the respirable dust area samples located at or near the operator station was 98%. For respirable crystalline silica, the percent reduction at this same location was 99%. These values demonstrate a high degree of airborne particulate reduction and effectiveness of the NIOSH mini-baghouse retrofit assembly in controlling both respirable particulates in general and respirable crystalline silica, specifically.
Because the air samples collected during the study were area samples, they are not predictive of risks for worker exposure because workers typically move between different locations during a working day. Personal breathing zone (PBZ) samples, such as those collected by Esswein et al. [Esswein et al., 2013] are needed to determine worker exposure. However, it is interesting to compare the results of this evaluation with occupational exposure limits. PEL values could not be calculated for these samples because of differences in the methods by which the mass of dust and the mass of silica were determined, but the concentrations were compared to REL and ACGIH-TLV limits.
When the mini-baghouse control was not in use, all eight of the samples collected at the Sand Mover Operator’s position on top of the sand mover (sampling location 4) exceeded the ACGIH-TLV and the REL for respirable crystalline silica. A worker
Page 10
EPHB Report No. 373-11a
who worked a full day at this position without respiratory protection would likely have been overexposed to respirable silica. Although area samples do not necessarily reflect PBZ samples, 74% of the PBZ samples for Sand Mover Operators collected during the study by Esswein et al. also exceeded the TLV and REL. [Esswein et al., 2013] With the mini baghouse control in place, four of the area samples (50%) exceeded the NIOSH REL, and five of eight samples (62.5%) exceeded the ACGIH-TLV for respirable crystalline silica.
Freshly Fractured Silica There is evidence that freshly fractured silica particles are more toxic than aged silica particles. [Vallyathan et. al., 1995] The observation of fractured silica particles in the bulk sand sample collected during sand moving is a cause for concern. Research performed by the NIOSH Respiratory Diseases Research Program (RDRP) shows that siloxyl radicals are formed on the surface of freshly fractured silica. These highly-reactive radicals can persist for about 30 hours after they are formed, long enough to react with the lung if they are inhaled. Studies in rats also showed that inhalation of freshly fractured silica caused more oxidant injury and inflammation than inhalation of aged silica. [NIOSH, 2006] If freshly fractured crystalline silica particles are present in the aerosols generated during sand transport, inhalation risks to unprotected workers could be enhanced compared to silica aerosols containing only aged quartz.
Limitations of the Study Several dust leaks were observed during this study, and the release of dust from these leaks is believed to have positively biased some results, possibly contributing to samples being > LOD and > LOQ. A screw cap was inadvertently left off of one of the fill ports (fill port not capped and sealed) on bin #1 during trial 1 and possibly also trial 2; visible dust leaked from this location before the cap was replaced. Dust leaks around the base of the mini-baghouse were observed several times on the first day of testing. Tightening of the clamp bolts helped to stop these leaks. Some dust leakage was also observed at the joint between the two pieces of ductwork and the band clamp on the mini-baghouse and dust also leaked visibly from the slide gates below several of the bins on the second day of testing. Those leaks may have had the effect of making the control appear to be less effective than if the leaks were not present during these trials.
Because of the prevailing winds, many of the air samples obtained during this study contained respirable particulate matter at concentrations <LOD. This resulted in not all of the data being useful or used to calculate a representative value for the effectiveness of the mini-baghouse control. However, using the method of Jin et al. [Jin et al., 2011], a percent reduction in respirable dust and respirable crystalline silica by use of the mini-baghouse control could be calculated for sampling locations that were downwind from the point sources of dust generation, the thief hatches.
A percentage of captured dust particles will cling to the wall of the filter cassette when airborne dust samples are collected. [Soo, Lee, Kashon, Kusti, & Harper,
Page 11
EPHB Report No. 373-11a
2014] Different analytical procedures were employed by the analytical laboratory to determine the mass of dust and the mass of silica present. When determining the mass of dust, only the dust on the filter was included, while the wall of the cassette was wiped when determining the mass of silica present. When using a polystyrene cassette with a GK2.69 cyclone, as in this study, Soo et al. found a mean of 7.52% of quartz mass on the wall of the cassette. [Soo et al., 2014] Due to this difference, the percentage of silica in the dust could not be accurately calculated. Without a percent silica, the PEL could not be calculated. As these were area samples and not PBZ samples, the PEL, like other occupational exposure limits, was not applicable.
The mini-baghouse is a prototype unit and these trials were the first field test of the control. As with many new technologies, improvements can be made to the mini-baghouse assemblies. The filtration material of the bags showed a tendency toward “blinding” after several runs, that is, the fabric became increasingly plugged with dust, necessitating shocking the bags with pulsed air from the fan compressor and manually shaking them, to slough the dust cake. Dust leakage was also evident at the band clamps connecting the two pieces of ductwork on the units. (See Figure 20.)
The “air-to-cloth” ratio may have been too high for this application. Air-to-cloth ratio is calculated by dividing the volumetric flowrate of air by the surface area of filter bag material. A low air-to-cloth ratio is needed to give an acceptable pressure drop during filtration. According to officials at the company that provided the sand trucks used in the study (MAC Trailer, Alliance, OH), the fan compressor on the sand delivery truck should deliver a minimum of 700 cubic feet per minute (CFM) of air when moving silica sand. With a 19”-diameter by 4-foot-long bag mounted on each of the two hatches on each bin of the sand mover (a total of 8 hatches), the air-to-cloth ratio is approximately 16, while the recommended range is between 4 and 10. This may explain the failure of one of the bags during the ninth trial, when all four bins were being filled simultaneously. (See Figure 21.)
Conclusions and Recommendations The presence of respirable crystalline silica, and in particular freshly fractured silica, released by forces created during pneumatic transfer of sand during hydraulic fracturing operations is an occupational exposure risk to workers at hydraulic fracturing sites. Inhalation of respirable crystalline silica (depending on dose and duration) can lead to lung diseases including silicosis and/or lung cancer, and also affect other organs, including the kidneys and the skin. The NIOSH mini-baghouse control, when mounted on thief hatches on the top of a sand mover, has been shown to be effective in reducing the quantity of respirable dust and respirable crystalline silica released during bin filling operations. Reductions in a range of 79% to 99% were demonstrated in this study. While personal breathing zone samples were not collected, observed area sample concentrations collected near working positions atop the sand mover sometimes exceeded the REL and/or TLV levels, even with the mini-baghouse control in place. This indicates that additional concentration reductions may be desirable.
Page 12

EPHB Report No. 373-11a
Opportunities exist to further enhance the performance of the NIOSH mini-baghouse retrofit assembly with an improved clamping mechanism and substitution of alternative filter bag fabrics that enhance release of the dust cake, different air-to-cloth ratios, and an improved sealing surface on the bottom of the assembly. Additional field evaluations are recommended and planned after enhancements have been made to the mini-baghouse retrofit.
Acknowledgements NIOSH thanks and acknowledges Southwestern Energy (SWN) for their leadership in occupational health and safety for agreeing to partner with NIOSH in safety and health research for the NIOSH Field Effort to Assess Chemical Exposures in Oil and Gas Workers. The authors further express their sincere gratitude to Messrs. Jim Bolander, Allen Green, Ted Hunter, Tom Huetter and others at SWN for their support of the field evaluation of the mini baghouse retrofit assembly. The authors thank Mr. Kenneth Strunk (NIOSH, Spokane) for his computer-generated rendering of a sand mover used in the report.
Page 13

EPHB Report No. 373-11a
References ACGIH. (2014). 2014 TLVs® and BEIs®: threshold limit values for chemical
substances and physical agents and biological exposure indices. Cincinnati, Ohio: American Conference of Governmental Industrial Hygienists (ACGIH).
AIHA. (2014). WEELs. In A. I. H. A. (AIHA) (Ed.). Falls Church, Virginia: American Industrial Hygiene Association (AIHA). Retrieved August 24, 2014, from https://www.aiha.org/get-involved/AIHAGuidelineFoundation/WEELs/Pages/default.aspx.
Amandus, H., & Costello, J. (1991). Silicosis and Lung-Cancer in United-States Metal Miners. Arch Environ Health, 46(2), 82-89.
Amandus, H. E., Shy, C., Castellan, R. M., Blair, A., & Heineman, E. F. (1995). Silicosis and lung cancer among workers in North Carolina dusty trades. Scandinavian Journal of Work Environment & Health, 21, 81-83.
API. (2008). API RP 19c - Recommended Practice for Measurement of Proppants Used in Hydraulic Fracturing and Gravel-packing Operations, First ed.: American Petroleum Institute (API).
Attfield, M. D., & Costello, J. (2004). Quantitative exposure-response for silica dust and lung cancer in Vermont granite workers. Am J Ind Med, 45(2), 129-138.
Chen, W., Hnizdo, E., Chen, J. Q., Attfield, M. D., Gao, P., Hearl, F., Lu, J., Wallace, W. E. (2005). Risk of silicosis in cohorts of Chinese tin and tungsten miners, and pottery workers (I): an epidemiological study. Am J Ind Med, 48(1), 1-9.
Chen, W., Liu, Y., Wang, H., Hnizdo, E., Sun, Y., Su, L., Zhang, X., Weng, S., Bochmann, F., Hearl, F. J., Chen, J., Wu, T. (2012). Long-term exposure to silica dust and risk of total and cause-specific mortality in Chinese workers: a cohort study. PLoS Med, 9(4), e1001206.
Cox-Ganser, J. M., Burchfiel, C. M., Fekedulegn, D., Andrew, M. E., & Ducatman, B. S. (2009). Silicosis in the Lymph Nodes: The Canary in Miner? J Occup Environ Med, 51(2), 164-169.
Echt, A., Sieber, W., Jones, A., & Jones, E. (2002). Control of silica exposure in construction: scabbling concrete. Appl Occup Environ Hyg, 17(12), 809-813.
Echt, A., & Sieber, W. K. (2002). Control of silica exposure from hand tools in construction: grinding concrete. Appl Occup Environ Hyg, 17(7), 457-461.
Esswein, E. J., Breitenstein, M., Snawder, J., Kiefer, M., & Sieber, W. K. (2013). Occupational Exposures to Respirable Crystalline Silica During Hydraulic Fracturing. J Occup Environ Hyg, 10(7), 347-356.
Page 14
EPHB Report No. 373-11a
Esswein, E. J., Snawder, J., King, B., Breitenstein, M., Alexander-Scott, M., & Kiefer, M. (2014). Evaluation of Some Potential Chemical Exposure Risks During Flowback Operations in Unconventional Oil and Gas Extraction: Preliminary Results. J Occup Environ Hyg, D174-D184.
Froines, J. R., Wegman, D. H., & Dellenbaugh, C. A. (1986). An approach to the characterization of silica exposure in U.S. industry. Am J Ind Med, 10(4), 345-361.
Goldstein, B. D., Brooks, B. W., Cohen, S. D., Gates, A. E., Honeycutt, M. E., Morris, J. B., Orme-Zavaleta, J., Penning, T. M., Snawder, J. (2014). The Role of Toxicological Science in Meeting the Challenges and Opportunities of Hydraulic Fracturing. Toxicol Sci, 139(2), 271-283.
Hnizdo, E., Murray, J., & Klempman, S. (1997). Lung cancer in relation to exposure to silica dust, silicosis and uranium production in South African gold miners. Thorax, 52(3), 271-275.
Hornung, R. W. & Reed, L. D. (1990). Estimation of Average Concentration in the Presence of Nondetectable Values, Appl Occup Environ Hyg, 5(1), 46-51.
IARC. (2012). Part C: Arsenic, metals, fibres, and dusts/ IARC Working Group on the Evaluation of Carcinogenic Risks to Humans IARC monographs on the evaluation of carcinogenic risks to humans (Vol. 100C). Lyon, France: International Agency for Research on Cancer (IARC).
Jin, Y., Hein, M. J., Deddens, J. A., & Hines, C. J. (2011). Analysis of lognormally distributed exposure data with repeated measures and values below the limit of detection using SAS. Ann Occup Hyg, 55(1), 97-112.
Landrigan, P. J., Cherniack, M. G., Lewis, F. A., Catlett, L. R., & Hornung, R. W. (1986). Silicosis in a Gray Iron Foundry - the Persistence of an Ancient Disease. Scand J Work Environ Health, 12(1), 32-39.
Laney, A. S., Petsonk, E. L., & Attfield, M. D. (2010). Pneumoconiosis among underground bituminous coal miners in the United States: is silicosis becoming more frequent? Occup Environ Med, 67(10), 652-656.
McDonald, J. C., McDonald, A. D., Hughes, J. M., Rando, R. J., & Weill, H. (2005). Mortality from lung and kidney disease in a cohort of North American industrial sand workers: an update. Ann Occup Hyg, 49(5), 367-373.
Morfeld, P., Mundt, K. A., Taeger, D., Guldner, K., Steinig, O., & Miller, B. G. (2014). Threshold Value Estimation for Respirable Quartz Dust Exposure and Silicosis Incidence Among Workers in the German Porcelain Industry. J Occup Environ Med, 56(2), 123-125.
Page 15
EPHB Report No. 373-11a
NIOSH. (1992, 1992). NIOSH Alert: Preventing Silicosis and Deaths from Sandblasting, Report #92-102. Retrieved October 15, 2014, from http://www.cdc.gov/niosh/docs/92-102/
NIOSH. (2002, April, 2002). NIOSH Hazard Review: Health Effects of Occupational Exposure to Respirable Crystalline Silica. Retrieved August 25, 2014, from http://www.cdc.gov/niosh/docs/2002-129/pdfs/2002-129.pdf
NIOSH. (2003). NIOSH Manual of Analytical Methods, Publication 2003-154. Retrieved August 29, 2014, from http://www.cdc.gov/niosh/docs/2003-154/
NIOSH. (2006). NIOSH Respiratory Diseases Research Program: Evidence Package for the National Academies' Review 2006 - 2007. Retrieved September 3, 2014, from http://www.cdc.gov/niosh/nas/rdrp/ch3.2e.htm
NIOSH. (2010a). NIOSH Field Effort to Assess Chemical Exposure Risks to Gas and Oil Workers. Retrieved August 24, 2014, from http://www.cdc.gov/niosh/docs/2010-130/pdfs/2010-130.pdf
NIOSH. (2010b). NIOSH Pocket Guide to Chemical Hazards. Retrieved August 24, 2014, from http://www.cdc.gov/niosh/npg/
NIOSH. (2010c). Workplace Safety & Health Topics: Engineering Controls. Retrieved September 26, 2014, from http://www.cdc.gov/niosh/topics/engcontrols/
NTP. (2011). Report on Carcinogens. 12th. Retrieved August 26, 2014, from http://ntp.niehs.nih.gov/ntp/roc/twelfth/roc12.pdf
OSHA. (2004). Occupational Safety and Health Act of 1970, Public Law 91-596. Retrieved August 27, 2014, from https://www.osha.gov/pls/oshaweb/owasrch.search_form?p_doc_type=OSHACT
OSHA. (2006). OSHA 1910.1000 Air Contaminants. Retrieved August 25, 2014, from https://www.osha.gov/pls/oshaweb/owadisp.show_document?p_table=STANDARDS&p_id=9991
OSHA. (2012). OSHA-NIOSH Hazard Alert: Worker Exposure to Silica during Hydraulic Fracturing. Retrieved August 25, 2014, from https://www.osha.gov/dts/hazardalerts/hydraulic_frac_hazard_alert.pdf
Park, R., Rice, F., Stayner, L., Smith, R., Gilbert, S., & Checkoway, H. (2002). Exposure to crystalline silica, silicosis, and lung disease other than cancer in diatomaceous earth industry workers: a quantitative risk assessment. Occup Environ Med, 59(1), 36-43.
Page 16

EPHB Report No. 373-11a
Perez-Alonso, A., Cordoba-Dona, J. A., Millares-Lorenzo, J. L., Figueroa-Murillo, E., Garcia-Vadillo, C., & Romero-Morillo, J. (2014). Outbreak of silicosis in Spanish quartz conglomerate workers. Int J Occup Environ Health, 20(1), 26-32.
Plog, B. A. (2012). Overview of Industrial Hygiene. In B. A. Plog (Ed.), Fundamentals of Industrial Hygiene (6th ed.). Itasca, IL: National Safety Council.
Rice, F. L., Park, R., Stayner, L., Smith, R., Gilbert, S., & Checkoway, H. (2001). Crystalline silica exposure and lung cancer mortality in diatomaceous earth industry workers: a quantitative risk assessment. Occup Environ Med, 58(1), 38-45.
Rosenman, K. D., Reilly, M. J., Rice, C., Hertzberg, V., Tseng, C. Y., & Anderson, H. A. (1996). Silicosis among foundry workers. Implication for the need to revise the OSHA standard. Am J Epidemiol, 144(9), 890-900.
Soo, J. C., Lee, T., Kashon, M., Kusti, M., & Harper, M. (2014). Quartz in Coal Dust Deposited on Internal Surface of Respirable Size Selective Samplers. J Occup Environ Hyg, 11(12), D215 - D219.
Steenland, K., Mannetje, A., Boffetta, P., Stayner, L., Attfield, M., Chen, J., Dosemeci, M., DeKlerk, N., Hnizdo, E., Koskela, R., Checkoway, H. (2001). Pooled exposure-response analyses and risk assessment for lung cancer in 10 cohorts of silica-exposed workers: an IARC multicentre study. Cancer Causes Control, 12(9), 773-784.
USEIA. (2014). Monthly Energy Review July 2014 (DOE/EIA-0035(2014/07)). Monthly Energy Review. Retrieved August 22, 2014, from http://www.eia.gov/totalenergy/data/monthly/archive/00351407.pdf
Vallyathan, V., Castranova, V. et. al., (1995). Freshly Fractured Quartz Leads to Enhanced Lung Injury and Inflammation. Potential Role of Free Radicals. Am J Resp Crit Care Med, 152(3), 1003-1009.
Page 17
EPHB Report No. 373-11a
Appendices
Tables Table I. Occupational Exposure Limits for respirable crystalline silica.
Table II. Materials used in mini-baghouse assemblies.
Agency Limit Time-weighted Average Exposure Limit
National Institute for Occupational Safety and Health (NIOSH) [NIOSH, 2010b]
Recommended Exposure Limit (REL)
𝑅𝑅𝑃𝑃𝑃𝑃 = 0.05 𝑚𝑚𝑚𝑚𝑚𝑚3
Occupational Safety and Health Administration (OSHA) General Industry (for dust containing quartz) [OSHA, 2006]
Permissible Exposure Limit (PEL)
𝑃𝑃𝑃𝑃𝑃𝑃(𝑚𝑚𝑚𝑚𝑚𝑚3) =
10(% 𝑠𝑠𝑠𝑠𝑠𝑠𝑠𝑠𝑠𝑠𝑠𝑠) + 2
American Conference of Governmental Industrial Hygienists (ACGIH) (α-quartz and cristobalite) [ACGIH, 2014]
Threshold Limit Value (TLV®)
𝑇𝑇𝑃𝑃𝑇𝑇 = 0.025 𝑚𝑚𝑚𝑚𝑚𝑚3
Section Material Filter bag Polyester knit Beane™ fabric Filter bag support 1/2” NPT threaded black iron pipe
and fittings Duct Galvanized steel Band clamps Steel Baseplate ¼” HR carbon steel Gasket Buna-N rubber, 40A durometer,
21” x 21” x1/4”
Page 18

EPHB Report No. 373-11a
Table III. Weather data for trials in which bin 3 was filled.
Bracketed {} numbers show that data was not collected for the full period of the trial. *Missing data.
Table IV. Weather data for trials in which bin 2 was filled.
Trial Avg. Wind Direction
Avg. Wind Speed
Avg. Temperature
Avg. %Relative Humidity
5 ON 10.8 5.4 48.6 57.6 5 OFF 41.2 4.1 44.2 64.0 6 ON 7.6 6.4 51.2 54.5 6 OFF 13.8 6.1 54.7 46.4 7 ON 15.5 5.1 60.5 33.4 7 OFF {24.7} {5.8} {60.9} {34.9} 8 ON 20.9 4.9 54.1 74.7 8 OFF 22.5 5.0 54.6 83.1
Bracketed {} numbers show that data was not collected for the full period of the trial.
Trial Avg. Wind Direction
Avg. Wind Speed
Avg. Temperature
Avg. %Relative Humidity
1 ON 27.5 4.0 66.9 25.6 1 OFF 37.8 3.8 64.3 29.2 2 ON 59.6 3.9 50.3 48.8 2 OFF 62.4 4.7 49.4 49.4 3 ON 54.7 4.8 52.7 44.5 3 OFF 64.1 6.5 55.2 38.8 4 ON {60.6} {5.6} {56.6} {32.8} 4 OFF * * * *
Page 19
EPHB Report No. 373-11a
Table V. Reductions in respirable dust concentrations when using the mini-baghouse control.
Sampling Location
Dust Geometric Standard Deviation (mg/m3)
Dust Geometric
Mean – control off (mg/m3)
Dust Geometric
Mean – control on (mg/m3)
Ratio of Geometric Means with Control on
and off Reduction
(%)
3 (n=16) 5.4 1.5 0.15 0.10 90
4 (n=16) 2.8 9.7 0.24 0.024 98
5 (n=16) 4.3 0.73 0.047 0.065 93
6 (n=16) 3.4 0.51 0.078 0.15 85 Table VI. Reductions in respirable crystalline silica concentrations when using the mini-baghouse control.
Sampling Location
Crystalline Silica
Geometric Standard Deviation (mg/m3)
Crystalline Silica
Geometric Mean –
control off (mg/m3)
Crystalline Silica
Geometric Mean –
control on (mg/m3)
Ratio of Geometric Means with Control on
and off Reduction
(%)
3 (n=16) 5.4 0.43 0.090 0.21 79
4 (n=16) 3.4 4.1 0.053 0.013 99
5 (n=16) 3.1 0.33 0.026 0.078 92
6 (n=16) 3.6 0.20 0.032 0.16 84
Page 20

EPHB Report No. 373-11a
Figures
Figure 2. Sand Mover Operator at his work station on top of the sand mover, arrows point to the open thief hatches. Photo courtesy of Eric Esswein, NIOSH.
Figure 1. Clouds of dust become visible as sand trucks are unloaded at a hydraulic fracturing site. Photo courtesy of Michael Breitenstein, NIOSH.
Page 21

EPHB Report No. 373-11a
Figure 3. NIOSH mini-baghouse assemblies installed on 8 thief hatches atop a sand mover. Photo courtesy of Mike Gressel and Jerry Kratzer, NIOSH.
Page 22

EPHB Report No. 373-11a
Figure 4. Air sampling locations for test of mini-baghouse. Computer rendering developed by Kenneth Strunk, NIOSH Spokane, and modified by Barbara Alexander, NIOSH DART.
Page 23

EPHB Report No. 373-11a
Figure 5. Sampling train installed on upper corner of sand mover. Photo courtesy of Mike Gressel and Jerry Kratzer, NIOSH.
Figure 6. Sampling train located in the middle of the top of the sand mover during an uncontrolled trial run. Photo courtesy of Mike Gressel and Jerry Kratzer, NIOSH.
Page 24

EPHB Report No. 373-11a
Figure 7. Sampling train located at breathing zone height on stand next to the sand mover. Photo courtesy of Mike Gressel and Jerry Kratzer, NIOSH.
Page 25
EPHB Report No. 373-11a
Figure 8. Engineered drawing of Mini-Baghouse Assembly, courtesy of Jerry Kratzer, NIOSH.
Page 26
EPHB Report No. 373-11a
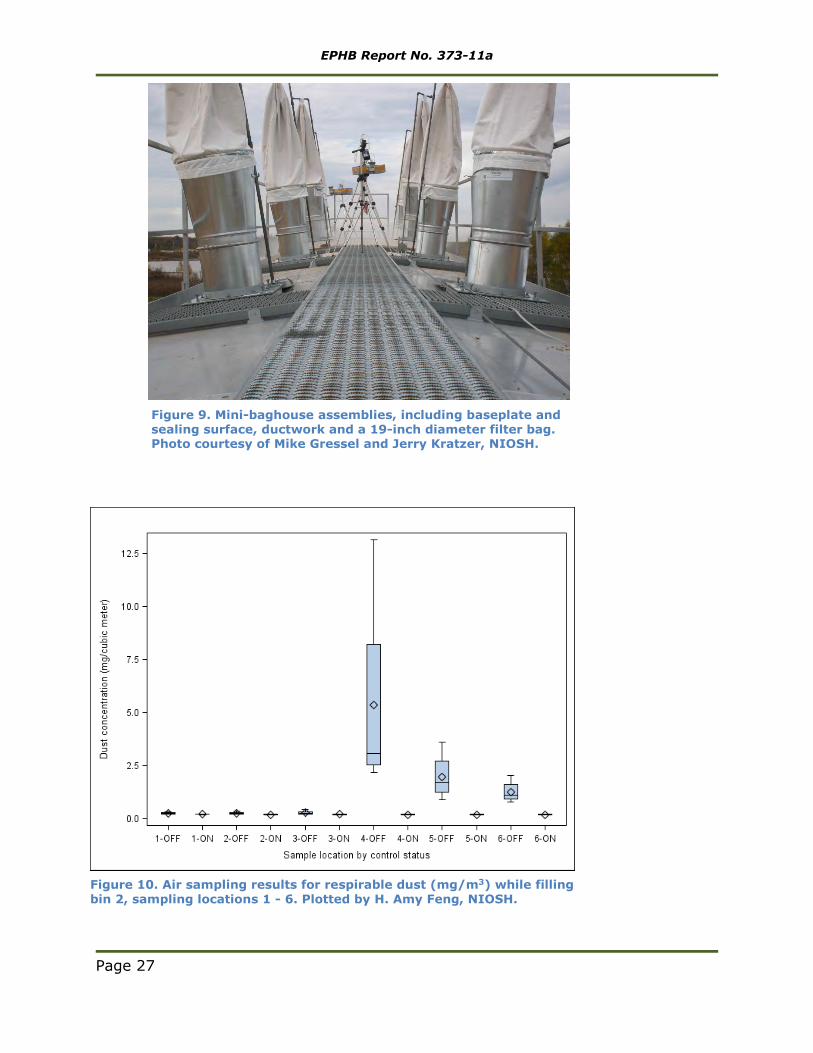
Figure 9. Mini-baghouse assemblies, including baseplate and sealing surface, ductwork and a 19-inch diameter filter bag. Photo courtesy of Mike Gressel and Jerry Kratzer, NIOSH.
Figure 10. Air sampling results for respirable dust (mg/m3) while filling bin 2, sampling locations 1 - 6. Plotted by H. Amy Feng, NIOSH.
Page 27

EPHB Report No. 373-11a
Figure 11. Air sampling results for respirable dust (mg/m3) while filling bin 3, sampling locations 1 - 6. Plotted by H. Amy Feng, NIOSH.
Figure 12. Air sampling results for respirable dust (mg/m3) while filling bin 2, sampling locations A - F. Plotted by H. Amy Feng, NIOSH.
Page 28

EPHB Report No. 373-11a
Figure 13. Air sampling results for respirable dust (mg/m3) while filling bin 3, sampling locations A - F. Plotted by H. Amy Feng, NIOSH.
Figure 14. Air sampling results for respirable crystalline silica (mg/m3) while filling bin 2, sampling locations 1 - 6. Plotted by H. Amy Feng, NIOSH.
Page 29
EPHB Report No. 373-11a
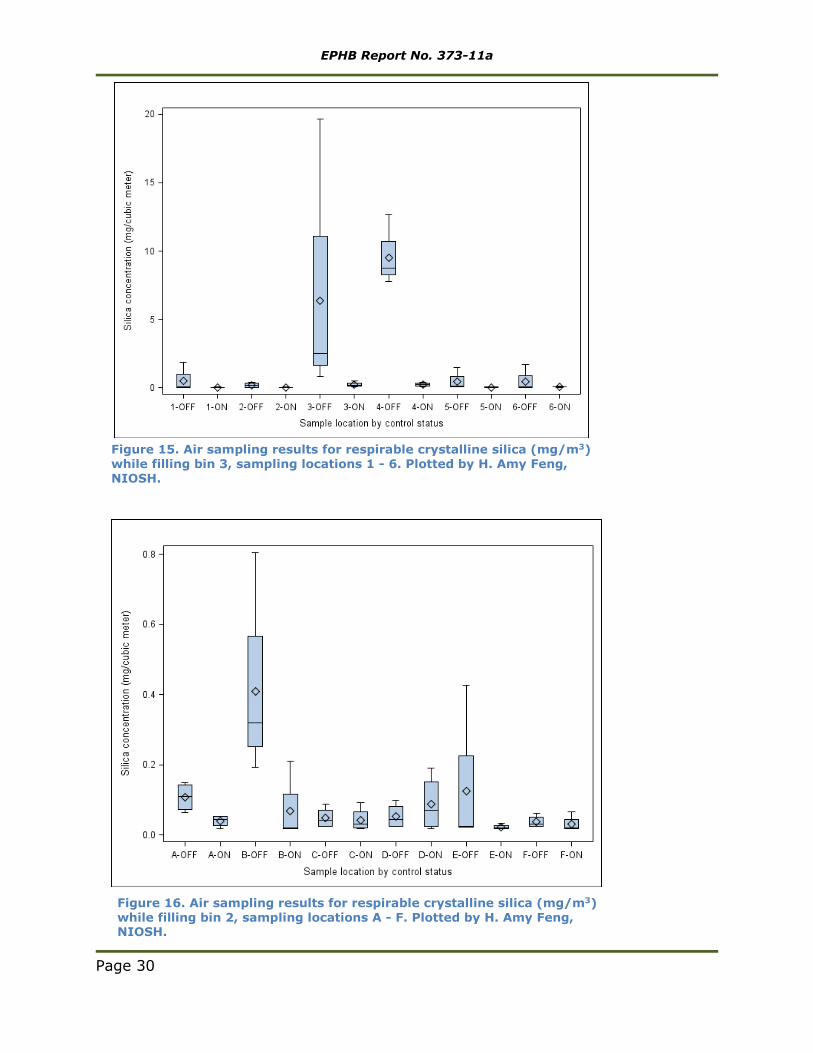
Figure 15. Air sampling results for respirable crystalline silica (mg/m3) while filling bin 3, sampling locations 1 - 6. Plotted by H. Amy Feng, NIOSH.
Figure 16. Air sampling results for respirable crystalline silica (mg/m3) while filling bin 2, sampling locations A - F. Plotted by H. Amy Feng, NIOSH.
Page 30
EPHB Report No. 373-11a
Figure 17. Air sampling results for respirable crystalline silica (mg/m3) while filling bin 3, sampling locations A - F. Plotted by H. Amy Feng, NIOSH.
Figure 18. Results of scanning electron microscopy analyses to determine particle size distribution for a bulk dust sample collected by the mini-baghouse retrofit assembly.
Page 31

EPHB Report No. 373-11a
Figure 20. Dust leakage visible at the band clamp connecting two sections of ductwork on the mini-baghouse. Photo courtesy of Mike Gressel and Jerry Kratzer, NIOSH.
Figure 19. Rounded and angular silica particles collected in the mini-baghouse during bin filling operations. SEM image courtesy of Arthur Miller, NIOSH Spokane.
Page 32

EPHB Report No. 373-11a
Figure 21. Failure of filter bag during test of mini-baghouse. Photo courtesy of Mike Gressel and Jerry Kratzer, NIOSH.
Page 33
EPHB Report No. 373-11a
Complete Dataset D
ATE
TRIA
L #
CO
NTR
OL
STA
TUS
BIN
SA
MP
LE N
UM
BER
SA
MP
LE L
OC
ATI
ON
PU
MP
NU
MB
ER
STA
RT
TIM
E
STO
P T
IME
TIM
E (m
ins)
PR
E-C
AL.
(L/m
in)
PO
ST-
CA
L. (
L/m
in)
AV
G.
FLO
W
(L/m
in)
TOTA
L V
OL.
(L)
RES
ULT
(µ
g)
CO
NC
ENTR
ATI
ON
(m
g/m
3)
QU
AR
TZ R
ESU
LT
(µg
)
CO
NC
ENTR
ATI
ON
(m
g/m
3)
11/18/13 1 ON 3 148254 A 72394 14:57 15:20 23 4.21 4.01 4.11 94.53 <LOD <LOD <LOD <LOD
11/18/13 1 ON 3 148240 B 72396 14:57 15:20 23 4.21 4.08 4.15 95.34 <LOD <LOD <LOD <LOD
11/18/13 1 ON 3 148109 C 50458 14:57 15:20 23 4.22 4.03 4.13 94.88 <LOD <LOD 13 0.137
11/18/13 1 ON 3 148184 D 72931 14:57 15:20 23 4.21 4.14 4.18 96.03 <LOD <LOD <LOD <LOD
11/18/13 1 ON 3 148251 E 50432 14:57 15:21 24 4.21 4.12 4.17 99.96 <LOD <LOD <LOD <LOD
11/18/13 1 ON 3 148177 F 71000 14:58 15:21 23 4.20 4.00 4.10 94.30 <LOD <LOD <LOD <LOD
11/18/13 1 ON 3 148165 1 71335 14:54 15:17 23 4.21 4.13 4.17 95.91 <LOD <LOD <LOD <LOD
11/18/13 1 ON 3 148236 2 45029 14:54 15:17 23 4.20 4.09 4.15 95.34 <LOD <LOD <LOD <LOD
11/18/13 1 ON 3 148235 3 72815 14:54 15:17 23 4.22 4.09 4.16 95.57 150 1.57 49 0.513
11/18/13 1 ON 3 148182 4 71309 14:54 15:17 23 4.21 4.07 4.14 95.22 <LOD <LOD 14 0.147
11/18/13 1 ON 3 148107 5 72902 14:54 15:17 23 4.22 4.12 4.17 95.91 <LOD <LOD <LOD <LOD
11/18/13 1 ON 3 148215 6 72790 14:54 15:17 23 4.21 3.61 3.91 89.93 <LOD <LOD 9 0.100
11/18/13 1 OFF 3 148226 A 72394 16:02 16:46 44 4.21 4.01 4.11 180.84 <LOD <LOD <LOD <LOD
11/18/13 1 OFF 3 148111 B 72396 16:02 16:46 44 4.21 4.08 4.15 182.38 66 0.36 18 0.099
11/18/13 1 OFF 3 148245 C 50458 16:02 16:46 44 4.22 4.03 4.13 181.50 170 0.94 55 0.303
11/18/13 1 OFF 3 148113 D 72931 16:02 16:47 44 4.21 4.14 4.18 183.70 <LOD <LOD <LOD <LOD
11/18/13 1 OFF 3 148232 E 50432 16:03 16:47 44 4.21 4.12 4.17 183.26 <LOD <LOD <LOD <LOD
11/18/13 1 OFF 3 148253 F 71000 16:03 16:47 44 4.20 4.00 4.10 180.40 <LOD <LOD <LOD <LOD
Page 34

EPHB Report No. 373-11a
DA
TE
TRIA
L #
CO
NTR
OL
STA
TUS
BIN
SA
MP
LE N
UM
BER
SA
MP
LE L
OC
ATI
ON
PU
MP
NU
MB
ER
STA
RT
TIM
E
STO
P T
IME
TIM
E (m
ins)
PR
E-C
AL.
(L/m
in)
PO
ST-
CA
L. (
L/m
in)
AV
G.
FLO
W
(L/m
in)
TOTA
L V
OL.
(L)
RES
ULT
(µ
g)
CO
NC
ENTR
ATI
ON
(m
g/m
3)
QU
AR
TZ R
ESU
LT
(µg
)
CO
NC
ENTR
ATI
ON
(m
g/m
3)
11/18/13 1 OFF 3 148247 1 71335 15:59 16:45 44 4.21 4.13 4.17 183.48 330 1.80 340 1.853
11/18/13 1 OFF 3 147985 2 45029 15:59 16:45 44 4.20 4.09 4.15 182.38 86 0.47 71 0.389
11/18/13 1 OFF 3 148102 3 72815 15:59 16:45 44 4.22 4.09 4.16 182.82 10,000 54.70 3600 19.691
11/18/13 1 OFF 3 148213 4 71309 15:59 16:45 44 4.21 4.07 4.14 182.16 3,600 19.76 1600 8.783
11/18/13 1 OFF 3 148243 5 72902 15:59 16:45 44 4.22 4.12 4.17 183.48 710 3.87 270 1.472
11/18/13 1 OFF 3 148047 6 72790 15:59 16:45 44 4.21 3.61 3.91 172.04 <LOD <LOD 14 0.081
11/19/13 2 ON 3 148178 A 50766 9:58 10:53 53 4.22 4.42 4.32 228.96 <LOD <LOD <LOD <LOD
11/19/13 2 ON 3 148103 B 72828 9:58 10:53 53 4.20 4.08 4.14 219.42 <LOD <LOD 27 0.123
11/19/13 2 ON 3 147891 C 45029 9:58 10:53 53 4.23 4.10 4.17 220.75 <LOD <LOD <LOD <LOD
11/19/13 2 ON 3 148095 D 50432 9:58 10:53 53 4.21 4.10 4.16 220.22 <LOD <LOD <LOD <LOD
11/19/13 2 ON 3 148227 E 72790 9:58 10:53 53 4.22 4.15 4.19 221.81 <LOD <LOD <LOD <LOD
11/19/13 2 ON 3 148117 F 50458 9:58 10:53 53 4.20 4.13 4.17 220.75 <LOD <LOD <LOD <LOD
11/19/13 2 ON 3 147835 1 72394 9:55 10:48 52 4.20 4.22 4.21 218.92 <LOD <LOD <LOD <LOD
11/19/13 2 ON 3 147867 2 71000 9:55 10:48 53 4.20 4.05 4.13 218.63 <LOD <LOD <LOD <LOD
11/19/13 2 ON 3 147893 3 71335 9:55 10:48 53 4.22 4.16 4.19 222.07 66 0.30 33 0.149
11/19/13 2 ON 3 147892 4 50464 9:55 10:48 53 4.22 4.33 4.28 226.58 250 1.10 75 0.331
11/19/13 2 ON 3 147919 5 72396 9:55 10:48 53 4.20 4.19 4.20 222.34 <LOD <LOD <LOD <LOD
11/19/13 2 ON 3 147910 6 71309 9:55 10:48 53 4.22 4.16 4.19 222.07 <LOD <LOD 14 0.063
11/19/13 2 OFF 3 148104 A 50766 8:29 9:11 42 4.22 4.42 4.32 181.44 <LOD <LOD <LOD <LOD
11/19/13 2 OFF 3 148171 B 72828 8:29 9:11 42 4.20 4.08 4.14 173.88 56 0.32 14 0.081
Page 35

EPHB Report No. 373-11a
DA
TE
TRIA
L #
CO
NTR
OL
STA
TUS
BIN
SA
MP
LE N
UM
BER
SA
MP
LE L
OC
ATI
ON
PU
MP
NU
MB
ER
STA
RT
TIM
E
STO
P T
IME
TIM
E (m
ins)
PR
E-C
AL.
(L/m
in)
PO
ST-
CA
L. (
L/m
in)
AV
G.
FLO
W
(L/m
in)
TOTA
L V
OL.
(L)
RES
ULT
(µ
g)
CO
NC
ENTR
ATI
ON
(m
g/m
3)
QU
AR
TZ R
ESU
LT
(µg
)
CO
NC
ENTR
ATI
ON
(m
g/m
3)
11/19/13 2 OFF 3 147887 C 45029 8:29 9:11 42 4.23 4.10 4.17 174.93 <LOD <LOD 5.8 0.033
11/19/13 2 OFF 3 147174 D 50432 8:30 9:11 42 4.21 4.10 4.16 174.51 <LOD <LOD <LOD <LOD
11/19/13 2 OFF 3 148241 E 72790 8:30 9:11 42 4.22 4.15 4.19 175.77 <LOD <LOD <LOD <LOD
11/19/13 2 OFF 3 148203 F 50458 8:30 9:12 42 4.20 4.13 4.17 174.93 <LOD <LOD <LOD <LOD
11/19/13 2 OFF 3 148237 1 72394 8:26 9:08 42 4.20 4.22 4.21 176.82 <LOD <LOD 6.2 0.035
11/19/13 2 OFF 3 148212 2 71000 8:26 9:08 42 4.20 4.05 4.13 173.25 <LOD <LOD 7.2 0.042
11/19/13 2 OFF 3 148152 3 71335 8:26 9:08 42 4.22 4.16 4.19 175.98 1000 5.68 430 2.443
11/19/13 2 OFF 3 148228 4 50464 8:26 9:08 42 4.22 4.33 4.28 179.55 3600 20.05 1400 7.797
11/19/13 2 OFF 3 148246 5 72396 8:26 9:08 42 4.20 4.19 4.20 176.19 <LOD <LOD 9.9 0.056
11/19/13 2 OFF 3 148173 6 71309 8:26 9:08 42 4.22 4.16 4.19 175.98 <LOD <LOD 5.7 0.032
11/19/13 3 ON 3 148233 A 50766 11:25 12:09 44 4.22 4.42 4.32 190.08 <LOD <LOD <LOD <LOD
11/19/13 3 ON 3 147921 B 72828 11:25 12:09 44 4.20 4.08 4.14 182.16 <LOD <LOD 23 0.126
11/19/13 3 ON 3 147850 C 42029 11:25 12:09 44 4.23 4.10 4.17 183.26 <LOD <LOD 6.5 0.035
11/19/13 3 ON 3 148161 D 50432 11:25 12:09 44 4.21 4.10 4.16 182.82 <LOD <LOD <LOD <LOD
11/19/13 3 ON 3 148120 E 72790 11:25 12:09 44 4.22 4.15 4.19 184.14 <LOD <LOD <LOD <LOD
11/19/13 3 ON 3 147868 F 50458 11:25 12:09 44 4.20 4.13 4.17 183.26 <LOD <LOD <LOD <LOD
11/19/13 3 ON 3 147828 1 72394 11:22 12:07 44 4.20 4.22 4.21 185.24 <LOD <LOD <LOD <LOD
11/19/13 3 ON 3 147802 2 71000 11:22 12:07 44 4.20 4.05 4.13 181.50 <LOD <LOD <LOD <LOD
11/19/13 3 ON 3 147776 3 71335 11:22 12:07 44 4.22 4.16 4.19 184.36 96 0.52 28 0.152
11/19/13 3 ON 3 147882 4 50464 11:22 12:07 44 4.22 4.33 4.28 188.10 210 1.12 71 0.377
11/19/13 3 ON 3 147888 5 72396 11:22 12:07 44 4.20 4.19 4.20 184.58 <LOD <LOD <LOD <LOD
Page 36

EPHB Report No. 373-11a
DA
TE
TRIA
L #
CO
NTR
OL
STA
TUS
BIN
SA
MP
LE N
UM
BER
SA
MP
LE L
OC
ATI
ON
PU
MP
NU
MB
ER
STA
RT
TIM
E
STO
P T
IME
TIM
E (m
ins)
PR
E-C
AL.
(L/m
in)
PO
ST-
CA
L. (
L/m
in)
AV
G.
FLO
W
(L/m
in)
TOTA
L V
OL.
(L)
RES
ULT
(µ
g)
CO
NC
ENTR
ATI
ON
(m
g/m
3)
QU
AR
TZ R
ESU
LT
(µg
)
CO
NC
ENTR
ATI
ON
(m
g/m
3)
11/19/13 3 ON 3 147897 6 71309 11:22 12:07 44 4.22 4.16 4.19 184.36 <LOD <LOD <LOD <LOD
11/19/13 3 OFF 3 147282 A 50766 13:47 14:28 40 4.22 4.42 4.32 172.80 <LOD <LOD <LOD <LOD
11/19/13 3 OFF 3 147237 B 72828 13:47 14:29 41 4.20 4.08 4.14 169.74 96 0.57 28 0.165
11/19/13 3 OFF 3 147255 C 45029 13:47 14:29 41 4.23 4.10 4.17 170.77 <LOD <LOD <LOD <LOD
11/19/13 3 OFF 3 147535 D 50432 13:47 14:29 41 4.21 4.10 4.16 170.36 <LOD <LOD <LOD <LOD
11/19/13 3 OFF 3 147230 E 72790 13:47 14:29 41 4.22 4.15 4.19 171.59 <LOD <LOD <LOD <LOD
11/19/13 3 OFF 3 147138 F 50458 13:47 14:29 41 4.20 4.13 4.17 170.77 <LOD <LOD <LOD <LOD
11/19/13 3 OFF 3 147841 1 72394 13:44 14:25 40 4.20 4.22 4.21 168.40 <LOD <LOD <LOD <LOD
11/19/13 3 OFF 3 147827 2 71000 13:44 14:25 40 4.20 4.05 4.13 165.00 <LOD <LOD <LOD <LOD
11/19/13 3 OFF 3 148050 3 71335 13:44 14:25 40 4.22 4.16 4.19 167.60 360 2.15 140 0.835
11/19/13 3 OFF 3 147909 4 50464 13:44 14:25 40 4.22 4.33 4.28 171.00 3700 21.64 1500 8.772
11/19/13 3 OFF 3 147784 5 72396 13:44 14:25 40 4.20 4.19 4.20 167.80 <LOD <LOD 24 0.143
11/19/13 3 OFF 3 148176 6 71309 13:44 14:25 40 4.22 4.16 4.19 167.60 <LOD <LOD <LOD <LOD
11/19/13 4 ON 3 147860 A 50766 15:13 16:27 50 4.22 4.42 4.32 216.00 <LOD <LOD 10 0.046
11/19/13 4 ON 3 147196 B 72828 15:13 16:27 50 4.20 4.08 4.14 207.00 76 0.37 6.1 0.029
11/19/13 4 ON 3 147340 C 45029 15:13 16:27 50 4.23 4.10 4.17 208.25 <LOD <LOD 13 0.062
11/19/13 4 ON 3 139818 D 50432 15:13 16:27 49 4.21 4.10 4.16 203.60 <LOD <LOD 12 0.059
11/19/13 4 ON 3 148239 E 72790 15:13 16:28 47 4.22 4.15 4.19 196.70 <LOD <LOD <LOD <LOD
11/19/13 4 ON 3 148170 F 50458 15:13 16:28 70 4.20 4.13 4.17 291.55 <LOD <LOD <LOD <LOD
11/19/13 4 ON 3 147100 1 72394 15:10 16:24 48 4.20 4.22 4.21 202.08 <LOD <LOD 5.7 0.028
Page 37

EPHB Report No. 373-11a
DA
TE
TRIA
L #
CO
NTR
OL
STA
TUS
BIN
SA
MP
LE N
UM
BER
SA
MP
LE L
OC
ATI
ON
PU
MP
NU
MB
ER
STA
RT
TIM
E
STO
P T
IME
TIM
E (m
ins)
PR
E-C
AL.
(L/m
in)
PO
ST-
CA
L. (
L/m
in)
AV
G.
FLO
W
(L/m
in)
TOTA
L V
OL.
(L)
RES
ULT
(µ
g)
CO
NC
ENTR
ATI
ON
(m
g/m
3)
QU
AR
TZ R
ESU
LT
(µg
)
CO
NC
ENTR
ATI
ON
(m
g/m
3)
11/19/13 4 ON 3 147529 2 71000 15:10 16:24 48 4.20 4.05 4.13 198.00 <LOD <LOD <LOD <LOD
11/19/13 4 ON 3 147219 3 71335 15:10 16:24 49 4.22 4.16 4.19 205.31 <LOD <LOD 12 0.058
11/19/13 4 ON 3 147337 4 50464 15:10 16:24 49 4.22 4.33 4.28 209.48 <LOD <LOD 11 0.053
11/19/13 4 ON 3 147214 5 72396 15:10 16:24 49 4.20 4.19 4.20 205.56 <LOD <LOD 6.5 0.032
11/19/13 4 ON 3 147260 6 71309 15:10 16:24 49 4.22 4.16 4.19 205.31 <LOD <LOD 13 0.063
11/19/13 4 OFF 3 147400 A 50766 16:55 17:33 37 4.22 4.42 4.32 159.84 <LOD <LOD <LOD <LOD
11/19/13 4 OFF 3 147250 B 72828 16:55 17:33 37 4.20 4.08 4.14 153.18 <LOD <LOD 12 0.078
11/19/13 4 OFF 3 147197 C 45029 16:55 17:35 39 4.23 4.10 4.17 162.44 <LOD <LOD 5.4 0.033
11/19/13 4 OFF 3 147443 D 50432 16:55 17:35 39 4.21 4.10 4.16 162.05 <LOD <LOD <LOD <LOD
11/19/13 4 OFF 3 147112 E 72790 16:55 17:36 40 4.22 4.15 4.19 167.40 <LOD <LOD <LOD <LOD
11/19/13 4 OFF 3 147298 F 50458 16:56 17:36 40 4.20 4.13 4.17 166.60 <LOD <LOD 5.5 0.033
11/19/13 4 OFF 3 147389 1 72394 16:52 17:30 37 4.20 4.22 4.21 155.77 <LOD <LOD 20 0.128
11/19/13 4 OFF 3 147312 2 71000 16:52 17:30 37 4.20 4.05 4.13 152.63 <LOD <LOD 42 0.275
11/19/13 4 OFF 3 147544 3 71335 16:52 17:30 37 4.22 4.16 4.19 155.03 1000 6.45 390 2.516
11/19/13 4 OFF 3 147252 4 50464 16:52 17:30 37 4.22 4.33 4.28 158.18 5300 33.51 2000 12.644
11/19/13 4 OFF 3 147470 5 72396 16:52 17:30 37 4.20 4.19 4.20 155.22 <LOD <LOD 7.2 0.046
11/19/13 4 OFF 3 147581 6 71309 16:52 17:30 37 4.22 4.16 4.19 155.03 330 2.13 260 1.677
11/20/13 5 ON 2 147833 A 72902 9:19 9:58 40 4.21 4.31 4.26 170.40 <LOD <LOD 5.8 0.034
11/20/13 5 ON 2 147793 B 72815 9:19 9:58 39 4.21 4.52 4.37 170.24 <LOD <LOD <LOD <LOD
11/20/13 5 ON 2 147885 C 72790 9:19 9:58 39 4.25 4.43 4.34 169.26 <LOD <LOD 6.6 0.039
Page 38

EPHB Report No. 373-11a
DA
TE
TRIA
L #
CO
NTR
OL
STA
TUS
BIN
SA
MP
LE N
UM
BER
SA
MP
LE L
OC
ATI
ON
PU
MP
NU
MB
ER
STA
RT
TIM
E
STO
P T
IME
TIM
E (m
ins)
PR
E-C
AL.
(L/m
in)
PO
ST-
CA
L. (
L/m
in)
AV
G.
FLO
W
(L/m
in)
TOTA
L V
OL.
(L)
RES
ULT
(µ
g)
CO
NC
ENTR
ATI
ON
(m
g/m
3)
QU
AR
TZ R
ESU
LT
(µg
)
CO
NC
ENTR
ATI
ON
(m
g/m
3)
11/20/13 5 ON 2 147899 D 50432 9:19 9:58 39 4.24 4.37 4.31 167.90 <LOD <LOD 32 0.191
11/20/13 5 ON 2 147912 E 72828 9:19 9:58 39 4.23 4.40 4.32 168.29 <LOD <LOD <LOD <LOD
11/20/13 5 ON 2 147317 F 50458 9:19 9:58 39 4.22 4.42 4.32 168.48 <LOD <LOD 11 0.065
11/20/13 5 ON 2 147854 1 72931 9:16 9:55 39 4.21 4.03 4.12 160.68 <LOD <LOD 35 0.218
11/20/13 5 ON 2 147922 2 71000 9:16 9:55 39 4.26 4.32 4.29 167.31 <LOD <LOD 20 0.120
11/20/13 5 ON 2 147806 3 71309 9:16 9:55 39 4.21 4.28 4.25 165.56 <LOD <LOD 14 0.085
11/20/13 5 ON 2 147782 4 72396 9:16 9:55 39 4.21 4.42 4.32 168.29 <LOD <LOD 7.9 0.047
11/20/13 5 ON 2 147928 5 71335 9:16 9:55 39 4.22 4.57 4.40 171.41 <LOD <LOD 7.2 0.042
11/20/13 5 ON 2 147791 6 45029 9:16 9:55 39 4.21 4.38 4.30 167.51 <LOD <LOD 7.9 0.047
11/20/13 5 OFF 2 147818 A 72902 8:13 8:50 37 4.21 4.31 4.26 157.62 <LOD <LOD 10 0.063
11/20/13 5 OFF 2 147808 B 72815 8:13 8:50 37 4.21 4.52 4.37 161.51 290 1.80 130 0.805
11/20/13 5 OFF 2 147215 C 72790 8:13 8:50 37 4.25 4.43 4.34 160.58 <LOD <LOD 14 0.087
11/20/13 5 OFF 2 147804 D 50432 8:13 8:50 38 4.24 4.37 4.31 163.59 <LOD <LOD 16 0.098
11/20/13 5 OFF 2 147836 E 72828 8:13 8:50 37 4.23 4.40 4.32 159.66 <LOD <LOD 68 0.426
11/20/13 5 OFF 2 147853 F 50458 8:13 8:50 37 4.22 4.42 4.32 159.84 <LOD <LOD 9.9 0.062
11/20/13 5 OFF 2 147772 1 72931 8:12 8:48 37 4.21 4.03 4.12 152.44 <LOD <LOD <LOD <LOD
11/20/13 5 OFF 2 147800 2 71000 8:12 8:48 37 4.26 4.32 4.29 158.73 56 0.35 150 0.945
11/20/13 5 OFF 2 147786 3 71309 8:12 8:48 37 4.21 4.28 4.25 157.07 66 0.42 25 0.159
11/20/13 5 OFF 2 147812 4 72396 8:12 8:48 37 4.21 4.42 4.32 159.66 2100 13.15 1000 6.264
11/20/13 5 OFF 2 147788 5 71335 8:12 8:48 37 4.22 4.57 4.40 162.62 590 3.63 280 1.722
11/20/13 5 OFF 2 147815 6 45029 8:12 8:48 38 4.21 4.38 4.30 163.21 130 0.80 53 0.325
Page 39

EPHB Report No. 373-11a
DA
TE
TRIA
L #
CO
NTR
OL
STA
TUS
BIN
SA
MP
LE N
UM
BER
SA
MP
LE L
OC
ATI
ON
PU
MP
NU
MB
ER
STA
RT
TIM
E
STO
P T
IME
TIM
E (m
ins)
PR
E-C
AL.
(L/m
in)
PO
ST-
CA
L. (
L/m
in)
AV
G.
FLO
W
(L/m
in)
TOTA
L V
OL.
(L)
RES
ULT
(µ
g)
CO
NC
ENTR
ATI
ON
(m
g/m
3)
QU
AR
TZ R
ESU
LT
(µg
)
CO
NC
ENTR
ATI
ON
(m
g/m
3)
11/20/13 6 ON 2 147206 A 72902 10:23 11:08 45 4.21 4.31 4.26 191.70 <LOD <LOD <LOD <LOD
11/20/13 6 ON 2 147221 B 72815 10:23 11:08 45 4.21 4.52 4.37 196.43 <LOD <LOD <LOD <LOD
11/20/13 6 ON 2 147167 C 72790 10:23 11:08 45 4.25 4.43 4.34 195.30 <LOD <LOD <LOD <LOD
11/20/13 6 ON 2 147515 D 50432 10:23 11:08 45 4.24 4.37 4.31 193.73 <LOD <LOD <LOD <LOD
11/20/13 6 ON 2 147269 E 72828 10:24 11:09 45 4.23 4.40 4.32 194.18 <LOD <LOD <LOD <LOD
11/20/13 6 ON 2 147438 F 50458 10:24 11:09 45 4.22 4.42 4.32 194.40 <LOD <LOD <LOD <LOD
11/20/13 6 ON 2 147612 1 72931 10:20 11:05 44 4.21 4.03 4.12 181.28 <LOD <LOD 10 0.055
11/20/13 6 ON 2 147301 2 71000 10:20 11:05 45 4.26 4.32 4.29 193.05 <LOD <LOD <LOD <LOD
11/20/13 6 ON 2 147306 3 71309 10:20 11:05 45 4.21 4.28 4.25 191.03 <LOD <LOD 7.7 0.040
11/20/13 6 ON 2 147233 4 72396 10:20 11:05 45 4.21 4.42 4.32 194.18 <LOD <LOD <LOD <LOD
11/20/13 6 ON 2 147294 5 71335 10:20 11:05 45 4.22 4.57 4.40 197.78 <LOD <LOD 11 0.056
11/20/13 6 ON 2 147283 6 45029 10:20 11:05 45 4.21 4.38 4.30 193.28 <LOD <LOD <LOD <LOD
11/20/13 6 OFF 2 147256 A 72902 11:29 12:03 34 4.21 4.31 4.26 144.84 <LOD <LOD 20 0.138
11/20/13 6 OFF 2 147228 B 72815 11:29 12:03 34 4.21 4.52 4.37 148.41 160 1.08 49 0.330
11/20/13 6 OFF 2 147913 C 72790 11:29 12:03 34 4.25 4.43 4.34 147.56 <LOD <LOD <LOD <LOD
11/20/13 6 OFF 2 147433 D 50432 11:29 12:03 34 4.24 4.37 4.31 146.37 <LOD <LOD <LOD <LOD
11/20/13 6 OFF 2 147238 E 72828 11:29 12:03 34 4.23 4.40 4.32 146.71 <LOD <LOD <LOD <LOD
11/20/13 6 OFF 2 147362 F 50458 11:29 12:03 34 4.22 4.42 4.32 146.88 <LOD <LOD <LOD <LOD
11/20/13 6 OFF 2 147829 1 72931 11:26 12:00 34 4.21 4.03 4.12 140.08 <LOD <LOD <LOD <LOD
11/20/13 6 OFF 2 147787 2 71000 11:26 12:00 34 4.26 4.32 4.29 145.86 <LOD <LOD <LOD <LOD
Page 40
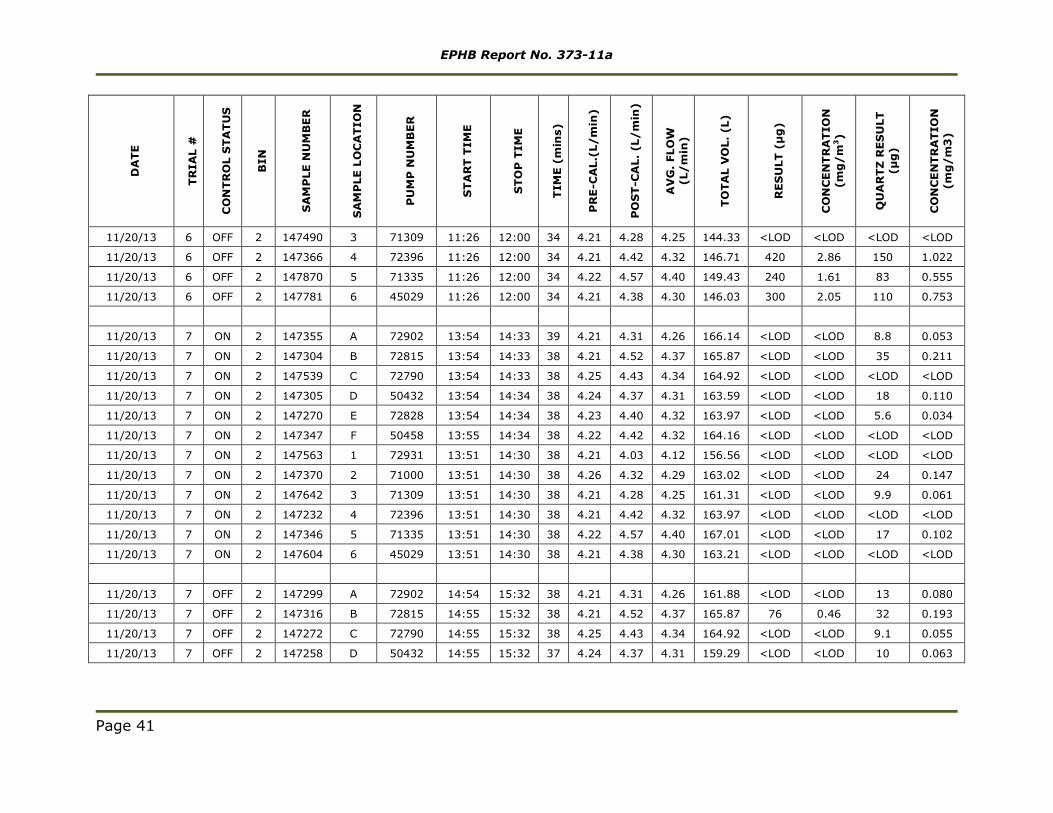
EPHB Report No. 373-11a
DA
TE
TRIA
L #
CO
NTR
OL
STA
TUS
BIN
SA
MP
LE N
UM
BER
SA
MP
LE L
OC
ATI
ON
PU
MP
NU
MB
ER
STA
RT
TIM
E
STO
P T
IME
TIM
E (m
ins)
PR
E-C
AL.
(L/m
in)
PO
ST-
CA
L. (
L/m
in)
AV
G.
FLO
W
(L/m
in)
TOTA
L V
OL.
(L)
RES
ULT
(µ
g)
CO
NC
ENTR
ATI
ON
(m
g/m
3)
QU
AR
TZ R
ESU
LT
(µg
)
CO
NC
ENTR
ATI
ON
(m
g/m
3)
11/20/13 6 OFF 2 147490 3 71309 11:26 12:00 34 4.21 4.28 4.25 144.33 <LOD <LOD <LOD <LOD
11/20/13 6 OFF 2 147366 4 72396 11:26 12:00 34 4.21 4.42 4.32 146.71 420 2.86 150 1.022
11/20/13 6 OFF 2 147870 5 71335 11:26 12:00 34 4.22 4.57 4.40 149.43 240 1.61 83 0.555
11/20/13 6 OFF 2 147781 6 45029 11:26 12:00 34 4.21 4.38 4.30 146.03 300 2.05 110 0.753
11/20/13 7 ON 2 147355 A 72902 13:54 14:33 39 4.21 4.31 4.26 166.14 <LOD <LOD 8.8 0.053
11/20/13 7 ON 2 147304 B 72815 13:54 14:33 38 4.21 4.52 4.37 165.87 <LOD <LOD 35 0.211
11/20/13 7 ON 2 147539 C 72790 13:54 14:33 38 4.25 4.43 4.34 164.92 <LOD <LOD <LOD <LOD
11/20/13 7 ON 2 147305 D 50432 13:54 14:34 38 4.24 4.37 4.31 163.59 <LOD <LOD 18 0.110
11/20/13 7 ON 2 147270 E 72828 13:54 14:34 38 4.23 4.40 4.32 163.97 <LOD <LOD 5.6 0.034
11/20/13 7 ON 2 147347 F 50458 13:55 14:34 38 4.22 4.42 4.32 164.16 <LOD <LOD <LOD <LOD
11/20/13 7 ON 2 147563 1 72931 13:51 14:30 38 4.21 4.03 4.12 156.56 <LOD <LOD <LOD <LOD
11/20/13 7 ON 2 147370 2 71000 13:51 14:30 38 4.26 4.32 4.29 163.02 <LOD <LOD 24 0.147
11/20/13 7 ON 2 147642 3 71309 13:51 14:30 38 4.21 4.28 4.25 161.31 <LOD <LOD 9.9 0.061
11/20/13 7 ON 2 147232 4 72396 13:51 14:30 38 4.21 4.42 4.32 163.97 <LOD <LOD <LOD <LOD
11/20/13 7 ON 2 147346 5 71335 13:51 14:30 38 4.22 4.57 4.40 167.01 <LOD <LOD 17 0.102
11/20/13 7 ON 2 147604 6 45029 13:51 14:30 38 4.21 4.38 4.30 163.21 <LOD <LOD <LOD <LOD
11/20/13 7 OFF 2 147299 A 72902 14:54 15:32 38 4.21 4.31 4.26 161.88 <LOD <LOD 13 0.080
11/20/13 7 OFF 2 147316 B 72815 14:55 15:32 38 4.21 4.52 4.37 165.87 76 0.46 32 0.193
11/20/13 7 OFF 2 147272 C 72790 14:55 15:32 38 4.25 4.43 4.34 164.92 <LOD <LOD 9.1 0.055
11/20/13 7 OFF 2 147258 D 50432 14:55 15:32 37 4.24 4.37 4.31 159.29 <LOD <LOD 10 0.063
Page 41
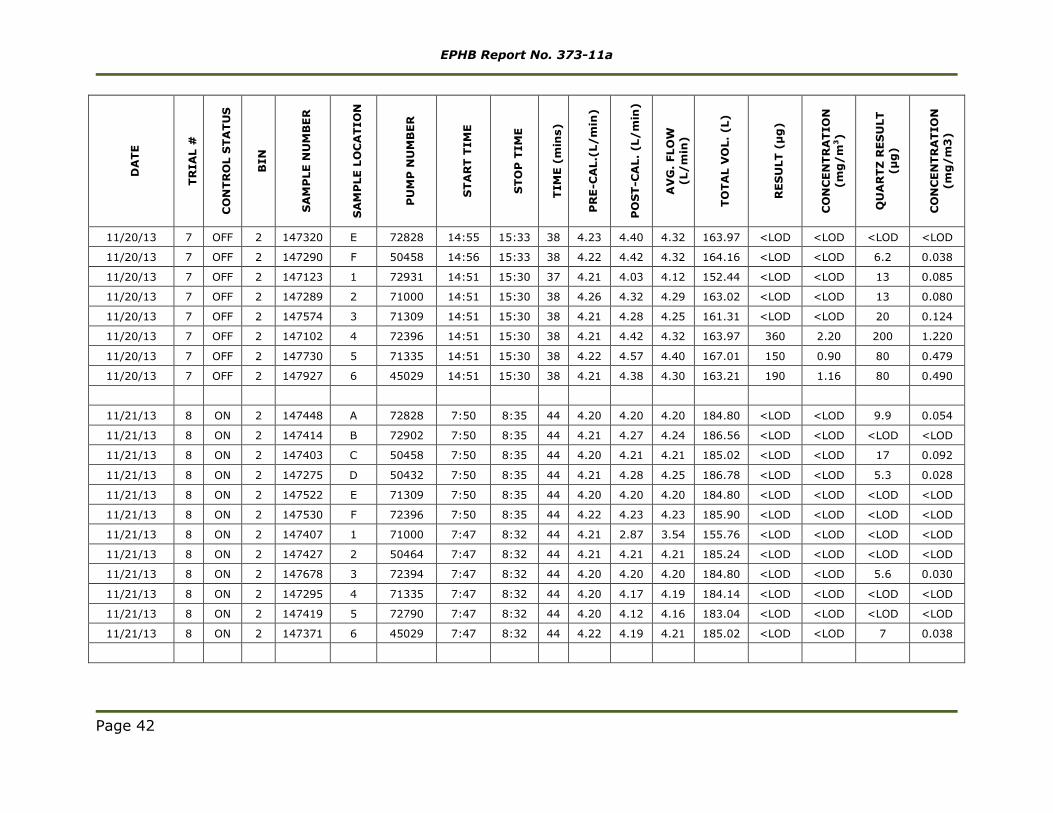
EPHB Report No. 373-11a
DA
TE
TRIA
L #
CO
NTR
OL
STA
TUS
BIN
SA
MP
LE N
UM
BER
SA
MP
LE L
OC
ATI
ON
PU
MP
NU
MB
ER
STA
RT
TIM
E
STO
P T
IME
TIM
E (m
ins)
PR
E-C
AL.
(L/m
in)
PO
ST-
CA
L. (
L/m
in)
AV
G.
FLO
W
(L/m
in)
TOTA
L V
OL.
(L)
RES
ULT
(µ
g)
CO
NC
ENTR
ATI
ON
(m
g/m
3)
QU
AR
TZ R
ESU
LT
(µg
)
CO
NC
ENTR
ATI
ON
(m
g/m
3)
11/20/13 7 OFF 2 147320 E 72828 14:55 15:33 38 4.23 4.40 4.32 163.97 <LOD <LOD <LOD <LOD
11/20/13 7 OFF 2 147290 F 50458 14:56 15:33 38 4.22 4.42 4.32 164.16 <LOD <LOD 6.2 0.038
11/20/13 7 OFF 2 147123 1 72931 14:51 15:30 37 4.21 4.03 4.12 152.44 <LOD <LOD 13 0.085
11/20/13 7 OFF 2 147289 2 71000 14:51 15:30 38 4.26 4.32 4.29 163.02 <LOD <LOD 13 0.080
11/20/13 7 OFF 2 147574 3 71309 14:51 15:30 38 4.21 4.28 4.25 161.31 <LOD <LOD 20 0.124
11/20/13 7 OFF 2 147102 4 72396 14:51 15:30 38 4.21 4.42 4.32 163.97 360 2.20 200 1.220
11/20/13 7 OFF 2 147730 5 71335 14:51 15:30 38 4.22 4.57 4.40 167.01 150 0.90 80 0.479
11/20/13 7 OFF 2 147927 6 45029 14:51 15:30 38 4.21 4.38 4.30 163.21 190 1.16 80 0.490
11/21/13 8 ON 2 147448 A 72828 7:50 8:35 44 4.20 4.20 4.20 184.80 <LOD <LOD 9.9 0.054
11/21/13 8 ON 2 147414 B 72902 7:50 8:35 44 4.21 4.27 4.24 186.56 <LOD <LOD <LOD <LOD
11/21/13 8 ON 2 147403 C 50458 7:50 8:35 44 4.20 4.21 4.21 185.02 <LOD <LOD 17 0.092
11/21/13 8 ON 2 147275 D 50432 7:50 8:35 44 4.21 4.28 4.25 186.78 <LOD <LOD 5.3 0.028
11/21/13 8 ON 2 147522 E 71309 7:50 8:35 44 4.20 4.20 4.20 184.80 <LOD <LOD <LOD <LOD
11/21/13 8 ON 2 147530 F 72396 7:50 8:35 44 4.22 4.23 4.23 185.90 <LOD <LOD <LOD <LOD
11/21/13 8 ON 2 147407 1 71000 7:47 8:32 44 4.21 2.87 3.54 155.76 <LOD <LOD <LOD <LOD
11/21/13 8 ON 2 147427 2 50464 7:47 8:32 44 4.21 4.21 4.21 185.24 <LOD <LOD <LOD <LOD
11/21/13 8 ON 2 147678 3 72394 7:47 8:32 44 4.20 4.20 4.20 184.80 <LOD <LOD 5.6 0.030
11/21/13 8 ON 2 147295 4 71335 7:47 8:32 44 4.20 4.17 4.19 184.14 <LOD <LOD <LOD <LOD
11/21/13 8 ON 2 147419 5 72790 7:47 8:32 44 4.20 4.12 4.16 183.04 <LOD <LOD <LOD <LOD
11/21/13 8 ON 2 147371 6 45029 7:47 8:32 44 4.22 4.19 4.21 185.02 <LOD <LOD 7 0.038
Page 42
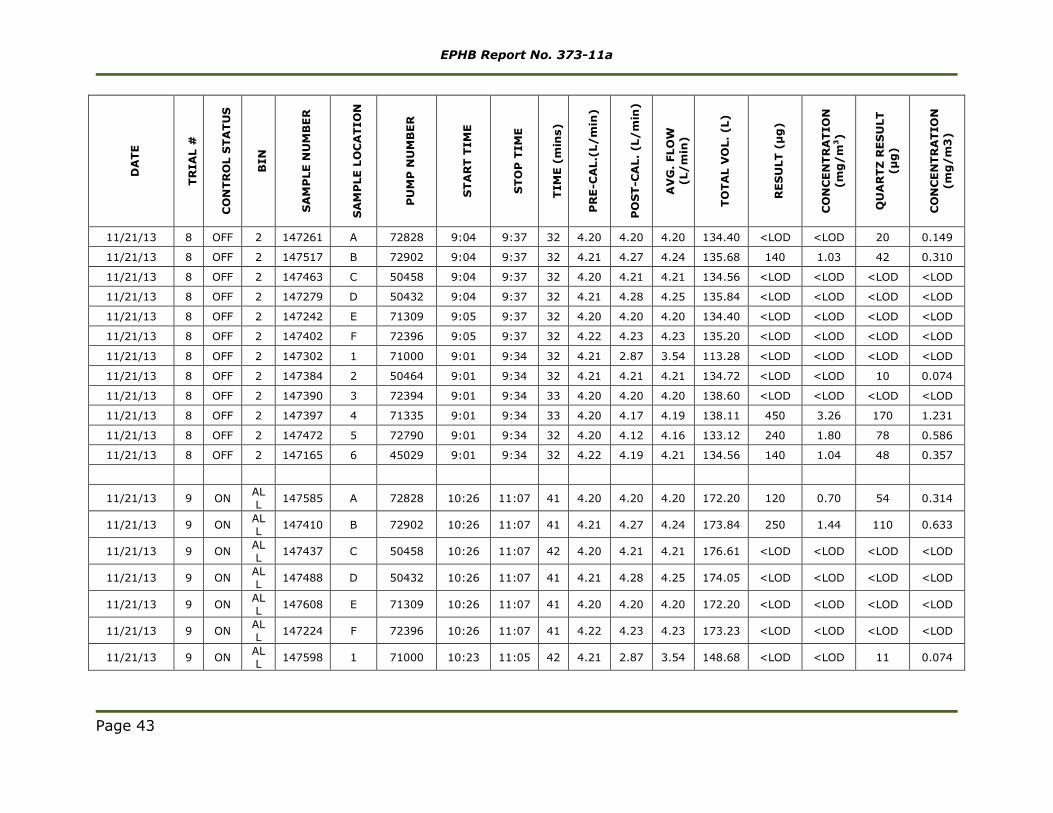
EPHB Report No. 373-11a
DA
TE
TRIA
L #
CO
NTR
OL
STA
TUS
BIN
SA
MP
LE N
UM
BER
SA
MP
LE L
OC
ATI
ON
PU
MP
NU
MB
ER
STA
RT
TIM
E
STO
P T
IME
TIM
E (m
ins)
PR
E-C
AL.
(L/m
in)
PO
ST-
CA
L. (
L/m
in)
AV
G.
FLO
W
(L/m
in)
TOTA
L V
OL.
(L)
RES
ULT
(µ
g)
CO
NC
ENTR
ATI
ON
(m
g/m
3)
QU
AR
TZ R
ESU
LT
(µg
)
CO
NC
ENTR
ATI
ON
(m
g/m
3)
11/21/13 8 OFF 2 147261 A 72828 9:04 9:37 32 4.20 4.20 4.20 134.40 <LOD <LOD 20 0.149
11/21/13 8 OFF 2 147517 B 72902 9:04 9:37 32 4.21 4.27 4.24 135.68 140 1.03 42 0.310
11/21/13 8 OFF 2 147463 C 50458 9:04 9:37 32 4.20 4.21 4.21 134.56 <LOD <LOD <LOD <LOD
11/21/13 8 OFF 2 147279 D 50432 9:04 9:37 32 4.21 4.28 4.25 135.84 <LOD <LOD <LOD <LOD
11/21/13 8 OFF 2 147242 E 71309 9:05 9:37 32 4.20 4.20 4.20 134.40 <LOD <LOD <LOD <LOD
11/21/13 8 OFF 2 147402 F 72396 9:05 9:37 32 4.22 4.23 4.23 135.20 <LOD <LOD <LOD <LOD
11/21/13 8 OFF 2 147302 1 71000 9:01 9:34 32 4.21 2.87 3.54 113.28 <LOD <LOD <LOD <LOD
11/21/13 8 OFF 2 147384 2 50464 9:01 9:34 32 4.21 4.21 4.21 134.72 <LOD <LOD 10 0.074
11/21/13 8 OFF 2 147390 3 72394 9:01 9:34 33 4.20 4.20 4.20 138.60 <LOD <LOD <LOD <LOD
11/21/13 8 OFF 2 147397 4 71335 9:01 9:34 33 4.20 4.17 4.19 138.11 450 3.26 170 1.231
11/21/13 8 OFF 2 147472 5 72790 9:01 9:34 32 4.20 4.12 4.16 133.12 240 1.80 78 0.586
11/21/13 8 OFF 2 147165 6 45029 9:01 9:34 32 4.22 4.19 4.21 134.56 140 1.04 48 0.357
11/21/13 9 ON ALL 147585 A 72828 10:26 11:07 41 4.20 4.20 4.20 172.20 120 0.70 54 0.314
11/21/13 9 ON ALL 147410 B 72902 10:26 11:07 41 4.21 4.27 4.24 173.84 250 1.44 110 0.633
11/21/13 9 ON ALL 147437 C 50458 10:26 11:07 42 4.20 4.21 4.21 176.61 <LOD <LOD <LOD <LOD
11/21/13 9 ON ALL 147488 D 50432 10:26 11:07 41 4.21 4.28 4.25 174.05 <LOD <LOD <LOD <LOD
11/21/13 9 ON ALL 147608 E 71309 10:26 11:07 41 4.20 4.20 4.20 172.20 <LOD <LOD <LOD <LOD
11/21/13 9 ON ALL 147224 F 72396 10:26 11:07 41 4.22 4.23 4.23 173.23 <LOD <LOD <LOD <LOD
11/21/13 9 ON ALL 147598 1 71000 10:23 11:05 42 4.21 2.87 3.54 148.68 <LOD <LOD 11 0.074
Page 43

EPHB Report No. 373-11a
DA
TE
TRIA
L #
CO
NTR
OL
STA
TUS
BIN
SA
MP
LE N
UM
BER
SA
MP
LE L
OC
ATI
ON
PU
MP
NU
MB
ER
STA
RT
TIM
E
STO
P T
IME
TIM
E (m
ins)
PR
E-C
AL.
(L/m
in)
PO
ST-
CA
L. (
L/m
in)
AV
G.
FLO
W
(L/m
in)
TOTA
L V
OL.
(L)
RES
ULT
(µ
g)
CO
NC
ENTR
ATI
ON
(m
g/m
3)
QU
AR
TZ R
ESU
LT
(µg
)
CO
NC
ENTR
ATI
ON
(m
g/m
3)
11/21/13 9 ON ALL 147528 2 50464 10:23 11:05 41 4.21 4.21 4.21 172.61 <LOD <LOD <LOD <LOD
11/21/13 9 ON ALL 147412 3 72394 10:23 11:05 41 4.20 4.20 4.20 172.20 <LOD <LOD 16 0.093
11/21/13 9 ON ALL 147696 4 71335 10:23 11:05 41 4.20 4.17 4.19 171.59 300 1.75 110 0.641
11/21/13 9 ON ALL 147514 5 72790 10:23 11:05 41 4.20 4.12 4.16 170.56 <LOD <LOD 16 0.094
11/21/13 9 ON ALL 147635 6 45029 10:23 11:05 41 4.22 4.19 4.21 172.41 <LOD <LOD 39 0.226
11/21/13 9 OFF ALL 147504 A 72828 11:59 12:40 41 4.20 4.20 4.20 172.20 340 1.97 100 0.581
11/21/13 9 OFF ALL 147600 B 72902 11:59 12:40 41 4.21 4.27 4.24 173.84 680 3.91 230 1.323
11/21/13 9 OFF ALL 147481 C 50458 11:59 12:40 40 4.20 4.21 4.21 168.20 <LOD <LOD 5.2 0.031
11/21/13 9 OFF ALL 147479 D 50432 12:00 12:00 0 4.21 4.28 4.25 0.00 <LOD <LOD <LOD <LOD
11/21/13 9 OFF ALL 147378 E 71309 12:00 12:40 38 4.20 4.20 4.20 159.60 <LOD <LOD <LOD <LOD
11/21/13 9 OFF ALL 147685 F 72396 12:00 12:40 38 4.22 4.23 4.23 160.55 <LOD <LOD 11 0.069
11/21/13 9 OFF ALL 147452 1 71000 11:56 12:36 40 4.21 2.87 3.54 141.60 <LOD <LOD <LOD <LOD
11/21/13 9 OFF ALL 147287 2 50464 11:56 12:36 40 4.21 4.21 4.21 168.40 260 1.54 75 0.445
11/21/13 9 OFF ALL 147686 3 72394 11:56 12:36 40 4.20 4.20 4.20 168.00 <LOD <LOD 50 0.298
11/21/13 9 OFF ALL 147296 4 71335 11:56 12:36 40 4.20 4.17 4.19 167.40 12000 71.68 4900 29.271
11/21/13 9 OFF ALL 147714 5 72790 11:56 12:36 40 4.20 4.12 4.16 166.40 2500 15.02 1100 6.611
Page 44

EPHB Report No. 373-11a
DA
TE
TRIA
L #
CO
NTR
OL
STA
TUS
BIN
SA
MP
LE N
UM
BER
SA
MP
LE L
OC
ATI
ON
PU
MP
NU
MB
ER
STA
RT
TIM
E
STO
P T
IME
TIM
E (m
ins)
PR
E-C
AL.
(L/m
in)
PO
ST-
CA
L. (
L/m
in)
AV
G.
FLO
W
(L/m
in)
TOTA
L V
OL.
(L)
RES
ULT
(µ
g)
CO
NC
ENTR
ATI
ON
(m
g/m
3)
QU
AR
TZ R
ESU
LT
(µg
)
CO
NC
ENTR
ATI
ON
(m
g/m
3)
11/21/13 9 OFF ALL 147424 6 45029 11:56 12:36 40 4.22 4.19 4.21 168.20 840 4.99 310 1.843
11/19/13 NA NA NA 148190
QUONSET HUT
72931 9:00 17:53 533 4.25 4.06 4.16 2214.6
2 <LOD <LOD 8.1 0.004
11/20/13 NA NA NA 147732
QUONSET HUT
72394 8:13 15:57 464 4.21 4.40 4.31 1997.5
2 <LOD <LOD 6.2 0.003
11/21/13 NA NA NA 147386
QUONSET HUT
72931 7:48 13:41 353 4.20 4.19 4.20 1480.8
4 <LOD <LOD <LOD <LOD
FIELD BLANK NA NA NA 148162 NA NA NA NA NA NA NA NA NA <LOD <LOD
FIELD BLANK NA NA NA 147166 NA NA NA NA NA NA NA NA NA <LOD <LOD
FIELD BLANK NA NA NA 147545 NA NA NA NA NA NA NA NA NA <LOD <LOD
FIELD BLANK NA NA NA 147630 NA NA NA NA NA NA NA NA NA <LOD <LOD
FIELD BLANK NA NA NA 147640 NA NA NA NA NA NA NA NA NA <LOD <LOD
FIELD BLANK NA NA NA 147622 NA NA NA NA NA NA NA NA NA <LOD <LOD
FIELD BLANK NA NA NA 147691 NA NA NA NA NA NA NA NA NA <LOD <LOD
FIELD BLANK NA NA NA 147631 NA NA NA NA NA NA NA NA NA <LOD <LOD
FIELD BLANK NA NA NA 147485 NA NA NA NA NA NA NA NA NA <LOD <LOD
FIELD BLANK NA NA NA 147557 NA NA NA NA NA NA NA NA NA <LOD <LOD
Page 45
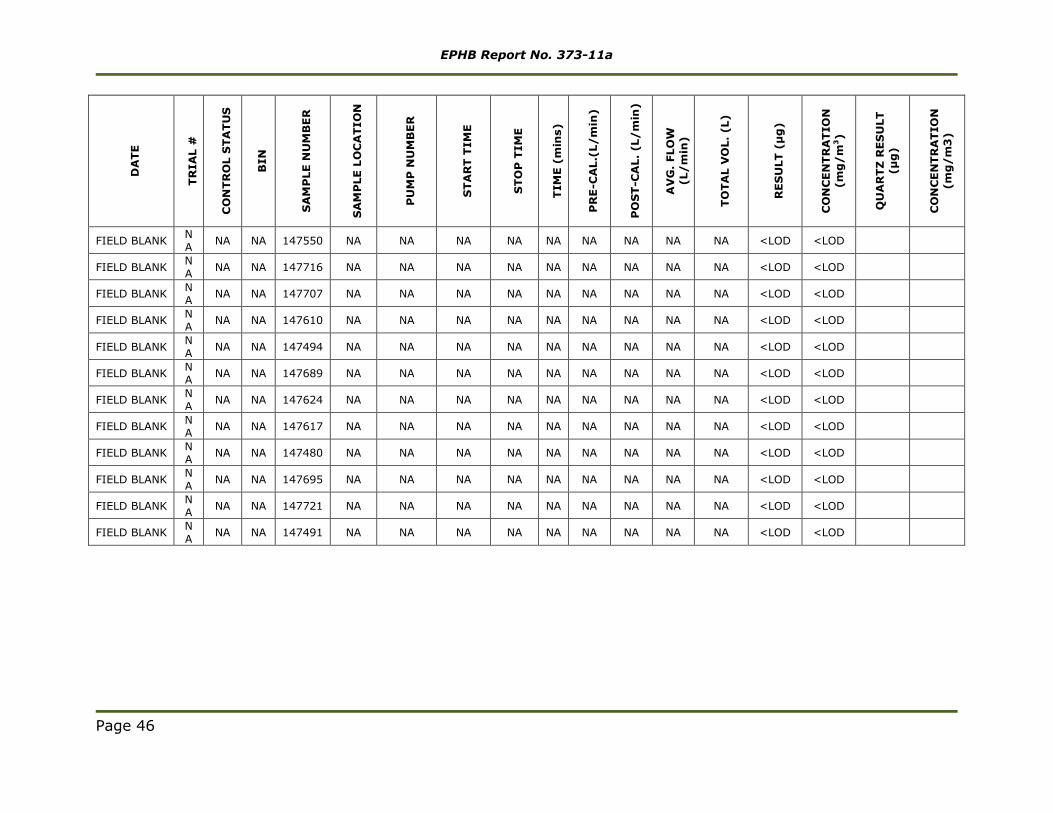
EPHB Report No. 373-11a
DA
TE
TRIA
L #
CO
NTR
OL
STA
TUS
BIN
SA
MP
LE N
UM
BER
SA
MP
LE L
OC
ATI
ON
PU
MP
NU
MB
ER
STA
RT
TIM
E
STO
P T
IME
TIM
E (m
ins)
PR
E-C
AL.
(L/m
in)
PO
ST-
CA
L. (
L/m
in)
AV
G.
FLO
W
(L/m
in)
TOTA
L V
OL.
(L)
RES
ULT
(µ
g)
CO
NC
ENTR
ATI
ON
(m
g/m
3)
QU
AR
TZ R
ESU
LT
(µg
)
CO
NC
ENTR
ATI
ON
(m
g/m
3)
FIELD BLANK NA NA NA 147550 NA NA NA NA NA NA NA NA NA <LOD <LOD
FIELD BLANK NA NA NA 147716 NA NA NA NA NA NA NA NA NA <LOD <LOD
FIELD BLANK NA NA NA 147707 NA NA NA NA NA NA NA NA NA <LOD <LOD
FIELD BLANK NA NA NA 147610 NA NA NA NA NA NA NA NA NA <LOD <LOD
FIELD BLANK NA NA NA 147494 NA NA NA NA NA NA NA NA NA <LOD <LOD
FIELD BLANK NA NA NA 147689 NA NA NA NA NA NA NA NA NA <LOD <LOD
FIELD BLANK NA NA NA 147624 NA NA NA NA NA NA NA NA NA <LOD <LOD
FIELD BLANK NA NA NA 147617 NA NA NA NA NA NA NA NA NA <LOD <LOD
FIELD BLANK NA NA NA 147480 NA NA NA NA NA NA NA NA NA <LOD <LOD
FIELD BLANK NA NA NA 147695 NA NA NA NA NA NA NA NA NA <LOD <LOD
FIELD BLANK NA NA NA 147721 NA NA NA NA NA NA NA NA NA <LOD <LOD
FIELD BLANK NA NA NA 147491 NA NA NA NA NA NA NA NA NA <LOD <LOD
Page 46
Delivering on the Nation’s promise: Safety and health at work for all people through research and prevention.
To receive NIOSH documents or other information about occupational safety and health topics, contact NIOSH at
1-800-CDC-INFO (1-800-232-4636)
TTY: 1-888-232-6348
E-mail: [email protected]
or visit the NIOSH Web site at www.cdc.gov/niosh
For a monthly update on news at NIOSH, subscribe to NIOSH eNews by visiting www.cdc.gov/niosh/eNews
SAFER ● HEALTHIER ● PEOPLE