in-depth sphingomyelin characterization using electron ... · in-depth sphingomyelin...
TRANSCRIPT
1
In-depth Sphingomyelin Characterization using Electron Impact Excitation of
Ions from Organics (EIEIO) and Mass Spectrometry
Takashi Baba1, J. Larry Campbell
1, J. C. Yves Le Blanc
1 and Paul R. S. Baker
2
1SCIEX, 71 Four Valley Dr., Concord, Ontario L4K 4V8, Canada
2SCIEX, 1201 Radio Rd, Redwood Shores, California, USA
Correspondence: Takashi Baba [email protected]
Phone: 289982 2233 Fax: 905 660 2623
Running title: EIEIO on sphingomyelins
Abbreviations:
EIEIO: Electron Impact Excitation of Ions from Organics
by guest, on August 7, 2018
ww
w.jlr.org
Dow
nloaded from

2
Abstract
Electron impact excitation of ions from organics (EIEIO), also referred to as electron induced
dissociation (EID), was applied to singly charged sphingomyelin (SM) molecular species in the
gas phase. Using electrospray ionization and a quadrupole time of flight mass spectrometer
equipped with an electron-ion reaction device, we found that SMs fragmented sufficiently to
identify their lipid class, acyl group structure, and the location of double bond(s). Using this
technique, nearly 200 SM molecular species were found in four natural lipid extracts: bovine
milk, porcine brain, chicken egg yolk, and bovine heart. In addition to the most common
backbone, d18:1, sphingosines with a range of carbon chain lengths, sphingadienes, and some
sphinganine backbones were also detected. Modifications in natural SMs were also identified,
including addition of iodine/methanol across a carbon-carbon double bond. This unparalleled
new approach to SM analysis using EIEIO-MS shows promise as a unique and powerful tool for
structural characterization.
Key words:
Mass spectrometry, sphingolipids, lipidomics, lipids/chemistry
Electron induced dissociation
by guest, on August 7, 2018
ww
w.jlr.org
Dow
nloaded from

3
Introduction
Sphingomyelins (SM) comprise a class of lipids within the sphingolipid category that are found
ubiquitously in the human body but are enriched in brain lipids where they play a crucial role in
insulating nerve cell axons. This class of lipid is also found in relatively high concentrations in
cell membrane microdomains termed lipid rafts, which are believed to be involved in diverse cell
functions such as cell trafficking, cell signaling, lipid-protein interactions and apoptosis (For a
general review of sphingomyelin, see references 1-2). The use of electrospray ionization (ESI)
mass spectrometry to fully characterize the diverse SM molecular species has proven to be
challenging.3,4
Structural elucidation of SM using collision-induced dissociation (CID), a
commonly used fragmentation method for lipid analysis, is limited due the low-energy collisions
(<100 eV) and generally only provides information regarding lipid class, carbon chain length and
the total number of double bonds that comprise the lipid backbone and the acyl group.3
Molecular species-specific information such backbone type (sphinganine, sphingosine and
sphingadiene with different carbon chain lengths) and the structure of the amide-linked acyl
chains (i.e., carbon chain length and the number and stereo-configuration of double bonds) are
not provided in a typical CID MS/MS spectrum. The analysis of glycerophospholipids by CID
also provides limited structural information and requires polarity switching to identify both the
phospholipid class and the fatty acid composition.5-7
In order to fully characterize the structure of
lipids, a different fragmentation technique is needed. Recently, Campbell and Baba reported a
“nearly” complete identification method of phosphatidylcholines8 using electron induced
dissociation (EID) or electron impact excitation of ions from organics (EIEIO)9 in a branched
radio-frequency (rf) electron-ion reaction device.10
(referred to as ExD cell in this work). Using
EIEIO to fragment glycerophospholipids, information regarding lipid class (or head group), acyl
by guest, on August 7, 2018
ww
w.jlr.org
Dow
nloaded from
4
chain length, the number and location of double bonds, and the regioisomeric structure were
obtained in a single experiment in the positive ion mode. Using an alternative fragmentation
method, Deimler and coworkers recently reported a radical induced dissociation of PCs using
bombardment of metastable helium atoms (MAD-MS).4 These reports on novel approaches to
structural elucidation of glycerophospholipids suggest that characterization of other lipid
categories such as SM may be improved by alternative fragmentation strategies to CID.
In this study, we applied EIEIO to SM structural characterization using a branched ion
trap10
installed in a quadrupole TOF mass spectrometer with a differential mobility spectrometry
cell (DMS; SelexIONTM
Technology) installed between the ion source and the mass
spectrometer.11-13
The DMS was used to isolate SM from other interfering lipid classes, namely
PCs and triacylglycerols (TAGs), prior to analysis. This is particularly important because SMs
and PCs share the same head group (i.e., phosphocholine) and are roughly in the same mass
range. Using DMS to isolate the SM, we obtained nearly 200 EIEIO based MS/MS spectra on
individual SM molecular species in various biological lipid extracts without isobaric interference
from other lipid classes or categories, which generated in-depth structural details, including the
sphingolipid backbone length and number of double bonds, acyl chain structure including carbon
chain length, and the number and locations of double bond(s). Additionally, the fragments
appeared in the product ion spectrum that enabled differentiation between sphinganines (SMs
that have no carbon-carbon double bond in the sphingoid backbone), sphingosines (SM that have
one carbon-carbon double bond in the sphingoid backbone), and sphingadienes (SM containing
two carbon-carbon double bonds in the sphingoid backbone). Consequently, EIEIO yields “near-
complete” characterization of SM molecular species.
by guest, on August 7, 2018
ww
w.jlr.org
Dow
nloaded from

5
Experiments
Samples
All lipid standards and lipid mixtures were purchased from Avanti polar lipids, Inc. (Alabaster,
Alabama) and are identified here using the guidelines of Liebisch and co-workers.14
The specific
lipid molecular species SM(d18:1,12:0), PC(16:0,18:1(9Z)) were used for method validation.
Commercial extracts of SM derived from porcine brain (brain SM), bovine milk (milk SM) and
chicken egg (egg SM) were used to characterize SM from biological sources, and bovine heart
extract (BHE) was used as a complex biological extract. Solvent for all working solution was
HPLC-grade dichloromethane (DCM): methanol (MeOH) (50/50, v/v) with 10 mM ammonium
acetate. These solvents and ammonium acetate were purchased from Caledon Laboratory
Chemicals (Georgetown, Ontario) and Sigma-Aldrich Canada Co. (Oakville, Ontario),
respectively. Concentrations of working solution were 250 µg/mL for BHE, 100 µg/mL for brain
SM, milk SM and egg SM, and 1 µg/mL for the standard SM and PC samples.
DMS-ECD-TOF Mass spectrometer
All experiments were conducted using a modified TripleTOF® 5600 system (Sciex) that was
equipped with both a DMS device and a branched rf ExD cell (Figure 1).10
The fundamental
behavior of DMS and its application to lipid analysis is described elsewhere.11-13
Briefly, the
DMS cell is mounted in the atmospheric pressure region between the ESI source (held at +5,000
V) and the spectrometer’s sampling orifice. The DMS operating parameters were optimized to
isolate SM ions from potential isobaric interferences from ionized PCs and TAGs (vide infra).
These parameters included a DMS cell temperature of 200 °C, nitrogen (99.999%) as the curtain
gas (transport gas for the DMS cell), and addition of isopropanol to the curtain gas at 1.5% (v/v)
by guest, on August 7, 2018
ww
w.jlr.org
Dow
nloaded from
6
as a chemical modifier. For the DMS experiments, the separation voltage (SV) was held at an
optimum value (3900 V peak-to-peak) while the compensation voltage (CV) was scanned from
−5 V to +20 V in 0.25-V increments. At each increment of CV, MS or EIEIO-MS spectra were
recorded.
The configuration of the ExD cell was reported previously.8,10
To cool the ions in the
device, helium buffer gas was introduced with a partial pressure in the ExD cell of ~3 mTorr.
This is the same pressure in Q2 due to the 5-mm diameter holes present in the IQ2B electrode
that provide efficient gas conductance. The electron beam used in the EIEIO experiments was
generated by a yttria coated iridium disk cathode (ES-525, Kimball Physics, NH). The cathode
was operated at the space charge limit of the electron cloud in the ExD cell by a direct current
(DC) power supply in constant voltage mode. The kinetic energy of the electron beam (KEe) was
controlled by biasing the cathode negatively to the branched ion trap electrodes.
Simultaneous trapping mode10
was mainly used in this work to enhance the production
and detection of EIEIO fragment ions. In simultaneous trapping mode, ions were irradiated by
the electron beam as ions were injected into the ExD cell (i.e., electron beam was applied when
IQ2A lens was set at open and IQ2B was closed). All of the ions remaining in the ExD cell after
the EIEIO reaction were subsequently injected into Q2 and beyond (i.e., the TOF pusher region)
for mass analysis by opening the IQ2B lens for 1 ms. In contrast, trapping mode is a
conventional scan function in which electron beam irradiates the trapped precursor ions.
For some SM species, background subtraction of their EIEIO mass spectra was
performed to augment detection of those species in the presence of low-level background
chemical interferences (vide infra). To accomplish this, we first recorded an EIEIO mass
spectrum without adding SM analyte ions to the ExD cell; as a result, only hydrocarbon-based
by guest, on August 7, 2018
ww
w.jlr.org
Dow
nloaded from

7
background molecules in the ExD cell (presumed to arise from roughing pump oil
contamination) were ionized. Next, SM analyte ions were admitted to the ExD cell and EIEIO
was performed, resulting in a mixture of fragment ions derived both from the SM as well as the
hydrocarbon chemical noise. However, background subtraction (removing the chemical noise-
derived EIEIO peaks from the SM-derived mass spectrum) improved the analysis of the low-
abundance SM species tremendously. This characterization of the chemical noise in the ExD cell
was obtained every ~30 min during EIEIO experiments.
In order to perform collision-induced dissociation (CID), voltages on the two lens
electrodes of the ExD cell (IQ2A and IQ2B) were set to allow precursor ions to be injected into
the Q2 collision cell. Here, the electron beam was turned off, and nitrogen gas was introduced
into Q2 (and the ExD cell) as a collision gas. In order to apply kinetic energy to isolated ions, the
upstream ion path before the IQ2A was biased 60-90 V to the ExD cell-Q2 assembly. The ExD
cell was controlled by in-house software coded using LabView (National Instruments Co.,
Austin, Texas).
Results and Discussion
Like PCs, SMs yield rich EIEIO fragment ion spectra
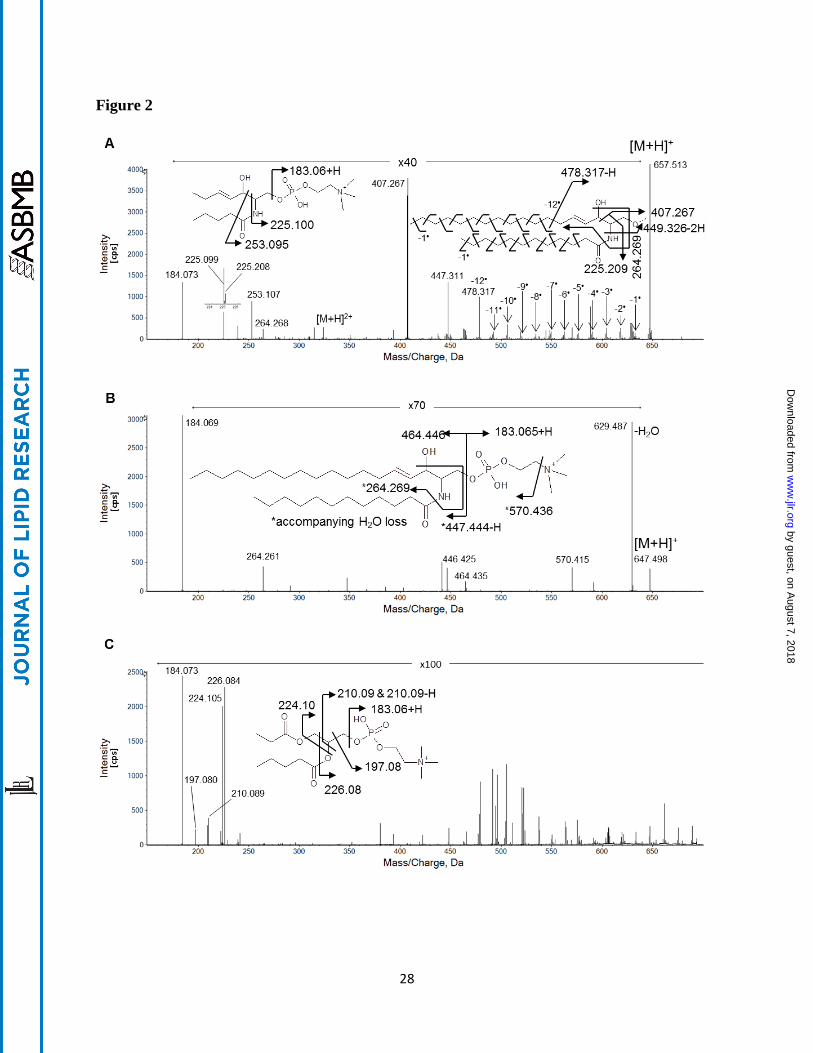
In initial experiments, EIEIO (KEe = 10 eV) was applied to a synthetic standard, SM(d18:1,12:0)
(Figure 2A), and the resulting spectrum was rich enough in diagnostic fragment ions to provide
near complete structural characterization for this SM molecular species. In the spectrum, the
following specific regions of this EIEIO spectrum contained information on SM structural
features: (m/z 180-260) SM head group fragments and dual chain loss fragments; (m/z 400~500)
SM backbone cleavage, with losses of the acyl group and the head group present; (m/z > 400)
by guest, on August 7, 2018
ww
w.jlr.org
Dow
nloaded from

8
fragments from both carbon chains with a weaker, yet complete, fragment series for the carbon-
carbon bond cleavages. In contrast, CID spectra acquired on the same instrument (Figure 2B)
contained fewer fragment ions and much less structural information, which only identified the
head group (m/z 184) and the chain length of sphingosine backbone (m/z 264).3 As expected,
CID did not produce fragments containing information on the backbone nor the acyl group.
Optimization of the electron kinetic energy (KEe) utilized for EIEIO
The selection of the optimum level of electron kinetic energy (KEe) was essential for SM
analysis using EIEIO, as we observed during our study on PCs.8 Besides overall EIEIO
fragmentation efficiency, we sought to optimize signals to obtain the clearest chain fragment
profiles with their characteristic radical and non-radical products. For the case of SMs, we chose
SM(d18:1,18:0) from a brain extract as a model compound to optimize KEe, paying particular
attention to the diagnostic fragmentation around the sphingosine backbone near the head group
and the acyl chain. EIEIO spectra were recorded while ramping the KEe (Figure 3), revealing
each fragment ion’s KEe dependence. While the majority of fragments shared a common
threshold of ~5-6 eV, one exception was the acyl validation peak (head group loss and backbone
cleavage between C2 and C3), which had a threshold ~9 eV. To obtain optimal signal intensity
and information quality for the acyl validation fragments, there was a need to compromise
between overall signal intensity and information quality at KEe values. For example, when KEe
was set >10 eV, EIEIO spectra were unacceptable for identifying SMs, because (1) the acyl
chain fragmentation simply became too extensive, making structural interpretation unduly
complex, just like PC case8, and (2) electron ionization (EI)-based chemical noise (from
ionization of background contaminants) was drastically increased. In some cases, background
by guest, on August 7, 2018
ww
w.jlr.org
Dow
nloaded from

9
chemical noise was still present in EIEIO spectra, but we established a protocol for such
instances (vide infra). Thus, we set KEe = 10 eV for the SM analyses, thereby obtaining signals
with good S/N for EIEIO spectra accumulated for periods ranging from a few seconds to several
minutes (depending upon precursor SM signal intensity).
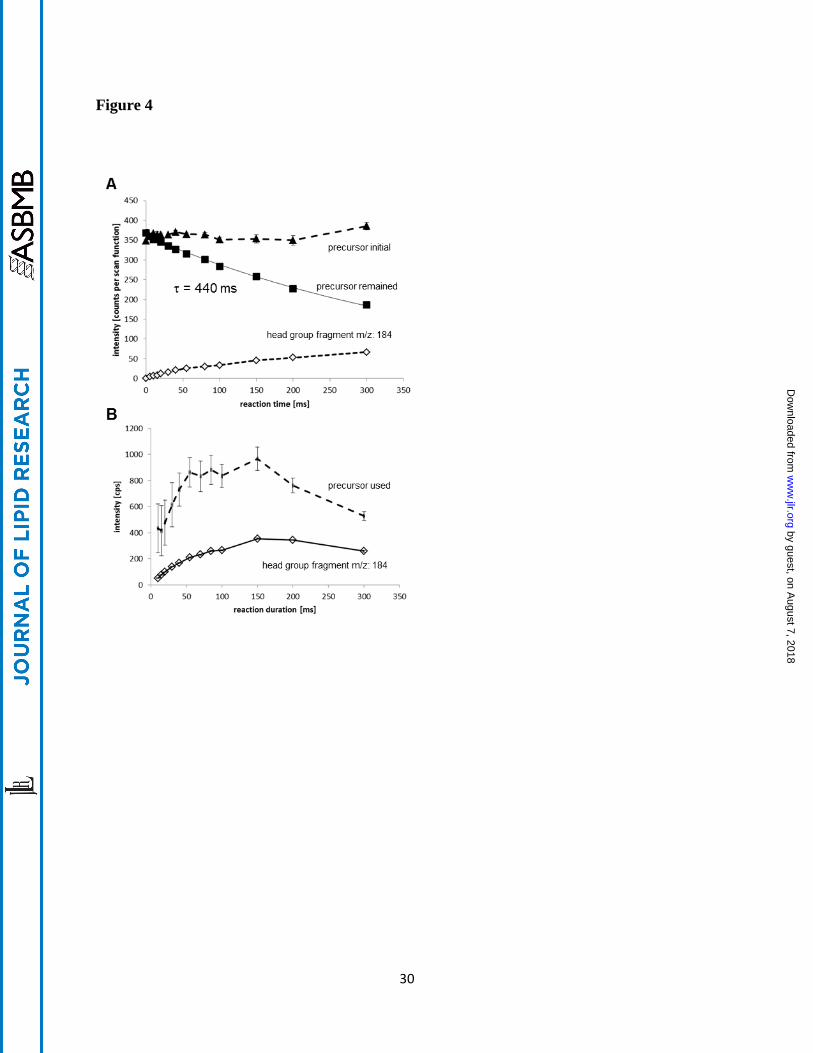
EIEIO reaction speed for SM analysis
Figure 4A shows the fragmentation reaction speed at KEe of 10eV when electron beam intensity
was at its space charge limit (i.e., reaction speed was not improved by increasing the heater
current applied on the electron emitter). Conventional trapping mode was used in this
measurement instead of the continuous trapping mode in order to define reaction time between
electrons and ions. Isolated precursor ions were introduced into the ExD cell for 100 ms without
electron beam. After ion loading, IQ2A lens was closed before the electron beam was applied.
The electron irradiation time, or reaction time, was the variable parameter of this
measurement. The trapped ions were released from the ExD cell into the TOF mass analyzer by
opening IQ2B after electron beam irradiation was terminated. Precursor ion intensity before
electron irradiation, precursor ion intensity after electron irradiation, and the head group
fragments were shown in the Figure. Reaction of SMs was slower than was previously reported
for PC8, typically 1/5 in the same instruments. The mechanism that explains the reaction rate
difference between SM and PC is not clear, but interaction cross section between the ions and
electrons can be significantly different.
Rapid SM analysis can be achieved using simultaneous trapping mode as has been shown
for PCs,8 as well as for ECD of peptides and proteins.
10 Figure 4B shows precursor ion
consumption and product yield in simultaneous trapping mode, which was the primary method
by guest, on August 7, 2018
ww
w.jlr.org
Dow
nloaded from

10
used in this work. When irradiation time was increased, a maximum product yield was achieved
at 150 ms.
EIEIO provides a generalized identification method for SMs
The EIEIO-based fragmentation pattern observed during the analysis of SM(d18:1,12:0)
provides a good generic case for characterizing SMs, with the m/z values of the diagnostic peaks
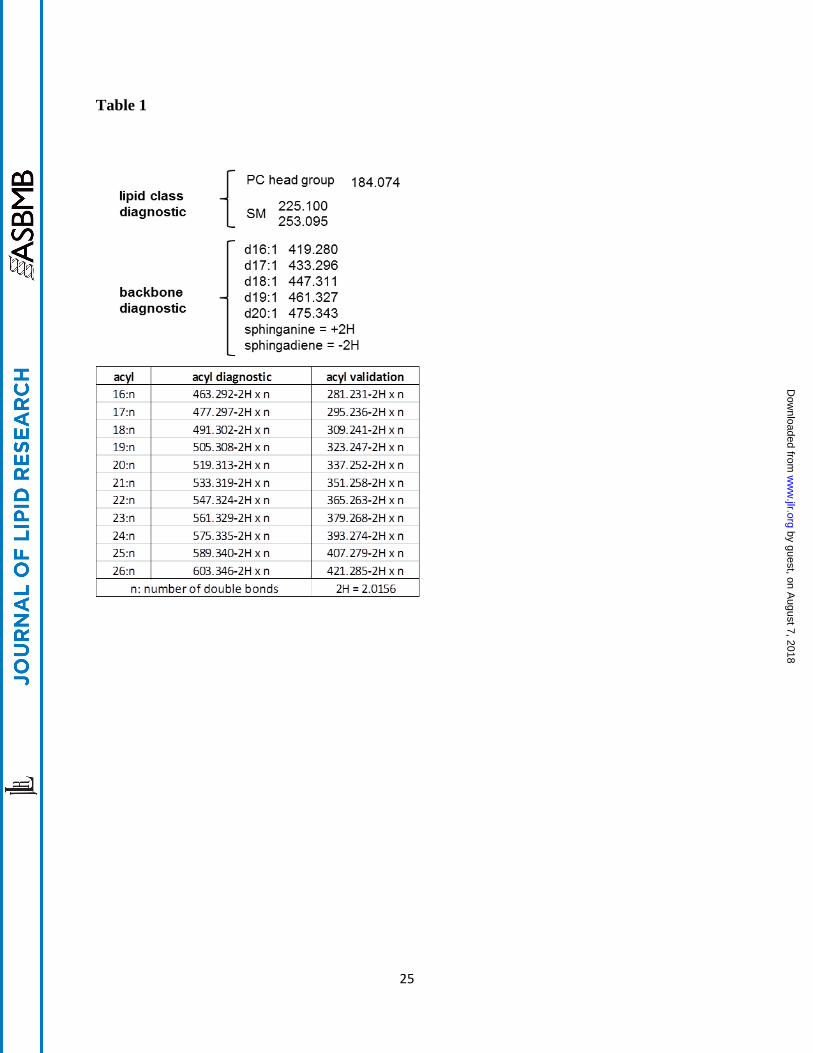
appearing in the EIEIO spectra shown in Table 1. The intense peak at m/z 184.074 indicates the
presence of a phosphocholine head group in the lipid, which is used often to identify either PCs
or SMs by traditional CID methods. In those workflows, SMs are only distinguished from PCs
by the fact that SM precursor ions are of odd nominal m/z and even for PCs due to the Nitrogen
Rule. However, this may not be the case if an SM exists in a modified form; alternatively, an SM
could be present in low abundance within the isotope envelope of an interfering PC (e.g., the 13
C
isotope of a PC would be present as an odd m/z ion, possibly masking a monoisotopic form of
SM). The latter issue can also be abrogated by the use of DMS separations (vide infra).
Fortuitously, EIEIO provides additional SM diagnostic fragment ions at m/z 225.100 and
253.095 (Figure 2A, Figure 3) not displayed by PCs, which instead provide diagnostic fragments
at m/z 224.104 and 226.083 (Figure 2A and C). This results in product ion spectra that can be
clearly attributed to SM, and enabled us to ascribe specific diagnostic fragments to SM
molecular species in standards as well as complex biological lipid extracts without the need for
chromatographic separation .12
EIEIO of SMs also yielded diagnostic fragment ions resulting from bond cleavage around
the branching point on the SM backbone (Figure 3). These fragment ions (e.g., m/z 449.326-2H
= m/z 447.311 in Figure 2A) are unique to SM molecular species and are useful, especially in
cases where less common SM forms are present, such as sphingosines with odd numbers of
by guest, on August 7, 2018
ww
w.jlr.org
Dow
nloaded from

11
carbons, sphingadienes, and sphinganines. The acyl chain diagnostic peaks (Table 1) are easy to
locate in EIEIO spectra as they are often the most intense peaks located mid-range (m/z ~200-
500) in an EIEIO spectrum. For example, the fragment ion of m/z 407.264 in Figure 2A is an
example of such an acyl chain diagnostic peak. An additional acyl chain diagnostic peak (m/z
225.269 in Figure 2A) was used for supplemental diagnostics to confirm the acyl chain. Here, we
identified four peaks to identify the two chains in this SM molecular species, and these backbone
and acyl chain fragments are consistent with a reconstructed SM precursor and its measured
precursor m/z.
This set of simple diagnostic rules was encoded for post-acquisition data analysis using
LabView. Multiple isomeric SMs were often found in a single EIEIO spectrum (e.g.,
SM(d18:1,16:0) and SM(d19:0,15:1)) as they share identical precursor m/z values. However,
while these isomers can share backbone and acyl diagnostic peaks, the presence of the other
characteristic EIEIO fragment ions verified the presence of multiple isomers in those
experiments. Data analysis also identified double bond locations from the pattern of the chain
region using the same concept that has been previously reprted8 (i.e., -2H mass shift at the
double bond location and characteristic intensity profile with “V shape” in the EIEIO spectrum).
While automatic identification of double bond position using these criteria was relatively facile
for PCs, this was not always the case for SMs, where the classic “V shape” intensity profile was
not always evident. Consequently, an assumption was made that an acyl chain with double bonds
has one of ω-3(or n-3), ω-6 (n-6), ω-7 (n-7) or ω-9 (n-9) forms with two carbon-carbon single
bond spacing in cases of polyunsaturated. In cases of sphingadiene backbones, the second double
bond position was easily identified at ω-4(n-4) as the common location.15
by guest, on August 7, 2018
ww
w.jlr.org
Dow
nloaded from

12
Optimal EIEIO characterization of SMs from natural extracts benefits from DMS
When applying EIEIO to characterize SMs in more complex lipid extracts, the challenge of
isobaric interference can be addressed by using an orthogonal means of separation. In this study,
we employed differential mobility spectrometry (DMS) to enhance the performance of EIEIO
during this infusion-based lipidomics workflow, whereby DMS isolates SM from other
potentially interfering lipid classes, namely PCs and triacylglycerols (TAGs), prior to EIEIO
analysis. This scenario is particularly relevant when surveying the total lipid profile of bovine
heart extract (BHE) (Figure 1B) using ESI. The resulting mass spectrum contains multiple lipid
classes and categories, including PE, PC and TAG, with SM present at less than ~1% to the total
lipid signal (Figure 1C)
Using optimized DMS voltages for selective transmission of SM (vide infra), the SM
component of the BHE was easily identified (Figure 1D). The optimization of the SM-specific
DMS parameters was performed using the standard sample SM(d18:1,12:0), as well as SMs from
brain, egg yolk, and milk extracts. In addition, to protonated SMs, we also observed sodiated
SMs among the precursor ions (~10%). The procedure for optimizing the DMS parameters is
very straightforward. First, the separation voltage (SV) was set to 3900 V, where good separation
of lipid classes has previously been demonstrated.12
Then, as compensation voltage (CoV) was
scanned from -5V to +15V (in 0.2V increments, typically), full-scan TOF MS data were acquired
for each step in CoV. Then, the signal from each m/z value corresponding to a known SM
species could be extracted as a function of CoV, providing profiles where optimal DMS
transmission of SM occurred. In this case, a CoV set to +9 V provided good separation of SM
from other lipid classes and categories, as demonstrated by the DMS-dependent MS spectra
recorded only at CoV = +9V. These filtered signals provided MS/MS targets that were 1/10,000
the base peak intensity of the unfiltered (no DMS) full-scan mass spectra. With DMS engaged,
by guest, on August 7, 2018
ww
w.jlr.org
Dow
nloaded from

13
we employed ion accumulation times of 1 s for a single TOF spectrum and 60-360 s for
individual MS/MS spectra.
With DMS filtering engaged to transmit SM-based ions selectively, the study of SM
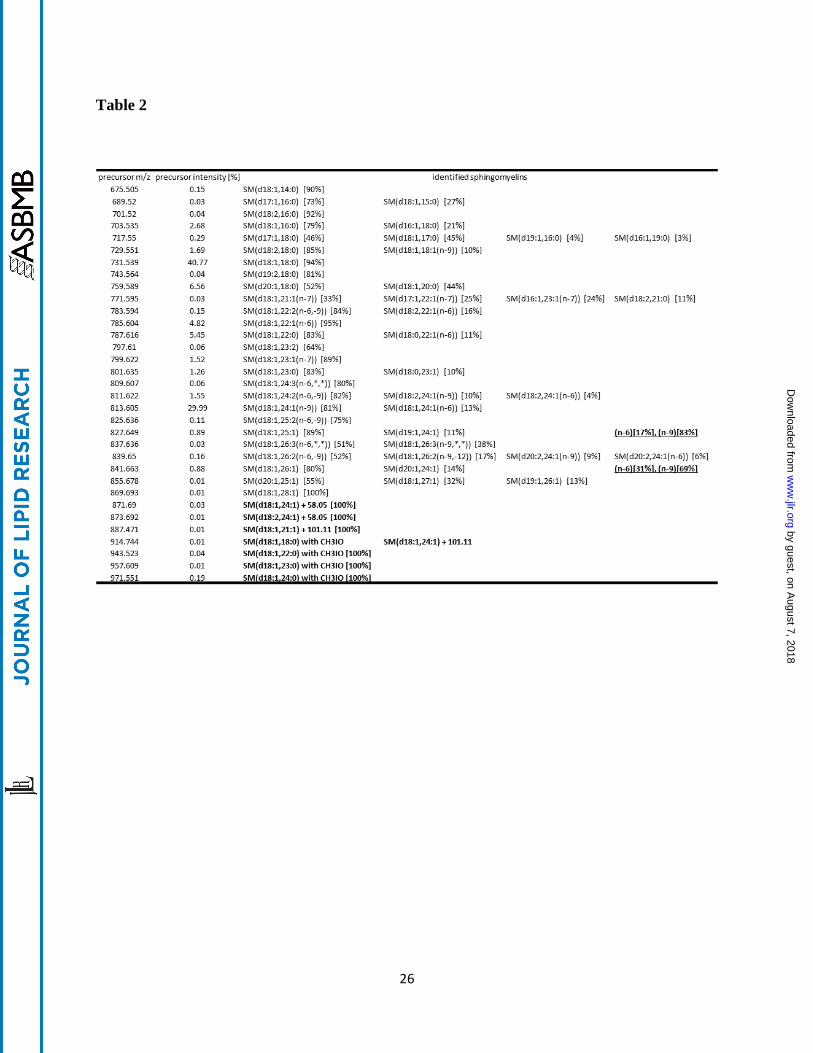
profiles for a variety of biological lipid extracts was greatly enhanced. Figure 5 shows an MS
spectrum obtained during the analysis of brain SM, with the identified SMs from the resulting
EIEIO experiments listed in Table 2. The percentages reported in Table 2 represent each
identified SM isomers relative contribution to the overall signal produced by that precursor m/z
ion. The % value following each identified SM represents the intensity ratio of the acyl
diagnostic peaks in the same precursor m/z as an indicator of expressed ratio. Results of other
SM sources are shown in supplemental information (Figure SI-1,2,3).
A typical spectrum of sphingadiene SM is shown in Figure 6A, which is found in bovine
brain SM. The backbone diagnostic peak was identified at m/z 445, which clearly indicates the
backbone is sphingadiene. The second double bond location was identified at the n-4 site. Figure
6 B and C are the examples of SMs that had one double bond and two double bonds in the acyl
groups, respectively.
Backbone and acyl constituents
Abundant sphingosines and some sphingadienes were observed in all the extracts, but the
sphinganine backbone was only observed in the bovine brain and milk SM (Figure SI-4). The
predominant molecular species were d18:1, which is conventionally recognized, i.e., ~90 % of
sphingosine backbones were d18:1 in brain, egg and BH, but only 43 % were d18:1 and another
30% were d16:1 in milk. Chain lengths from 16 to 20 including odd number of carbons were also
detected in brain, milk and BH. Sphingadiene exists less than a few % in brain, egg and BH, but
by guest, on August 7, 2018
ww
w.jlr.org
Dow
nloaded from

14
it was more significant in milk (10 %). Although odd-chain fatty acids in mammalian systems
are generally not considered, cows are ruminants and hence have extensive bacterial biomes in
their digestive tract that can produce odd-chain fatty acids and be incorporated into the cow
lipidome.
Acyl chains expressed in each SM are shown in Figure SI-4. The identified profile of
abundant acyl chains using this EIEIO method showed good agreement to the fatty acid
distribution given by the vendor.17
Modified SMs in brain SM
The brain SM contained a great variety of SM molecular species derived from the numerous
combinations of different sphingoid backbones and acyl groups, but this sample also showed
existence of SM molecular species containing unique chemical modifications. The most
prevalent irregular SM molecules found in these studies had precursor ion masses of m/z
914.775, 943.523, 957.609 and 971.551. A significant differentiating characteristic of these
peaks, compared to the majority of SM molecular species, is their precursor masses that are 0.1
amu smaller than standard SM molecular species. These molecules are clearly SM, because all
lipid class diagnostic peaks for SM are clearly observed, but the acyl group and backbone masses
are inconsistent with the results in table 1. The -0.1amu difference suggests the molecules have
an unusually heavy atom in their structures. In their EIEIO and CID spectra, an abundant neutral
loss of m/z 126.903+H was observed. This mass is exactly the same as that of an iodine atom.
The EIEIO spectra showed further consecutive neutral losses from the iodine loss: those
corresponding to losses of, CH3 and O. Detailed analysis of the chain fragments shows an iodine
atom and a methoxy group are attached to double bonds present in unmodified SM (Figure 7A-
by guest, on August 7, 2018
ww
w.jlr.org
Dow
nloaded from

15
C). The iodine modification was found at the methyl terminal side and the methoxy group was at
the head group side in all four precursor cases. Interestingly, double bond in sphingadiene
backbone (n-4) was modified in the case of m/z 914.775.
The source of iodinated SM is unclear. It is certainly possible that the iodine and
methoxy group adducts are artifactually generated. Indeed, iodine is traditionally used to detect
double bonds in lipid analysis.18
To evaluate the structural characteristics of SM that has reacted
with adventitious iodine, SM extracts were exposed to iodine and methanol vapor. However,
from this process, we did not find any evidence of SM molecular species containing iodine or
methoxy group adducts despite the fact the SM mixture was replete with SM molecular species
with acyl chains containing carbon-carbon double bonds. Instead, replacement of a hydrogen by
an iodine was observed as the main process (Figure SI-5). Dual iodine adduct reaction at a
double bond, which is often used for estimation of double bond number (known as iodine
number), was also observed, but it was 1/100 weaker than the hydrogen replacement by an
iodine atom. From these observations, we can conclude that the iodinated SM found in bovine
brain extracts is not formed via a typical iodine addition across a double bond. In the context of
a biological reaction mechanism, it is interesting that this iodine-methoxy type of modification
was observed only in brain, which is known to have relatively higher levels of iodine than other
tissues (with the exception of the thyroid).19
Further studies that are outside the scope of this
report are needed to identify the mechanism of the iodine-methoxy adduction. However, it
should be noted that this new methodology has the analytical power to analyze such unknown
modifications.
by guest, on August 7, 2018
ww
w.jlr.org
Dow
nloaded from
16
The potential of high-throughput lipid structural characterization using DMS-EIEIO-TOF
MS
In this study, EIEIO spectra were accumulated for a long duration (2-5 min) to obtain high
quality spectra to survey EIEIO characteristics on sphingomyelins with no concern about ion
statistics and S/N. For high throughput analysis, such as LC-MS measurements, much shorter
accumulation should be applied. To identify the diagnostic peaks, the peak intensities should be
above at least the detection limits given by noise fluctuation. Theoretical minimum accumulation
time was calculated using the stored multiple EIEIO spectra accumulated every second in BHE.
Minimum accumulation time can be defined as the time when intensities of all diagnostic peaks
becomes higher than the detection limits, which is a triple of the standard deviation of the EI
noise at the same m/z of each diagnostic peak (Figure SI-1). Though the intensity of SMs in BHE
were not strong because SMs were minor components in the total lipids, the accumulation for a
typical LC time scale (a few sec) is sufficient to identify many SM molecular species. Longer
accumulation than LC time scale will be required for lower concentrated species typically lower
than 0.1µM, but infused measurements will also be promising like this work because DMS
separates SMs from other lipid classes efficiently without the need for chromatographic
separation.
Conclusion
The combination of DMS and EIEIO MS is a promising tool for sphingomyelin analysis. Lipid
class, backbone structure and acyl chains characterizations are clearly identified using
fragmentation information in a single EIEIO spectrum. This method also revealed the power to
identify unknown modifications in SM molecular species. While previous studies employing
by guest, on August 7, 2018
ww
w.jlr.org
Dow
nloaded from

17
atmospheric-pressure chemical ionization (APCI) have shown promise in characterizing SMs20,21
,
their findings have been limited to identifying intact species (Brutto level identification) and
inferring FA composition from limited information derived from MS/MS spectra. As noted
previously, APCI must be employed as ESI-MS/MS can provide little to no structural
information for SMs – only confirmation of the phosphocholine head group at m/z 184. In
addition, these studies must rely upon separation by liquid chromatography for sample
simplification (due to in-source fragmentation from APCI), requiring additional analysis time
and resources. In comparison, the DMS-EIEIO workflow for characterizing SMs requires no
chromatographic separation, and provides much greater in-depth structural analyses of these
biologically valuable lipid biomarkers.
Acknowledgement:
The authors would like to thank Dr. James Hager (Sciex) for helpful discussions.
Notes:
The authors declare no competing financial interests. For research use only. Not for use in
diagnostic procedures. The trademarks mentioned herein are the property of AB Sciex Pte. Ltd.
or their respective owners. AB SCIEXTM
is being used under license. © 2016 AB SCIEX.
SUPPORTING INFORMATION AVAILABLE
by guest, on August 7, 2018
ww
w.jlr.org
Dow
nloaded from
18
References:
1. Slotte, J. P., Biological functions of sphingomyelins. Prog Lipid Res. 2013 52: 424-437.
Erratum in Prog Lipid Res. 2013 52: 681
2. Chakraborty, M., Jiang X. C., Sphingomyelin and its role in cellular signaling Adv. Exp. Med.
Biol. 2013 991: 1-14
3. Shaner, R. L., Allegood, J. C., Park, H., Wang, E., Kelly, S., Haynes, C. A., Sullards, M. C.,
and Merrill Jr., A. H., Quantitative analysis of sphingolipids for lipidomics using triple
quadrupole and quadrupole linear ion trap mass spectrometers J. Lipid Res, 50:, 1692-1707
4. Deimler, R. E., Sander, M., Jackson, G. P., “Radical-induced fragmentation of phospholipid
cations using metastable atom-activated dissociation mass spectrometry (MAD-MS)” Int.l
J.Mass Spectrom., 390: 2015, 178–186
5. Stutzman, J.R.; Blanksby, S.J.; McLuckey, S.A., Gas-Phase Transformation of
Phosphatidylcholine Cations to Structurally Informative Anions via Ion/Ion Chemistry
Anal. Chem. 2013, 85: 3752-3757
6. Ekroos, K., Ejsing, C. S., Bahr, T., Karas, M., Simons, K., and Shevchenko, A., Charting
molecular composition of phosphatidylcholines by fatty acid scanning and ion trap MS3
fragmentation J. Lipid Res.2003, 2181-2192.
by guest, on August 7, 2018
ww
w.jlr.org
Dow
nloaded from
19
7. Pham, H. T., Maccarone, A. T., Thomas, M. C., Campbell, J. L., Mitchell, T. W., and
Blanksby, S, J., Structural characterization of glycerophospholipids by combinations of ozone-
and collision-induced dissociation mass spectrometry: the next step towards “top-down”
lipidomics Analyst 2014, 139:, 204-214.
8. Campbell, J. L., and Baba, T. Near-Complete Structural Characterization of
Phosphatidylcholines Using Electron Impact Excitation of Ions from Organics Anal. Chem.,
2015, 87: 5837–5845
9. Cody, R.B.; Freiser, B.S., Electron impact excitation of ions from organics: an alternative to
collision induced dissociation Anal. Chem. 1979, 51: 547-551
10. Baba, T., Campbell, J. L., Le Blanc, J. C. Y., Hager, J. W., and Thomson, B. A., Electron
Capture Dissociation in a Branched Radio-Frequency Ion Trap Anal. Chem., 2015, 87: 785–792
11. Schneider, B. B., Covey, T. R., Coy, S. L., Krylov, E. V. & Nazarov, E. G. Planar differential
mobility spectrometer as a pre-filter for atmospheric pressure ionization mass spectrometry. Int.
J. Mass Spectrom. 2010, 298: 45-54.
12. Baker, P.R.S.; Armando, A.M.; Campbell, J.L.; Quehenberger, O.; Dennis, E.A. Three-
dimensional enhanced lipidomics analysis combining UPLC, differential ion mobility
spectrometry, and mass spectrometric separation strategies. J. Lipid Res. 2014, 55: 2432-2442.
by guest, on August 7, 2018
ww
w.jlr.org
Dow
nloaded from
20
13. Lintonen, T.; Baker, P.R.S.; Suoniemi, M.; Ubhi, B.; Koistinen, K.; Duchoslav, E.; Campbell,
J.L.; Ekroos, K. Differential mobility spectrometry-driven shotgun lipidomics. Anal. Chem. 2014,
86:, 9662-9669.
14. Liebisch, G.; Vizcaíno, J. A.; Kofeler, H.; Trotzmuller, M.; Griffiths, W. J.; Schmitz, G.;
Spener, F.; Wakelam, M. J. O., Shorthand notation for lipid structures derived from mass
spectrometry J. Lipid Res. 2013, 54: 1523−1530.
15. Barenholz, Y., Thompson, T.E., Sphingomyelins in bilayers and biological membranes
Biochemica et Biophysica Acta 1980 604: 129-158
16. Baba, T., Campbell, J. L., Capturing Polyradical Protein Cations after an Electron
Capture Event: Evidence for their Stable Distonic Structures in the Gas Phase J. Am. Soc. Mass
Spectrom. 2015 26: 1695-1701
17. http://www.avantilipids.com (accessed 29 January 2016)
18. Williams, JR. J.N., Anderson, C. E., D. Jasik A. D., A sensitive and specific method for
plasmalogens and other enol ethers J. Lipid Research, 1962 3: 378-381
19. Delange, F., The role of iodine in brain development, Proc. Nutrition Soc. 59: 2000, 75-79
20. Karlsson, A. Å., Michélsen, P., Odham, G., Molecular species of sphingomyelin:
determination by high-performance liquid chromatography/mass spectrometry with atmospheric
pressure chemical ionization J. Mass Spectrom. 1998 33: 1192-1198
by guest, on August 7, 2018
ww
w.jlr.org
Dow
nloaded from
21
21. Byrdwell, W. C., Perry, R. H., Liquid chromatography with dual parallel mass spectrometry
and 31
P nuclear magnetic resonance spectroscopy for analysis of sphingomyelin and
dihydrosphingomyelin II. Bovine milk sphingolipids J. Chromatogr. A 2007 1146: 164-185
by guest, on August 7, 2018
ww
w.jlr.org
Dow
nloaded from

22
Figure and figure caption:
Figure caption:
Figure 1
A: ESI-Quadrupole TOF mass spectrometer with an electron–ion reaction device (ExD cell) and
a differential mobility spectrometer (DMS) used in this EIEIO experiments. TOF mass
spectrometer is not shown in this figure. B in this figure represents the direction of the magnetic
field to assist electrons traveling along the radio frequency potential minimum. B: MS spectrum
of the BHE total lipid. C: DMS spectrum of Lipid class separation by DMS. Compensation
voltage (COV) was scanned on constant separation voltage (SV). The sample is total lipid in
bovine heart extract (BHE). We optimized the system as the yield of sphingomyelins was
maximized. D: separated sphingomyelin spectrum.
Figure 2
Comparison between dissociation product spectra by EIEIO (A) and CID (B). The sample was a
synthesized standard sphingomyelin, SM(d18:1,12:0). EIEIO spectrum of a phosphatidylcholine
(PC) lipid [1-palmitoyl-2-oleoyl-sn-glycero-3-phosphatidylcholine, or PC (16:0/18:1)] is shown
in (C) as a typical spectrum with the same head group as SM.
Figure 3
Signal intensity of each diagnostic peak on kinetic energy of electrons. Intensities of fragments
were expanded vertically by the values shown in the figure. To obtain good S/N signal the acyl
validation peak (dashed line with round circle markers) and to avoid electron impact (EI)
ionization of residual gas in the ExD cell we have chosen electron energy of 10 eV .
by guest, on August 7, 2018
ww
w.jlr.org
Dow
nloaded from
23
Figure 4
A: reaction rate between singly charged SM and electron beam with kinetic energy of 10 eV in
the conventional trapping mode. The sample was SM(d18:1,18:0) in brain SM. The reaction time
was 440 ms when the electron beam was in space charge limit. B: reaction time optimization in
simultaneous trapping mode to obtain maximum yield of product ions. Consumed amount of
precursor ions (or precursor used in the figure) was defined as subtracted value of remained
precursor intensity after reaction from the initial precursor intensity before reaction. The errors,
mainly the fluctuation of the ion source, were large because of error propagation in the
subtraction. The consumed precursor ions and obtained fragments were maximized at reaction
time of 150 ms.
Figure 5
MS spectrum of porcine brain SM and identified SM. DMS was on to separate protonated SMs
from sodiated SMs, which were ~10 % compared to protonated SMs.
Figure 6
Typical EIEIO spectra observed in porcine brain SM. A: the backbone is a sphingadiene,
d18:2(n-4). B: the acyl chain has a carbon-carbon double bond at n-9 and C: acyl chain has two
carbon-carbon double bonds at n-6 and n-9. [M-H+O2]+
is a product of a radical-ion – neutral
reaction from the hydrogen lost precursor species, which is often observed in ExD16
.
Figure 7
by guest, on August 7, 2018
ww
w.jlr.org
Dow
nloaded from
24
Iodine containing SM observed in brain SM. A: Normal SM(d18:1,24:1(n-9)) and C: iodine
containing SM. The carbon-carbon double bond region is expanded in Figure B. White arrows
indicate backbone fragments from the normal SM. Black arrows indicate acyl group fragments.
2H difference started at n-9 position indicates the double bond location in the normal SM (D). In
the case of the modified SM, fragment series of C(15th position)H, O and CH3 were appeared.
This indicates the modified SM has the structure shown in E.
Table 1
SM diagnostic in EIEIO mass spectrometry.
Table 2
Identified SMs in porcine brain SM shown in Figure 5. Precursor intensity [%] in the table
represents the amount of each precursor in the total lipids, which contains other
impurities. Percent values following identified SMs shown the relative intensities of acyl
diagnostic peaks in the isobaric precursor ions. Total value in each precursor may not be 100%
because of ignoring low intensity species. Underlined double bond locations in m/z 827 and 841
were not de-convoluted mathematically in each sphingomyelins.
by guest, on August 7, 2018
ww
w.jlr.org
Dow
nloaded from


29
Figure 3
OH
NH
OP
O
OH
O
O
N+
184.074
253.095 225.100
backbone diagnostic
acyl diagnostic
acyl validation
PC diagnostic
SM diagnostic
by guest, on August 7, 2018
ww
w.jlr.org
Dow
nloaded from


33
Figure 7
-5
-6
-7
-8
-9
-10
-11
-12
-13
-14
CH O CH3
-O -CH
3
-O -CH
3
-HI -OCH3
-O
d18:1
d18:1
24:1
24:1
24:1 +CH
3IO
A
B
C
573.439
447.311
573.439 731.364 604.456
-I 447.311 843.696
813.685
939.584 829.681
O
I
OH
NH
OP
O
OH
O
O
N+
OH
NH
OP
O
OH
O
O
N+
C=C
[%]
[%] 955.580
D
E
by guest, on August 7, 2018
ww
w.jlr.org
Dow
nloaded from