in albuquerque, new mexico a thesis family …
TRANSCRIPT
KNOWLEDGE, USE, AND ATTITUDES CONCERNING CONSUMER CREDIT CARDS
AND OTHER CREDIT BY HIGH SCHOOL STUDENTS
IN ALBUQUERQUE, NEW MEXICO
by
DEBORAH J. COLEMAN ROGULICH, B.S. in H.E.
A THESIS
IN
FAMILY MANAGEMENT, HOUSING, AND CONSUMER SCIENCE
Submitted to the Graduaté Faculty of Texas Tech University in Partial Fulfillment of the Requirements for
the Degree of
MASTER OF SCIENCE
IN
HOME ECONOMICS
Approved
Accepted
August 1982

ACKNOWLEDGMENTS
The author wishes to express gratitude to Dr. A. William
Gustafson, graduate committee chairman, for his assistance and guidance;
to Dr. E. Carolyn Ater and Dr. Dennis A. Harp, committee members, for
their suggestions and interest; to John and Dorothy Coleman, parents,
for their continuing support and encouragement; and to Andrew Rogulich,
husband, for his assistance in completing the thesis.
11

CONTENTS
ACKNOWLEDGMENTS ii
LIST OF TABLES v
Chapter
I. INTRODUCTION 1
Statement of Objectives 1
Hypotheses 2 Clarification of Terminology 3 Need for Study 4 Nature and Order of Presentation 5
II. REVIEW OF LITERATURE 6
Introduction 6 Families 6 Teenagers 7 Teenagers and School Attendance 10 Youth and Credit 10 Adults and Credit Cards 17 Summary 22 Youth 22 Adults 22
III. METHODOLOGY 24
Introduction 24 Composition of Population 24 Sampling 25 Questionnaire 26 Data Analysis 27 Limitations 27
111
IV. FINDINGS AND INTERPRETATIONS 29
Description of Sample 29 Descriptive Analysis 34 Student Credit Card Use 34 Respondents' Parents' Credit Card Use 39 Consumer Education 41 Knowledge Questions 43 Summated Knowledge Score 45 Student Attitudes 46
Demographic Comparisons 53 Analysis of Hypotheses 53 Hypothesis 1 53 Hypothesis 2 55 Hypothesis 3 58 Hypothesis 4 58 Hypothesis 5 59
V. SUMMARY, CONCLUSIONS, AND RECOMMENDATIONS 60
Summary and Conclusions 60
Recommendations 62
LIST OF REFERENCES 64
APPENDIX: CREDIT CARD SURVEY .67
IV
LIST OF TABLES
1. Demographic Characteristics of Respondents 30
2. Frequency Distribution: Demographics of Parents
of Respondents 33
3. Frequency Distribution: Credit Card Use by Respondents . . 35
4. Frequency Distribution: Credit Card Use by
Parents of Respondents 40
5. Frequency Distribution: Consumer Education 42
6. Frequency Distribution: Credit Knowledge Questions . . . . 43
7. Correlation Analysis: Credit Knowledge Questions 44
8. Frequency Distribution: Summated Knowledge Scores 46
9. Frequency Distribution: Attitude Scores 48
10. Frequency Distribution: Summated Attitude Scores 49
11. Pearson Correlation Analysis: Demographics with
Summated Knowledge, Attitude, and Education Scores . . . . 54 12. Pearson Correlation Analysis: Hypotheses 1 Through 5 . . . 56

CHAPTER I
INTRODUCTION
Statement of Objectives
In the early 1970s research on consumer credit in general and
charge accounts in particular was conducted by Marie Blair and Linda
Ogle. Each suggested that teenagers had a lack of knowledge and under-
standing about the credit they use (2, 19). Consumer credit can include
cash loans, charge accounts, and credit cards of various forms. For
this study regarding credit card use, credit cards include bank cards,
travel and entertainment cards, department store cards, and gasoline
and oil company cards.
Credit cards have grown to be of great importance in consumer
credit. Since many teenagers are using this facet of consumer credit,
it is wise to educate students in its use. If the educator lacks know-
ledge of students' credit experience and information, instruction may
be lacking and may not accomplish the desired goals. A determination
of students' knowledge levels and a plan that will fulfill their unique
educational needs may be necessary for each school system.
Specifically, the objective of this research study was to
determine areas in which students' knowledge of consumer credit is

strong or weak and, thus, where educational efforts should be concen-
trated. Overall, the objective was to support or reject the concept
held by many educators that it is important to educate students concern-
ing consumer credit in general and credit cards in specific.
Hypotheses
The hypotheses were as follows:
1. There was no statistically significant relationship between
the total number of credit cards the student uses and the total number
of credit cards the students' parents use.
2. There was no statistically significant relationship
between whose credit card the student uses and the percentage of the
students' credit card bills that are paid by the student.
3. There was no statistically significant relationship between
the summated knowledge scores of students and the students' use of
credit cards.
4. There was no statistically significant relationship between
the summated knowledge scores of students with and without prior credit
card education. Prior education was defined as having taken a consumer
education class and/or having studied or discussed credit cards for
purchasing goods and/or services.
5. There was no statistically significant relationship between
the attitudes toward saving money by students who do and do not use
credit cards.
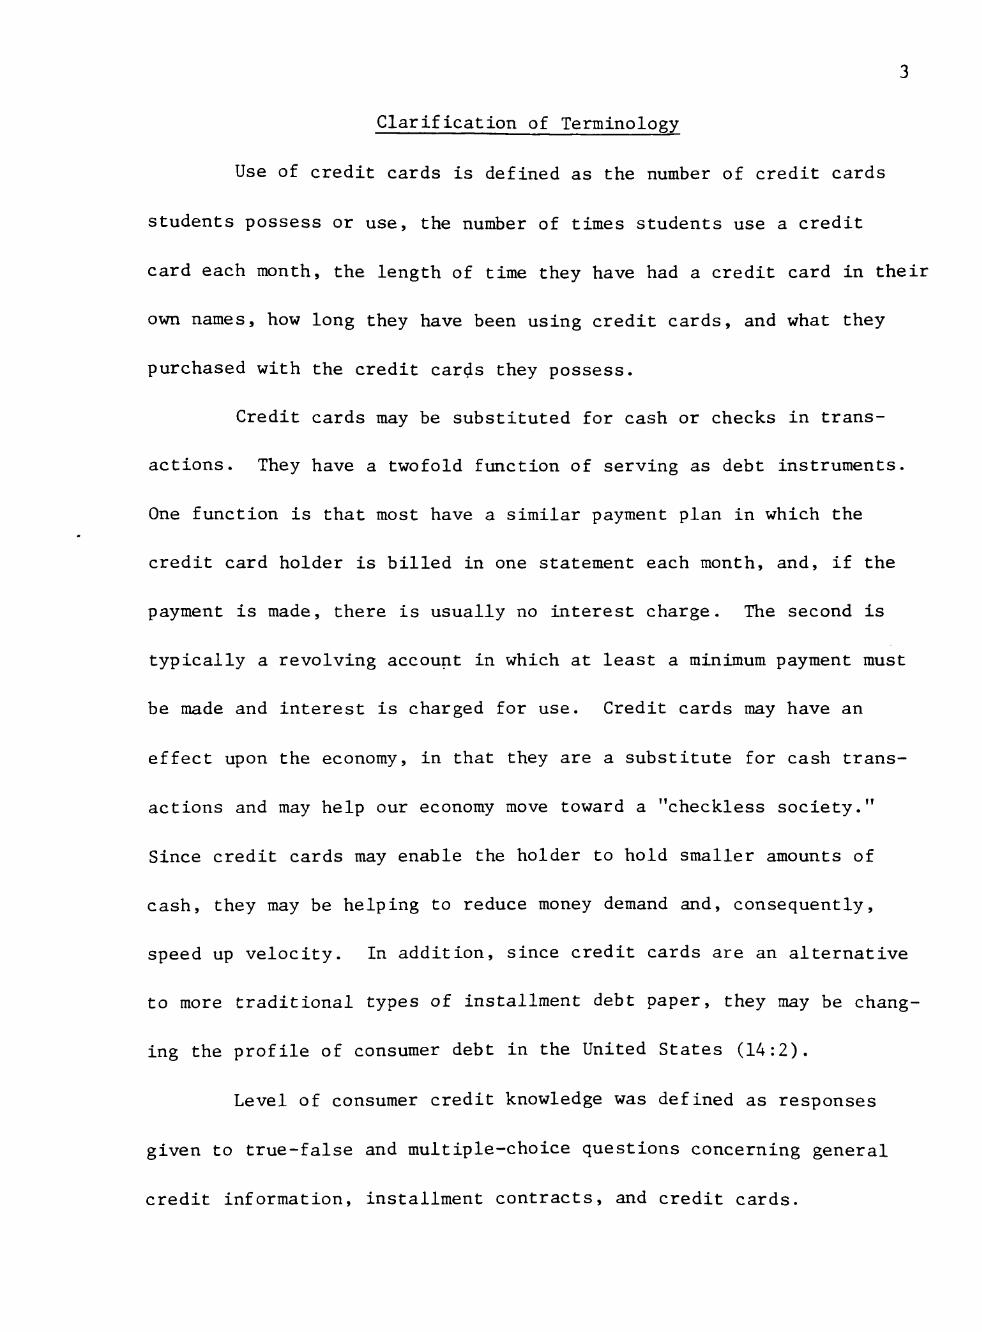
Clarification of Terminology
Use of credit cards is defined as the number of credit cards
students possess or use, the number of times students use a credit
card each month, the length of time they have had a credit card in their
own names, how long they have been using credit cards, and what they
purchased with the credit carcis they possess.
Credit cards may be substituted for cash or checks in trans-
actions. They have a twofold function of serving as debt instruments.
One function is that most have a similar payment plan in which the
credit card holder is billed in one statement each month, and, if the
payment is made, there is usually no interest charge. The second is
typically a revolving account in which at least a minimum payment must
be made and interest is charged for use. Credit cards may have an
effect upon the economy, in that they are a substitute for cash trans-
actions and may help our economy move toward a "checkless society."
Since credit cards may enable the holder to hold smaller amounts of
cash, they may be helping to reduce money demand and, consequently,
speed up velocity. In addition, since credit cards are an alternative
to more traditional types of installment debt paper, they may be chang-
ing the profile of consumer debt in the United States (14:2).
Level of consumer credit knowledge was defined as responses
given to true-false and multiple-choice questions concerning general
credit information, installment contracts, and credit cards.

Consumer attitudes are defined as the attitudes students have
regarding credit, credit cards, and saving money. Specific credit
card attitudes are:
1. Should teenagers be allowed to use credit cards more or
less often?
2. Should they learn about credit cards in school?
3. Do they think credit cards are bad or good, or somewhere in
between?
4. How important are reasons for saving money?
Prior education is defined as having taken a consumer education
class and/or having studied or discussed credit cards for purchasing
goods and/or services.
Need for Study
In a pilot study conducted during April 1979 at Texas Tech
University, students used or possessed an average of five credit
cards, and 59 percent of the sample had used credit cards for more than
one year. When asked the current interest rate charged on credit cards,
26 percent answered correctly, 21 percent answered incorrectly, and 53
percent said they did not know the interest rate. These findings and
others suggest that students may be uninformed about the credit they
are using. They may not realize there are alternatives to credit cards,
the disadvantages and advantages of credit card use, nor understand
what is involved in the alternatives to credit use. Since all
teenagers do not continue their education beyond the secondary level, it
seems most appropriate to provide credit education opportunities at
the high school level.
Nature and Order of Presentation
Included in the following chapters are the review of litera-
ture, explanation of the data collection process, methods of data
analysis, analysis of the hypotheses and other data, conclusions, and
recoramendations for further research. The appendix includes a blank
questionnaire.

CHAPTER II
REVIEW OF LITERATURE
Introduction
The chapter reviews the role of credit in lives of families
and teenagers and teenagers' acquisition and use of money. The term
"teenager" is one lacking a strict definition in research. Often, it
is used to describe a sample which consists of people whose ages are
thirteen through nineteen. High school students, however, are in the
fourteen to eighteen years of age range and are in the ninth through
twelfth grades. In this study the term "teenagers" will be used to
describe any population that includes youth from thirteen through nine-
teen years of age.
Families
Credit plays an important role in our economy. In 1974
Americans spent 17 percent of their take-home pay on installment
credit, and this percentage did not include mortgage payments. Ameri-
cans in 1974 paid for one-half of their retail purchases by some type
of credit cards (22), and it is assumed that this amount has increased
since that time.

Mandell's 1970-1971 study indicated that 50 percent of the
families surveyed had no credit cards, 10 percent had one credit
card, 26 percent had two to five credit cards, and 14 percent had six
or more credit cards (14). In November 1978 it was reported that
credit of almost $23 million was outstanding on commercial bank credit
cards, a 33.6 percent jump over the previous year (6). In U.S. News
and World Report the Federal Reserve Board also reported that from
December 1967 to June 1973, less than six years, the share of all out-
standing consumer credit accounted for by holders of bank credit cards,
travel and entertainment cards, and oil company cards had more than
doubled, rising from 2 percent to 5 percent. The amount owed by bank
card holders increased 546 percent, from $828 million to $5,502 million,
during that six-year period. Travel and entertainment card debt
increased 197 percent, from $61 million to $181 million (10). Accord-
ing to the Federal Reserve Bulletin (September 1973), the bank credit
card debt increased 553 percent from January 1968 to December 1972,
and during the same five-year period, travel and entertainment card
debt increased 169 percent (7). From such data, it can be assumed that
American families and/or households are using credit and that its use
is increasing.
Teenagers
Teenagers are a market segment with large spending power.
Since most students do not have to pay living expenses while at home,

8
most of the income they acquire is available to be spent or saved.
Ogle (19) found that clothing, shoes, groceries, and gasoline were
the primary items purchased by teenagers using credit.
As a result of a study by the U.S. Education Commission, it
was concluded that "seventeen-year-olds are not well-prepared for
their consumer roles as informed citizens, spenders, earners, or
investors." They continued to affirm that the seventeen-year-olds knew
they should be asking more questions and that they did not seem to have
the required knowledge to carry out consumer transactions effectively
(7).
According to one source, the number of fourteen- to eighteen-
year-olds increased from 15 percent of the population in 1960 to 20
percent of the population in 1972, with more than 42 million teens in
1972. During the same twelve-year period, the number of fourteen- to
seventeen-year-olds in school increased from 90 percent to 93 percent
(12).
According to Gilbert Youth Research, Inc., in 1979 the 28
million fourteen- to nineteen-year-olds had $30 billion to spend, much
of which was earned by the teens themselves. One-half of the teenagers
had their own store charge accounts or had the use of one (16). The
Rand Youth Poil in 1978 found that teenagers had $39.1 billion to
spend and that one-half of the $39.1 billion came from their own
earnings (11).

In the Detailed Characteristics of the Census for New Mexico
in 1970, the median income was given for persons who are a relative
of the head of the household, other than the wife. The assumption is
made that in most cases this person is a son or daughter. The median
income for the group of fourteen- to nineteen-year-olds was $728
in 1969 (23:159). In 1977, the median income nationwide for this
group was $1,039 (24:460). The figures do not truly represent the
income of high school students since many eighteen- and nineteen-year-
olds would be out of high school, employed in a full-time job, and
living on their own. However, it does provide some knowledge of the
money teenagers have available.
According to the Rand Youth Poll in 1978, the allowance for
teenagers was as follows: Girls thirteen to fifteen years of age,
$30.00 per month; boys thirteen to fifteen years of age, $29.20 per
month; girls sixteen to nineteen yars of age, $64.40 per month; and
boys sixteen to nineteen years of age, $63.80 per month. The study
also reported that in each of the age groups the teenagers were more
than matching their allowances listed above with earnings of their
own (11).
The importance of youth in America to the retail sales indus-
try, and potentially to the credit card industry, is indicated in a
recent study by Gilbert Youth Research, Inc. It was found that
thirteen- to nineteen-year-olds spent between $5.5 and $6 billion on

10
clothes in 1979. These same teenagers spent almost $5 billion on
records, tapes, films, concerts, and other forms of entertainment (16).
Teenagers and School Attendance
A national longitudinal study of the high school graduating
class of1972 was conducted by the Department of Health, Education, and
Welfare. They reported the percentage of high school students who
participated in postsecondary education from the fall of 1972 through
the fall of 1976, five years later. In the fall of 1972, 54 percent of
the students were in school; in 1973, 45 percent; in 1974, 40 percent;
and in 1975, 37 percent. In 1976 after many students may have gradu-
ated from a postsecondary institution, 25 percent who graduated in 1972
were still in a postsecondary school. These statistics show that just
over one-half of the students who graduated from high school in the
spring of 1972 attended a postsecondary school that fall. By the fall
of 1975, just over one-third were still in school. This suggests that
many students do not continue their formal education in the first five
years after they graduate (25). An opportune time to educate young
people about wise credit use is during their high school years.
Youth and Credit
Cateora (5) stated that "the purpose of this study, therefore,
has been to examine the possible effects of and the extent of influence
from the adolescent's family social status and/or peer group

11
affiliation upon his attitudes toward selected consumer characteris-
tics." For this study, a fifty-minute questionnaire was administered
during the fall of 1961 in a city with a population of 200,000. There
were 189 useable surveys completed by the high school juniors and
seniors. The questionnaire was administered to two groups several weeks
apart, with the two groups combined for analysis.
Through the analysis of the hypothesis it was found that
students' consumer values and goals were related to peer group
affiliation and peer group opinions.
It was found that the students were not price-conscious or will-
ing to shop around, and that they wanted to acquire an abundant package
of consumer goods early in adulthood. The researchers felt that in
other areas of consuming the students had a mature and relatively com-
plete awareness of the art of consuming (5).
Cateora's (5) study is important in that it indicates that the
students' consumer values were most influenced by their peer groups
and not by their family or by their family's social status. The
school was another source of influence since the students were all
exposed to the same information and, thus, it presumably had an effect
on peer group values and opinions.
In 1978, a nationwide study was conducted by the National
Assessment for Educational Progress (NAEP), an independent survey
group of the U.S Education Committee. The purpose was to assess

12
consumer knowledge, skills, and attitudes of a sample of 4,300
seventeen-year-olds. A questionnaire with 201 consumer knowledge ques-
tions was used as the survey instrument.
The NAEP found that the average number of questions answered
correctly was 57 percent. Twenty-five percent of the students knew
that personal finance companies charge higher rates for credit than
banks, credit unions, or savings and loans. Consumer specialists asked
to evaluate the results of the testing believed that the seventeen-year-
olds were not well-prepared for their consumer roles as informed citi-
zens, spenders, earners, or investors. The consensus was that the
testing indicated that seventeen-year-olds knew they should be asking
more questions as consumers, but that they did not seem to have suffi-
cient level of knowledge to carry out effectively consumer transactions
(13).
The study by NAEP provides evidence that students are lacking
in consumer knowledge and consumer skills. More data on areas where
students lack consumer credit card knowledge are needed.
Sources that influenced the development of consumption-related
skills, knowledge, and attitudes during adolescence were the focus of
a study by Moschis. A sample of 806 adolescents from thirteen schools
in seven towns and cities in urban, suburban, semi-rural, and rural
Wisconsin was studied. Self-administered questionnaires were used to
collect the data.
13
In this study, mass media was found to be the most important
agent in adolescent consumer socialization. Influence of peers was
secondary. Family influence ranked third in its influence on sociali-
zation. Adolescents appeared to learn very little about both consump-
tion, in general, and effective consumer behaviors, in particular,
from consumer-related classes in school (15).
The study by Moschis suggests that the mass media could be used
to improve adolescents' consumer skills knowledge, and attitudes.
At present, mass media advertisers are promoting the use of credit
cards.
A study by Ogle sought to determine: (a) students' previous
instruction in the area of consumer credit, (b) prevalence of their
use of consumer credit in the form of personal or parents' charge
accounts, (c) various items they purchased with credit, and (d) know-
ledge of certain consumer credit concepts. The concepts, vocabulary,
types, cost, and regulations of the use of consumer credit and the
characteristics and attitudes of consumer credit users were topics in
the knowledge section.
The sample consisted of 606 students in the ninth through
twelfth grades in three counties of rural Mississippi. The juniors
and seniors were attending a short-course in consumer education spon-
sored by the Mississippi Cooperative Extension Service. The freshmen
and sophomores were selected at random from five randomly selected high

14
schools. It was observed by the researcher that many of the white
children of upper socioeconomic status were enrolled in private schools
rather than public schools.
It was found that 59 percent of the students had received
instruction in the use of consumer credit, with home economic classes
being their primary sources of instruction. Sixty-five percent of the
students had used credit in some form. Both males and females used
their parents' charge accounts more than their own. Males used their
own personal charge accounts more than the females did. The items pur-
chased with credit were as follows: clothes and shoes, groceries,
auto parts and gasoline, and, lastly, cars and bicycles. The mean
score for the knowledge section of the test was 53 percent. The
researcher reported that students had a greater understanding of charac-
teristics and attitudes of consumer credit users than knowledge of
vocabulary, types, costs, and regulations of consumer credit (19).
The study by Ogle was related to the students' attitudes
toward and understanding of consumer credit and charge accounts.
While this study looked at many of the same topics as Ogle did, the
topics were related to credit cards. These topics were consumer educa-
tion, parent credit use,items purchased with credit or credit cards,
and credit knowledge. The findings of this study and the study by
Ogle show the importance of credit and credit card research.

15
The purpose of Blair's (2) study was to look at knowledge,
attitudes, and the use of consumer credit by the eighteen- and
nineteen-year-old freshmen residing on the University of Nebraska-
Lincoln campuses. First she determined what credit was available in
the area for fourteen- to twenty-year-olds. Credit managers of twenty-
eight stores of all types were interviewed, and, of these stores,
eighteen extended credit to the designated age group.
From the research data collected, it was found that students'
use of credit cards was higher if the parents used credit cards. No
significant relationships were found in the areas of use, knowledge,
and attitudes. In the previous six months, 56 percent of the students
had used some credit cards. Of the students who used credit cards,
80 percent had used their parents' cards and 64 percent had used them
for gas purchases, with clothing purchases second in use.
Blair found that over one-half of the college freshmen had used
credit cards. The parents' use of credit cards affected the students'
use of credit cards. The parents' use of credit cards did not affect
the students' knowledge or attitudes, and the use of credit had only
a slight effect on knowledge and attitudes. The knowledge and atti-
tude scores were slightly higher for students who had used credit
before (2).
Research conducted by Buswell (4) sought to answer four
questions:

16
1. What personal characteristics of college students have a
relationship to consumer credit use?
2. What are the credit habits of college students?
3. What is the extent of credit knowledge possessed by the
students?
4. What are the attitudes of college students toward credit
cards?
Questionnaires were mailed to a stratified random sample of
four hundred students enrolled at the University of lowa.
It was found that there was no statistically significant rela-
tionship between consumer credit use among the students and the four
credit-related variables: personal characteristics, habits, knowledge,
and attitudes. Some of the conclusions of the study were as follows:
1. Consumer credit habits were related to age, place of resi-
dence, marital status, income, and level of education attained
2. The score obtained from the knowledge categories indicated
a minimal amount of training in consumer credit use
3. Students were mobile and tended to use credit
4. The students' patronage of commercial banks and credit
card companies was likely to increase (4)
Buswell found that students did use credit cards and that they
lacked training in consumer credit use. The study suggests that more

17
research should be done in the area of credit cards, due to the increas-
ing use of credit cards.
Adults and Credit Cards
The purpose of Gorham's (8) study was to determine the attitudes
of husbands and wives regarding the use of bank credit cards as compared
and related to the couple's marital happiness rating.
The sample consisted of forty randomly selected young married
couples residing in married student housing at Utah State University.
The subjects had at least one child, were U.S. born, and were between
the ages of twenty and thirty-five. Gorham's survey consisted of a back-
ground questionnaire, marital happiness rating scale, and eight case
studies used to evaluate subjects' attitudes toward bank credit cards.
Since both bank credit card users and nonusers were included in the
study, some variations in experiences and knowledge about bank credit
cards were reported.
There was no significant difference found between attitudes
of husbands and wives regarding the use of bank credit cards. There
was no significant relationship between attitudes of husbands and wives
regarding the use of bank credit cards of those couples expressing a
very happy marital happiness rating and of couples expressing other
than a very happy marital rating (8).
The purpose of the study by St. Clair (21) was to analyze the
attitudes and opinions of credit card holders and participating

18
retailers of the Uni-Card credit card system in New York City. The Uni-
Card, family-type credit card plan was selected because it was the
largest family-type system in the area and because it represented the
consumer and retailer population more than other t rpes of credit cards.
Two opinion surveys of users were conducted. One was a representative
sample of 1,000 cardholders, ôf which 400 responded. The other was a
representative sample of 1,000 retailers, of which 295 responded.
The study indicated that both cardholders and retailers liked
credit card advantages more than they disliked the disadvantages of
credit cards. The cardholders favored credit cards even more than the
retailers. Cardholders placed the greatest value on the convenience of
instant credit, and their greatest dislike was the fear of loss if their
credit card would be lost or stolen. Retailers disliked the cost of
the credit card system, but they liked the increased sales volume that
resulted from the new credit customers who tended to make larger pur-
chases than cash customers (21).
The study by St. Clair concluded that credit cards were liked
by both retailers and credit card customers. The researcher believed
that the study indicates that modern society is moving toward the use
of an electronic funds-transfer system and away from the use of cash
and checks. Credit cards and the study of credit cards thus increase
in importance as society assumes this direction.

19
Two major research questions were asked in the study by
Blackwell, Hawes, and Talarzyk (1). The first was whether credit cards
were valued primarily for their convenience function or for their
borrowing function. That is, do people value them as an alternative
to cash and checks or as long-term (over ninety days) loans? Secondly,
did female and male credit needs, attitudes, and practices differ?
A twenty-page questionnaire was sent by Market Facts, Inc. , to
1,000 households in May 1973. The useable response rate was 61 percent.
The questionnaire included credit data; leisure data; standard demo-
graphic questions; and eighty-seven activity, interest, and opinion
questions. Households with a total family income less than $4,000 per
year were excluded from the sample. The demographics of the sample were
very similar to that of the United States Census on geographic region,
urbanization, income, and education and were slightly higher in age than
the United States Census.
The respondents perceived the "convenience" function to be more
important than the "borrowing" function, with this ratio being about
two-thirds to one-third. The study reported that American consumers
generally believe that "long-term" borrowing should be restricted to
major purchases of needed durable goods or needed medical services.
Over 75 percent of the sample considered buying a car a good reason to
borrow, and over 66 percent considered buying land or property a good
reason for borrowing.

20
Two attitudes toward credit cards were studied. First, over
66 percent believed that credit cards made it too easy to buy things
when they were not needed, and 24 percent disagreed. Secondly, over
66 percent said they would not use credit cards if it was not for the
convenience aspect of credit cards. Over 60 percent said they paid
their bills in full when they received the credit card bill.
The major conclusion was that while some minor differences do
exist, overall, males and females have similar credit needs, habits,
and behaviors. The researchers reported that this finding cast doubt
on the discrimination toward granting credit toward women (1).
Blackwell, Hawes, and Talazyk's study indicates that research
and education in this area should be equally concerned with males and
females. The study establishes major motivations for credit use.
The study by Plummer (20) involved a nationwide survey of
activities, interests, and opinions of female homemakers and male heads
of households. The research was designed to indicate the difference
between heavy, light, or non-users of bank credit cards in terms of
life styles or attitudes.
The study was conducted in the fall of 1968 by Market Facts,
Inc. Two separate samples were used—one of 1,000 females and one of
1,200 males. The demographic composition of each sample was similar
to the United States Census figures.

21
In general, the male users surveyed led an active, urban, and
upper socioeconomic style of life congruent with their higher incomes,
positions, and education. They perceived credit cards as providing a
convenience over cash in every transaction.
The females who used credit cards also led an active, upper
socioeconomic style of life, belonged to social organizations, and were
concerned with their appearance. The typical respondent seemed to fit
the picture of the suburban housewife.
There were several differences between users and nonusers that
are worth examining since they have some bearing on credit card usage.
The two most pronounced differences were that the female credit card
users (a) showed a number of fantasies of potential roles or activi-
ties and (b) tended to be less interested in housework than nonusers.
A variety of activities indicated a woman who not only possessed energy
but also had some specific cultural interests. She viewed her house-
wife role as one of managing and purchasing, as opposed to the tra-
ditional duties of the housewife.
From the standpoint of a potential market segment, people who
have higher incomes, who are better educated, who are middle-aged, and
who are employed in the professional segments will tend to rank higher
on the commercial bank credit card user scale (20).
Since the study by Plummer involves adults, the findings can
be related to the parents of the students in this study. The parents'

22
use of credit cards influences the students' use of credit cards. The
parents in this study were found to have higher incomes, higher educa-
tion, and a mean of 4.7 credit cards.
Summary
Youth
In summary, six studies dealing with adolescents of various
ages were reviewed. It was found that youth did use credit but often
lacked knowledge about wise credit use. It was found that youth were
not price conscious or willing to shop around for the best buy.
The development of consumption skills was influenced by the
following factors, in this order: (a) mass media, (b) peers,
(c) family, and (d) school.
The incomes and spending of teenagers have risen to a level
that makes them an important group in our national spending. The
number of teenagers is increasing, and they are attaining higher levels
of education. Not only do teenagers spend large amounts of money, but
they influence the spending patterns of their parents.
Adults
Four studies concerned with adult credit card use were
reviewed. No difference between male and female credit card attitudes,
behaviors, and habits was found, which suggests that credit cards
should be issued to males and females on the same basis, without

23
discrimination toward females. Bank credit card users tend to have
higher incomes, to be better educated, to be middle-aged, and to be
professionally employed.

CHAPTER III
METHODOLOGY
Introduction
This chapter describes the sample selection, development of the
questionnaire, and method for analyzing the data. The questionnaire was
designed to determine students' use of, knowledge about, and attitudes
toward credit cards and related factors. The research procedure is
described below.
Composition of Population
In the April 1980 United States Census, the City of Albuquerque
and several nearby communities had a population of 409,589 people.
The City of Albuquerque was composed of the following racial groups:
Anglo, 80 percent; Blacks, 2.4 percent; American Indians, 2.1 percent;
Asian, 0.9 percent; and others, 14.6 percent (18).
The 1980 census had one question concerning race and one ques-
tion concerning Spanish ethnic origin. According to the Bureau of
Business and Economic Research at the University of New Mexico, these
questions were sometimes misinterpreted by the respondents (3). Race
included possible choices of Anglo, Black, American Indian, Asian, and
24
25
other, and it was intended for people of Spanish ethnic origin to be
classified as Anglo. It has been estimated that 40 percent of the
people classified in the "other" category were of Spanish origin (3).
Adding 5.8 percent (40 percent of 14.6 percent) to the 80 per-
cent already included as Anglo results in a sum of 85.8 percent Anglo.
The ethnic question determined if the respondent was of Spanish
ethnic origin. It is desirable to determine the percentage of Anglos
without a Spanish background and the percentage of Anglos with a
Spanish background. Thirty-seven percent responded that they were of
Spanish ethnic origin. When the 37 percent Spanish origin figure is sub-
tracted from the 85.8 percent Anglo figure, it results in 48.8 percent
of the Anglos without a Spanish background and 37 percent of the Anglos
with a Spanish background.
Sampling
In the Albuquerque school district there were thirteen high
schools with a total enrollment of approximately 27,000 students dur-
ing the Spring 1980 session (9). During the 1980 six-week summer
school session, there were 2,436 students enrolled in school, or approxi-
mately 9 percent of the spring enrollment.
Two schools were offering the high school summer school pro-
grams in 1980. Each principal at the two schools selected several
classes in which to administer the questionnaire. There was a total of

26
eight classes in the sample. Selection was based on teachers who were
willing to cooperate and who did not have class schedule conflicts.
The questionnaire was administered to 95 students at Albuquerque High
School on July 10, 1980, and to 107 students at Del Norte High School
on July 15, 1980. Forty-eight percent of the respondents were in five
classes at Albuquerque High School, and 52 percent of the respondents
were in three classes at Del Norte High School.
The students were allowed as much time as was needed for com-
pleting the questionnaire. The questionnaire was administered in math,
history, English, and physical education classes. Of the 202 surveys
collected, 190 were useable.
By using a sample of summer school students, it was possible
to obtain a wide representation of students. Overall, the students were
from nineteen different schools. Of these nineteen schools, six were
not located in Albuquerque or the Albuquerque Public School District.
The number of respondents attending these six schools during the regu-
lar school year was twelve, or 7 percent of the sample.
Questionnaire
The questionnaire consisted of three sections: demographic
information, assessment of knowledge and attitudes of students toward
credit and credit cards, and credit behavior. Questions to measure
credit behavior included the number of credit cards possessed by the

27
students and their parents, information about who pays the students'
credit card bills, how long they had been using credit cards, what they
purchased with credit cards, and if they had taken consumer education
courses. Another section of the questionnaire was designed to deter-
mine the students' knowledge of several aspects of consumer credit
and credit cards and the attitudes toward credit, credit cards, and
saving money. A summated knowledge score based on answers to knowledge
questions was computed for each student. A summated score of attitudes
toward saving money also was computed.
Data Analysis
For each variable, the mean, mode, and frequencies were calcu-
lated. The Pearson Product Moment Correlation Coefficient (Pearson's
r) was used to test the hypotheses. The Pearson's r coefficient indi-
cates both strength and direction of relationship between two variables.
Also, a comparison of demographic data with the knowledge, attitude, and
consumer education scores was made.
Limitations
Several limitations to the study are noted. Since the
respondents were summer school students, they may not have been a
representative sample of students attending high school during the
regular school year. Classes were not selected in a random method.
In addition, some questions may have been misinterpreted by the

28
respondents and resulted in measurement errors. The limitations of the
study are of the nature that restrict the findings and conclusions of
the study to the group studied.

CHAPTER IV
FINDINGS AND INTERPRETATIONS
Description of Sample
The demographic characteristics of the respondents are shown
in table 1. The sample was composed of 49 percent males and 51 percent
females. The students' ages varied from 13 to 19 years. Over one-third
of the respondents were age seventeen (35 percent) , and almost one-fourth
were age sixteen (22 percent). Over 57 percent of the students were
in the twelfth grade. A major portion of the sample was coraposed of
Anglos (48 percent) and Hispanics (33 percent). In the City of
Albuquerque the population consisted of 49 percent Anglos and 37 percent
Hispanics (18).
The question, What is the amount of the allowance you receive
from your parents each month? was answered by 44 percent of the
students. The average allowance received by the students was $48.66
per month. In addition, the average earnings of the students with
jobs was $301.43 per month. Since it was summer and the students were
in school only during the morning, their potential earnings at this
time of year were much greater than during the regular school year.
29

30
TABLE 1
DEMOGRAPHIC CHARACTERISTICS OF RESPONDENTS
Question and Response
Sex of respondent Male Female No response
Total
Age of respondent 19 years 18 years 17 years 16 years 15 years 14 years 13 years No response
Total
Year in school of respondent Graduated 12 11 10 9 No response
Total
Ethnic origin of respondent Anglo Black Hispanic Oriental Indian Other No response
Total
Frequency
93 96 2
190
5 21 67 42 26 13 4 12 190
4 109 30 24 113 10 190
91
4 63
6 10 6
10 190
Percentage
49 50 1
100
3 11 35 22 14 7 2 6
100
2 57 16 13 7 5
100
48
2 34
3 5 3
5 100

TABLE l~Continued
31
Question and Response Frequency Percentage
Amount of
allowance
$200
100
60
50
30
20
10
1
No
-
-
-
-
-
-
-
-
re:
monthly
from parents
$500
199
99
59
49
29
19
9
sponse
Total
4
6
4
10
18
24
11
7
106
190
2
3
2
5
9
13
6
4
56
100
Average raonthly earnings
of respondent
700 - $999
500 - 699
400 - 499
300 - 399
200 - 299
100 - 199
1 - 99
Not employed or no response
Total
6
14
10
13
15
20
15
97
190
3
7
5
7
8
11
8
51
100
32
According to Rand Youth Poll, in 1978 the average allowance for
thirteen- to fifteen-year-olds was $29.60 per month, while sixteen- to
nineteen-year-olds averaged $64.10 per month. It was also indicated
that the respondents were more than matching their allowances with
earnings of their own (11:19).
Inforraation provided by the respondents regarding their
parents' income and education is shown in table 2. Thirty-five percent
of the fathers had completed a college degree; 29 percent had twelve
years of school or less and/or had other training; 23 percent had some
college; and 4 percent completed a Master's degree or Ph.D. Of the
raothers, 38 percent had twelve years of school or less and/or other
training; 27 percent had some college; 24 percent completed a college
degree; and 2 percent completed a Master's degree or Ph.D. Thus, the
sample appeared to have a higher educational level than the normal
population.
Forty-four percent of the respondents did not answer the ques-
tion, possibly because they did not know their parents' incorae. Of
those who did respond, the highest number reported an income of over
$40,000 per year, while 14 percent had an income between $20,000 and
$29,999; and 15 percent had an income of $19,999 or less. Mandell
(14) reported that 92 percent of the adult respondents in the 1970-1971
survey had an income of $19,999 or less; 4 percent had an income of
$20,000 to $24,999; and 4 percent had an income of $25,000 or raore.

33
TABLE 2
FREQUENCY DISTRIBUTION: DEMOGRAPHICS OF PARENTS OF RESPONDENTS
Question and Response Frequency Percentage
Hghest year of school compieted by f a the r
Ph.D. Mas t e r ' s College degree Some college 12 years Less than 12 years Other No response or did not know
Total
6 1 66 44 27 25 3 18 190
3 1 35 23 14 13 2 9
100
Highest year of school completed by mother Ph.D. Master's College degree Some college 12 years Less than 12 years Other No response or did not know
Total
1 2 46 51 35 33 6 16 190
1 1 24 27 18 17 3 9
100
Parents' combined incorae $40,000 and raore 30,000 -25,000 -20,000 -10,000 -
0 -
$39,999 29,999 24,999 19,999 9,999
No response or did not know Total
36 16 14 14 18 9 83 190
19 8 7 7 10 5 44 100

34
The incomes and educational backgrounds of the respondents'
parents suggest that the parents are generally professionally
employed. In contrast, the sample in Mandell's (14) study was com-
posed of 50 percent clerical-salesworkers, craftsmen, foremen, opera-
tives, and laborers; and 12 percent professional workers. The occupa-
tions and an inflationary economy help to explain the wide difference
in the incoraes of the two samples.
Descriptive Analysis
This analysis includes responses to questions concerning student'
use of credit cards, parent use of credit cards, student consumer educa-
tion background, knowledge about credit and credit cards, and attitudes
toward saving raoney.
Student Credit Card Use
As indicated in table 3, slightly less than two-thirds of the
students reported they did not use credit cards. About one-third
(28 percent) used credit cards one to five tiraes each raonth, and 9
percent used credit cards six times or more tiraes each month. Of
the students responding to a second question on credit card use, thirty-
two indicated various amounts of time that they had been using the
credit cards. The time ranged from six months or less (7 percent) to
raore than three years (2 percent). Only 14 percent of the students
responding to a question regarding credit card ownership had a credit

35
TABLE 3
FREQUENCY DISTRIBUTION: CREDIT CARD USE BY RESPONDENTS
Question and Response Frequency Percentage
Frequency of credit card use per month 11 times or raore 6 3 6 to 10 times 11 6 1 to 5 times 52 28 Never use them 113 59 No response 8 4_
Total 190 100
Length of time using credit cards 3 years or more 4 2 2 years to 3 years 7 4 1 year to 2 years 22 12 6 months to 1 year 14 7 Less than 6 months 14 7 No credit card use or no response 129 68
Total 190 100
Length of time respondents had credit card in own name 3 years or more 0 0 2 years to 3 years 3 2 1 year to 2 years 11 6 6 months to 1 year 8 4 Less than 6 months 5 2 No credit card in name 163 86
Total 190 100
Number of credit cards used by respondents 5 or more credit cards 13 7 4 credit cards 9 5 3 credit cards 12 6 2 credit cards 25 13 1 credit card 18 9 No credit cards 113 60
Total 190 100 Mean 3.6

36
TABLE 3—Continued
Types of iteras purchased with credit cards Clothes Gasoline and automobile parts Shoes Emergency Restaurants Records and tapes Airline tickets Mail order purchases Other Don't use them - 54.7%
Proportion of time respondent used someone's credit card other than their own or their
parents 11 - 100% 1 - 10% 0% (not at all) Total
8.8 7.8 7.7 6.3 5.2 4.5 3.6 2.9 1.3
0 2
188 190
Proportion of credit card bills paid by respondent
76 - 100%
Question and Response Frequency Percentage
Types of credit cards used by respondents Master Charge 39 Visa 29 American Express 6 Department stores 45 Gas companies 38
0 1 99 100
7 27
5 1 - 7 5 0 0 2 6 - 5 0 4 15 1 - 2 5 15 _5^ Total 26 100

37
TABLE 3—Continued
Question and Response Frequency Percentage
Proportion of bills paid by
100% 76 51 26 1
- 99 - 75 - 50 - 25 Total
credit parents
card
55 9 5 1
_5 75
74 12 7 1 7
100
Proportion of time respondents used own credit cards 76 51 26 1
- 100% - 75 - 50 - 25 Total
6 3 5
10. 24
25 12 21 42 100
Proportion of tirae respondents used paren t s ' c red i t card
100% 76 51 26 1
- 99 - 75 - 50 - 25 Total
20 10
0 4
Z5 59
34 17
0 7
42 100

38
card in their names, with the length of time of cards in their own
names ranging from six months or less (2 percent) to more than two
years (2 percent) (see table 3). As can be observed in the table, of
those students reporting number of credit cards in use, the majority
had use of two credit cards.
When credit cards were used, use was fairly evenly divided
between departraent store credit cards (used by forty-five of the
respondents), Master Charge (used by thirty-nine of the respondents),
and gasoline credit cards (used by thirty-eight of the respondents).
Visa and American Express cards were used less frequently. It should
be noted that it was possible to indicate the use of more than one
credit card.
Respondents were asked to rank nine categories of items from
most to least purchased using credit cards. Of the 45 percent who
reported making purchases, the top three items most frequently pur-
chased were clothes, gasoline and automobile parts, and shoes (see
table 3). Although ranked in different priority, these were the same
three items reported by Ogle as raost frequently purchased (19). These
three items correspond also to the types of credit cards most often
used—that is, department store credit cards (clothes and shoes),
bank credit cards (general use), and gasoline credit cards.
Only two of the respondents indicated using a credit card
other than their own or their parents'. Fifty-nine of the respondents

39
used their parents' cards, and twenty-four respondents used their own
credit cards for purchases. Seventy-five of the respondents' credit
card bills were paid by their parents, and twenty-six of the
respondents paid their own credit card bills.
Respondents' Parents' Credit Card Use
Respondents were asked to list the number of credit card accounts
their parents had (see table 4). Thirty percent of the respondents did
not know how many credit card accounts their parents had or responded
that their parents had no credit card accounts. Of the 70 percent
who did report credit card use by parents, the use reported by the
respondents was fairly evenly distributed between one to six credit
card accounts. The mean number of credit cards used was 4.7. While
Mandell (14) reported that one-half of his respondents used credit
cards and the other one-half did not use credit cards, it is suggested
that in the ten years since his study, credit card use has increased.
The respondents reported that when credit cards were used by
parents, 104 used one or raore departraent store credit cards, 79 used
Master Charge, 75 used Visa, 63 used gasoline credit cards, and 9 per-
cent used American Express cards. Use of raore than one credit card
account could be reported. In contrast, Mandell (14) reported that
of his respondents, 35 percent used store credit cards, 16 percent
used bank credit cards, 34 percent used gasoline credit cards, and

40
TABLE 4
FREQUENCY DISTRIBUTION: CREDIT CARD USE BY PARENTS OF RESPONDENTS
Question and Response Frequency Percentage
Number of credit card accounts of parents 6 or more credit card accounts 5 credit card accounts 4 credit card accounts 3 credit card accounts 2 credit card accounts 1 credit card account Do not know or no credit card accounts
Total
33 14 17 22 22 24 58
17 7 9 12 12 13 30
190 100
Mean 4.7
Types of credit cards used by parents Master Charge Visa American Express Department stores Gas companies
79 75 17 104 63

41
9 percent used travel and entertainment cards. The use of bank credit
cards and department store credit cards was much higher in the 1980
study than the 1970-1971 study conducted by Mandell. This also indi-
cates the large growth in credit card use during the past ten years.
Consumer Education
Respondents were asked if they had enrolled or were presently
enrolled in a consumer education course (see table 5). Twenty-six
percent of the respondents had taken or were currently taking a consumer
education course. However, when asked if they had either studied or
discussed the use of credit cards for buying things, 53 percent
responded that they had. The respondents were asked then where they
had studied or discussed the use of credit cards. Parental instruction
and business classes were the most frequent sources of study or dis-
cussion, with home economics, social studies, and econoraics classes
given as the next raost frequent sources.
The summated education score was computed from the following
variables: (a) present or prior enrollment in consumer education
courses and (b) the study or discussion of credit cards. The summated
education score was computed by adding the number who responded yes to
both questions, those who responded yes to one question and no to one
question, and those who responded no to both questions. Frora this
computation, it was observed that 59 percent of the saraple had some

42
TABLE 5
FREQUENCY DISTRIBUTION: CONSUMER EDUCATION
Question and Response
Prior or present enrollment in consumer education course Yes No
Total
Frequency
49 141 190
Percentage
26 74 100
Study or discussion of use of credit cards Yes No
Total
100 90 190
53 47 100
Sources of study and/or discussion of credit cards Parents' instruction Business class Home econoraics class Social studies class Econoraics class Other 4H, FHA, FFA Clubs
Those who answered yes
42 38 22 20 15 11 5
100
Summated education score Yes to both questions No to one question, yes to one question No to both questions
Total
37 75 78 190
20 39 41 100

43
background of credit card education, and 41 percent had no credit card
education.
Knowledge Questions
The knowledge section of the questionnaire included twenty-seven
questions. The number of credit knowledge questions answered correctly
was computed for each respondent. This score was converted to a per-
centage and scaled as shown in table 6. Almost one-third (32 percent)
of the respondents scored from 71 to 100 percent correct knowledge
questions.
TABLE 6
FREQUENCY DISTRIBUTION: CREDIT KNOWLEDGE QUESTIONS
Percentage of Correctly Answered Knowledge Frequency Percentage
Questions
91 - 100% correct answers 6 3 81 - 90 31 16 71 - 80 25 13 61 - 70 53 28 51 - 60 24 13 0 - 5 0 _51 JJ_
Total 190 100

44
Variables that were found to be related to the percentage of
correct answers at a statistically significant level were:
1. The number of times the respondents use credit cards each
month
2. The education of the father
3. If the respondent studied or had discussed the use of credit
cards and/or had a consumer education course (see table 7).
As the percentage of correct credit knowledge questions increased,
the number of times credit cards were used per raonth increased, the
father's education increased, and the summated education score increased.
TABLE 7
CORRELATION ANALYSIS: CREDIT KNOWLEDGE QUESTIONS
Percentage of Correctly Answered Knowledge Questions in Relationship Coefficient
With Other Variables
Number of times credit cards were used per raonth 0.12*
Father's level of education 0.14-
Mother's level of education -0.01
Parents' corabined income 0.08
Summated education score 0.23***
*Significance at 0.05 level **Significance at 0.01 level ***Significance at 0-001 level

45
One of the objectives of this study was to determine where the
students' knowledge was strong and where it was weak. To determine
this, the percentage of correct answers was averaged for the credit
and credit card questions in the multiple choice section, and for
credit, credit card, and installment contract questions in the true-
false section. The averaging resulted in three credit card questions
averaging 51 percent and eight credit questions averaging 52 percent.
In the true-false section, five credit questions averaged 54 percent,
five credit card questions averaged 66 percent, and six installment
contract questions averaged 73 percent. These percentages are in the
same range or higher than the percentages for knowledge score in the
studies by the N.A.E.P. (13), 57 percent, and Ogle (19), 53 percent.
Summated Knowledge Score
For further analysis, the responses to the twenty-seven ques-
tions in the knowledge section of the questionnaire were summated in
the following manner. The true-false questions were scored 2 for
correct answers, 1 for incorrect answers, and 0 for blank or did not
know answers. Multiple choice questions were scaled frora the most
correct answer (value of 4) to the least correct answer (value of 1)
and 0 for questions left blank. Each respondent's summated knowledge
score was calculated by summing the score for each question. The
total possible score was 68. Each student's score was then converted

46
to a percentage. Results are indicated in table 8. Overall, the
students have a high level of knowledge, with two-thirds of the
students having 71 to 100 percent knowledge scores. Since the summated
education score gave full, partial, or no credit for each question,
the respondents were given credit for some credit knowledge, even
though they did not have the correct answer. Twice as raany respondents
scored from 71 to 100 percent on the summated education score (64
percent) as did respondents on the number of correct credit knowledge
questions (32 percent). This resulted from the partial credit given
for answers in the summated knowledge section.
TABLE 8
FREQUENCY DISTRIBUTION: SUMMATED KNOWLEDGE SCORE
Summated Score Frequency Percentage
91 - 100 percent correct 81 - 90 71 - 80 61 - 70 51 - 60 0 - 5 0
Total
11 52 59 35 10 23 190
6 27 31 19 5 12 100
Student Attitudes
Student attitudes toward the use of consumer credit and credit
cards, learning about credit cards, and attitudes toward saving money

47
were the topics in the attitude section of the questionnaire. A ques-
tion from each topic is discussed here and shown in tables 9 and 10.
Responses to the question concerning the use of credit cards
by high school students indicated a variety of attitudes. Forty per-
cent believed they should use credit cards the same amount as present
(see table 9). The students were asked if they believed it was impor-
tant to learn about the use of credit cards in school situations, and
alraost two-thirds (61 percent) of the students answered yes, while
other responses were somewhat equally distributed between more use
(13 percent), less use (21 percent), and no use (18 percent).
One question requested a response to whether credit cards in
general were good or bad. Thirty-eight percent reported good or
good with qualifications, while 34 percent reported the opposite belief
of bad, bad with qualifications, or uncertain. In Mandeil's (14) study,
38 percent reported good or good with qualifications, and 49 percent
reported bad, bad with qualifications, or uncertain beliefs. A compari-
son of the results of this research and Mandell's study is shown in
table 9.
Eight items were offered as responses to the stateraent:
How important are these reasons to save money? The responses were
summed to determine a composite attitude toward saving money score
(summated attitude score) . Responses are shown in table 10. The four
possible answers for each question were: (a) Not Important at All,

48
TABLE 9
FREQUENCY DISTRIBUTION: ATTITUDE SCORES
Question and Response Frequency Percentage Mandell Study Percentage
High school students should be allowed to use credit cards: More often Same as at present Less often Not at all No response
Total
24 77 40 34 15 190
13 40 21 18 8
100
Importance of learning about the use of credit cards in school situations: Yes 116 Sort of 20 No 22 Do not know 23 No response 9
Total 190
61 11 12 11 5
100
Use of credit cards is a good thing, or a bad thing, or what? Good Good with qua l i f i ca t ions Pro-Con Bad with qualifications
Bad Uncertain No response
Total
20 54 43 11 22 31 9
10 28 23 6 12 16 5
190 100
26 12 12 4 41 4 1
100

49
TABLE 10
FREQUENCY DISTRIBUTION: SUMMATED ATTITUDE SCORES
Summated score of attitude toward
savmg money: 25 17 9 1
- 32 - 24 - 16 - 8
0 Total
Frequency Percentage
82 85 7 2 14 190
43 45 4 1 7
100
Teenage Consumers A Profile
(%)
Importance of reasons to save money—question and response:
To buy something you cannot afford right now Very important Moderately important Not very important Not iraportant at all No response
Total
29 30 19 13 9
100
32 38 22 8 0
100
To take care of emergencies Very iraportant Moderately important Not very important Not important at all No response
Total
80 8 3 1 8
100
75 20 4 1 0
100

50
TABLE 10—Continued
Frequency Percentage
To pay for an education Very important Moderately important Not very important Not important at all No response
Total
53 28 5 6 8
100
Teenage Consumers: A Profile
63 25 9 3 0
100
To get raarried Very iraportant Moderately important Not very important Not important at all No response
Total
32 33 20 9 6
100
16 39 28 17 0
100
How important are these reasons to save money? Question and response:
Just to have money in the bank Very important Moderately important Not very important Not important at all No response
Total
25 31 24 13 7
100
29 46 18 7 0
100
Because your family expects you to save money Very important Moderately important Not very important Not important at all No response
Total
13 26 33 20 8
100
8 32 35 25 0
100

TABLE 10—Continued
Frequency Percentage
51
Teenage Consumers A Profile
To earn interest on the raoney Very iraportant Moderately important Not very important Not important at all No response
Total
30 38 18 6 8
100
24 45 26 5 0
100
To avoid using credit to buy something Very important Moderately important No't ve ry imp or t ant Not important at all No response
Total
35 34 14 10 7
100
37 37 17 9 0
100

52
(b) Not Very Iraportant, (c) Moderately Important, and (d) Very Iraportant
The highest possible score was 32. Forty-five percent scored from 17
to 24, and 43 percent scored from 25 to 32, indicating a positive atti-
tude toward savings was held by the raajority of the respondents.
A coraparison of the responses to the eight iteras by the
students in this study to the responses by students in the Teenage
Consumers study is also shown in table 10 (17). The questions were
corapared by the responses with the highest percentage results. Two
questions rated very important in both studies: (a) To take care of
eraergencies and (b) To pay for an education. The question, Avoiding
the use of credit to buy soraething, was rated Very Iraportant in this
study, and the Teenage Consumers: A Profile study had equal response
to Very Important and Moderately Important. Four questions were
rated Moderately Iraportant in both studies: (a) To buy soraething you
cannot afford now, (b) To get raarried, (c) Just to have money in the
bank, and (d) To earn interest on the raoney. The question that was
rated Not Very Iraportant in both studies was: Because your faraily
expects you to save raoney. None of the questions was rated Not Irapor-
tant At All in either study. The individual percentage of responses
is given in table 10.

53
Deraographic Coraparisons
The respondents' summated knowledge scores, attitudes toward
saving money scores, and education scores were compared with several
demographic and credit card-related variables (see table 11). The
Pearson's r_ test was used for this analysis.
The summated knowledge score was related at a statistically
significant level to having discussed or studied the use of credit
cards. The students' summated knowledge score was not related to the
education of the father, the education of the mother, parents' combined
income, or the respondents' having taken a consumer education course.
Neither the summated attitude toward savings score nor the
suramated consumer education score was related at a statistically signifi-
cant level with any of the variables: student credit card use, parent
education, or parents' income. And the summated attitude score was
not related to the summated education score.
Analysis of Hypotheses
Hypothesis 1
Hypothesis 1 stated that there was no statistically signifi-
cant relationship between the total number of credit cards the respondent
uses and the total number of credit card accounts respondent's parents
use. There was a highly significant positive relationship between the
possession of credit cards by the students and their parents. Therefore,

54
TABLE 11
PEARSON CORRELATION ANALYSIS: DEMOGRAPHICS WITH SUMMATED KNOWLEDGE, ATTITUDE, AND EDUCATION SCORES
*Significance at 0.05 level. **Significance at 0.01 level. ***Significance at 0.001 level.
Variables Coefficient
Summated knowledge score Father's education level 0.11 Mother's education level 0.01 Parents' combined income 0.09 Consumer education course 0.05 Studied or discussed credit card use 0.23***
Summated attitude score Number of times credit cards used monthly -0.05 Father's education level -0.10 Mother's education level -0.08 Parents' combined income 0.01 Consumer education course -0.09 Studied or discussed credit card use 0.01
Summated education score Number of times credit cards used monthly 0.03 Father's education level -0.01 Mother's education level -0.01 Parents' combined incorae 0.05

55
the alternative hypothesis was accepted (see table 12). This supported
the findings by Blair (2), who also found a significant relationship
between students' and parents' credit card use.
Hypothesis 2
Hypothesis 2 stated that there was no statistically significant
relationship between whose credit card the student uses and the per-
centage of the student's credit card bills that is paid by the student.
Four variables were used to test Hypothesis 2. The four vari-
ables used were:
1. The student's use of his or her own credit cards
2. The student's using his or her parents' credit cards
3. The student's paying his or her own credit card bills
4. The parents' paying the student's credit card bills
Since two of the variables were found to be related at a statistically
significant level, the alternative hypothesis was partially accepted as
follows: The students' using their own credit cards was significantly
related to paying their own credit card bills was positively related at
the 0.01 level of significance. At the same significance level (0.01),
a positive relationship was found between the students' using the
parents' credit cards and the parents' paying the students' credit
card bills. The alternative hypothesis was partially rejected for the
other two sets of variable corabinations. These results support the

56
TABLE 12
PEARSON CORRELATION ANALYSIS: HYPOTHESES 1 THROUGH 5
Variable Coefficient
Hypothesis 1
Total number of credit cards used by the students with
Total number of credit cards used by the student's parents 0.76***
Hypothesis 2
The percentage the student uses his own credit card with
The percentage the student pays his own credit card bills 0.71**
The percentage the student uses his own credit card with
The percentage the student's parents pay the credit card bills 0.09
The percentage the student uses his parents' credit cards with
The percentage the student pays his own credit card bills - -029
The percentage the student uses his parents' credit cards with
The percentage the student's parents pay the credit card bills 0.31*
Hypothesis 3
Summated knowledge score with Number of times credit cards are used each month by the students 0.12*

57
TABLE 12~Continued
Variable Coefficient
Hypothesis 4
Summatéd knowledge score with Summated education classes score 0.18**
Hypothesis 5 Summated attitude score with Number of tiraes credit cards are used each raonth by the students -0.05
*Significance at 0.05 level. **Significance at 0.01 level. ***Significance at 0.001 level.

58
idea that whose credit card is used is related to who pays the credit
card bills (see table 12). The students' use of someone's credit card
other than their own or their parents' was eliminated since only two
students used someone else's credit card.
Hypothesis 3
Hypothesis 3 stated that there was no statistically significant
relationship between the summated knowledge scores of students and the
students' use of credit cards. A positive statistically significant rela-
tionship was found; therefore, the alternative hypothesis was accepted.
This suggests that knowledge and credit card use are positively
related (see table 12). However, Blair did not find a statistically
significant relationship between these variables (2).
Hypothesis 4
Hypothesis 4 stated that there was no statistically significant
relationship between the summated knowledge score of students with prior
credit card education and the knowledge scores of those without prior
credit card education. A positive statistically significant relation-
ship was found between the summated knowledge score and the summated
education score (see table 12). The alternative hypothesis was accepted.
This finding indicates that knowledge and education are related and
supports the concept that credit card education is iraportant since
education increases with knowledge.

59
The summated education score was composed of two variables:
(a) had taken a consumer education course and (b) had studied or dis-
cussed the use of credit cards for buying things. When the variables
were compared separately with the suramated knowledge score, only the
second of the above variables was related at a statistically signifi-
cant level to the summated knowledge score (see table 11). This find-
ing suggests that the discussion or study of credit cards had a greater
influence on the students' summated knowledge scores than did enrollment
in a consumer education course.
Hypothesis 5
Hypothesis 5 stated that there was no statistically significant
relationship between attitudes toward saving and the use of credit
cards by students. For the students who did use credit cards, the
number of times they used credit cards each month was also included.
Since no statistically significant relationship was found between the
variables, the alternative hypothesis was rejected (see table 12).
Blair (2) found that if the students used consumer credit, their
attitudes toward consumer credit were higher, but the difference was
not statistically significant.
CHAPTER V
SUMMARY, CONCLUSIONS, AND RECOMMENDATIONS
Summary and Conclusions
The questionnaire was administered to 202 high school summer
school students during the summer of 1980 in Albuquerque, New Mexico.
Of the surveys collected, 190 were determined to be useable.
For each variable, frequencies were calculated. The Pearson's
r_ test was used to test the hypotheses. A comparison of demographic
data with the suramated knowledge score, summated attitude score, and
summated consumer education score was made.
The findings of this study show that the number of credit cards
used by the students was related at a statistically significant level
to the number of credit cards used by the parents. As partial use of
credit cards increased, student use of credit cards also increased.
This supports the results reported by Blair (2).
A statistically significant relationship was found between
students using their own credit cards and paying the credit card bills.
A statistically significant relationship was found between the students'
using their parents' credit cards and the parents' paying the students'
credit card bills. Since parents often pay the students' credit
60

61
card bills, the students may not fully realize the responsibilities of
credit card use.
A statistically significant relationship was found between the
students' use of credit cards and the students' summated knowledge
scores. This relationship suggests that education may be helpful,
since students do have higher knowledge levels with higher credit card
use. Further research might show other factors that are related to
the students' credit card knowledge levels.
As the respondents' summated knowledge scores increased, the
respondents' summated education scores increased. This result indicates
that knowledge and education are related and further research might
show the exact relationship. Blair (2) did not find a statistically
significant relationship between credit knowledge and credit use.
In this study and the study by Blair (2), no statistically
significant relationship was found between the students' attitudes
scores and credit card or credit use. Research regarding the types
of experiences students had with credit cards could provide further
insight to development of attitudes. Expansion of credit card use
and attitude questions may lend further insight in this relationship.
A follow-up survey of the same students several years later also might
indicate attitude changes.

62
Re commendat ions
A recommendation for improving the questionnaire includes
better organization of questions, as well as expanding the content
of the questionnaire. The questions for credit card users only need
to be labeled as such. Different types of data, such as demographic,
should be placed together, as well as the credit card information ques-
tions, knowledge questions, and attitude questions.
Questions concerning demographic data need to be expanded.
The parents' occupations, student income and allowance during the
school year and suramertime, and the dollar amount charged per month
on credit cards are questions that could lend insight to student know-
ledge, use, and attitudes concerning credit cards. Responses from the
students' parents on credit card use would provide accurate informa-
tion not easily obtained from the students. The knowledge and atti-
tude sections could be expanded to cover the areas studied by the
students in class. Math computations covering interest charges, dis-
counts, balancing checkbooks, and installraent contracts may show
strengths and weaknesses in math skills (13). An investigation of the
influence of peers on credit knowledge, use, and attitudes; and the
influence of discussion about credit cards and the sources of dis-
cussion would provide additional information. Research into the effect
of the parents as role raodels and their influence in the students'
credit behavior may suggest that parental education be combined with

63
student education in credit-related areas.
A random sample during the regular school year that included
each school in the city would be more effective than testing during
the summer school session. Given the diversity of school enrollment
patterns, testing should be done between each school to discover
differences in the sample groups.
Research in the past has been limited to adults and credit
card use and youth and general credit use. Since youth are using
credit cards now and are expected to continue to use credit cards as
they raature, the importance of research into knowledge, use, and atti-
tudes concerning credit cards is increased.
This study did not investigate factors related to student
credit card attitudes. Research into the related factors would be
helpful.

LIST OF REFERENCES
1. Blackwell, Rodger D.; Hawes, Douglas K.; Talarzyk, W- Wayne. "Americans' Use of Credit Cards: A Nationwide Study of Femaie and Male Attitudes." Bulletin of Business Research February 1975, pp. 5-8.
2. Blair, Laurel Marie. "Use of Knowledge About and Attitude Toward Consumer Credit by Freshmen Students Residing on the University of Nebraska-Lincoln Campuses." M.S. thesis, University of Nebraska, 1975.
3. Bureau of Business and Economic Research, University of New Mexico- Interview, 29 May 1981.
4. Buswell, Henrietta Arlene. "An Analysis of Consumer Credit Behavior of a College Market." Ph.D. dissertation, University of lowa, 1975. In Dissertation Abstracts International. Ann Arbor, Michigan: University Microfilms International, 1976.
5. Cateora, Philip R. An Analysis of the Teen-age Market. Austin: University of Texas, 1963.
6. "Credit Card War Moves Into High Gear." U.S. News and World Report, 5 March 1979, pp. 70-73.
7. Federal Reserve Board. "Credit Card and Check-Credit Plans at Commercial Banks." Federal Reserve Bulletin 59 (Septeraber 1973): 647-648.
8. Gorham, Elizabeth Ellen. "Young Married Couples' Attitudes Toward Credit Cards." M.S. thesis, Utah State University, 1971.
9. Hutchins, Robert. Albuquerque Public Schools, Albuquerque, New Mexico. Interview, 7 May 1981.
10. "It's Getting Hard to Live Without a Credit Card." U.S. News and World Report, 8 October 1973, pp. 57, 58, 60.
64
65
11. "Kids and Money: What They Need to Know, When They Need to Know It." Changing Times, June 1981, pp. 17-20.
12. "Latest Profile of the Nation's Young People." U.S. News and World Report, 16 April 1973, p. 70.
13. McFeatters, Ann. "Tests Show Teenage Consumers Marketplace 'Babes in the Words.'" Albuquerque Tribune, 9 July 1979.
14. Mandell, Lewis. Credit Card Use in the United States. Ann Arbor, Michigan: Braun and Brumfield, 1972.
15. Moschis, George Parthenios. "Acquisition of the Consumer Role by Adolescents." Ph.D. dissertation, University of Wisconsin-Madison, 1976. In Dissertation Abstracts International. Ann Arbor, Michigan: University Microfilms International 38 (1977).
16. NBC, "The New Teens." The Today Show, 14 May 1980. Tom Brokaw and Sam White.
17. National Assessment of Educational Progress. Education Commission of the States. Teenage Consumers: A Profile. Denver, Colorado
18. New Mexico. 1980 Census of Population and Housing, Final Popula-tion and Housing Units Counts. March 1981, p. 4.
19. Ogle, Linda Lee. "An Investigation of the Study, Use, and Under-standing of Consumer Credit by a Selected Group of High School Students." M.S thesis, University of Mississippi, 1972.
20. Plummer, Joseph T. "Life-Style Patterns and Commercial Bank Credit Card Usage." Journal of Marketing 35 (April 1971): 35-41.
21. St. Clair, Robert M. "An Analysis of Attitudes and Opinions of Consumers and Retailers Using a Family-Type Credit Card Systera in the New York City Area." Ph.D. dissertation, New York University, 1968. In Dissertation Abstracts International. Ann Arbor, Michigan: University Microfilms International 30 (1969).
22. Stinson, Richard J. "Is there a Credit-Card Debacle?" Financial World, 17 July 1974, pp. 28-31.

66
23. U.S. Department of Commerce. Bureau of the Census. Census Popu-lation: 1970. Detailed Characteristics. Final Report PC(1) - D33 N.M.
24. U.S. Department of Commerce. Bureau of the Census. Statistical Abstract of the U.S.: 1979. Washington, D.C., 1979.
25. U.S. Department of Health, Education, and Weifare. National Center for Education Statistics. Digest of Education Statis-tics 1979. By W. Vance Grant and C. George Lind. Washington, D.C.: Government Printing Office, 1979.

APPENDIX: CREDIT CARD SURVEY
One purpose of thi3 survey is to strengthen the consumer credit oresentation in the APS schools. The study will be used to fulfill a requirement for a ::asters Thesis problem as Texas Tech University. Please answer each question to the best of your knowledge.
1, Person completing the survey: Male Pemale Age Grade in school
Ethnic Origin; Anglo Blaclc ^Hispanic Oriental Other
2, What school do you attend during the regular year? ^_______^_^_________^^_
3, How many of the following typea of credit cards do you use?
Type Number of Who pays the credit card bills aost often? BMâãi You Parents (Checlc one)
Master Chsæge —____»»_ _____ ___^_ Visa
American Express ________ -_—_— __,^___ Department Stores _ _ _ _ _ _ ______ _______ Gas Companies _______ ______ ____^__ Other
4. Please give an estimate of how many credit card accounts your pajents have of each of the following types, (If •they have severai accoiints with the sane company, count each account as a separate account, EXAMPLE 1: If your family has a Texaco accoTint for your fathers' business, and if your parents have their own Texaco accoxint; -this would be counted as two accounts. E.XJ^':?LZ 2: However, several cards for the same account would count as only one account. Thus, "Texaco, Parents* Account" with separate cards in the name of each spouse counts' as one account.)
t'Iaster Charge Visa American Express Department Stores Gas Companies None Don't have any idea Other
5. Generally, what percent of your credit card bills do you pay, and what percent do your parents pay? ^ ou pay ?iParents pay
6. How many times do you use credit caxds each month? (Check one)
Never use 'them 1 to 5 times 6 to 10 times 11 to 15 times 16 to 20 times 21 times or raore
7. Generally, what percent do you use your credit cards and your parents credit cards? % Yours % Parenta % Someone else (Specify )
8. If you have a credlt card in your name, how long have you had it? (If more than
one, check when you got the first one.) Less than 6 raon-ths 6 months to 1 year 1 to 2 years 2 to 3 years 3 years or tnore
9. How long have 3^u been using credit cards? less than 6 months
6 months to 1 year 1 to 2 years 2 to 3 years 3 years or riore
10. What is the amoiint of the allowaiice you receive from your parents each month?
$ . I f you have a job, how much do you eam in an average month? S

68
11. What do you use credit cards to purchase? Rank these in order with 1 being the most often purchased, and 9 being the least often puxchased.
Shoes Restaurants Gas and Auto Parts Don't use
Clothes Airline Tickets Records and Tapes '^^^
__Emergency Mail Order Purchases Other (Specify)
12. What is the highest year of school your parents have completed?
PATHER: MOTHER:
___Iiea8 than 12 Some College Less than 12 Some College
12 years College Degree 12 years College Degree
^Other(Specify) Other(Specify)
13. What is the income rajige of your parents? (Corabined income.) (Check one)
Less than $2,000 $10,000 to $14,999 $25.000 to $29,999
$2,000 to $4,999 $15,000 to $19,999 $30,000 to $39,999 don't
$5,000 to $9,999 $20,000 to $24,999 $40,000 or more ^ ° ^
14. Have you taken, or are you now taking a consumer education course?
yes no
15. Have you ever studied or discussed the use of credit cards for buying things? yes no
TTyes, where? You may check more than one,
Business Class Social Studies Class Other(Specify)
Economics Class Home Economics Class
4H. FHA, PFA Club Parents Instruction
POR QUESIIONS 16 TO 26 CIRCLE THE LETTER OF THE C0RR2CT ANS^WER.
16. What is the current interest rate charged on credit card accounts?
A, 10% per year B. 296 per month C. 18% per year D. 1% per month
17. Three important characteristics checked by credit lenders when extending credit
^ ® ' A. character, charge, credit C. character, capacity, collateral
B. charge, credit, capacity
18. Credit purchases cost more thaji cash purchases.
A, often true B, occasionally true C, rarely true
19. Among these four the lowest interest rates for loans are usually at:
A, credit cards B, pawn shops C, banks D, finance companies
20. If you loose your credit card, the maximum amount you can be responsible for is:
A, $0.00 B, $100,00 C, $50,00 D, no limit on the amount
21. Interest is: A. payment for the use of credit
B, rates charged for added payments C, principal X rate X down payment
22. Before signing any credit contract, you should: A. pay all payments
B. be sure "there are no blank spaces C. obtain a co-signer
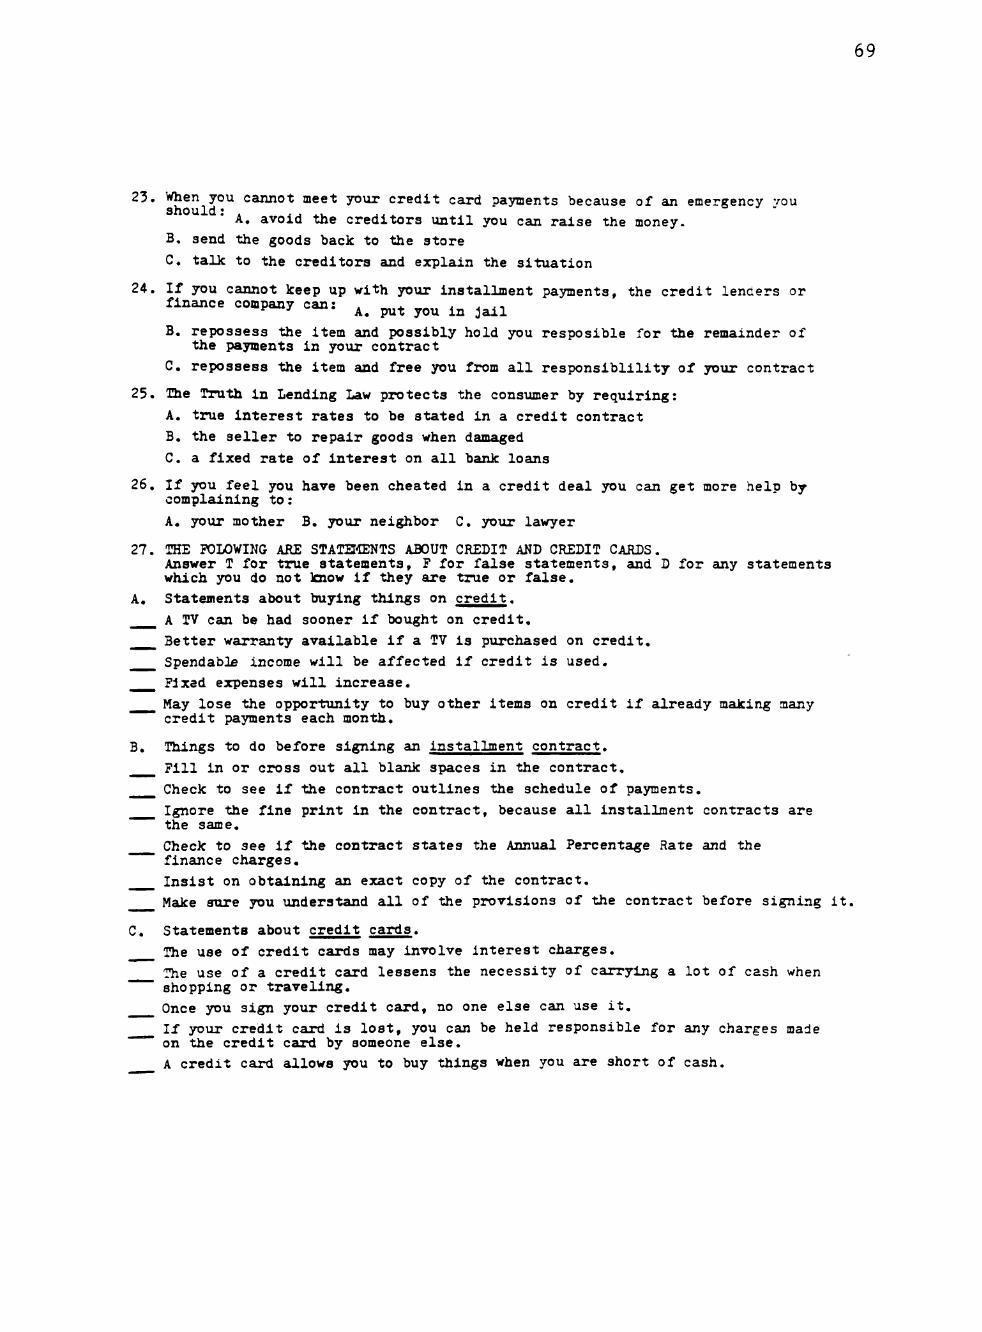
69
23. When you cannot meet yDur credit card payments because of an emergency vou should: . .j ^. j.^ ,, = -
A, avoid the creditors until you can raise the money. B, send -the goods back to the store
C, talk to the creditors and explain the situation
24. If you cannot keep up with your installment payments, the credit lenders or finance coopany can: ^^ ^^ ^^^ ^^ ^^^
B, repossess "the item and possibly hold you resposible for the remainder of the payments in your contract
C, repossess the item and free you from all responsiblility of your contract
25. Ihe Truth In Lending Law protects the consumer by requiring:
A, true interest rates to be stated in a credit contract
B, the seller to repair goods when damaged
C, a fixed rate of interest on all bank loans
26. If you feel you have been cheated in a credit deal you can get more help by complalning to:
A. your mother B, your neighbor C, your lawyer
27. THE FOLOWING ARZ STATETÍENTS AflOUT CREDIT AND CREDIT CARDS. Answer T for true statements, F for false statements, and D for émy statements which you do not Imow if they are true or false,
A, Statements about buying things on credit.
_ _ A TV can be had sooner if bought on credit,
Better warranty available if a TV is purchased on credit,
___ Spendablfi income will be affected if credit is used,
___ Flxad expenses will increase.
___ May lose the opportrunity to buy other items on credit if already making many credit pajmients each month,
B, Things to do before signing an installment contract,
___ Fill in or cross out all blank spaces in the contract,
___ Check to see if the contract outlines the schedule of payments,
___ Ignore the fine print in the contract, because all installment contracts are the same,
_ _ Check to see if the contract states the Annual Percentage Rate and the finance charges.
Insist on obtaining an exact copy of the contract,
Make sure you understand all of the provisions of the contract before signing it,
C, Statements about credit cards.
The use of credit cards may involve interest charges.
The use of a credit card lessens the necessity of carrying a lot of cash when shopping or traveling, Once you sign your credit card, no one else caui use it,
^ ^ If your credit card is lost, you can be held responsible for any charges made on the credit card by someone else.
A credit card allows you to buy things when you are short of cash.

70
FOR QUESTIONS 28 TO 34 CIHCLE TKE LETTER OF THE YOU JEZL IS CORRECT.
28, Who do you feel should pay a high school student's credit card bills?
A. the student B. the parents C. don't know D, it depends
29, In yoxir opinion, high school students should be allowed to use their parent's credit cards to the following degree:
A. all the time (for all purchaaes) B. some purchases C. not at all
30, There is a lot of talk about credit cards these days, amd we are interested in what you think about them, Would you say that using credit cards is a good thing, or a bad thing, or what?
A, good B. good with qualifications C, pro-con
D, bad with qualifications E, bad F. uncertian
31, In your opinion, teenagers should use credit for:
A. durable goods (car, stereo, motobikes, etc.)
B. nondurable goods (clothes, cosmetic items, etc.) C. no itema, except in case of extreme. necessity
32, In your opinion, do your parents: A, not charge enough with credit cards
B, charge the 'right amount of credit cards C, charge too much on credit cards
33, In you opinion, it is important to leam about the use of credit cards in school situations? ^ ^^ g^ „^ ^^ ^^^.^ ^^^ ^^ ^^^^ ^^
34, In your opinion, high school students should be allowed to use credit cards: A, more often B, less often C, the same D, not at all
35, What type of credit card do you feel teenagers should have? (You may check more than one,)
bank credit cards department store cards none
gas carda travel and entertainment cards
36, How important éire •these reaaons to save money? (Check one for each statement.) very moderately not very not important important iraportant importémt at all
To buy something you can't
afford now.
To t2Úce care of emergencies.
To pay for an education, _____ ____ ^ _
To get married, _ _ __ _ _ _ _
Just to have money in the bank. _ _ ____ _ ^
Because yo\ir family expects you to save money,
To eam interest on the money, ___ ___ ___ To avoid using credit to buy
something, ___ ___ ___ ___ Thank you for your cooperation.