in accordance with the requirements of en62209, en50360...
TRANSCRIPT
Compliance Certification Services Inc. Date of Issue: July 3, 2013 Report No .: C130627S01-SE
Note: This report shall not be reproduced except in full, without the written approval of Compliance
Certification Services Inc. This document may be altered or revised by Compliance Certification Services Inc. personnel only, and shall be noted in the revision section of the document.
Page 1 of 96
In accordance with the requirements of EN62209, EN50360 and COUNCIL RECOMMENDATION
1999/519/EC
CE SAR TEST REPORT
For
Product Name: WCDMA Mobile Phone
Brand Name: iOCEAN
Model No.: iOCEAN X7
Series No: N/A
Test Report Number:
C130627S01-SE
Issued to
Shenzhen IOCEAN Digital Communications Technology Co., Ltd Rm. 701, Tower B, FU'AN Technology Building, No. 013 Hi-tech Ave.1.S., Nanshan District,
Shenzhen, China
Issued by
Compliance Certification Services Inc. Kunshan Laboratory
No.10 Weiye Rd., Innovation park, Eco&Tec, Development Zone, Kunshan City, Jiangsu, China
TEL: 86-512-57355888 FAX: 86-512-57370818 http://www.ccsrf.com [email protected]

Compliance Certification Services Inc. Date of Issue: July 3, 2013 Report No .: C130627S01-SE
This report shall not be reproduced except in full, without the written approval of Compliance Certification Services. Page 2 of 96
Revision History
Revision REPORT NO. Date Page Revised Contents
Original C130627S01-SE July 3, 2013 N/A N/A

Compliance Certification Services Inc. Date of Issue: July 3, 2013 Report No .: C130627S01-SE
This report shall not be reproduced except in full, without the written approval of Compliance Certification Services. Page 3 of 96
TABLE OF CONTENTS 1. CERTIFICATE OF COMPLIANCE (SAR EVALUATION)................................................................ 4
2. EUT DESCRIPTION ........................................................................................................................ 5
3. REQUIREMENTS FOR COMPLIANCE TESTING DEFINED BY THE CE....................................... 6
4. DOSIMETRIC ASSESSMENT SETUP ............................................................................................ 7
4.1 MEASUREMENT SYSTEM DIAGRAM..................................................................................... 8
4.2 System Components ................................................................................................................ 9
5. EVALUATION PROCEDURES...................................................................................................... 12
6. MEASUREMENT UNCERTAINTY ................................................................................................ 15
7. EXPOSURE LIMIT......................................................................................................................... 16
8. EUT ARRANGEMENT................................................................................................................... 17
8.1 Anthropomorphic head phantom ............................................................................................ 17
8.2 Definition of the “Cheek/Touch” Position ................................................................................ 18
8.3 Definition of the “Tilted” Position............................................................................................. 19
9. MEASUREMENT RESULTS ......................................................................................................... 20
9.1 Test Liquids Confirmation....................................................................................................... 20
9.2 System Performance Check................................................................................................... 22
9.3 EUT Tune-up Procedures....................................................................................................... 25
9.4 SAR Measurement Results .................................................................................................... 28
10. EUT PHOTO .................................................................................................................................. 33
11. EQUIPMENT LIST & CALIBRATION STATUS ............................................................................. 37
12. FACILITIES ................................................................................................................................... 38
13. REFERENCES .............................................................................................................................. 38
14. ATTACHMENTS............................................................................................................................ 39
Appendix A: Plots of Performance Check......................................................................................... 40
Appendix B: DASY Calibration Certificate ........................................................................................ 45
Appendix B: DASY Calibration Certificate ........................................................................................ 45
Appendix C: Plots of SAR Test Result .............................................................................................. 96

Compliance Certification Services Inc. Date of Issue: July 3, 2013 Report No .: C130627S01-SE
This report shall not be reproduced except in full, without the written approval of Compliance Certification Services. Page 4 of 96
1. CERTIFICATE OF COMPLIANCE (SAR EVALUATION) Product Name: WCDMA Mobile Phone
Brand Name: iOCEAN Model Name: iOCEAN X7
Series Model: N/A Devices supporting
GPRS: Class B
Device Category: Production unit
Applicant: Address:
Shenzhen IOCEAN Digital Communications Technology Co., Ltd Rm. 701, Tower B, FU'AN Technology Building, No. 013 Hi-tech Ave.1.S., Nanshan District, Shenzhen, China
Manufacturer: Address:
Shenzhen IOCEAN Digital Communications Technology Co., Ltd Rm. 701, Tower B, FU'AN Technology Building, No. 013 Hi-tech Ave.1.S., Nanshan District, Shenzhen, China
Description Test Modes(worst
case ): SIM 1 and SIM2 is a chipset unit and tested as single chipset
Date of Test: June 28, 2013 & June 29, 2013 &J une 30, 2013 & July 1, 2013
Device Category: PORTABLE DEVICES
Exposure Category: GENERAL POPULATION/UNCONTROLLED EXPOSURE
Application Type: Certification
APPLICABLE STANDARDS
STANDARD TEST RESULT
EN62209-1:2006EN62209-2:2010
EN50360:2001EN62311:2008
No non-compliance noted
Deviation from Applicable Standard
None The device was tested by Compliance Certification Services Inc. in accordance with the measurement methods and procedures specified in EN62209. Testing has shown that this device is capable of compliance with localized specific absorption rate (SAR) specified in COUNCIL 1999/519/EC. The test results in this report apply only to the tested sample of the stated device/equipment. Other similar device/equipment will not necessarily produce the same results due to production tolerance and measurement uncertainties.
Approved by: Tested by:
Hui.Li RF Manager Compliance Certification Services Inc.
Jason Qiao Test Engineer Compliance Certification Services Inc.

Compliance Certification Services Inc. Date of Issue: July 3, 2013 Report No .: C130627S01-SE
This report shall not be reproduced except in full, without the written approval of Compliance Certification Services. Page 5 of 96
2. EUT DESCRIPTION Product Name: WCDMA Mobile Phone
Brand Name: iOCEAN Model Number: iOCEAN X7
Series Model: N/A Model Discrepancy: N/A
Frequency Range: GSM 900: 880.2 MHz to 914.8 MHz GSM1800: 1710.2 MHz to 1784.8 MHz WCDMA Band I: 1922MHz to 1978 MHz WI-FI IEEE 802.11b/g/20n:2412MHz to 2472 MHz
Operating Mode: Maximum continuous output
Max. Transmit Power: (Conducted average power)
GSM 900: 32.60 dBm GPRS900: 31.58 dBm DCS 1800: 30.83 dBm GPRS1800: 29.66 dBm WCDMA Band I: 23.83 dBm
WI-FI IEEE 802.11b: 15.69 dBm WI-FI IEEE 802.11g: 14.57 dBm WI-FI IEEE 802.1120n:14.28 dBmWI-FI IEEE 802.1140n:13.32 dBm
Max. SAR (10g):
Head: GSM 900:0.132 W/kg GSM 1800:0.084 W/kg WCDMA Band I:0.203 W/kg WI-FI IEEE 802.11b:0.055 W/kg
Body: GSM 900:0.158 W/kg GPRS900:0.220 W/kg GSM 1800:0.098 W/kg GPRS 1800:0.174 W/kg WCDMA Band I:0.382 W/kg WI-FI IEEE 802.11b:0.012 W/kg
Modulation Technique:
GSM / DCS: GMSK WCDMA:QPSK IEEE 802.11b: DSSS (CCK, DQPSK, DBPSK) IEEE 802.11g: DSSS (CCK, DQPSK,DBPSK)+OFDM (QPSK, BPSK, 16-QAM, 64-QAM) WI-FI IEEE 802.11n: OFDM(MCS 0-7)
Network Support: GSM/GPRS/WCDMA/WIFI/BT
GPRS Level: 12
Antenna Specification: GSM/WCDMA: PIFA antenna WIFI : PIFA antenna
Accessories:
Power supply and ADP(rating): Model No.: A31-1503B-501000 Input: AC100-240V, 0.2 A, 50/60 Hz Output: DC5V,1 A Battery(rating): Brand Name: iOCEAN Model No.: X7 Capacitance: 2000mAh Rated Voltage: 3.7 V Charging Limit: 4.2 V

Compliance Certification Services Inc. Date of Issue: July 3, 2013 Report No .: C130627S01-SE
This report shall not be reproduced except in full, without the written approval of Compliance Certification Services. Page 6 of 96
3. REQUIREMENTS FOR COMPLIANCE TESTING DEFINED BY THE CE According to Council Recommendation 1999/519/EC of 12 July 1999 on the limitation of exposure of the general public to electromagnetic fields (0 Hz to 300 GHz) (Official Journal L 197 of 30 July 1999).International Commission on Non-Ionising Radiation Protection (1998), Guidelines for limiting exposure in time-varying electric, magnetic, and electromagnetic fields (up to 300 GHz). Health Physics 74, 494-522. The European Standard (EN62209-1: 2006) was prepared by the technical committee CENELEC TC106, Electromagnetic fields in the human environment. For consumer products, the applicable limit is 2 W/Kg for Head and Trunk. The device should be evaluated at maximum output power (radiated from the antenna) under “worst-case” conditions for normal or intended use, incorporating normal antenna operating positions, device peak performance frequencies and positions for maximum RF energy coupling. The European Standard (EN 62209-2:2010) was prepared by the technical committee CENELEC TC106, for transmitters used in close proximity to the human ear SAR measurements shall be performed according to standard EN 62209-1:2006(EN62209-1: 2006), for transmitters used in close proximity to the human body SAR measurements shall be performed according to standard EN 62209-2:2010 Tests shall be performed with both phone positions described in 6.1.4., on the left and right sides of the head and using the centre frequency of each operating band. Then the configuration giving rise to the maximum mass-averaged SAR shall be used to test the low-end and the high-end frequencies of the transmitting band. If the mobile phone has a retractable antenna, all of the tests described above shall be performed both with the antenna extended and with it retracted. When considering multi-mode and multi-band mobile phones, all of the above tests shall be performed in each transmitting mode/band with the corresponding maximum peak power level.
Compliance Certification Services Inc. Date of Issue: July 3, 2013 Report No .: C130627S01-SE
This report shall not be reproduced except in full, without the written approval of Compliance Certification Services. Page 7 of 96
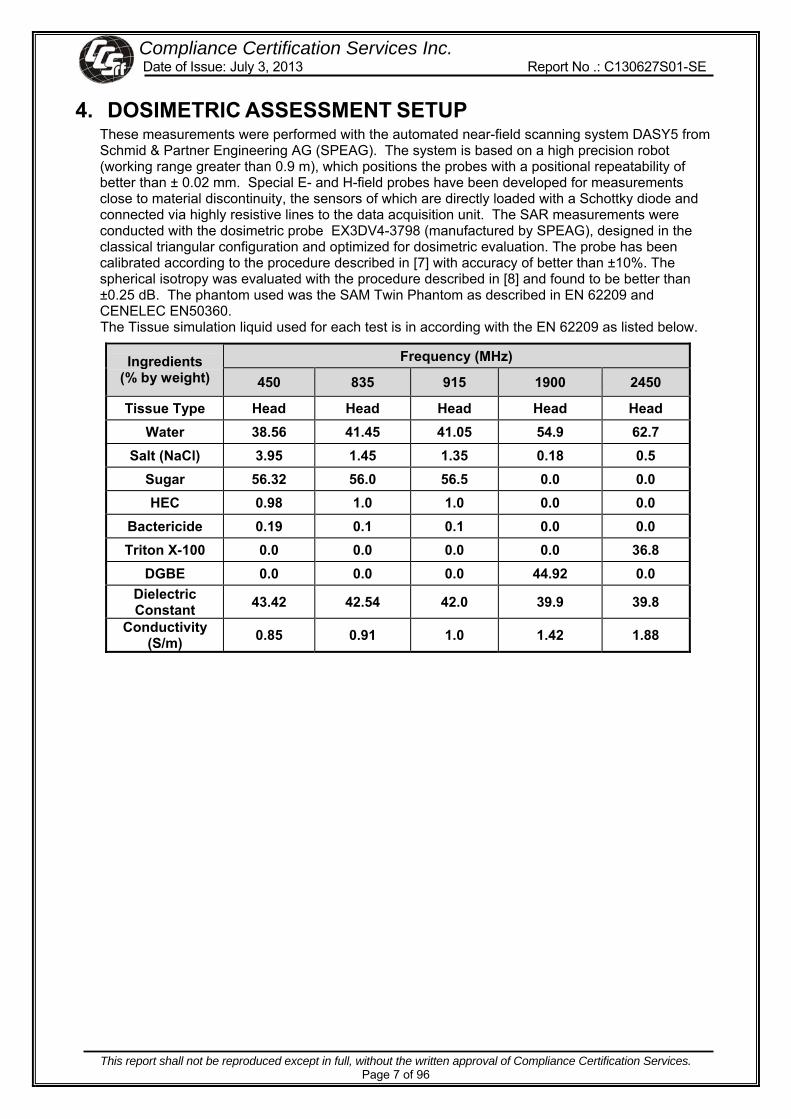
4. DOSIMETRIC ASSESSMENT SETUP These measurements were performed with the automated near-field scanning system DASY5 from Schmid & Partner Engineering AG (SPEAG). The system is based on a high precision robot (working range greater than 0.9 m), which positions the probes with a positional repeatability of better than ± 0.02 mm. Special E- and H-field probes have been developed for measurements close to material discontinuity, the sensors of which are directly loaded with a Schottky diode and connected via highly resistive lines to the data acquisition unit. The SAR measurements were conducted with the dosimetric probe EX3DV4-3798 (manufactured by SPEAG), designed in the classical triangular configuration and optimized for dosimetric evaluation. The probe has been calibrated according to the procedure described in [7] with accuracy of better than ±10%. The spherical isotropy was evaluated with the procedure described in [8] and found to be better than ±0.25 dB. The phantom used was the SAM Twin Phantom as described in EN 62209 and CENELEC EN50360. The Tissue simulation liquid used for each test is in according with the EN 62209 as listed below.
Frequency (MHz) Ingredients (% by weight) 450 835 915 1900 2450
Tissue Type Head Head Head Head Head Water 38.56 41.45 41.05 54.9 62.7
Salt (NaCl) 3.95 1.45 1.35 0.18 0.5 Sugar 56.32 56.0 56.5 0.0 0.0 HEC 0.98 1.0 1.0 0.0 0.0
Bactericide 0.19 0.1 0.1 0.0 0.0 Triton X-100 0.0 0.0 0.0 0.0 36.8
DGBE 0.0 0.0 0.0 44.92 0.0 Dielectric Constant 43.42 42.54 42.0 39.9 39.8
Conductivity (S/m) 0.85 0.91 1.0 1.42 1.88
Compliance Certification Services Inc. Date of Issue: July 3, 2013 Report No .: C130627S01-SE
This report shall not be reproduced except in full, without the written approval of Compliance Certification Services. Page 8 of 96
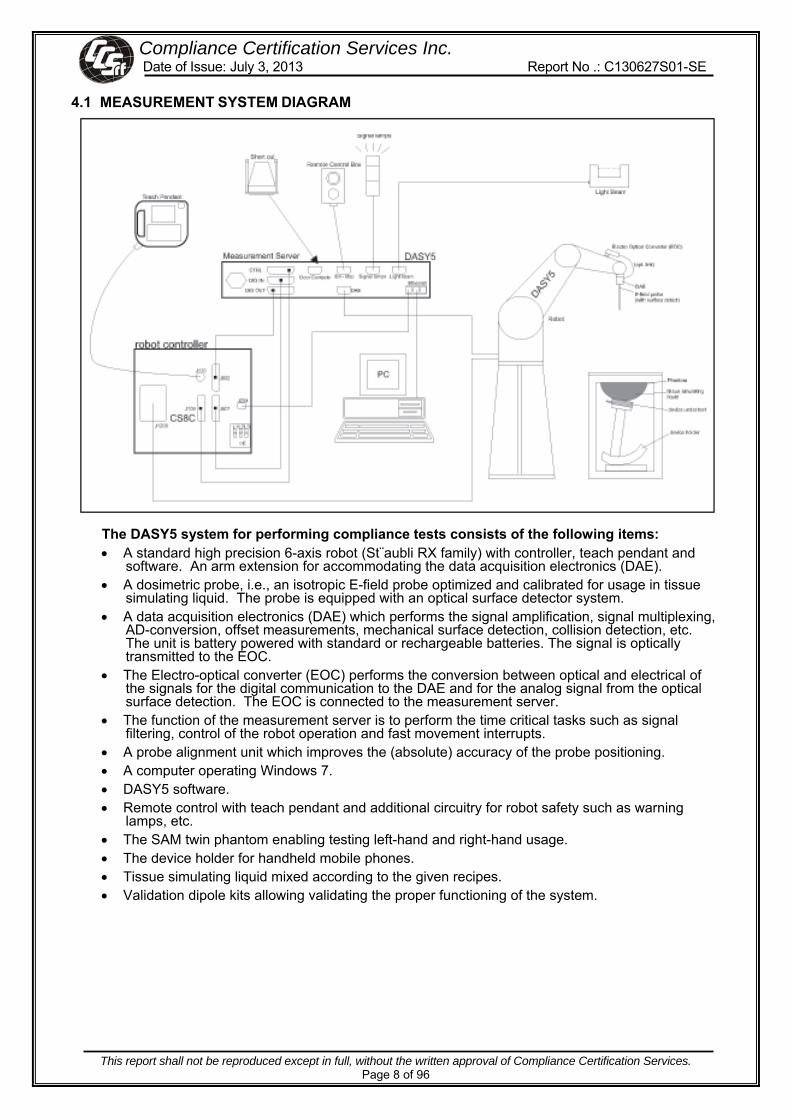
4.1 MEASUREMENT SYSTEM DIAGRAM
The DASY5 system for performing compliance tests consists of the following items: • A standard high precision 6-axis robot (St¨aubli RX family) with controller, teach pendant and
software. An arm extension for accommodating the data acquisition electronics (DAE). • A dosimetric probe, i.e., an isotropic E-field probe optimized and calibrated for usage in tissue
simulating liquid. The probe is equipped with an optical surface detector system. • A data acquisition electronics (DAE) which performs the signal amplification, signal multiplexing,
AD-conversion, offset measurements, mechanical surface detection, collision detection, etc. The unit is battery powered with standard or rechargeable batteries. The signal is optically transmitted to the EOC.
• The Electro-optical converter (EOC) performs the conversion between optical and electrical of the signals for the digital communication to the DAE and for the analog signal from the optical surface detection. The EOC is connected to the measurement server.
• The function of the measurement server is to perform the time critical tasks such as signal filtering, control of the robot operation and fast movement interrupts.
• A probe alignment unit which improves the (absolute) accuracy of the probe positioning. • A computer operating Windows 7. • DASY5 software. • Remote control with teach pendant and additional circuitry for robot safety such as warning
lamps, etc. • The SAM twin phantom enabling testing left-hand and right-hand usage. • The device holder for handheld mobile phones. • Tissue simulating liquid mixed according to the given recipes. • Validation dipole kits allowing validating the proper functioning of the system.

Compliance Certification Services Inc. Date of Issue: July 3, 2013 Report No .: C130627S01-SE
This report shall not be reproduced except in full, without the written approval of Compliance Certification Services. Page 9 of 96
4.2 SYSTEM COMPONENTS DASY5 Measurement Server
The DASY5 measurement server is based on a PC/104 CPU board with a 400MHz intel ULV celeron, 128MB chip-disk and 128 MB RAM. The necessary circuits for communication with either the DAE4(or DAE3) electronic box as well as the 16-bit AD-converter system for optical detection and digital I/O interface are contained on the DASY5 I/O-board, which is directly connected to the PC/104 bus of the CPU board.
The measurement server performs all real-time data evaluation for field measurements and surface detection, controls robot movements and handles safety operation.
The PC-operating system cannot interfere with these time critical processes. All connections are supervised by a watchdog, and disconnection of any of the cables to the measurement server will automatically disarm the robot and disable all program-controlled robot movements. Furthermore, the measurement server is equipped with two expansion slots which are reserved for future applications. Please note that the expansion slots do not have a standardized pinout and therefore only the expansion cards provided by SPEAG can be inserted. Expansion cards from any other supplier could seriously damage the measurement server. Calibration: No calibration required.
Data Acquisition Electronics (DAE4)
The data acquisition electronics (DAE4) consists of a highly sensitive electrometer grade preamplifier with auto-zeroing, a channel and gain-switching multiplexer, a fast 16 bit AD converter and a command decoder and control logic unit. Transmission to the measurement server is accomplished through an optical downlink for data and status information as well as an optical uplink for commands and the clock. The mechanical probe mounting device includes two different sensor systems for frontal and sideways probe contacts. They are used for mechanical surface detection and probe collision detection. The input impedance of the DAE4 box is 200MOhm; the inputs are symmetrical and floating. Common mode rejection is above 80 dB.
EX3DV4 Isotropic E-Field Probe for Dosimetric Measurements
Construction: Symmetrical design with triangular core Built-in shielding against static charges PEEK enclosure material (resistant to organic solvents, e.g., DGBE)
Calibration: Basic Broad Band Calibration in air: 10-3000 MHz. Conversion Factors (CF) for HSL 900 and HSL 1800 CF-Calibration for other liquids and frequencies upon request.
Frequency: 10 MHz to > 6 GHz; Linearity: ± 0.2 dB (30 MHz to 3 GHz)
Directivity: ± 0.3 dB in HSL (rotation around probe axis) ± 0.5 dB in HSL (rotation normal to probe axis)
Dynamic Range: 10 µW/g to > 100 mW/g; Linearity: ± 0.2 dB (noise: typically < 1 µW/g)

Compliance Certification Services Inc. Date of Issue: July 3, 2013 Report No .: C130627S01-SE
This report shall not be reproduced except in full, without the written approval of Compliance Certification Services. Page 10 of 96
Dimensions: Overall length: 337 mm (Tip: 9 mm)
Tip diameter: 2.5 mm (Body: 10 mm) Distance from probe tip to dipole centers: 1 mm
Application: High precision dosimetric measurements in any exposure scenario (e.g., very strong gradient fields). Only probe which enables compliance testing for frequencies up to 6 GHz with precision of better 30%.
Interior of probe SAM Twin Phantom Construction: The shell corresponds to the
specifications of the Specific Anthropomorphic Mannequin (SAM) phantom defined in IEEE 1528-200X, CENELEC 50360 and IEC 62209. It enables the dosimetric evaluation of left and right hand phone usage as well as body mounted usage at the flat phantom region. A cover prevents evaporation of the liquid. Reference markings on the phantom allow the complete setup of all predefined phantom positions and measurement grids by manually teaching three points with the robot.
Shell Thickness: 2 ±0.2 mm Filling Volume: Approx. 25 liters Dimensions: Height: 850mm; Length: 1000mm; Width:
750mm
SAM Phantom (ELI4 v4.0) Description Construction:
Phantom for compliance testing of handheld and body-mounted wireless devices in the frequency range of 30 MHz to 6 GHz. ELI4 is fully compatible with the latest draft of the standard IEC 62209 Part II and all known tissue simulating liquids. ELI4 has been optimized regarding its performance and can be integrated into our standard phantom tables. A cover prevents evaporation of the liquid. Reference markings on the phantom allow installation of the complete setup, including all predefined phantom positions and measurement grids, by teaching three points. The phantom is supported by software version DASY4/DASY5.5 and higher and is compatible with all SPEAG dosimetric probes and dipoles
Shell Thickness: 2.0 ± 0.2 mm (sagging: <1%) Filling Volume: Approx. 25 liters Dimensions: Major ellipse axis: 600 mm Minor axis: 400 mm 500mm

Compliance Certification Services Inc. Date of Issue: July 3, 2013 Report No .: C130627S01-SE
This report shall not be reproduced except in full, without the written approval of Compliance Certification Services. Page 11 of 96
Device Holder for SAM Twin Phantom Construction: In combination with the Twin SAM Phantom, the
Mounting Device (made from POM) enables the rotation of the mounted transmitter in spherical coordinates, whereby the rotation point is the ear opening. The devices can be easily and accurately positioned according to IEC, IEEE, CENELEC, FCC or other specifications. The device holder can be locked at different phantom locations (left head, right head, and flat phantom).
System Validation Kits for SAM Twin Phantom Construction: Symmetrical dipole with l/4 balun Enables
measurement of feedpoint impedance with NWA Matched for use near flat phantoms filled with brain simulating solutions Includes distance holder and tripod adaptor.
Frequency: 900,1800,2450,5800 MHz Return loss: > 20 dB at specified validation position Power capability: > 100 W (f < 1GHz); > 40 W (f > 1GHz)
Dimensions: D900V2: dipole length: 148.5 mm; overall height: 340 mmD1800V2: dipole length: 72.5 mm; overall height: 300 mmD1900V2: dipole length: 67.7 mm; overall height: 300 mm
D2450V2: dipole length: 51.5 mm; overall height: 290 mm D5GHzV2: dipole length: 20.6 mm; overall height: 300 mmSystem Validation Kits for ELI4 phantom Construction: Symmetrical dipole with l/4 balun Enables
measurement of feedpoint impedance with NWA Matched for use near flat phantoms filled with brain simulating solutions Includes distance holder and tripod adaptor.
Frequency: 900, 1800, 2450, 5800 MHz Return loss: > 20 dB at specified validation position Power capability: > 100 W (f < 1GHz); > 40 W (f > 1GHz)
Dimensions: D900V2: dipole length: 148.5 mm; overall height: 340 mmD1800V2: dipole length: 72.5 mm; overall height: 300 mmD1900V2: dipole length: 67.7 mm; overall height: 300 mmD2450V2: dipole length: 51.5 mm; overall height: 290 mm
D5GHzV2: dipole length: 20.6 mm; overall height: 300 mm

Compliance Certification Services Inc. Date of Issue: July 3, 2013 Report No .: C130627S01-SE
This report shall not be reproduced except in full, without the written approval of Compliance Certification Services. Page 12 of 96
5. EVALUATION PROCEDURES DATA EVALUATION The DASY 5 post processing software automatically executes the following procedures to calculate the field units from the microvolt readings at the probe connector. The parameters used in the evaluation are stored in the configuration modules of the software:
Probe parameters: - Sensitivity Normi, ai0, ai1, ai2
- Conversion factor ConvFi
- Diode compression point dcpi
Device parameters: - Frequency f - Crest factor cf Media parameters: - Conductivity σ - Density ρ
These parameters must be set correctly in the software. They can be found in the component documents or be imported into the software from the configuration files issued for the DASY 5 components. In the direct measuring mode of the multi-meter option, the parameters of the actual system setup are used. In the scan visualization and export modes, the parameters stored in the corresponding document files are used.
The first step of the evaluation is a linearization of the filtered input signal to account for the compression characteristics of the detector diode. The compensation depends on the input signal, the diode type and the DC-transmission factor from the diode to the evaluation electronics. If the exciting field is pulsed, the crest factor of the signal must be known to correctly compensate for peak power. The formula for each channel can be given as:
iiii dcp
cfUUV ⋅+= 2
with Vi = Compensated signal of channel i (i = x, y, z) Ui = Input signal of channel i (i = x, y, z) cf = Crest factor of exciting field (DASY 5 parameter) dcpi = Diode compression point (DASY 5 parameter)
From the compensated input signals the primary field data for each channel can be evaluated:
E-field probes: ConvFNorm
VEi
ii •=
H-field probes: f
fafaaViH
iii
i
2
121110 ++⋅=
with Vi = Compensated signal of channel i (i = x, y, z) Normi = Sensor sensitivity of channel i (i = x, y, z)
μV/(V/m)2 for E0field Probes ConvF = Sensitivity enhancement in solution aij = Sensor sensitivity factors for H-field probes f = Carrier frequency (GHz) Ei = Electric field strength of channel i in V/m Hi = Magnetic field strength of channel i in A/m
The RSS value of the field components gives the total field strength (Hermitian magnitude):
EEEE zyxtot222 ++=

Compliance Certification Services Inc. Date of Issue: July 3, 2013 Report No .: C130627S01-SE
This report shall not be reproduced except in full, without the written approval of Compliance Certification Services. Page 13 of 96
The primary field data are used to calculate the derived field units.
10002
⋅⋅=ρ
σESAR tot
with SAR = local specific absorption rate in mW/g Etot = total field strength in V/m σ = conductivity in [mho/m] or [Siemens/m] ρ = equivalent tissue density in g/cm3
Note that the density is normally set to 1 (or 1.06), to account for actual brain density rather than the density of the simulation liquid.
The power flow density is calculated assuming the excitation field as a free space field.
37702EP tot
pwe = or 7.372 ⋅= HP totpwe
with Ppwe = Equivalent power density of a plane wave in mW/cm2 Etot = total electric field strength in V/m
Htot = total magnetic field strength in A/m
SAR EVALUATION PROCEDURES The procedure for assessing the peak spatial-average SAR value consists of the following steps:
• Power Reference Measurement The reference and drift jobs are useful jobs for monitoring the power drift of the device under test in the batch process. Both jobs measure the field at a specified reference position, at a selectable distance from the phantom surface. The reference position can be either the selected section’s grid reference point or a user point in this section. The reference job projects the selected point onto the phantom surface, orients the probe perpendicularly to the surface, and approaches the surface using the selected detection method.
• Area Scan The area scan is used as a fast scan in two dimensions to find the area of high field values, before doing a finer measurement around the hot spot. The sophisticated interpolation routines implemented in DASY 5 software can find the maximum locations even in relatively coarse grids. The scan area is defined by an editable grid. This grid is anchored at the grid reference point of the selected section in the phantom. When the area scan’s property sheet is brought-up, grid was at to 15 mm by 15 mm and can be edited by a user.
• Zoom Scan Zoom scans are used to assess the peak spatial SAR values within a cubic averaging volume containing 1 g and 10 g of simulated tissue. The default zoom scan measures 5 x 5 x 7 points within a cube whose base faces are centered around the maximum found in a preceding area scan job within the same procedure. If the preceding Area Scan job indicates more then one maximum, the number of Zoom Scans has to be enlarged accordingly (The default number inserted is 1).
• Power Drift measurement The drift job measures the field at the same location as the most recent reference job within the same procedure, and with the same settings. The drift measurement gives the field difference in dB from the reading conducted within the last reference measurement. Several drift measurements are possible for one reference measurement. This allows a user to monitor the power drift of the device under test within a batch process. In the properties of the Drift job, the user can specify a limit for the drift and have DASY 5 software stop the measurements if this limit is exceeded.

Compliance Certification Services Inc. Date of Issue: July 3, 2013 Report No .: C130627S01-SE
This report shall not be reproduced except in full, without the written approval of Compliance Certification Services. Page 14 of 96
SPATIAL PEAK SAR EVALUATION The procedure for spatial peak SAR evaluation has been implemented according to the IEEE1529 standard. It can be conducted for 1 g and 10 g. The DASY 5 system allows evaluations that combine measured data and robot positions, such as:
• maximum search • extrapolation • boundary correction • peak search for averaged SAR
During a maximum search, global and local maximum searches are automatically performed in 2-D after each Area Scan measurement with at least 6 measurement points. It is based on the evaluation of the local SAR gradient calculated by the Quadratic Shepard’s method. The algorithm will find the global maximum and all local maxima within -2 dB of the global maxima for all SAR distributions.
Extrapolation Extrapolation routines are used to obtain SAR values between the lowest measurement points and the inner phantom surface. The extrapolation distance is determined by the surface detection distance and the probe sensor offset. Several measurements at different distances are necessary for the extrapolation. Extrapolation routines require at least 10 measurement points in 3-D space. They are used in the Cube Scan to obtain SAR values between the lowest measurement points and the inner phantom surface. The routine uses the modified Quadratic Shepard’s method for extrapolation. For a grid using 5x5x7 measurement points with 5mm resolution amounting to 343 measurement points, the uncertainty of the extrapolation routines is less than 1% for 1 g and 10 g cubes. Boundary effect For measurements in the immediate vicinity of a phantom surface, the field coupling effects between the probe and the boundary influence the probe characteristics. Boundary effect errors of different dosimetric probe types have been analyzed by measurements and using a numerical probe model. As expected, both methods showed an enhanced sensitivity in the immediate vicinity of the boundary. The effect strongly depends on the probe dimensions and disappears with increasing distance from the boundary. The sensitivity can be approximately given as:
Since the decay of the boundary effect dominates for small probes (a<<λ), the cos-term can be omitted. Factors Sb (parameter Alpha in the DASY 5 software) and a (parameter Delta in the DASY 5 software) are assessed during probe calibration and used for numerical compensation of the boundary effect. Several simulations and measurements have confirmed that the compensation is valid for different field and boundary configurations. This simple compensation procedure can largely reduce the probe uncertainty near boundaries. It works well as long as:
• the boundary curvature is small • the probe axis is angled less than 30_ to the boundary normal • the distance between probe and boundary is larger than 25% of the probe diameter • the probe is symmetric (all sensors have the same offset from the probe tip)
Since all of these requirements are fulfilled in a DASY 5 system, the correction of the probe boundary effect in the vicinity of the phantom surface is performed in a fully automated manner via the measurement data extraction during post processing.
Compliance Certification Services Inc. Date of Issue: July 3, 2013 Report No .: C130627S01-SE
This report shall not be reproduced except in full, without the written approval of Compliance Certification Services. Page 15 of 96
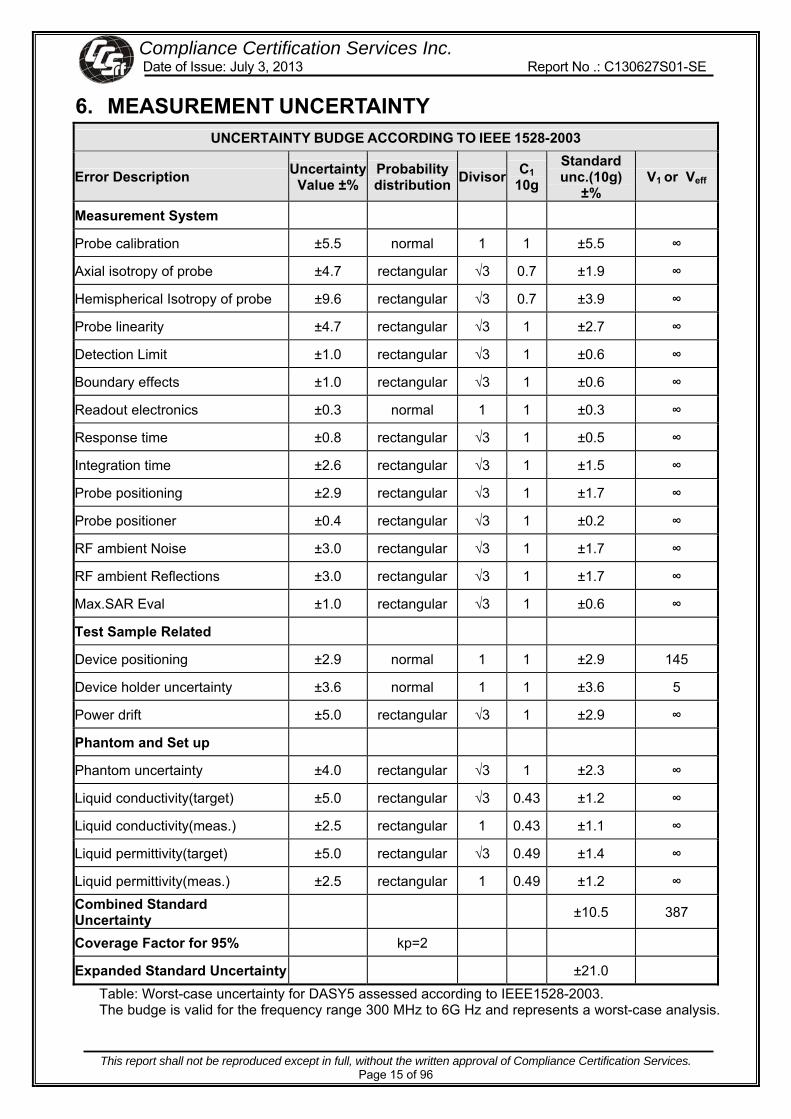
6. MEASUREMENT UNCERTAINTY UNCERTAINTY BUDGE ACCORDING TO IEEE 1528-2003
Error Description UncertaintyValue ±%
Probabilitydistribution Divisor C1
10gStandard unc.(10g)
±% V1 or Veff
Measurement System
Probe calibration ±5.5 normal 1 1 ±5.5 ∞
Axial isotropy of probe ±4.7 rectangular √3 0.7 ±1.9 ∞
Hemispherical Isotropy of probe ±9.6 rectangular √3 0.7 ±3.9 ∞
Probe linearity ±4.7 rectangular √3 1 ±2.7 ∞
Detection Limit ±1.0 rectangular √3 1 ±0.6 ∞
Boundary effects ±1.0 rectangular √3 1 ±0.6 ∞
Readout electronics ±0.3 normal 1 1 ±0.3 ∞
Response time ±0.8 rectangular √3 1 ±0.5 ∞
Integration time ±2.6 rectangular √3 1 ±1.5 ∞
Probe positioning ±2.9 rectangular √3 1 ±1.7 ∞
Probe positioner ±0.4 rectangular √3 1 ±0.2 ∞
RF ambient Noise ±3.0 rectangular √3 1 ±1.7 ∞
RF ambient Reflections ±3.0 rectangular √3 1 ±1.7 ∞
Max.SAR Eval ±1.0 rectangular √3 1 ±0.6 ∞
Test Sample Related
Device positioning ±2.9 normal 1 1 ±2.9 145
Device holder uncertainty ±3.6 normal 1 1 ±3.6 5
Power drift ±5.0 rectangular √3 1 ±2.9 ∞
Phantom and Set up
Phantom uncertainty ±4.0 rectangular √3 1 ±2.3 ∞
Liquid conductivity(target) ±5.0 rectangular √3 0.43 ±1.2 ∞
Liquid conductivity(meas.) ±2.5 rectangular 1 0.43 ±1.1 ∞
Liquid permittivity(target) ±5.0 rectangular √3 0.49 ±1.4 ∞
Liquid permittivity(meas.) ±2.5 rectangular 1 0.49 ±1.2 ∞ Combined Standard Uncertainty ±10.5 387
Coverage Factor for 95% kp=2
Expanded Standard Uncertainty ±21.0 Table: Worst-case uncertainty for DASY5 assessed according to IEEE1528-2003. The budge is valid for the frequency range 300 MHz to 6G Hz and represents a worst-case analysis.

Compliance Certification Services Inc. Date of Issue: July 3, 2013 Report No .: C130627S01-SE
This report shall not be reproduced except in full, without the written approval of Compliance Certification Services. Page 16 of 96
7. EXPOSURE LIMIT (A). Limits for Occupational/Controlled Exposure (W/kg)
Whole-Body Partial-Body Hands, Wrists, Feet and Ankles
0.4 10.0 20.0
(B). Limits for General Population/Uncontrolled Exposure (W/kg)
Whole-Body Partial-Body Hands, Wrists, Feet and Ankles
0.08 2.0 4.0
NOTE: Whole-Body SAR is averaged over the entire body, partial-body SAR is averaged over any 10 gram of tissue defined as a tissue volume in the shape of a cube. SAR for hands, wrists, feet and ankles is averaged over any 10 grams of tissue defined as a tissue volume in the shape of a cube.
Population/Uncontrolled Environments: are defined as locations where there is the exposure of individuals who have no knowledge or control of their exposure.
Occupational/Controlled Environments: are defined as locations where there is exposure that may be incurred by people who are aware of the potential for exposure, (i.e. as a result of employment or occupation).
NOTE HEAD AND TRUNK LIMIT
2.0 W/kg APPLIED TO THIS EUT

Compliance Certification Services Inc. Date of Issue: July 3, 2013 Report No .: C130627S01-SE
This report shall not be reproduced except in full, without the written approval of Compliance Certification Services. Page 17 of 96
8. EUT ARRANGEMENT Please refer to EN 62209 illustration below.
8.1 ANTHROPOMORPHIC HEAD PHANTOM The phantom shell material shall be resistant to all ingredients used in the tissue-equivalent liquid recipes. The shell of the phantom including ear spacers shall be constructed from low permittivity and low loss material, with a relative permittivity 5 and a loss tangent 0,05. The shape of the phantom shall have a tolerance of less than 0,2 mm with respect to the CAD file of the SAM phantom. In any area within the projection of the handset, the shell thickness shall be (2 0,2) mm, except for the ears and the extended perimeter walls (as shown in Figure 2). The low-loss ear spacers (same material as the head shell) shall provide a 6 mm spacing from the tissue-equivalent liquid boundary at the ear reference points (ERPs), within a tolerance of less than 0,2 mm. In the central strip region within 1,0 cm of the central sagittal
plane (Figure 1), the tolerance shall be +1,0 mm.
Figure 1
Front, back and side view of SAM (model for the phantom shell)
Figure 2
Close up side view of phantom showing the ear region

Compliance Certification Services Inc. Date of Issue: July 3, 2013 Report No .: C130627S01-SE
This report shall not be reproduced except in full, without the written approval of Compliance Certification Services. Page 18 of 96
8.2 DEFINITION OF THE “CHEEK/TOUCH” POSITION The cheek position is established in points a) to i) as follows. a) Ready the handset for talk operation, if necessary. For example, for handsets with a cover
piece (flip cover), open the cover. If the device can also be used with the cover closed, both configurations shall be tested.
b) Define two imaginary lines on the handset, the vertical centreline and the horizontal line,
for the handset in vertical orientation as shown in Figures 5a and 5b. The vertical centreline passes through two points on the front side of the handset: the midpoint of the width wt of the handset at the level of the acoustic output (point A in Figures 5a and 5b), and the midpoint of the width wb of the bottom of the handset (point B). The horizontal line is perpendicular to the vertical centreline and passes through the centre of the acoustic output (see Figures 5a and 5b). The two lines intersect at point A. Note that for many handsets, point A coincides with the centre of the acoustic output. However, the acoustic output may be located elsewhere on the horizontal line. Also note that the vertical centreline is not necessarily parallel to the front face of the handset (see Figure 5b), especially for clam-shell handsets, handsets with flip cover pieces, and other irregularly shaped handsets.
c) Position the handset close to the surface of the phantom such that point A is on the
(virtual) extension of the line passing through points RE and LE on the phantom (see Figure 6). The plane defined by the vertical centreline and the horizontal line of the device must be parallel to the sagittal plane of the phantom. d) Translate the handset towards the phantom along the line passing through RE and LE until the handset touches the ear.
e) Rotate the handset around the (virtual) LE-RE Line until the DUT vertical centreline is in
the reference plane. f) Rotate the device around its vertical centreline until the plane defined by the DUT vertical
centreline and horizontal line is parallel to the N-F Line, then translate the handset towards the phantom along the LE-RE line until DUT point A touches the ear at the ERP. g) While keeping point A on the line passing through RE and LE and maintaining the handset in contact with the pinna, rotate the handset about the line N-F until any point on the handset is in contact with a phantom point below the pinna (cheek) (see Figure 6). The physical angles of rotation shall be documented.
h) While keeping DUT point A in contact with the ERP, rotate the handset around a line
perpendicular to the plane defined by the DUT vertical centreline and horizontal line and passing through DUT point A, until the DUT vertical centreline is in the reference plane.
i) Verify that the cheek position is correct as follows:
— the N-F line is in the plane defined by the DUT vertical centreline and horizontal line,
— DUT point A touches the pinna at the ERP, and — the DUT vertical centreline is in the reference plane.
Figure6 Phone “cheek” or “touch” position. The reference points for the right ear (RE), left ear (LE)
and mouth (M), which define the reference plane for handset positioning, are indicated.

Compliance Certification Services Inc. Date of Issue: July 3, 2013 Report No .: C130627S01-SE
This report shall not be reproduced except in full, without the written approval of Compliance Certification Services. Page 19 of 96
Figure 5a Figure 5b
8.3 DEFINITION OF THE “TILTED” POSITION The “tilted” position is defined as follows:
a. Repeat steps (a) – (g) of 8.2 to place the device in the “cheek position.”
b. While maintaining the orientation of the handset move the handset away from the pinna along the line passing through RE and LE in order to enable a rotation of the handset by 15 degrees.
c. Rotate the handset around the horizontal line by 15 degrees.
d. While maintaining the orientation of the handset, move the handset towards the phantom on a line passing through RE and LE until any part of the handset touches the ear. The tilted position is obtained when the contact is on the pinna. If the contact is at any location other than the pinna (e.g., the antenna with the back of the phantom head), the angle of the handset should be reduced. In this case, the tilted position is obtained if any part of the handset is in contact with the pinna as well as a second part of the handset is contact with the phantom (e.g., the antenna with the back of the head).
Figure 7 Phone “tilted” position. The reference points for the right ear (RE), left ear (LE) and mouth (M), which define the reference plane for handset positioning, are indicated.
Compliance Certification Services Inc. Date of Issue: July 3, 2013 Report No .: C130627S01-SE
This report shall not be reproduced except in full, without the written approval of Compliance Certification Services. Page 20 of 96
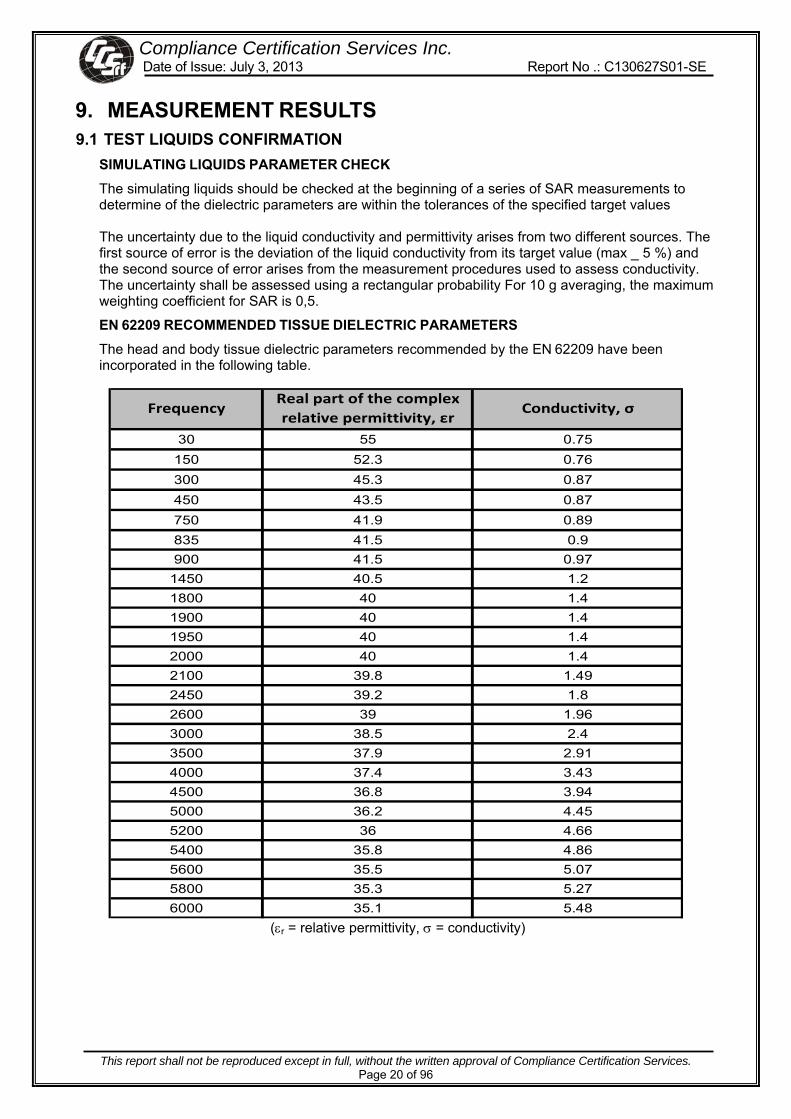
9. MEASUREMENT RESULTS 9.1 TEST LIQUIDS CONFIRMATION
SIMULATING LIQUIDS PARAMETER CHECK The simulating liquids should be checked at the beginning of a series of SAR measurements to determine of the dielectric parameters are within the tolerances of the specified target values The uncertainty due to the liquid conductivity and permittivity arises from two different sources. The first source of error is the deviation of the liquid conductivity from its target value (max _ 5 %) and the second source of error arises from the measurement procedures used to assess conductivity. The uncertainty shall be assessed using a rectangular probability For 10 g averaging, the maximum weighting coefficient for SAR is 0,5.
EN 62209 RECOMMENDED TISSUE DIELECTRIC PARAMETERS The head and body tissue dielectric parameters recommended by the EN 62209 have been incorporated in the following table.
30 55 0.75150 52.3 0.76300 45.3 0.87450 43.5 0.87750 41.9 0.89835 41.5 0.9900 41.5 0.97
1450 40.5 1.21800 40 1.41900 40 1.41950 40 1.42000 40 1.42100 39.8 1.492450 39.2 1.82600 39 1.963000 38.5 2.43500 37.9 2.914000 37.4 3.434500 36.8 3.945000 36.2 4.455200 36 4.665400 35.8 4.865600 35.5 5.075800 35.3 5.276000 35.1 5.48
Real part of the complexrelative permittivity, εr
Conductivity, σFrequency
(εr = relative permittivity, σ = conductivity)
Compliance Certification Services Inc. Date of Issue: July 3, 2013 Report No .: C130627S01-SE
This report shall not be reproduced except in full, without the written approval of Compliance Certification Services. Page 21 of 96
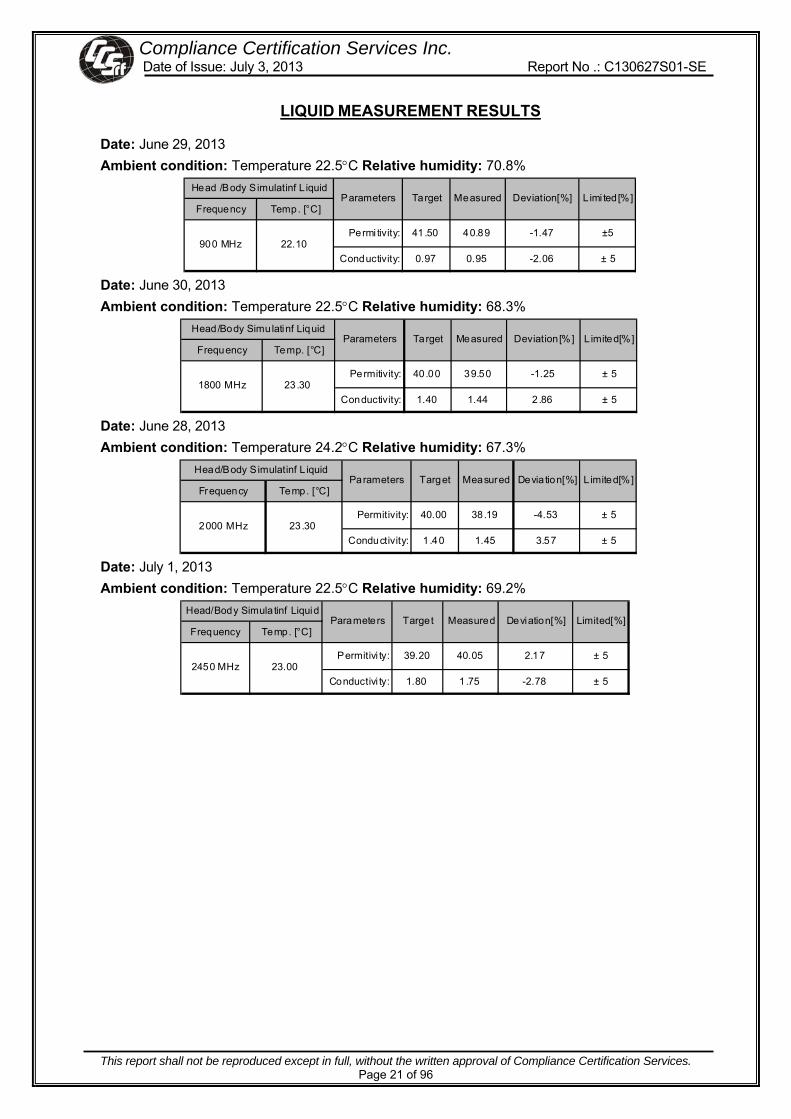
LIQUID MEASUREMENT RESULTS
Date: June 29, 2013 Ambient condition: Temperature 22.5°C Relative humidity: 70.8%
Frequency Temp. [°C]
Permi tivity: 41.50 40.89 -1.47 ±5
Conductivity: 0.97 0.95 -2.06 ± 522.10
Deviation[%] L imi ted[%]Parameters Target MeasuredHead /Body Simulatinf L iquid
900 MHz
Date: June 30, 2013 Ambient condition: Temperature 22.5°C Relative humidity: 68.3%
Frequency Temp. [°C]
Permitivity: 40.00 39.50 -1.25 ± 5
Conductivity: 1.40 1.44 2.86 ± 523.30
Deviation[%] L imited[%]Parameters Target MeasuredHead/Body Simulatinf Liquid
1800 MHz
Date: June 28, 2013 Ambient condition: Temperature 24.2°C Relative humidity: 67.3%
Frequency Temp. [°C]
Permitivity: 40.00 38.19 -4.53 ± 5
Conductivity: 1 .40 1.45 3.57 ± 523.30
Devia tion[%] L imited[%]Parameters Target MeasuredHead/Body Simulatinf L iquid
2000 MHz
Date: July 1, 2013 Ambient condition: Temperature 22.5°C Relative humidity: 69.2%
Frequency Temp. [°C]
Permitivi ty: 39.20 40.05 2.17 ± 5
Conductivi ty: 1.80 1.75 -2.78 ± 523.00
Deviation[%] Limited[%]Parameters Target MeasuredHead/Body Simulatinf Liquid
2450 MHz

Compliance Certification Services Inc. Date of Issue: July 3, 2013 Report No .: C130627S01-SE
This report shall not be reproduced except in full, without the written approval of Compliance Certification Services. Page 22 of 96
9.2 SYSTEM PERFORMANCE CHECK The system performance check is performed prior to any usage of the system in order to guarantee reproducible results. The system performance check verifies that the system operates within its specifications of ±5%. The system performance check results are tabulated below. And also the corresponding SAR plot is attached as well in the SAR plots files. EN 62209 Recommended Reference Value
Frequency (MHz) 1 g SAR 10 g SAR Local SAR at surface
(Above feed point) Local SAR at surface
(y=2cm offset from feed point)300 3.0 2.0 4.4 2.1 450 4.9 3.3 7.2 3.2 835 9.5 6.2 14.1 4.9 900 10.8 6.9 16.4 5.4
1450 29.0 16.0 50.2 6.5 1800 38.1 19.8 69.5 6.8 1900 38.8 20.4 67.6 6.6 2000 41.1 21.1 74.6 6.5 2450 52.4 24.0 104.2 7.7 3000 63.8 25.7 140.2 9.5
SYSTEM PERFORMANCE CHECK MEASUREMENT CONDITIONS
• The measurements were performed in the flat section of the SAM twin phantom filled with Head and Bodysimulating liquid of the following parameters.
• The DASY5 system with an E-fileld probe EX3DV4 SN: 3798 was used for the measurements.
• The dipole was mounted on the small tripod so that the dipole feed point was positioned below the center marking of the flat phantom section and the dipole was oriented parallel to the body axis (the long side of the phantom). The standard measuring distance was 15 mm (below 1 GHz) and 10 mm (above 1 GHz) from dipole center to the simulating liquid surface.
• The dipole input power (forward power) was 250 mW.
• The 1g and 10 g spatial average SAR values normalized to 1 W dipole input power give reference data for comparisons and it’s equal to 4x(dipole forward power).
Compliance Certification Services Inc. Date of Issue: July 3, 2013 Report No .: C130627S01-SE
This report shall not be reproduced except in full, without the written approval of Compliance Certification Services. Page 23 of 96
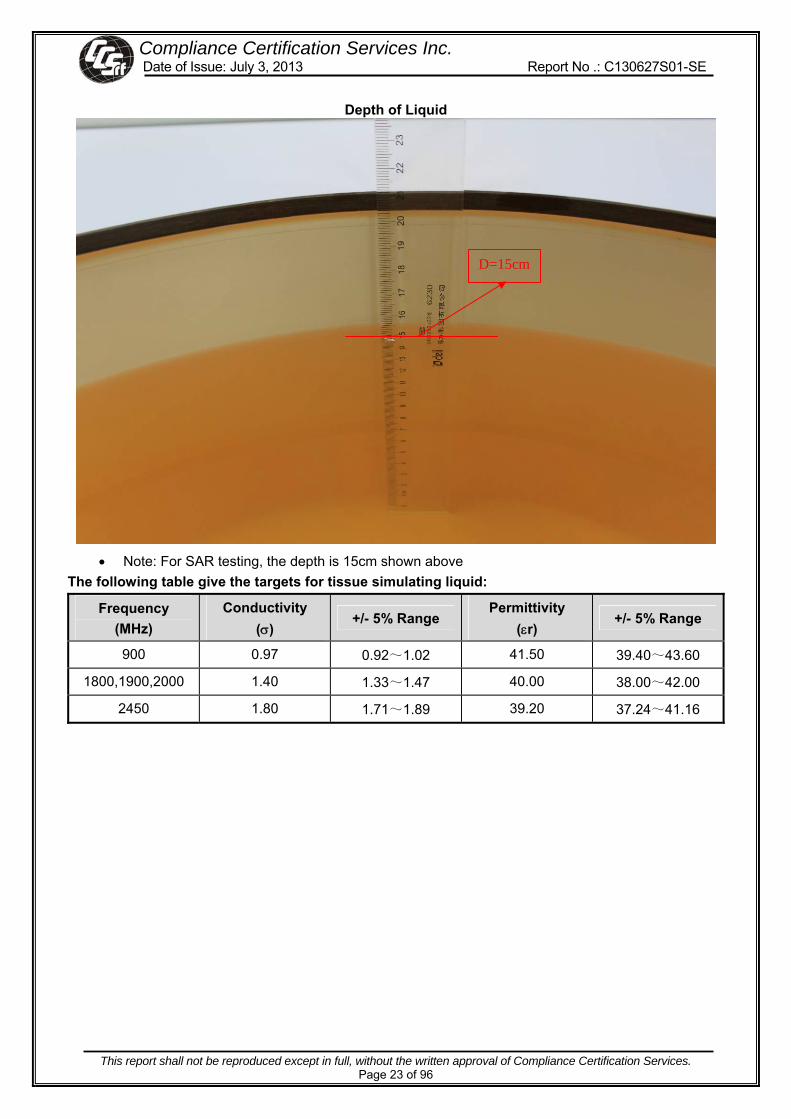
Depth of Liquid
• Note: For SAR testing, the depth is 15cm shown above
The following table give the targets for tissue simulating liquid:
Frequency (MHz)
Conductivity (σ)
+/- 5% Range Permittivity
(εr) +/- 5% Range
900 0.97 0.92~1.02 41.50 39.40~43.60
1800,1900,2000 1.40 1.33~1.47 40.00 38.00~42.00
2450 1.80 1.71~1.89 39.20 37.24~41.16
D=15cm

Compliance Certification Services Inc. Date of Issue: July 3, 2013 Report No .: C130627S01-SE
This report shall not be reproduced except in full, without the written approval of Compliance Certification Services. Page 24 of 96
SYSTEM PERFORMANCE CHECK RESULTS
Date: June 29, 2013 Ambient condition: Temperature 22.5°C Relative humidity: 70.8% Dipole: D900V2-SN:1d079
Frequency Temp. [°C]
Permitivi ty: 41.50 40.89 -1.47 ±5
Conductivi ty: 0.97 0.95 -2.06 ± 5
10g SAR: 7.01 6.52 -6.99 ± 10
22.10
Deviation[%] Limited[%]Parameters Target MeasuredHead/Body Simulatinf Liquid
900 MHz
Date: June 30, 2013 Ambient condition: Temperature 22.5°C Relative humidity: 68.3%
Dipole: D1800V2-SN:2d170
Frequency Temp. [°C]
Permitivi ty: 40.00 39.50 -1.25 ±5
Conductivi ty: 1.40 1.44 2.86 ± 5
10g SAR: 20.80 19.88 -4.42 ± 10
23.30
Deviation[%] Limited[%]Parameters Target MeasuredHead/Body Simulatinf Liquid
1800.00
Date: June 28, 2013 Ambient condition: Temperature 24.2°C Relative humidity: 67.3% Dipole: D2000V2-SN:1041
Frequency Temp. [°C]
Permitivi ty: 40.00 38.19 -4.53 ±5
Conductivi ty: 1.40 1.45 3.57 ± 5
10g SAR: 21.50 20.60 -4.19 ± 10
23.30
Deviation[%] Limited[%]Parameters Target MeasuredHead/Body Simulatinf Liquid
2000 MHz
Date: July 1, 2013 Ambient condition: Temperature 25.1°C Relative humidity: 69.2% Dipole: D2450V2-SN:817
Frequency Temp. [°C]
Permitivi ty: 39.20 40.05 2.17 ±5
Conductivi ty: 1.80 1.75 -2.78 ± 5
10g SAR: 25.30 24.72 -2.29 ± 10
23.00
Deviation[%] Limited[%]Parameters Target MeasuredHead/Body Simulatinf Liquid
2450.00

Compliance Certification Services Inc. Date of Issue: July 3, 2013 Report No .: C130627S01-SE
This report shall not be reproduced except in full, without the written approval of Compliance Certification Services. Page 25 of 96
9.3 EUT TUNE-UP PROCEDURES The following procedures had been used to prepare the EUT for the SAR test.
• To setup the desire channel frequency and the maximum output power. A Radio Communication Tester “ROHDE SCHWARZ CMU200” was used to program the EUT. GSM 900 / GSM 1800 Main Service: Circuit Switched Power Setting: 33dBm / 30dBm GPRS900 /GPRS1800 Main Service: Packet Switched Power Setting: 33dBm / 30dBm
• Maximum conducted power was measured by replacing the antenna with an adapter for conductive measurement.
Conducted output power: Band
Channel 975 37 124 512 698 885Frequency(MHz) 880.2 897.4 914.8 1710.2 1747.4 1784.8
GSM(GMSK,1Uplink) 32.60 32.54 32.53 30.83 30.73 30.70GPRS 8 (1 Uplink) 31.58 31.53 31.50 29.66 29.55 29.49
GPRS 10 (2 Uplink) 30.59 30.52 30.51 28.86 28.98 29.33GPRS 11 (3 Uplink) 30.43 30.41 30.40 28.53 28.10 28.51GPRS 12 (4 Uplink) 29.73 29.69 29.66 27.84 27.76 27.45
GSM(GMSK,1Uplink) 23.57 23.51 23.50 21.80 21.70 21.67GPRS 8 (1 Uplink) 22.56 22.51 22.48 20.64 20.53 20.47
GPRS 10 (2 Uplink) 24.57 24.50 24.49 22.84 22.96 23.31GPRS 11 (3 Uplink) 26.17 26.15 26.14 24.27 23.84 24.25GPRS 12 (4 Uplink) 26.72 26.68 26.65 24.83 24.75 24.44
GSM900 GSM1800
Maximum Burst-Averaged Output Power
Maximum Frame-Averaged Output Power
NOTE: GSM has 8 timeslot Average factor: 1TS : 10*LOG1/8=-9.03 2TS: 10*LOG2/8=-6.02 3TS: 10*LOG3/8=-4.26 4TS: 10*LOG4/8=-3.01 The frame-averaged power is linearly scaled the maximum burst-averaged power based on time slots. The calculated methods are shown as below: Frame-averaged power = Burst-averaged power (1 Uplink) – 9.03 dBm Frame-averaged power = Burst averaged power (2 Uplink) – 6.02 dBm Frame-averaged power = Burst-averaged power (3 Uplink) – 4.26 dBm Frame-averaged power = Burst averaged power (4 Uplink) – 3.01 dBm

Compliance Certification Services Inc. Date of Issue: July 3, 2013 Report No .: C130627S01-SE
This report shall not be reproduced except in full, without the written approval of Compliance Certification Services. Page 26 of 96
WCDMA: As the SAR body tests for WCDMA Band I , we established the radio link through call processing. The maximum output power were verified on high, middle and low channels for each test band according to 3GPP TS 34.121 with the following configuration:a 12.2kbps RMC, 64,144,384 kbps RMC with TPC set to all “all ‘1’s”b Test loop Mode 1 The following procedures had been used to prepare the EUT for the SAR test.
Conducted output power (Average)(dBm):
BandChannel 9612 9750 9888
Frequency(MHz) 1922.4 1950 1977.6AMR 22.75 22.23 22.85
RMC12.2K 23.76 23.83 23.77HSDPA Subtest-1 22.32 22.61 22.63HSDPA Subtest-2 22.18 22.59 22.55HSDPA Subtest-3 22.16 22.62 22.53HSDPA Subtest-4 22.15 22.65 22.5
WCDMA Band I
Compliance Certification Services Inc. Date of Issue: July 3, 2013 Report No .: C130627S01-SE
This report shall not be reproduced except in full, without the written approval of Compliance Certification Services. Page 27 of 96
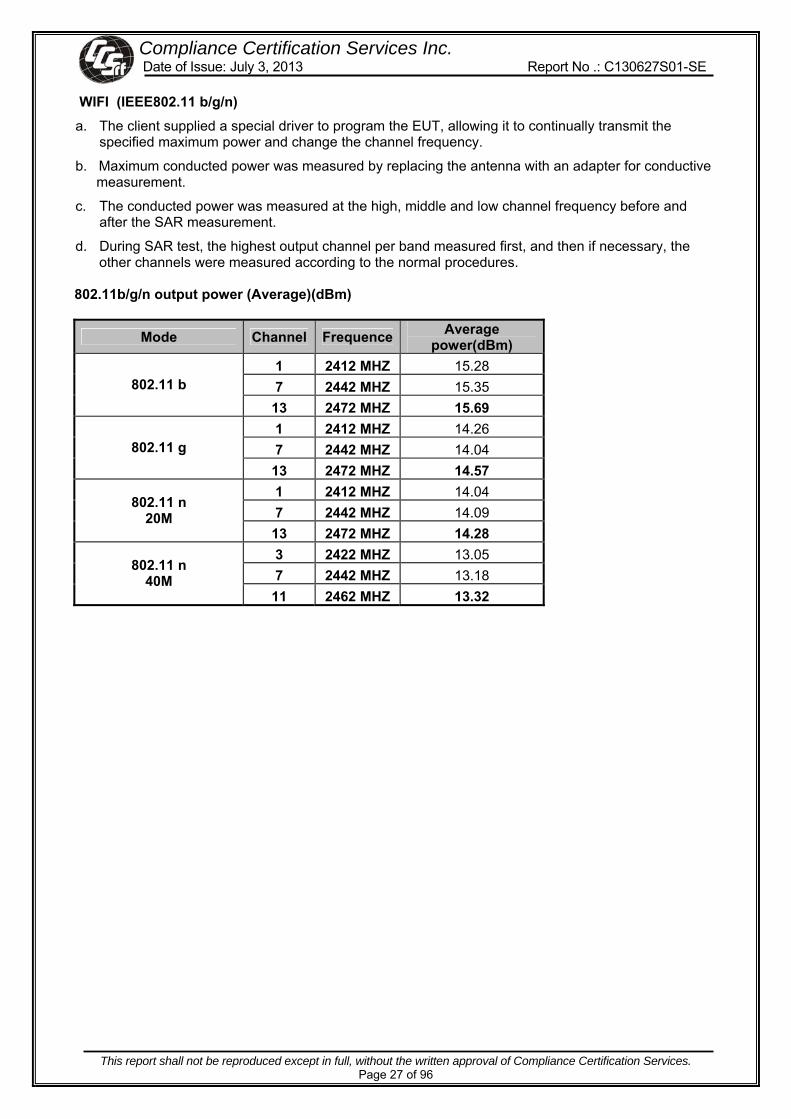
WIFI (IEEE802.11 b/g/n) a. The client supplied a special driver to program the EUT, allowing it to continually transmit the
specified maximum power and change the channel frequency.
b. Maximum conducted power was measured by replacing the antenna with an adapter for conductive measurement.
c. The conducted power was measured at the high, middle and low channel frequency before and after the SAR measurement.
d. During SAR test, the highest output channel per band measured first, and then if necessary, the other channels were measured according to the normal procedures.
802.11b/g/n output power (Average)(dBm)
Mode Channel Frequence Average power(dBm)
1 2412 MHZ 15.28 7 2442 MHZ 15.35 802.11 b 13 2472 MHZ 15.69 1 2412 MHZ 14.26 7 2442 MHZ 14.04 802.11 g 13 2472 MHZ 14.57 1 2412 MHZ 14.04 7 2442 MHZ 14.09
802.11 n 20M
13 2472 MHZ 14.28 3 2422 MHZ 13.05 7 2442 MHZ 13.18
802.11 n 40M
11 2462 MHZ 13.32
Compliance Certification Services Inc. Date of Issue: July 3, 2013 Report No .: C130627S01-SE
This report shall not be reproduced except in full, without the written approval of Compliance Certification Services. Page 28 of 96
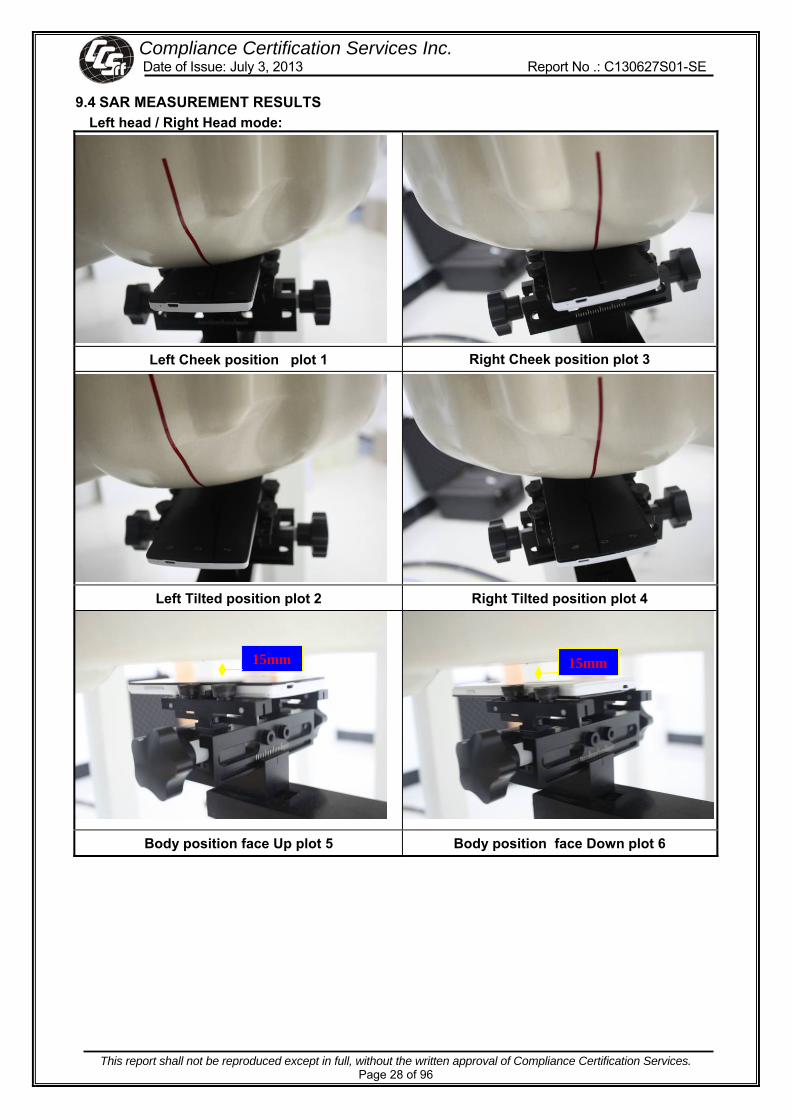
9.4 SAR MEASUREMENT RESULTS Left head / Right Head mode:
Left Cheek position plot 1 Right Cheek position plot 3
Left Tilted position plot 2 Right Tilted position plot 4
Body position face Up plot 5 Body position face Down plot 6
15mm 15mm

Compliance Certification Services Inc. Date of Issue: July 3, 2013 Report No .: C130627S01-SE
This report shall not be reproduced except in full, without the written approval of Compliance Certification Services. Page 29 of 96
Head SAR <GSM> Test Mode:GSM900
SAR(W/kg) Limit(W/kg) EUT Position Mode Channel Freq.
(MHz) Liquid
Temp(°C) 10-g 10-g 975 880.2 N/A N/A 37 897.4 21.6 0.101 Right Cheek GSM
124 914.8 N/A N/A 975 880.2 N/A N/A 37 897.4 21.6 0.072 Right Tilted GSM
124 914.8 N/A N/A 975 880.2 21.6 0.132 37 897.4 21.6 0.113 Left Cheek GSM
124 914.8 21.6 0.088 975 880.2 N/A N/A 37 897.4 21.6 0.077 Left Tilted GSM
124 914.8 N/A N/A
2.0
Test Mode:GSM1800 SAR(W/kg) Limit(W/kg)
EUT Position Mode Channel Freq. (MHz)
Liquid Temp(°C) 10-g 10-g
512 1710.2 21.8 0.077 698 1747.4 21.8 0.078 Right Cheek GSM 885 1784.8 21.8 0.084 512 1710.2 N/A N/A 698 1747.4 21.8 0.16 Right Tilted GSM 885 1784.8 N/A N/A 512 1710.2 N/A N/A 698 1747.4 21.8 0.041 Left Cheek GSM 885 1784.8 N/A N/A 512 1710.2 N/A N/A 698 1747.4 21.8 0.018 Left Tilted GSM
885 1784.8 N/A N/A
2.0

Compliance Certification Services Inc. Date of Issue: July 3, 2013 Report No .: C130627S01-SE
This report shall not be reproduced except in full, without the written approval of Compliance Certification Services. Page 30 of 96
<WCDMA> Test Mode:WCDMA Band I
SAR(W/kg) Limit(W/kg) EUT Position Mode Channel Freq.
(MHz) Liquid
Temp(°C) 10-g 10-g 9612 1922.4 N/A N/A 9750 1950.0 23.3 0.113 Right Cheek RMC 12.2K 9888 1977.6 N/A N/A 9612 1922.4 N/A N/A 9750 1950.0 23.3 0.042 Right Tilted RMC 12.2K 9888 1977.6 N/A N/A 9612 1922.4 23.3 0.203 9750 1950.0 23.3 0.161 Left Cheek RMC 12.2K 9888 1977.6 23.3 0.132 9612 1922.4 N/A N/A 9750 1950.0 23.3 0.034 Left Tilted RMC 12.2K 9888 1977.6 N/A N/A
2.0
<Wifi> Test Mode: 802.11 b
SAR(W/kg) Limit(W/kg) EUT Position Mode Channel Freq.
(MHz) Liquid
Temp(°C) 10-g 10-g 1 2412 21.5 0.041 7 2442 21.5 0.042 Right Cheek 802.11 b13 2472 21.5 0.055 1 2412 N/A N/A 7 2442 21.5 0.036 Right Tilted 802.11 b13 2472 N/A N/A 1 2412 N/A N/A 7 2442 21.5 0.028 Left Cheek 802.11 b 13 2472 N/A N/A 1 2412 N/A N/A 7 2442 21.5 0.019 Left Tilted 802.11 b
13 2472 N/A N/A
2.0

Compliance Certification Services Inc. Date of Issue: July 3, 2013 Report No .: C130627S01-SE
This report shall not be reproduced except in full, without the written approval of Compliance Certification Services. Page 31 of 96
Body SAR <GSM> Test Mode:GSM900
SAR(W/kg) Limit(W/kg) EUT Position Mode Channel Freq.
(MHz) Liquid
Temp(°C) 10-g 10-g 975 880.2 N/A N/A 37 897.4 21.6 0.097 Front GSM
124 914.8 N/A N/A 975 880.2 21.6 0.158 37 897.4 21.6 0.134 Rear GSM
124 914.8 21.6 0.103 975 880.2 N/A N/A 37 897.4 21.6 0.156 Front GPRS12
124 914.8 N/A N/A 975 880.2 21.6 0.212 37 897.4 21.6 0.220 Rear GPRS12
124 914.8 21.6 0.191
2.0
Test Mode:GSM1800 SAR(W/kg) Limit(W/kg)
EUT Position Mode Channel Freq. (MHz)
Liquid Temp(°C) 10-g 10-g
512 1710.2 N/A N/A 698 1747.4 21.8 0.082 Front GSM 885 1784.8 N/A N/A 512 1710.2 21.8 0.088 698 1747.4 21.8 0.091 Rear GSM 885 1784.8 21.8 0.098 512 1710.2 N/A N/A 698 1747.4 21.8 0.138 Front GPRS12 885 1784.8 N/A N/A 512 1710.2 21.8 0.152 698 1747.4 21.8 0.155 Rear GPRS12
885 1784.8 21.8 0.174
2.0

Compliance Certification Services Inc. Date of Issue: July 3, 2013 Report No .: C130627S01-SE
This report shall not be reproduced except in full, without the written approval of Compliance Certification Services. Page 32 of 96
<WCDMA> Test Mode:WCDMA Band I
SAR(W/kg) Limit(W/kg) EUT Position Mode Channel Freq.
(MHz) Liquid
Temp(°C) 10-g 10-g 9612 1922.4 N/A N/A 9750 1950.0 23.3 0.162 Front RMC 12.2K 9888 1977.6 N/A N/A 9612 1922.4 23.3 0.382 9750 1950.0 23.3 0.293 Rear RMC 12.2K 9888 1977.6 23.3 0.301
2.0
<Wifi> Test Mode: 802.11 b
SAR(W/kg) Limit(W/kg) EUT Position Mode Channel Freq.
(MHz) Liquid
Temp(°C) 10-g 10-g 1 2412 N/A N/A 7 2442 21.5 0.005 Front 802.11 b 13 2472 N/A N/A 1 2412 21.5 0.011 7 2442 21.5 0.010 Rear 802.11 b
13 2472 21.5 0.012
2.0

Compliance Certification Services Inc. Date of Issue: July 3, 2013 Report No .: C130627S01-SE
This report shall not be reproduced except in full, without the written approval of Compliance Certification Services. Page 33 of 96
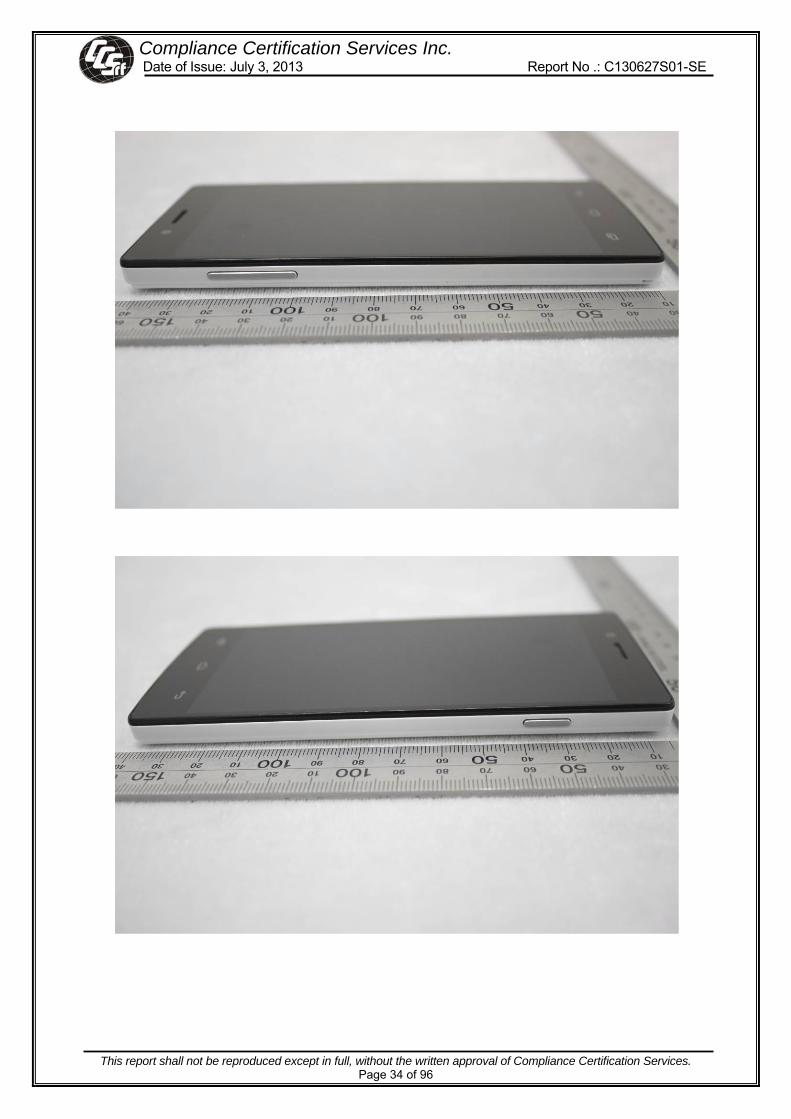
10. EUT PHOTO
Compliance Certification Services Inc. Date of Issue: July 3, 2013 Report No .: C130627S01-SE
This report shall not be reproduced except in full, without the written approval of Compliance Certification Services. Page 34 of 96

Compliance Certification Services Inc. Date of Issue: July 3, 2013 Report No .: C130627S01-SE
This report shall not be reproduced except in full, without the written approval of Compliance Certification Services. Page 35 of 96

Compliance Certification Services Inc. Date of Issue: July 3, 2013 Report No .: C130627S01-SE
This report shall not be reproduced except in full, without the written approval of Compliance Certification Services. Page 36 of 96
Compliance Certification Services Inc. Date of Issue: July 3, 2013 Report No .: C130627S01-SE
This report shall not be reproduced except in full, without the written approval of Compliance Certification Services. Page 37 of 96
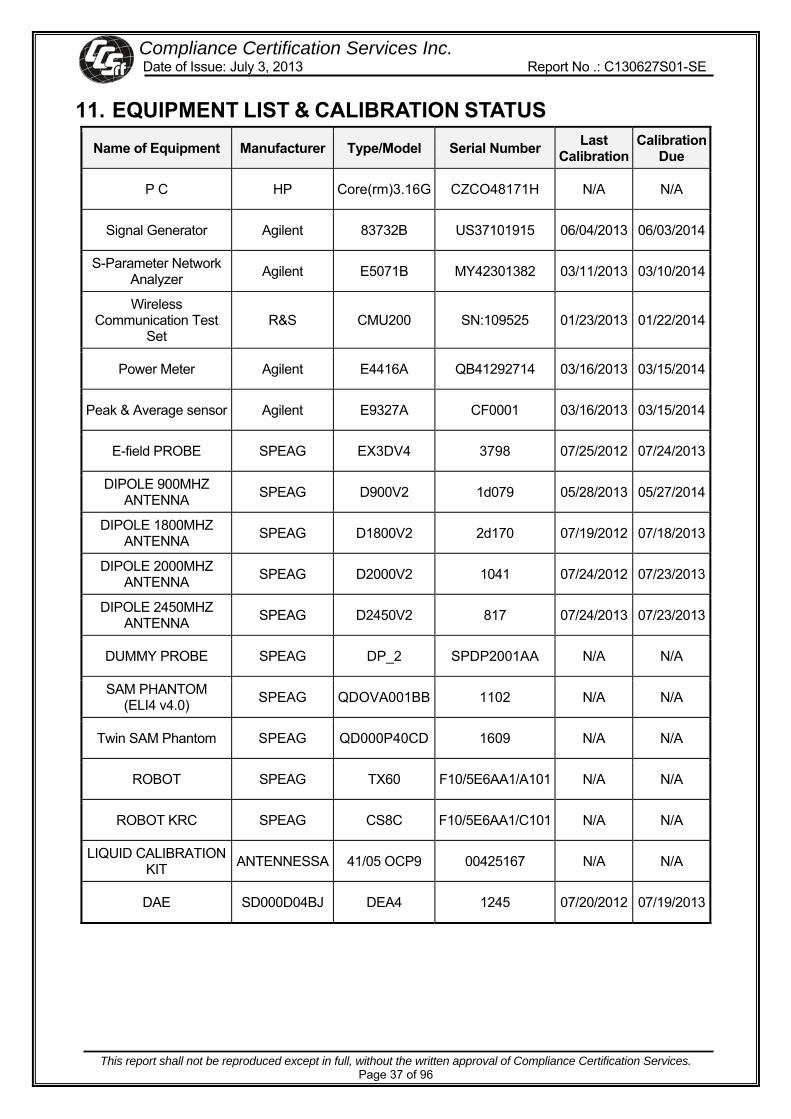
11. EQUIPMENT LIST & CALIBRATION STATUS Name of Equipment Manufacturer Type/Model Serial Number Last
Calibration Calibration
Due
P C HP Core(rm)3.16G CZCO48171H N/A N/A
Signal Generator Agilent 83732B US37101915 06/04/2013 06/03/2014
S-Parameter Network Analyzer Agilent E5071B MY42301382 03/11/2013 03/10/2014
Wireless Communication Test
Set R&S CMU200 SN:109525 01/23/2013 01/22/2014
Power Meter Agilent E4416A QB41292714 03/16/2013 03/15/2014
Peak & Average sensor Agilent E9327A CF0001 03/16/2013 03/15/2014
E-field PROBE SPEAG EX3DV4 3798 07/25/2012 07/24/2013
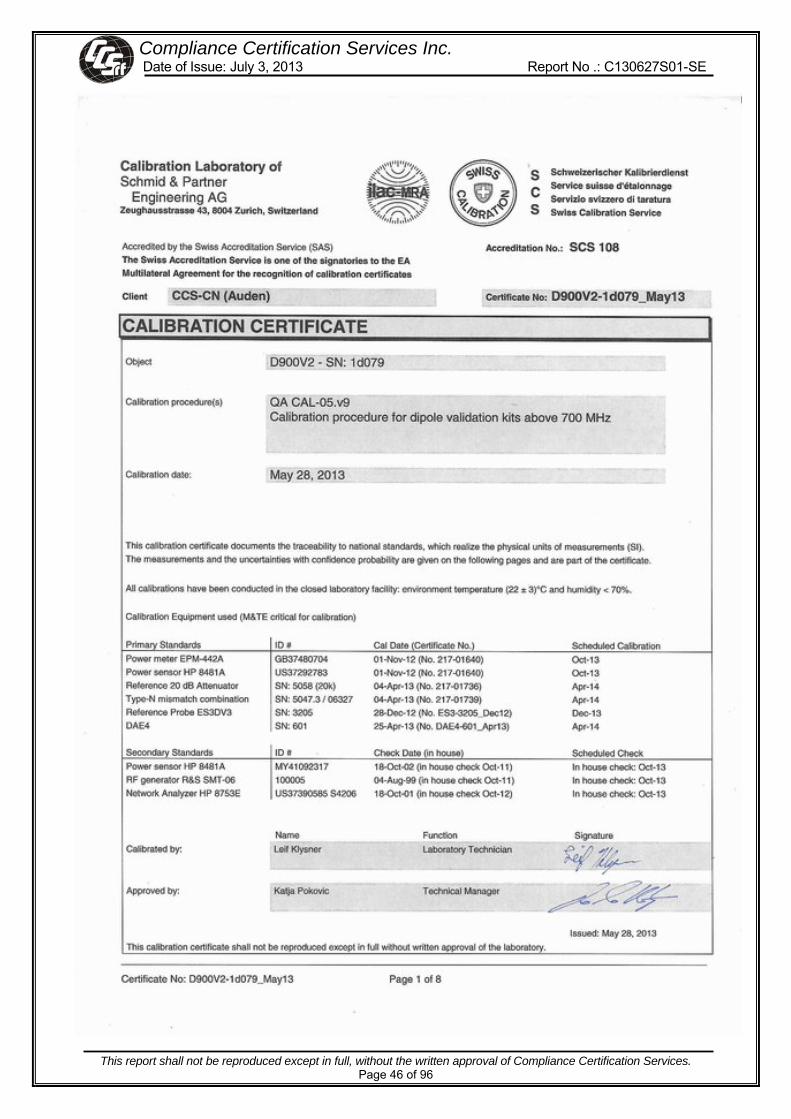
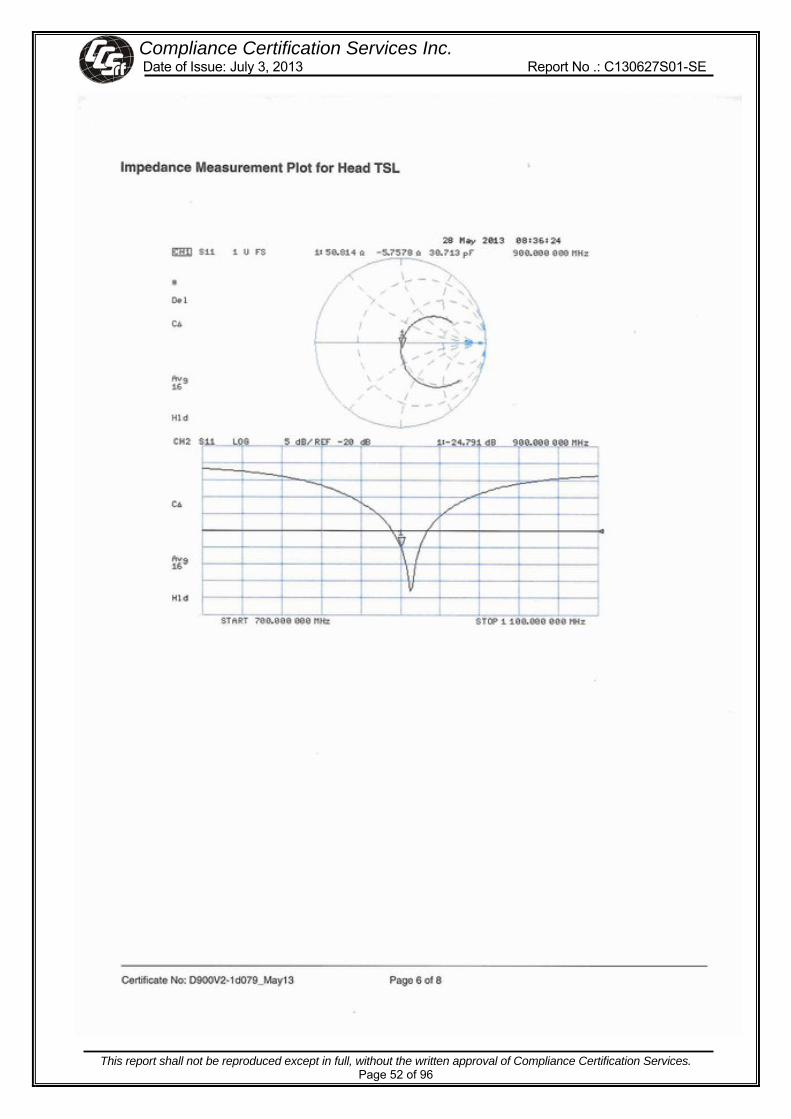
DIPOLE 900MHZ ANTENNA SPEAG D900V2 1d079 05/28/2013 05/27/2014
DIPOLE 1800MHZ ANTENNA SPEAG D1800V2 2d170 07/19/2012 07/18/2013
DIPOLE 2000MHZ ANTENNA SPEAG D2000V2 1041 07/24/2012 07/23/2013
DIPOLE 2450MHZ ANTENNA SPEAG D2450V2 817 07/24/2013 07/23/2013
DUMMY PROBE SPEAG DP_2 SPDP2001AA N/A N/A
SAM PHANTOM (ELI4 v4.0) SPEAG QDOVA001BB 1102 N/A N/A
Twin SAM Phantom SPEAG QD000P40CD 1609 N/A N/A
ROBOT SPEAG TX60 F10/5E6AA1/A101 N/A N/A
ROBOT KRC SPEAG CS8C F10/5E6AA1/C101 N/A N/A
LIQUID CALIBRATION KIT ANTENNESSA 41/05 OCP9 00425167 N/A N/A
DAE SD000D04BJ DEA4 1245 07/20/2012 07/19/2013

Compliance Certification Services Inc. Date of Issue: July 3, 2013 Report No .: C130627S01-SE
This report shall not be reproduced except in full, without the written approval of Compliance Certification Services. Page 38 of 96
12. FACILITIES All measurement facilities used to collect the measurement data are located at
No.10, Weiye Rd., Innovation Park, Eco & Tec. Development Part, Kunshan City, Jiangsu Province, China.
13. REFERENCES 1] Federal Communications Commission, \Report and order: Guidelines for evaluating the
environ-mental effects of radiofrequency radiation", Tech. Rep. FCC 96-326, FCC, Washington, D.C. 20554, 1996.
[2] David L. Means Kwok Chan, Robert F. Cleveland, \Evaluating compliance with FCC guidelines for human exposure to radiofrequency electromagnetic fields", Tech. Rep., Federal Communication Commision, O_ce of Engineering & Technology, Washington, DC, 1997.
[3] Thomas Schmid, Oliver Egger, and Niels Kuster, \Automated E-_eld scanning system for dosimetric assessments", IEEE Transactions on Microwave Theory and Techniques, vol. 44, pp. 105{113, Jan. 1996.
[4] Niels Kuster, Ralph K.astle, and Thomas Schmid, \Dosimetric evaluation of mobile communications equipment with known precision", IEICE Transactions on Communications, vol. E80-B, no. 5, pp. 645{652, May 1997.
[5] CENELEC, \Considerations for evaluating of human exposure to electromagnetic fields (EMFs) from mobile telecommunication equipment (MTE) in the frequency range 30MHz - 6GHz", Tech. Rep., CENELEC, European Committee for Electrotechnical Standardization, Brussels, 1997.
[6] ANSI, ANSI/IEEE C95.1-1992: IEEE Standard for Safety Levels with Respect to Human Exposure to Radio Frequency Electromagnetic Fields, 3 kHz to 300 GHz, The Institute of Electrical and Electronics Engineers, Inc., New York, NY 10017, 1992.
[7] Katja Pokovic, Thomas Schmid, and Niels Kuster, \Robust setup for precise calibration of E-_eld probes in tissue simulating liquids at mobile communications frequencies", in ICECOM _ 97, Dubrovnik, October 15{17, 1997, pp. 120{124.
[8] Katja Pokovic, Thomas Schmid, and Niels Kuster, \E-_eld probe with improved isotropy in brain simulating liquids", in Proceedings of the ELMAR, Zadar, Croatia, 23{25 June, 1996, pp. 172{175.
[9] Volker Hombach, Klaus Meier, Michael Burkhardt, Eberhard K. uhn, and Niels Kuster, \The dependence of EM energy absorption upon human head modeling at 900 MHz", IEEE Transactions onMicrowave Theory and Techniques, vol. 44, no. 10, pp. 1865{1873, Oct. 1996.
[10] Klaus Meier, Ralf Kastle, Volker Hombach, Roger Tay, and Niels Kuster, \The dependence of EM energy absorption upon human head modeling at 1800 MHz", IEEE Transactions on Microwave Theory and Techniques, Oct. 1997, in press.
[11] W. Gander, Computermathematik, Birkhaeuser, Basel, 1992. [12] W. H. Press, S. A. Teukolsky,W. T. Vetterling, and B. P. Flannery, Numerical Recepies in C,
The Art of Scientific Computing, Second Edition, Cambridge University Press, 1992..Dosimetric Evaluation of Sample device, month 1998 9
[13] NIS81 NAMAS, \The treatment of uncertainity in EMC measurement", Tech. Rep., NAMAS Executive, National Physical Laboratory, Teddington, Middlesex, England, 1994.
[14] Barry N. Taylor and Christ E. Kuyatt, \Guidelines for evaluating and expressing the uncertainty of NIST measurement results", Tech. Rep., National Institute of Standards and Technology, 1994. Dosimetric Evaluation of Sample device, month 1998 10

Compliance Certification Services Inc. Date of Issue: July 3, 2013 Report No .: C130627S01-SE
This report shall not be reproduced except in full, without the written approval of Compliance Certification Services. Page 39 of 96
14. ATTACHMENTS Exhibit Content
1 System Performance Check Plots
2 Dipole calibration report D900V2 SN:1d079
3 Dipole calibration report D1800V2 SN: 2d170
4 Dipole calibration report D2000V2 SN: 1041
5 Dipole calibration report D2450V2 SN: 817
6 Probe calibration report EX3DV4 SN3798
7 DAE calibration report DEA4 SD000D04BJ SN: 1245
8 SAR Test Plots

Compliance Certification Services Inc. Date of Issue: July 3, 2013 Report No .: C130627S01-SE
This report shall not be reproduced except in full, without the written approval of Compliance Certification Services. Page 40 of 96
Appendix A: Plots of Performance Check The plots are showing as followings.

Compliance Certification Services Inc. Date of Issue: July 3, 2013 Report No .: C130627S01-SE
This report shall not be reproduced except in full, without the written approval of Compliance Certification Services. Page 41 of 96
Test Laboratory: Compliance Certification Services Inc. Date: 6/29/2013 SystemPerformanceCheck-D900_2013.06.29 DUT: Dipole 900 MHz D900V2; Type: D900V2; Serial: D900V2 - SN:1d079 Communication System: CW; Communication System Band: D900 (900.0 MHz); Frequency: 900 MHz;Duty Cycle: 1:1 Medium parameters used: f = 900 MHz; σ = 0.95 S/m; εr = 40.889; ρ = 1000 kg/m3 Room Ambient Temperature: 22.5°C; Liquid Temperature: 21.6°C Phantom section: Flat Section Measurement Standard: DASY5 (IEEE/IEC/ANSI C63.19-2007) DASY Configuration:
• Probe: EX3DV4 - SN3798; ConvF(8.88, 8.88, 8.88); Calibrated: 7/25/2012; • Sensor-Surface: 2mm (Mechanical Surface Detection) • Electronics: DAE4 Sn1245; Calibrated: 7/20/2012 • Phantom: Twin SAM Phantom; Type: QD 000 P40 CD; Serial: 1609 • DASY52 52.8.5(1059); • SEMCAD X Version 14.6.8 (7028)
System Performance Check at Frequencies below 1 GHz/d=15mm, Pin=250 mW, dist=2.0mm (EX-Probe)/Area Scan (7x12x1): Measurement grid: dx=15mm, dy=15mm Maximum value of SAR (measured) = 3.25 W/kg System Performance Check at Frequencies below 1 GHz/d=15mm, Pin=250 mW, dist=2.0mm (EX-Probe)/Zoom Scan (7x7x7) (7x7x7)/Cube 0: Measurement grid: dx=5mm, dy=5mm, dz=5mm Reference Value = 59.717 V/m; Power Drift = -0.01 dB Peak SAR (extrapolated) = 3.89 W/kg SAR(1 g) = 2.55 W/kg; SAR(10 g) = 1.63 W/kg Maximum value of SAR (measured) = 3.26 W/kg

Compliance Certification Services Inc. Date of Issue: July 3, 2013 Report No .: C130627S01-SE
This report shall not be reproduced except in full, without the written approval of Compliance Certification Services. Page 42 of 96
Test Laboratory: Compliance Certification Services Inc. Date: 6/30/2013 SystemPerformanceCheck-D1800_2013.06.30 DUT: Dipole 1800 MHz D1800V2; Type: D1800V2; Serial: D1800V2 - SN:2d170 Communication System: CW; Communication System Band: D1800 (1800.0 MHz); Frequency: 1800 MHz;Duty Cycle: 1:1 Medium parameters used (extrapolated): f = 1800 MHz; σ = 1.441 S/m; εr = 39.502; ρ = 1000 kg/m3 Room Ambient Temperature: 22.5°C; Liquid Temperature: 21.8°C Phantom section: Flat Section Measurement Standard: DASY5 (IEEE/IEC/ANSI C63.19-2007) DASY Configuration:
• Probe: EX3DV4 - SN3798; ConvF(7.77, 7.77, 7.77); Calibrated: 7/25/2012; • Sensor-Surface: 2mm (Mechanical Surface Detection) • Electronics: DAE4 Sn1245; Calibrated: 7/20/2012 • Phantom: Twin SAM Phantom; Type: QD 000 P40 CD; Serial: 1609 • DASY52 52.8.5(1059); • SEMCAD X Version 14.6.8 (7028)
System Performance Check at Frequencies above 1 GHz/d=10mm, Pin=250 mW, dist=2.0mm (EX-Probe) (23.6 dBm)/Area Scan (7x7x1): Measurement grid: dx=15mm, dy=15mm Maximum value of SAR (measured) = 13.8 W/kg System Performance Check at Frequencies above 1 GHz/d=10mm, Pin=250 mW, dist=2.0mm (EX-Probe) (23.6 dBm)/Zoom Scan (7x7x7) (7x7x7)/Cube 0: Measurement grid: dx=5mm, dy=5mm, dz=5mm Reference Value = 98.656 V/m; Power Drift = -0.20 dB Peak SAR (extrapolated) = 17.5 W/kg SAR(1 g) = 9.51 W/kg; SAR(10 g) = 4.97 W/kg Maximum value of SAR (measured) = 13.6 W/kg

Compliance Certification Services Inc. Date of Issue: July 3, 2013 Report No .: C130627S01-SE
This report shall not be reproduced except in full, without the written approval of Compliance Certification Services. Page 43 of 96
Test Laboratory: Compliance Certification Services Inc. Date: 6/28/2013 SystemPerformanceCheck-D2000_2013.06.25 DUT: Dipole 2000 MHz D2000V2; Type: D2000V2; Serial: D2000V2 - SN:1041 Communication System: CW; Communication System Band: D2000 (2000.0 MHz); Frequency: 2000 MHz;Duty Cycle: 1:1 Medium parameters used (extrapolated): f = 2000 MHz; σ = 1.452 S/m; εr = 38.185; ρ = 1000 kg/m3 Room Ambient Temperature: 24.2°C; Liquid Temperature: 23.3°C Phantom section: Flat Section Measurement Standard: DASY5 (IEEE/IEC/ANSI C63.19-2007) DASY Configuration:
• Probe: EX3DV4 - SN3798; ConvF(7.64, 7.64, 7.64); Calibrated: 7/25/2012; • Sensor-Surface: 2mm (Mechanical Surface Detection) • Electronics: DAE4 Sn1245; Calibrated: 7/20/2012 • Phantom: Twin SAM Phantom; Type: QD 000 P40 CD; Serial: 1609 • DASY52 52.8.5(1059); • SEMCAD X Version 14.6.8 (7028)
System Performance Check at Frequencies above 1 GHz/d=10mm, Pin=250 mW, dist=2.0mm (EX-Probe)/Area Scan (7x7x1): Measurement grid: dx=15mm, dy=15mm Maximum value of SAR (measured) = 15.6 W/kg System Performance Check at Frequencies above 1 GHz/d=10mm, Pin=250 mW, dist=2.0mm (EX-Probe)/Zoom Scan (7x7x7) (7x7x7)/Cube 0: Measurement grid: dx=5mm, dy=5mm, dz=5mm Reference Value = 104.4 V/m; Power Drift = -0.12 dB Peak SAR (extrapolated) = 20.0 W/kg SAR(1 g) = 10.3 W/kg; SAR(10 g) = 5.15 W/kg Maximum value of SAR (measured) = 15.2 W/kg

Compliance Certification Services Inc. Date of Issue: July 3, 2013 Report No .: C130627S01-SE
This report shall not be reproduced except in full, without the written approval of Compliance Certification Services. Page 44 of 96
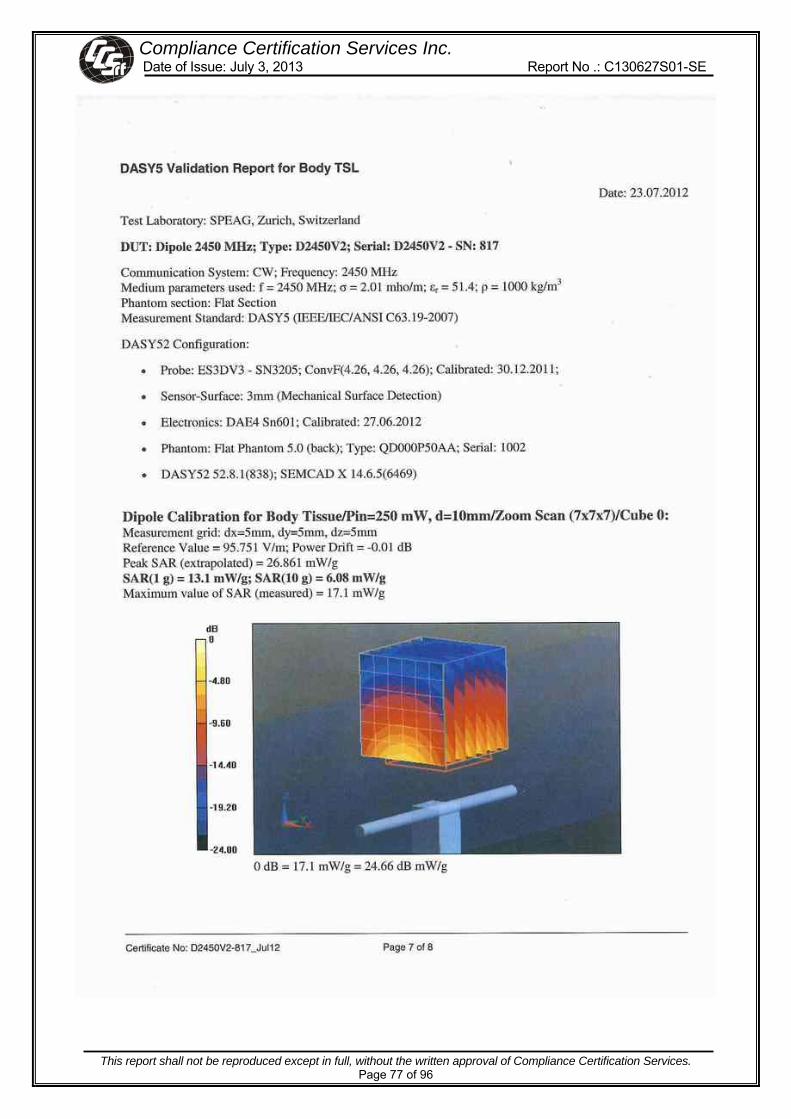
Test Laboratory: Compliance Certification Services Inc. Date: 7/1/2013 SystemPerformanceCheck-D2450_2013.07.01 DUT: Dipole 2450 MHz D2450V2; Type: D24500V2; Serial: 817 Communication System: CW; Communication System Band: D2450 (2450.0 MHz); Frequency: 2450 MHz;Duty Cycle: 1:1 Medium parameters used: f = 2450 MHz; σ = 1.754 S/m; εr = 40.05; ρ = 1000 kg/m3 Room Ambient Temperature: 24.0°C; Liquid Temperature: 22.5°C Phantom section: Flat Section Measurement Standard: DASY5 (IEEE/IEC/ANSI C63.19-2007) DASY Configuration:
• Probe: EX3DV4 - SN3798; ConvF(6.87, 6.87, 6.87); Calibrated: 7/25/2012; • Sensor-Surface: 2mm (Mechanical Surface Detection) • Electronics: DAE4 Sn1245; Calibrated: 7/20/2012 • Phantom: Twin SAM Phantom; Type: QD 000 P40 CD; Serial: 1609 • DASY52 52.8.5(1059); • SEMCAD X Version 14.6.8 (7028)
System Performance Check at Frequencies above 1 GHz/d=10mm, Pin=250 mW, dist=2.0mm (EX-Probe)/Area Scan (8x9x1): Measurement grid: dx=12mm, dy=12mm Maximum value of SAR (measured) = 16.3 W/kg System Performance Check at Frequencies above 1 GHz/d=10mm, Pin=250 mW, dist=2.0mm (EX-Probe)/Zoom Scan (7x7x7) (7x7x7)/Cube 0: Measurement grid: dx=5mm, dy=5mm, dz=5mm Reference Value = 105.2 V/m; Power Drift = -0.08 dB Peak SAR (extrapolated) = 26.8 W/kg SAR(1 g) = 13.2 W/kg; SAR(10 g) = 6.18 W/kg Maximum value of SAR (measured) = 20.0 W/kg
Compliance Certification Services Inc. Date of Issue: July 3, 2013 Report No .: C130627S01-SE
This report shall not be reproduced except in full, without the written approval of Compliance Certification Services. Page 45 of 96
Appendix B: DASY Calibration Certificate The DASY Calibration Certificates are showing as followings .
Compliance Certification Services Inc. Date of Issue: July 3, 2013 Report No .: C130627S01-SE
This report shall not be reproduced except in full, without the written approval of Compliance Certification Services. Page 46 of 96

Compliance Certification Services Inc. Date of Issue: July 3, 2013 Report No .: C130627S01-SE
This report shall not be reproduced except in full, without the written approval of Compliance Certification Services. Page 47 of 96
Compliance Certification Services Inc. Date of Issue: July 3, 2013 Report No .: C130627S01-SE
This report shall not be reproduced except in full, without the written approval of Compliance Certification Services. Page 48 of 96

Compliance Certification Services Inc. Date of Issue: July 3, 2013 Report No .: C130627S01-SE
This report shall not be reproduced except in full, without the written approval of Compliance Certification Services. Page 49 of 96

Compliance Certification Services Inc. Date of Issue: July 3, 2013 Report No .: C130627S01-SE
This report shall not be reproduced except in full, without the written approval of Compliance Certification Services. Page 50 of 96

Compliance Certification Services Inc. Date of Issue: July 3, 2013 Report No .: C130627S01-SE
This report shall not be reproduced except in full, without the written approval of Compliance Certification Services. Page 51 of 96
Compliance Certification Services Inc. Date of Issue: July 3, 2013 Report No .: C130627S01-SE
This report shall not be reproduced except in full, without the written approval of Compliance Certification Services. Page 52 of 96

Compliance Certification Services Inc. Date of Issue: July 3, 2013 Report No .: C130627S01-SE
This report shall not be reproduced except in full, without the written approval of Compliance Certification Services. Page 53 of 96

Compliance Certification Services Inc. Date of Issue: July 3, 2013 Report No .: C130627S01-SE
This report shall not be reproduced except in full, without the written approval of Compliance Certification Services. Page 54 of 96

Compliance Certification Services Inc. Date of Issue: July 3, 2013 Report No .: C130627S01-SE
This report shall not be reproduced except in full, without the written approval of Compliance Certification Services. Page 55 of 96

Compliance Certification Services Inc. Date of Issue: July 3, 2013 Report No .: C130627S01-SE
This report shall not be reproduced except in full, without the written approval of Compliance Certification Services. Page 56 of 96
Compliance Certification Services Inc. Date of Issue: July 3, 2013 Report No .: C130627S01-SE
This report shall not be reproduced except in full, without the written approval of Compliance Certification Services. Page 57 of 96
Compliance Certification Services Inc. Date of Issue: July 3, 2013 Report No .: C130627S01-SE
This report shall not be reproduced except in full, without the written approval of Compliance Certification Services. Page 58 of 96

Compliance Certification Services Inc. Date of Issue: July 3, 2013 Report No .: C130627S01-SE
This report shall not be reproduced except in full, without the written approval of Compliance Certification Services. Page 59 of 96

Compliance Certification Services Inc. Date of Issue: July 3, 2013 Report No .: C130627S01-SE
This report shall not be reproduced except in full, without the written approval of Compliance Certification Services. Page 60 of 96

Compliance Certification Services Inc. Date of Issue: July 3, 2013 Report No .: C130627S01-SE
This report shall not be reproduced except in full, without the written approval of Compliance Certification Services. Page 61 of 96

Compliance Certification Services Inc. Date of Issue: July 3, 2013 Report No .: C130627S01-SE
This report shall not be reproduced except in full, without the written approval of Compliance Certification Services. Page 62 of 96

Compliance Certification Services Inc. Date of Issue: July 3, 2013 Report No .: C130627S01-SE
This report shall not be reproduced except in full, without the written approval of Compliance Certification Services. Page 63 of 96
Compliance Certification Services Inc. Date of Issue: July 3, 2013 Report No .: C130627S01-SE
This report shall not be reproduced except in full, without the written approval of Compliance Certification Services. Page 64 of 96

Compliance Certification Services Inc. Date of Issue: July 3, 2013 Report No .: C130627S01-SE
This report shall not be reproduced except in full, without the written approval of Compliance Certification Services. Page 65 of 96

Compliance Certification Services Inc. Date of Issue: July 3, 2013 Report No .: C130627S01-SE
This report shall not be reproduced except in full, without the written approval of Compliance Certification Services. Page 66 of 96

Compliance Certification Services Inc. Date of Issue: July 3, 2013 Report No .: C130627S01-SE
This report shall not be reproduced except in full, without the written approval of Compliance Certification Services. Page 67 of 96

Compliance Certification Services Inc. Date of Issue: July 3, 2013 Report No .: C130627S01-SE
This report shall not be reproduced except in full, without the written approval of Compliance Certification Services. Page 68 of 96
Compliance Certification Services Inc. Date of Issue: July 3, 2013 Report No .: C130627S01-SE
This report shall not be reproduced except in full, without the written approval of Compliance Certification Services. Page 69 of 96

Compliance Certification Services Inc. Date of Issue: July 3, 2013 Report No .: C130627S01-SE
This report shall not be reproduced except in full, without the written approval of Compliance Certification Services. Page 70 of 96

Compliance Certification Services Inc. Date of Issue: July 3, 2013 Report No .: C130627S01-SE
This report shall not be reproduced except in full, without the written approval of Compliance Certification Services. Page 71 of 96

Compliance Certification Services Inc. Date of Issue: July 3, 2013 Report No .: C130627S01-SE
This report shall not be reproduced except in full, without the written approval of Compliance Certification Services. Page 72 of 96
Compliance Certification Services Inc. Date of Issue: July 3, 2013 Report No .: C130627S01-SE
This report shall not be reproduced except in full, without the written approval of Compliance Certification Services. Page 73 of 96

Compliance Certification Services Inc. Date of Issue: July 3, 2013 Report No .: C130627S01-SE
This report shall not be reproduced except in full, without the written approval of Compliance Certification Services. Page 74 of 96

Compliance Certification Services Inc. Date of Issue: July 3, 2013 Report No .: C130627S01-SE
This report shall not be reproduced except in full, without the written approval of Compliance Certification Services. Page 75 of 96
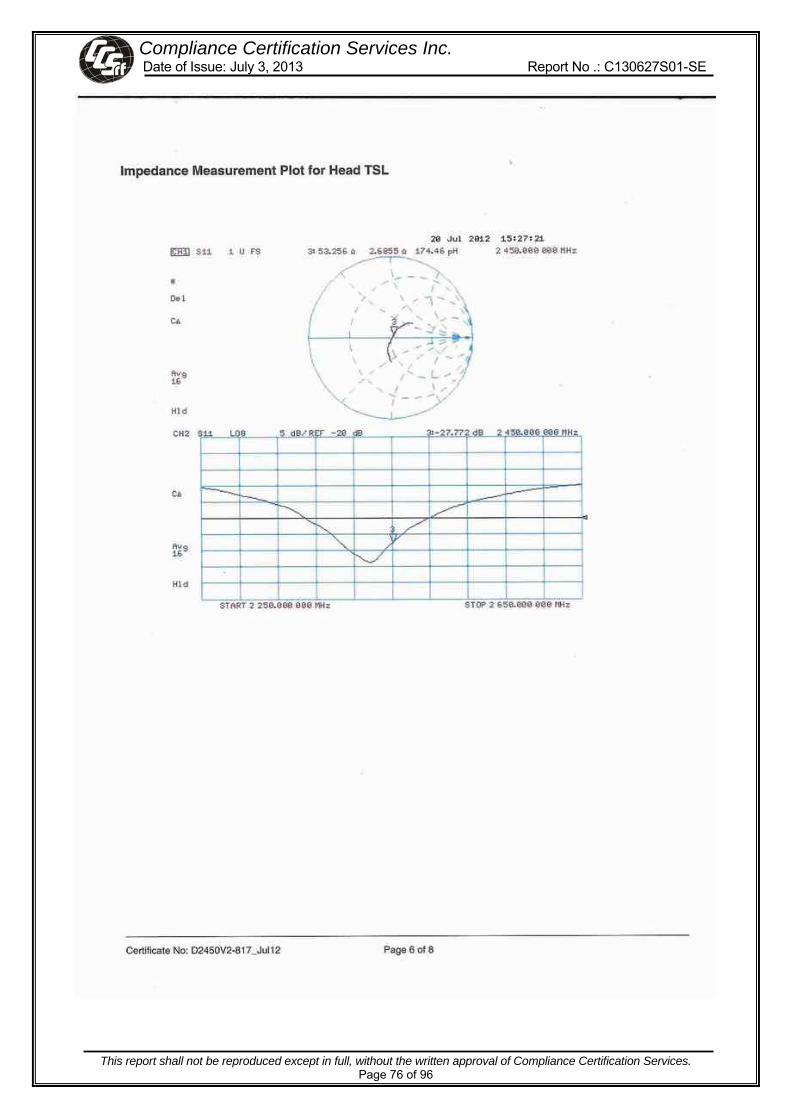
Compliance Certification Services Inc. Date of Issue: July 3, 2013 Report No .: C130627S01-SE
This report shall not be reproduced except in full, without the written approval of Compliance Certification Services. Page 76 of 96
Compliance Certification Services Inc. Date of Issue: July 3, 2013 Report No .: C130627S01-SE
This report shall not be reproduced except in full, without the written approval of Compliance Certification Services. Page 77 of 96

Compliance Certification Services Inc. Date of Issue: July 3, 2013 Report No .: C130627S01-SE
This report shall not be reproduced except in full, without the written approval of Compliance Certification Services. Page 78 of 96
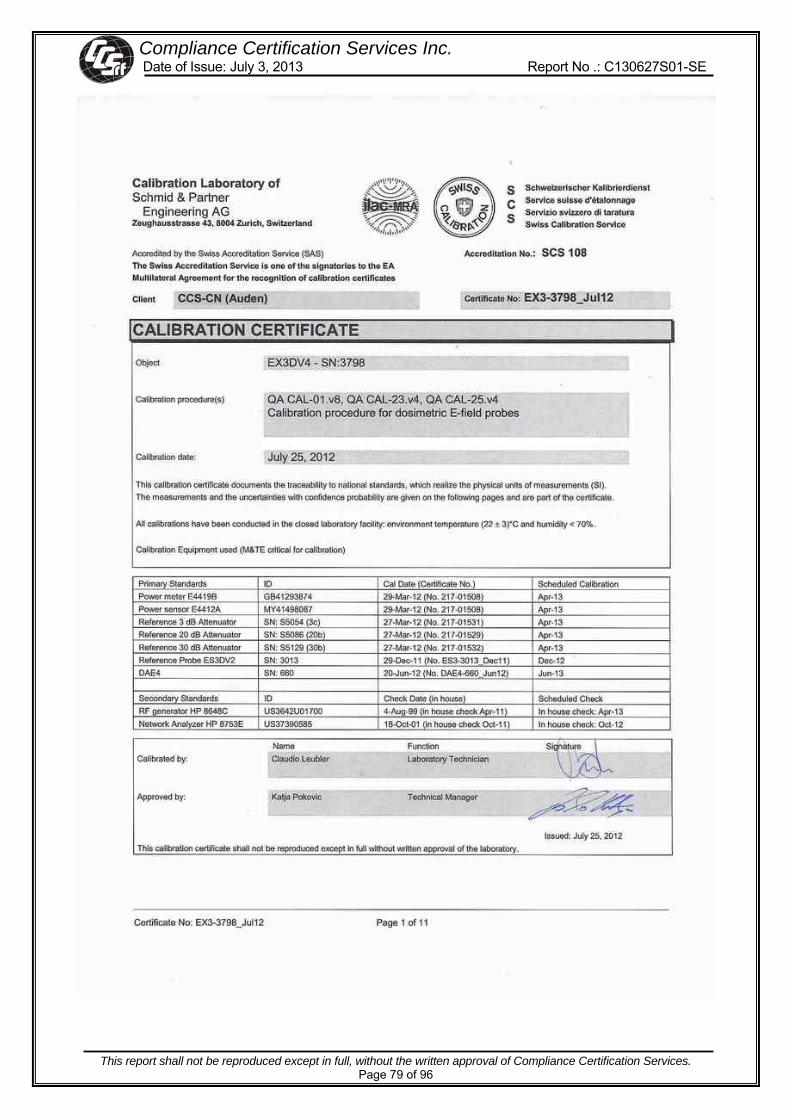
Compliance Certification Services Inc. Date of Issue: July 3, 2013 Report No .: C130627S01-SE
This report shall not be reproduced except in full, without the written approval of Compliance Certification Services. Page 79 of 96

Compliance Certification Services Inc. Date of Issue: July 3, 2013 Report No .: C130627S01-SE
This report shall not be reproduced except in full, without the written approval of Compliance Certification Services. Page 80 of 96
Compliance Certification Services Inc. Date of Issue: July 3, 2013 Report No .: C130627S01-SE
This report shall not be reproduced except in full, without the written approval of Compliance Certification Services. Page 81 of 96

Compliance Certification Services Inc. Date of Issue: July 3, 2013 Report No .: C130627S01-SE
This report shall not be reproduced except in full, without the written approval of Compliance Certification Services. Page 82 of 96

Compliance Certification Services Inc. Date of Issue: July 3, 2013 Report No .: C130627S01-SE
This report shall not be reproduced except in full, without the written approval of Compliance Certification Services. Page 83 of 96
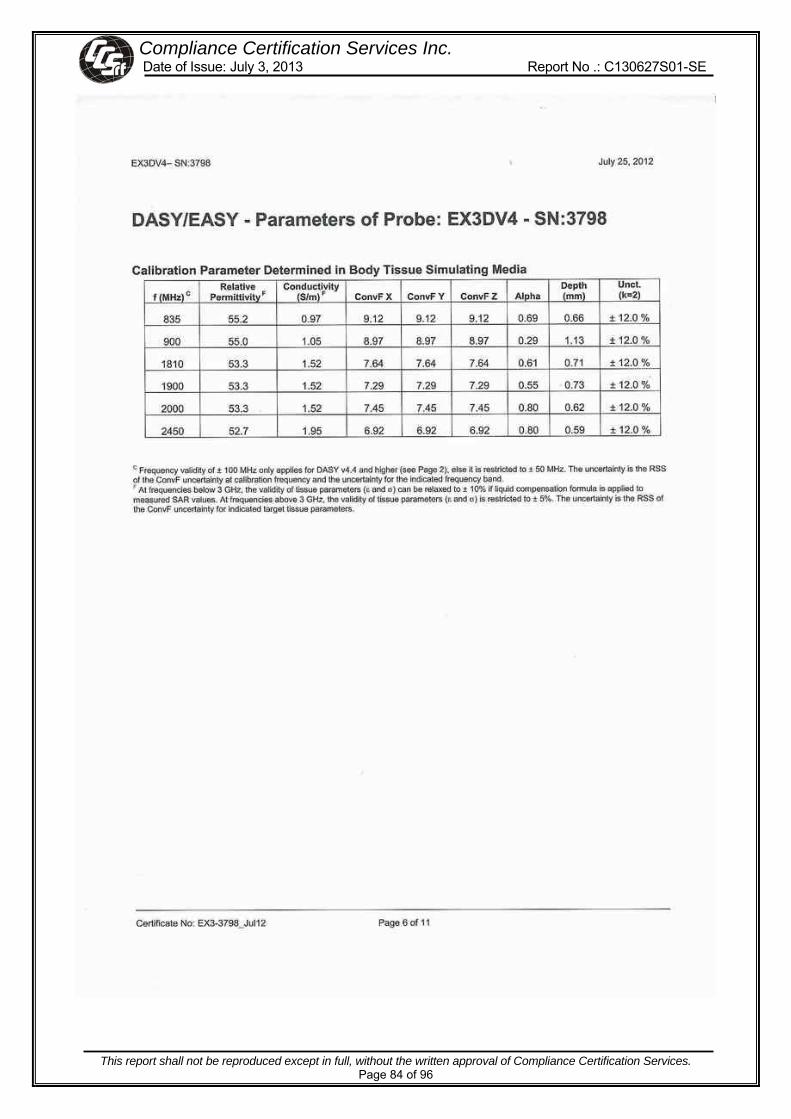
Compliance Certification Services Inc. Date of Issue: July 3, 2013 Report No .: C130627S01-SE
This report shall not be reproduced except in full, without the written approval of Compliance Certification Services. Page 84 of 96
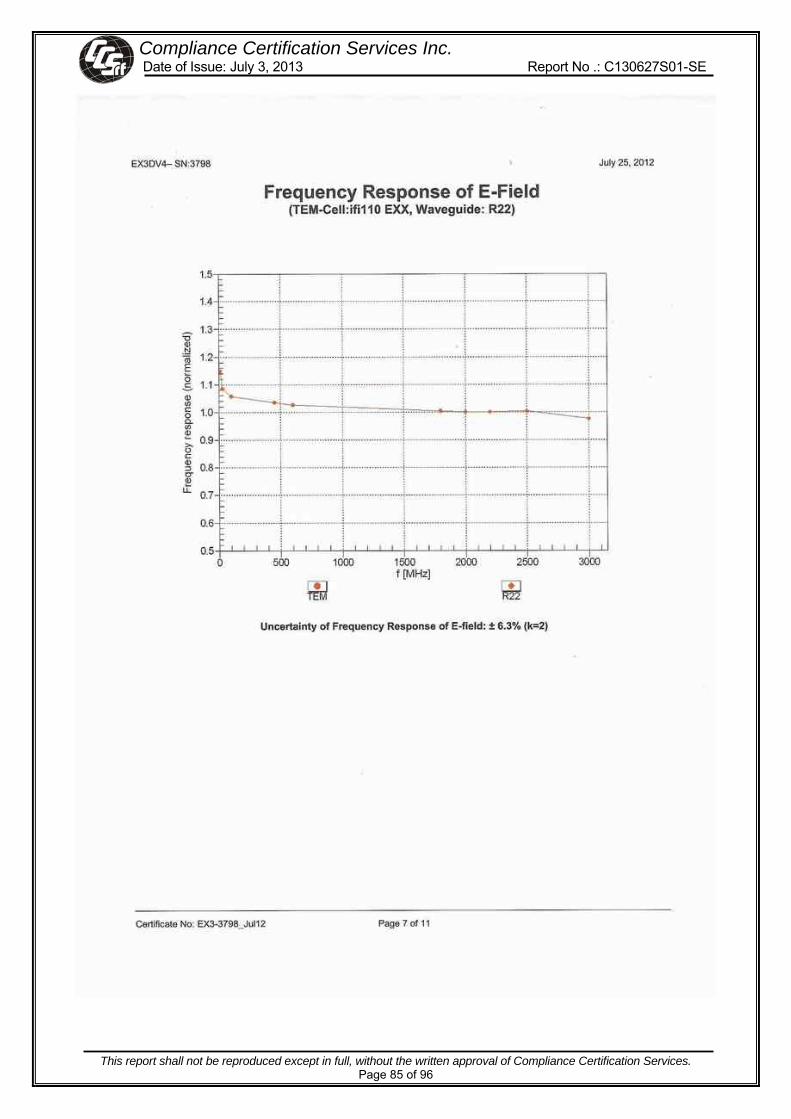
Compliance Certification Services Inc. Date of Issue: July 3, 2013 Report No .: C130627S01-SE
This report shall not be reproduced except in full, without the written approval of Compliance Certification Services. Page 85 of 96

Compliance Certification Services Inc. Date of Issue: July 3, 2013 Report No .: C130627S01-SE
This report shall not be reproduced except in full, without the written approval of Compliance Certification Services. Page 86 of 96

Compliance Certification Services Inc. Date of Issue: July 3, 2013 Report No .: C130627S01-SE
This report shall not be reproduced except in full, without the written approval of Compliance Certification Services. Page 87 of 96

Compliance Certification Services Inc. Date of Issue: July 3, 2013 Report No .: C130627S01-SE
This report shall not be reproduced except in full, without the written approval of Compliance Certification Services. Page 88 of 96

Compliance Certification Services Inc. Date of Issue: July 3, 2013 Report No .: C130627S01-SE
This report shall not be reproduced except in full, without the written approval of Compliance Certification Services. Page 89 of 96
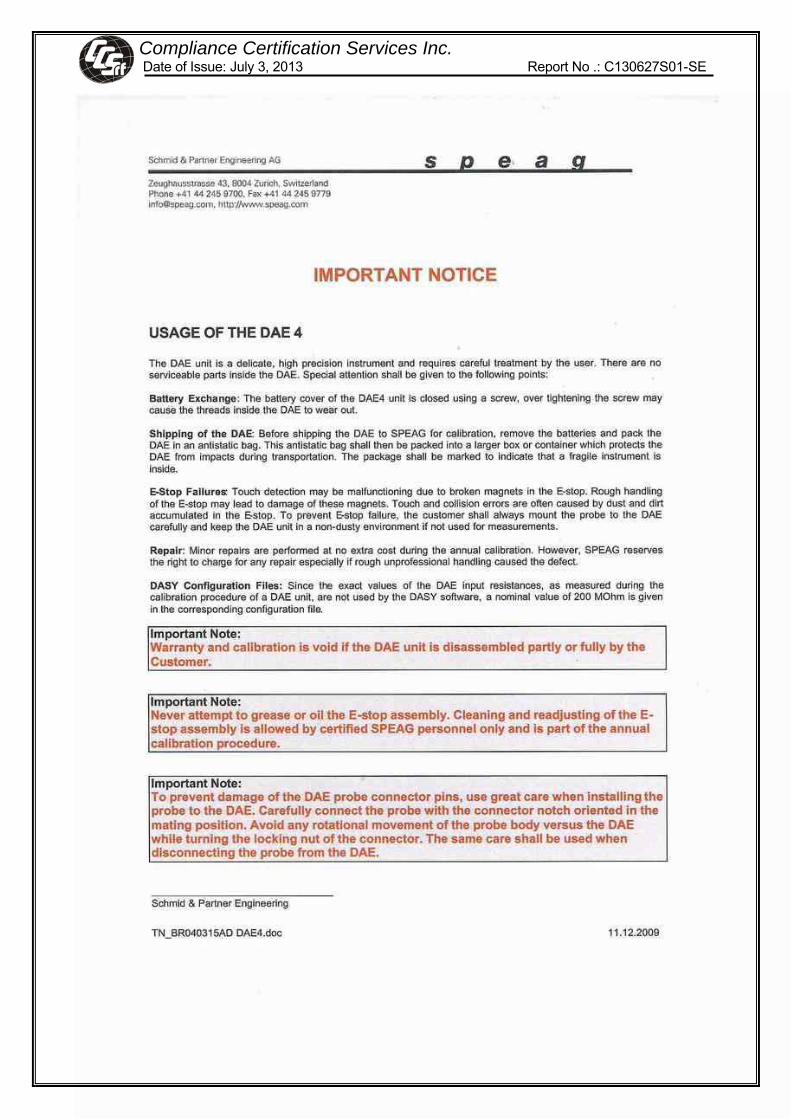
Compliance Certification Services Inc. Date of Issue: July 3, 2013 Report No .: C130627S01-SE
This report shall not be reproduced except in full, without the written approval of Compliance Certification Services. Page 90 of 96

Compliance Certification Services Inc. Date of Issue: July 3, 2013 Report No .: C130627S01-SE
This report shall not be reproduced except in full, without the written approval of Compliance Certification Services. Page 91 of 96
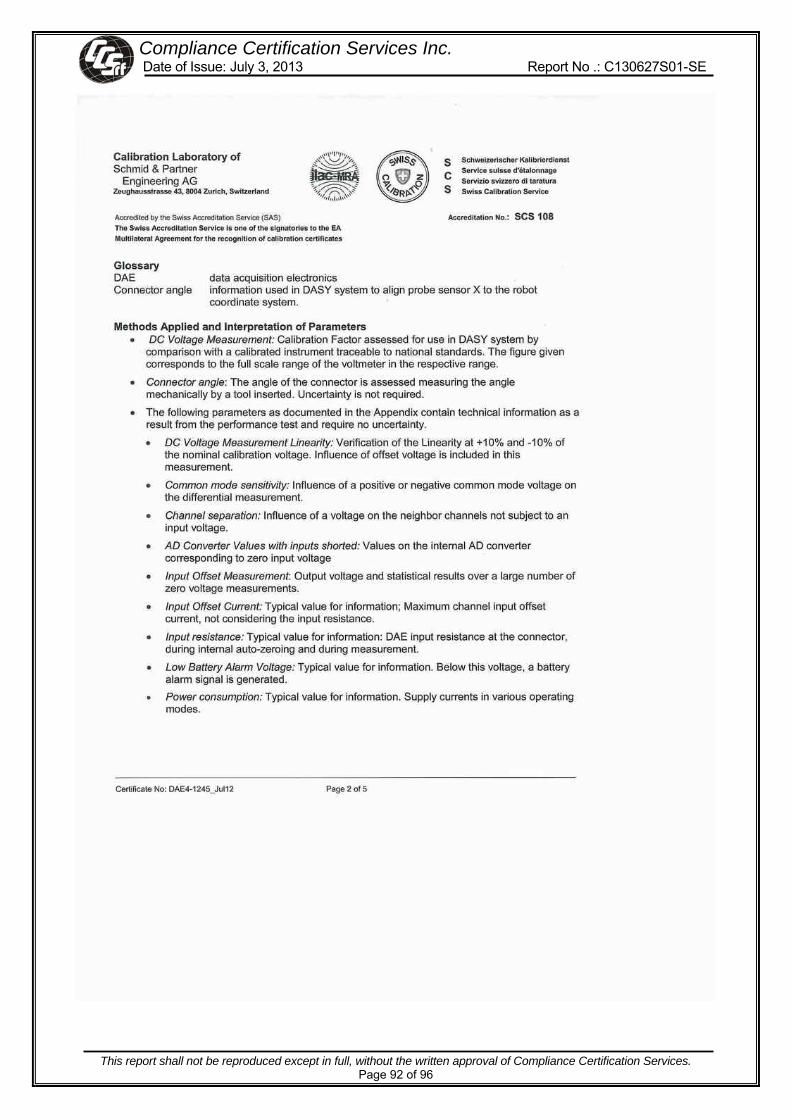
Compliance Certification Services Inc. Date of Issue: July 3, 2013 Report No .: C130627S01-SE
This report shall not be reproduced except in full, without the written approval of Compliance Certification Services. Page 92 of 96

Compliance Certification Services Inc. Date of Issue: July 3, 2013 Report No .: C130627S01-SE
This report shall not be reproduced except in full, without the written approval of Compliance Certification Services. Page 93 of 96
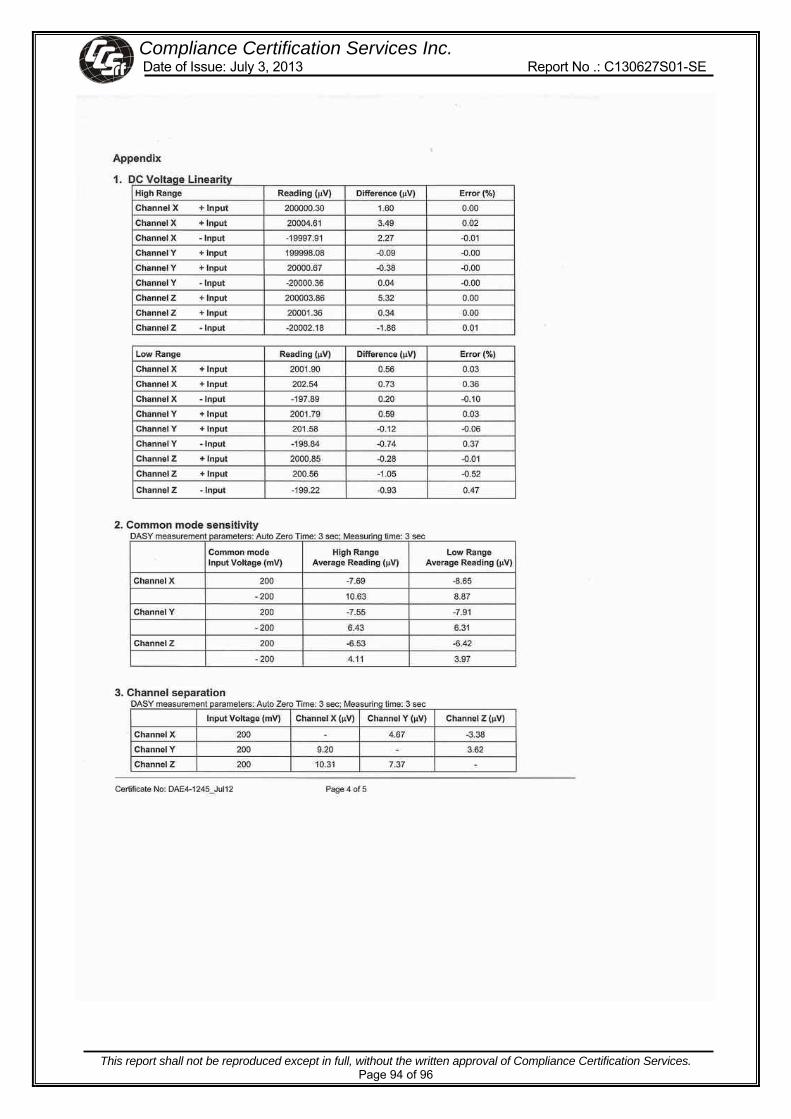
Compliance Certification Services Inc. Date of Issue: July 3, 2013 Report No .: C130627S01-SE
This report shall not be reproduced except in full, without the written approval of Compliance Certification Services. Page 94 of 96

Compliance Certification Services Inc. Date of Issue: July 3, 2013 Report No .: C130627S01-SE
This report shall not be reproduced except in full, without the written approval of Compliance Certification Services. Page 95 of 96
Compliance Certification Services Inc. Date of Issue: July 3, 2013 Report No .: C130627S01-SE
This report shall not be reproduced except in full, without the written approval of Compliance Certification Services. Page 96 of 96
Appendix C: Plots of SAR Test Result The plots are showing in the file named Appendix C Plots of SAR Test Result
END REPORT