in 2014, mexico exported around 4 litres of...
TRANSCRIPT

PROCESSED FOODS

WHEREVER you ARE, it’s HIGHLYPROBABLE that SOMETHING AROUNDyou has BEEN MADE in MEXICO.
is the Mexican Government institution that promotes the export of Mexican products and services, the internationalization of national companies, and the attraction of foreign investment. ProMéxico drives Mexico’s active participation in the international economic arena. Through a network of 48 of�ces in 31 countries and 29 of�ces in the country it offers a wide range of specialized services and support.

WHAT ARE PROCESSED FOODS?
Processed foods are the ones that have gone through some kind of process before their consumption and thanks to canning or packaging, they prevent undue manipulation of foods and guarantee their quality and health.
Today’s lifestyle demands processed foods, which allow for quicker and simpler preparation, and also afford us the opportunity of acquiring seasonal foods throughout the year.
Mexico possesses the technology, the raw materials, the infrastructure and the necessary processes to provide the domestic and world markets with safe foods that preserve their unique �avor.
In 2014, MEXICOEXPORTED AROUND
4 LITRES of MEZCALEVERY MINUTE.

MAIN EXPORT PRODUCTS
TariffCode
ExportValue
2014 (md)Description % Growth
2013-2014
% Share inTotal Industry Exports 2014
Main ExportDestinationsand % Share
Table 1. Main Products Exported by Mexico, 2014
17011905170418060306
09010802
02032919012008
Cane or beet sugar & sucroseBread, cake & biscuit productsConfectionery items without cocoaChocolateShell�sh (peeled, live, fresh & refrigerated)Coffee (roasted or decaffeinatedFresh or dried nuts (almond, hazelnut, walnut, chestnut, pistachio, macadamia & pine nuts, among others)Frozen porkMalt extractPrepared & preserved fruitsOthersTotal
-30.4%4.3%6.9%
-5.5%16.8%
-16.9%57.1%
-8.7%-10.4%
7.5%3.5%
-2.2%
-30.4%4.3%6.9%
-5.5%16.8%
-16.9%57.1%
-8.7%-10.4%
7.5%3.5%
-2.2%
11.09.57.36.85.6
4.94.7
4.44.34.2
37.3100%
11.09.57.36.85.6
4.94.7
4.44.34.2
37.3100%
US 81.4% | UK 5.5% | CA 4.6% | MA 2.4% | LY 1.6%US 86.2% | CA 5.9% | GT 1.4% | DO 1.0% | PA 0.9%US 87.4% | GT 2.8% | CR 1.8% | DO 0.9% | CA 0.9%US 86.1% | CA 6.6% | GT 0.9% | CR 0.7% | CO 0.6%
US 84.2% | HK 9.1% | VN 3.8% | JP 0.9% | FR 0.8%
US 64.8% | PR 5.8%| ES 4.7% | BE 4.4% | CA 3.2%US 80.8% | HK 13.9% | VN 4.5% | ES 0.2% | RU 0.1%
JP 85.5% | US 8.0% | KR 6.1% | CA 0.3% | CN 0.03%VE 26.8% | US 8.7% | PE 7.4% | CO 6.9% | GT 6.8%US 85.4% | UK 2.9% | NL 2.7% | ES 1.4% | JP 1.2%
907786605565461
407385
359356348
3,0828,261
US United StatesUK United KingdomCA CanadaMA MoroccoLY LibyaGT Guatemala
US United StatesUK United KingdomCA CanadaMA MoroccoLY LibyaGT Guatemala
DO Dominican RepublicPA PanamaCR Costa RicaCO ColombiaHK Hong KongVN Vietnam
DO Dominican RepublicPA PanamaCR Costa RicaCO ColombiaHK Hong KongVN Vietnam
JP JapanFR FrancePR Puerto RicoES SpainBE BelgiumRU Russia
JP JapanFR FrancePR Puerto RicoES SpainBE BelgiumRU Russia
KR South KoreaCN ChinaVE VenezuelaPE PeruNL Netherlands
KR South KoreaCN ChinaVE VenezuelaPE PeruNL Netherlands
• In 2014, the leading product exported from Mexico was sugar cane, with bakery products in second place followed by confectionery and chocolate.
• It is worth noting the growth of other products in 2013, such as nuts at a rate of 57%, shell�sh at 17% and prepared and preserved fruits at 8%.
• The categories with the highest number of export companies in 2013 were: food preparations with 602 units, sauce preparations with 437, prepared or preserved fruits and vegetables with 353, confectionery without cocoa 339 and chocolate 258.
Source: ProMéxico con base en Global Trade Atlas.
57%
NU
TS 8%
PR
EPA
RED
&P
RES
ERV
EDFR
UIT
S17%
SHEL
LFIS
H

TAMQUAM PLACERAT IUSINDUSTRY INDICATORS IN MEXICO
• 2nd largest processed food supplier to the USA (2014)
• 3rd largest processed food producer in the Americas (2013)
• 9 of the ten most important companies in the global industry have a presence in Mexico
• Total personnel employed in the food industry: 793,826
• Production 2013: $135.293 bd• AAGR 2013-2020: 6.4%
• Consumption 2013: $137.112 bd• AAGR 2013-2020: 6.2%
• FDI (2004-2014): $16.392 bd• FDI 2014: $433 md
• Top investor countries from 2004 to 2014: Netherlands, USA, Switzerland, Japan and Luxembourg.
• Exports 2014: $8.261 bd
• Main export products: cane sugar, bread, chocolate and confectionery without cocoa.
2ND 3RD
US 68% JP 5.5% CA 2.5% HK 2.2% GT 2.1%
DESTINATIONS:

COMPETITIVE COSTS
Mexico is a pro�table country for locating food industry production units; during 2013, net operating pro�ts in Mexico reached 37.1 bd, representing 10% of the global industry indicator.
Graph 7. Index of Cost Savings for the Processed Food Industry, 2014
Source: KPMG, Competitive Alternatives(KPMG’s Guide to International Business Location), 2014.
-9.1
%
-5.1
% -3.7
% -3%
-1%
-0.7
% 0%
0.2% 0.7% 1.
3%
Mex
ico
UK
Can
ada
Net
herla
nds
Japa
n
Fran
ce
US
Ital
y
Ger
man
y
Aus
tral
ia
NET OPERATINGPROFITS INMEXICOREACHED37.1 BD
representing
10%of the

SIZE OF THE MARKET IN MEXICO
Categories AAGR2014-2019
Market value 2014 (md)
% share in total value 2014
Table 2. Value and Volume of Processed Food Sales in Mexico during 2014
BreadDairyConfectionerySauces, dressings & condimentsSweet and savory snacksDehydrated processed dry foodsRefrigerated foodsOils and fatsCanned foodsBaby foodsFrozen foodsPastaSpreadsIce creamSnack barsNoodlesReady to eat foodsFood substitutesSoupsTotal
27,17713,221
4,7644,0463,6702,4772,1272,1822,2511,190
883660.1523.4601.3410.3388.7385.8326.5167.2
67.451
40.3%19.6%
7.1%6.0%5.4%3.7%3.2%3.2%3.3%1.8%1.3%1.0%0.8%0.9%0.6%0.6%0.6%0.5%0.2%
100%
40.3%19.6%
7.1%6.0%5.4%3.7%3.2%3.2%3.3%1.8%1.3%1.0%0.8%0.9%0.6%0.6%0.6%0.5%0.2%
100%
3.6%4.8%4.0%4.1%4.4%4.0%5.5%4.7%3.6%4.4%4.2%4.7%5.5%2.0%8.2%5.4%5.2%5.8%2.5%4.1%
• In 2014, the size of the processed food market* in Mexico was worth 67.451 billion dollars. The market value is expected to grow at an AAGR of 4.1% between 2014 and 2019.
• The biggest selling categories in the Mexican market in 2014 were bread, dairy and confectionery, with a joint share of 67% of the domestic market.
* Note: Refers to industry sales on the domestic market. Source: Euromonitor.

* Economic units refer to of�ces, manufacturing plants and distribution centers.
185,013 ECONOMIC UNITS*
LOCATED IN:
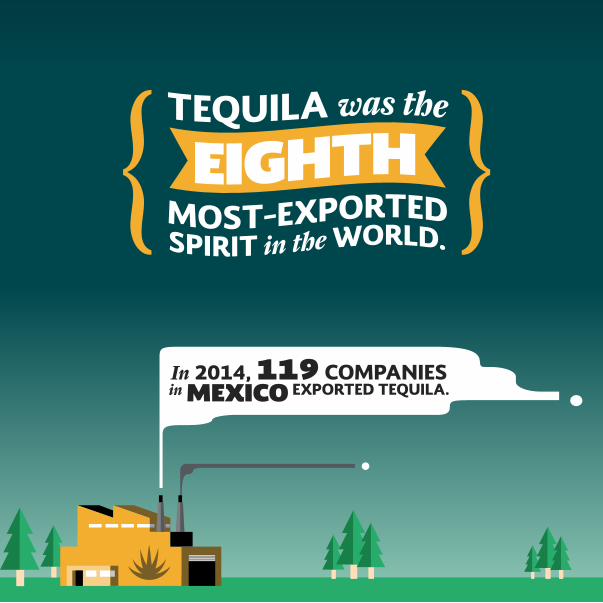
In 2014, 119 COMPANIESin MEXICO EXPORTED TEQUILA.

MEXICAN TRADE: EXPORTS VALUE
• In 2014, Mexican exports from the industry reached a value of 8.261 bd, representing an AAGR of 10% between 2007 and 2014.
Graph 4. Mexican Processed Food Trade, 2007-2014 (bd)
4.31
27.
478
5.14
88.
091
5.39
0 6.53
5
6.10
8 7.69
9
8.09
9 9.28
0
8.04
3 9.49
2
8.44
3 9.71
0
8.26
1 10.1
28‘07
0
2,000
4,000
6,000
8,000
10,000
12,000
-3,500
-3,000
-2,500
-2,000
-1,500
-1,000
-1,000
-500
‘08 ‘09 ‘10 ‘11 ‘12 ‘13 ‘14
Exports Imports Trade Balance
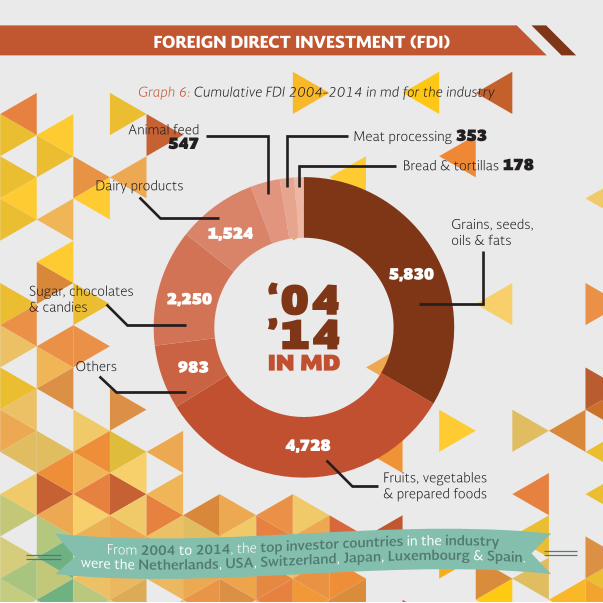
FOREIGN DIRECT INVESTMENT (FDI)
Graph 6: Cumulative FDI 2004-2014 in md for the industry
‘04’14IN MD
Grains, seeds,oils & fats
Bread & tortillas 178
Meat processing 353Animal feed547
5,830
1,524
2,250
983
4,728
Fruits, vegetables& prepared foods
Others
Sugar, chocolates& candies
Dairy products

MEXICO EXPORTS TEQUILA, MEZCAL & SOTOL,THREE DRINKS with a PROTECTED
DENOMINATION of ORIGIN, and can only bePRODUCED in the COUNTRY.

PRODUCTION & CONSUMPTION IN MEXICO
P&C
PRODUCTION
In 2013, the value of the processed food industry in Mexico was estimated at 135.293 bd; between 2013 and 2020 the industry is expected to grow at an AAGR of 6.4%.
* Figures in billions of dollars.
Graph 1. Processed Food Production in Mexico 2012-2020*
AAGR:6.4%
135
141
156
169
179
188
198
208
‘13 ‘14 ‘15 ‘16 ‘17 ‘18 ‘19 ‘20
CONSUMPTION
In 2013, consumption in Mexico was calculated to reach 137.112 bd; it is expected to grow at an AAGR of 6.2% between 2013 and 2020.
Graph 2. Processed Food Consumption in Mexico 2012-2020*
AAGR:6.2%
Source: ProMéxico based on information from INEGIand Global Insight.
137
142
158
170
180
189
199
209
‘13 ‘14 ‘15 ‘16 ‘17 ‘18 ‘19 ‘20

FOREIGN DIRECT INVESTMENT (FDI)
From 2004 to 2014, the cumulative FDI for the processed food industry reached a value of 16.393 bd.
In 2014, incoming FDI rose to 433 md.
Graph 5: FDI In�ows in md for 2004-2014
3.64
0
1,68
5
1,05
1
602
333
151
6,14
2
1,54
8
-168
976
433
‘04 ‘05 ‘06 ‘07 ‘08 ‘09 ‘10 ‘11 ‘12 ‘13 ‘14Source: Ministry of Economy.

MEXICAN TRADE: EXPORTS DESTINATIONS
MEXICAN EXPORTS TOTAL VALUE IN 2014: 8,261 MD
• Mexican exports were primarily destined to the USA with 67.6% share, followed by Japan (5.5%), Canada (2.5%) and Hong Kong (2.2%).
Source: Global Trade Atlas
Country% Share
2014Value 2014
(md)Growth
2013-2014
Table 3. Export Destinations ofthe Mexican Industry, 2014
USAJapanCanadaHong KongGuatemalaVenezuelaSpainUKVietnamNetherlandsOthersTotal
5,587456209183177118113105
7876
1,1598,261
-4.4%-14.0%56.4%39.1%-1.0%
-25.4%64.7%76.6%54.5%34.9%-5.8%-2.2%
-4.4%-14.0%56.4%39.1%-1.0%
-25.4%64.7%76.6%54.5%34.9%-5.8%-2.2%
67.7%5.5%2.5%2.2%2.1%1.4%1.4%1.3%0.9%0.9%
14.0%100.0%

PRODUCTION BY INDUSTRY IN MEXICO
Source: National accounts, INEGI.
Of the main inputs required by the industry for product manufacture, 90% come from the domestic market and include fruits, vegetables, beef, cardboard, glass, plastic and tin cans.
Graph 3. Mexican Processed Food Production by Industry 2013, Percentage Share
52.7% of industry production is concentrated in bread and tortillas and meat processing.
2013
%SHARE
OthersFish and shell�shpreparation 0.9%
Fruits, vegetablesand cooked dishes
Sugar, chocolatesand candies
Grains and oilseeds
Dairy products
Bread and tortillas
Meat and poultry processing
15.3%
3.8%
6.7%
10%
10.6% 25.8%
26.9%

COMPETITIVE COSTS
79.9
33
70.2
57
37.1
01
19.5
56
16.0
21
17.8
97
11.0
32
7.47
5
9.27
0
6.95
5
Chi
na US
Mex
ico
Braz
il
Japa
n
Indo
nesi
a
Russ
ia
Tha
iland
Can
ada
Indi
a
Graph 8. Net Operating Pro�ts in the Processed Food Industry, for selected countries (bd) 2014
Source: Global Insight
Mexico provides 9.1% savings on manufacturing costs in the processed food industry, compared to costs in the USA and other countries.
In addition, Mexico City and Monterrey are ranked the �rst and second lowest cost cities, respectively.

COMPANIES LOCATED IN MEXICO
There are a total of 185,013 industry economic units* in Mexico, mainly in the State of Mexico, Puebla, Oaxaca, Veracruz and Mexico City. In 2013, the food industry employed 793,826 people.
Sales in 2014: 14.064 bdEmployees: 128,000
Sales in 2014: 3.383 bdEmployees: 35,000
Sales in 2014: 4.241 bdEmployees: 19,202
1
2
3
45
6
10
7 11
8
9
1.- AguascalientesGrupo LalaIndustrias BachocoSara Lee de MéxicoTyson Foods
6.- GuanajuatoCampbell’sConAgra FoodsGrupo AltexGrupo BimboGrupo DanoneGrupo HerdezGrupo LalaIndustrias BachocoLa ModernaPepsicoSigma Alimentos
7.- MorelosGivaudanIngenio E. ZapataPepsicoUnilever
8.- QuerétaroKellog’sMarsNestléNutecPilgrim’s PrideProalimexQualtia Alimentos
9.- TlaxcalaComercializadora GonacNestléProductos Alimenticios La Morena
10.- San Luis PotosíCanel’sCarlotaGrumaGrupo BimboLas SevillanasSigma Alimentos
11.- PueblaBachocoGrupo BimboGrupo HerdezSabormex
2.- ColimaDanisco MexicanaGrupo MarítimoMarindustriasSigma Alimentos
3.- HidalgoGrupo BimboPilgrim’s PrideProductos Santa ClaraSigma Alimentos
4.- Distrito FederalConAgra FoodsGrumaGrupo BimboGrupo DanoneGrupo HerdezGrupo LalaGrupo Mac’MaGrupo TurínKraftLa CosteñaNestléPepsico
5.- Estado de MéxicoAlpuraChocolates TurínGrupo AltexGrupo BimboGrupo HerdezKraftLa ModernaNestléPepsicoSigma AlimentosUnileverYakult
* Includes companies, plants,commercial and sales of�cesSource: DENUE and EMIM, (INEGI)
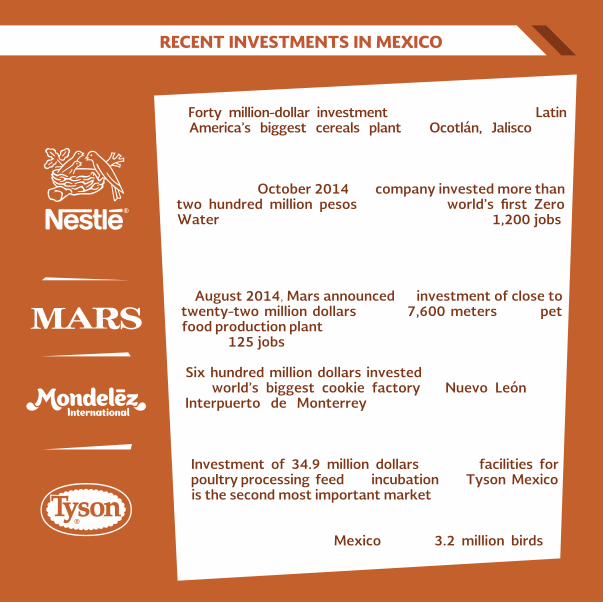
• Forty million-dollar investment in the construction of Latin
America’s biggest cereals plant in Ocotlán, Jalisco. The decision to install a second plant here was due to the availability of dairy raw materials in the state.
• In addition, in October 2014 the company invested more than two hundred million pesos to open the world’s �rst Zero Water factory in Jalisco; besides generating around 1,200 jobs, this will translate into a sizeable reduction in annual water consumption levels used in the powdered milk production process.
• In August 2014, Mars announced an investment of close to twenty-two million dollars to add 7,600 meters to its pet food production plant in Poncitlán; the expansion will generate around 125 jobs.
• Six hundred million dollars invested in the construction of the world’s biggest cookie factory in Nuevo León. The Interpuerto de Monterrey was chosen as its location because it will be Mexico’s major distribution and logistics center in the next few years.
• Investment of 34.9 million dollars to build facilities for poultry processing, feed and incubation. For Tyson, Mexico is the second most important market after the USA.
• It currently operates three production plants and seven distribution centers in Mexico, selling 3.2 million birds a week on the domestic market.
RECENT INVESTMENTS IN MEXICO

PROMÉXICO WORLDWIDE OFFICES
NORTH AMERICA LATIN AMERICA
EUROPE & AFRICA
[email protected] [email protected]@[email protected]@promexico.gob.mxLos [email protected]@[email protected] [email protected]@promexico.gob.mx
[email protected] [email protected]@[email protected]
[email protected] de [email protected] [email protected]
Istanbul (Paci�c Alliance)[email protected]
[email protected]@promexico.gob.mxWashington, [email protected]
[email protected]@promexico.gob.mx
ASIA-PACIFIC
[email protected]@[email protected] [email protected] [email protected]@promexico.gob.mxNew [email protected]@promexico.gob.mxShanghaishanghai@[email protected]@[email protected]
[email protected]@promexico.gob.mx
48OFFICES

WWW.PROMEXICO.GOB.MX+52 (55) 5447 7000
/PROMEXICOOFICIAL@PROMEXICO