in 1952, between twilight on 1 october and dawn on 5
TRANSCRIPT

A CONTINENTWIDE VIEW OF BIRD MIGRATION
ON FOUR NIGHTS IN OCTOBER
GEORCE H. LOWERY, JR., A•D ROBERT J. NEWMAN
IN 1952, between twilight on 1 October and dawn on 5 October, observ- ers watching through telescopes witnessed the passage of 35,407 presump- tive migrants silhouetted against the moon. No less than 1,391 bird stu- dents and astronomers joined in the organized effort that produced this total. They manned 265 observation stations at 235 named locations rep- resenting three of the provinces of Canada and every state of the United States except Alaska, Hawaii, Maine, Nevada, and Utah. Figure 1 and its accompanying key identify the locations.
The records produced by this project offered a basis for constructing continentwide synoptic views of nocturnal migration over North America. But the difficulties were formidable. We have spent more than a decade in overcoming them.
TIlE METIIOD OF PORTRAYING MIGRATION
Lunar observations provide information regarding two features of the migration over the vicinity of the observing point--the approximate amount of migration and its directional trends. Neither the quantity of mi- gration nor its directions, however, are immediately discernible from the raw data recorded in the field. Each must be decoded from these data by a mathematical procedure that compensates for the changing effects exerted on observations by the constantly moving moon.
By 1952, mathematical means of correcting for changes in the size of the effective observation space due to the movement of the moon and of calculating flight directions from the apparent pathways of birds as seen against the moon had already been devised (Rense, 1946 and 1950; Low- ery, 1951). But the procedures were extremely cumbersome and time-con- suming. To cope with the data amassed in 1952, we developed a new com- putation system based on the principle of the old one but incorporating a large measure of precalculation.
The mathematical results express the quantity of migration in terms of the theoretical number of passing birds per mile of front per hour. Our earlier papers referred to this theoretical number as a /fight density. Because density primarily denotes the quantity of objects in space alone and because "flight density" in our sense relates to numbers in space and time combined, we now prefer the term migration tra/fi'c rate. The migration traffic rates on which the present paper is based are stated in detail in a supplemental publication (Newman and Lowery, 1964).
547 The Auk, 83: 547-586. October, 1966
548 LOWERY AND NEWMAN, Continentwide Bird Migration [ Auk Vol. 83
THE OBSERVATION STATIONS
1. New Hampton, N.H. 2. Andover, Mass. 3. Boston, Mass. 4. South Hadley- Springfield-Ware, Mass. 5. Pittsfield, Mass. 6. Monterey, Mass. 7. Glastonbury- Hartford-Storrs, Conn. 8. N. augatuck-New Haven-Westport-Wilton, Conn. 9. Bear Mountain Park-Dobbs Ferry-Mt. Kisko-Scarsdale-West Nyack, N.Y. 10. Kingston- Lomontville-Mohonk Lake, N.Y. ll. Ferndale-Monticello, N.Y. 12. Troy, N.Y. 13. Binghamton-Johnson City, N.Y. 14. Elmira, N.Y. 15. Allegany, N.Y. 16. Pittsford-Rochester, N.Y. 17. Geneva-Waterloo, N.Y. 18. Oneida, N.Y. 19. Brooklyn-Flushing, N.Y. 20. Woodstock, Vt. 21. Rutland, Vt. 22. Kellogg Bay, Vt. 23. Chatham-Haworth-Upper Montclair-Oradell-Ramsey-Westfield-Whitehouse-Wood Ridge, N.J. 24. Freehold-Lakewood-Matawan, N.J. 25. Audubon-Moorestown, N.J. 26. New Hope, Pa. 27. Scranton, Pa. 28. Reading, Pa. 29. Gradyville-King of Prus- sia-Norristown-West Chester, Pa. 30. Lancaster, Pa. 31. New Cumberland, Pa. 32. State College, Pa. 33. Greenville, Pa. 34. The Cedars, Del. 35. Cedar Beach, Del. 36. Deep Shore, Md. 37. Towson, Md. 38. Laurel, Md. 39. Frederick, Md. 40. Emmitsburg, Md. 41. Huntington, W. Va. 42. Athens, Ohio. 43. Columbus, Ohio. 44. Canton, Ohio. 45. Kent, Ohio, 46. Cleveland, Ohio. 47. Berea, Ohio. 48. Toledo, Ohio. 49. Hamilton, Ont. 50. Hawk Cliff, Ont. 51. West Lorne, Ont. 52. Bear Island, Ont. $3. Montreal, Que. 54. Fort William, Ont. 55. Balsam Lake, Wis. $6. Viroqua, Wis. 57. Wausau, Wis. 58. Appleton, Wis. 59. Kiel, Wis. 60. Oshkosh, Wis. 61. Waupun, Wis. 62. Madison, Wis. 63. Edgerton, Wis. 64. Beloit, Wis. 65. Kenosha, Wis. 66. Mundelein, Ill. 67. St. Charles, Ill. 68. Chicago, Ill. 69. Peoria, Ill. 70. Quincy, IlL 71. Bay City, Mich. 72. Pontiac, Mich. 73. Bloomfield Hills, Mich. 74. Temperance, Mich. 75. Muskegon, Mich. 76. Niles, Mich. 77. South Bend, Ind. 78. Lagrange, Ind. 79. Richmond, Ind. 80. Evansville, Ind. 81. Newburgh, Ind. 82. Louisville, Ky. 83. Murray, Ky. 84. Memphis, Tenn. 85. Nashville, Tenn. 86. Kimball, Tenn. 87. Chattanooga, Tenn. 88. Knoxville, Tenn. 89. Blacksburg, Va. 90. Sweet Briar, Va. 91. Cobham, Va. 92. Arlington, Va.-Washing- ton, D.C. 93. Williamsburg-York River, Va. 94. Driver, Va. 95. Rocky Mount, N.C. 96. Greenville, N. C. 97. Atlantic Beach, N. C. 98. Raleigh, N. C. 99. Guilford, N. C. 100. Charlotte, N. C. 101. Highlands, N. C. 102. Charleston, S.C. 103. Rome, Ga. 104. Athens, Ga. 105. Milledgeville, Ga. 106. Robins AFB, Ga. 107. Columbus, Ga. 108. Sherwood Plantation, Ga. 109. Jacksonville, Fla. 110. Gaines- ville, Fla. lll. Winter Park, Fla. ll2. Miami, Fla. 113. Pensacola, Fla. ll4. Bir- mingham, Ala. 115. Blountsville, Ala. ll6. Laurel, Miss. 117. Shaw, Miss. llS. New Orleans, La. ll9. Pilottown, La. 120. Grand Isle, La., and oil rig offshore. 121. Baton Rouge-Port Allen, La. 122. Alexandria, La. 123. Port Arthur, Tex. 124. Groves, Tex. 125. Bolivar Point, Tex. 126. Galveston Beach, Tex. 127. Houston, Tex. 128. Corpus Christi, Tex. 129. San Benito, Tex. 130. Harlingen, Tex. 131. Alamo, Tex. 132. San Antonio, Tex. 133. Boerne, Tex. 134. Austin, Tex. 135. Col- lege Station, Tex. 136. Lake Waco, T•x. 137. Dallas, Tex. 138. Denton, Tex. 139. Commerce, Tex. 140. E1 Dorado, Ark. 141. Stillions, Ark. 142. Little Rock, Ark. 143. Fort Smith, Ark. 144. Norman, Okla. 145. Tulsa, Okla. 146. Wichita, Kan. 147. Baldwin City, Kan. 148. Fort Riley, Kan. 149. Lawrence, Kan. 150. Kansas City, Kan. 151. St. Joseph, Mo. 152. Sedalia, Mo. 153. Moberly, Mo. 154. St. Louis-Webster Groves, Mo. 155. Ottumwa, Iowa. 156. Iowa City, Iowa. 157. New- ton, Iowa. 158. Holstein, Neb. 159. Martin, S. Dak. 160. Sioux Falls, S. Dak. 161. Mankato, Minn. 162. Northfield, Minn. 163. St. Paul, Minn. 164. Walker, Minn. 165. Fargo, N. Dak. 166. Bismarck, N. Dak. 167. Upham, N. Dak. 168. Ken- mare, N. Dak. 169. Casper, Wyo. 170. Laramie, Wyo. 171. Boulder, Col. 172. Denver, Col. 173. Colorado Springs, CoL 174. Paonia, Col. 175. Durango, Col. 176. Socorro, N. Mex. 177. Tucson, Ariz. 178. Flagstaff, Ariz. 179. Lemon Grove, Cal. 180. Wildcat Creek, Cal. 181. Los Gatos--Palo Alto--San Jose, Cal. 182. (de- leted). 1113. Walnut Creek, Cal. 184. Corvallis, Ore. 1115. Portland, Ore. 186. Seattle, Wash. 187. Spokane, Wash. 188. Pullman, Wash. 189. Clarkston, Wash. 190. Moscow, Ida. 191. Lewiston, Ida. 192. Pocatello, Ida. 193. Bozeman, Mont. 194. Edmonton, Alta. 195. St. George Island, Fla. 196. East Providence, R. I. 197. Steubenville, Ohio. 198. Hellertown, Pa. 199. Gibson Island, Md. 200. Red- field, S. Dak. 201. Sioux City, Iowa.

,De
550 LOWERY AND N•WM^•, Continentwide Bird Migration [ Auk Vol. 83
A temporal study of 1,808 autumnal migration traffic rates (Newman and Lowery, MS) revealed another complication. The hourly rates showed a tendency toward a characteristic pattern of hour-to-hour change. Their arithmetic means began low, rose to a peak between 2200 and 2300 hours, and then gradually subsided to a predawn mini- mum. Since the nightly watches used in the present continental synopsis varied greatly in length, from as little as one hour to as many as 12 hours, and since many of them were conducted at different times of the night, they were difficult to compare fairly. Suppose, for instance, that the migrants seen against the moon at Station A between 200.0 and 2200 h•ours produced traffic rates totalling 1,000 birds per mile of front and that the count at Station B between 190.0 and 2100 hours on the same
night also yielded traffic rates totalling 1,000 birds per mile of front. Superficially, an equal amount of migration at the two stations seems to be indicated. The difficulty is that the 1900 to 2000 hour (represented at Station B but not at Station A) is typically far inferior in its migra- tion rating to the 2100 to 220.0 hour (represented at Station A and not at Station B). Indications are, therefore, that had both stations ob- served during the same period, results at Station B would have sur- passed results at Station A.
Our solution to this problem has been to express the computed migra- tion at each station as a percentage of the average obtained for the same hours in the separate hour-to-hour analysis. This average is 4,800 birds per mile of front for the period of 1900 to 2100 hours. The 1,000- bird rating of Station B in this period is 21% of the average. The aver- age for 2000 to 2200 hours is 6,800, and the 1,000-bird rating of Sta- tion A for the same two hours is only 15% of the average. Thus the per- centage scores properly express the probability that migration on the night in question was somewhat heavier at Station B than at Station A.
The problem of depicting the density and direction of migration at a large number of stations on maps small enough to fit on the page of an ordinary journal was in itself a major one. Previous published represen- tations of lunar-derived migration data on maps (Lowery, 1951; Lowery and Newman, 1955) had portrayed direction only and had by means of clusters of arrows included all the computed flight directions at a given station. A glance back at Figure 1, the map of the observation points, so crowded in some sections that they could not be indicated even by sepa- rate numbered dots, will serve to. show why this procedure could not be applied in the present project.
On the maps that follow, difficulties of scale combined with the large number of observation posts have obliged us to represent directional trends by a single small arrow. Our problem in determining the direc-
Oct. ] LOWERY AND NEWMAN, Contlnentwlde Bird M{gration 551 1966
tion to be shown by this arrow was complicated by the tendency of migra- tion directions in fall to scatter far more widely than migration directions in spring. In a few instances, directions seemed almost random.
Our procedure has been to determine the 180 degrees in which the most migration occurred at a given station on a given night. By vector addition of the migration quantities included in this 180-degree spread, we have arrived at a direction that determines the slant of the arrow portrayed. When the vector resultant obtained was clearly the product of two diver- gent trends and pointed along a pathway that relatively few birds were calculated to. be following, we have indicated this divergence by splitting the head of the arrow by a bar. When less than 80% of the computed mi- gration fell in the 180 degrees that determined the slant of the arrow, we have taken cognizance of the counter-trend by "fish-tailing" the arrow. What we mean by "split heads" and "fish tails" is depicted in Figure 2.
Our objective has been to indicate amounts of mi•ation in such a way that mass features of the display would be almost instantly discernible, without prolonged study of the individual arrows. Such a result requires that the system of portrayal have a natural visual link with the quantita- tive scale. We have attempted to provide this link by a five-grade color key that indicates denser and denser migration by denser and denser com- binations of white, red, and black. An ideal division of the scale into five parts would be one providing fairly similar numbers of arrows of each grade and enough mathematical regularity to be easily remembered. These two provisions can be approximated by doubling the upper limit of each successive range, as: 1-10%, 11-20%, 21-40%, 41-80%, and 81% or more. With these divisions the number of cases in the five different grades are respectively 115, 83, 99, 78, and 119. In one respect, the foregoing per- centage scale may be misleading. The soundest principles of data selec- tion for purposes of hour-to-hour analysis bias the resulting averages to- ward atypically high migration traffic rates and thereby depress per- centages based on them. Over-all, the migration traffic rates for the four nights of the present study are almost exactly two-thirds as high as those used in the hour-to-hour analysis. Therefore a scale change that preserves the proportional verities of the hour-to-hour analysis without accepting its absolute quantitative values as "average" is both easy and desirable. The effect is to rate each of the.'present sets of observations against the total amount of migration recorded for the four nights imme- diately concerned. Without in any way altering the number of cases in each group, the percentage ranges become those shown in the figure on the next page: 1-15%, 16-30%, 31-60%, 61-120%, and over 120%.
The migration symbols shown in Figure 2 are greatly enlarged. Note that all have red borders. These are a device for making the symbol clear-

552 LOWERY AND NEWl•IAbr, Continentwide Bird Migration [ Auk Vol. 83
M I GRAT ION GRADES I_OCAT ION PO I NTS
No migration One station per arrow
Negligible
1-15% Two stations per arrow
Very 1 ight 16-30% Three or more stations per arrow
Light 31-60% DIRECTIONAI- DISPERSION
• Spllt forward components Moderate --- • • 61-120% •
Strong reverse components
Heavy • 121% or more
Figure 2

190•t• ] LOWERY AND NEWMAN, Continentwide Bird Migration 553
ly visible against any background, black or white; the outer borders have no informational significance. The key coloration of the interiors of the arrows conforms to the following darkening and ascending scale: solid white, white and red, solid red, red and black, solid black. In actual plotting, the positioning of the arrow with respect to the observation point varies to permit crowding together the greatest possible number of ar- rows in regions where many stations were operating at once. The location of the station is indicated by a dot within the arrow. When the migration arrow covers two stations, both locations are shown. When an arrow rep- resents more than two stations, the fact is acknowledged by a single large central dot, with no attempt to distinguish the observing sites indi- vidually. The actual directional vectors for St. Charles, Illinois, on 2-3 October and for Ware, Massachusetts, on 1-2 October are reproduced to illustrate the sort of situation represented respectively by "split-headed" and "fish-tailed" migration arrows. The relative lengths of the black vectors correspond to the relative amounts of computed migration in the corresponding directions. The long red arrows represent the vector resultants for the 180 degrees with the most migration.
A feature of our migration charts that needs to be fixed firmly in mind is that the number of migration arrows in an area signifies absolutely nothing with regard to the quantity of migration there. One must look solely to the coloration of the arrows to see how heavy the flights were. The number of arrows furnishes information regarding the number of ob- servation stations only. In some regions, it does not serve even this limited function well.
In southern New England, lower New York, northern New Jersey, and eastern Pennsylvania, for instance, the number of stations far exceeded the number of migration arrows that could be crowded into. the region on a page-size map covering the whole breadth of the continent. Even though not all stations were in operation on all nights, cases where one arrow had to represent two or more stations were frequent in this part of the United States.
When obliged to combine results from different stations, we completely retabulated the data, used the hourly mean traffic rates for determining the color of the arrow, and revectored the migration according to the com- bined amount of recorded flight in each directional sector. In other words, the quantitative and directional 'averages portrayed by combination arrows are not simple means; they are appropriately weighted means.
Figures 3 and 4 (next page) are "blow-ups" of the section of the country where station combinations were most numerous. The small arrows, which are of the size and type used on the later continental maps, show the re- sults at individual localities. The larger arrows, outlined in gray, mark

SOME COM OF STATIOI',
NIGHT OF ARROWS,/ OCTOBER •
SOME COIV OF STATION
NIGHT OF 4-.•
Figure 3
F•gure 4
Oct. ] LowErY AND NEWMAN, Continentwide Bird Migration 555 1966
the areas covered by the combination arrows on the continental maps. The red-bordered squares within the gray outlines reveal what the colora- tion of the combination arrows will be on subsequent charts. A seemingly important omission in Figures 3 and 4--one that will nevertheless be car- ried forward--is failure to provide a formal indicator pointing out the di- rection north. The elimination is both deliberate and inevitable. Our
charts are miniaturized adaptations of the United States Department of Commerce Daily Weather Maps. As such, they are Lambert Conformal Projections, in which the mapped slant of the north direction changes dras- tically from one side of the continent to the other. To identify the migra- tion directions, simply compare the slants of the migration arrows with the slant of the nearest mapped meridian.
The "blow-ups" on the opposite page are presented here mainly to illus- trate how the directions and traffic ratings of combination arrows are re- lated to the directions and ratings of their component station arrows. On 3-4 October, a night of relatively favorable weather in the section con- cerned, scarcely any of the directions of the subsidiary arrows deviate markedly from the direction of the larger arrow in which they are con- tained. On the other hand, in 4 of 10 cases traffic ratings more than one grade apart are recorded within the compass of the same combination arrow. On the meteorologically more disturbed night of 4-5 October, quite to the contrary, none of the migration traffic ratings in the whole sectional display are more than one grade apart, but the directions are conflicting and disorderly both within and without the gray outlines of the large arrows that will later represent them. The extent to which the noncon- formities may be attributable to the real distribution and behavior of migrants and the extent to which they may be blamed on defects in data or limitations in our methods of interpreting data will be a subject of later discussion. We feel, however, that Figures 3 and 4 do give reasonable assurance that combination arrows present a fair summarization of the more detailed picture provided by their contributing parts. True, many individual nonconformities lose identity in the process of amalgamation. Still, the directions of the gray-outlined arrows in Figure 4 reflect the prevailing chaos just as well as the separate station arrows themselves and perhaps even more vividly.
In some instances, thoughtful critics have good reason to doubt at first glance that the station arrows could possibly combine to. produce the di- rectional slant assigned to the outline arrow that encloses them. The lowermost combination arrow on 4-5 October is a good example. Here all three of the encompassed small arrows fall within the same minimal quantitative class rating, and all differ radically in direction. The large arrow appears not to effect a just compromise between the three slants

I I

Oct. ] LOWERY ^•O NEWM^•, Continentwide Bird Migration 5 5 7 1966
but to adhere too closely to the direction of a single station arrow, the northernmost one. What one must bear in mind is that white arrows des-
ignate ratings ranging from 1% to 15%. Therefore one of them may legitimately exercise up to 15 times. the weight of another or up to 7 times the weight of another two.
THE INFLUENCE OF AUTUMN WINDS ON NIGHT MIGRATION
Whether or not wind is really a major factor influencing bird migration, the idea has been advanced often enough and denied often enough to make comparisons of bird flights and winds aloft an excellent starting point for the present series of continental migration maps.
The wind movements shown in this study are derived from United States Air Force Weather Winds Aloft Charts for 2100 EST. The charts indicate
the speed and direction of the wind at more than 80 weather stations by standard Beaufort symbols. If migration arrows were directly super- imposed upon a chart with Beaufort symbols, the result would be a con- fusing tangle in which migration indicators and wind indicators would fre- quently fail at the same location and partially obliterate one another. To avoid this difficulty, we have translated the Beaufort data into large-scale wind trends delineated by large gray wind arrows of a type that cannot be hidden when small migration arrows are overlaid. In the process, we have not made use of any refined technique such as streamline analysis. We have merely employed a draftsman, working without knowledge of the associated bird movements, to sketch in what the Beaufort symbols sug- gest the wind is doing over broad areas. How literal the translation is may be judged from Figure 5, in which the Beaufort symbols for the night of 3-4 October can be directly compared with their derivatives. The small numbers represent wind speed in miles per hour. A more general in- dication of wind speed is the tone of the wind arrows themselves, dar- ker where the wind is stronger.
Data obtained with range-height radar (Harper, 1958; Nisbet, 1963) and with modern weather surveillance radar (Gauthreaux, 1965) suggest that most nocturnal bird migration takes place in the stratum of air be- tween the earth's surface and an elevation one mile above the earth's
surface. Although technical difficulties prevent actual computation of the average ]eve] of flight, a reasonable approximation would appear to be 2,600 to 3,000 feet. Winds Aloft Charts supply data for 2,000 and 4,000 feet above sea level but nothing intermediate. We have decided in favor of the 2,000-foot winds as the ones generally most suitable for our migration maps, though where the altitude of the terrain radically reduces the depth of the stratum of air between ground ]eve] and 2,000 feet, we have had to substitute winds of a higher elevation.

558 LOWERY AND NEWMAN, Continentwide Bird Migration [ Auk Vol. 83
MIGRATION AND WINDS ALOFT ON NIGHT OF 1--2 OCTOBER
The first feature to note in viewing the map on the facing page is the tendency of migration arrows of a given grade to mass in homogeneous blocks. For example, all eight of the arrows representing Iowa, Illinois, and Missouri--three states with a combined area of 182,354 square miles --are black, signifying flights of the highest plotted volume (121% or more of the study average). The over-all breadth of this block of heavy migration from Baldwin City, Kansas, to Newburgh, Indiana, is about 425 miles. At the other end of the scale, two white arrows indicating negligible migration and five circles indicating no. observed migration form a band hundreds of miles long south of Lake Erie and Lake Ontario.
Up to a point, the quantity of migration on this night seems to be in- dependent of the speed and direction of the wind. Top-grade flights (black arrows) occur under a variety of circumstances: with southward winds of 35 mph (eastern Kansas, western Missouri); with southeasterly directed winds of like force (eastern Iowa, southern Wisconsin); with light easterly blowing winds (northeastern Texas); with winds of 17 to 24 mph pushing northeasterly (Little Rock, Arkansas; Chattanooga, Tennessee); and even in face of the northward thrust of adverse winds (Rocky Mount, North Carolina; Washington, D. C.; Naugatuck, Connecticut).
Note, however, that while all the migration is heavy within the south- ward wind arrow that straddles eastern Kansas and western Missouri, the large wind arrow curving from southeastward to eastward below the Great Lakes encloses only four top-grade migration ratings out of 10 and encompasses some stations with no migration at all. And within the northward sweep of wind through the Middle and North Atlantic states, only 4 out of 34 stations are represented by black arrows. Also, where northerly winds approach or exceed 40 mph, as in upstate New York and Vermont, migration is halted entirely. Just as northward wind movement does not preclude a heavy migration rating, southward wind movement does not assure it. Negligible migration in North Dakota and western Minnesota and zero migration in northern South Dakota are closely as- sociated with winds of approximately 24 mph blowing southward.
In spite of several anomalies, an influence of wind on the average flight directions strongly suggests itself. In midwestern states where the winds are swerving easterly, the migration arrows tend to point southeasterly. Contrariwise, in the Atlantic States, where the wind sweep is toward the north, migration tends to take on an opposite trend, toward the west, away from the sea. In general when the wind movement departs markedly from a southward flow, the majority of the birds do not turn to follow the wind; rather they seem to approximate a course that is a compromise between their own calm-air direction and the direction of the wind.

-0•
I, I J I1'!
560 Low•m¾ AND NEWMAN, Continentwide Bird Migration [ ^uk [ Vol. 83
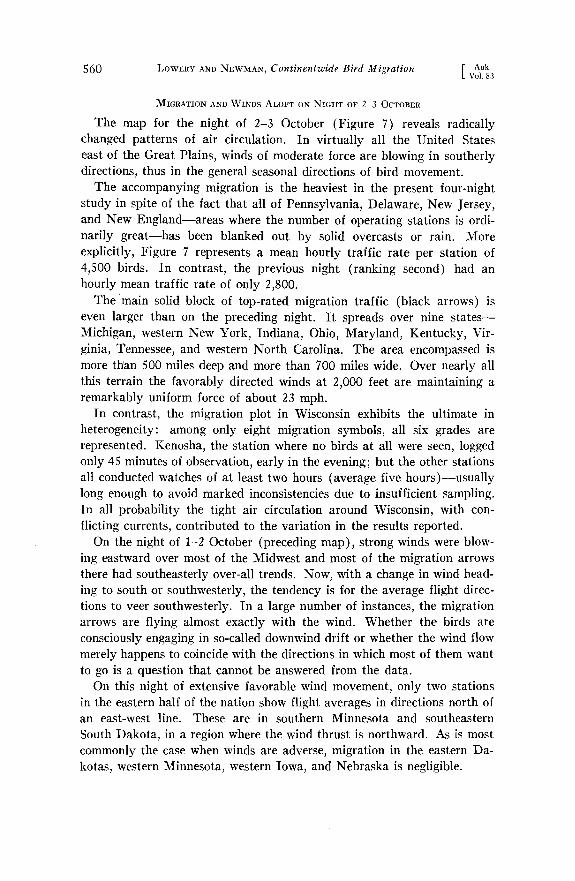
MIGRATION AND WINDS ALOFT ON NICIfT or 2-3 OCTOBER
The map for the night of 2-3 October (Figure 7) reveals radically changed patterns of air circulation. In virtually all the United States east of the Great Plains, winds of moderate force are blowing in southerly directions, thus in the general seasonal directions of bird movement.
The accompanying migration is the heaviest in the present four-night study in spite of the fact that all of Pennsylvania, Delaware, New Jersey, and New England--areas where the number of operating stations is ordi- narily great--has been blanked out by solid overcasts or rain. More explicitly, Figure ? represents a mean hourly traffic rate per station of 4,500 birds. In contrast, the previous night (ranking second) had an hourly mean traffic rate of only 2,800.
The main solid block of top-rated migration traffic (black arrows) is even larger than on the preceding night. It spreads over nine states-- Michigan, western New York, Indiana, Ohio, Maryland, Kentucky, Vir- ginia, Tennessee, and western North Carolina. The area encompassed is more than 500 miles deep and more than 700 miles wide. Over nearly all this terrain the favorably directed winds at 2,000 feet are maintaining a remarkably uniform force of about 23 mph.
In contrast, the migration plot in Wisconsin exhibits the ultimate in heterogeneity: among only eight migration symbols, all six grades are represented. Kenosha, the station where no birds at all were seen, logged only 45 minutes of observation, early in the evening; but the other stations all conducted watches of at least two hours (average five hours)--usually long enough to avoid marked inconsistencies due to insufficient sampling. In all probability the tight air circulation around Wisconsin, with con- flicting currents, contributed to the variation in the results reported.
On the night of 1-2 October (preceding map), strong winds were blow- ing eastward over most o.f the Midwest and most of the migration arrows there had southeasterly over-all trends. Now, with a change in wind head- ing to south or southwesterly, the tendency is for the average flight direc- tions to veer southwesterly. In a large number of instances, the migration arrows are flying almost exactly with the wind. Whether the birds are consciously engaging in so-called downwind drift or whether the wind flow merely happens to coincide with the directions in which most of them want to go is a question that cannot be answered from the data.
On this night of extensive favorable wind movement, only two stations in the eastern half of the nation show flight averages in directions north of an east-west line. These are in southern Minnesota and southeastern
South Dakota, in a region where the wind thrust is northward. As is most commonly the case when winds are adverse, migration in the eastern Da- kotas, western Minnesota, western Iowa, and Nebraska is negligible.


562 LOWERY AI•D NEW1VIAN, Continentwide Bird Migration [ Auk 1_ Vol. 83
MmRATION AND WINDS ALOFT ON Nm•xT or 3-40CXOB•R
The most striking new element in the wind system on the night of 3-4 October (Figure 8) is the broad northward sweep of wind that reaches all the way from the western part of the Gulf of Mexico to the Great Lakes. In middle-eastern Texas where adverse winds have a force on the order
of 17 mph, the birds react by flying in several divergent directions, as indicated by the split heads and fish tails of several of the migration arrows. In northeastern Texas, Oklahoma, northern Arkansas, Kansas, and Missouri, where the wind picks up speed to 23 mph and more, major elements of the migration seem actually to turn to follow the wrongway trend of the air currents. In the Great Lakes area, where head winds are very strong, migration is stopped almost entirely. Of the 33 stations where migration was not more than 15% of "average" on this night, 20 could be bounded by a single isopleth surrounding the Great Lakes region plus the upper Mississippi Valley.
In Massachusetts and most of Connecticut, with winds blowing eastward at speeds reaching or exceeding the birds' own air speeds, migration has veered east of south. At Boston, where the eastward wind has attained 35 mph, the few birds in the air seem actually in danger of being carried out to sea. The migration arrows in New England possibly depict in action a process that has often been inferred from daytime field observa- tions-deflection by the wind of night migrants into southeastern New England from migratory pathways well inland (cf. Baird and Nisbet, 1960; Bagg, 1960; Newman and Lancaster, 1960; and others). Assuming an average air speed of 25 mph for the flights shown, one can compute what the average standard direction of the normal inland pathway would have to be if birds do not resist lateral drift at all. On these premises the data from Pittsfield, South Hadley, and Ware in Massachusetts re- quire a mean standard direction of about 230 ø.
Although more stations were in operation on the night of 3-4 October than at any other time, fewer migrants were recorded than on the preced- ing night. In fact, the mean traffic rate per station-hour is only third in rank, inferior even to the rating for the night of 1-2 October. The map for 3-4 October shows only 25 black migration arrows--14 fewer than on the night of 2-3 October. However, a majority of the black arrows (14 of 25) are massed in Maryland, Virginia, and North Carolina, and six of these exceed 240% of average, the dividing point that would have been used if a seventh category of super-heavy migration could feasibly have been portrayed. During all four nights of the study, 240% was exceeded in only 43 of more than 500 cases. So., while migration over most of the country was poor on the night of 3-4 October, huge flights were occurring in the section where assisting winds of 12-17 mph were blowing.
• J
0 •

564 LOWERY AND NEWl•IAN, Continentwide Bird Migration [ Auk Vol. 83
MIGRATION AND WINDS ALOFT ON NIGHT OF 4-5 OCTOBER
Weatherwise, the period of the study ends much as it began, with the winds swerving northeastward across the eastern United States (Figure 9). One might expect that the migratory movements too would be similar. They are not.
Whereas the night of 1-2 October had the second highest average traffic rate (2,800 birds per hour per mile of front), the night of 4-5 October ranks a poor fourth with a rating of a mere 500 birds. Not a single black arrow appears in Figure 9, and arrows of the second highest grade (red and black) show themselves at only six scattered stations. White arrows, signifying negligible migratory movements, abound. With the adverse wind conditions and the meager samples afforded by the few migrants observed, the computed directional trends become helter-skelter and pro- vide numerous indications of wrong-way flight.
Most attempts to explain the distribution of diurnally observed grounded migrants in terms of wind and weather (e.g., Bagg et al., 1950; Gunn and Crocker, 1951; and numerous national summaries in Audubon Field Notes) have been exercises in hindsight, however convincing. The analysts have looked at known ornithological results and then have tried to find meteorological events to account for them. We had hoped that the prin- ciples emerging from retrospective studies could be refined to the point where blind tests would prove their validity beyond question, where skilled interpreters looking only at a weather map would be able to deduce the migrational outcome with reasonable accuracy.
In view of the meteorological similarities and the migrational contrasts between the nights of 1-2 and 4-5 October, blind tests could hardly have succeeded in both instances. To be sure, weather conditions are not exactly the same on the two nights. Even the winds are not. For example, though the directional patterns of air circulation. in the Gulf States on the two occasions closely resemble one another, the adverse wind currents there are much stronger on the night of 4-5 October. Again, though the push of the wind in the Atlantic States is northerly in both cases, the swerve is inland on 1-2 October and seaward on 4-5 October. So to some
extent the attendant quantities of migration might be considered pre- dictable.
On the other hand, in so far as we have been able to perceive, no meteorological rationalizations of this sort can be constructed to account for the fall-off of migration in such areas as eastern Kansas and western Missouri, where similar wind flows of similar speeds were recorded on both nights. One reasonable assumption is that after three successive nights with heavy flights somewhere east of the Great Plains, the eastern United States was largely drained of birds in a condition to migrate.

566 LOWERY AIqD NEWMAN, Continentwide Bird Migration [ Auk Vol. 83
MmRAT•ON ANI• SURFACE W•ATH•R SYSXF..>aS
Most migrants seen against the moon are passing well aloft. Surface weather does not affect them directly. However, since such weather is the kind shown on the familiar Daily Weather Maps and since it bears certain more or less set relationships to conditions at the higher elevations, consideration of its general features remains pertinent. Therefore in Figures 10-13, we repeat the four migration plots, this time with ground- level highs, lows, fronts, and pressure zones as a background. In our simplifications, nonpictorialized data from the Daily Weather Maps, such as temperature readings, have been omitted. So have features subject to rapid change from hour to hour, such as cloud cover and precipitation. Only selected isobars are shown.
Weather, even in its more stable aspects, does not stand still. Between dusk and dawn, while observations of migrants passing in front of the moon are being made, it can change considerably. But the preserved meteorological records immobilize weather conditions at specific and rather widely spaced moments in time. Converted to their Eastern Standard equivalents, the watches that enter into this study have an average median time of 2230 hours. The readings for winds aloft are taken at 2200 hours EST and therefore are very well timed with respect to the bird observa- tions, except in the Far West. The Daily Weather Maps show surface weather conditions, three hours later, at 0130 EST, after most of the moon watches had ended. Consequently, the fit between the depicted winds aloft and the situations in Figures 10-13 is not exact; but it is close enough to aid understanding of the meteorological developments.
Arranged as they are on successive pages, the surface weather maps serve an additional objective: they permit one to compare the migration arrows of 1-2 October directly with those of 2-3 October and the migra- tion arrows of 3-4 October directly with those of 4-5 October. By bend- ing the intervening two pages double, one can even make direct compari- sons between the meteorologically similar opening and closing nights of the study.
The series of surface charts begins at 0130 EST on 2 October (Figure 10) with a broad mass of continental polar air pouring down the middle of the continent. Twenty-four hours later (Figure 11) this cold air mass has broadened and advanced sufficiently to envelope all the United States east of the Rockies, except peninsular Florida and southern Texas. Another 24 hours afterward (Figure 12), most of the front has passed well to sea, and the only segment left on land is nearing the tip of Florida. Meanwhile a new incursion of continental polar air has become evident in the wake of the first and penetrated as far south as the Texas Panhandle. In the final chart, that of 4-5 October (Figure 13), the first front has disap-

19(k6t• ] LOW•:R'z ^•D N•:WM^•, Continentwide Bird Migration 567
peared from view entirely. The second front, remaining anchored in the Texas Panhandle and stationary on its western side, has bulged eastward and southward on its other side.
Fronts mark two sorts of division: (1) between different patterns of air circulation; (2) between higher and lower temperatures. Figures 6 to 9 and the accompanying commentary have already suggested relations between the amount and direction of migration and the wind. These re- lations are reflected in Figures 10-13, where the arrows indicating the heavier flights are seen to be most numerous on the right side of Highs (indicated by large bold H's), that is, on the side where the clockwise circulation of air around centers of high pressure provides assisting winds. Sometimes, as on the night of 1-2 October (Figure 10), the area of heavy migration is far from the High. At other times, as on 3-4 October in Virginia and North Carolina (Figure 12), arrows signifying "avalanche" flights crowd far enough leftward to overrun and nearly obliterate. the marked position of the High. Sometimes, at least, the appearance of dark migration arrows on the "wrong" side of a High reflects nothing more than a time differential between the mapped elements. An example is the black arrow for Blacksburg, Virginia, on the night of 3-4 October. The observations there were made between 2100 and 2200 hours. As a
glance back at the Beaufort symbols in Figure 5 will confirm, Blacksburg during those hours was probably still in the southward circulation on the east side of a high pressure center that later moved to its position in Figure 12, which shows conditions at 0130 hours EST on 4 October.
Temperature could not be indicated on these surface maps, except as vaguely reflected by the position of freeze lines and fronts. If sheer cold- ness provides an impetus to migration, the impetus is not obvious enough to reveal itself on the present charts. Only on 4-5 October does the amount of migration behind the freeze line appear to be appreciably better than the amount of migration ahead of it, and then waterfowl may account for the difference. A pertinent contrast is offered by the nights of 1-2 October and 4-5 October, when the fronts occupied nearly identical positions. On the earlier night, surface temperatures in the area bounded by the front averaged some seven degrees warmer than on the later night, yet the migration behind the front was far heavier on 1-2 October.
Comparisons of this sort are crude and indecisive. Keener insights would be provided by superimposing the four-night migration plots on isothermal maps showing in detail not only temperature readings but also 24-hour changes in temperature. Though such a study is beyond the physical capacity of the present report, it is being contemplated as the subject of a sequel.

ol


572 LOWERY AND NEWMAN, Continentwide Bird Migration [ Auk Vol, 83
AUTUMN MmRAT•O•
Raynor (1956) advanced a stimulating new hypothesis. He held that bird migration is most efficiently accomplished in smooth-flowing, non- turbulent air and that the presence of such stable air at suitable levels is the major factor encouraging large night flights east of the Rockies in spring. In marshalling evidence, he relied upon temperature inversions or isothermal layers as indicators of air stability and upon daytime ob- servations of grounded migrants as indicators of migration. His analysis showed that the number of reported migratory movements in stable air was significantly greater than random expectation. He cautiously em- phasized, however, that effects in autumn may not be the same as effects in spring.
Allen (1957) commented that difficulties in interpreting migration data of the sort used weaken Raynor's case, and Lack (1960) suggested that Raynor's figures should be re-analyzed. Otherwise the Raynor hypothesis has attracted almost no published attention, favorable or unfavorable. The several investigations of weather and migration since 1957 have made no attempt to assay the role of air stability, and for good reason. Meteoro- logical observations from which stability can be determined are no longer regularly made after dark by the United States Weather Bureau.
Fortunately a fair number of such data for October 1952 have been preserved in the Daily Series Synoptic Weather Maps/Part II/Northern Hemisphere Sea Level and Upper Air Tabulations (U.S. Weather Bureau, 1953). We can therefore find out how well air stability correlated with the quantities of migration actually in the air as recorded by our observa- tion stations. In doing so, we have tried to adhere as closely as possible to Raynor's method of determining air stability, which is based on the existence of a temperature inversion or isothermal layer 3,000 feet or less above the terrain. The one unavoidable difference is that on each of the
four nights with which we are dealing upper air temperatures are available for only 30 weather stations east of the Rockies in contrast to an average of 44 for the nights of the Raynor study. Among the 30, the number with no discernible inversion nor isothermal layer was 5 for 1 October, 8 for 2 October, 10 for 3 October, and 9 for 4 October.
In Figure 14, representing 3-4 October, the large white circles within squares represent weather stations reporting temperature inversions or isothermal layers less than 3,00'0 feet above the ground, i.e., presumably with stable air at levels where birds are flying. The solid black circles denote weather stations without such inversions or isothermal layers, i.e., presumably with turbulent air at the critical elevations. The 10 weather stations east of the Rockies in unstable air are the highest number on any night of our study. Yet nearly all the eastern and midwestern states


574 LowERY Ai•D NEWiVI•AN, Continentwide Bird Migration [ Auk Vol, 83
lie mostly in nonturbulent air. One observes immediately from the map that over this vast area o.f stability great variation in the amount of migration occurs. Clearly if meteorological factors are responsible for this variation at all, they must be factors other than stability.
No weather station in unstable air lacks recorded migration at or near its location unless no lunar observations were made. Bismarck , North Dakota, and Miami, Florida, both with weather stations and both in presumptively unstable air, have traffic rates of the middle grade, but no arrow of higher than middle grade is closely associated with mapped in- stability. Averaging of the migration traffic rates of the observation stations in Figure 14 gives a mean of 66% of the study average for pre- sumptively stable air and 12% for presumptively unstable air.
So far the Raynor hypothesis seems to be sustained. However, when the analysis is extended to. include all four nights, the advantage is reversed. The means become 64% for unstable areas and 11% for stable areas.
In fact, 3-4 October is the only date on which stability enjoys the superior rating.
Furthermore, most o,f the noninversion stations in Figure 14 happen to be located at points where heavy migration was unusual during our study, regardless of inversion patterns--along the Atlantic littoral, near the Canadian boundary, and in the Far West. Even so, red migration arrows of the middle grade appear at two of the exact locations where an in- version was lacking, and on the night of 2-3 October top-grade migration in Georgia and near Lake Ontario was recorded in the vicinity of weather stations reporting no inversion nor isothermal layer.
The over-all results might suggest that the amount of fall migration tends. to be inversely correlated with air stability. Some rationale for such correlation might be found in the idea that when the air is turbulent fly- ing birds can better detect which way the wind is blowing and thereby reduce disadvantageous drift. We do not believe, however, that the evi- dence is sufficient to support the conclusion that unstable air is really a favored condition for migration in fall. In mathematical averaging, the relatively few cases of extremely heavy migration play a relatively large part in determining the mean. Consequently more data than we now have are needed to assay the role of air stability with confidence. Furthermore the mapping of areas of stability and instability on the basis of reports from only 30 weather stations is an inexact process.
MIGRATION AND PHYSIOGRAPHIC FEATURES
A nonmeteorological factor remains to be considered--the extent to which features of the terrain itself may influence the course and co,ncen- tration of bird migration. For illustrative purposes we have chosen the

Oct. ] LOWEi•Y AND NEWMAWr, Continentwide Bird Migration 5 7 5 1966 I
night of 2-3 October, when the amount of migration was greatest and when meteorological disturbances were least pronounced. Figure 15 super- imposes the migration arro•vs for that night on a background that shows major river systems and gives a general idea of topography by indicating increasing elevations with darkening tones of gray.
As is immedately evident from the map, the migration arrows show no tendency to follow the major tributaries of the Mississippi River toward a grand confluence of bird flight along the lower Mississippi. The slants of the arrows at some Mississippi River stations correspond closely with the local directional trend of the river. The many nonconformities, how- ever, so far outnumber the few conformities that they make the latter appear largely accidental. Also, there is no clear tendency for stations on the river to record more migration than stations well removed from the river. In spite of these considerations the possibility is not precluded that migrants of certain types, constituting a modest portion of the total, are following the rivers as flight paths. For telescopic investigation of the possibility, special field procedures are necessary. Frances C. James, one of our former graduate students, is currently completing an analysis based on data obtained with such procedures.
No clear-cut reaction of nocturnal migration to the mountains of the eastern United States asserts itself in Figure 15 or in a comparison of migration arrows of other nights with the topographic background o.f Figure 15. In the Far West, on the other hand, the extremely rugged terrain is associated with a pronounced lack of uniformity in migration ratings and directional trends. The ultimate in quantitative contrasts is provided by Denver and Colorado Springs o.n the night of 3-4 October, when the former reported top-grade flights and the latter recorded no migration at all. On the night of 4-5 October, the same two stations ob- tained diametrically opposite directional trends. Denver and Colorado Springs are little more than 60 miles apart.
On the whole, migration traffic rates in the Far West, in so far as re- vealed by this study, are markedly inferior to those in the eastern half of the continent. In fact, Denver is the only far-western station reporting migration of more than middle grade. The distribution of western stations is too sparse to permit confident generalizations, even to the extent of deciding definitely that less nocturnal migration takes place in the West than in the East. Yet it seems fair to say that almost none of the rules that might be derived from a study of eastern migration, as seen here, apply well in the Far West.
Special interest attaches to the reaction of night migrants to large bodies of water. The charts of migration and winds aloft (Figures 6-9) are con- venient for examination of the results in this regard. Particularly striking

o i

Oct. ] LoweRY ^•) N•wM^•, Continentwide Bird Migration 5 7 7 1966
is the exactitude with which the red arrow at Fort William, Ontario, on the night of 2-3 October parallels the general trend of the Lake Superior shoreline. A convenient assumption would be that the birds are flying around the Great Lakes; but the individual flight vectors do not conform very well with the slant of the lake's edge. Conversely, the red arrow for Hawk Cliff near Port Stanley, Ontario, on the night of 3-4 October shows migrants heading out across Lake Erie; but, as the indented base of the arrow warns, variation in directions was great (only 48% of the migration was recorded on tracks that definitely projected out over the water). Taken as a whole, the results suggest that some night migrants detour the Great Lakes while others fly across them.
Results are similar along the northern coast of the Gulf of Mexico. At Pensacola, Florida, where the stations were half a mile and one and a half miles inland from Pensacola Bay, 58% of the birds recorded during the study period were travelling in Gulfward directions (i.e., between ESE and WSW). At St. George Island, Florida, the percentage going in the same directions was 66; at Pilottown, Louisiana, 88; at Grand Isle, Louisiana, 75. Thus the Florida data differ from the Louisiana data by showing a lower proportion of migration headed seaward.
Particularly noteworthy in this respect are the observations at St. George Island. Though 66% of the recorded birds seemed to be initiating a flight across the Gulf, the true proportion of birds moving coastwise was probably much greater than 34%. Herbert L. Stoddard, Sr., has reported (in litt.): "Curiously there was a high migration in sharp focus [going to sea] and a much lower one out of focus in an easterly or north- easterly direction along the islands. In many cases it could not be told whether the creatures were insects, birds, or what, and not over one-third of these objects was tallied as known to be birds as we had more than our hands full with the high in-focus birds." His considered judgment, taking into account flight speed, is that most of the low objects. were warblers and other small birds. A more pronounced reaction to coastal guiding lines on the part of low-level migrants than on the part of high- level migrants is in accord with diurnal observations in the Netherlands (van Dobben, 1953).
One possible explanation why coastal stations in Louisiana failed to record coastwise flights of appreciable magnitude is that these stations were situated at the southern edge of a broad expanse of marshland. If "circum-Gulf" land bird migration occurs in the state, it probably skirts the inland edge of this marsh belt. Unless a bird's normal fall migration route lies across the Gulf, it is unlikely to reach the Louisiana Gulf coast at all.
The situation is entirely different in coastal Texas, where the average

5 7 8 LOWERY AND NEW/VrA/q, Continentwide Bird Migration [ Auk Vol. 83
migration directions parallel rather closely the trend of the shoreline. In peninsular Florida, where no coastal stations were operating, most of the migration arrows are nevertheless remarkably in line with the slant of the peninsula, regardless of the direction of the wind.
DISCUSSION
Our primary objective in this report has been to present reconstructions of nocturnal migration that are novel in geographic scope. By comparison, most previous studies of the active process of migration, even those em- ploying radar, have been localized or sectional in viewpoint. Therefore our charts and the attendant data provide an essentially new means of scrutinizing existing hypotheses regarding the migratory movements of birds at night. Indeed, they are relevant to so many aspects of the sub- ject that discussion of all points of bearing--or detailed consideration of any one--is impossible within the space limitations of this paper.
On the preceding pages, we have already compared some of our results with the findings and ideas of other investigators. In this section, we shall extend the process a bit further, without pretending to be definitive or to be able to pay proper tribute to the relevant researches of others. But before doing so we shall comment upon the relative reliability of the lunar data on which this study is based.
Moon-derived migration traffic rates and directional trends are highly objective; but the method of arriving at them, as in the case of all other measures of migration, involves assumptions. Among these are that few migrants passing through the observation space are too far away to be seen through a 20-power telescope and that the median altitude of flight does not vary a great deal on clear nights. Nisbet (1963) has taken issue with both assumptions and has proposed empirical correction factors as a partial remedy. His tests of the distances at which model birds remain visible were made in daylight, when atmospheric interference tends to be worse than at night and when the contrast between bird and background is much less sharp than in the case of a migrant silhouetted against the moon. So the question of how far away a bird passing before the moon can be seen has yet to be resolved with complete satisfaction.
As we have already said in connection with winds aloft, data on the mean and median elevations at which nocturnal migrants fly also remain inconclusive. Radar has indisputably shown cases of night-to-night varia- tion in flight levels, but we do not know of evidence that such variation commonly occurs on clear, moonlit nights of the sort required for moon- watching. In undisturbed weather, half a mile---the value used in our computations--still seems to be a reasonable approximation of the median elevation of nocturnal migration.
To a large extent, uncertainties regarding the distance at which birds

LOWERY ^m) NEw•vr^•, Contlnentwlde Bird Migration 579
can be seen and possible hour-to-hour changes in the average altitude of migratory flight are not critical as far as the present study is concerned. We are seeking not to ascertain the absolute numbers of migrants passing but only to estimate the relative numbers. Even if birds tend to fly higher in the middle of the night than during the early hours or the late hours, even if our computational formulae overestimate the distance at which a lunar silhouette is visible, the effects are largely compensated by our method of expressing the amount of migration traffic as a per- centage of average quantity for the same hours.
Tunmore (1956) expressed conviction that the method of grouping data used by Lowery (1951) for computing the directional trends of migration could lead to large errors. Agreeing with this opinion, Nisbet (1959) outlined a procedure for calculating flight directions individually that is sound in principle but too time-consuming for the treatment of large quantities of observations. We have tested the original method and the Nisbet method against computations made with the greatest possible mathematical rigor. Neither method was consistently superior to the other but in all cases the deviation was less than 5ø--below the amount
of inaccuracy to be expected in the raw data themselves. In this study, directions were analyzed by the original method of grouping with special modifications to take care of skewed distributions of birds within the hour.
The field work on which this study is based does not represent moon- watching in its highest state of refinement. In the first place, since we were enlisting help on a purely volunteer basis, we could not always secure coverage at the most strategic locations. Second, since we were operating a far-flung network by remote control, we seldom were able to train ob- servers directly or to test their efficiency. While the field procedure is simple enough to be quickly learned and while adjustments of focus com- pensate well for the most frequent type of visual defect, occasional indi- viduals are definitely substandard in their ability to detect small silhouettes against the moon. Th'erefore low migration ratings may occasionally be due to human factors rather than ornithological ones, particularly at stations manned by only one observer. Third, the optical equipment varied considerably. The most commonly used instruments were 19.5 X or 20 X spotting scopes, which were in service at 158 stations. However, tele- scopes of higher magnification, of lower magnification, and with different optical systems were also employed.
The degree of consistency in the mapped data is the best assurance that the field work, in spite of its potentialities for error, did yield meaningful results. The occasional nonconformities, on the other hand, are enigmatic. They may represent real local variations or they may be the product of misdating, differences in observer efficiency, or a lack of success on our

580 LOWERY AND NEWMAN, Continentwide Bird Migration [ Auk 1_ Vol. 83
part in decoding the translations of direction that take place in certain optical systems. Some local nonconformities, such as the heavy southward migration both at Washington, D.C., and adjacent Arlington, Virginia, on th'e night of 1 October, definitely cannot be explained as the result of computational or observational error.
Of note with regard to local variation is the necessity of doubling the value of each successive class limit in order to obtain a fairly equitable number of cases in each' class. As a result, the black arrows indicate from 8 to 898 times as much migration traffic as do the white arrows. This enormous range is due to two factors. First, the white-arrow class in- cludes everything from the lowest measurable amount of migration to 15 times that amount. Second, the black-arrow class is open-ended, without any upper limit. In all other arrow grades except solid black and solid white, the maximum included rating cannot be more than twice the mini- mum included rating.
Obviously, therefore, the "homogeneity" represented by large blocks of solid white and solid black arrows is homogeneity only in a limited special sense. It leaves room for a great deal of concealed component local varia- tion. Although impressive on a multiplicative basis, the range in the white-arrow class is not great in terms of absolute numbers of birds; it merely spans the difference between very poor and very, very poor migra- tion. Within the black-arrow class, on the other hand, the multiplicative differences are not as great, but the absolute variation can be on the order of tens of thousands of birds per mile of front per hour--more by far than would pass in two weeks of low-grade migration.
The average traffic rate for the study falls not in the middle of the dis- tribution but in the second highest class; 388 sets of observations have a below-average rating versus 141 sets with an above-average rating. The indication is that the amount of migration in a given section is more often low than high, that a relatively large amount of the migration past any one point takes place on relatively few nights. The situation calls to mind the idea of the "grand passage" discussed by Bellrose and Sieh' (1960) and the opinion cited by Lack (1962) that data on the numbers of mi- grants need in the course of analysis to be expressed on an exponential scale to counteract the otherwise overwhelming influence of the occasional very large movements.
A rating system that does not distinguish between a factor of 8 and a factor of 800 may seem hopelessly undiscriminating. One must bear in mind, however, that this coarseness of scale is due to the needs of picto- rial presentation, not to limitations inherent in the data th'emselves. The
analyst of lunar migration data has access to exact figures expressing the

Oct. • 1966 J
LOWERY AND NEWMAN, Continentwide Bird Migration
TABLE 1
•V•IGRATION TRAFFIC RATES IN RELATION TO COLD FRONTS
581
Average migration traffic percentage rating Zone
1-2 Oct. 2-3 Oct. 3-4 Oct. 4-5 Oct.
5- 79 (5) 115 (4) 12 (1) 35 (2) 4- - (0) 127 (6) 14 (2) 27 (2) 3- 111 (4) 165 (7) 14 (2) 0 (1) 2- 132 (7) 220 (11) 25 (4) 2 (1) 1- 147 (3) 299 (13) 25 (3) 7 (8)
1¾- 104 (7) 224 (3) 7 (11) 7 (11) 2+ 95 (7) 29 (2) 9 (12) 9 (20)
numerical relationship between any two sets of observations. This is an advantage that not all methods of studying migration aloft provide.
We have already demonstrated numerical analysis of the lunar data on which our maps are based in the test of the applicability of the Raynor hy- pothesis to autumn migration. As a further illustration we shall use the method to synopsize the distribution of active migrants with respect to cold fronts. For this purpose we have drawn a series of bands 150 miles wide behind and ahead of the portion of major fronts that lies on the rightward side of centers of high pressure. The 150-mile band directly ahead of the front is designated as Zone 1+; the band directly behind the front as Zone 1-. The other bands are numbered accordingly. The migra- tion percentages for the stations in each band have been averaged. Table 1 gives the mean percentage rating of the stations in each band for each of the four nights of the study, with the number of reporting stations shown in parentheses.
In spite of the small number of station reports in each zone, a remark- ably consistent progression in which the amount of migration traffic behind the front diminishes with the distance from the front is evident on
the first two nights. On both these nights, heavy traffic appears 0 to 150 miles ahead of the front but drops off in the 150- to 300-mile zone. On the meteorologically disturbed nigh't of 3-4 October a semblance of the decreasing progression behind the front persists although the data are few. On the even more chaotic night of 4-5 October, also with few data, the highest traffic rates are in Zones 4- and 5-, behind the freeze line. This is the only night on which' the migration traffic rating for the zone im- mediately back of the front did not comfortably exceed the rating for the zone immediately ahead of the front. On both 3-4 and 4-5 October, com- puted traffic 150 to 300 miles beyond the front is higher than the rating 0 to 150 miles beyond the front--a reversal of the situation on the pre- ceding two nights.

582 LOWERY AND NEWMAN, Continentwide Bird Migration [ Auk Vol. 83
We do not know of any previous findings with which the data just pre- sented can be closely compared. Many papers have dealt with the relation of the passage of fall cold fronts to the number of grounded migrants, and a radar study in Illinois (Hassler, Graber, and Bellrose, 1963) has inves- tigated at length the timing of large flights aloft with respect to frontal passage, but these reports largely concern events as seen from a single vantage point. Our decreasing progression behind the front seems at first glance to fit neatly with the conclusion of Hassler, Graber, and Bellrose that the amount of active fall migration typically undergoes a progressive night-to-night decrease following the wave brought by a cold front pas- sage. On reflection, however, a cause and effect relationship appears un- likely.
In one respect, our results differ markedly from the experience of Hassler, Graber, and Bellrose. The latter found heavy migration in ad- vance of a cold front on only two occasions out of 21, and on one of the occasions a prefrontal shift to northerly winds occurred. Our summations show above-average migration traffic in the zone ahead of the front on both 1-2 and 2-3 October, without any indication of a premature wind shift. Furthermore, since the front was moving rapidly and since its mapped position is for 0130 EST, after most of the watches had ended, a great deal of the maximal migration traffic shown in Zone 1- must actually have been observed before the advent of the front.
Examination of the data presented in the radar study reveals that only one of the 21 fronts recorded arrived between 1800 (before dark) and 0300 (well after the nightly drop-off of migration). The exceptional front passed at 2300 on the night of 22-23 October, the only night when pre- frontal initiation of a wave was observed without a prefrontal windshift to northerly. The possibility remains good that heavy migration activity in advance of an autumnal cold front is the rule rather than the exception, providing the front arrives between sunset and midnight. In a previous investigation in Illinois, using flight-call data instead of radar returns (Graber and Cochran, 1960), none of the fronts passed between 1700 and 0240 hours.
On the nights of 3-4 and 4-5 October, traffic rates average lower in Zone 1+ than in Zone 2+, that is, the relationship noted on the previous two nights is reversed. Migration ahead of the front may still be under influence of the previous front, which has passed out to sea. In other words, the ratings in Zones 2+ and 1+ may represent the end of a de- creasing progression in the wake of the previous front.
While the ratings for the two zones behind the freeze line on 4 5 Octo- ber, far back of the front, are the highest for that night, they represent

19•6t/i ] LOWERSt ^•D NEWM^•, Continentwide Bird Migration 583
only 27 and 35 per cent of the study average. The large image size of the silhouettes involved and the identification of some of them as ducks lends
credence to the idea that the Zone 4- and 5- migration on that night may have consisted largely of waterfowl moving out with the icing of ponds and lakes. We are reminded that, while North American migration viewed as a whole usually exhibits enough consistency to permit several general conclusions concerning it, not all component species or groups of species are likely to react to all circumstances in the same way. When special groups dominate the results in a particular section, special effects con- trary to the general rule are likely to emerge.
In our descriptive night-by-night review of the relation of our migration arrows to selected winds aloft, emphasis on the several exceptions may have obscured the general tendency of following winds to favor migration, of headwinds to inhibit or stop it altogether, and of side winds to deflect it. That the instances of inconsistency may in part represent interspecific variation in the beh'avior of the birds is a distinct possibility. On our maps only the over-all directional trend at a station can be shown, and sometimes the element that controls the illustrated result, that swings the balance in favor of southwesterly rather than southeasterly for instance, may be a modest proportion of the whole.
The general tendencies of which we have just spoken conform well with findings of some oth'er investigators and with previously reported findings of our own. However, the consensus of these other investigators seems to be that brisk winds from any quarter are unfavorable for heavy migration. Our charts, as well as our personal experience, indicate that top-grade traffic rates can be associated with tail winds that equal or exceed the probable air speeds of the birds. A factor to remember in this connection is that, with a given spacial migration density, any force that adds to the birds' ground speed will mechanically raise the traffic rate.
One would perhaps expect that the mapping of the migration in the air over so many stations on four consecutive nights might furnish a picture of the forward progress of a migration wave. But our charts provide no clear indication that migrations on any night are largely the resumption of migrations on the preceding night.
SUMMARY
A series of two-color and multi-symbol charts based on counts of birds passing before the moon show computed amounts and major directional trends of migration over the United States and southern Canada on four successive nights in October. The charts permit direct comparison of features of the migration with factors potentially affecting them--the speed and direction of winds aloft, the character of surface weather sys-
584 LOWERY AI•D NEW•VlAN• Continentwide Bird Migration [ Auk Vol. 83
tems, the disposition of temperature inversions and isothermal layers, and the physiography of the North American continent.
Migration traffic in the Far West on these four nights is found to be generally inferior in quantity to the flights occurring east of the Rockies under favorable meteorological circumstances. Differences in the quantity and average direction of migration from one far-western observation station to another are too inconsistent--and the stations tSemselves are
too sparse---to support any other generalization except possibly that ex- tremely mountainous terrain produces pronounced local variations.
In the Midwest and East, heavy night migrations often extend over vast areas, including several states, and display homogeneity with respect to quantitative rating. Similarly, areas with no detected migration are often far-reaching. Sharp contrasts in migration rating between stations close to one another do occur--and sometimes without clearly evident cause.
Migration directions at a given station usually scatter far more widely than migration directions in spring, being in a few instances almost ran- dom. Yet the main over-all trend is often approximately the same for all the stations over a wide area, particularly when the stations in that area are alike in their quantitative migration ratings.
No effect of physiography asserts itself except for indications that a sizable proportion of migrants may detour the Great Lakes and the Gulf of Mexico. In particular, the maps fail to support the idea that migration tends to follow river systems, though the possibility is not precluded that some kinds of migrants may do so.
The data for one night fit the hypothesis that stable air aloft, as indi- cated by the presence of temperature inversions or isothermal layers, may be a requisite of heavy autumnal migration. Data for the other three nights show inverse correlations.
On successive nights, in the case of the first of the two cold fronts of the period, the 5eaviest migration traffic was in the zone 0-150 miles back of the front with progressively diminishing mean traffic ratings in each of the four successive 150-mile zones behind the front. On these occasions, above-average migration occurred in the zone 0 to 150 miles ahead of the front. Though accompanied by a greater drop in temperature, the second front studied brought little migration and failed to duplicate the distribu- tional pattern of migrants aloft with respect to the frontal advance. The suggestion is that most birds physiologically ready to migrate moved out with the first front. Meterologically similar continental situations on the opening and closing nights of the study with contrasting migration results point to the danger of attempting to predict ornithological results from weather alone.

Oct. ] LOWERY AI•/D NEWMAN, Continentwide Bird Migration 585 1966
The charts show a variable reaction of migration traffic to the winds aloft selected for comparison. Heavy migration is most frequently associ- ated with following winds, and wind usually seems to affect the direction of migration, even causing reverse movements on occasion; but many exceptions appear. The contention th'at following winds must be gentle to permit large migrations is contradicted by the present results.
Low or falling temperature had no discernible separate influence on the migrations of the four nights except possibly with regard to a move- ment behind the freeze line in which waterfowl seem to have been promi- nently involved.
Below-average migration traffic was far more frequent than traffic that exceeded the average. The implication is that the greater part of migra- tion through' a given area takes place on relatively few nights. The charts furnish no clear indication of the night-to-night advance of migration waves.
ACKNOWLED,G1V[ENTS
Although the names of the nearly 1,400 bird students and astronomers who partici- pated in the joint effort that produced the observational data on which this paper is based are listed in one of our previous publications (Newman and Lowery, 1964), we want to express again our immense gratitude for their enormous cumulative effort. Of our many former students who have made special contributions to this research we wish to single out for special commendation Frances Crews James. The execution of the charts was for the most part performed by Joseph Melancon, working under our direction. To Samuel A. Grimes we are indebted for the special attention he gave to the many problems that arose in the course of making the engravings of the two-color maps. Finally, we gratefully acknowledge the research support of the National Science Foundation under its grants G-19386 and GB-97.
LITERAZURE CIrE•)
A•;LEN, W. H. 1957. Review of G. S. Raynor, "Meteorological variables and the northward movement of nocturnal land bird migrants." Bird-Banding, 28: 43.
B^co, A.M. 1960. A summary of the spring migration season [1960]. Audubon Field Notes, 14: 360-364.
BAG(I, A.M., W. W. H. G•JX•N, D. S. MILLER, J. T. NIC}rOLS, W. SMIr}r, AND F. P. WOLFAR•It. 1950. Barometric pressure-patterns and spring migration. Wilson Bull., 62: 5-19.
BAreD, J., AND I. C. T. Nisbet. 1960. Northward fall migration on the Atlantic coast and its relation to offshore drift. Auk, 77: 119-149.
BELLROSE, F. C., AND J. G. SIEI{. 1960. Massed waterfowl flights in the Mississippi flyway, 1956 and 1957. Wilson Bull., 72: 29-59.
GAUTIIRI•AUX, S. A., JR. 1965. Bird migration as simultaneously viewed by telescope and radar. Master's thesis, Louisiana State University (unpublished MS).
GRABER, R. R., AND W. W. COCHRAN. 1960. Evaluation of an aural record of noc- turnal migration. Wilson Bull., 72: 253-273.
GuI•I•, W. W. H., AND A.M. CROCKER. 1951. Analysis of unusual bird migration in North America during the storm of April 4-7, 1947. Auk, 61{: 139-163.

586 LOWERY ^•m NEw•^•r, Continentwlde Bird Migration [ Auk Vol. 83
H•ER, W. G. 1958. Detection of bird migration by centimetric radar--a cause of radar "angels." Proc. Roy. Soc. London, Ser. B, 149: 484-502.
H^SS•ER, S.S., R. R. GR^•ER, ̂•m F. C. BELLROSE. 1963. Fall migration and weather, a radar study. Wilson Bull., 75: 56-77.
L^½•:, D. 1960. The influence of weather on passefine migration. A review. Auk, 77: 171-209.
L^½•:, D. 1962. Migration across the southern North Sea studied by radar. Part 3. Movement in June and July. Ibis, 10•.' 74-85.
LowERY, G. I:I., JR. 1951. A quantitative study of the nocturnal migration of birds, Univ. Kansas Publs. Mus. Nat. Hist., 3.' 361-472.
LowErY, G. I:I., J•., ^•Tn R. J. NEw•^•r. 1955. Direct studies of nocturnal migra- tion. Pp. 238-263 in Recent studies in avian biology (A. Wolfson, ed.). Univ. Illinois Press, Urbana.
NEw•r^•, R. J., ^•r• D. A. L^•r½^STER. 1960. A summary of the 1959 fall migration with emphasis on navigational factors. Audubon Field Notes, 1•: 4-9.
NEWM^•I, R. J., ^•ID G. I:I. LOWERY, JR. 1964. Selected quantitative data on night migration in autumn. Special Publs. Mus. Zool. Louisiana State Univ., 3: 1-39.
N•s•Er, I. C.T. 1959. Calculation of flight directions of birds observed crossing the face of the moon. Wilson Bull., 71: 237-243.
N•s•Er, I. C.T. 1963. Measurements with radar of the height of nocturnal migration over Cape Cod, Massachusetts. Bird-Banding, •1•: 57-67.
R^¾•roR, G. S. 1956. Meteorological variables and the northward movement of nocturnal land bird migrants. Auk, 73: 153-175.
REUSE, W.A. 1946. Astronomy and ornithology. Popular Astronomy, 5•: 55-73. RE•rSE, W.A. 1950. Some notes on the astronomical method of studying bird migra-
tion. Ibid., 5g: 287-294. TIJi'•MORE, B. G. 1956. The visual observation of night migration. Bird Study,
•: 237-241.
U.S. WE^r•ER B•JRE•U. 1953. Daily series synoptic weather maps. Part II. North- ern hemisphere sea level and upper air tabulations. Gov't. Printing Office, Washington, D.C.
v^•r Do•E•r, W. H. 1953. Bird Migration in the Netherlands. Ibis, 95: 212-234.
Museum o[ Zoology, Louisiana State University, Baton Rouge, Louisi- ana.