improving websites' quality of service by shortening their browsing
TRANSCRIPT

Special Issue Article
(wileyonlinelibrary.com) DOI: 10.1002/qre.2030 Published online in Wiley Online Library
Improving Websites’ Quality of Service byShortening Their Browsing Expected PathLengthZohar Postelnicu, Tal Raviv and Irad Ben-Gal*†
This work proposes a method to improve the QoS provided to internet users by website servers. In particular, the goal is tominimize the expected number of browsing steps (clicks), also known as the expected path length, which are required toreach a website page by a community of users. We use Markov chain modeling to represent the transition probabilities fromone webpage to another, and the first passage from page to page that can be retrieved from web server logs. The proposedmethod deletes links among webpages to minimize the expected path length of the website. Three different methods forachieving this goal are examined: (i) a greedy deletion heuristic; (ii) an approximated branch and bound algorithm; and(iii) a cross-entropy metaheuristic. Numerical studies show that the proposed greedy heuristic results in the optimal solutionin more than 60% of the tested cases, while in almost 90% of the cases, the obtained solution is within 10% of the optimalsolution. Both the approximated branch and bound and the cross-entropy methods achieved optimality in more than 80% ofthe tested cases; however, this came with a much higher computational cost. Copyright © 2016 John Wiley & Sons, Ltd.
Keywords: browsing time; expected path length; websites quality of service; websites analytics; web analytics
1. Introduction and motivation
Searching information content in websites is an integral part of internet services nowadays and is accepted as a major QoScriterion.1,2 Users spend a great deal of time browsing within websites, searching for specific content items. A major qualitymeasure of website browsing is the website service time, namely, the time it takes the user to reach a desirable content item
once he or she reaches that website. While search engines, for example, Google, provide excellent mechanisms to find the contentthe user is looking for, in many cases, they target the homepage that is highly ranked by PageRank-like algorithms. In such cases,the internal search within the website requires additional browsing time, reflected by the browsing QoS while ignoring the externalsearch. Accordingly, one of the major QoS challenges faced by website designers is how to better organize their sites, such that thecontent can be found effectively within the site. Let us note that this is a different challenge than organizing and optimizing thewebsite such that its content is more visible and better oriented towards external search engines – a problem of importance by itself.
The challenge of saving man hours in online platforms is an appealing one to modern industrial engineers, just as much as thetraditional industrial engineers have been focused on work standards and processes effectiveness in the past.3,4 One measure of suchQoS effort is the average number of steps (clicks) the users have to follow in the site until they reach their destination. Clearly, awebsite that enables the users to reach their desired pages effectively and quickly is considered to be of a better quality5, providinga better user experience and is more likely to retain its users. This consideration causes many web designers to add more links amongthe website pages by erroneously thinking that a higher connectivity will reduce the website expected path length (EPL) and improveits QoS. In this paper, however, we show that such a policy is not necessarily effective and can result in an opposite situation.
To emphasize the importance of an effective website linking, let us refer to the Nielsen NetView Survey6 in Figure 1. The surveyshows the time spent on various internet sectors in the USA alone in 2010, measured in millions of hours/month. We focus onlyon the content-searching sectors that are candidates for the proposed method (i.e., Portals, Video/Movies, Search, Software Info,Entertainment and Classifieds that are marked in light gray), thus, sectors in which visitors should reach their desired content quicklyand directly without moving from one page to another. The figure shows that during 2010, internet users in the USA alone spent 819million hours a month online in these types of sites, both searching and consuming content items. Therefore, if one is able to saveeven 1% of this time1 (assuming only a small portion of the time is actually spend on finding content, rather than consuming it), itimplies a potential saving of more than 8.2million man-hours each month. Even if the search time is only 0.01% of the browsing time,
Faculty of Engineering, Department of Industrial Engineering, Tel-Aviv University, Tel Aviv-Yafo, Israel*Correspondence to: Irad Ben-Gal, Faculty of Engineering, Department of Industrial Engineering, Tel-Aviv University Israel.†E-mail: [email protected]
Copyright © 2016 John Wiley & Sons, Ltd. Qual. Reliab. Engng. Int. 2016,
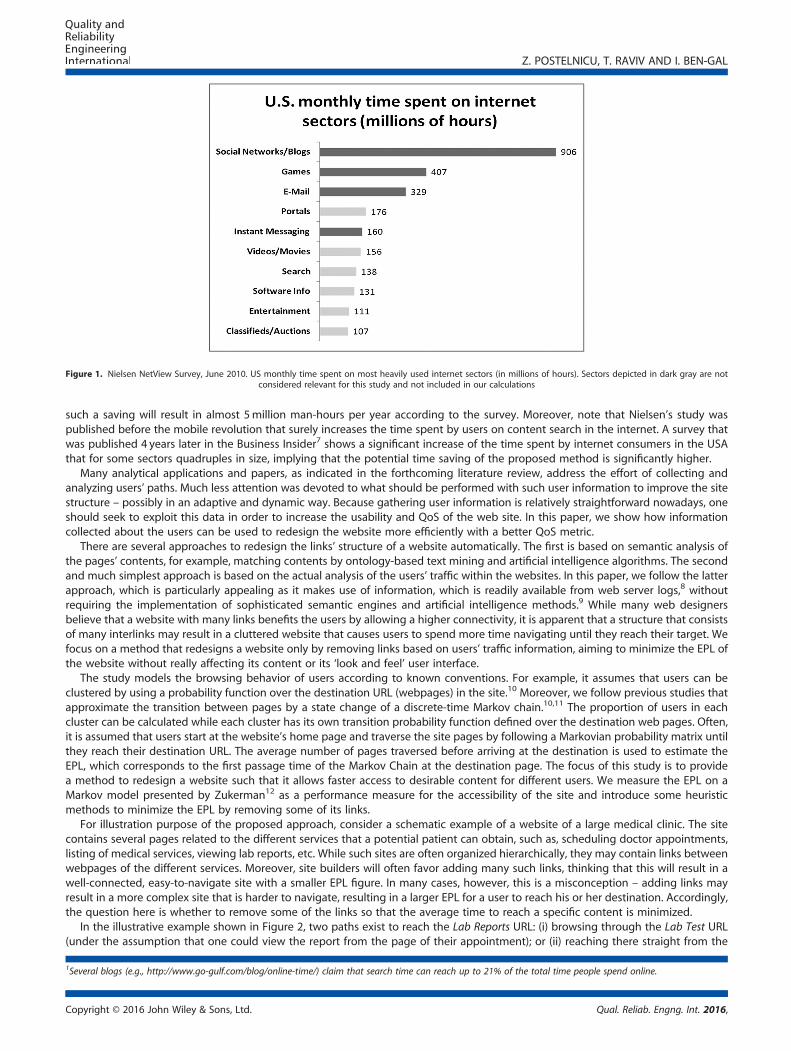
Figure 1. Nielsen NetView Survey, June 2010. US monthly time spent on most heavily used internet sectors (in millions of hours). Sectors depicted in dark gray are notconsidered relevant for this study and not included in our calculations
Z. POSTELNICU, T. RAVIV AND I. BEN-GAL
such a saving will result in almost 5million man-hours per year according to the survey. Moreover, note that Nielsen’s study waspublished before the mobile revolution that surely increases the time spent by users on content search in the internet. A survey thatwas published 4 years later in the Business Insider7 shows a significant increase of the time spent by internet consumers in the USAthat for some sectors quadruples in size, implying that the potential time saving of the proposed method is significantly higher.
Many analytical applications and papers, as indicated in the forthcoming literature review, address the effort of collecting andanalyzing users’ paths. Much less attention was devoted to what should be performed with such user information to improve the sitestructure – possibly in an adaptive and dynamic way. Because gathering user information is relatively straightforward nowadays, oneshould seek to exploit this data in order to increase the usability and QoS of the web site. In this paper, we show how informationcollected about the users can be used to redesign the website more efficiently with a better QoS metric.
There are several approaches to redesign the links’ structure of a website automatically. The first is based on semantic analysis ofthe pages’ contents, for example, matching contents by ontology-based text mining and artificial intelligence algorithms. The secondand much simplest approach is based on the actual analysis of the users’ traffic within the websites. In this paper, we follow the latterapproach, which is particularly appealing as it makes use of information, which is readily available from web server logs,8 withoutrequiring the implementation of sophisticated semantic engines and artificial intelligence methods.9 While many web designersbelieve that a website with many links benefits the users by allowing a higher connectivity, it is apparent that a structure that consistsof many interlinks may result in a cluttered website that causes users to spend more time navigating until they reach their target. Wefocus on a method that redesigns a website only by removing links based on users’ traffic information, aiming to minimize the EPL ofthe website without really affecting its content or its ‘look and feel’ user interface.
The study models the browsing behavior of users according to known conventions. For example, it assumes that users can beclustered by using a probability function over the destination URL (webpages) in the site.10 Moreover, we follow previous studies thatapproximate the transition between pages by a state change of a discrete-time Markov chain.10,11 The proportion of users in eachcluster can be calculated while each cluster has its own transition probability function defined over the destination web pages. Often,it is assumed that users start at the website’s home page and traverse the site pages by following a Markovian probability matrix untilthey reach their destination URL. The average number of pages traversed before arriving at the destination is used to estimate theEPL, which corresponds to the first passage time of the Markov Chain at the destination page. The focus of this study is to providea method to redesign a website such that it allows faster access to desirable content for different users. We measure the EPL on aMarkov model presented by Zukerman12 as a performance measure for the accessibility of the site and introduce some heuristicmethods to minimize the EPL by removing some of its links.
For illustration purpose of the proposed approach, consider a schematic example of a website of a large medical clinic. The sitecontains several pages related to the different services that a potential patient can obtain, such as, scheduling doctor appointments,listing of medical services, viewing lab reports, etc. While such sites are often organized hierarchically, they may contain links betweenwebpages of the different services. Moreover, site builders will often favor adding many such links, thinking that this will result in awell-connected, easy-to-navigate site with a smaller EPL figure. In many cases, however, this is a misconception – adding links mayresult in a more complex site that is harder to navigate, resulting in a larger EPL for a user to reach his or her destination. Accordingly,the question here is whether to remove some of the links so that the average time to reach a specific content is minimized.
In the illustrative example shown in Figure 2, two paths exist to reach the Lab Reports URL: (i) browsing through the Lab Test URL(under the assumption that one could view the report from the page of their appointment); or (ii) reaching there straight from the
1Several blogs (e.g., http://www.go-gulf.com/blog/online-time/) claim that search time can reach up to 21% of the total time people spend online.
Copyright © 2016 John Wiley & Sons, Ltd. Qual. Reliab. Engng. Int. 2016,

Figure 2. Schematic view of a transition matrix and link deletion in a medical website. Two transitions metrics are given as follows: (i) percentage showing the transitionprobability for people aiming to reach the Lab Reports URL (shown without parentheses); (ii) percentages (in parentheses) that show the transition probability for people
aiming to reach the Lab Test URL. Deleting the dashed line from Homepage to Lab Test results in shorter expected path length to Lab Reports
Z. POSTELNICU, T. RAVIV AND I. BEN-GAL
Homepage URL. Transition probabilities for the people aiming to reach the Lab Reports URL are shown without parentheses. Note thatin this example, if most of the users are aiming to reach the Lab Reports URL, it may be better to remove the link from the home pageto Lab Test URL, forcing all users to surf the site via the Lab Reports page. By using the server log data, it is possible to calculate the firstpassage time from the homepage to each target page. In the example, the first passage time for users aiming towards the Lab ReportsURL is 1.52 steps (clicks), while the first passage time for users aiming towards the Lab Test URL is 1.12 steps. By deleting the link fromthe homepage to the Lab Test URL, the former passage time is reduced to 1.0, while the latter passage time is increased to 2.5. Yet,because most of the users seek the Lab Test URL, the overall EPL is shortened. These opportunities to improve the site QoS exist inmore complex websites and are considered in the paper.
In this paper, we propose and analyze several algorithms for redesigning a website by deleting links in order to decrease the siteEPL. The first algorithm is a greedy deletion (GD) heuristic that deletes, at each iteration, the link having the maximum marginalcontribution to the EPL. The second algorithm is an approximated branch and bound (AB&B) heuristic. This heuristic employs abranch and bound search strategy over the entire solution space, namely, it approximates an EPL bound at each node of the searchtree. The third algorithm is based on the cross-entropy (CE) metaheuristic that was originally introduced by Rubinstein13. Thisevolutionary metaheuristic is based on a parameterized random search mechanism that generates random solutions. The parametersof the search mechanism are gradually updated by minimizing an entropy function, seeking to increase the likelihood of potentially‘better’ solutions to be considered in the next search iteration.
Results from the aforementioned heuristics show that both the GD and the CE heuristic perform well and relatively fast, while thebranch and bound method is clearly dominated by them. The CE heuristic, for example, achieved the optimal structure solution in87% of the sample set for websites with 24 pages at an average time of less than 1min (on a 2-cores 16GB computer). The GDheuristic reached the optimal solution in 64% of the same sample set, obtaining these solutions at an average time of less than 1 son the same machine. Moreover, most of the suboptimal solutions of the GD heuristic are found to be within a 10% range of theoptimal solution. Such a performance indicates that while the CE algorithm can be used for offline design of sites, the GD algorithmis fast enough to be implemented online, enabling a personalized browsing experience for each type of user depending on theirbrowsing statistics.
The rest of this paper is organized as follows: Section 2 presents some relevant literature papers. Section 3 introduces the minimumEPL (MEPL) problem, including a formal mathematical model. Section 4 presents the proposed solution methods for the MEPLproblem. In Section 5, the effectiveness of the proposed heuristics is benchmarked against the optimal solution that is obtained bya complete enumeration of the solution space for some small instances of the problem. Section 6 concludes the work and indicatessome future research directions.
2. Related work
More than a decade ago that Perkowitz and Etzioni14,15 described several challenges faced by website designers that seem to berelevant also today: (i) Different visitors may have dissimilar goals; (ii) The same visitor may seek different information at various times;(iii) Many sites outgrow their original design, accumulating links and pages in unlikely places; and (iv) The designers’ a prioriexpectations regarding the usage of the site may be violated. One of their proposed approaches to address these challenges wasto design an automatically adaptive website, that is, websites that automatically improve their organization and presentation bylearning from users browsing patterns. Perkowitz and Etzioni further noted that websites may either be adapted to the individual useror to a community of users as a whole, as proposed in this work that targets a cluster of users.
Some of the challenges mentioned in Perkowitz and Etzioni14,15 are addressed today in many commercial websites. For example,the Amazon.com site presents personalized commerce contents to users according to their past purchases, aiming to improve theuser experience, shorten the transaction time, and increase convergence. iGoogle provides a customizable platform that allows eachuser to define its preferences on the structure and the presented content. This allows each user to design a personal homepage
Copyright © 2016 John Wiley & Sons, Ltd. Qual. Reliab. Engng. Int. 2016,

Z. POSTELNICU, T. RAVIV AND I. BEN-GAL
browser with content accessories related to his or her own interests. For example, an academic researcher may seek a quick access tothe ‘Google Scholar’ search engine, while a gamer may look for constant RSS feeds related to new game releases to be shown in hishomepage.
A preliminary condition for websites’ personalization is the ability to learn the user preferences. And indeed, various data-mining and machine learning models were suggested in recent years to learn such preferences and use these automatically tobuild adaptive sites, among other applications. Web-mining nowadays is used extensively to profile users who access particularURLs based on demographic/behavioral/personal information that is available from various resources, including cookies,smartphones, location sensors, and various apps. Classification based on access logs is used to uncover segmentation informationsuch as the IP addresses of most of the users who often access a specific URL, as well as their profiling. For example, a commonassociation rule based on the aforementioned information can be of the following format ‘50% of the users who placed an onlineorder for product X of company Y belong to a segment of 20–25 years olds living in a large city on the west coast of the USA’.Classification methods are now used to map users into predefined classes (for example by collaborative filtering), and a differentwebsite structure can then be presented to each class. For example, if a user is classified as a fan of certain games or movie types,he or she will be automatically directed to relevant sites. Segmentation and web-mining enable to support dynamic modificationsof websites for new or revisited clients that follow several of the approaches proposed by Etzioni14 and others. Roughly indicating,many of the aforementioned models can be categorized into two classes: (i) Web-mining models, such as association rules,sequential pattern discovery, clustering, and classification (e.g., 16,17); and (ii) Predictive Statistical models, such as linear models,neural networks, Bayesian networks, and Markov chains (e.g., 11,18), that are used in this work.
One example for a machine-learning application that tracks browsing behavior and applies it to websites’ link-design wasproposed in Mobasher et al.16 The authors used association rules, collaborative filtering, and web-mining techniques to findwebpages that are connected implicitly by users’ browsing behavior. They found significant correlated accesses to various URLsand indicated that such correlations can be used to generate new links between the correlated websites. For example, if 60%of the users who accessed the page www.amazon.com/Under-Dome-Novel-Stephen-King/dp/1439149038/ later also accessedthe page www.amazon.com/Hunger-Games-Suzanne-Collins/dp/0439023521/, then the former page may contain a referral linkto the latter. The authors argue that the advantage of using web-mining techniques is that the search space can be moreeffectively pruned, partly because of the fact that most sites are organized in a hierarchical fashion. For example, if the URL/company/products has few hits (entries), it is safe to assume that the lower-level page /company/products/products1.html will haveeven fewer hits and, therefore, could be pruned. Thus, revealing the association rules of the site may help to organize it moreefficiently, as we aim to do in this work by proposing a different application.
Other examples for applications based on personalized browsing behavior can be indicated. Jiang and Tuzhilin19 presented asegmentation approach that is not based on computed statistics, but rather on directly combining transactional data, such asweb browsing and purchasing activities of several users. Baraglia and Silvestri,20 Saad,21 and Jalali et al.22 discussed a WebPersonalization (WP) application based on web usage mining that customizes the content of a web site with respect to the users’needs. They tracked the users’ browsing behavior and proposed a mechanism to predict the next content of interest for a user.Saad and Kruschwitz23 further illustrated the use of web usage mining for an adaptive website. Goyal et al.24 proposed an onlinehotlink assignment algorithm for designing adaptive websites, with a desired goal to reach certain contents on the site within aminimal number of clicks. The authors looked at the website as a directed graph and allowed an addition of up to k hotlinks oneach page. Such an approach is now adopted by paid-content companies such as Taboola and Outbrain. Chen and Ryu25
suggested a model in which the website designer adds a certain amount of links to the structure of a website to provide a betternavigation. They set a threshold value for the number of paths a user will agree to pass through before churning from the site. Theauthors assumed that by adding links, up to a threshold number, the user will be directed to the desired content faster. Similarly,Jadhav and Bhale26 proposed a mathematical programming model for adding or enhancing website links to improve the websitestructure while minimizing the required website’s changes (assuming that users’ backtracking is undesired). In this paper, wefollow an opposite approach, and instead of adding links, we consider the deletion of up to k links among webpages. Theproposed approach is advantageous because it is simple, does not require a change in the website design, and often reducesthe browsing EPL.
Popular models that are used to estimate the EPL of a website, and also used in this paper, are Markov models that are generatedby historical browsing data. These models can be used to predict the next link ‘click’ given an observed browsing path, whileestimating the first passage time from one page to another. For example, Bestavros27 used a Markov model to calculate theprobability that a user will seek a particular document based on his browsing behavior. Zukerman et al.28 compared the predictiveperformance of different Markov models when forecasting a user’s next request. Let us note that all these methods can be used tomodify the hierarchy or the layout of a website once the next URL is predicted with high enough probability. We follow these basicideas in the proposed modeling.
Finally, let us note that in the past few years, the development of well-structured websites has become an even bigger challenge,probably because of the popularity of e-commerce sites, in which a poor link structure and content visibility often result in a directloss of revenue. Multiple researchers suggested new heuristics to solve the Website Structure Optimization (WSO) problem, as it iscalled now when addressing not only the linking but also structure and content optimization. For example, Yin and Guo29 suggestedan enhanced Tabu Search procedure to solve the WSO problem. They showed how website owners can obtain a feasible high-qualitysolution, although often not optimal. Paul and Kumar,30 Jadhav and Bhale26 both suggested procedures for adding or repairingexisting website links to improve user navigation through a website. For further reading on the extended WSO problem, the readeris referred to Singh and Kaur31 that provide a survey on the topic.
Copyright © 2016 John Wiley & Sons, Ltd. Qual. Reliab. Engng. Int. 2016,

Z. POSTELNICU, T. RAVIV AND I. BEN-GAL
3. Problem formulation and notation
The link structure of a website is modeled by a sparse directed graph. Each node is related to a page, and each arc is related to alink between an ordered pair of pages. The transition probability between pages is assumed positive if and only if the pages aredirectly linked. The transition probability information is readily available from the website’s log data. The designer of the websitemay remove links between pages. By doing so, he or she sets the transition probability between the corresponding pages to zero,while proportionally increasing the transition probability to other pages (normalizing the rest by the sum of probabilities). Forexample, the link structure of a website with four pages may resemble the one in Figure 3, having the corresponding transitionprobabilities:
P ¼0 0 0:25 0:750 0 0:5 0:5
0:65 0:05 0 0:30:1 0:2 0:7 0
0B@
1CA:
In this example, a user moves from page 1 (the homepage) to page 3 with a probability of 0.25 and to page 4 with a probability of0.75. There is no direct route from the homepage to page 2. Therefore, a user who wishes to reach page 2 from the homepage will gofirst to either page 3 or 4, and from there, his or her destination can be reached. The designer might aim at decreasing the EPL of theusers in a given website by solving the MEPL problem. The MEPL problem is defined as follows: given an integer number D, delete upto D links in the web site so as to minimize the EPL.
Following the example, let us present the notation that will be used in the proposed mathematical model:
Parameters:n
Figure 3. Example of a
Copyright © 2016 Jo
Number of pages in the site. Page 1 represents the homepage
L Total number of links in the site (initially) D Number of links for deletion pijt The transition probability from page i=1,…, n to page j= 1,…, n of users with final destination t. We denote then× n stochastic matrix as P and refer to it as the Transition Probability Matrix. There are no self-loops, so piit= 0.
wt The proportion of visitors with destination page t=1,…, n. We denote the vector of proportions by w and refer to itas the content proportion vector.
a
Decision variables:xij A bin
existinm
that t
website
hn Wile
ry variable that represents whether the link between page i, and j is kept. These variables are defined only forg links that are traversed by some users, that is, ∑
tpijt > 0.
Auxiliary variables:μijt The
ah
ean first passage time at page j, for users starting at page i with final destination t.
vit Norm lizing variable representing the change of transition probabilities following a deletion of links at page i, suche total transition probability out of page i remains one.
with four pages and the linking structure, represented by a Markov chain
y & Sons, Ltd. Qual. Reliab. Engng. Int. 2016,

Z. POSTELNICU, T. RAVIV AND I. BEN-GAL
Assumptions:• The model focuses on deleting a webpage’s internal links in order to reduce the EPL. Although the objective could be achievedby adding new links, such a solution requires a different analysis approach and left for future research.
• The model does not address additional issues related to webpage optimization, such as the webpage rank scoring, adaptabilityto search engines, ease-of-use, and other user experience objectives.
• The model follows previous studies that approximate the transition between pages by a state change of a discrete-time Markovchain.10,11 In particular, we use a discrete-time Markov chain, which focuses on analyzing the expected travel steps beforereaching the target page. We further assume that the average number of traveling steps is proportional to the average searchtime.
• Upon link deletion, the new transition probabilities of the new network are normalized such that the probability associated withthe deleted link is proportionally redistributed to the other pages.
• The browsing behavior of the users is stationary, and the transition between pages can be approximated by a state change of adiscrete-time Markov chain.10,11
Following the above, we are mostly interested in μ1,j,j, the first passage time at page j of users starting at the homepage with page jas their final destination. μijt is evaluated by solving the following linear system of equations:
μijt ¼ 1þ ∑n
k¼1piktμkjt ∀i; j≠i
μi;i;t ¼ 0 ∀i(1)
The MEPL problem is then defined mathematically as follows:
Min ∑jμ1jjwj
s:t:(2)
μijt ¼ 1þ ∑k:pik>0vitxijpiktμkjt ∀ i; j : ≠i; t (3)
∑i∑j:∑tpijt>0xij ≥L� D (4)
∑k:pikt>0vitxikpikt ¼ 1 ∀i ; t (5)
xij∈ 0; 1f g ∀i; j : ∑tpijt > 0 (6)
μijt ≥ 0 ∀i; j; t (7)
vit ≥ 0 ∀i; t (8)
The objective function (2) minimizes the EPL. Constraint (3) calculates the first passage time based on the modified transitionprobabilities following the deletion of links. Constraint (4) limits the number of allowed deletions. Constraint (5) normalizes thetransition probabilities following a deletion. Constraints (6), (7), and (8) are integrality and non-negativity constraints.
The previous non-linear and non-convex mathematical model cannot be solved by using standard branch and bound techniquesthat are supported by commercial solvers. Accordingly, three algorithms are proposed and evaluated in the next sections.
4. Proposed algorithms
Three different heuristics are proposed based on the considered MEPL problem. The algorithms are as follows: (i) a GD heuristic;(ii) an AB&B heuristic; and (iii) a CE based heuristic. In this section, we present these algorithms, while in the next section weshow the results of a numerical experiment that compares the performances of these algorithms against the optimal solutionthat was obtained by an exhaustive search (ES). The next subsections outline the three heuristics, providing both a pseudo codeand a running example on each one of them.
4.1. Greedy deletion heuristic
This algorithm greedily deletes arcs one at a time. In each iteration, the link whose removal contributes the most to reducingthe EPL is removed. The process is terminated once no link deletion contributes positive value to the objective function, or afterD, links were removed. In order to calculate the effect of a link removal, its probability is temporarily assigned to other links ofthe same page, as described in Section 3. The algorithm is formally described in Pseudo Code Listing 1.
Copyright © 2016 John Wiley & Sons, Ltd. Qual. Reliab. Engng. Int. 2016,

Z. POSTELNICU, T. RAVIV AND I. BEN-GAL
C
Greedy Deletion Algorithm for MEPLInput: Transition matrix P, maximal number of links to delete DCalculate transition matrix EPL and set TempEPL= EPLSet MinEPL= TempEPLWhile D ≥ 0 do
Set TempP = PBreakFlag = TrueFor i= 1,…, n
For j= 1,…, nIf P[i, j] =0 then
TempP[i,j] = 0For z= 1,…, n
TempP [i,z] = TempP[i, z]/(1� P[i, j])Calculate EPL for TempPIf EPL<MinEPL then
.disc_i = i, disc_j = jBreakFlag = False
If BreakFlag then Break (while loop)D = D – 1For z= 1,…, n
P [disc_i,z] = P[disc_i , z]/(1� P[disc_i , disc_j])P[disc_i , disc_j] = 0
Return P
Pseudo code listing 1.
Illustrative Example
opyright © 2016 John W
As an illustrative example, consider the following 5 × 5 matrix and allow for the deletion of up to three links.Accordingly, the following notations and parameters are used:
P ¼0 0:3297 0:1087 0:2286 0:3331
0:1729 0 0:2386 0:1776 0:41090:2529 0:1968 0 0:3280 0:22240:2937 0:1641 0:3078 0 0:23430:0485 0:2670 0:4750 0:2096 0
0BBB@
1CCCA w ¼
0:0740:0510:7
0:0570:116
0BB@
1CCA
Thus, P is the transition matrix, and w is the content proportion vector, and D= 3.The original EPL matrix is calculated. The calculation is obtained by solving the linear equation of the first passage time between
each pair of pages, as seen in Equation (1). This results in the matrix μ. The EPL can now be calculated by multiplying the matrix μ bythe content proportion vector w, resulting in 3.4858 steps for this example.
The next step is to delete the first available link, which is link (1,2) with an initial probability p12 = 0.3297. While p12 is set to zero, allthe other probabilities in the row are normalized by their cumulative sum. That is,
p1;j←p1j
1� p12f or j ¼ 3; 4; 5:
Thus, a user positioned at page 1 can no longer move to page 2 directly and has to move to pages 3, 4, or 5 (assuming page 1 is nothis or her goal), before reaching page 2. Recalculating the EPL based on the new transition matrix results in a new EPL:
P ¼0 0 0:1621 0:3410 0:4969
0:1729 0 0:2386 0:1776 0:41090:2529 0:1968 0 0:3280 0:22240:2937 0:1641 0:3078 0 0:23430:0485 0:2670 0:4750 0:2096 0
0BBB@
1CCCA EPL ¼ 3:2534:
As seen, a lower EPL is obtained by deleting the link (1,2). Applying the same method, we now return to the initial matrix anddelete the next available link (1,3). This deletion results in the following transition matrix and EPL:
iley & Sons, Ltd. Qual. Reliab. Engng. Int. 2016,

Z. POSTELNICU, T. RAVIV AND I. BEN-GAL
P ¼0 0:3699 0 0:2565 0:3737
0:1729 0 0:2386 0:1776 0:41090:2529 0:1968 0 0:3280 0:22240:2937 0:1641 0:3078 0 0:23430:0485 0:2670 0:4750 0:2096 0
0BBB@
1CCCA EPL ¼ 3:7873:
Note that deleting link (1,3) leads to a larger EPL than the one obtained by deleting link (1,2) and even larger than the initial EPL. Inthe same manner, the proposed procedure evaluates the deletion of all available links. It turns out that the maximal reduction in theEPL is obtained by deleting link (5,2). Having this link removed, one obtains the following transition matrix and its correspondinglowest EPL for the first deletion:
P ¼0 0:3297 0:1087 0:2286 0:3331
0:1729 0 0:2386 0:1776 0:41090:2529 0:1968 0 0:3280 0:22240:2937 0:1641 0:3078 0 0:23430:0662 0 0:6479 0:2859 0
0BBB@
1CCCA EPL ¼ 3:1957:
The procedure now continues for up to D= 3 iterations (the number of permitted deletions) and eventually reaches the bestsolution by deleting links – (5,2), (5,4), and (4,1). The following transition matrix and its corresponding EPL are presented as follows:
P ¼0 0:3297 0:1087 0:2286 0:3331
0:1729 0 0:2386 0:1776 0:41090:2529 0:1968 0 0:3280 0:2224
0 0:2324 0:4359 0 0:33180:0926 0 0:9074 0 0
0BBB@
1CCCA EPL ¼ 2:7412:
Thus, in this example, one can obtain a reduction in the EPL of more than 20%. Note that the complexity of this procedure (and thefollowing two procedures) is a constant function of the inventions of the transition matrix. Thus, the complexity of the greedyheuristic is O(L �MI(L) �D), where MI(L) represents the complexity of the inverse operation of a sparse matrix with L non-zeros. Forexample, if one uses the Gauss–Jordan elimination MI(L) =O(L3), the resulting complexity of the greedy heuristics is O(L4D).
4.2. Approximated branch and bound heuristic
In this section, we present a heuristic that is based on an AB&B framework. The proposed method is similar to the conventional Branchand Bound strategy, except that the lower bounds are conjectured based on heuristic considerations and are not necessarily valid.Such an approximated lower bound might lead to the erroneous pruning of branches in the search tree that might contain theoptimal solution. Nevertheless, as demonstrated later, if the lower bounds are ‘guessed’ plausibly, this approach may lead to asuccessful solution method.
Let us present some notations that are used for a more formal description of the heuristic.
LINK
Copyrigh
– the list of links in the website ordered in some arbitrarymanner. The individual links are denoted as LINK(1), LINK(2),…, LINK(L)
TREE – list of ‘active’ (unprocessed) nodes in the search tree.Each node consists of a tuple (DEL, CUR, EPL), where
DEL
– Set of links that must be deleted in any offspring of this node CUR – the index (in LINK) of the previously inspected link (0 if no link was inspected yet). EPL – The expected path length of the website after removing the links in DEL.Our approximated bound is based on the assumption that the reduction rate of the EPL, because of the links that where deletedduring the branch and bound process, also represents the expected rate of EPL reduction for the remaining links to be deleted. Wedenote the initial EPL by EPL0, and thus, the total improvement up to a given branch and bound node is given by EPL0�NODE. EPL,which represents a reduction rate of
EPL0 � NODE:EPLð ÞNODE:D; E; Lj j
per link, where |NODE.DEL| is the number of deleted links at that branch and bound node. Assuming the same average reduction rateremains effective for all the D links to be removed next, we obtain the following approximated lower bound, where
ALB ¼ EPL0 � D� EPL0 � NODE:EPLð ÞNODE:D; E; Lj j :
Because the branching criteria favors the most ‘promising’ links for first removal, the above lower bound is likely to be valid. For theroot node, where |NODE.DEL| = 0, we set ALB=0, which is surely a valid (yet a very loose) lower bound.
t © 2016 John Wiley & Sons, Ltd. Qual. Reliab. Engng. Int. 2016,

Z. POSTELNICU, T. RAVIV AND I. BEN-GAL
The AB&B algorithm is presented in Pseudo Code Listing 2.
Approximated Branch and Bound Algorithm for MEPL
Input: Transition matrix P, maximal number of links to delete DCreate the list LINK (based on the non-zero elements in P).Calculate EPL for the initial website design and store it in EPL0.Insert into TREE the node (∅, 0, EPL0)Set INCUMBENT= EPL0While TREE not empty
Remove the NODE with the smallest NODE.EPL from array TREECalculate the greedy solution where all the links in NODE.DEL are forced to be deleted and only links with an index greaterthan NODE. CUR are considered for further deletion.Store the value of the best solution in UB
IF UB< INCUMBENT set INCUMBENT=UBSet approximated lower bound
ALB ¼ EPL0 � D� EPL0 � NODE:EPLð ÞNODE:D; E; Lj j ; NODE:DEL≠∅
0 ;NODE:DEL ¼ ∅
(
IF (ALB< INCUMBENT) and (|NODE.DEL|<D)
For i = NODE. CUR+ 1 to |LINK|Calculate EPL for NODE.DEL ∪ {LINK(i)} and store in XInsert into TREE a node (NODE.DEL ∪ {LINK(i)}, i, X)
Return INCUMBENT solution
Pseudo code listing 2.
Illustrative Example
Figure 4. Approximated bra
Copyright © 2016 John W
Consider a website with a transition matrix P and five existing links with a maximum of two disconnectionspermitted. Assume that the original design’s EPL is 2, that is, EPL0 = 2. Initially, the node (∅, 0, 2) is inserted intothe array TREE, and we set INCUMBENT=2.
The node with the corresponding smallest EPL is removed from the array TREE. Because initially there is only one node, we removeit, and the greedy solution, as described in Section 4.1 with no prior-deletions, is calculated (because NODE. DEL =∅). Let us assumethat the greedy solution for this node is 1.5 steps. This value is set as the current UB, and because it is better than the incumbentsolution, it is also set as the INCUMBENT.
Because so far no links were actually deleted, we set ALB=0.Because (ALB< INCUMBENT) and (|NODE.DEL|<D), we add a node into the TREE with all possible deletions of one link with an
index greater than CUR. For each such node, we calculate the EPL assuming only the links in NODE.DEL are deleted.We now return to the beginning of the algorithm and remove the next node with the smallest EPL from array TREE for processing.
As can be seen in Figure 4 later, this is node ({3}, 3, 1.7). We calculate the greedy solution of this node and find its value is 1.5. This isthe UB and as it is equal to the incumbent solution, which does not change. We calculate ALB=1.4. Because the ALB is lower than theincumbent solution, we continue with this branch.
nch and bound example for a site with five links
iley & Sons, Ltd. Qual. Reliab. Engng. Int. 2016,

Z. POSTELNICU, T. RAVIV AND I. BEN-GAL
Bounding is performed when the ALB is greater than the incumbent solution. For example, node ({1}, 1, 1.85)’s greedy solutionresulted in 1.72 steps. This is the UB for this solution. This is not an improvement of the incumbent solution, which was calculatedas 1.5. The ALB is then calculated as 1.7. Because the ALB is greater than the incumbent solution, the branch is bound.
We continue for each un-reviewed node and stop once all the tree nodes have been processed. Figure 4 shows the order in which thenodes enter the algorithm. Eventually, we bounded three nodes for having an ALB greater than the incumbent solution (example omitted).
As can be seen, node ({3, 5}, 5, 1.5) reached the EPL obtained by the initial matrix. However, node ({4, 5}, 5, 1.48) reached a lower EPL,and because no other deletions are allowed (two deletions already exist in NODE.DEL), this is the final obtained solution.
4.3. The cross-entropy heuristic
The CE method12 generates a random data sample of solutions, finds the best solutions, refines the data generating mechanismaccordingly, and produces a ‘better’ sample in the next iteration. The process continues until eventually converging to a singlesolution. A solution in our problem definition is a set of D deleted links.
The notations used for this heuristic, in addition to the original notations given earlier, are as follows:
N
Figure
Copy
– the number of solutions generated in each generation
T – the top percentile of observations that are used as an Elite set. For example, T=10% implies the algorithm only uses the top10% best solutions to refine the random mechanism for the next iteration.
Pi – defines the probability vector in step i. This vector represents our chance of choosing a certain link to be disconnected. P0 isthe initial probability vector.
S – The probability breaking point. When D links have probability equal or greater than S in the Pi vector, the process stops, andthis vector is returned as the final solution.
α – Represents the smoothing coefficient used to create the next generation probability vector.At the beginning of the process, P0 is defined as a uniformly distributed vector of length L. Because eventually this probabilityvector should equal the number of disconnections allowed (and not 1), each link is given the probability of D
L .Using the probability vector, N solutions are randomly generated, where each solution represents a website with D links
disconnected. Out of those N solutions, only the top T solutions are observed. A new probability vector is now defined, which equalsthe percentage of times each link got disconnected in the top solutions (we use the following notation to represent this new vector: APi).
Because certain links may not have been disconnected in the top T solutions, their new probability will be set to zero, meaning thatthey will not be chosen in the next iteration (or ever). To prevent this from happening, the coefficient α is used to smooth the newprobability vector with the former generation probability vector:
Pi ¼ APi� αþ Pi�1� 1� αð Þ :The new vector Pi will be our probability vector for the next iteration. The process finishes when the probability vector consists of D
links with probability equal or greater than S.The entire process is outlined in Figure 5.
5. Outline of the solution evaluation process for the cross-entropy heuristic
right © 2016 John Wiley & Sons, Ltd. Qual. Reliab. Engng. Int. 2016,
Z. POSTELNICU, T. RAVIV AND I. BEN-GAL
Illustrative Example
Copyright © 2016 John W
Let us look at a simple example using a site, which consists of L= 10 links, N=100, T=10%, D=3, α = 0.6, andS= 0.96.
The initial P0 is a uniformly divided vector of 10 elements with a value of 0.3 for each one. The algorithm uses P0 to generate Nsolutions, each with D links disconnected. It then observes the top 10% (T=0.1) of the solutions and finds the number of times eachlink appears. Using this observation it calculates the APi and, eventually, the Pi + 1:
Pi ¼
0:30:30:30:30:30:30:30:30:30:3
26666666666664
37777777777775→ # ¼
3653822100
26666666666664
37777777777775→ APi ¼
0:30:60:50:30:80:20:20:100
26666666666664
37777777777775→Piþ1 α ¼ 0:6ð Þ ¼
0:30:480:420:30:60:240:240:180:120:12
26666666666664
37777777777775:
The process continues until reaching D links with probability equal or greater than S.The complexity of each iteration of the CE method is O(N �MI(L)). Again, using the Gauss–Jordan elimination method, the complexityis O(N � L3).
5. Numerical experiments and results
The goal of the numerical experiment is to evaluate the proposed link-deletion methods and find the heuristic that results in thelowest EPL in various experimental conditions. In order to benchmark the proposed algorithms, a set of problem instances weregenerated. Each instance consisted of a directed graph that represents the link structure of the website, its transition probabilitymatrices, and the content proportion vector (describing the distribution of the target pages of the users).
Scale Free transition matrices were generated randomly. Websites, like many other networks in nature, are typically structured asScale-Free Networks,32 representing a sparse network with a few nodes of high degree (commonly referred to as ‘hubs’) and manynodes with a low degree. The procedure used to generate a scale-free network (or Matrix) was based on the linear preferentialattachment32 principle, as follows:
1 A network is constructed using a set of m0 vertices.2 New vertices are added up to the dimension of the matrix required.3 Each new vertex is connected with no more than m links to the previously added vertices.4 The new edges are chosen using a linear preferential attachment rule, that is, the probability of the new vertex i being connected
to an existing vertex j is proportional to the degree of j. This rule is also known as ‘the rich get richer’ paradigm and follows thepower-law principle.
For the purpose of simplicity, we assume that the transition matrices of all the users were identical and independent of their targetURL. The diagonal of the transition probability matrices were kept to zero in order to rule out links/movements from a page to itself(i.e., the Refresh button is not considered a movement). Using two m links values, either m= 2 or m=3, we generated 120 differenttransition probability matrices and website structures: 40 of them contained 8 pages, 40 contained 16 pages, and 40 contained 24pages (for validation purpose several experiments were executed on larger websites with 50, 100, and 200 pages that are discussedin Section 6). These website sizes represent of small and medium organizations that form the majority of the websites in the WWW.Note that the used network-generation procedure describes a case where new added webpages are most probably connected to thehomepage, resulting in a scale free network where hubs have degrees higher than m.
The content proportion vector was generated with three different methods:
1 Using a randomly generated vector – initially, set pij=U(0, 1) for all existing links (i, j) and then normalize the probabilities bydividing the elements of each row i by the sum of probabilities ∑
jpij .
2 Using a uniform distribution – the transition probability from page i to each linked page j is pij ¼ 1k , where k is the number of links
at page i.3 Using a 70/30 vector – one of the pages is randomly selected (t ’). Then, wt′ ¼ 0:7. Other pages t≠ t ’ were then randomly
assigned a portion of the additional 0.3.
For each of the 120 matrices described earlier, we generated a content proportion vector using each one of these three methods.Each of these 360 instances were tested with D=4 and D= 3. In total, 720 instances were created for each website in each of the threesizes.
We ran all three heuristics, namely, GD, AB&B, and CE, on each instance. In order to compare the obtained EPL results with the
optimal solution, we used ES over all the LD
� �possible solutions. The ES results are denoted by OPT. The three algorithms and
iley & Sons, Ltd. Qual. Reliab. Engng. Int. 2016,

Z. POSTELNICU, T. RAVIV AND I. BEN-GAL
the ES were implemented in MathWorks MATLAB version R2009b using Microsoft Windows 7. The experiment was executed on anIntel i7 with 8GB.
Two metrics of interest are observed: (i) avg. run time – the average time necessary to obtain a result (in seconds); (ii) the optimalitygap –measuring how close a solution is to the optimal solution. The optimality gap is calculated for each heuristic as shown in Table Ibelow:
Optimality Gap ¼ Heuristic Solution� OPT
OPT:
Note that OPT is the true minimal EPL of the website obtained by ES, and Heuristic Solution is the actual EPL obtained by one of thefaster heuristic solutions.
Table I summarizes the results of the experimental runs for the three groups according to the dimension (number of pages) of thewebsite, as shown in the first column. The second column describes the solution heuristic that was used to modify the links. The thirdcolumn shows the average running time (in seconds) of each of the algorithms, and in the fourth column, one can see the averagedifference between the obtained EPL and the optimal EPL (referred to as the optimality gap as obtained by the ES procedure).
As seen in the website size, while the average running time of the ES and the AB&B methods grow very rapidly, the growth rates ofthe greedy method and the CE are much more moderate. Note that the relative optimality gaps obtained using all three heuristicmethods decreased in the problem dimension as there is more combinatorial space for the heuristic to search for a better solution.This observation is of particular interest because it implies that the two faster heuristics can be applied to much larger websites at areasonable computational cost.
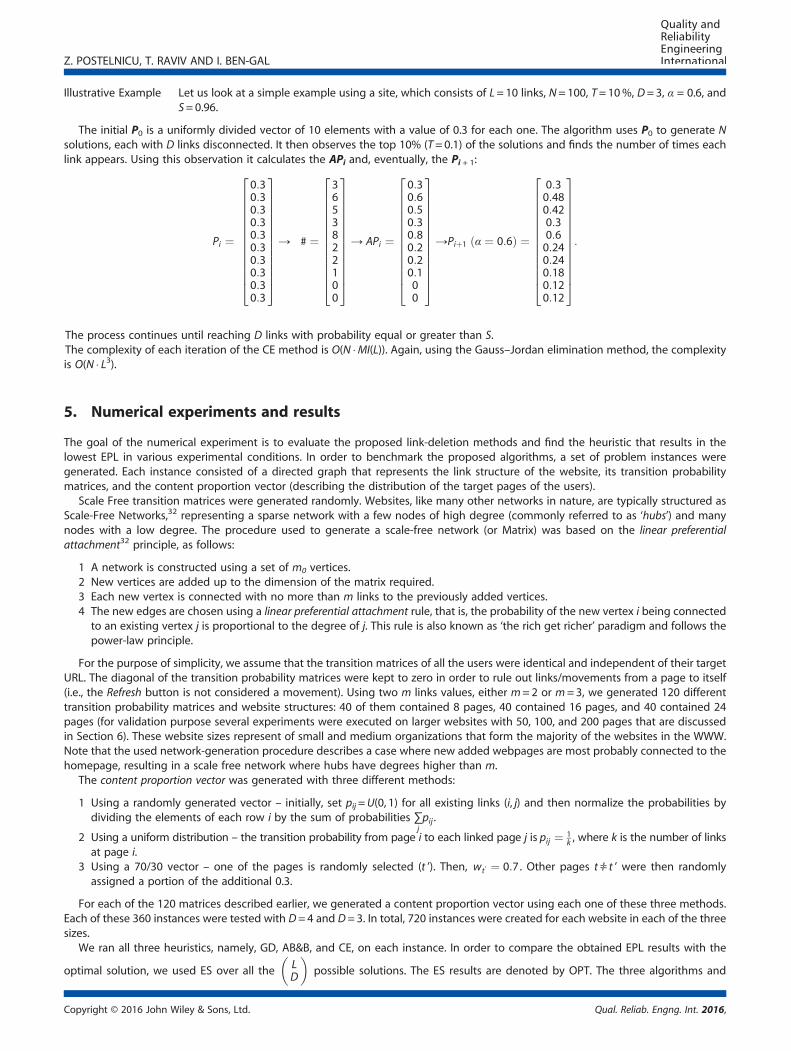
Another observation is that the AB&B heuristic is dominated by the CE heuristic, both in terms of running time and optimality gap.The GD, CE, and ES constitute an efficiency frontier with respect to the average optimality gap and the average run time. It seems thatin practice, the CE should be used for websites of moderate size, while the greedy heuristic, which obtained slightly higher EPL values,has a significant advantage in terms of running time, making it a good candidate method for larger websites. These observations areshown in Figure 6 where each method is depicted by the running time (using a logarithmic scale) and the average optimality gap.
Finally, we wish to demonstrate the effectiveness of the leading heuristics method by putting them in the context of the possibleimprovement that can be gained by deleting links from a websites with 24 pages (which is a typical size of a medium-sizeorganization website). For each instance of the problem, we observed the ratio between the remaining absolute optimality gapand the total improvement that can be potentially gained by a complete optimization method. We refer to this ratio as a distancegap, defined as follow:
Distance Gap ¼ Heuristic Solution� Optimal Solution
Initial Solution� Optimal Solution:
Figure 7 presents a histogram of the ratio of problem instances with respect to their distance gap (in predefined intervals). Thesolid lines represents the cumulative ratio of problem instances with a distance gap up to the corresponding category.
As seen, in more than 95% (respectively, 90%) of the instances, the CE heuristic (respectively, the greedy heuristic) obtained asolution to within 10% of the optimum. This implies that the two heuristics are capable of providing near optimal solution most ofthe time. Because these methods are much faster and scalable than any known complete solution method, it is possible to implementthem online, for example, in personalized website browsing, when there is a need to make quick decisions.
Table I. Overall results – average of runs
Dimension (no of pages) Heuristic Avg. time (s) Avg. optimality gap
8 pages Initial solution – 50.93%ES (OPT) 29.93 0.00%Greedy 0.10 2.14%AB&B 9.83 1.39%CE 16.07 0.21%
16 pages Initial solution – 25.68%ES (OPT) 1522.01 0.00%Greedy 0.55 1.19%AB&B 186.41 0.88%CE 38.39 0.49%
24 pages Initial solution – 20.95%ES (OPT) 10512.09 0.00%Greedy 0.95 0.67%AB&B 1032.18 0.43%CE 55.93 0.27%
ES, exhaustive search; AB&B, approximated branch and bound; CE, cross-entropy.
Copyright © 2016 John Wiley & Sons, Ltd. Qual. Reliab. Engng. Int. 2016,
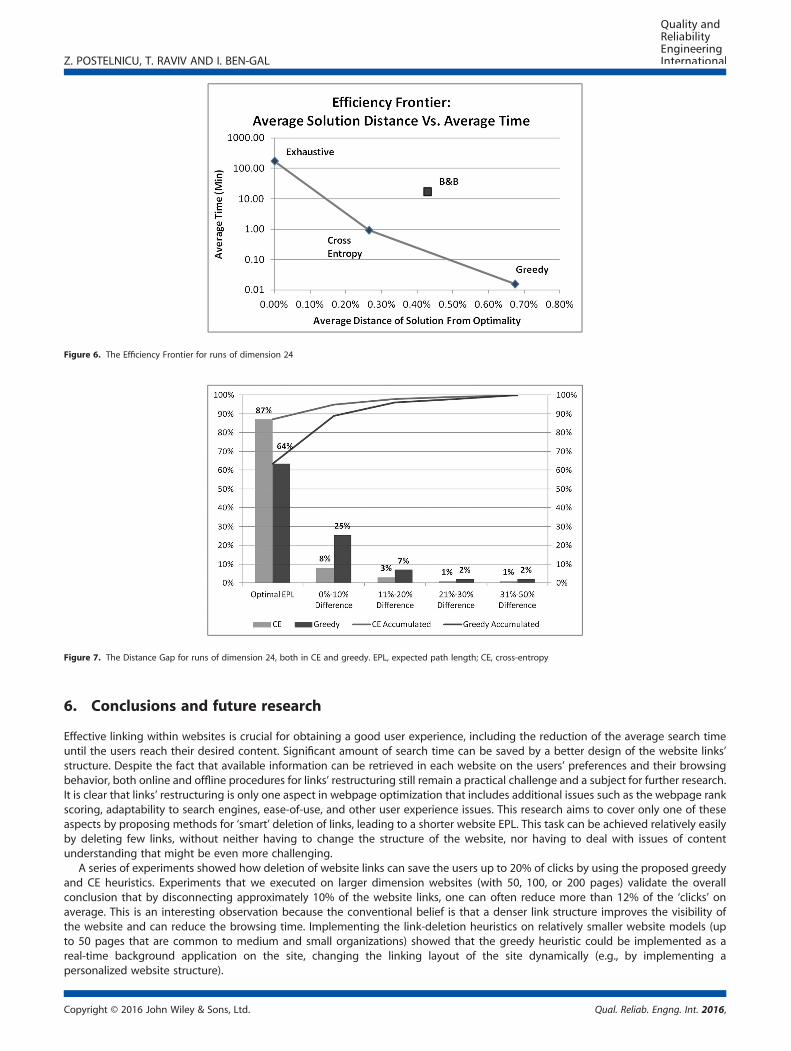
Figure 7. The Distance Gap for runs of dimension 24, both in CE and greedy. EPL, expected path length; CE, cross-entropy
Figure 6. The Efficiency Frontier for runs of dimension 24
Z. POSTELNICU, T. RAVIV AND I. BEN-GAL
6. Conclusions and future research
Effective linking within websites is crucial for obtaining a good user experience, including the reduction of the average search timeuntil the users reach their desired content. Significant amount of search time can be saved by a better design of the website links’structure. Despite the fact that available information can be retrieved in each website on the users’ preferences and their browsingbehavior, both online and offline procedures for links’ restructuring still remain a practical challenge and a subject for further research.It is clear that links’ restructuring is only one aspect in webpage optimization that includes additional issues such as the webpage rankscoring, adaptability to search engines, ease-of-use, and other user experience issues. This research aims to cover only one of theseaspects by proposing methods for ‘smart’ deletion of links, leading to a shorter website EPL. This task can be achieved relatively easilyby deleting few links, without neither having to change the structure of the website, nor having to deal with issues of contentunderstanding that might be even more challenging.
A series of experiments showed how deletion of website links can save the users up to 20% of clicks by using the proposed greedyand CE heuristics. Experiments that we executed on larger dimension websites (with 50, 100, or 200 pages) validate the overallconclusion that by disconnecting approximately 10% of the website links, one can often reduce more than 12% of the ‘clicks’ onaverage. This is an interesting observation because the conventional belief is that a denser link structure improves the visibility ofthe website and can reduce the browsing time. Implementing the link-deletion heuristics on relatively smaller website models (upto 50 pages that are common to medium and small organizations) showed that the greedy heuristic could be implemented as areal-time background application on the site, changing the linking layout of the site dynamically (e.g., by implementing apersonalized website structure).
Copyright © 2016 John Wiley & Sons, Ltd. Qual. Reliab. Engng. Int. 2016,

Z. POSTELNICU, T. RAVIV AND I. BEN-GAL
Future research direction includes among other issues not only the deletion of links but also an addition of links when required, aswell as other user-experience factors. While this research considered each website as a single entity, future research should examine alarger structure of linked websites, allowing the heuristic to run quickly on a portion of the site in parallel, while enabling the user tomove efficiently between the various networked sections. Another potential research direction can be focused on the use of fixed-orderMarkov chains to represent the user’s behavior within the website. While one can look at a Markov chain of order 1 and derive adiscrete-time stochastic matrix to represent the websitemovement of a user, another approach can consider a continuous-timeMarkovprocess. The latter modeling approach does not rely only on the current location of the user, but also on previous locations. Becausesuch a modeling scheme is more complicated, one can alternatively consider a site containing N pages that can be represented by upto N discrete-time Markov processes, each of which represents a cluster or class of users with similar surfing behavior.
Finally, let us note that the use of browsing data as one out of many diverse customer-experience data sources is part of anongoing effort in quality engineering to address modern application of QoS in an increasingly complex systems33,34.
References1. Jiang W, Au T, Tsui KL. A statistical process control approach to business activity monitoring. IIE Transactions 2007; 39(3):235–249.2. Liang CC, Wu PC. Internet-banking customer analysis based on perceptions of service quality. Total Quality Management & Business Excellence
2014:1–19.3. Barnes M. Ralph, Motion and Time Study: Design and Measurement of Work (7th Edition). John Wiley, 1980.4. Lawrence S. Aft, Work Measurement and Methods Improvement. Interscience, 2000.5. Goldstain O, Ben-Gal I, Bukchin Y. Remote Learning for the Manipulation and Control of Robotic Cells. The European Journal of Engineering Education
2007; 32(4):481–494.6. Nielsen Website, http://www.nielsen.com/us/en/insights/news/2010/what-americans-do-online-social-media-and-games-dominate-activity.html,
[08-02-2010].7. Yarow J., Here’s what people do on the internet all day, Business Insider Website, http://www.businessinsider.com/heres-what-people-do-on-the-
internet-all-day-2014-5, [05-21-2014].8. Murat AB, Ismail HT, Murat D, Ahmet C. Discovering better navigation sequences for the session construction problem. Data & Knowledge
Engineering 2012; 73:58–72.9. Hussein W, Gharib TF, Ismail RM, Mostafa MGM. An efficient framework based on usage and semantic data for next page prediction. Intelligent Data
Analysis 2015; 19(6):1377–1389.10. Xie Y, Yu SZ. A large-scale hidden semi-Markov model for anomaly detection on user browsing behaviors. IEEE/ACM Transactions nn Networking
2009; 17(1):54–65.11. Montgomery AL, Srinivasan SLK, Liechty JC. Modeling online browsing and path analysis using clickstream data. Marketing Science 2004;
23(4):579–595.12. Zukerman I, Albrecht DW. Predictive statistical models for user modeling, User Modeling and User Adapted Interaction 2001; 11(1-2):1–5.13. Rubinstein R. The cross-entropy method for combinatorial and continuous optimization. Methodology and Computer in Applied Probability 1999;
2(2):127–190.14. Perkowitz M., Etzioni O., Adaptive web sites: an ai challenge, in: Proc. IJCAI-97, Nagoya, Japan, 1997.15. Perkowitz M, Etzioni O. Towards adaptive web sites: conceptual framework and case study. Artificial Intelligence 2000; 118(1-2):245–275.16. Mobasher B, Jain N, Han EH, Srivastava J. Web mining: Pattern discovery from world wide web transactions. In Technical Report TR-96050.
Department of Computer Science, University of Minnesota: Minneapolis, 1996.17. Forsati R, Moayedikia A, Shamsfard M. An effective web page recommended using binary data clustering. Information Retrieval Journal 2015;
18:167–214.18. Ben-Gal I. On the Use of Data Compression Measures to Assess Robust Designs. IEEE Transactions on Reliability 2005; 54(3):381–388.19. Jiang T, Tuzhilin A. Improving personalization solutions through optimal segmentation of customer bases. IEEE Transactions on Knowledge and Data
Engineering 2009; 21(3):305–320.20. Baraglia R, Silvestri F. Dynamic personalization of web sites without user intervention. Communications of the ACM 2007; 50(2):63–67.21. Saad S. Z., Web Personalization based on Usage Mining, The 3rd BCS IRSG Symposium on Future Directions in Information Access, 2009, pp. 15-21.22. Jalali M, Mustapha N, Sulaiman M, Mamat A. WebPUM: a web-based recommendation system to predict user future movements. Expert Systems
with Applications 2010; 37(9):6201–6212.23. Saad SZ, Kruschwitz U. Applying Web Usage Mining for Adaptive Intranet Navigation, Multidisciplinary Information Retrieval, LNCS, Vol. 6653.
Springer Berlin Heidelberg: Berlin, 2011; 118–133.24. Goyal P, Goyal N, Gupta A, Rahul TS. Designing self-adaptive websites using online hotlink assignment algorithm. Proceedings of the 7th
International Conference on Advances in Mobile Computing and Multimedia, ACM 2009:579–583.25. Chen M, Ryu YU. Facilitating effective user navigation through web site structure improvement. IEEE Transactions on Knowledge and Data
Engineering 2013; 25(3):571–588.26. Jadhav SW, Bhale NL. Optimized website structure improvement for effective user navigation. International Research Journal of Engineering and
Technology (IRJET) 2015; 2(9).27. Bestavros A, Cunha C. Server-initiated document dissemination for the WWW. IEEE Data Eng. Bull 1996; 19(3):3–11.28. Zukerman I, Albrecht DW, Nicholson AE. UM99 - Proceedings of the Seventh International Conference on User Modeling. In Predicting Users’
Requests on the WWW. Banff: Canada, 1999; 275–284.29. Yin PY, Guo YM. Optimization of multi-criteria website structure based on enhanced tabu search and web usage mining. Applied Mathematics and
Computation 2013; 219:11082–11095.30. Paul N, Kumar A. Adding extra links and repairing existing links in websites. International Journal of Mechanical Engineering and Information
Technology 2014; 2(9):746–753.31. Singh H, Kaur P. A survey of transformation based website structure optimization models. Journal of Information and Optimization Sciences 2015;
35:5–6 529-560. doi:10.1080/02522667.2014.961802.32. Barabasi AL, Albert R, Jeong H. Scale-free characteristics of random networks: the topology of the World Wide Web. Physica A 2000; 281(1):69–77.33. Brombacher A, Hopma E, Ittoo A, Lu Y, Luyk I, Maruster L, Ribeiro J, Weijters T, Wortmann H. Improving product quality and reliability with customer
experience data. Qual. Reliab. Engng. Int. 2012; 28:873–886. doi:10.1002/qre.1277.34. Kenett RS, Harel A, Ruggeri F. Controlling the usability of web services, international journal of software engineering and knowledge engineering.
World Scientific Publishing Company 2009; 19(5):627–651.
Copyright © 2016 John Wiley & Sons, Ltd. Qual. Reliab. Engng. Int. 2016,
Z. POSTELNICU, T. RAVIV AND I. BEN-GAL
Authors' biographies
Zohar Postelnicu accomplished his BSc (2008) and MSc (2013) degrees in the Department of Industrial Engineering at Tel AvivUniversity, the latter under the supervision of Professor Irad Ben-Gal and Professor Tal Raviv. Zohar is currently working as a ProductManager at Google, located in Mountain View, CA, USA.
Tal Raviv is a member of the Industrial Engineering Department, Iby and Aladar Fleischman Faculty of Engineering, Tel AvivUniversity, Israel. He holds a BA from the Eitan Berglas School of Economics, Tel Aviv University (1993); an MBA from the RecanatiSchool of Business, Tel Aviv University (1997); and a PhD in Operations Research from the William Davidson Faculty of IndustrialEngineering and Management, Technion–Israel Institute of Technology, Haifa (2003). He spent 2 years (2004–2006) as a postdoctoralfellow in the Sauder School of Business at University of British Columbia, Vancouver, Canada. His current main research interest is intransportation and logistics with a focus on sustainable logistics and shared mobility systems.
Irad Ben-Gal is a professor and former chair in the Department of Industrial Engineering at Tel Aviv University, currently visiting theManagement Science and Engineering Department at Stanford University. His research interests include applied probability, machinelearning and information theory applications to industrial and service systems. He wrote and edited five books, published more than80 scientific papers and received several best papers awards. Irad is the former chair of the Quality Statistics and Reliability society atINFORMS and a member in the Institute of Industrial Engineers, the European Network for Business and Industrial Statistics and theInternational Statistical Institute. He is a Department Editor in Institute of Industrial Engineers Transactions and serves in the EditorialBoards of several other professional journals. Prof. Ben-Gal supervised dozens of graduate students, led many R&D projects andworked with companies such as Intel, Applied Materials, GM, Nokia, Oracle and SAP. Irad is a co-founder and an active chairman ofContext-Based 4casting (C-B4), a software startup that provides automated predictive analytics solutions.
Copyright © 2016 John Wiley & Sons, Ltd. Qual. Reliab. Engng. Int. 2016,