improving usage of doorstep baking for the poor:
TRANSCRIPT

June 2013
Does financial education affect savings behavior? Evidence from a randomized
experiment among low-income clients
of branchless banking in India
MarghErIta CalDEronE, FlorEntIna Mulaj,
SantaDarShan SaDhu, anD lEopolD Sarr


Does Financial Education Affect Savings Behavior? Evidence from a Randomized Experiment among Low Income Clients of Branchless
Banking in India
Margherita Calderone Florentina Mulaj Santadarshan Sadhu Leopold Sarr 1
Abstract
Can financial behavior be improved through financial education? This paper presents a randomized
controlled trial evaluation designed to answer this question by measuring the impact of a financial
education program on savings behavior among low income clients of branchless banking in India. The
intervention consisted of a two-day training that covered as main topics the role of formal banking in
people’s lives and responsible cash management; while the experiment was conducted on a random
sample of 3,000 clients served by a branchless banking facility across two adjacent districts in the state
of Uttar Pradesh. The results reveal that the intervention had a significant impact on savings: savings in
the treatment group increased by 29% (as compared to the control group) within a period of one year.
Our results also indicate that attitudes related to financial planning improved after the intervention, but
there was no impact on overall financial literacy. These findings suggest that a causal chain reaction
from knowledge to behavior might not necessarily be required in such order to achieve desired
outcomes. The direct policy implication is that different program designs, other than a program merely
focused on literacy, might be more effective in altering financial behaviors.
1 Margherita Calderone: German Institute for Economic Research, Berlin; Santadarshan Sadhu: Centre for Microfinance, Chennai; Florentina Mulaj and Leopold Sarr: The World Bank, Washington DC. Contact author: [email protected]

I. Introduction
In a rising number of developing countries, thanks to innovations in technology-based
branchless banking, formal banking has expanded its outreach to the previously unbanked population,
including even its most vulnerable segments. A recent study shows that between 500 and 800 million of
the world’s poor now have access to finance (Deb and Kubzansky, 2012). However, there is also
evidence indicating that the majority of these individuals are not prepared to interact with the growing
complexities of financial products and services. Scholars focusing on both developed (Lusardi and
Mitchell, 2006) and developing countries (Cole et al., 2011) have documented low levels of financial
literacy; that is, low knowledge and skills around basic concepts on personal financial management as
well as low understanding of more general banking practices.
A growing literature suggests that financial literacy is correlated with household wellbeing,
including participation in savings, credit, investments (Hogarth et al., 2003), and planning for retirement
(Lusardi and Mitchell, 2007). Therefore, along with the increased focus on financial inclusion, a rising
number of countries are developing national strategies for financial education and making more
investments in related programs (Grifoni and Messy, 2012). The basic premise behind these initiatives is
that improved access, complemented with financial knowledge, will lead to responsible financial
behavior among consumers. However, in order to provide more concrete policy directions in terms of
program design, there is a need to establish causality between financial education and behavioral
outcomes and, to the extent possible, examine the impact of the former on a number of variables along
the causal chain.
To date, the evidence from field experimental research in analyzing the cause-and-effect of
financial education has provided mixed results in both developed and developing countries. Duflo and
Saez (2003) conducted a randomized experiment to measure the impact of a benefit fair on retirement
plan enrollment among employees of a university in the United States, but found small effects on
enrollment. Focusing on developing countries, Cole et al. (2011) led another randomized experiment in
Indonesia to measure the impact of financial education training among the unbanked, also finding no
substantial effect on savings behavior. On the other hand, in Brazil, Bruhn et al. (2013) used a
randomized control trial approach to assess the effect of high school financial education, incorporated in
the standard curriculum during three academic semesters, and reported impact on financial literacy,
attitudes, and behavioral change (based on self-reported data). Though not focusing on personal
finance, Karlan and Valdivia (2011) examined the impact of business education on female entrepreneurs
in Peru and found a significant increase in participants’ engagement in some of the activities included in

the training, such as, separating money between business and household, reinvesting profits, and
maintaining records of sales and expenses.
The literature in this field suggests that there is still need for more rigorous evaluations to
provide conclusive evidence on whether financial literacy leads to the desired outcomes and on what
types of programs work, in which contexts, how much they cost, and whether they are scalable in low-
income settings. Against such a background, this paper presents a randomized field experiment in India
to measure the impact of a financial education program, delivered in conjunction with doorstep
banking, on savings behavior among low income households. The methodological and conceptual
contribution of the study is twofold. First, it is set out to test causality between financial education and
savings and between financial education and financial capabilities in a rigorous way. Second, it helps
understand the effect of financial education in combination with branchless banking and, therefore,
sheds further light on the debate concerning the low rates of banking usage among the recently banked
populations in low-income countries.
More specifically, we show that the financial education intervention had a significant impact on
savings. Moreover, we find improvements on attitudes related to financial planning, but we do not find
impact on financial knowledge. These findings reveal that financial education can improve behavioral
outcomes even if it does not affect overall financial literacy and suggests that a casual chain reaction
from knowledge to behavior might not always be necessary to influence savings. When taking into
account impact heterogeneity, the study provides three interesting findings. First, financial attitudes
improve more among the less educated individuals. Second, increased interest in financial matters and
shift from informal to formal savings are found among individuals more financially educated at the
baseline. Third, the intervention was less effective for the more impatient individuals. Discussing the
mechanisms, we show that the treatment effect is not merely a substitution effect as savings in the
doorstep banking account did not just replace other forms of savings and, on the contrary, they crowded
in other formal savings as well.
The rest of the paper is organized as follows. The next section describes the intervention, the
context in which it was implemented and its expected impact, while section III details the experimental
design, the randomization strategy and the sampling method. Section IV presents descriptive statistics
of key variables and section V explains the estimation methods and provides the regression results.
Finally, section VI concludes discussing possible mechanisms through which the causal chain of financial
education operates.

II. Intervention and Expected Impact
For our study, we worked with FINO Paytech Foundation, a financial services company, based in
India and specialized in offering technology-based banking transactions. FINO works with different
financial institutions to enable access to financial services for the previously excluded segments of the
society by offering last mile service delivery through a number of portable devices (i.e. biometric smart
cards, hand-held devices and micro-deposit machines with biometric authentication). The model that
FINO employs to reach out to households in rural areas is based on Business Correspondents (BCs), also
known as “bandhus”, who are permanently based in the villages where FINO operates and serve as the
focal point, or the contact person, between the financial institution and community members. This
model helps introduce the bank to the poor, who usually are not familiar or comfortable with the
traditional banking institutions, through a more personal interaction. To date, FINO has trained more
than 10,000 bandhus, serving over 58 million customers, and it is growing close to a million clients per
month.2
While doorstep banking has had enormous success in expanding access, as many studies that
look at the impact of branchless banking have shown, access in and of itself does not make individuals
financially more aware or literate (Thyagarajan and Venkatesan, 2008, in India, Dupas et al., 2012, in
Kenya). For example, out of the sample of 3,000 individuals - that we have randomly drawn from FINO’s
administrative database - who had signed up for FINO bank accounts, and were observed over a period
of two months, 88% were found to have made no transactions, with only 10% holding a positive
balance.3 While there could be many factors that account for this shortcoming, including lack of financial
resources, potential lack of effective access and lack of trust in branchless banking, or behavioral biases,
many researchers and policy makers have referred to the low levels of financial literacy as a major
constraint. In the case of FINO, it is important to note for the purpose of this study, that most of the
individuals who signed up for bank accounts were apparently provided instructions on how to use the
portable cards and on the types of transactions they could make and they also had ongoing access to the
bandhus for any question. However, it is likely that these FINO clients did not have a general
understanding about the benefits of responsible financial management or about the basic concepts of
personal finance.
2 http://www.moneycontrol.com/smementor/news/finance-capital/fino-taking-banks-to-indias-poor-766580.html 3 Source: Administrative data shared by FINO. Such picture also reflects the fact that bandhus received around Rs. 20-25 for signing up each client.

To shed light on the extent to which financial education improves financial behaviors when easy
access to banking services is provided, we developed our program in collaboration with FINO. The
intervention consisted of a two-day financial education training program, delivered through a video (2-3
hours per day) in a classroom setting, followed by interactive discussions on the presentation. It was
implemented between May and August 2011 across two adjacent districts of the state of Uttar Pradesh.
Table 1 illustrates the contents covered by the training that mostly focused on three topics: the role of
formal banking in people’s lives; responsible borrowing, spending, and saving; and cash management.
Overall the training material was fairly standard and based on classical modules used in other financial
literacy interventions, with the only difference that the beneficiaries were also told how to use the FINO
bank card. The content of the training was essentially developed by FINO under the overall guidance of
the evaluation team; while the video was designed in collaboration with a company specialized in street
plays and movie production. The training was delivered by professional trainers employed by FINO,
while the bandhu who served the area was also present to engage the clients in the workshop
discussions.
Our key hypothesis is that financial education can indeed be effective in changing savings
behavior among the existing FINO account holders from low-income households. More specifically, we
are interested in: 1) the impact of the financial education training on savings rates; and 2) the impact of
the financial education training on financial knowledge, budgeting skills, and attitudes about good
money management. The break-down of the analysis in these two dimensions will allow to examine in
more depth the impact of the intervention along the variables in the causal chain.
Furthermore, in order to understand whether there might be alternative and more cost-
effective ways to deliver the message that saving is important, we try to investigate which elements are
required for the success of the program. For this purpose, we introduced an intervention consisting of a
simple 10-minute house visit to stress the importance of saving in formal instruments during the post-
harvest period (when people have more money), followed up by a monthly 5-minute phone
conversation to remind people to save. Besides highlighting the importance of savings and the benefits
of formal savings, this post-harvest intervention also included the setting of saving goals and the
delivery of information about expected dates of bandhu presence in the area. Hence, we test whether a
simple intervention is as effective as the classroom financial literacy training and we also check whether
the post-harvest reminders can leverage the effect of the training.

III. Experimental Design
The experiment was conducted on a random sample of individuals in villages where FINO
operates. Villages were randomly selected to either receive the training, or receive no training.
Individuals from treatment villages that had FINO bank cards were then randomly selected to be offered
the financial education training.
The program was rolled out with the clients of 200 bandhus who were working in the villages of
the two experiment districts of Varanasi and Azamgarh in the state of Uttar Pradesh. These bandhus
were selected from the list of all FINO agents using a distance-based dropping method to prevent
contamination between treatment and control groups. In particular, from a pair of bandhus who were
located in villages very close to each other (less than 1.25 Kms) one bandhu was randomly dropped to
minimize spillovers and bandhus whose own service areas were far apart (more than 10 Kms) were also
dropped to make data collection and training easier. These 200 bandhus were then randomly assigned
into treatment and control and, for each bandhu, 25 clients were randomly selected through FINO’s
client records updated in January 2011. Using these FINO records, a pre-baseline randomization check
was undertaken to ensure that the sample was well balanced with respect to available demographic and
account activity information. The results of the balance test showed that before the baseline there were
indeed no observable differences between treatment and control FINO clients.4 Finally, from the list of
25 clients, a sample of 15 clients per bandhu was drawn for the survey interview.5 So, in total, 3,000
households were selected for the baseline survey which took place in April 2011, while the endline was
collected one year later in April 2012. Around November 2011, the sample was further divided assigning
half of the treatment and half of the control to receive the post-harvest intervention (house visit and
reminder phone calls) and, as a result, four groups were formed: pure control, pure treatment, only
post-harvest intervention, and treatment plus post-harvest intervention.
The questionnaire was designed to understand clients’ current knowledge of financial tools and
their current financial behaviors and it also collected detailed information on various indicators assumed
to play an important role in household financial wellbeing. Thus, the questionnaire covered the
following topics: household demographics, such as the number of family members, age, educational
4 The variables included in the pre-baseline balance test were: percentage of female; share of clients in the age groups 18-24, 25-59, 60 and above; and share of clients who made at least one transaction in the 6 months period before February 2011. 5 Buffers of 10 clients per bandhu were kept to ensure that, for each bandhu, the target of 15 clients could be surveyed. The first 15 clients (based on the sorting of randomly-assigned client ids) per bandhu were treated as the priority and the buffer only used in the extreme case where, in spite of making every effort, the survey team was unable to find the client from the original list.

attainment, income, primary and secondary occupation; household ownership of assets; household
expenditures, savings and borrowings; respondent’s perceptions and behaviors about budgeting,
involvement in household financial matters, and financial knowledge and attitudes; and respondent’s
time and risk preferences. Additionally, a module on FINO services was added in the endline survey to
assess the experience of the clients with the branchless banking delivered by FINO.
IV. Data
Household savings
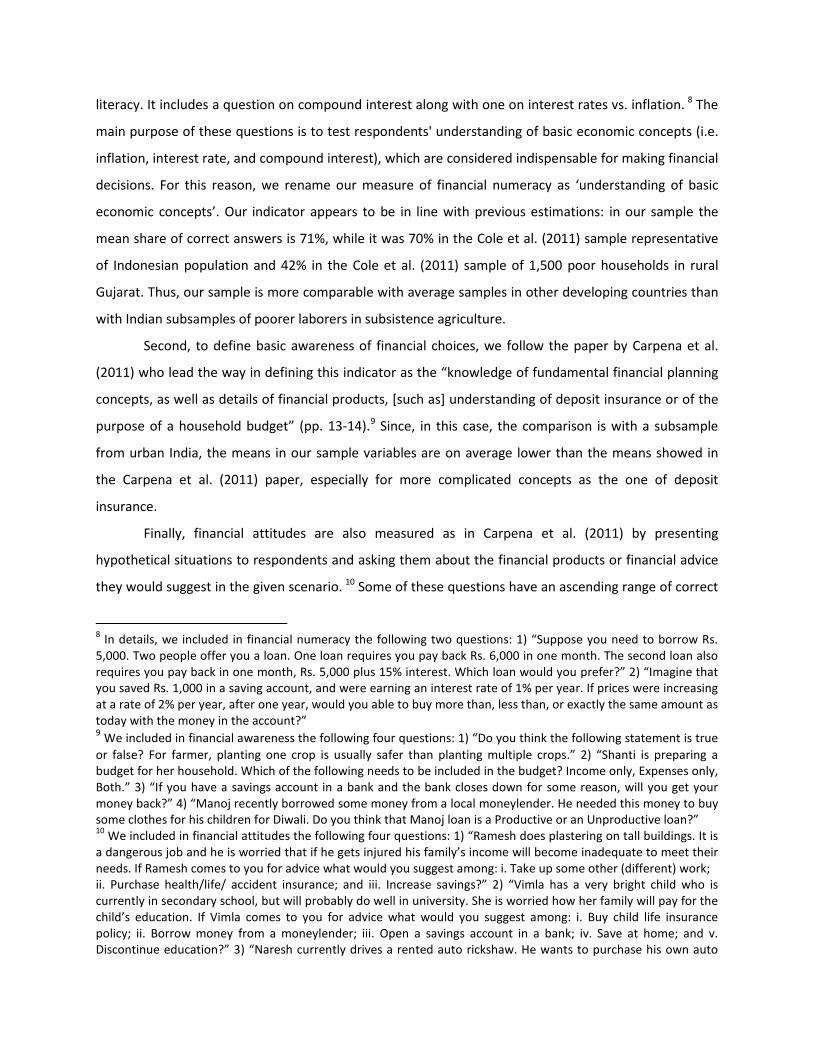
In Table 2 we present descriptive information to show how rural households in our sample
saved at the time of the baseline survey. To estimate savings we rely on self-reported data, i.e. the
respondents’ recall of the balance amount in each formal account and informal savings tool.
In April 2011, mean formal savings were Rs. 4,376 or about twice the average monthly income,
while mean informal savings (mostly home savings or savings in self-help groups) amounted only to Rs.
619 showing that, in our sample, formal savings are more prevalent than informal savings. Even though
technically the entire sample had no-frills savings account served by FINO, only 87% of households
reported having an account through FINO, suggesting that some clients were either not aware they had
FINO accounts or did not understand what they were signing up for when they opened the account.
Noticeably, even though about 94% of households reported having a formal savings account at
the baseline, only 59% had a non-zero balance suggesting that other constraints than access to bank
services limited savings amounts. Considering only FINO accounts, the figures are worse as only 24% of
households appeared to use the account for savings by keeping a non-zero balance.6 Such baseline
levels present indeed potential scope for financial education training to help develop better savings
behaviors.
Further, almost 60% of FINO account holders also had at least one other formal savings account.
About 51% had an account in a nationalized bank, 6% in a post office, 5% in a private bank and only 2%
with an NGO (categories not mutually exclusive). This picture is not too far from the percentages
presented by Demirguc-Kunt and Klapper (2012) based on the nationally representative Global Findex
dataset. They showed that in 2011, in India, between 22% and 56% of the population (exact percentages
depending on the income quintile) had an account at a formal financial institution. The fact that half of 6 The low deposit in FINO account might have been aggravated by the problem of absence of bandhus in the areas and/or by trust issues.

the respondents had a national bank account suggests that while banking is not easy in the areas where
FINO operates, people are interested in obtaining formal savings despite the extra costs. This finding
also reflects that in 2006 the Reserve Bank of India imposed on all commercial banks the introduction of
free no-frills accounts (Thyagarajan and Venkatesan, 2008). Thus, in the study area, the extra cost of
keeping another formal account consists mostly in the traveling cost of reaching the nearest bank.7
Financial literacy indicators
To define our indicator of financial literacy we follow the approach introduced by Cole et al.
(2011) and by Carpena et al. (2011). The first paper presents the first nationally representative measure
of financial literacy in a developing world, while the second study identifies “three distinct dimensions of
financial knowledge”: financial numeracy, basic awareness of financial choices, and attitudes toward
financial decisions. Accordingly, our questionnaire covered different aspects of financial literacy,
including budgeting skills, interest in financial matters, basic financial numeracy, financial products’
awareness, and financial attitudes.
More specifically, budgeting quality refers to the skills of making a budget, writing it down,
evaluating it as helpful and being able to stick to it. Interest in financial matters covers responses
regarding involvement in household financial matters and self-assessed understanding of information
related to financial products. Table 3.A presents the summary statistics for these first two measures of
financial literacy. In the baseline, budgeting quality appeared to be particularly low, 73% of the
respondents did not make a budget and, even when they did, they mostly kept it only mentally. A
considerable fraction of individuals (24%) also reported not to be involved at all in financial matters and
not to be actively interested in financial topics (48%). When asked about their understanding of financial
product, almost half of the respondents stated that, in general, they rarely or never understood financial
information, especially on loan and savings products. Even though these percentages might not
represent a particularly alarming picture, they still signal a generalized lack of financial understanding
and involvement.
In addition, Table 3.B presents the descriptive statistics regarding financial knowledge and
compares our results to the findings of Cole et al. (2011) from rural India and Indonesia and of Carpena
et al. (2011) from urban India.
The first measure of financial numeracy is based on the study by Cole et al. (2011) which is in
turn very close to the work of Lusardi and Mitchell (2006) who pioneered the research on financial
7 FINO estimated that in the villages where it chose to operate a bank branch was at least 4-5 kms away.
literacy. It includes a question on compound interest along with one on interest rates vs. inflation. 8 The
main purpose of these questions is to test respondents' understanding of basic economic concepts (i.e.
inflation, interest rate, and compound interest), which are considered indispensable for making financial
decisions. For this reason, we rename our measure of financial numeracy as ‘understanding of basic
economic concepts’. Our indicator appears to be in line with previous estimations: in our sample the
mean share of correct answers is 71%, while it was 70% in the Cole et al. (2011) sample representative
of Indonesian population and 42% in the Cole et al. (2011) sample of 1,500 poor households in rural
Gujarat. Thus, our sample is more comparable with average samples in other developing countries than
with Indian subsamples of poorer laborers in subsistence agriculture.
Second, to define basic awareness of financial choices, we follow the paper by Carpena et al.
(2011) who lead the way in defining this indicator as the “knowledge of fundamental financial planning
concepts, as well as details of financial products, [such as] understanding of deposit insurance or of the
purpose of a household budget” (pp. 13-14).9 Since, in this case, the comparison is with a subsample
from urban India, the means in our sample variables are on average lower than the means showed in
the Carpena et al. (2011) paper, especially for more complicated concepts as the one of deposit
insurance.
Finally, financial attitudes are also measured as in Carpena et al. (2011) by presenting
hypothetical situations to respondents and asking them about the financial products or financial advice
they would suggest in the given scenario. 10 Some of these questions have an ascending range of correct
8 In details, we included in financial numeracy the following two questions: 1) “Suppose you need to borrow Rs. 5,000. Two people offer you a loan. One loan requires you pay back Rs. 6,000 in one month. The second loan also requires you pay back in one month, Rs. 5,000 plus 15% interest. Which loan would you prefer?” 2) “Imagine that you saved Rs. 1,000 in a saving account, and were earning an interest rate of 1% per year. If prices were increasing at a rate of 2% per year, after one year, would you able to buy more than, less than, or exactly the same amount as today with the money in the account?” 9 We included in financial awareness the following four questions: 1) “Do you think the following statement is true or false? For farmer, planting one crop is usually safer than planting multiple crops.” 2) “Shanti is preparing a budget for her household. Which of the following needs to be included in the budget? Income only, Expenses only, Both.” 3) “If you have a savings account in a bank and the bank closes down for some reason, will you get your money back?” 4) “Manoj recently borrowed some money from a local moneylender. He needed this money to buy some clothes for his children for Diwali. Do you think that Manoj loan is a Productive or an Unproductive loan?” 10 We included in financial attitudes the following four questions: 1) “Ramesh does plastering on tall buildings. It is a dangerous job and he is worried that if he gets injured his family’s income will become inadequate to meet their needs. If Ramesh comes to you for advice what would you suggest among: i. Take up some other (different) work; ii. Purchase health/life/ accident insurance; and iii. Increase savings?” 2) “Vimla has a very bright child who is currently in secondary school, but will probably do well in university. She is worried how her family will pay for the child’s education. If Vimla comes to you for advice what would you suggest among: i. Buy child life insurance policy; ii. Borrow money from a moneylender; iii. Open a savings account in a bank; iv. Save at home; and v. Discontinue education?” 3) “Naresh currently drives a rented auto rickshaw. He wants to purchase his own auto

answers, so they are coded as continuous variables from 0 to 1 with 1 equal to the best financial option
and 0.5 weight on the second best option. Again, with an average mean of 0.68, our measure of financial
attitudes is on average lower than the one presented by Carpena et al. (2011) based on an urban
subsample.
Basic sample characteristics and randomization verification
In our sample, respondents appear to be of relatively low socio-economic status. Households
heads are mostly males, are on average 45 years old and about 40% of them are illiterate. Households
are mostly Hindus and have on average 6-7 members, of which 4 adults. About 70% of the households
own land, with income from harvest and livestock contributing about 45% to total income. At the
baseline, the income from primary and secondary occupation was on average only Rs. 1,079 ($20),
slightly above the poverty threshold (the state poverty line for rural Uttar Pradesh in 2010 was fixed at
Rs. 663).11 The mean of the total household income was Rs. 2,028 ($38), while the mean of total
household expenditures was Rs. 1,773 ($33) suggesting that on average households did not manage to
save much. In fact, about 50% of them resorted to loans and the average loan amount was equal to Rs.
4,839 ($90). Table 4 presents the results of the balance test relative to all the basic household
characteristics.
Summary statistics of the outcome variables
The first outcome of interest is whether the program caused any increment in the amount of the
following types of savings: FINO savings, formal savings (including FINO, post office and other
commercial banks -accounts), non-FINO formal bank savings, savings in other nationalized banks,
informal savings, and total savings. All savings amounts are capped at the 99th percentile in order to
eliminate outliers. The second outcome of interest is whether the intervention resulted in any
improvement in the different indicators of financial literacy described in the previous paragraph. Each
indicator is expressed as the average of the answers belonging to the same dimension of financial
literacy. Table 5 shows the relevant summary statistics and includes all households present in both
baseline and the endline surveys. Columns (1)–(3) give values for the pre-intervention, while columns
rickshaw but does not have the money and is considering taking out a loan for the same. If Naresh comes to you for advice would you suggest him to take out a loan or not?” 4) “Sajid recently got married. He and his wife are considering buying a TV. They do not have enough savings and will need to take out a loan. Sajid has two options: he can take a loan from the moneylender and a relative and get a bigger amount of loan to buy a big TV or he can take a loan only from a relative and buy a smaller TV. What would you advice Sajid and his wife?” 11 Government of India Planning Commission (2012)

(4)–(6) refer to the post-intervention - all standard errors reported are adjusted for clustering at the
village level (bandhu service area).12
Column (6) gives a first approximation of the impact of the financial literacy training on savings;
the difference between treatment and control endline savings’ measures is always positive and
statistically significant, in spite of the fact that the control group seems to improve along with the
treatment group. To minimize measurement errors and show only the effect of training, we repeat the
comparisons including only pure treatment and pure control (i.e. excluding the beneficiaries of the post-
harvest intervention) and we show that, as expected, the difference is even starker in this case (the
treatment group increases total savings on average by 154%, while the control group experiences an
increase of 66%). The fact that the control group improves as well is not so surprising if we take into
account that Uttar Pradesh is now one of the Indian states growing more rapidly. As Chakravarty (2011)
wrote, “‘UP’ saw its GDP at constant prices rise by over 8% in 2010-11. This is the state that used to
grow at abysmal rates in earlier years - for instance, the state’s GDP grew at 2.2% in 2000-01 and 2001-
02”.13 To give a sense of what such growth rate means for our sample, we can take as example bi-weekly
expenditures in food consumed outside home (a proxy of income) that increased from an average of Rs.
36 in April 2011 to an average of Rs. 198 in April 2012 (i.e. an increment of 450%).
Regarding financial literacy, it can be noticed that, also in this case, the control group improves
its outcome measures after the intervention, but this increment could simply be justified by the fact that
people are replying to the same questions again. Looking at the significance levels of Column (3) of Table
5, it is clear that in our regression we will have to control for the baseline values because not all the
financial measures were perfectly balanced at baseline, in spite of the fact that randomization was
successful and significant differences appeared only at a rate equal to that which would be given by
chance.
12 The appendix also includes a table with the non-response rates of all the outcome measures showed in Table 5. 13http://www.livemint.com/Opinion/lnJzBNekym0ZD4t1syOrHM/Bihar-UP-Chhattisgarh-grew-faster-than-Karnataka-in-20101.html. Chakravarty, M. (2011). Bihar, UP, Chhattisgarh grew faster than Karnataka in 2010-11, Livemint & The Wall Street Journal. Growth rates showed in the table titled "Many Poorer States Growing Rapidly" are based on data from the Directorate of Economics and Statistics of the respective state governments, available on CSO website.

V. Impacts on Savings and Financial Literacy
Estimation Method
For our estimation, we employ an ANCOVA specification since, as highlighted in McKenzie
(2011) and Bruhn and McKenzie (2009), when autocorrelation is low it is a more powerful specification
than difference-in-difference or fixed effects.14 Thus, we regress the outcome indicator on the
treatment status of household h controlling for the baseline value of the indicator:
(1) Yh POST = α + β Th + η Yh PRE + δ Xh PRE + εh POST
The β is the treatment effect, X represents other household control variables unbalanced at the
baseline and standard errors are adjusted for clustering at the village/ bandhu level. This specification
asks whether FINO clients improved savings or financial literacy levels more in treatment households
than control households relative to what would have been expected based on their pre-intervention
levels.
For various reasons15 , about 20% of the clients initially assigned to the treatment group did not
attend the financial literacy training. Thus, in our analysis, in addition to the standard OLS Intention-to-
Treat (ITT) regressions that focus on overall impacts, we have also used Instrumental Variable (IV)
regressions that use the initial assignment (the ITT) as an instrument for actual treatment to assess the
treatment effect on the treated (ToT).
Finally, differential attrition between the treatment and comparison groups could potentially
bias our results. To minimize attrition, the survey team undertook a rigorous search for tracking back the
baseline sample (including pre-end line house visits) and, in some cases, used the help of the bandhus to
re-locate the households. These efforts ensured a low attrition rate: attrition was only 2.8% and 2.1%
respectively, in the comparison and treatment groups. Furthermore, the baseline characteristics of
households that left the sample were similar in the treatment and comparison groups, suggesting that
the factors leading to attrition were the same and, consequently, that attendance and treatment status
were unrelated (the results of the estimation regressing attrition on treatment assignment are available
in the appendix). Therefore, attrition is unlikely to be a problem in our estimation strategy.
14 As a robustness check, we also replicated the estimation regressing the change in the outcome indicator (post-intervention value in levels minus pre-intervention value in levels) on the treatment status controlling for the baseline value of the indicator (YPOST – YPRE = α + β T + δ X PRE + η Y PRE + ε POST, as in Banerjee et al., 2007). Such robustness check gave the same results confirming the validity of our estimates. 15 In most instances, the beneficiaries could not attend because of other important engagements (including work, household chores, etc.).

Estimates of the Average Impacts on Savings
Table 6 displays the average impacts of the financial education intervention on increments in
the amount of savings. These estimates show a positive and substantial treatment effect both in the ITT
specifications (panel A) and in the ToT (IV) specifications (panel B).
Looking at the ITT specification, the program caused an increase in total savings of Rs. 1,647
(about $30) from April 2011 to April 2012 which equals to an increase of 29% compared to the endline
total savings in the control group. Considering the IV specification, the effect of training attendance is
even higher and equal to an increase in total savings of almost Rs. 2,000 (about $38) or 35% compared
to the control group. The effect is robust to the different specifications and even though the magnitude
slightly changes depending on the regression, the treatment effect remains positive and significant.
Foremost, the increment does not seem to be only determined by a marketing effect on FINO savings
because formal non-FINO savings also grew substantially. In fact, still considering the ITT estimates, the
program increased FINO savings by Rs. 88 and formal savings other than FINO by Rs. 1,559. Therefore,
given that the program was mostly aimed at increasing savings, it appears to be quite effective.
Table 7 shows that, on the contrary, the post-harvest intervention did not have a significant
effect on savings. It was successful only in increasing FINO savings by extra Rs. 56 (Rs. 122 in total -
compared to an increase of Rs. 66 for those that were assigned to receive only the training) maybe
because the delivery of information about the expected dates of bandhu presence or the actual
presence of the bandhus helped improve the delivery of the FINO service. The relative ineffectiveness of
the reminder intervention suggests that even if the post-harvest is a relevant period to boost attention
towards savings (Duflo et al., 2011) and even if reminders have been found to be effective in previous
field experiments in Latin America and Asia (Karlan et al., 2011 and Kast et al., 2012), a simple targeted
phone call is not as successful as a two-day class training with video-illustrated lessons and interactive
discussions to underline the importance of savings and make sure that the contents are internalized.
Estimates of the Average Impacts on Financial Literacy
Table 8 illustrates the average impacts of the financial education intervention on improvements
in the different aspects of financial literacy and shows that the only dimension of financial literacy that
appears to have been positively affected by the treatment is financial attitudes. The IV estimates show
that the intervention increased the financial attitudes indicator of individuals in the treatment group by
3% increase compared to the endline mean in the control group.

This result is somewhat in line with what was previously found in the literature and, in
particular, can be related to the conclusions of Carpena et al. (2011) that highlighted positive effects of
financial literacy on financial attitudes and basic financial awareness. The exception is that our
intervention did not seem to have any effect on financial awareness. However, this may be due to
various reasons that might not ensure comparability of the results. First, a problem that has undermined
our ability to identify a significant impact is that the survey was answered by the FINO client only when
he/she was available and, in the remaining cases, it was answered by the other most knowledgeable
person in the household. Therefore, we repeat the estimation on the restricted sample of clients who
responded to both the baseline and the endline surveys because, even though this might be a selected
sample, we need to check whether the absence of a significant impact on financial knowledge can be
attributed to a measurement error. As shown in Table 9, the new results confirm our previous findings
and, as before, the only significant treatment coefficient is the one on financial attitudes, but the
magnitude of the impact is now higher and equal to a 4% (ITT) – 5% (IV) increase as compared to the
endline value in the control group. It could also be because our financial education training was tailored
differently than previously evaluated financial education programs as it was more focused on increasing
savings and less oriented towards improving financial knowledge. In fact, even restricting the measure
of financial knowledge to include only the questions that must have been well underlined in the training
does not modify our results (columns 6 of Tables 8 and 9). 16
Our findings are also similar to the results of Doi et al. (2012) that find a positive and significant
effect of financial education on financial attitudes and financial awareness, but they use an indicator of
awareness that is more relaxed than other measures of financial knowledge and, specifically, they assess
it by asking respondents only whether they have heard about different financial products. Interestingly,
the authors redefine financial attitudes as “applied financial knowledge” since the questions included in
this indicator deal with real life situation where one could use in practice his/her financial understanding
to suggest, for instance, an appropriate financial product to someone who is worried about meeting
expenses if sick.
Finally, Table 10 replicates the results using standardized indicators to ensure comparability of
the effects. Normalized scores for each dimension of financial literacy are calculated like school test
16 We include in this indicator the following questions: question on financial numeracy number 2), questions on financial awareness number 1), 2) and 4), and questions on financial attitudes number 1) and 4). Thus, we exclude the following questions: question 1) on financial numeracy because it involves numerical skills that the training did not cover; question 3) on financial awareness because it deals with the concept of deposit insurance that was not explicitly included in the training program and question 2) and 3) on financial attitudes because they are framed in a very subjective way.

scores, by first summing the results of each question belonging to that dimension and then
standardizing by subtracting the mean pre-intervention score of the comparison group and dividing by
the standard deviation of the pre-intervention scores of the comparison group as in Banerjee et al.
(2007). The ITT estimates show that the intervention increased the average score for financial attitudes
of individuals in the treatment group by 0.09 standard deviations (equal to a 4% increase). The IV
estimates are similar and just slightly higher in magnitude: the effect on financial attitudes for those
who attended the training is equal to a 0.11 standard deviations increase or a 5% increment. This result
is very close to the increment estimated using the mean value of financial attitudes.
Heterogeneity
To test for heterogeneity in the treatment effect based on observable characteristics, we run
the following set of regressions:
(2) Yh POST = α + β Th + γ Th x TRAITh + η Yh PRE + δ Xh PRE + εh POST
Where TRAIT is the vector of background characteristics along which theory would predict
heterogeneity in the treatment impacts and where X includes also TRAIT among the controls. The effect
of the treatment for the subgroup of people with a given trait is given by the sum of the coefficients β
and γ and if γ is significantly different from zero then there is evidence of heterogeneity in the treatment
effect for that trait. Since the ITT estimates are more relevant for policy impacts17 and since the IV
estimates are close to the ITT ones, for this heterogeneity part, we only show the tables with the ITT
estimates. For comparison purposes, we also choose to use the standardized measures of financial
literacy instead of the mean values.18
We estimate equation (2) for the following different baseline characteristics: client education (at
least secondary), the baseline measure of overall financial literacy, client gender, client’s time
preferences, the baseline level of household per capita total expenditures, and an indicator for having a
formal savings account other than FINO at the baseline.19
17 The ITT estimates are more relevant for policy impacts because people cannot be forced to attend and policy makers need to know what would be the overall effect of treatment taking into account that not everybody assigned to treatment might comply. In addition, even though in our case attendance is orthogonal to treatment, the sample of those who attended is a selected sample with peculiar characteristics different from those of the average population. 18 The tables using the mean values are included in the appendix. 19 The tables shown focus only on the treatment effects, but the selected characteristics have significant direct effects, too. In particular, education and baseline financial literacy are significantly and positively correlated with endline savings and financial capability measures, being impatient decreases savings, females have less endline

Cole et al. (2011) highlighted that, in their experiment, the financial education program had a
modest effect and positively influenced financial behaviors only for those with limited education and
financial literacy. Thus, we first focus on the role of education and baseline financial literacy to check
whether our sample offers a similar picture. Tables 11 and 12 show the heterogeneous treatment
impacts on savings increments and on improvements in financial literacy, respectively. For education,
there is no heterogeneity in the treatment effect on savings, but there is indeed heterogeneity in the
treatment effect on financial attitudes. In particular, more educated people seem to have changed their
attitudes less than other clients in the treatment group confirming Cole et al. (2011) findings about
greater effects of financial education on the less educated. On the contrary, the heterogeneous impact
of baseline financial literacy runs in opposite direction with respect to what we would have expected
based on Cole et al. (2011) results. In our sample, those with better baseline financial literacy positively
and significantly improved their interest in financial matters by 0.2 standard deviations (0.08 + 0.12) and
even slightly increased their basic understanding of basic economic concepts by 0.11 standard
deviations (0.06 + 0.05). Also, they significantly decreased their informal savings by Rs. 80 (-18 and -62,
Table 11). This finding suggests that a sufficient prior familiarity with financial concepts helps in learning
more during a financial education program.
Similar to the paper by Dupas and Robinson (2012) on health savings, we also control for
heterogeneity in treatment impacts for gender and time preferences. Tables 13 and 14 show the results
of this additional test. There is no heterogeneity for gender, but there is a strong heterogeneous effect
for time preferences. In specific, more impatient individuals (those with higher discount rates) improved
their financial attitudes significantly less compared to an average client in the treatment group and even
scored worse in budgeting skills. Accordingly, they also saved significantly less than average and their
total savings after the training increased only by Rs. 195 (754 – 559, about $ 3). This result is in line with
the Dupas and Robinson (2012) findings on the importance of time preference bias in influencing saving
behaviors. In fact, the authors showed that a simple safe box significantly helped people in rural Kenya
to save more through a mental accounting effect, but such a basic technology was not useful for people
with present-biased preferences who managed to save only when facing social pressure through a
saving device with a strong social commitment feature (a health pot at a ROSCA).
Finally, we test for heterogeneity in the treatment effects based on baseline expenditures (per
capita total expenditures) and on whether the client already had another formal account other than
savings in national bank accounts and score worse in financial literacy, and those with higher baseline expenditures increase their financial numeracy skills.

FINO. Table 15 and Table 16 show that there is almost no heterogeneity in expenditures, while there is a
heterogeneous impact for those clients who had also a non-FINO formal savings account. It seems that
those who already had formal non-FINO savings account, increased their interest in financial matters by
0.19 standard deviations (0.27 – 0.08) and they even slightly improved their overall financial knowledge
(i.e. only including the questions that must have been stressed in the training) by 0.01 standard
deviations (0.14 – 0.13). Moreover, after the training, they also saved more experiencing an increment
in total savings equals to Rs. 2,544 (2,012 + 532). Thus, these results possibly indicate that the
intervention was more effective in influencing the behavior of the clients who already had an exposure
to formal savings bank accounts, rather than those who were linked with the banking system for the
first time through the no-frills savings account served by FINO.
VI. Discussion of the Results and Conclusion
Our key finding is that the financial education program increased total savings on average by
29% (as compared to the endline savings of the control group). The intervention was not only successful,
but also sufficiently cost-effective. The per-beneficiary cost of the program was $ 51. Considering that
total savings increased by about $30 for those in the treatment group, each dollar spent caused an
increase in savings of at least 60 cents (and estimates are even more positive if we consider only clients
who attended training).
The success of the intervention in increasing savings is in line with the fast growing literature on
savings in developing countries that has established that even the poorer are not simply “too poor to
save”. Collins et al. (2009) documented that poor families in Bangladesh, India and South Africa save
resources in a wide variety of informal or semi-formal savings devices. Banerjee and Duflo (2007),
looking at household survey data from 13 countries, found that extremely poor households do not use
all of their income to afford basic necessities. Similarly, evidence from bank expansion in developing
countries suggested that improving access to the formal financial sector can increase savings and
income (Aportela, 1999; Bruhn and Love, 2009; and Burgess and Pande, 2005). Still, we try to explore
various reasons that might have contributed to the increment in savings in our sample.
First, this success might be due to the fact that the program was delivered in conjunction with a
doorstep banking service and it might have just worked as a marketing campaign for the FINO account.
Our baseline survey confirms that even if FINO started its operations in 2006, at the time of the
intervention (May-August 2011) there were still enough margins to improve outcomes since only 87% of

households knew that they had an account and only 24% were using it for savings. Indeed, the FINO
account offered the big advantage of being not only without fees, but also accessible to clients in their
village and, thus, free from traveling costs. As Schaner (2011) underlines, even if one considers the
benefits of formal savings versus home savings (Rb > Rh), individuals might still be averse to saving
formally when savings are small because bank accounts also have a fixed transaction cost and the
difference between Rb and Rh might not be attractive enough to outweigh it. But when the transaction
cost is reduced, individuals who were already using a bank account will make more deposits and
withdrawals, while other individuals who were not using bank accounts will start to use them.
Eventually, such increase in account use is likely to lead to higher formal (but not necessarily total)
savings levels. In fact, in a parallel and preliminary study about the effect of the financial literacy training
on usage of FINO accounts on the sample sample, Sarr et al. (2012) find that the number of withdrawal
and deposits significantly increased after the intervention. However, even offering a formal banking
service for free might not be enough if the quality of the service is not ensured and trust issues are not
addressed. For example, Dupas et al. (2012) emphasizes that efforts to expand financial access will
effectively achieve financial inclusion only by comprising a communication component that brings
awareness of the various financial options available. Accordingly, their randomized experiment
suggested that entry costs (including opening fees and the administrative hassle of opening an account)
explained only about 1/5th of the low banking rates observed in their sample from rural Kenya.
Thus, our financial education program might have been successful just because it worked as a
marketing campaign for FINO and helped in improving the familiarity with and the perception of quality
of the bandhus’ service. During our endline survey, we asked respondents a full set of questions
regarding their satisfaction with the FINO account and we use the responses to investigate how much
the marketing of FINO services has contributed towards the impact of the program on savings. Table
17.A shows how the results change for average impacts on savings increments when we control for
quality of the service. 20 The effect of the financial education program on FINO savings is diminished in
magnitude, but nonetheless it retains its significance suggesting that the program indeed had a direct
impact on savings, apart from the indirect effect that it might have had by increasing the familiarity with
and the perception of the quality of FINO service. Most importantly, the significant and positive effect of
the financial education program on average total savings for the treatment group (OLS estimates) and
especially for those who attended the training (IV estimates) remains unchanged and even the
20 We measure quality of service by exploiting the responses of clients to the following question: “How would you rate the overall FINO agent/bandhu service? Very bad, Not good, Satisfactory, Good or Very good?”

magnitude of the coefficient is very close to the one in the estimation that does not control for quality.
These findings confirm that the treatment impact is not driven by a marketing effect leading people to
simply switch money from other saving devices to the FINO account. On the other hand, Table 17.A
provides evidence suggesting that the quality of service is an important determinant of the amount of
FINO savings. Table 17.B shows that there is indeed a substantial heterogeneity of impact depending on
the frequency with which FINO agents visited the village: those who were assigned to treatment and
were visited by a bandhu in the last 3 months increased their FINO savings by about Rs. 200.21
The second and more probable explanation for the success of our intervention is that the 29%
increase in total savings is linked to the 4% improvement in financial attitudes. This indicator of financial
literacy might represent “applied financial knowledge”, as coined by Doi et al. (2012), and it might be a
proxy for the important ability of taking appropriate financial decisions in everyday life. Also, it might
more generally measure the degree of familiarity with and confidence in the financial system since the
questions are mostly about suggesting financially appropriate saving devices over more informal
solutions. According to this approach, financial attitudes might be a proxy for trust in the formal
financial system and, thus, might really be crucial for achieving an effective financial inclusion. For
instance, Dupas et al. (2012) maintains that lack of trust is the first reason justifying why people, in rural
Western Kenya, did not begin saving in their bank account even when it was offered for free. This
hypothesis can explain well why not only FINO savings increased, but also savings in other nationalized
banks’ accounts showed a positive and significant increment.
Another possible reason for the success of the intervention is that the program was so focused
on responsible financial behavior (including savings and borrowing) that it directly contributed in
boosting attention and commitment towards savings, in addition to its effect on financial attitudes. This
hypothesis is consistent with a growing body of literature on savings in developing countries that
underlines the power of facilitating the mindset of saving money (Dupas and Robinson, 2012).
Finally, we have to notice that the endline survey was collected only 9 to 10 months after the
financial education training was provided and, thus, the savings increase might be temporary. Only an
experiment with a longer time horizon could confirm whether the training was indeed effective in
changing outcomes and helping people continuously save more for the future.
21 For other types of savings there was no impact heterogeneity depending on the frequency with which FINO agents visited the village.

References
Anamitra, D., and Kubzansky, M., (2012). Bridging the Gap: The Business Case for Financial Capability. A report commissioned and funded by the Citi Foundation. Cambridge, Mass: Monitor, March.
Aportela, F., (1999). Effects of Financial Access on Savings by Low-Income People. Banco de Mexico Working Paper.
Banerjee, A., and Duflo. E., (2007). The Economic Lives of the Poor. The Journal of Economic Perspectives 21(27): 141–167.
Banerjee, A., Cole, S., Duflo, E., and Linden, L., (2007). Remedying Education: Evidence from Two Randomized Experiments in India. The Quarterly Journal of Economics 122(3): 1235-1264.
Bruhn, M., de Souza Leão, L., Legovini, A., Marchetti, R., and Zia, B., (2013). Financial Education and Behavior Formation: Large-Scale Experimental Evidence from Brazil. Mimeo.
Bruhn, M., and Love, I., (2009). The Economic Impact of Banking the Unbanked: Evidence from Mexico. World Bank Policy Research Working Paper 4981.
Bruhn, M., and McKenzie, D., (2009). In Pursuit of Balance: Randomization in Practice in Development Field Experiments. American Economic Journal: Applied Economics 2009, 1(4): 200–232.
Burgess, R., and Pande, R., (2005). Do Rural Banks Matter? Evidence from the Indian Social Banking Experiment. The American Economic Review 95(3): 780–795.
Carpena, F., Cole, S., Shapiro, J., and Zia, B., (2011). Unpacking the Casual Chain of Financial Literacy. World Bank Policy Research Working Paper 5798.
Cole, S., Sampson, T., and Zia, B., (2011). Price or Knowledge? What Drives Demand for Fiancial Services in Emrging Markets? The Journal of Finance 66(6): 1933-1967.
Collins, D., Morduch, J., Rutherford, S., and Ruthven, O., (2009). Portfolios of the Poor: How the World’s Poor Live on Two Dollars a Day. Princeton University Press.
Deb, A., and Kubzansky, M. (2012). Bridging the Gap: The Business Case for Financial Capability. MONITOR Report.
Demirguc-Kunt, A., and Klapper, L., (2012). Measuring Financial Inclusion: The Global Findex. World Bank Policy Research Working Paper 6025.

Doi, Y., McKenzie, D., and Zia, B., (2012). Who You Train Matters? Identifying Complementary Effects of Financial Education on Migrant Households. World Bank Policy Research Working Paper 6157.
Duflo, E., Kremer, M., and Robinson, J., (2011). Nudging Farmers to Use Fertilizer: Theory and Experimental Evidence from Kenya. American Economic Review 101: 2350–2390.
Duflo, E., and Saez, E., (2003). The Role of Information and Social Interactions in Retirement Plan Decisions: Evidence from a Randomized Experiment. Quarterly Journal of Economics 118 (3): 815-842.
Dupas, P., and Robinson, J., (2012). Why Don't the Poor Save More? Evidence from Health Savings Experiments. Forthcoming, American Economic Review.
Dupas, P., Green, S., Keats, A., and Robinson, J., (2012). Challenges in Banking the Rural Poor: Evidence from Kenya’s Western Province. Forthcoming, NBER Africa Project Conference Volume.
Government of India Planning Commission (2012). Press Note on Poverty Estimates, 2009-10.
Grifoni, A., and Messy, F., (2012). Current Status of National Strategies for Financial Education: A Comparative Analysis and Relevant Practices. OECD Working Paper 16 on Finance, Insurance and Private Pensions. Paris: OECD Publishing.
Hogarth, J.M., Beverly, S.G., and Hilgert, M., (2003), Household Financial Management: The Connection Between Knowledge and Behavior. Federal Reserve Bulletin 89: 309-322.
Karlan, D., McConnell, M., Mullainathan, S., and Zinman, J., (2011). Getting to the Top of Mind: How Reminders Increase Saving. Mimeo.
Karlan, D., and Valdivia, M. (2011). Teaching Entrepreneurship: Impact of Business Training on Microfinance Clients and Institutions. The Review of Economics and Statistics 93(2): 510-527.
Kast, F., Meier, S., and Pomeranz, D., (2012), Under-Savers Anonymous: Evidence on Self-Help Groups and Peer Pressure as a Savings Commitment Device. Harvard Business School Working Paper 060.
Lusardi, A., and Mitchell, O., (2006). Financial Literacy and Planning: Implications for Retirement Wellbeing. Pension Research Council Working Paper 1.
Lusardi, A., and Mitchell, O., (2007). Financial Literacy and Retirement Preparedness: Evidence and Implications for Financial Education. Business Economics 42(1): 35-44.
McKenzie, D. (2012). Beyond baseline and follow-up: The case for more T in experiments. Journal of Development Economics 99: 210–221.

Sarr, L., Sadhu, S., and Fiala, N., (2012). Bringing the Bank to the Doorstep: Uptake among the Poor in a Financial Inclusion and Training Program. Mimeo
Schaner, S.G., (2011). The Cost of Convenience? Transaction Costs, Bargaining Power and Savings Account Use in Kenya. Mimeo.
Thyagarajan, S., and Venkatesan, J., (2008). Cost –Benefit and Usage Behaviour Analysis of No Frills Accounts: A Study Report on Cuddalore District. Institute for Financial Management and Research/ Centre for Micro Finance Working Paper.

Table 1. The content of the financial education training
Training Module Contents Methodology
Financial Planning and Budgeting
Discussion about objective of session How to keep track of income and expenses
Creation of personal budget and its categories Allocation of Income among budget categories
Discussion, pamphlet, storytelling
Saving And Investment
Importance of regular saving Difference between savings and investments
Importance of saving account and different avenues of saving Long term saving and planning for major future event
Different avenues of investment
Video, comics, storytelling,
leaflets
Borrowing and Loan Management
Concepts of wise borrowing Different avenues of borrowing
Planning personal loan management Planning for emergency needs to avoid over indebtedness
Video, comics, storytelling,
leaflets
Mitigating Risk and Insurance
Meaning and usefulness of insurance Discussion on different insurance products
Pension planning or target segments
Video, comics, storytelling,
leaflets
Formal Financial Services Know-how
Basic know-how about banking and allied services Need for including oneself in formal financial system
Videos, group discussion, leaflets
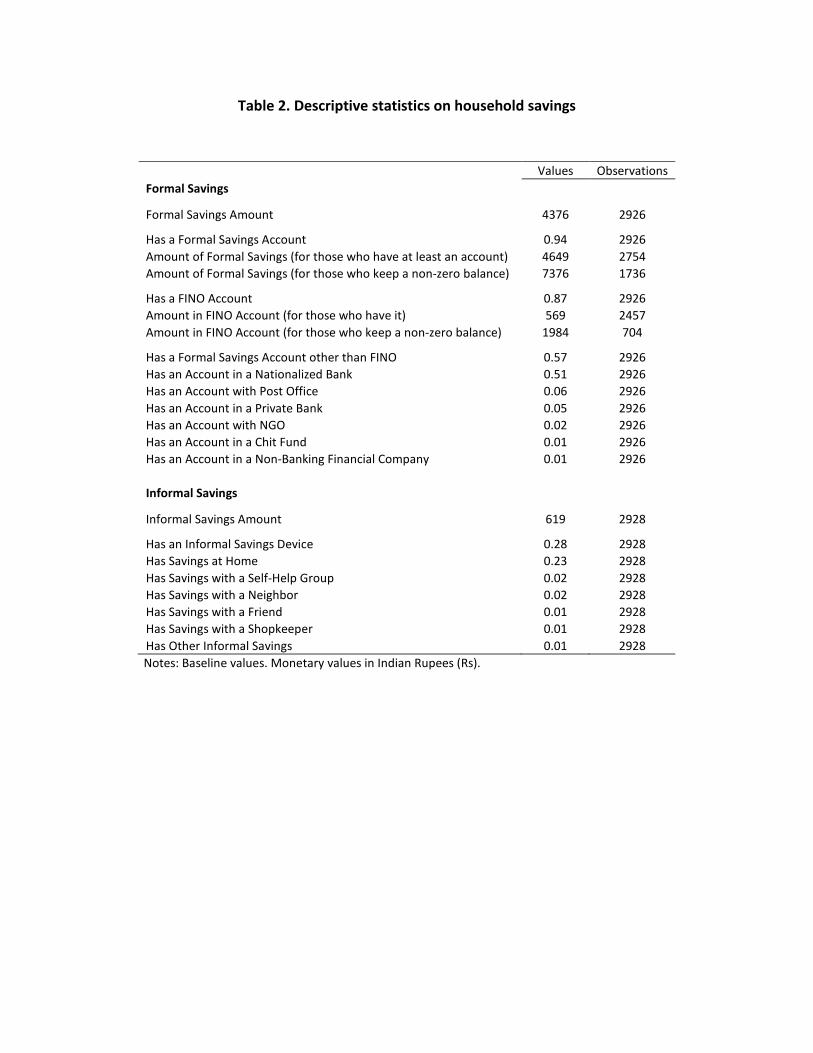
Table 2. Descriptive statistics on household savings
Values Observations Formal Savings
Formal Savings Amount 4376 2926
Has a Formal Savings Account 0.94 2926 Amount of Formal Savings (for those who have at least an account) 4649 2754 Amount of Formal Savings (for those who keep a non-zero balance) 7376 1736
Has a FINO Account 0.87 2926 Amount in FINO Account (for those who have it) 569 2457 Amount in FINO Account (for those who keep a non-zero balance) 1984 704
Has a Formal Savings Account other than FINO 0.57 2926 Has an Account in a Nationalized Bank 0.51 2926 Has an Account with Post Office 0.06 2926 Has an Account in a Private Bank 0.05 2926 Has an Account with NGO 0.02 2926 Has an Account in a Chit Fund 0.01 2926 Has an Account in a Non-Banking Financial Company 0.01 2926
Informal Savings
Informal Savings Amount 619 2928
Has an Informal Savings Device 0.28 2928 Has Savings at Home 0.23 2928 Has Savings with a Self-Help Group 0.02 2928 Has Savings with a Neighbor 0.02 2928 Has Savings with a Friend 0.01 2928 Has Savings with a Shopkeeper 0.01 2928 Has Other Informal Savings 0.01 2928
Notes: Baseline values. Monetary values in Indian Rupees (Rs).

Table 3.A. Descriptive statistics on budgeting quality and interest in financial matters
Mean Values Observations
Budgeting Quality Makes a budget 0.27 2922
Writes the budget (if makes it) 0.05 798 Has been helped by the budget (if makes one) 0.04 798 Is able to stick to the budget (if makes one) 0.03 798
Interest in Financial Matters Is involved in financial matters (Dummy) 0.76 2642
Generally understands loan information (Dummy) 0.52 2630 Generally understands savings information (Dummy) 0.58 2659 Generally understands insurance information (Dummy) 0.62 2726 Actively seeks information about financial topics (Dummy) 0.52 2726

Table 3.B. Descriptive statistics and comparability of our measures of financial knowledge
Understanding of basic economic concepts
Our sample Cole et al. (2011) sample from rural
India
Cole et al. (2011) sample from
Indonesia
Compound interest % Correct 70 % 59 % 78 % % Do not know 15 % 30 % 15 %
Interest rate vs. inflation
% Correct 71 % 25 % 61 % % Do not know 11 % 38 % 16 %
Both questions % Correct on average 71 % 42 % 70 %
Observations 2931 1496 3360
Financial awareness
Our sample Cole et al. (2011) sample from rural
India
Cole et al. (2011) sample from
Indonesia Is one crop safer than multiple crops?
% Correct 31 % 31 % 28 % % Do not know 8 % 6 % 4 %
Observations 2931 1496 3360 Mean in our sample Mean in Carpena et al. (2011) pure
control from urban India Knows to include both income and expenses in HH budget 0.77 0.85
Knows will get money back if bank closes 0.32 0.70 Knows borrowing money for Diwali is unproductive loan 0.70 0.62
All questions, on average 0.58 0.72 Observations 2851 221
Financial attitudes Mean in our sample Mean in Carpena et al. (2011) pure
control from urban India Advice to construction worker 0.66 0.81 Advice to friend with bright child 0.77 0.93 Advice to auto driver about loans 0.40 0.92 Advice about buying a TV 0.84 0.95 All question, on average 0.68 0.90 Observations 2901 221

Table 4. Sample characteristics and balance test
Variables Control Mean
Treatment Mean P value
Gender of hh head (Dummy) 0.71 0.72 0.36 Age of hh head 44.68 45.52 0.2 Whether hh head is illiterate (Dummy) 0.38 0.41 0.32 Whether hh head has primary education (Dummy) 0.18 0.18 0.88 Whether hh head has secondary education (Dummy) 0.26 0.26 0.94 Whether hh head has higher secondary education (Dummy) 0.11 0.10 0.52 Whether religion is Hindu (Dummy) 0.95 0.94 0.77 Whether religion is Muslim (Dummy) 0.05 0.06 0.8 Whether belong to general caste (Dummy) 0.11 0.13 0.63 Whether belong to schedule caste (Dummy) 0.30 0.35 0.16 Whether belong to other backward community (Dummy) 0.54 0.49 0.17 Total number of members in the household 6.74 6.96 0.17 Total number of adults (>=18) 4.03 4.10 0.49 Whether owns land (Dummy) 0.71 0.70 0.9 Size of land owned 21.76 22.26 0.59 Hh income from primary occupation 1019.24 1027.3 0.92 Hh income from primary & secondary occupation 1094.66 1062.5 0.85 Hh income from harvest, livestocks & other sources 821.79 1074.89 0.54 Total hh income 1917.08 2139.72 0.61 Total hh income per capita 287.66 311.43 0.66 Amount of hh expenditures: consumed at home 1542.38 1596.49 0.48 Amount of hh expenditures: consumed outside home 32.83 39.86 0.39 Amount of hh expenditures: cigarette, tobacco, alcohol 68.93 58.75 0.12 Total amount of hh expenditures in last 14 days 1837.52 1708.23 0.39 Number of rooms 3.28 3.21 0.59 Scores for 1st component of full asset list 0.05 -0.05 0.41 Quality of roof 3.5 3.4 0.12 Total number of outstanding formal loans 0.09 0.11 0.09 Total number of outstanding loans 0.5 0.5 0.96 Total outstanding formal loan amount 1640.9 1776.64 0.74 Total outstanding loan amount 4623.28 5053.99 0.61 Index of risk preferences 2.32 2.39 0.23 Discount rate or Index of time preferences 2.84 2.86 0.74 Index of ambiguity preferences 2.11 2.19 0.28

Table 5. Pre and post intervention differences
(1) (2) (3) (4) (5) (6) Pre Intervention Post Intervention Treatm Control Diff Treatm Control Diff Savings
FINO Savings 303.26 324.12 -20.86 180.5 85.37 95.13***
(69) (26.86) Formal Savings
2603.96 2725.83 -121.88 6505.1 5267.4 1237.70* (341.61) (665.07)
Non-FINO Formal Sav.
2172.39 2265.39 -93.01 6263.43 5147.84 1115.59* (301.11) (656.37)
Nationalized Banks Sav.
1938.00 2028.29 -90.29 5348.78 3931.25 1417.53** (302.89) (589.11)
Informal Savings
350.50 333.08 17.42 363.07 375.84 -12.77 (68.17)
(51.43)
Total Savings 2952.45 3055.17 -102.72 6868.17 5643.23 1224.94* (353.16) (675.96)
Savings considering only pure treatment and pure control
FINO Savings 364.91 336.53 28.38 152.8 85.80 67.0**
(99.19) (30.63) Formal Savings
2579.13 2971.29 -392.16 7158.73 5043.47 2115.26** (500.56) (948.5)
Non-FINO Formal Sav.
2089.95 2461.53 -371.58 6936.93 4940.27 1996.66** (447.8) (941.3)
Nationalized Banks Sav.
1854.82 2224.42 -369.6 6165.83 3823.54 2342.29*** (458.22) (865.08)
Informal Savings
385.23 288.04 97.19 353.79 372.08 -18.29 (94.42)
(68.73)
Total Savings 2960.63 3255.58 -294.95 7512.53 5415.55 2096.98** (517.96) (961.78)
Financial literacy Budgeting
Quality 0.26 0.29 -0.031 0.42 0.4 0.015
(0.03) (0.04) Interest in Fin.
Matters 0.41 0.44 -0.03** 0.49 0.48 0.008
(0.02) (0 .01) BasicEconomic Understanding
0.8 0.83 -0.034* 0.64 0.63 0.012 (0.02) (0.02)
Financial Awareness
0.55 0.58 -0.027* 0.58 0.58 -0 .004 (0.01) (0.01)
Financial Attitudes
0.75 0.78 -0.025* 0.60 0.59 0.01 (0.01) (0.01)
Columns (1), (2), (4), and (5) show mean values.

Table 6. Average impacts on savings
(1) (2) (3) (4) (5) (6)
FINO Savings
Formal Savings
Non-FINO Formal Savings
Nationalized Banks
Savings
Informal Savings
Total Savings
Panel A. Intention-To-Treat Estimates Treatment 87.96*** 1681*** 1559** 1392** -13 1647** (28.51) (630.4) (626.8) (570) (50.9) (640.5) Panel B. Instrumental Variable Estimates Attendance 104*** 2000*** 1855** 1650** -15.47 1961*** (33.46) (747.9) (743.4) (672.2) (60.37) (760.1) Observations 2666 2916 2916 2661 2918 2919 R-squared (OLS estimates) 0.02 0.07 0.07 0.08 0.02 0.07 R-squared (IV estimates) 0.03 0.07 0.06 0.08 0.02 0.07 Mean of Endline Variable in the Control Group
85.37 5267.4 5147.84 3931.25 375.84 5643.23
Notes: Standard errors are clustered at the agent/ village level. Controls include the baseline values of the dependent variable and all the variables unbalanced at the baseline: whether the client has at least secondary education, whether the client had a loan, the number of females in the household, whether the client had a non-FINO bank account and the level of overall financial literacy.

Table 7. Average impacts of treatment and post-harvest reminders on savings
(1) (2) (3) (4) (5) (6)
FINO Savings
Formal Savings
non-FINO Formal Savings
Nationalized Banks
Savings
Informal Savings
Total Savings
Only Treatment 65.9** 2734*** 2617*** 2328*** -22.08 2648*** (31.48) (900.0) (904.1) (831.4) (69.34) (914.0)
Treatment and Post-Harvest Reminders
122.1** 1367* 1146 863.0 19.0 1334 (48.47) (810.5) (812.4) (744.6) (77.52) (828.2)
Only Post-Harvest Reminders 8.06 930.3 838.5 588.4 21.23 869.4
(25.11) (808.2) (804.6) (707.0) (67.34) (814.3) Observations 2666 2916 2916 2661 2918 2919 R-squared 0.02 0.07 0.07 0.08 0.02 0.07
Notes: see Table 6.The results refer to the Intention-To-Treat estimates.

Table 8. Average impacts on financial literacy
(1) (2) (3) (4) (5) (6)
Budgeting Quality
Interest in
Financial Matters
Basic Economic
Understanding
Financial Awareness
Financial Attitudes
Financial Knowledge targeted by
the intervention
Panel A. Intention-To-Treat Estimates Treatment 0.022 0.013 0.025 0.002 0.016 0.003 (0.04) (0.01) (0.02) (0.01) (0.01) (0.01) Panel B. Instrumental Variable Estimates Attendance 0.026 0.016 0.03 0.003 0.019* 0.003 (0.05) (0.02) (0.02) (0.01) (0.01) (0.01) Observations 2907 2848 2739 2866 2890 2883 R-squared (OLS estimates) 0.08 0.01 0.04 0.03 0.02 0.02 R-squared (IV estimates) 0.07 0.01 0.04 0.03 0.03 0.02 Mean of Endline Variable in the Control Group
0.4 0.48 0.63 0.58 0.59 0.68
Notes: see Table 6

Table 9. Average impacts on financial literacy for the subsample of clients who answered both the baseline and the endline survey
(1) (2) (3) (4) (5) (6)
Budgeting Quality
Interest in Financial Matters
Basic Economic
Understanding
Financial Awareness
Financial Attitudes
Financial Knowledge targeted by
the intervention
Panel A. Intention-To-Treat Estimates Treatment 0.004 0.019 0.016 -0.005 0.025** 0.0003 (0.05) (0.02) (0.02) (0.01) (0.01) (0.01) Panel B. Instrumental Variable Estimates Attendance 0.004 0.02 0.019 -0.005 0.03** 0.0004 (0.05) (0.02) (0.03) (0.01) (0.01) (0.01) Observations 1584 1554 1508 1565 1576 1574 R-squared (OLS estimates) 0.09 0.02 0.04 0.05 0.04 0.04 R-squared (IV estimates) 0.09 0.02 0.04 0.05 0.04 0.04
Notes: see Table 6

Table 10. Average impacts on financial literacy using the standardized indicators
(1) (2) (3) (4) (5) (6)
Budgeting Quality
Interest in Financial Matters
Basic Economic
Understanding
Financial Awareness
Financial Attitudes
Financial Knowledge targeted by
the intervention
Panel A. Intention-To-Treat Estimates Treatment 0.066 0.068 0.052 0.03 0.09** 0.071 (0.13) (0.06) (0.04) (0.04) (0.04) (0.05) Panel B. Instrumental Variable Estimates Attendance 0.078 0.081 0.062 0.036 0.107** 0.084 (0.15) (0.08) (0.04) (0.04) (0.05) (0.06) Observations 2921 2921 2921 2921 2921 2921 R-squared (OLS estimates) 0.08 0.01 0.04 0.03 0.02 0.03 R-squared (IV estimates) 0.08 0.01 0.04 0.03 0.02 0.03 Mean of Endline Variable in the Control Group 1.25 2.4 1.24 2.23 2.26 3.9
Notes: see Table 6

Table 11. Heterogeneity of impacts on savings for client’s education and baseline financial literacy
(1) (2) (3) (4) (5) (6)
FINO Savings
Formal Savings
Non-FINO Formal Savings
Nationalized Banks
Savings
Informal Savings
Total Savings
Panel 1. Heterogeneous Impacts for Client's Education (At Least Secondary) Treatment 90.12*** 1231** 1120* 868.4* 9.89 1229** (28.50) (589.7) (586.1) (515.9) (52.64) (601.4) Treatm X Education -9.17 1874 1829 2220 -95.73 1747 (55.91) (1605) (1597) (1473) (108.7) (1639) Observations 2666 2916 2916 2661 2918 2919 R-squared 0.02 0.07 0.07 0.08 0.02 0.07 Panel 2. Heterogeneous Impacts for Baseline Financial Literacy Treatment 86.80*** 1720*** 1594** 1439** -18.10 1683** (29.03) (641.1) (636.4) (583.6) (51.64) (652.3) Treatm X Basel Financ Literacy -16.62 499.4 437.3 590.4 -62.31* 428.8 (25.88) (516.4) (506.2) (454.2) (36.62) (523.1) Observations 2666 2916 2916 2661 2918 2919 R-squared 0.02 0.07 0.07 0.08 0.02 0.07
Notes: see Table 6

Table 12. Heterogeneity of impacts on financial literacy for client’s education and baseline financial literacy
(1) (2) (3) (4) (5) (6)
Budgeting Quality
Interest in
Financial Matters
Basic Economic
Understanding
Financial Awareness
Financial Attitudes
Financial Knowledge targeted by
the intervention
Panel 1. Heterogeneous Impacts for Client's Education (At Least Secondary) Treatment 0.099 0.054 0.062 0.053 0.121*** 0.088 (0.13) (0.07) (0.04) (0.04) (0.05) (0.06) Treatm X Education -0.141 0.058 -0.04 -0.093 -0.13* -0.072 (0.23) (0.1) (0.06) (0.08) (0.07) (0.1) Observations 2921 2921 2921 2921 2921 2921 R-squared 0.08 0.01 0.04 0.03 0.03 0.03 Panel 2. Heterogeneous Impacts for Baseline Financial Literacy Treatment 0.064 0.078 0.056 0.027 0.09** 0.07 (0.13) (0.06) (0.04) (0.04) (0.04) (0.05) Treatm X Basel -0.021 0.123** 0.049* -0.044 -0.006 -0.007 Financ Literacy (0.09) (0.05) (0.03) (0.03) (0.03) (0.04) Observations 2921 2921 2921 2921 2921 2921 R-squared 0.08 0.01 0.04 0.03 0.02 0.03
Notes: see Table 6

Table 13. Heterogeneity of impacts on savings for client’s gender and time preferences
(1) (2) (3) (4) (5) (6)
FINO Savings
Formal Savings
Non-FINO Formal Savings
Nationalized Banks
Savings
Informal Savings
Total Savings
Panel 1. Heterogeneous Impacts for Client Gender (Female Dummy) Treatment 65.91** 1703** 1594* 1222 -33.12 1660* (32.59) (835.6) (829.8) (782.6) (63.94) (849.7) Treatm X Female 53.89 -45.34 -76.71 424.1 49.52 -22.85 (34.08) (1060) (1061) (950.9) (83.91) (1076) Observations 2666 2916 2916 2661 2918 2919 R-squared 0.02 0.07 0.07 0.08 0.02 0.07 Panel 2. Heterogeneous Impacts for Time Preferences (Discount Rate) Treatment 143.6** -510.6 -801.8 -566.5 -109.5 -558.5 (59.84) (1281) (1284) (1195) (102.8) (1292) Treatm X Discount Rate -18.90 745.6* 800.0** 677.1** 32.92 753.9* (18.63) (405.4) (400.2) (343.1) (34.73) (412.8) Observations 2633 2877 2877 2626 2879 2879 R-squared 0.02 0.07 0.07 0.08 0.02 0.08
Notes: see Table 6

Table 14. Heterogeneity of impacts on financial literacy for client’s gender and time preferences
(1) (2) (3) (4) (5) (6)
Budgeting Quality
Interest in
Financial Matters
Basic Economic
Understanding
Financial Awareness
Financial Attitudes
Financial Knowledge targeted by
the intervention
Panel 1. Heterogeneous Impacts for Client Gender (Female Dummy) Treatment 0.073 0.066 0.045 0.006 0.055 0.074 (0.15) (0.07) (0.04) (0.04) (0.05) (0.06) Treatm X Female -0.017 0.008 0.018 0.062 0.088 -0.006 (0.17) (0.08) (0.05) (0.06) (0.06) (0.08) Observations 2921 2921 2921 2921 2921 2921 R-squared 0.08 0.02 0.04 0.04 0.03 0.03 Panel 2. Heterogeneous Impacts for Time Preferences (Discount Rate) Treatment -0.448** 0.082 0.046 -0.078 -0.04 -0.077 (0.23) (0.13) (0.07) (0.09) (0.09) (0.11) Treatm X Discount Rate 0.179*** -0.004 0.001 0.035 0.045* 0.05 (0.06) (0.04) (0.02) (0.02) (0.03) (0.03) Observations 2881 2881 2881 2881 2881 2881 R-squared 0.08 0.01 0.04 0.03 0.03 0.03
Notes: see Table 6

Table 15. Heterogeneity of impacts on savings for baseline per capita total expenditures and for whether the client had a non-FINO formal savings account
(1) (2) (3) (4) (5) (6)
FINO Savings
Formal Savings
Non-FINO Formal Savings
Nationalized Banks
Savings
Informal Savings
Total Savings
Panel 1. Heterogeneous Impacts for Baseline Per Capital Total Expenditures Treatment 84.59*** 1287* 1150 1080* -12.66 1256* (28.49) (696.0) (697.3) (643.5) (50.56) (702.2) Treatm X PC Tot Expend 0.01 1.75 1.8 1.49 -0.03 1.72 (0.03) (1.73) (1.8) (1.48) (0.04) (1.73) Observations 2656 2906 2906 2653 2908 2909 R-squared 0.02 0.08 0.07 0.09 0.02 0.08 Panel 2. Heterogeneous Impacts for Whether the Client Had a Non-FINO Formal Savings Account Treatment 68.00* 599.4 591.7 989.9 -52.83 532.2 (35.42) (860.8) (854.2) (718.4) (69.13) (875.1) Treatm X Had Formal Sav Acc 36.30 1949 1744 746.1 71.86 2012* (36.32) (1190) (1177) (1062) (81.84) (1203) Observations 2666 2916 2916 2661 2918 2919 R-squared 0.02 0.07 0.07 0.08 0.02 0.07
Notes: see Table 6

Table 16. Heterogeneity of impacts on financial literacy for baseline per capita total expenditures and for whether the client had a non-FINO formal savings account
(1) (2) (3) (4) (5) (6)
Budgeting Quality
Interest in
Financial Matters
Basic Economic
Understanding
Financial Awareness
Financial Attitudes
Financial Knowledge targeted by
the intervention
Panel 1. Heterogeneous Impacts for Baseline Per Capital Total Expenditures Treatment 0.053 0.055 0.055 0.035 0.118*** 0.087 (0.13) (0.07) (0.04) (0.04) (0.04) (0.05) Treatm X PC Tot Expend 0.0001 0.0001 0.00002 0.00002 -0.0001*** -0.0001 (0.0001) (0.0001) (0.00002) (0.0001) (0.00003) (0.0001) Observations 2911 2911 2911 2911 2911 2911 R-squared 0.08 0.01 0.04 0.03 0.03 0.03 Panel 2. Heterogeneous Impacts for Whether the Client Had Already a Non-FINO Formal Savings Account Treatment 0.103 -0.083 0.065 0.048 0.075 0.143** (0.15) (0.08) (0.04) (0.05) (0.06) (0.062) Treatm X Had Formal -0.067 0.273*** -0.024 -0.031 0.027 -0.131* Sav Acc (0.17) (0.1) (0.05) (0.06) (0.07) (0.07) Observations 2921 2921 2921 2921 2921 2921 R-squared 0.08 0.01 0.04 0.03 0.02 0.03
Notes: see Table 6

Table 17.A. Average impacts on saving controlling for quality of FINO services
(1) (2) (3) (4) (5) (6)
FINO Savings
Formal Savings
non-FINO Formal Savings
Nationalized Banks
Savings
Informal Savings
Total Savings
Panel A. Intention-To-Treat Estimates Treatment 43.53* 1632** 1560** 1443** -14.98 1609** (23.17) (672.2) (667.9) (601.8) (51.15) (686.2) Quality of FINO services 81.80*** 186.5 85.97 60.33 -7.083 181.6 (11.83) (262.7) (255.0) (226.6) (23.49) (269.6) Panel B. Instrumental Variable Estimates Attendance 52.16* 1968** 1880** 1731** -18.07 1941** (27.64) (808.3) (802.8) (718.4) (61.46) (825.4) Quality of FINO services 80.63*** 141.9 43.58 25.63 -6.675 137.9 (11.55) (270.0) (262.5) (231.7) (23.55) (277.1) Observations 2619 2863 2863 2614 2864 2865 R-squared (OLS estimates) 0.06 0.07 0.07 0.08 0.02 0.07 R-squared (IV estimates) 0.07 0.07 0.06 0.08 0.02 0.07
Notes: see Table 6
Table 17.B. Heterogeneity of impacts on FINO saving for FINO agents’ presence
FINO Savings Treatment -0.28 (13.36) Treatm. X FINO agent visited 199.5*** (74.5) FINO agent visited in the last 3 months 203.5*** (42.67) Observations 2666 R-squared 0.11 Notes: see Table 6

Appendix Information Table A1. Non-response rates for the outcome measures showed in Table 5
(1) (2) (3) (4) Pre Intervention Post Intervention Treatm Control Treatm Control Savings FINO Savings 0.03 0.03 0.07 0.05 Formal Savings 0.00 0.00 0.00 0.00 Non-FINO Formal Savings 0.00 0.00 0.00 0.00 Nationalized Banks Savings 0.07 0.05 0.03 0.04 Informal Savings 0.00 0.00 0.00 0.00 Total Savings 0.00 0.00 0.00 0.00 Savings considering only pure treatment and pure control
FINO Savings 0.03 0.03 0.07 0.05 Formal Savings 0.00 0.00 0.00 0.00 Non-FINO Formal Savings 0.00 0.00 0.00 0.00 Nationalized Banks Savings 0.06 0.05 0.03 0.04 Informal Savings 0.00 0.00 0.00 0.00 Total Savings 0.00 0.00 0.00 0.00 Financial literacy Budgeting Quality 0.00 0.00 0.00 0.00 Interest in Financial Matters 0.03 0.02 0.00 0.00 Financial Numeracy 0.06 0.05 0.00 0.01 Financial Awareness 0.02 0.02 0.00 0.00 Financial Attitudes 0.01 0.01 0.00 0.00
Table A2. Attrition
Attrition Treatment -0.007
(0.007)
Observations 3004 R-squared 0.004

Kernel Densities
0.0
5.1
.15
Den
sity
0 5 10 15ln_total_savings_b
pure control pure treatment
kernel = epanechnikov, bandwidth = 0.8541
Baseline Kernel Densities
0.0
5.1
.15
.2D
ensi
ty
0 5 10 15ln_total_savings_e
pure control pure treatment
kernel = epanechnikov, bandwidth = 0.5566
Endline Kernel Densities
0.0
5.1
.15
Den
sity
0 5 10 15ln_total_savings_b
pure control treatment & post-harvest intervention
kernel = epanechnikov, bandwidth = 0.8541
Baseline Kernel Densities
0.0
5.1
.15
.2D
ensi
ty
0 5 10 15ln_total_savings_e
pure control treatment & post-harvest intervention
kernel = epanechnikov, bandwidth = 0.5566
Endline Kernel Densities

Heterogeneity of impacts on financial literacy using the mean value of the indicators Table 12.B. Heterogeneity of impacts on financial literacy for client’s education and baseline
financial literacy
(1) (2) (3) (4) (5) (6)
Budgeting Quality
Interest in
Financial Matters
Basic Economic
Understanding
Financial Awareness
Financial Attitudes
Financial Knowledge targeted by
the intervention
Panel 1. Heterogeneous Impacts for Client's Education (At Least Secondary) Treatment 0.031 0.01 0.029 0.005 0.02* 0.002 (0.04) (0.01) (0.02) (0.01) (0.01) (0.01) Treatm X Education -0.037 0.012 -0.014 -0.01 -0.015 0.002 (0.07) (0.02) (0.033) (0.02) (0.02) (0.02) Observations 2907 2848 2739 2866 2890 2883 R-squared 0.08 0.01 0.04 0.03 0.03 0.02 Panel 2. Heterogeneous Impacts for Baseline Financial Literacy Treatment 0.022 0.014 0.024 0.002 0.017* 0.003 (0.04) (0.01) (0.018) (0.01) (0.01) (0.01) Treatm X Basel -0.002 0.029*** 0.03** -0.013 0.002 -0.003 Financ Literacy (0.03) (0.01) (0.014) (0.01) (0.01) (0.01) Observations 2907 2848 2739 2866 2890 2883 R-squared 0.08 0.01 0.04 0.03 0.02 0.02
Notes: see Table 6

Table 14.B. Heterogeneity of impacts on financial literacy for client’s gender and time preferences
(1) (2) (3) (4) (5) (6)
Budgeting Quality
Interest in
Financial Matters
Basic Economic
Understanding
Financial Awareness
Financial Attitudes
Financial Knowledge targeted by
the intervention
Panel 1. Heterogeneous Impacts for Client Gender (Female Dummy) Treatment 0.025 0.014 0.018 -0.004 0.012 0.002 (0.05) (0.013) (0.021) (0.01) (0.01) (0.01) Treatm X Female -0.006 -0.002 0.018 0.017 0.011 0.002 (0.05) (0.02) (0.03) (0.02) (0.02) (0.01) Observations 2907 2848 2739 2866 2890 2883 R-squared 0.08 0.01 0.04 0.03 0.03 0.02 Panel 2. Heterogeneous Impacts for Time Preferences (Discount Rate) Treatment -0.132* 0.022 0.032 -0.022 -0.027 -0.018 (0.07) (0.03) (0.04) (0.02) (0.02) (0.02) Treatm X Discount Rate 0.054** -0.003 -0.003 0.008 0.015** 0.007 (0.02) (0.01) (0.01) (0.01) (0.01) (0.01) Observations 2867 2812 2711 2830 2854 2846 R-squared 0.08 0.01 0.04 0.03 0.03 0.02
Notes: see Table 6

Table 16.B. Heterogeneity of impacts on financial literacy for baseline per capita total expenditures and for whether the client had a non-FINO formal savings account
(1) (2) (3) (4) (5) (6)
Budgeting Quality
Interest in
Financial Matters
Basic Economic
Understanding
Financial Awareness
Financial Attitudes
Financial Knowledge targeted by
the intervention
Panel 1. Heterogeneous Impacts for Baseline Per Capital Total Expenditures Treatment 0.018 0.011 0.026 0.001 0.024** 0.003 (0.04) (0.01) (0.02) (0.01) (0.01) (0.007) Treatm X PC Tot Expend 0.00002 0.00001 -0.0 0.00001 -0.00003*** 0.0 (0.00004) (0.00001) (0.00001) (0.00001) (0.00001) (0.00001) Observations 2897 2838 2732 2857 2880 2874 R-squared 0.08 0.01 0.04 0.03 0.03 0.02 Panel 2. Heterogeneous Impacts for Whether the Client Had Already a Non-FINO Formal Savings Account Treatment 0.03 -0.019 0.032 0.008 0.01 0.014 (0.05) (0.02) (0.02) (0.01) (0.01) (0.01) Treatm X Had Formal -0.014 0.057*** -0.013 -0.011 0.01 -0.02* Sav Acc (0.055) (0.02) (0.03) (0.02) (0.02) (0.01) Observations 2907 2848 2739 ,866 2890 2883 R-squared 0.08 0.01 0.04 0.03 0.02 0.02
Notes: see Table 6

MINISTRY OF FINANCE OF THE RUSSIAN FEDERATION
The Russia Financial Literacy and Education Trust Fund was established in 2008 at the World
Bank with funding provided by the Ministry of Finance of the Russian Federation. The work
supported by the Trust Fund is jointly managed by the World Bank and the Organisation for
Economic Co‑operation and Development (OECD) and is directed toward improving public
policies and programs to enhance financial knowledge and capabilities in low‑ and middle‑
income countries. This effort has focused on the review of national strategies for financial
education, the development of methods for the measurement of financial knowledge and
capabilities, methods for evaluating the impact and outcome of programs, and research
applying these methods to programs in developing countries. The products of this program of
work can be found at the Trust Fund website at:
www.finlitedu.org