improving the quality of multi-resolution volume renderingtorsten/publications/papers/ev06-1.pdf ·...
TRANSCRIPT

Eurographics/ IEEE-VGTC Symposium on Visualization (2006)Thomas Ertl, Ken Joy, and Beatriz Santos (Editors)
Improving the Quality of Multi-resolution Volume Rendering
H. Younesy 1 and T. Möller 1 and H. Carr 2
1Graphics, Usability and Visualization Lab (GrUVi), Simon Fraser University, Vancouver, Canada2University College, Dublin, Ireland.
AbstractWe propose a novel method to improve the quality of multi-resolution visualizations. We reduce aliasing artifactsby approximating the data distribution with a Gaussian basis function at each level of detail for more accuraterendering at coarser levels of detail. We then show an efficient implementation of our novel Gaussian basedapproximation scheme and show its superiority using numerical tests and compelling renderings.
Categories and Subject Descriptors (according to ACM CCS): I.3.6 [Computing Methodologies]: Computer Graph-ics - Methodology and Techniques E.1 [Data]: Data Structures
1. Introduction
Visualizing scientific and medical volumetric data continuesto require processing ever larger data sets. Many algorithmshave been proposed for optimizing performance, especiallyfor datasets too large to fit in main memory. Such datasets arecommonly visualized with hierarchical rendering algorithmsbased on multi-resolution representation of the data, tradingoff image quality against rendering speed.
Although image quality is implicitly balanced against ren-dering speed, few authors have addressed the question ofmulti-resolution image quality, i.e. the quality of the im-ages rendered at coarser levels of resolution. In this paper,we address this question by using statistical information todecrease aliasing artifacts in direct volume rendering.
Conventional multiresolution algorithms downsamplevoxel opacities with the mean value of all high resolutionvoxels that contribute to each low resolution voxel. Espe-cially for transfer functions with relatively narrow domains,this causes features visible at high resolution to disappear,blur or deform in low resolution images. Our first contri-bution is therefore to demonstrate how these defects can bereduced by storing statistical information such as histogramsin the multi-resolution data structure.
However, histograms are sufficiently expensive that theynegate most of the advantage of the multi-resolution repre-sentation, so our second contribution is to demonstrate thata simple Gaussian distribution, stored as mean and standarddeviation, can significantly improve image quality at little or
no additional cost in memory or rendering time. We do so bydescribing a novel approach that efficiently combines Gaus-sian distributions with transfer functions to generate outputcolors and opacities.
The remainder of this paper is organized as follows: Aftera review of related work in Section 2 we present the detailsof our method and the Gaussian basis transfer function inSection 3. Experimental results are discussed in Section 4,followed by conclusions and future work in Section 5.
2. Related Work
Since it is not always possible to interactively processdata in the original sampling resolution, level of detailand multi-resolution techniques have been proposed bymany researchers to balance between architectural con-straints (e.g. performance and memory) and fidelity. Multi-resolution techniques have been employed in a variety ofvisual data representation approaches including geometricrendering [WG92, CDL∗96, LWC∗02] and volumetric datavisualization [LHJ99] especially for out-of-core applica-tions [SCM99].
Multi-resolution volume rendering techniques generallyuse spatial hierarchies to represent different levels of detail.Often the goal is to maintain a specific frame-rate [LS02] atthe expense of image quality. The quality of the image canthen be updated when user interaction stops using techniquessuch as progressive refinement [LH91, PPL∗99, RYL∗96].
Most hierarchical multi-resolution schemes use the mean
c© The Eurographics Association 2006.

H. Younesy & T. Möller & H. Carr / Improving the Quality of Multi-resolution Volume Rendering
values of the underlying function values in order toconstruct the representations in different levels of de-tail. Notable exceptions are wavelet-based multi-resolutionschemes [GLDH97, HVU98], which use better filteringmethods to improve the quality of lower levels of the multi-resolution hierarchy. In particular, Guthe et al. [GWGS02,GW04] use a block based wavelet compression and em-ploy graphics hardware to handle large datasets at interactivespeed. Kraus et al. [KE01] use a topology guided downsam-pling to preserve topology of a scalar volume field in coarselevels of detail.
Some of the proposed multi-resolution hierarchies for vol-ume rendering also address the underlying transfer functionbeing used during the rendering. Ljung et al. [LLYM04] usea level-of-detail scheme, selecting the appropriate level ofdetail during data decompression using information from thetransfer function being applied. Wittenbrink et al. [WMG98]have shown that interpolation of the underlying functionbefore the application of a transfer function is of utmostimportance in order to assure the best quality. Röttger etal. [RKE00, RE02] have since shown that the application ofa transfer function to the underlying scalar data can createarbitrarily high frequencies, making it difficult to render thedata properly. To address this, they proposed pre-integratedvolume rendering to minimize the impact of the modulationof the underlying signal by the transfer function.
Other related work deals with the quality and propersampling in the volume rendering pipeline. Mueller etal. [MMI∗98] combine elliptical Gaussian reconstructionkernels with a Gaussian low-pass filter to reduce the alias-ing artifacts in volume splatting. Zwicker et al. [ZPvBG02]extends this idea to point-based data. For a high-qualitytexture-based volume rendering, Engel et al. [EKE01] avoidadditional slices by integrating non-linear transfer functionsin a pre-processing step known as pre-integrated volume ren-dering.
However, none of these approaches has dealt explicitlywith the proper use of transfer functions nor exploited theunderlying distribution of the function values to improve im-age quality. This paper therefore proposes a novel methodthat improves the quality of multi-resolution rendering byapproximating the distribution of function values at coarselevels of detail.
3. Rendering
Given a desired level of performance, hierarchical renderinguses criteria such as viewing distance [WWHW97], projec-tion area [LS02] and gaze distance [LW90] to identify thelevel of detail at which the data must be rendered. At a givenlevel of detail, one should ideally produce the highest pos-sible image quality for a given performance cost. To under-stand how to do so, we consider the theoretical implicationsof multi-resolution downsampling, then develop a methodthat significantly reduces image artifacts.
3.1. Accurate Multi-resolution Transfer Functions
In general, hierarchical rendering decreases rendering timeby substituting a small data set downsampled from the fulldata set. This tends to result in aliasing problems such asthe “jaggies" and discontinuities visible in Figure 2, causedby the loss of detail information during construction of themulti-resolution representation. In particular, information islost because the data in a subvolume is represented by themean of the samples in the subvolume. This mean value rep-resents the data values well if they form smooth regions withlittle variance, but data sets often display their most interest-ing behaviour near sharp gradients for which the mean aloneis not a good summary of a subvolume. This causes drasticproblems in the resulting images because the transfer func-tion often does not have a smooth transition between colorsand opacities for different values. More sophisticated sum-maries of the subvolume can, however, be substituted for themean, and this idea forms the basis of our approach.
As an example, consider a subvolume with values{1,1,1,1,5,5,5,5} and mean µ = 3 and suppose V (x) is atransfer function which maps real numbers to color values.Unless V (3), the color specified in the transfer function for3, is near to the color produced by blending V (1) and V (5),the summary information will misrepresent the data in thefinal visual image.
For simplicity, we develop notation in one dimension:higher dimensions are essentially identical, but with densernotation (i.e. integration along three dimensions). Assumethat the scalar field to be visualized is f (x), and that thesample points xi are evenly spaced: i.e. that f (xi) = f (iT )for some sampling distance T . For convenience, we use fi torefer to f (xi).
Typically, the transfer function V is a vector-valued func-tion mapping input data values to output colors and opacity.We write this transfer function as V : IR→ (R,G,B,α), whereR,G,B,α are respectively red, green, blue and opacity, andstate the rendering task in terms of visualizing V ( f (x)), ofwhich we only know the values V ( fi). A proper coarse vi-sualization of this discrete dataset would involve smoothingV ( f (x)) with a low-pass filter in order to avoid aliasing, thensub-sampling. For level n in the multi-resolution hierarchy,this can be written as:
Vn+1( f (y)) =∫ ∞
−∞Vn( f (y− x))w(x)dx (1)
where
f (x) =∞
∑k=−∞
f (k)h(x− k) (2)
where w is the (continuous) low-pass filter used for comput-ing the (n+1)st level of the multi-resolution pyramid and his a (continuous) interpolation filter used to reconstruct theunderlying function f from its discrete representation. Theimportance of Equation 2 in volume rendering has been welldocumented by Wittenbrink et al. [WMG98].
c© The Eurographics Association 2006.
H. Younesy & T. Möller & H. Carr / Improving the Quality of Multi-resolution Volume Rendering
The formulation in Equation 1 is not particularly useful,as it requires recomputing the multi-resolution pyramid af-ter each change of the transfer function V . A more usefulformulation of Equation 1 derives from the sifting propertyof the Dirac delta function δ [Bra99]:
Vn+1( f (y)) =∫ ∞
−∞
∫ ∞
−∞Vn(s)δ (s− f (y− x))w(x)dsdx (3)
=∫ ∞
−∞Vn(s)
(
∫ ∞
−∞δ (s− f (x))w(y− x)dx
)
ds
=∫ ∞
−∞Vn(s)
(
∫
f−1(s)w(y− x)dx
)
ds (4)
, where∫
f−1(s) is the integral over the inverse image f −1(s)of the isovalue s.
If w is a box filter with support of size N, then∫
f−1(s) w(y−x)dx is equivalent to 12N
∫
f−1(s)|[y−N,y+N] dx, i.e.the restriction of the integral to the support of the filter.
In the discrete case with a box filter, this distributionis merely the histogram of a local neighborhood of f (y)weighted by 1/2N: the histogram therefore also has supportof size 2N.
Regardless of the low-pass filter chosen,∫
f−1(s) w(y −x)dx is the weighted distribution of f in the support of thefilter w, and the discrete version is the weighted histogram off in the support of w. Thus, for any low-pass filter w, we canguarantee accuracy of low-resolution images within the lim-its of reconstruction by storing Hw(s,y) =
∫
f−1(s) w(y−x)dxfor each location y, where Hw is the weighted histogram cen-tered at y. Note that all our histograms are local, i.e. they col-lect statistics about the underlying function f in the neigh-borhood of y. If we were to store these weighted histogramsat each multi-resolution node, we would then compute thevalue at this node Vn+1( f (y)) in the following way:
Vn+1( f (y)) =∫ ∞
−∞Vn(s)Hw(s,y)ds (5)
This allows us to represent our function in a multi-resolution pyramid with proper anti-aliasing and withouta priori knowledge of the transfer function. For multi-dimensional transfer functions we would use a multi-dimensional histogram, which can be derived using a multi-dimensional delta function in Equation 1.
3.2. Discretizing the Local Histograms
While the above equations were derived on the assumptionof continuity, we normally work with discrete representa-tions and discrete histograms. We therefore need to approx-imate f (s) at a resolution dependent on the transfer func-tion to assure that V ( f (s)) is sampled above the Nyquist fre-quency. This is still an open problem: no algorithm is knownto determine such a sampling frequency accuractly. Only anapproxiamte upper bound has been determined [Kra03]. Weleave this problem open, and work with the same sampling
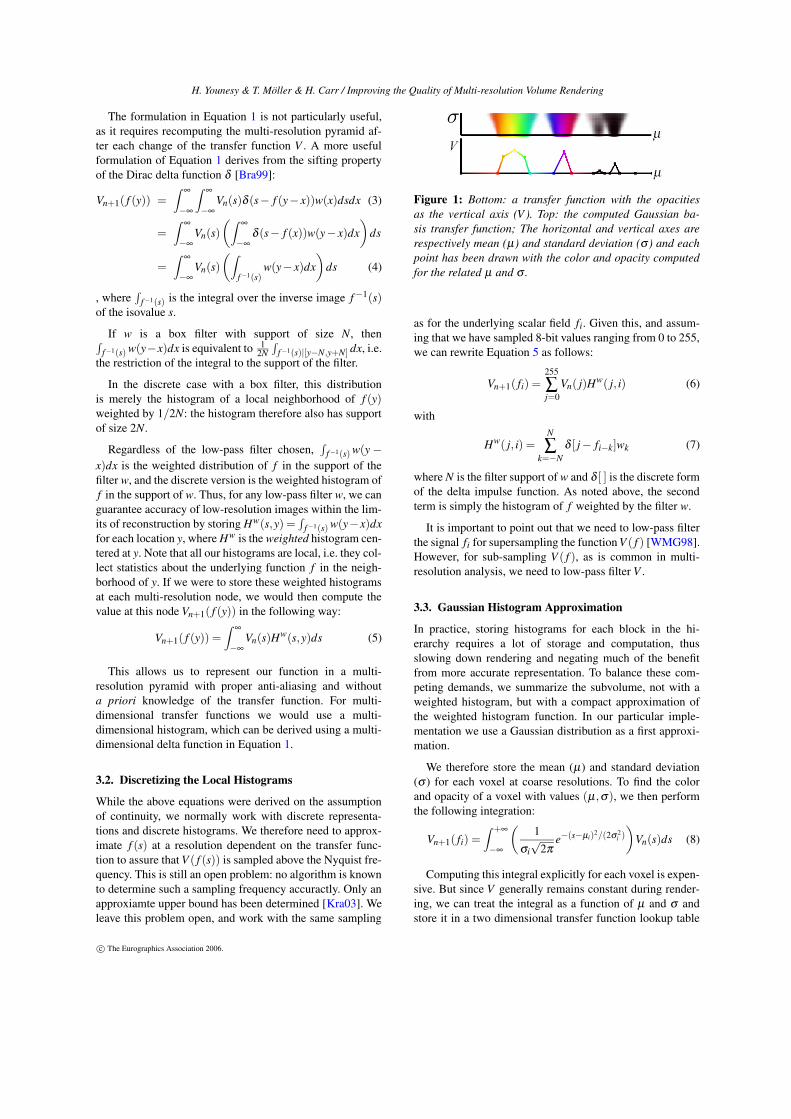
Figure 1: Bottom: a transfer function with the opacitiesas the vertical axis (V ). Top: the computed Gaussian ba-sis transfer function; The horizontal and vertical axes arerespectively mean (µ) and standard deviation (σ ) and eachpoint has been drawn with the color and opacity computedfor the related µ and σ .
as for the underlying scalar field fi. Given this, and assum-ing that we have sampled 8-bit values ranging from 0 to 255,we can rewrite Equation 5 as follows:
Vn+1( fi) =255
∑j=0
Vn( j)Hw( j, i) (6)
with
Hw( j, i) =N
∑k=−N
δ [ j− fi−k]wk (7)
where N is the filter support of w and δ [ ] is the discrete formof the delta impulse function. As noted above, the secondterm is simply the histogram of f weighted by the filter w.
It is important to point out that we need to low-pass filterthe signal fi for supersampling the function V ( f ) [WMG98].However, for sub-sampling V ( f ), as is common in multi-resolution analysis, we need to low-pass filter V .
3.3. Gaussian Histogram Approximation
In practice, storing histograms for each block in the hi-erarchy requires a lot of storage and computation, thusslowing down rendering and negating much of the benefitfrom more accurate representation. To balance these com-peting demands, we summarize the subvolume, not with aweighted histogram, but with a compact approximation ofthe weighted histogram function. In our particular imple-mentation we use a Gaussian distribution as a first approxi-mation.
We therefore store the mean (µ) and standard deviation(σ ) for each voxel at coarse resolutions. To find the colorand opacity of a voxel with values (µ,σ), we then performthe following integration:
Vn+1( fi) =∫ +∞
−∞
(
1σi√
2πe−(s−µi)
2/(2σ 2i )
)
Vn(s)ds (8)
Computing this integral explicitly for each voxel is expen-sive. But since V generally remains constant during render-ing, we can treat the integral as a function of µ and σ andstore it in a two dimensional transfer function lookup table
c© The Eurographics Association 2006.
H. Younesy & T. Möller & H. Carr / Improving the Quality of Multi-resolution Volume Rendering
whose indices are the mean isovalue and the standard de-viation. Each time the user changes the transfer function,we update the lookup table, which takes a few millisec-onds. Figure 1 shows a sample transfer function (bottom)and the computed transfer function based on the Gaussianbasis function (top). For the top transfer function, pointshave been drawn with the color and opacity computed forthe related µ and σ .
We note that the Gaussian method may fail to approximatehistogram distributions properly if they have more than onemajor maximum (peak). This typically happens at the bor-der between a sampled phenomenon and empty space in thevolume. One solution for this case would be to use morethan one Gaussian function for approximating the distribu-tions when the error of a single Gaussian approximation isnot negligible, but we restrict ourselves to a single distri-bution for efficiency. Although this paper does not addressthis approach, we use a straight forward method to solve theproblem of the empty regions, by not considering the vox-els in empty spaces (voxels that are always set to have zeroopacity) in calculating µ and σ .
4. Implementation and Results
Our goal in this work was to provide higher-quality volumerenderings at coarse resolutions of a multi-resolution dataset.We identified five principal factors affecting the image qual-ity: the type of data visualized, the simplification level of thedata, the downsampling filter chosen during simplification,the statistical information retained at various levels of down-sampling, and the type of transfer function chosen.
The data sets we chose as representative of different do-mains were a synthetic dataset (sphere), a medical dataset(Visible Human Male), and a fluid dynamics simulationdataset (Richtmyer-Meshkov). The synthetic dataset is aspherical distance function sampled at a resolution of 2563,while the medical dataset is the visible human male head CTdataset with a resolution of 512× 512× 512, and the sim-ulation dataset is one frame (frame 250) of the Richtmyer-Meshkov instability dataset from Lawrence Livermore Na-tional Laboratory with a resolution of 2048×2048×1920.
Although we wanted to use the full resolution of thesedatasets, the memory requirements of storing a histogramper each voxel in the coarse resolutions, precluded full com-parisons for data sets larger than 643. Moreover, by choosingthe coarsest levels of simplification, the characteristic visualartifacts were more visible. We therefore chose the four lev-els of simplification between 643 and 83.
For statistical information, we rendered our images withfull histogram in each voxel (the best statistical informa-tion available), with the Gaussian distribution proposed inthis paper, and with the conventional mean value. We chosethree different filters (box, tent and cubic) to compare their
effects on the output. Finally, we chose two transfer func-tions that oscillated between red, green and blue, one at highfrequency, the other at low frequency, to emphasize the ef-fects of sample distribution in the subsampled data.
Figures 2 - 4 show some of the images that we generated,chosen to illustrate the effects of the various choices. Fig-ure 2 shows the effects of the Gaussian and mean distribu-tions on the visible male head data set at full resolution (i.e.2563). Images using the histogram were not computed dueto memory limitations, and a typical transfer function waschosen for displaying bone and other features.
As we can see from Figure 2, the Gaussian distributiondoes a better job of preserving features such as the diagonalline across the skull and the locations and shape of the eyesockets and mouth. And, at the coarsest level of resolution,the mean distribution generates curious colour artifacts dueto ramps in the transfer function, while the Gaussian distri-bution does not. This disparity between Gaussian distribu-tion and mean value was also visible across all resolutions,filters, transfer functions and datasets. We have omitted dis-playing all of our images, for clarity and to conserve space.
Figure 3 shows the effects of using different downsam-pling filters to reduce the Richtmyer-Meshkov data set from643 down to 163 using a high frequency transfer functionwhich oscillates from red to green to blue. We note that thehistogram distribution gives a result that is quite close tothe 643 resolution, no matter what filter is used, althoughblurring is apparent. Using mean distribution results in thecolours that are sometimes unrelated to any of the samples inthe block, leading to the artifacts shown, while the Gaussiandistribution does a better job of approximating the correctintegral values.
Similarly, Figure 4 shows the effects of different transferfunctions at the two lowest resolution levels in the sphericaldata set. For a high-frequency transfer function, the correctimage is of thin concentric shells of red, green and blue. Acorrect image will involve a fairly uniform mixture of red,green and blue throughout the volume: i.e. the grey tonesvisible in the histogram distribution images. However, forthe mean distribution, the effect of the multi-resolution rep-resentation is to sample a single opacity for each sub-block,resulting in the color artifacts visible in this figure. Again,the Gaussian distribution, while not eliminating these arti-facts entirely, is much more satisfactory.
In comparison, the right two columns of Figure 4 depictthe low-frequency transfer function and the obtained im-ages show a set of thick concentric spheres of slowly vary-ing color. Even at coarse resolutions, we expect that thesespheres will be distinguishable, and from the figure we seethat this is indeed the case. In this case, the artifacts gen-erated by the mean distribution are less prominent, but stillvisible, while the Gaussian distribution is nearly as good asthe histogram distribution.
c© The Eurographics Association 2006.

H. Younesy & T. Möller & H. Carr / Improving the Quality of Multi-resolution Volume Rendering
Resolution Histogram Gaussian/ MeanMean (Unpacked) (Packed)
2563 - 77.2MB 58.5MB1283 3.6GB 9.7MB 7.3MB643 460MB 1.3MB 920KB
Table 1: Storage requirement for each distribution.
In addition to visual comparison, we evaluated our resultsanalytically by computing the root mean squared error be-tween the approximated distribution of f for each voxel andthe histogram distribution for the same voxel. This measuresthe error induced in f by our approximation before applyingthe transfer function. Although we plotted these errors for allof the images we generated, the plots consistently showedthat Gaussian distributions had consistently smaller errors,and Figure 5(a) may be taken as representative.
As Figure 5(a) shows, the error of the Gaussian distribu-tion was consistently less than the error of the mean approxi-mation at each level of resolution, with the error diminishingunder the Gaussian distribution as the resolution was coars-ened further. This occurs because the downsampled vox-els represent progressively more of the original data, witha Gaussian distribution becoming a better fit to the data asmore samples accumulate. Although different low-pass fil-ters affect the visual quality at coarser levels of detail (cubicis better than linear, and linear better than box), it does nothave a major effect on the approximation errors. This is be-cause the filters do not necessarily cause the histograms tobecome closer to Gaussian distributions.
We also computed root mean square error between the im-ages produced with histogram distribution and images pro-duced with Gaussian and mean distributions. This gives ameasure of image error after applying transfer functions andfilters. We computed the RGBA color of each voxel usingthe Gaussian approximation and mean approximation andcompared it to the color when using the full histogram dis-tribution for that voxel, averaging the root mean squared er-rors of red, green, blue and alpha components. A perceptualcolor space such as CIE Lab might be a better basis for aninsightful comparison. Figure 5(b) and Figure 5(c) respec-tively show the error in rendered images for different filtersand for different transfer functions.
Again, in these plots similar to the rendered figures, theaverage error of rendering is consistently less for the Gaus-sian distribution than the mean distribution. It is interestingto note that the actual downsampling filter is less significantthan the statistical information chosen to represent the func-tion.
4.1. Memory and storage overhead
We expected that encoding the standard deviation values foreach voxel would add around 33% (1-byte σ added to 1-byte µ + 2-bytes gradient) overhead in terms of memoryand processing power. Surprisingly there was no significantmemory or processing overhead, presumably due to com-piler optimization of data structures. Since voxel values (1byte mean) and normals (2 bytes) are word aligned to 4bytes by the compiler, adding the standard deviation (1 byte)adds no memory overhead in practice. During volume ren-dering, voxel color was determined by a look up to a tableindexed by discretized µ and σ . The look up table is com-puted once at a negligible cost each time user changes thetransfer function. The result of this was that we did not no-tice any slowdown due to our algorithm. We did consider notpacking our data structures to achieve a storage reductionof 20%, but found that the additional overhead for runtimeword alignment offsetted this, and reverted to an unpackedformat. Table 1 shows the storage requirement to keep themulti-resolution information for each distribution.
5. Conclusion and future work
In this paper we have developed a mathematical frameworkfor improving multi-resolution image quality based on trans-fer functions applied to scalar data. Using a Gaussian basisto approximate the data distribution at each level of detail,rather than the commonly used mean approximation, we areable to composite color more accurately and reduce aliasingartifacts. Our methods allow any low-pass filter to be ap-plied to build the multi-resolution pyramid without a-prioriknowledge of the transfer function.
In future we would like to extend our framework to visu-alize multi-modal and time-varying datasets, and considerthe effect of an adaptive approximation scheme with dif-ferent function bases for better approximation at differentlevels of detail of different datasets. We would expect toapply the work of Drew et al. [DWL98] with the SingularValue Decomposition of a wavelet-compressed histogram.We are also investigating possible ways to include gradientsand other derived information in our current transfer func-tion scheme.
References
[Bra99] BRACEWELL R.: The Fourier Transform and ItsApplications, 3rd ed. McGraw-Hill, 1999. 3
[CDL∗96] CHAMBERLAIN B., DEROSE T., LISCHINSKI
D., SALESIN D., SNYDER J.: Fast rendering of com-plex environments using a spatial hierarchy. In GI ’96:Proceedings of the Conference on Graphics Interface ’96(1996), pp. 132–141. 1
[DWL98] DREW M. S., WEI J., LI Z.-N.: Illumination–invariant color object recognition via compressed chro-
c© The Eurographics Association 2006.

H. Younesy & T. Möller & H. Carr / Improving the Quality of Multi-resolution Volume Rendering
maticity histograms of color–channel–normalized im-ages. In ICCV98 (1998), IEEE, pp. 533–540. 5
[EKE01] ENGEL K., KRAUS M., ERTL T.: High-quality pre-integrated volume rendering using hardware-accelerated pixel shading. In HWWS ’01: Proceedingsof the ACM SIGGRAPH/EUROGRAPHICS workshop onGraphics hardware (2001), pp. 9–16. 2
[GLDH97] GROSS M. H., LIPPERT L., DITTRICH R.,HÄRING S.: Two methods for wavelet-based volume ren-dering. Computers & Graphics 21, 2 (1997), 237–252.2
[GW04] GUTHE S., WAND M.: Advanced techniques forhigh-quality multi-resolution volume rendering. Comput-ers and Graphics 28, 1 (2004). 2
[GWGS02] GUTHE S., WAND M., GONSER J.,STRASSER W.: Interactive rendering of large vol-ume data sets. In In Proceedings of IEEE Visualization2002 (2002), pp. 53–59. 2
[HVU98] HORBELT S., VETTERLI M., UNSER M.:High-quality wavelet splatting for volume rendering.In Wavelet Applications Workshop (Monte Verità TI,Switzerland, September 28-October 2, 1998). 2
[KE01] KRAUS M., ERTL T.: Topology-guided down-sampling. In Proceedings of International Workshop onVolume Graphics ’01 (2001), pp. 139–147. 2
[Kra03] KRAUS M.: Direct Volume Visualization of Geo-metrically Unpleasant Meshes. PhD thesis, University ofStuttgart, 2003. 3
[LH91] LAUR D., HANRAHAN P.: Hierarchical splat-ting: a progressive refinement algorithm for volume ren-dering. In SIGGRAPH ’91: Proceedings of the 18th An-nual Conference on Computer Graphics and InteractiveTechniques (1991), pp. 285–288. 1
[LHJ99] LAMAR E., HAMANN B., JOY K. I.: Multireso-lution techniques for interactive texture-based volume vi-sualization. In Proceedings of the Conference on Visual-ization ’99 (1999), pp. 355–361. 1
[LLYM04] LJUNG P., LUNDSTRÖM C., YNNERMAN A.,MUSETH K.: Transfer function based adaptive decom-pression for volume rendering of large medical data sets.In Proceedings of IEEE Symposium on Visualization andGraphics 2004 (2004), pp. 25–32. 2
[LS02] LI X., SHEN H.-W.: Time-critical multiresolutionvolume rendering using 3D texture mapping hardware. InProceedings of the 2002 IEEE Symposium on Volume Vi-sualization and Graphics (Piscataway, NJ, USA, 2002),IEEE Press, pp. 29–36. 1, 2
[LW90] LEVOY M., WHITAKER R.: Gaze-directed vol-ume rendering. In SI3D ’90: Proceedings of the 1990Symposium on Interactive 3D Graphics (1990), pp. 217–223. 2
[LWC∗02] LUEBKE D., WATSON B., COHEN J. D.,REDDY M., VARSHNEY A.: Level of Detail for 3DGraphics. Elsevier Science Inc., New York, NY, USA,2002. 1
[MMI∗98] MUELLER K., MÖLLER T., II J. E. S.,CRAWFIS R., SHAREEF N., YAGEL R.: Splatting errorsand antialiasing. IEEE Transactions on Visualization andComputer Graphics 4, 2 (1998), 178–191. 2
[PPL∗99] PARKER S., PARKER M., LIVNAT Y., SLOAN
P.-P., HANSEN C., SHIRLEY P.: Interactive ray tracingfor volume visualization. IEEE Transactions on Visual-ization and Computer Graphics 5, 3 (1999), 238–250. 1
[RE02] RÖTTGER S., ERTL T.: A two-step approach forinteractive pre-integrated volume rendering of unstruc-tured grids. In Proceedings of the 2002 IEEE Symposiumon Volume Visualization and Graphics (2002), pp. 23–28.2
[RKE00] RÖTTGER S., KRAUS M., ERTL T.: Hardware-accelerated volume and isosurface rendering based oncell-projection. In Proceedings of IEEE Visualization2000 (2000), pp. 109–116. 2
[RYL∗96] REED D. M., YAGEL R., LAW A., SHIN P.-W., SHAREEF N.: Hardware assisted volume renderingof unstructured grids by incremental slicing. In Proceed-ings of the 1996 IEEE Symposium on Volume Visualiza-tion (Piscataway, NJ, USA, 1996), IEEE Press, pp. 55–ff.1
[SCM99] SHEN H.-W., CHIANG L.-J., MA K.-L.: A fastvolume rendering algorithm for time-varying fields usinga time-space partitioning (TSP) tree. In Proceedings ofIEEE Visualization ’99 (1999), pp. 371–377. 1
[WG92] WILHELMS J., GELDER A. V.: Octrees for fasterisosurface generation. ACM Transactions on Graphics 11,3 (July 1992), 201–227. 1
[WMG98] WITTENBRINK C. M., MALZBENDER T.,GOSS M. E.: Opacity-weighted color interpolation forvolume sampling. In Proceedings of the 1998 IEEE Sym-posium on Volume Visualization (New York, NY, USA,1998), ACM Press, pp. 135–142. 2, 3
[WWHW97] WATSON B., WALKER N., HODGES L. F.,WORDEN A.: Managing level of detail through periph-eral degradation: effects on search performance with ahead-mounted display. ACM Transactions on Computer-Human Interaction 4, 4 (1997), 323–346. 2
[ZPvBG02] ZWICKER M., PFISTER H., VAN BAAR J.,GROSS M.: Ewa splatting. IEEE Transactions on Visu-alization and Computer Graphics 8, 3 (2002), 223–238.2
c© The Eurographics Association 2006.

H. Younesy & T. Möller & H. Carr / Improving the Quality of Multi-resolution Volume Rendering
Figure 2: Renderings of the Visible Human Male Head (2563) at different levels of details. Top row: using mean value forapproximation. Bottom row: using Gaussian function for approximation. From left to right, each image represents an additionallevel of coarsening by a factor of two in each dimension.
Histogram
Gaussian
Mean
643 163 Box Low-Pass Filter 163 Tent Low-Pass Filter 163 Cubic Low-Pass Filter
Figure 3: Effects of downsampling distributions with different filters on the Richtmyer-Meshkov Instability dataset.
c© The Eurographics Association 2006.

H. Younesy & T. Möller & H. Carr / Improving the Quality of Multi-resolution Volume Rendering
Histogram
Gaussian
Mean
323 High-Frequency 163 High-Frequency 323 Low-Frequency 163 Low-Frequency
Figure 4: Rendering with different transfer functions on the spherical distance dataset.
0 1 2 3 40
5
10
15
20
Level of Coarsening
App
roxi
mat
ion
Err
or (%
)
Sphere − MeanSphere − GaussianHead − MeanHead − GaussianInstability − MeanInstability − Gaussian
(a) Histogram Approximations Errors
0 1 2 3 40
20
40
60
80
100
Level of Coarsening
App
roxi
mat
ion
Err
or (%
)
Mean − BoxMean − TentMean − CubicGaussian − BoxGaussian − TentGaussian − Cubic
(b) Effect of Filters
0 1 2 3 40
20
40
60
80
100
Level of Coarsening
App
roxi
mat
ion
Err
or (%
)
High−Freg − MeanHigh−Freq − GaussianLow−Freq − MeanLow−Freq − Gaussian
(c) Effect of Transfer Functions
Figure 5: (a) Errors of the mean and Gaussian approximations of the histogram for the three test datasets. At a certainlevel of detail, for each method, the reported error is the root mean squared error of the voxels’ approximated histogram incomparison with their actual histogram, for all voxels in that level of coarsening. Rendering errors of the mean and Gaussianapproximations ( f ) of the histogram on (b) the Richtmyer-Meshkov Instability dataset using different filters and (c) the sphericaldistance dataset using a high-frequency and low-frequency transfer function (V ).
c© The Eurographics Association 2006.