improving teaching - inqaahe · ratio of hec approved phd supervisors to full ... factor journals...
TRANSCRIPT


Improving Teaching Quality & Research by Focusing on HEC University Ranking Parameters (A Case of Pakistan)
Engr. Salim Ahmed Khan (Sitara-e-Imtiaz), PE
Director, QA – Riphah International University, Islamabad, Pakistan

Mission Statement of HEC Pakistan
“To Facilitate Institutions of Higher
Learning to Serve as an Engine of
Socio-Economic Development of
Pakistan”
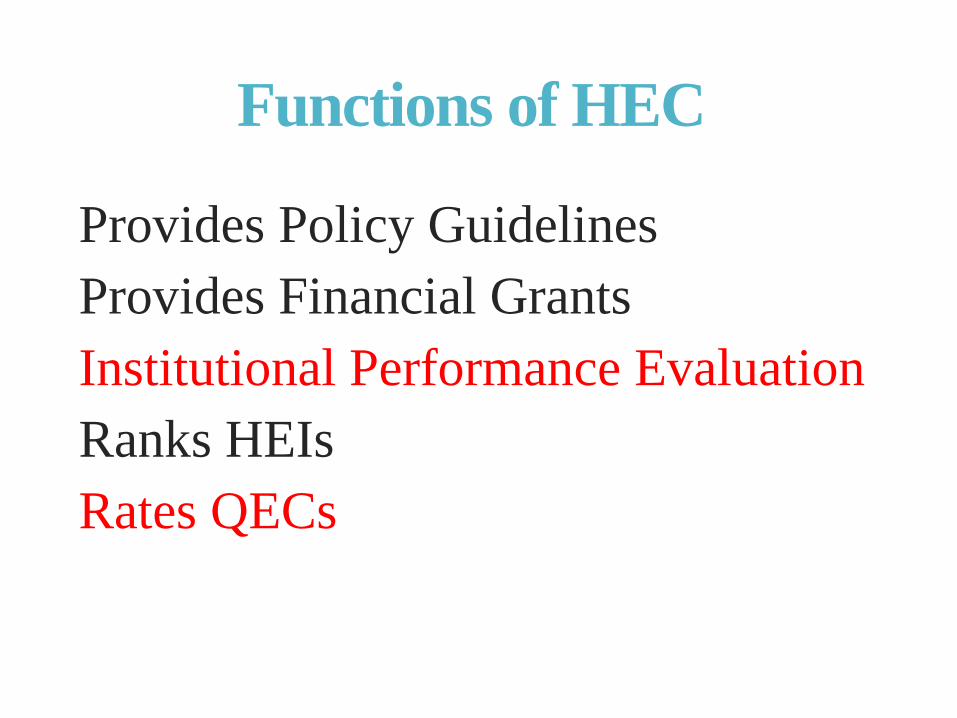
Functions of HEC
Provides Policy Guidelines
Provides Financial Grants
Institutional Performance Evaluation
Ranks HEIs
Rates QECs
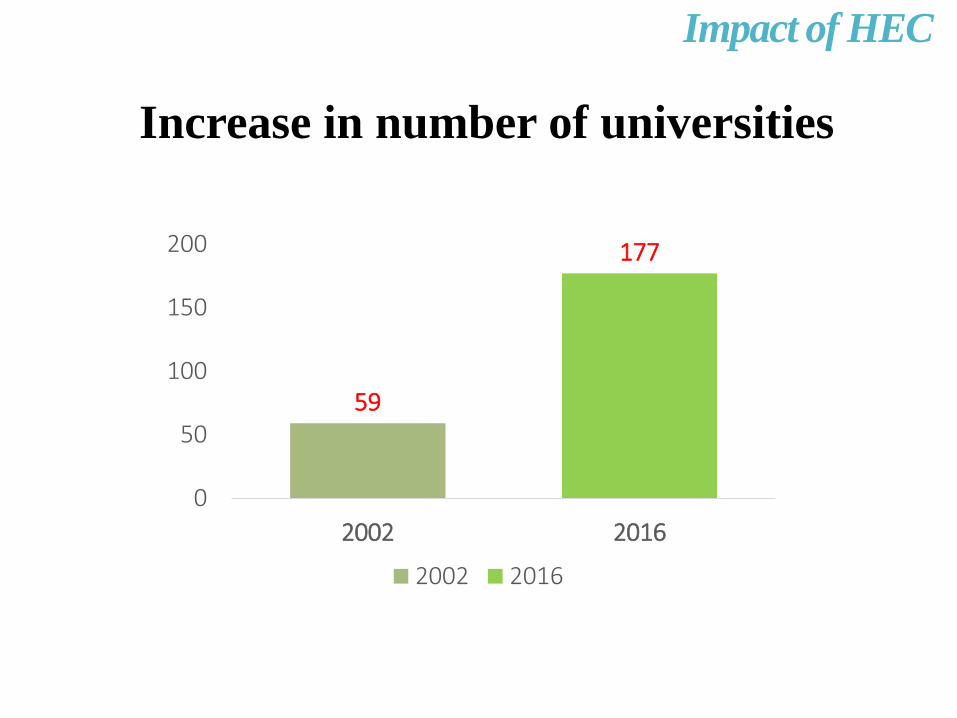
Impact of HEC
Increase in number of universities
59
177
0
50
100
150
200
2002 2016
2002 2016

Students Enrolment
0.27 Million
1.3 Million
Year 2002 Year 2016
Impact of HEC

PhDs Production/Year
256
1450
0
200
400
600
800
1000
1200
1400
1600
1800
2000
Year 2002 Year 2016
Impact of HEC

Research Publications/Year
500
12500
0
2000
4000
6000
8000
10000
12000
Year2002
Year2016
Impact of HEC

HEC University Categorization Criteria

University Categorization Criteria
Categories of Universities
1. General (73)
2. Engineering & Technologies (21)
3. Business Education (15)
4. Agriculture & Veterinary (5)
5. Medical (13)
6. Arts & Designing (2)
Note: Not considered
<5 Years of age, Distance Learning

University Ranking

University Ranking Parameters
S. No Categories Score
1 Quality Assurance 15
2 Teaching Quality 28
3 Research 39
4 Finance & Facilities 8
5 Social Integration 10
Total 100

Quality Assurance Score CardS.
NoParameters Component Weightage
1
Adoption/Implementation of HEC eligibility criteria for
appointments of faculty membersQA 1
2Adoption/Implementation of HEC criteria of
M.Phil/MS/PhD Programs QA 1
3Adoption/Implementation of HEC plagiarism policy
complianceQA 2
4Ratio of number of accredited programs to total number
of HEI accreditable programsQA 4
5
Ratio of number of HEC recognized programs (non-
accreditable) to total number of HEI non-accreditable
programs
QA 1
6Rating of Quality Enhancement Cells (QECs) of the
HEIs QA 4
7 Student Feedback QA 1
8 Ranking of HEIs in latest international rankings QA 1
Total 15

TEACHER’S SELF-IMPROVEMENT EVIDENCE
.
1 2 3 4 5 6
2011 2.76 2.75 2.37 3.02 3.76 3.68
2012 2.76 2.75 3.16 3.54 3.19 3.68
2013 4.35 4.56 3.16 3.54 3.19 4.06
2014 4.36 4.34 3.78 4.18 4.04 4.43
0
0.5
1
1.5
2
2.5
3
3.5
4
4.5
5
Sco
re o
ut
of
5.0
FMS 2011, 2012, 2013 & 2014 Comparison

Teaching Quality Score CardS. No Parameters Component Weightage
9Ratio of Full time PhD faculty to full time total
faculty
Teaching
Quality7
10 Full time teacher to student ratio Teaching
Quality7
11 Ratio of full time faculty load to total faculty loadTeaching
Quality4
12Number of national/International awards won by
full time faculty members per total full time faculty
Teaching
Quality2
13
Ratio of Number of faculty members retained at
university for more than 03 years to total fulltime
faculty members
Teaching
Quality2
14Ratio of their faculty having terminal degrees from
other institutions over total full time faculty members
Teaching
Quality2
15Selectivity: enrollment ratio (fresh intake) to total
applicants
Teaching
Quality4
Total 28
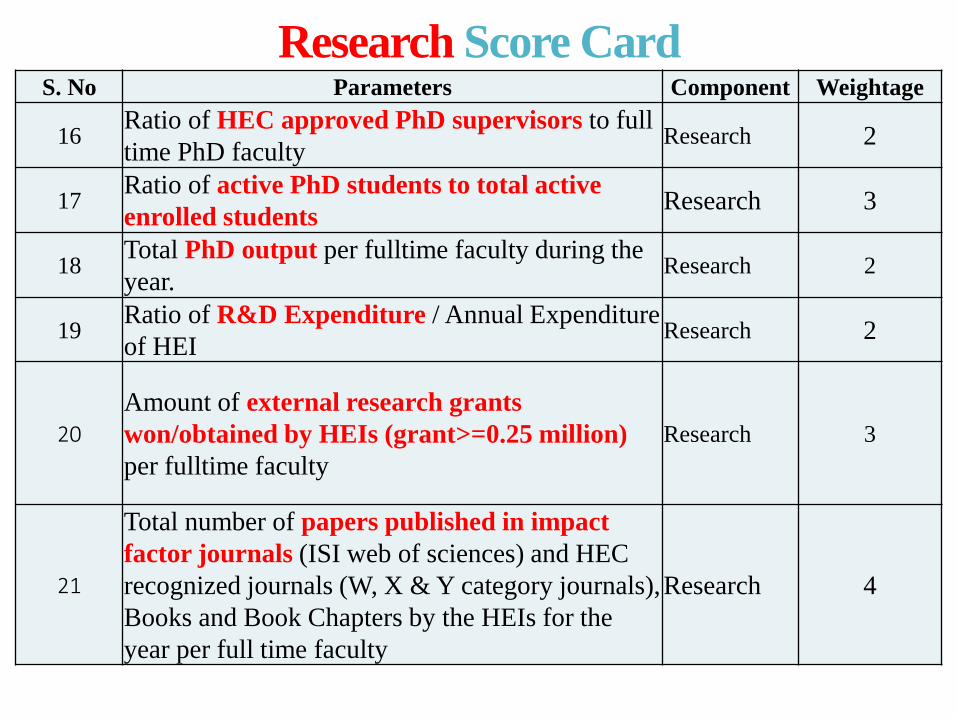
S. No Parameters Component Weightage
16Ratio of HEC approved PhD supervisors to full
time PhD facultyResearch 2
17Ratio of active PhD students to total active
enrolled students Research 3
18Total PhD output per fulltime faculty during the
year. Research 2
19Ratio of R&D Expenditure / Annual Expenditure
of HEIResearch 2
20
Amount of external research grants
won/obtained by HEIs (grant>=0.25 million)
per fulltime faculty
Research 3
21
Total number of papers published in impact
factor journals (ISI web of sciences) and HEC
recognized journals (W, X & Y category journals),
Books and Book Chapters by the HEIs for the
year per full time faculty
Research 4
Research Score Card

S. No Parameters Component Weightage
22
Citations (from CPCI conferences + ISI impact
factor Journals). Books and Book Chapters per
fulltime faculty (last 05 years publications)
Research 4
23 University H Index Research 2
24
Number of registered Patents at
national/international level per full time faculty for
last 10 years
Research 1
25
Number of registered Varieties/ Technologies/
Breeds and Creative Work recognized at national /
international level per full time faculty for last 10
years
Research 2
26
Number of Commercialization of registered
Varieties/ Technologies/ Breeds and Creative Work
at national /international level per full time faculty
for last 10 years
Research 1
Research Score Card

Research Score Card
S. No Parameters Component Weightage
27Number of W category Journals Published by the
HEIs (Science and Social Science Journals)Research 2
28Number of X category Journals Published by the
HEIs (Science and Social Science Journals)Research 1
29
Number of international
conferences/symposia/workshop/seminar / creative
work exhibitions organized (at least 3 International
participants traveling from abroad specifically for
the conference) by the HEI during the year.
Minimum 08 contact hours.
Research 2
30
Number of National conferences/ symposia/
workshop/ seminar / creative work exhibitions
organized by the HEI (2 days or more). Minimum
08 contact hours.
Research 2
31Number of total CPCI (WoS) indexed conference
papers per full time facultyResearch 2
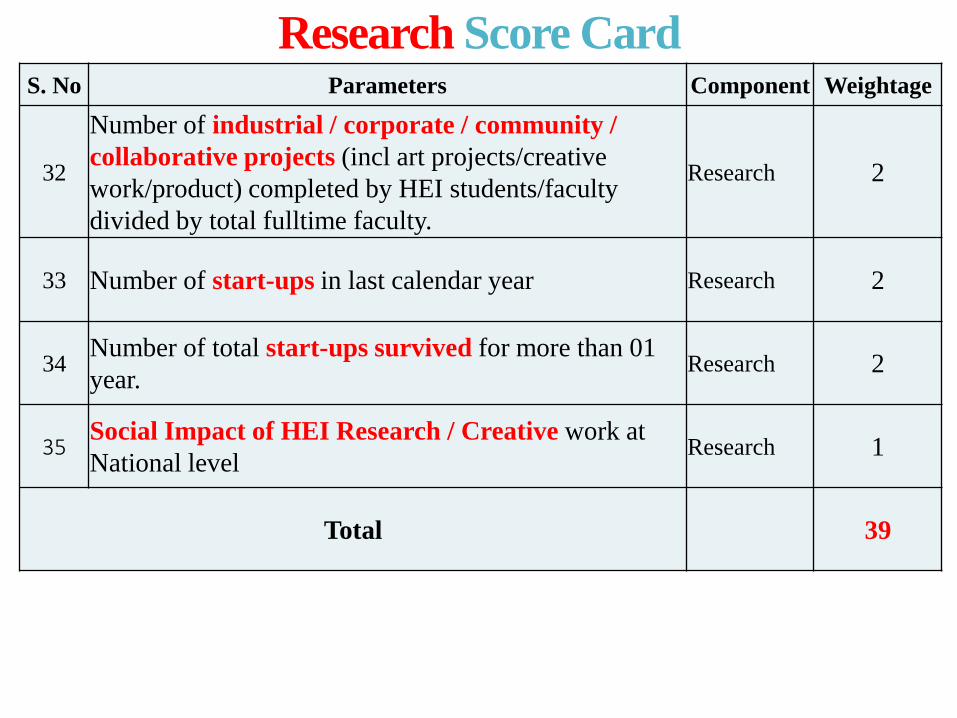
Research Score CardS. No Parameters Component Weightage
32
Number of industrial / corporate / community /
collaborative projects (incl art projects/creative
work/product) completed by HEI students/faculty
divided by total fulltime faculty.
Research 2
33 Number of start-ups in last calendar year Research 2
34Number of total start-ups survived for more than 01
year.Research 2
35Social Impact of HEI Research / Creative work at
National level Research 1
Total 39
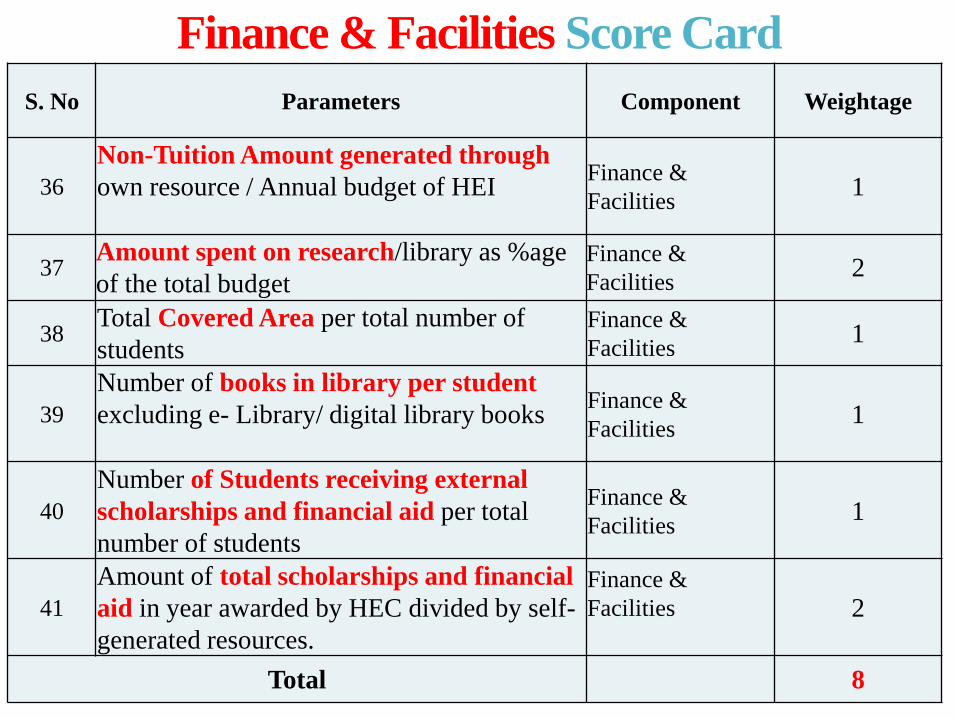
Finance & Facilities Score Card
S. No Parameters Component Weightage
36
Non-Tuition Amount generated through
own resource / Annual budget of HEIFinance &
Facilities1
37Amount spent on research/library as %age
of the total budget
Finance &
Facilities2
38Total Covered Area per total number of
students
Finance &
Facilities1
39
Number of books in library per student
excluding e- Library/ digital library booksFinance &
Facilities1
40
Number of Students receiving external
scholarships and financial aid per total
number of students
Finance &
Facilities1
41
Amount of total scholarships and financial
aid in year awarded by HEC divided by self-
generated resources.
Finance &
Facilities 2
Total 8

Social Integration /Community Development Score CardS. No Parameters Component Weightage
42
Number of international /national collaboration/
exchange program (outbound/inbound student &
faculty (at least 1 week for faculty & 2 weeks for
students)) / fulltime faculty
Social Integration
/ Community
Development2
43
Number of community outreach programs
funded by HEI (amount >= Rs 0.25 mil), and
community service projects by the HEIs (at least
200 students-hrs) / Number of students in HEI
Social Integration
/ Community
Development2
44
No of Students taking social / community service
work/activities (at least 05 hours per semester) per
total number of students enrolled
-Do- 3
45
No of players participating in Provincial /
National / International Sports events divided by
Number of total enrolled students
Social Integration
/ Community
Development1
46 HEC sports ranking-menSocial Integration
/ Community
Development1
47 HEC sports ranking-women -Do- 1
Total 10
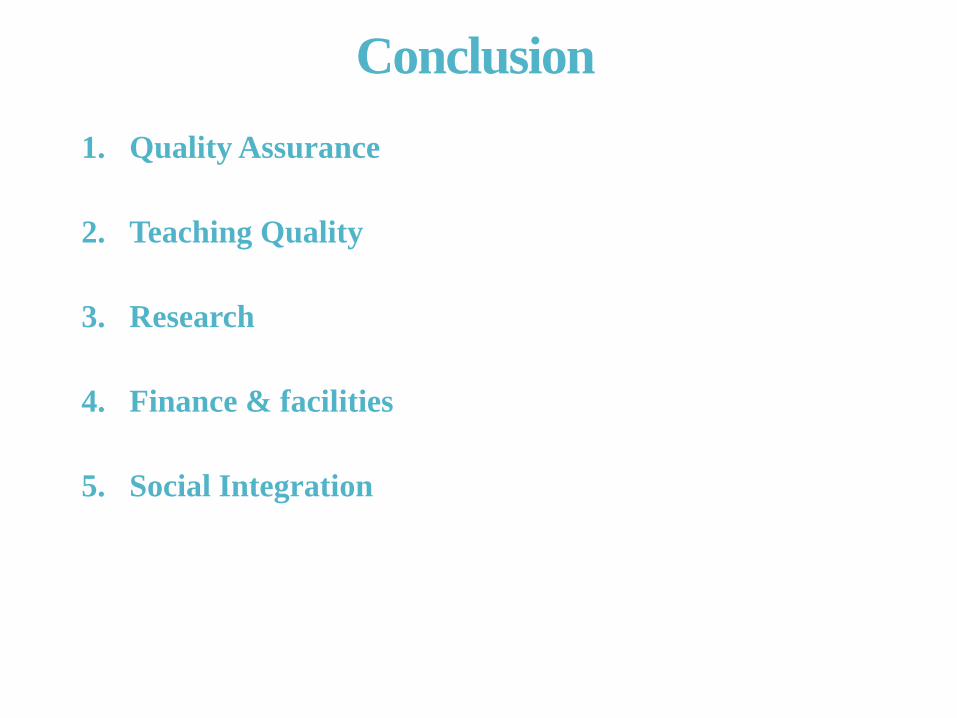
Conclusion
1. Quality Assurance
2. Teaching Quality
3. Research
4. Finance & facilities
5. Social Integration

25