improving systems-based practice to enhance delivery of acute stroke care door-to-needle times
TRANSCRIPT

Improving Systems-Based Practice to Enhance Delivery of Acute Stroke Care
Door-to-Needle Times: You Can Do It Faster!
Allyson Zazulia, MDWashington University School of Medicine
St. Louis, MO
ARSaves 2012
Stroke & Cerebrovascular

Salary and Research SupportNational Institutes of Health
Washington University School of Medicine
No financial relationships with industry
Financial Disclosures
Objectives:
• To recognize the importance of reducing door to needle time for IV tPA use in acute ischemic stroke
• To learn how to identify goals, barriers, and solutions to reducing door to needle time for IV tPA use in acute ischemic stroke
• To understand the process of Value Stream Mapping in improving delivery of acute stroke care.
Improving Systems-Based Practice to Enhance Delivery of Acute Stroke Care: Topics
• Reducing door to needle time– Why– How: value stream map
• Goals• Barriers• Solutions
• Telestroke: Reducing delays in patient acceptance/transfer

Meta-analysis of IV tPA: 0-3 hour window
Wardlaw et al. Cochrane Database Syst Rev, 2009
Level 1a evidence that 0.9 mg/kg IV tPA administered within 3 hours of stroke onset increases the likelihood of recovery/reduces likelihood of death/dependency at 90 days
mRS≥2
Absolute benefit 11-13%
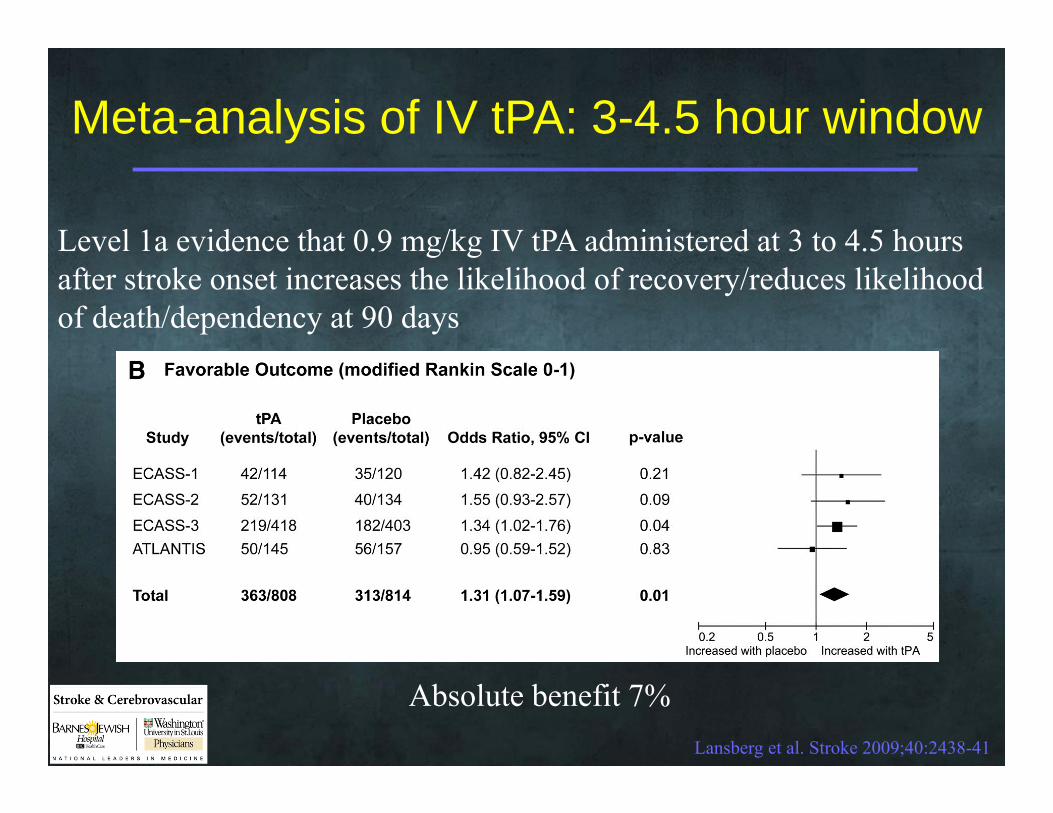
Meta-analysis of IV tPA: 3-4.5 hour window
Lansberg et al. Stroke 2009;40:2438-41
Level 1a evidence that 0.9 mg/kg IV tPA administered at 3 to 4.5 hours after stroke onset increases the likelihood of recovery/reduces likelihood of death/dependency at 90 days
Absolute benefit 7%
Stroke & Cerebrovascular
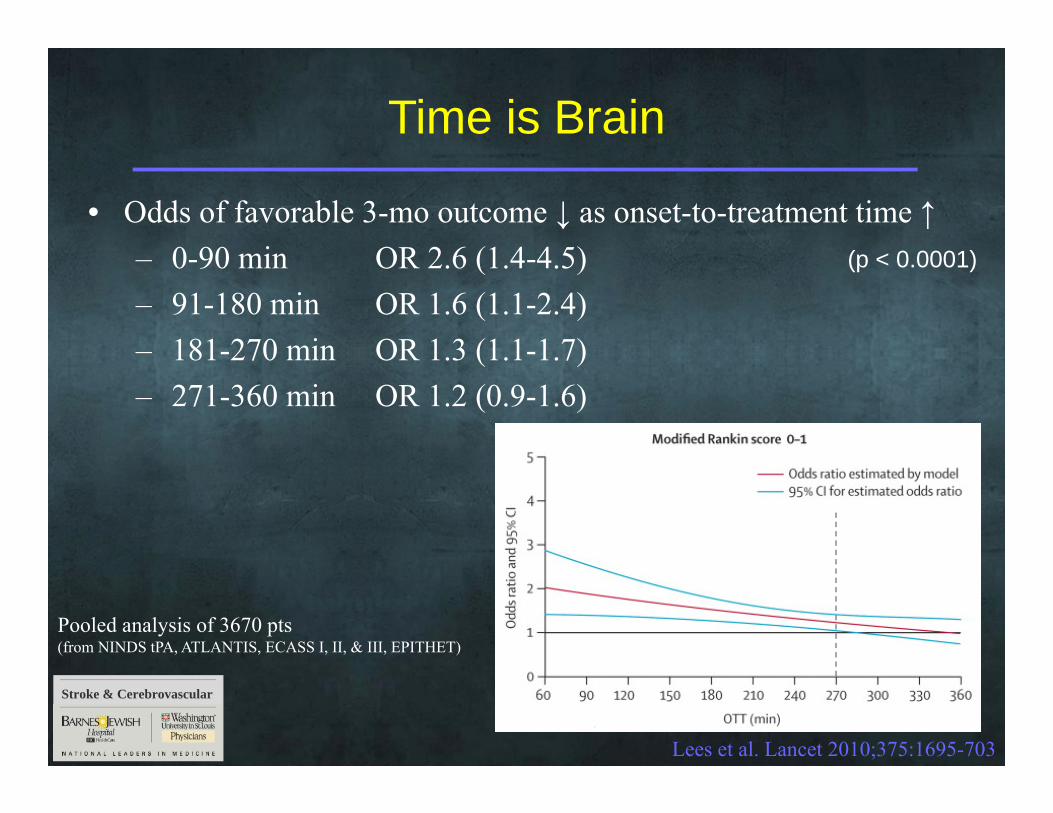
Time is Brain
Lees et al. Lancet 2010;375:1695-703
• Odds of favorable 3-mo outcome ↓ as onset-to-treatment time ↑– 0-90 min OR 2.6 (1.4-4.5)– 91-180 min OR 1.6 (1.1-2.4)– 181-270 min OR 1.3 (1.1-1.7)– 271-360 min OR 1.2 (0.9-1.6)
(p < 0.0001)
Pooled analysis of 3670 pts(from NINDS tPA, ATLANTIS, ECASS I, II, & III, EPITHET)

Stroke & Cerebrovascular
Time is Brain
Lees et al. Lancet 2010;375:1695-703
• Risk of death ↑ as onset-to-treatment time ↑– 0-90 min OR 0.8 (0.4-1.5)– 91-180 min OR 1.1 (0.7-1.8)– 181-270 min OR 1.2 (0.9-1.7)– 271-360 min OR 1.5 (1.0-2.2)
Pooled analysis of 3670 pts(from NINDS tPA, ATLANTIS, ECASS I, II, & III, EPITHET)
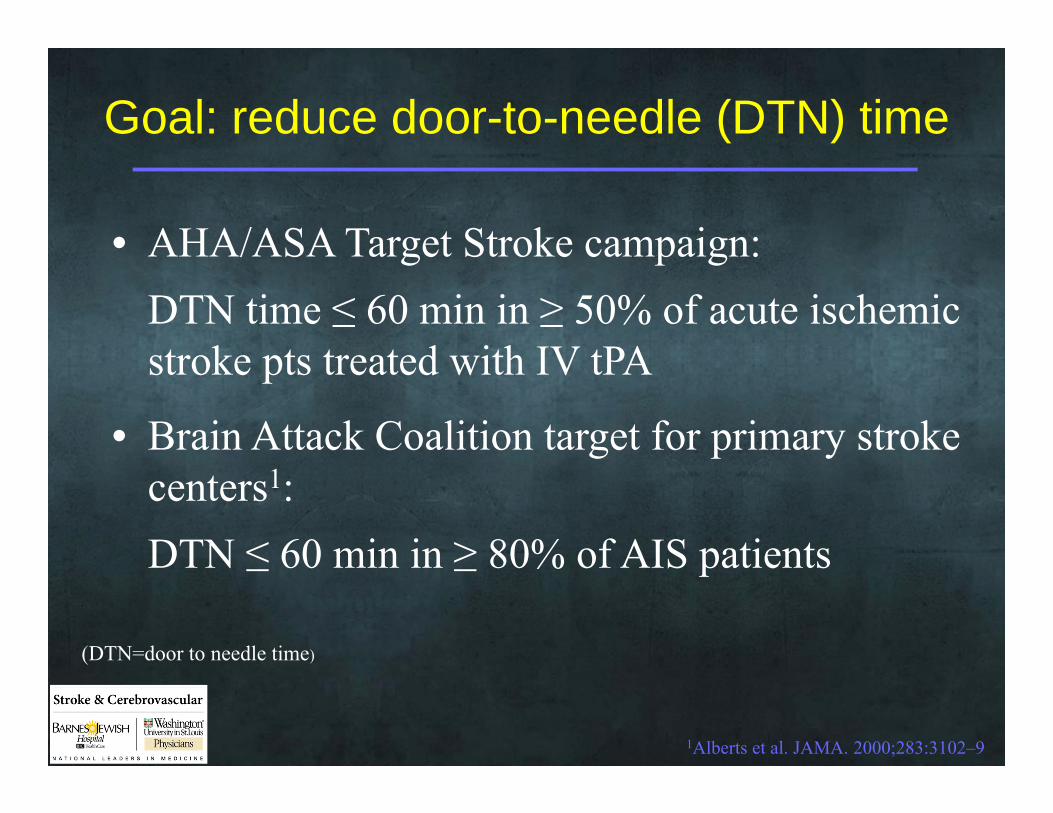
Goal: reduce door-to-needle (DTN) time
• AHA/ASA Target Stroke campaign: DTN time ≤ 60 min in ≥ 50% of acute ischemic stroke pts treated with IV tPA
• Brain Attack Coalition target for primary stroke centers1:DTN ≤ 60 min in ≥ 80% of AIS patients
1Alberts et al. JAMA. 2000;283:3102–9
(DTN=door to needle time)
Reaching the goal
• Value Stream Mapping/Lean Processing– Group process to create a “map” depicting
everything that needs to happen in the production and delivery of a product
– Process of mapping serves as communication tool to • Identify goals• Expose inefficiencies and barriers• Create solutions

Value Stream Mapping
Step 1Preparatory
meeting to plan project
Step 2Communicate
plans to affected parties
Step 3Focused “Rapid Improvement
Event” to develop new
process
Requires participationfrom key process stakeholders
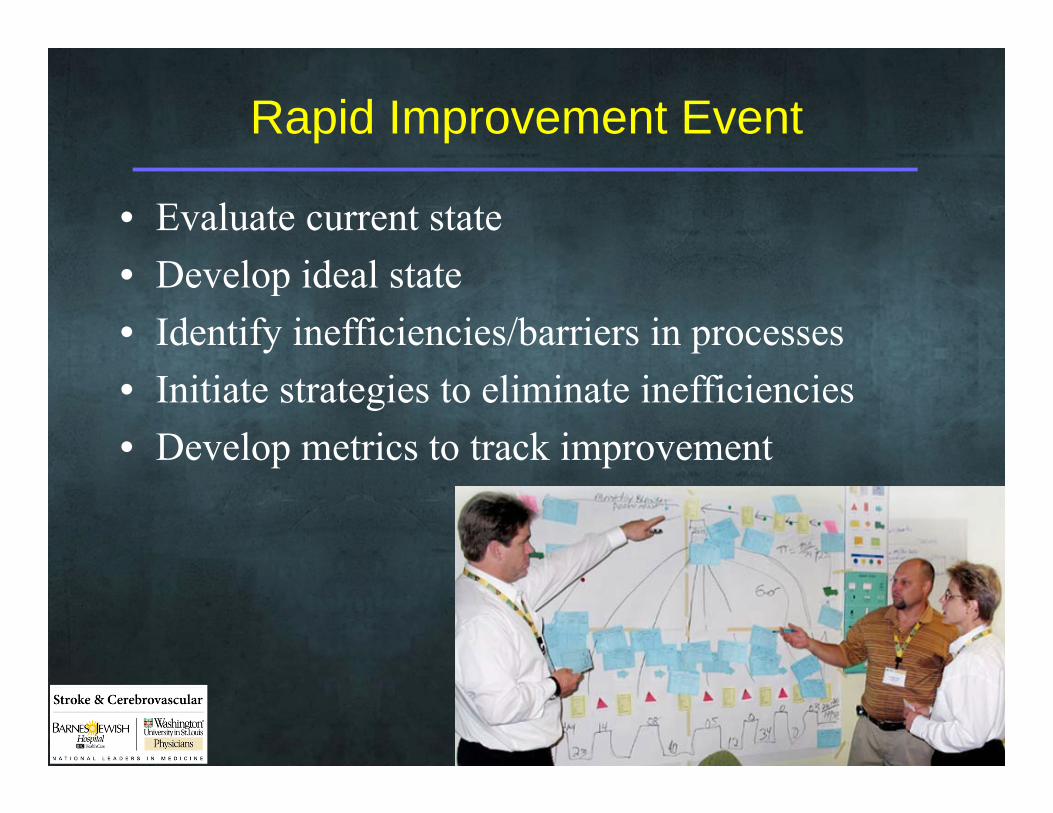
Rapid Improvement Event
• Evaluate current state• Develop ideal state• Identify inefficiencies/barriers in processes• Initiate strategies to eliminate inefficiencies• Develop metrics to track improvement
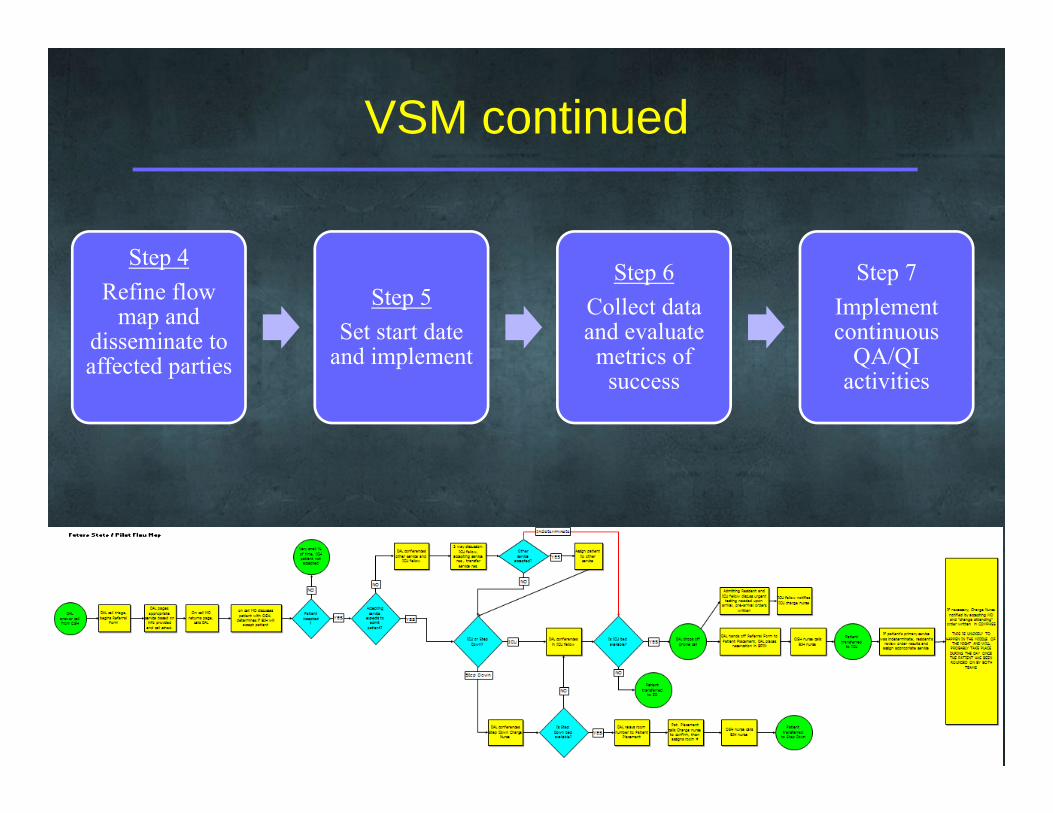
VSM continued
Step 4Refine flow
map and disseminate to affected parties
Step 5Set start date
and implement
Step 6Collect data and evaluate metrics of
success
Step 7Implement continuous
QA/QI activities
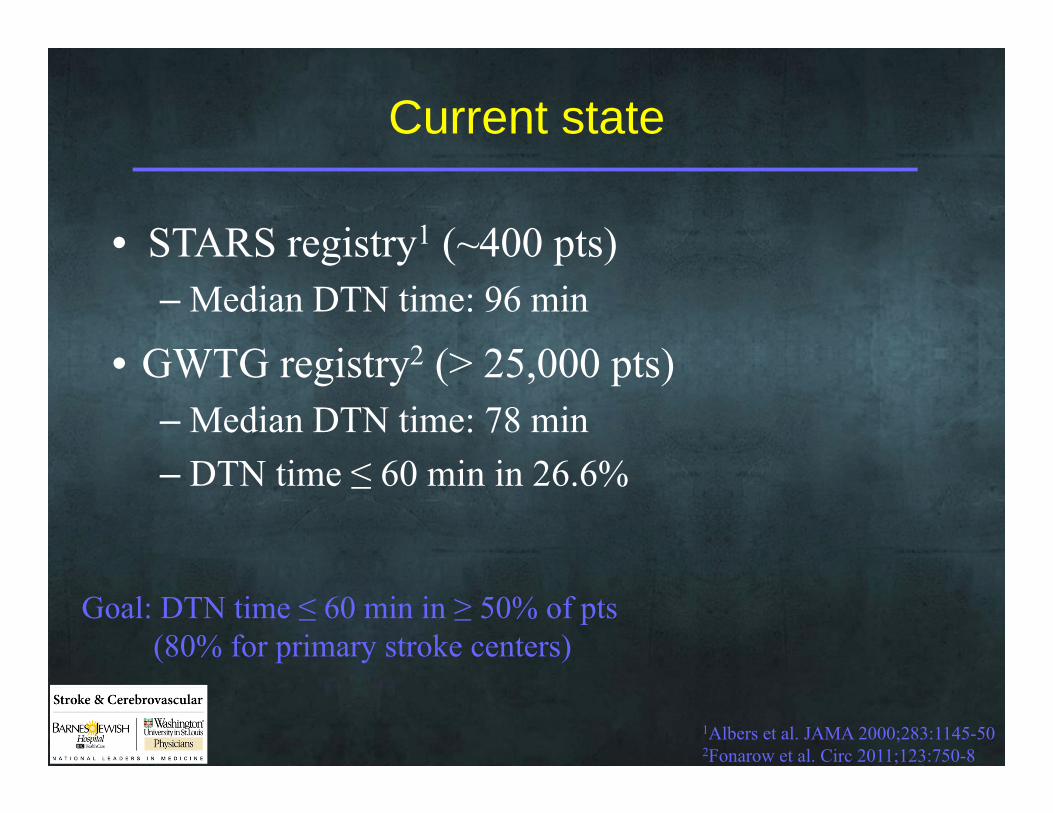
Current state
• STARS registry1 (~400 pts)– Median DTN time: 96 min
• GWTG registry2 (> 25,000 pts)– Median DTN time: 78 min– DTN time ≤ 60 min in 26.6%
1Albers et al. JAMA 2000;283:1145-502Fonarow et al. Circ 2011;123:750-8
Goal: DTN time ≤ 60 min in ≥ 50% of pts(80% for primary stroke centers)
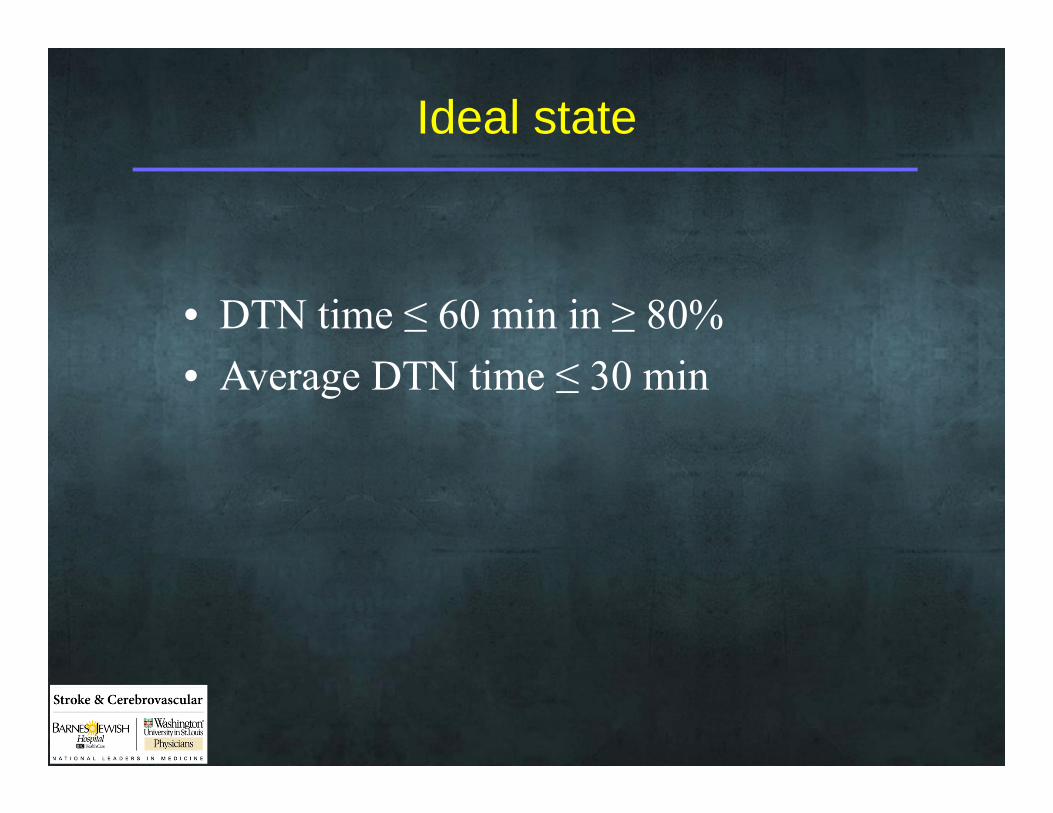
Ideal state
• DTN time ≤ 60 min in ≥ 80%• Average DTN time ≤ 30 min
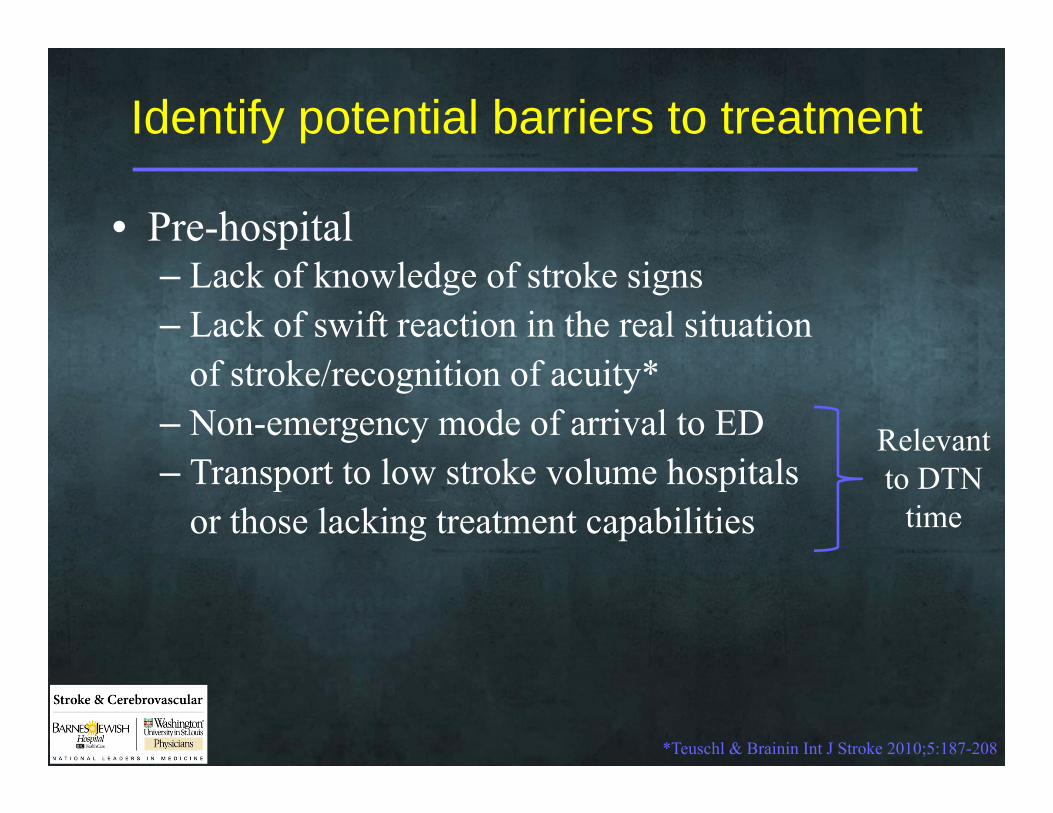
Identify potential barriers to treatment
• Pre-hospital– Lack of knowledge of stroke signs– Lack of swift reaction in the real situation
of stroke/recognition of acuity*– Non-emergency mode of arrival to ED– Transport to low stroke volume hospitals
or those lacking treatment capabilities
*Teuschl & Brainin Int J Stroke 2010;5:187-208
Relevant to DTN
time
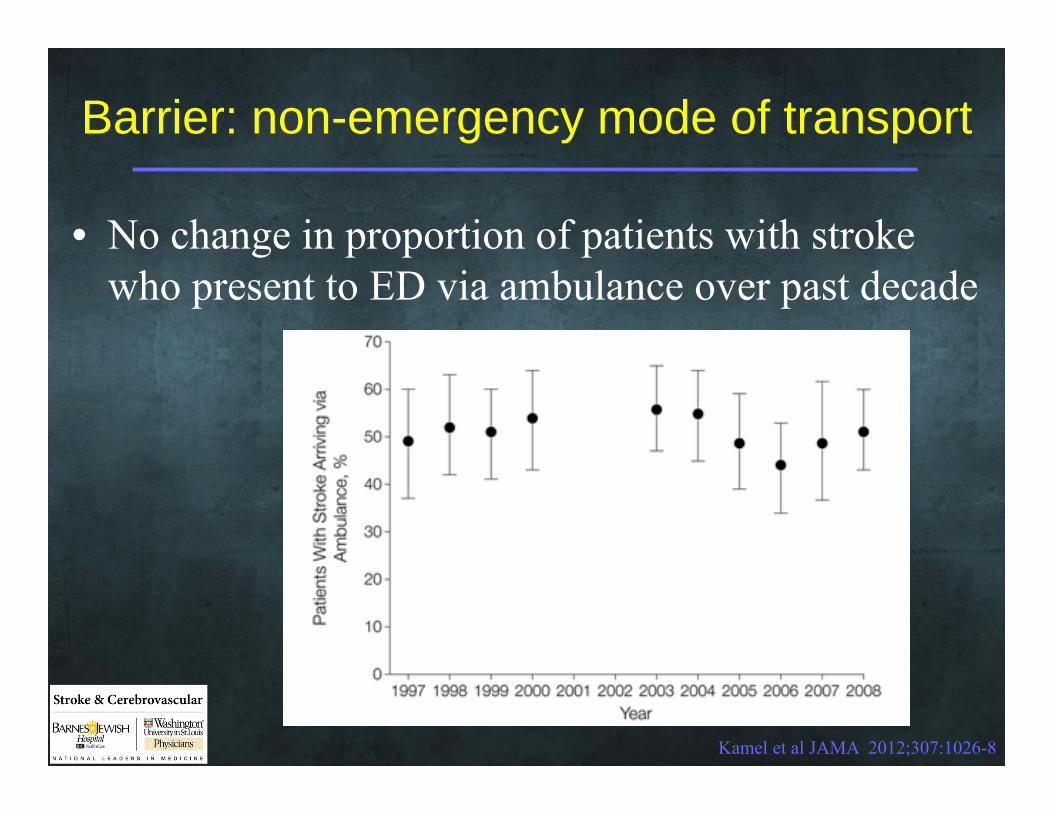
Barrier: non-emergency mode of transport
• No change in proportion of patients with stroke who present to ED via ambulance over past decade
Kamel et al JAMA 2012;307:1026-8
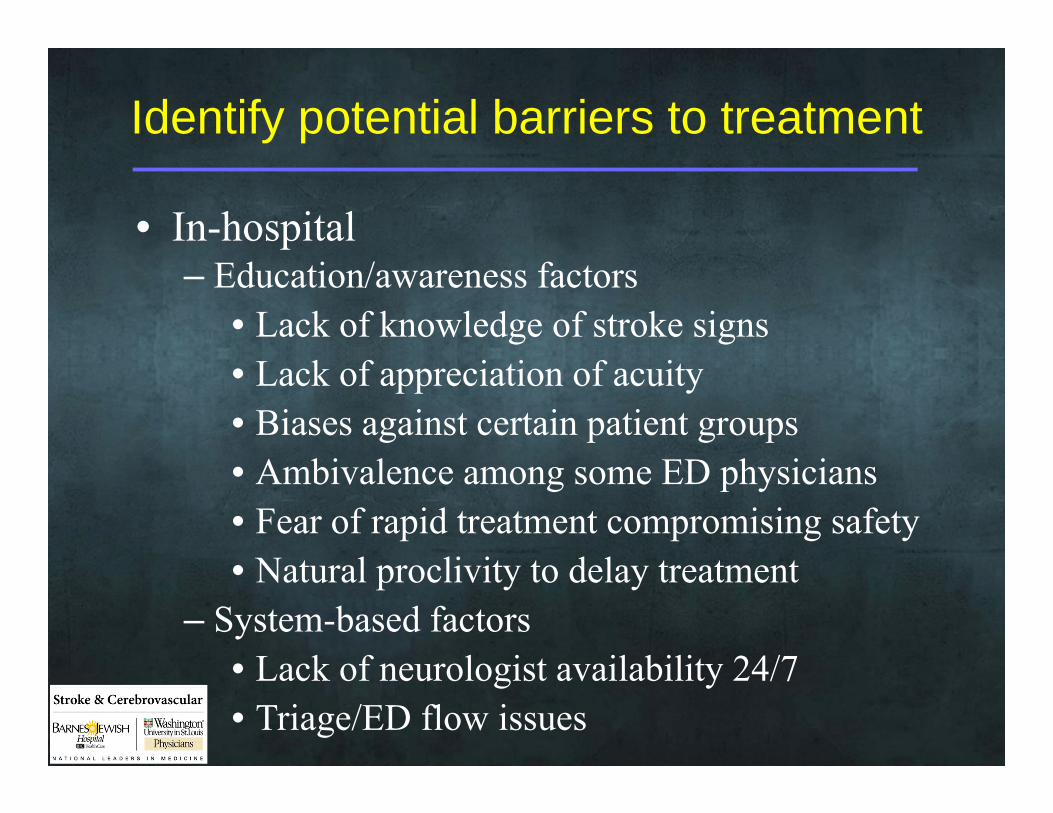
Identify potential barriers to treatment
• In-hospital– Education/awareness factors
• Lack of knowledge of stroke signs• Lack of appreciation of acuity• Biases against certain patient groups• Ambivalence among some ED physicians• Fear of rapid treatment compromising safety • Natural proclivity to delay treatment
– System-based factors• Lack of neurologist availability 24/7• Triage/ED flow issues
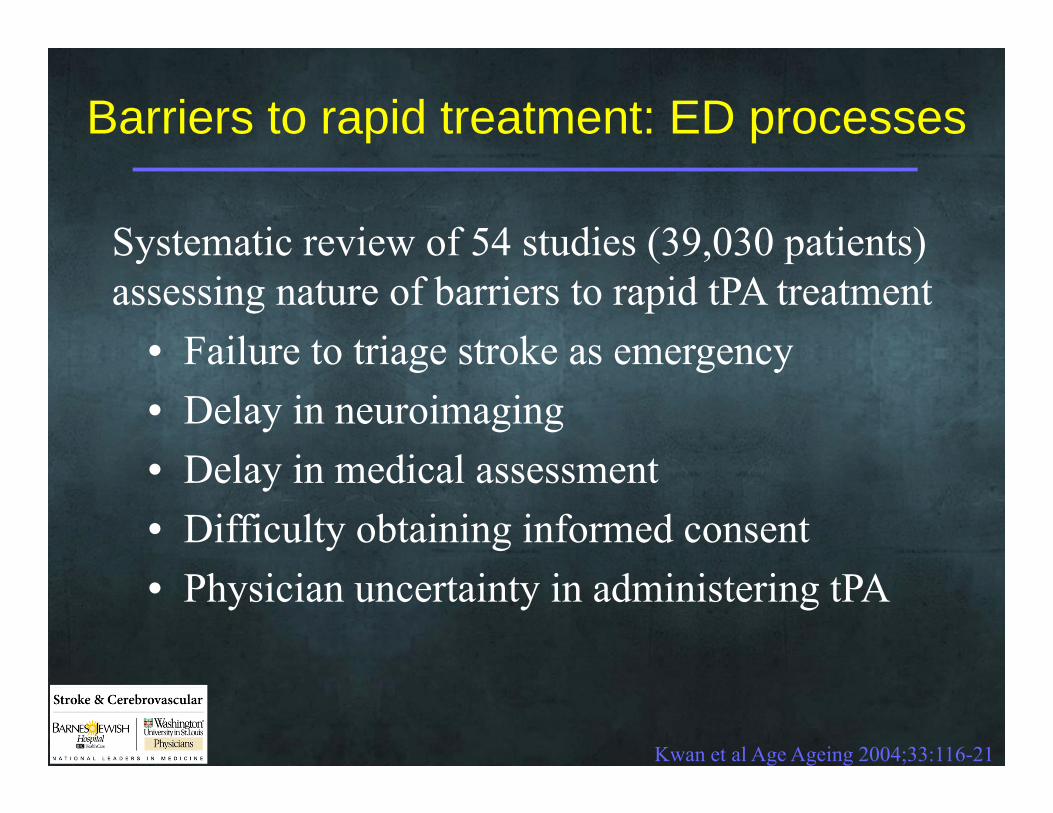
Barriers to rapid treatment: ED processes
Systematic review of 54 studies (39,030 patients) assessing nature of barriers to rapid tPA treatment
• Failure to triage stroke as emergency• Delay in neuroimaging• Delay in medical assessment• Difficulty obtaining informed consent• Physician uncertainty in administering tPA
Kwan et al Age Ageing 2004;33:116-21
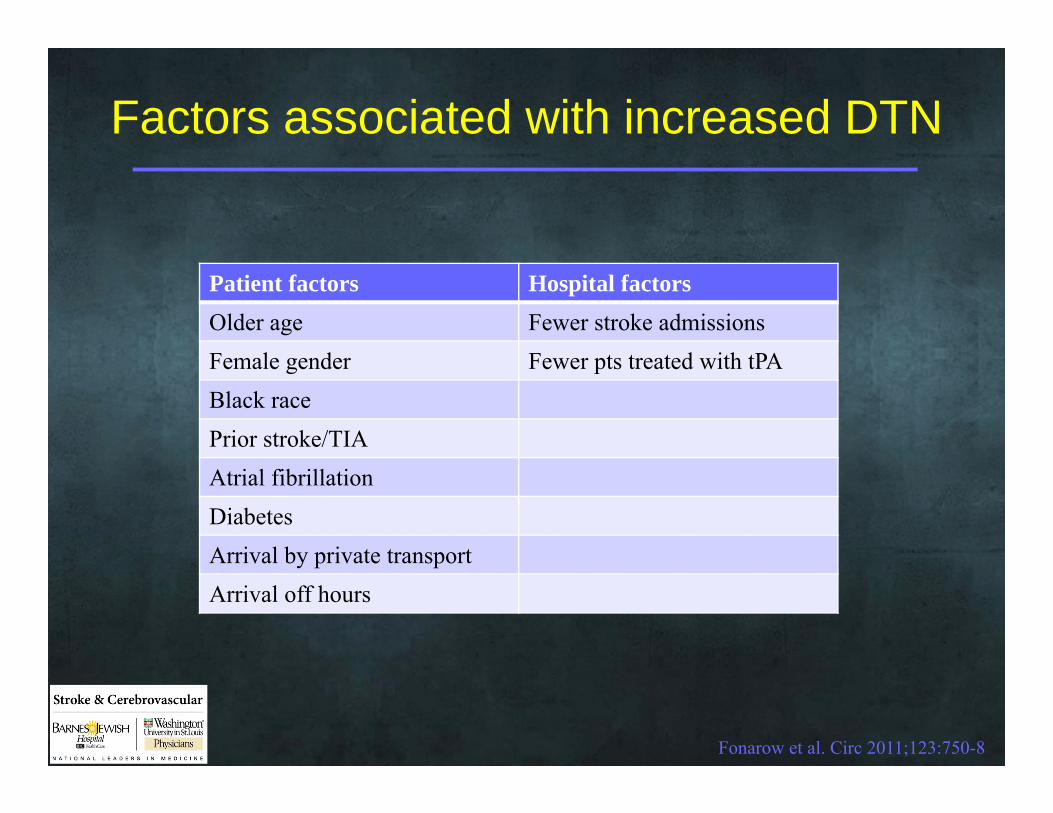
Factors associated with increased DTN
Patient factors Hospital factorsOlder age Fewer stroke admissionsFemale gender Fewer pts treated with tPABlack racePrior stroke/TIAAtrial fibrillationDiabetesArrival by private transportArrival off hours
Fonarow et al. Circ 2011;123:750-8
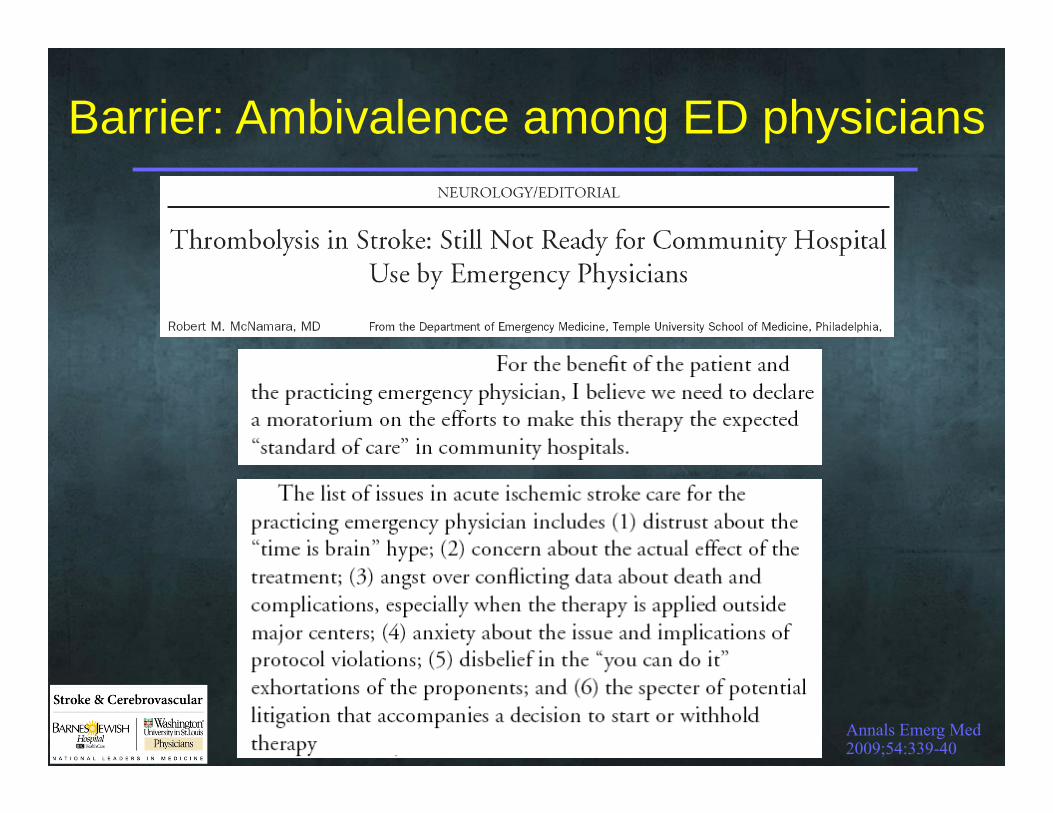
Barrier: Ambivalence among ED physicians
Annals Emerg Med 2009;54:339-40
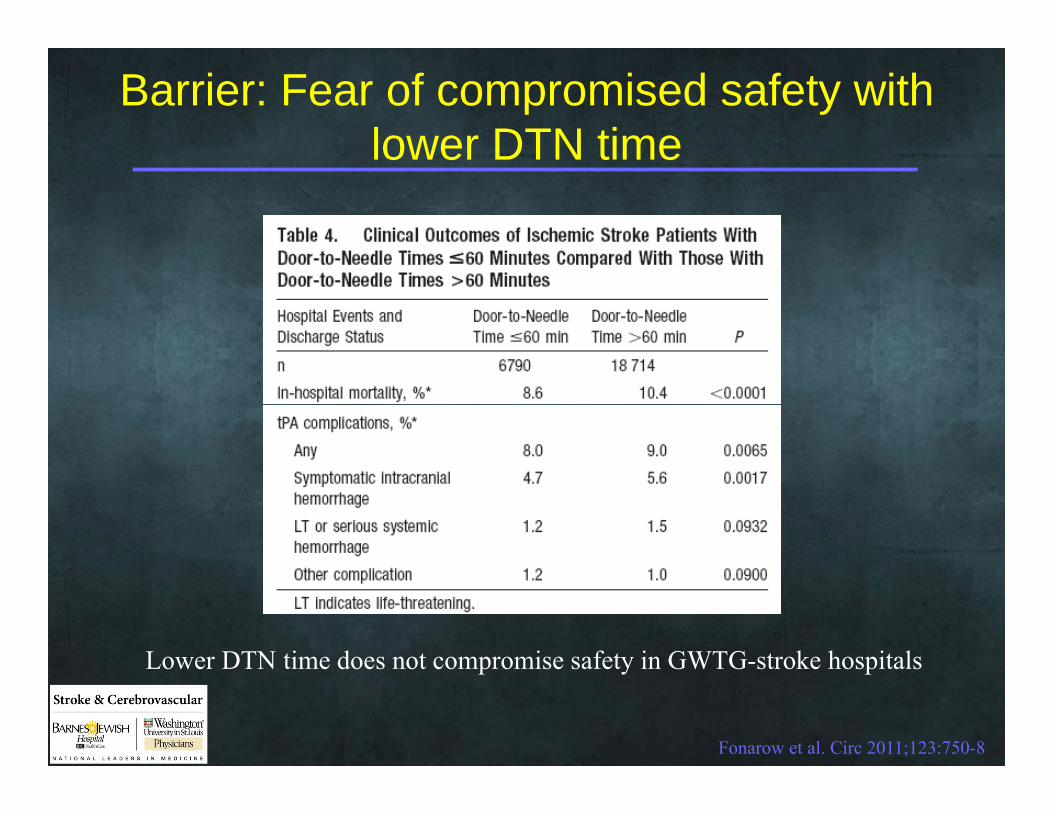
Barrier: Fear of compromised safety with lower DTN time
Fonarow et al. Circ 2011;123:750-8
Lower DTN time does not compromise safety in GWTG-stroke hospitals
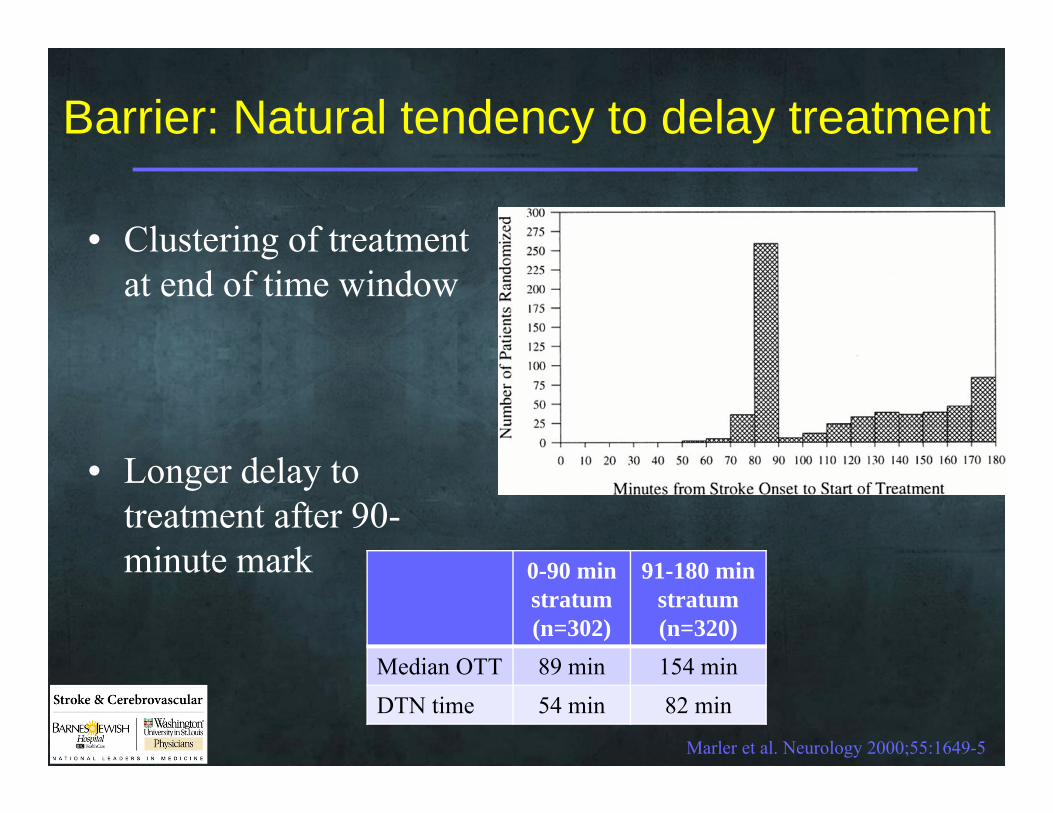
Barrier: Natural tendency to delay treatment
• Clustering of treatment at end of time window
Marler et al. Neurology 2000;55:1649-5
0-90 min stratum(n=302)
91-180 min stratum(n=320)
Median OTT 89 min 154 minDTN time 54 min 82 min
• Longer delay to treatment after 90-minute mark
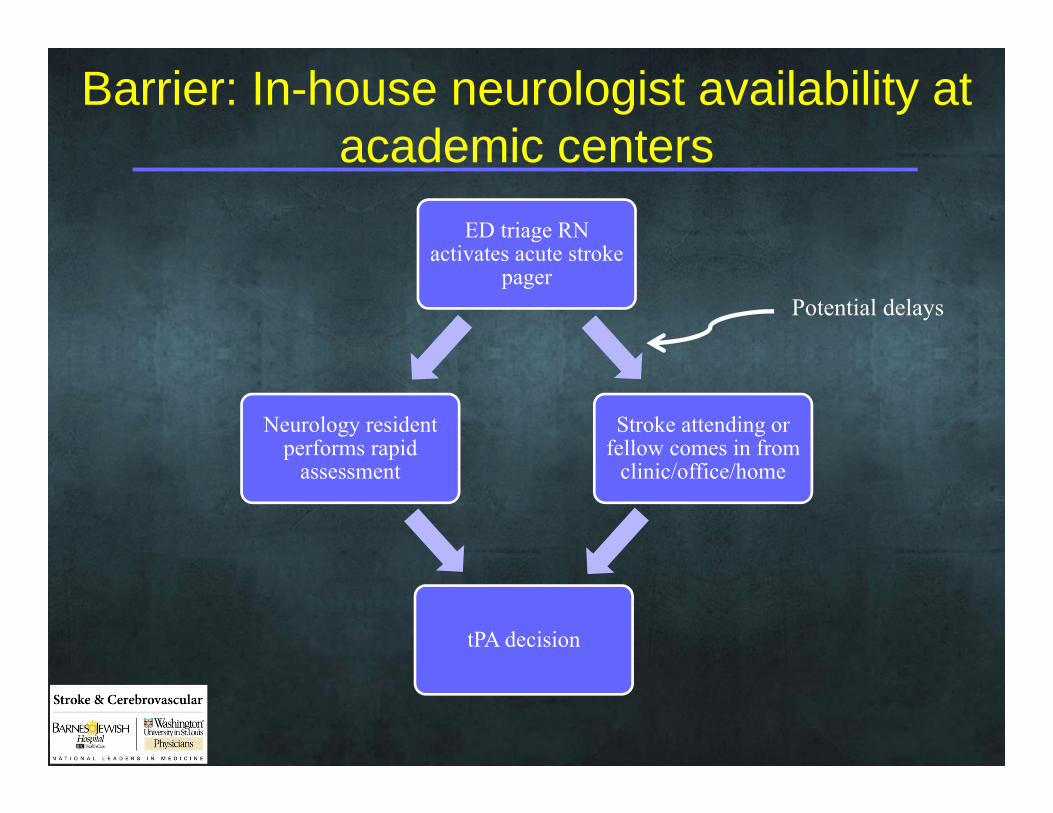
Barrier: In-house neurologist availability at academic centers
ED triage RN activates acute stroke
pager
Stroke attending or fellow comes in from
clinic/office/home
tPA decision
Neurology resident performs rapid
assessment
Potential delays
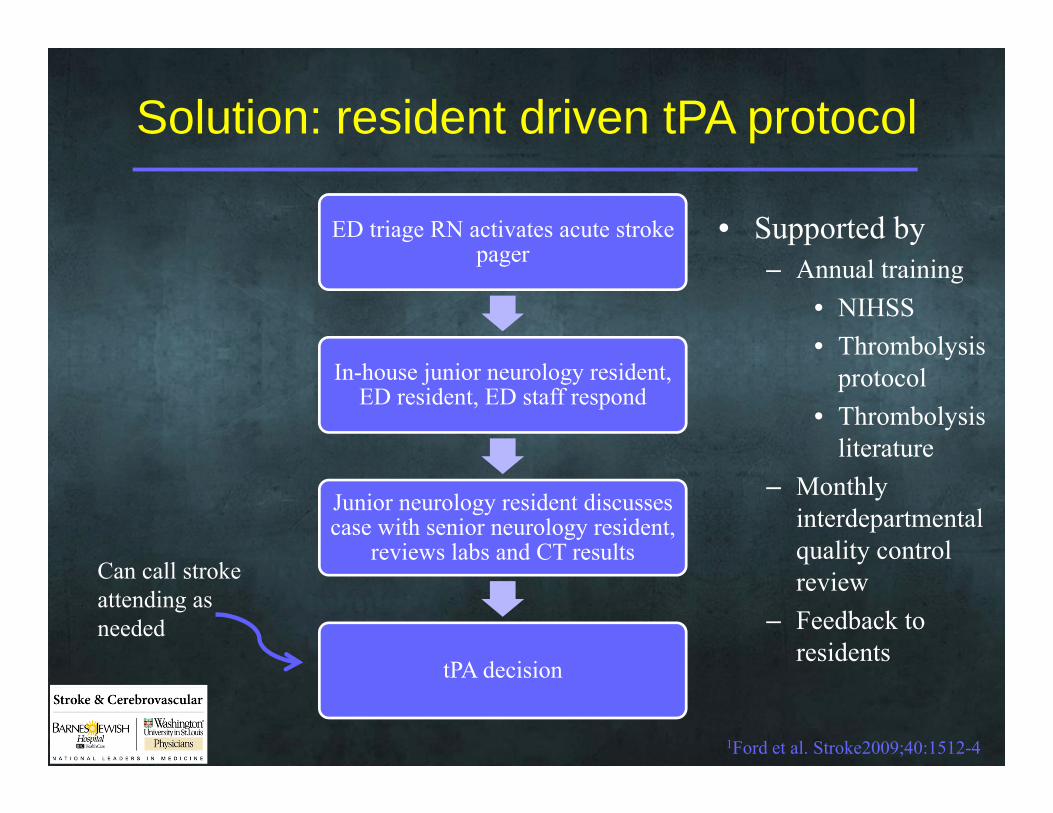
Solution: resident driven tPA protocol
• Supported by– Annual training
• NIHSS• Thrombolysis
protocol• Thrombolysis
literature– Monthly
interdepartmental quality control review
– Feedback to residents
1Ford et al. Stroke2009;40:1512-4
ED triage RN activates acute stroke pager
In-house junior neurology resident, ED resident, ED staff respond
Junior neurology resident discusses case with senior neurology resident,
reviews labs and CT results
tPA decision
Can call stroke attending as needed
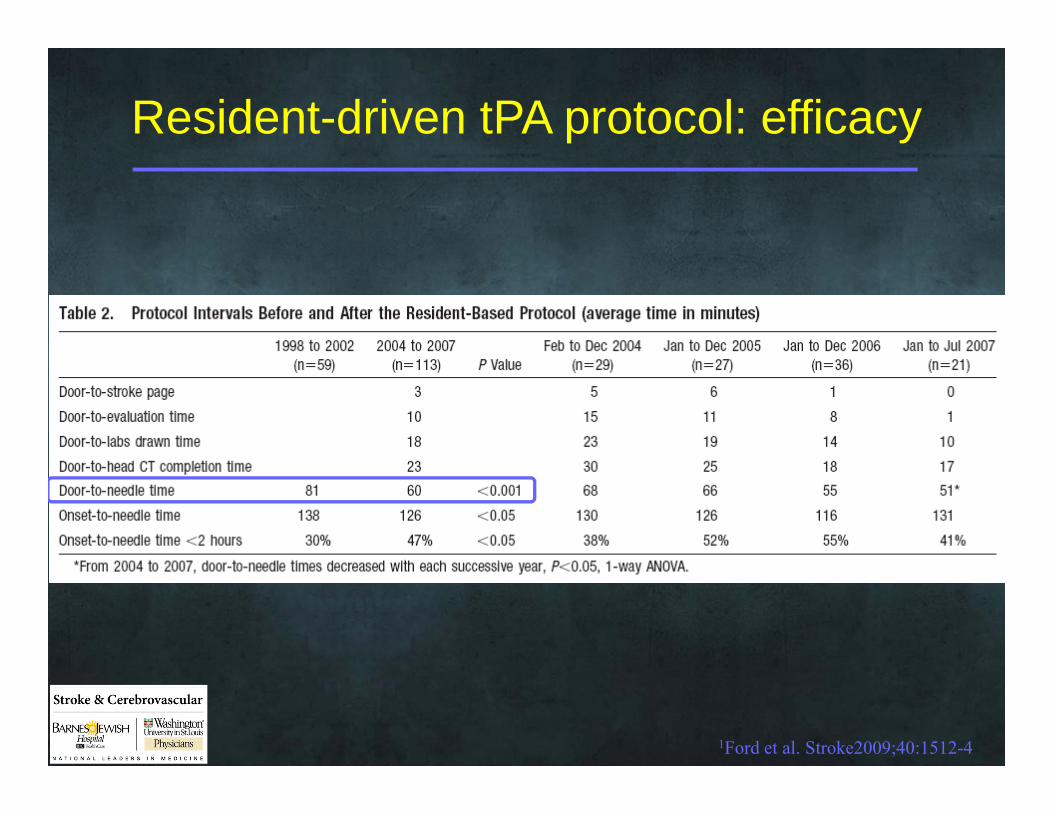
Resident-driven tPA protocol: efficacy
1Ford et al. Stroke2009;40:1512-4
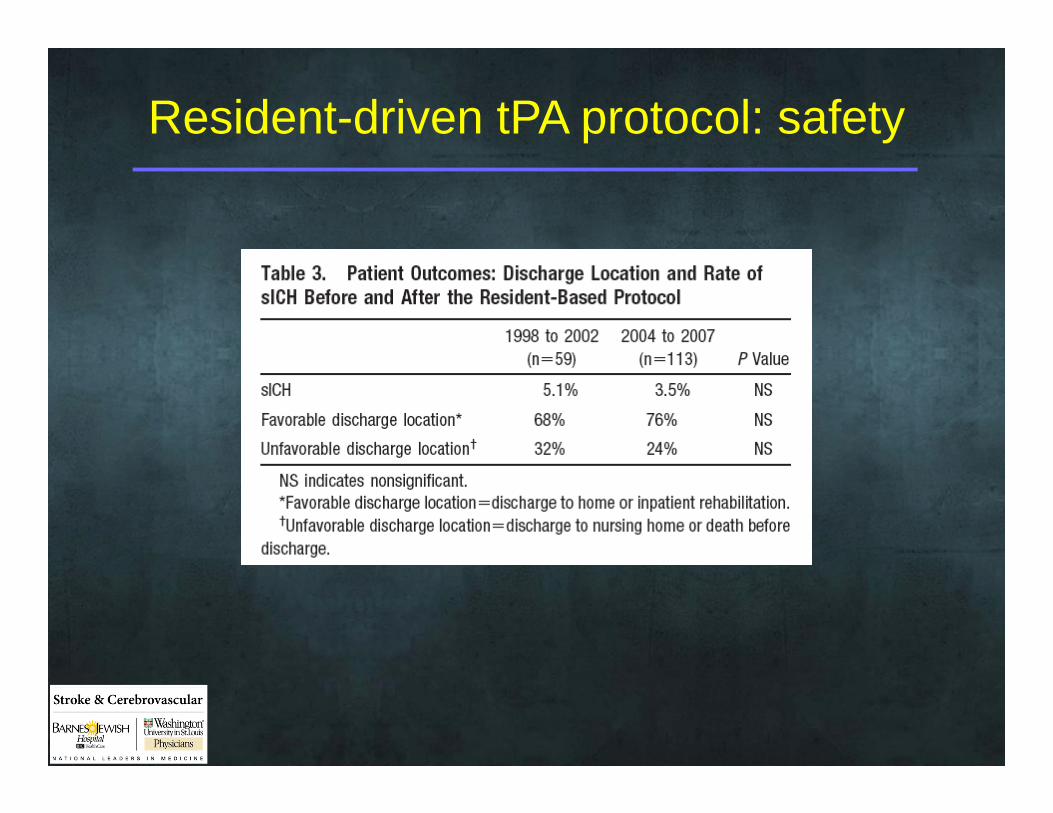
Resident-driven tPA protocol: safety
Barrier: physician accessibility at non-academic centers
• A majority of acute stroke patients present to hospitals lacking 24/7 availability of stroke specialists– These patients are less likely to receive tPA
• Transfer to regional stroke center for tPA is possible, but means treatment delays
1Morgenstern LB et al Neurology 2004;62:895-900

Solution: telestroke (“drip and ship”)
Schwamm et al Stroke 2009;40:2616-34
Class I recommendations supporting telestroke in the acute stroke setting
The NIHSS-telestroke examination…is recommended when an NIHSS-bedside assessment by a stroke specialist is not immediately available…and this assessment is comparable to an NIHSS-bedside assessment (Class I, Level of Evidence A).
Review of brain CT scans by stroke specialists or radiologists using teleradiology systems…is useful for identifying exclusions for thrombolytic therapy in acute stroke patients (Class I, Level of Evidence A).
Teleradiology systems…are useful in supporting rapid imaging interpretation in time for thrombolysis decision making (Class I, Level of Evidence B).
It is recommended that a stroke specialist using high-quality videoconferencing provide a medical opinion in favor of or against the use of intravenous tPA in patients with suspected acute ischemic stroke when on-site stroke expertise is not immediately available (Class I, Level of Evidence B).
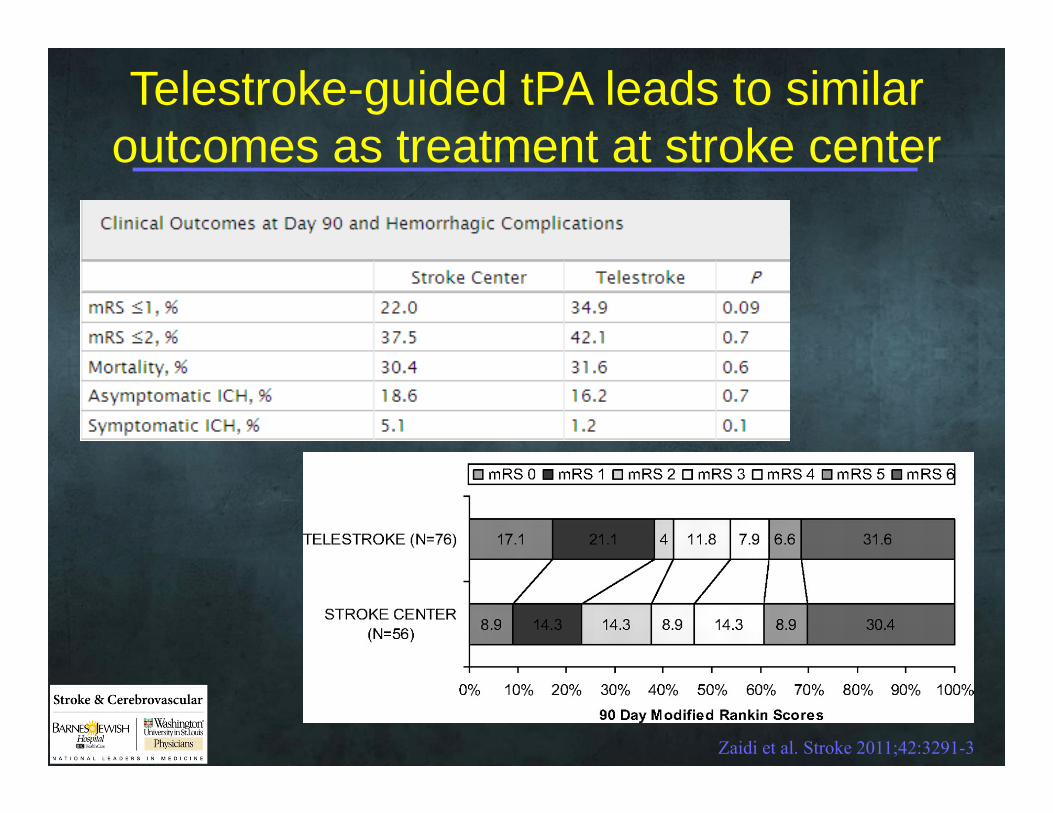
Telestroke-guided tPA leads to similar outcomes as treatment at stroke center
Zaidi et al. Stroke 2011;42:3291-3
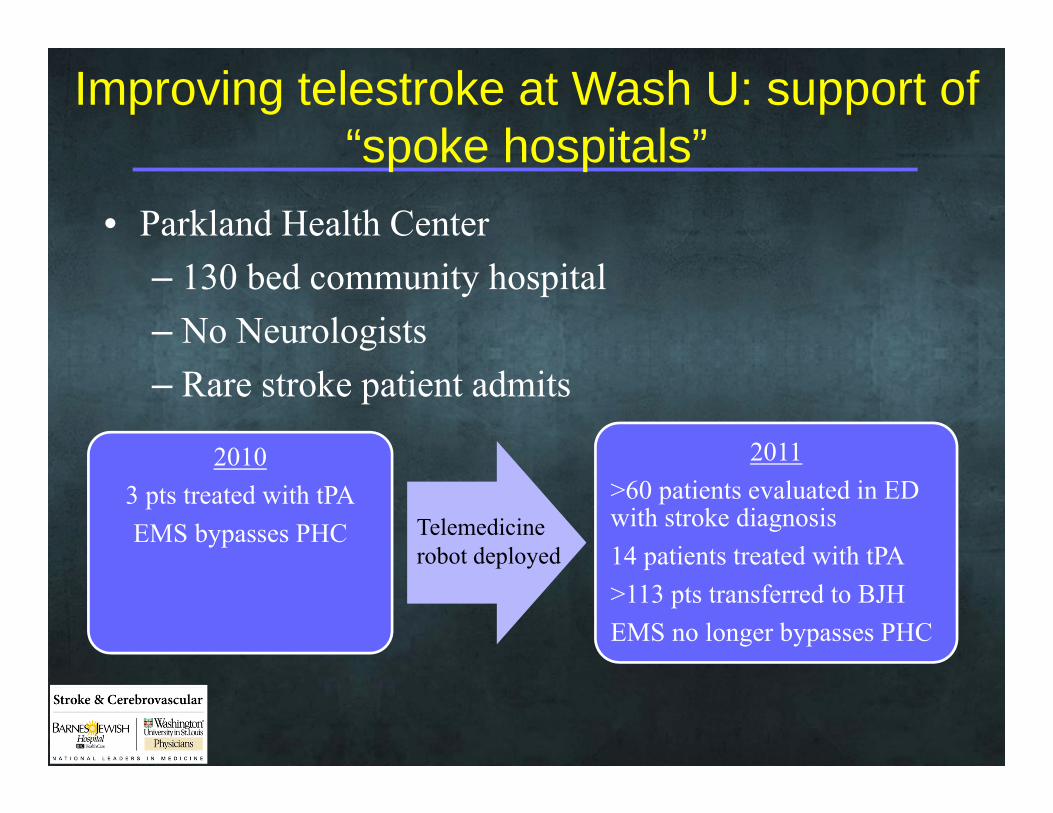
Improving telestroke at Wash U: support of “spoke hospitals”
• Parkland Health Center– 130 bed community hospital– No Neurologists– Rare stroke patient admits
20103 pts treated with tPAEMS bypasses PHC
2011>60 patients evaluated in ED with stroke diagnosis14 patients treated with tPA>113 pts transferred to BJHEMS no longer bypasses PHC
Telemedicine robot deployed
Improving telestroke at Wash U: reducing delays in patient acceptance/transfer
• Barriers:– Inefficient routing of calls to services– Frequent transfers of calls to find appropriate
service– Lack of ED bed availability
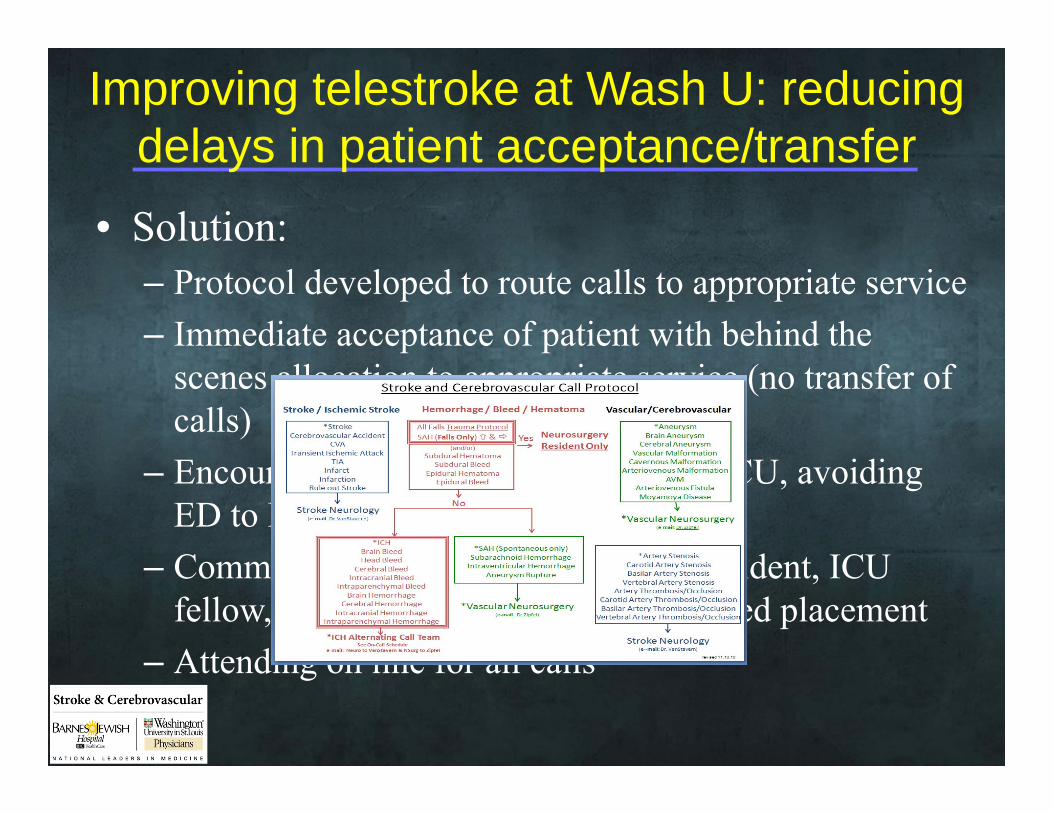
Improving telestroke at Wash U: reducing delays in patient acceptance/transfer
• Solution:– Protocol developed to route calls to appropriate service– Immediate acceptance of patient with behind the
scenes allocation to appropriate service (no transfer of calls)
– Encourage direct admission to Neuro ICU, avoiding ED to ED transfer
– Communication between neurology resident, ICU fellow, and ICU charge nurse prior to bed placement
– Attending on line for all calls

Spencer et al ISC 2012
Jul-Oct 2010 vs. Mar-Jun 2011 Prior to VSM After VSM pMean time to acceptance in minutes (SD) 14 (3.3) 9 (1.5) 0.02Patients accepted within 15 minutes 73% 92% 0.0001ICU direct admits 27 43 0.11Rate of patient calls (per month) 68 86 0.03
Intervention
Barrier: ED processes
• Problems identified at BJH– Overwhelming # of tasks to complete in short time– Inefficient choreography– Labs take too long
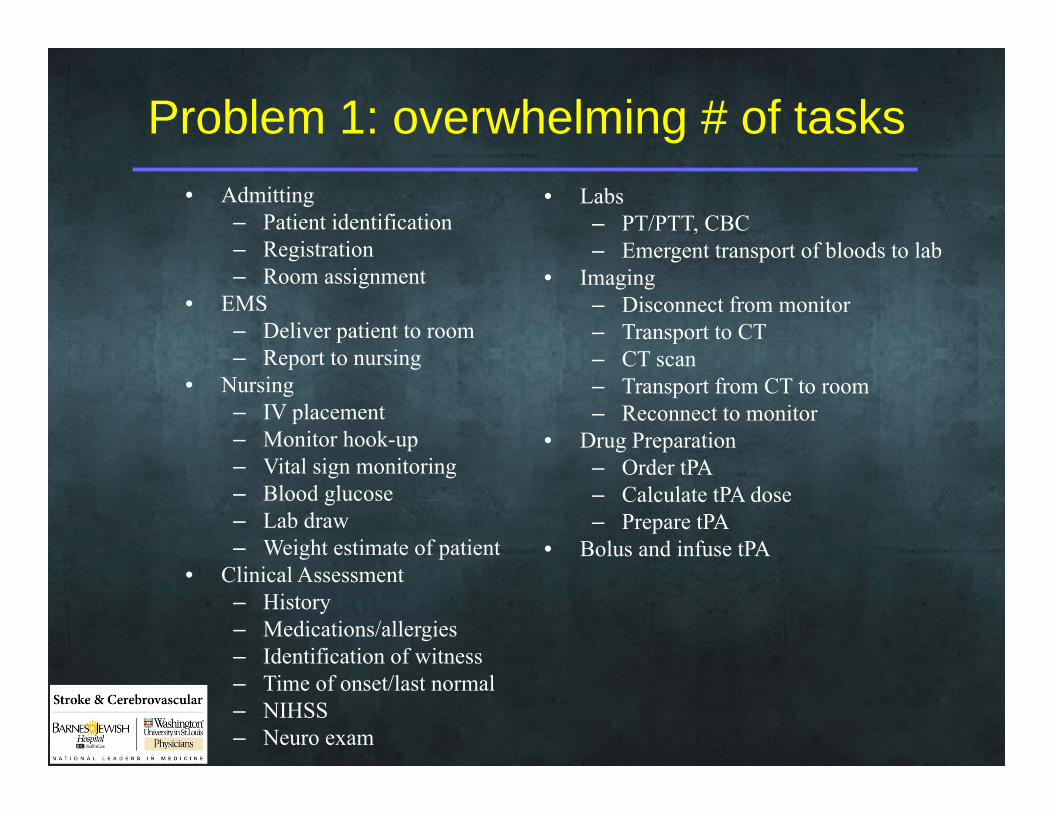
Problem 1: overwhelming # of tasks• Admitting
– Patient identification– Registration– Room assignment
• EMS– Deliver patient to room– Report to nursing
• Nursing– IV placement– Monitor hook-up– Vital sign monitoring– Blood glucose– Lab draw– Weight estimate of patient
• Clinical Assessment– History– Medications/allergies– Identification of witness– Time of onset/last normal– NIHSS– Neuro exam
• Labs– PT/PTT, CBC– Emergent transport of bloods to lab
• Imaging– Disconnect from monitor– Transport to CT– CT scan– Transport from CT to room– Reconnect to monitor
• Drug Preparation– Order tPA– Calculate tPA dose– Prepare tPA
• Bolus and infuse tPA

1
2 3 4 5
6
Emergent Unit 1
Nursing Station
Trauma Critical Care
CT
CT
Ambulance Bay
Problem #2: Inefficient choreography
Slide courtesy of JM Lee
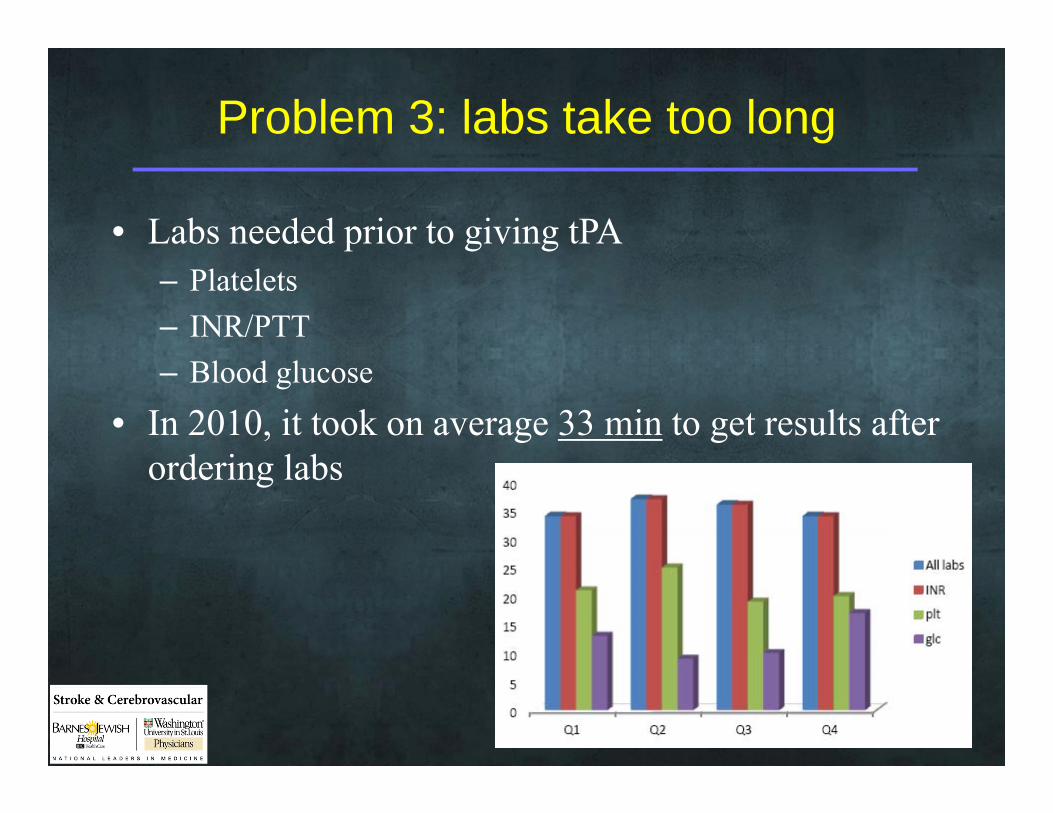
Problem 3: labs take too long
• Labs needed prior to giving tPA– Platelets– INR/PTT– Blood glucose
• In 2010, it took on average 33 min to get results after ordering labs
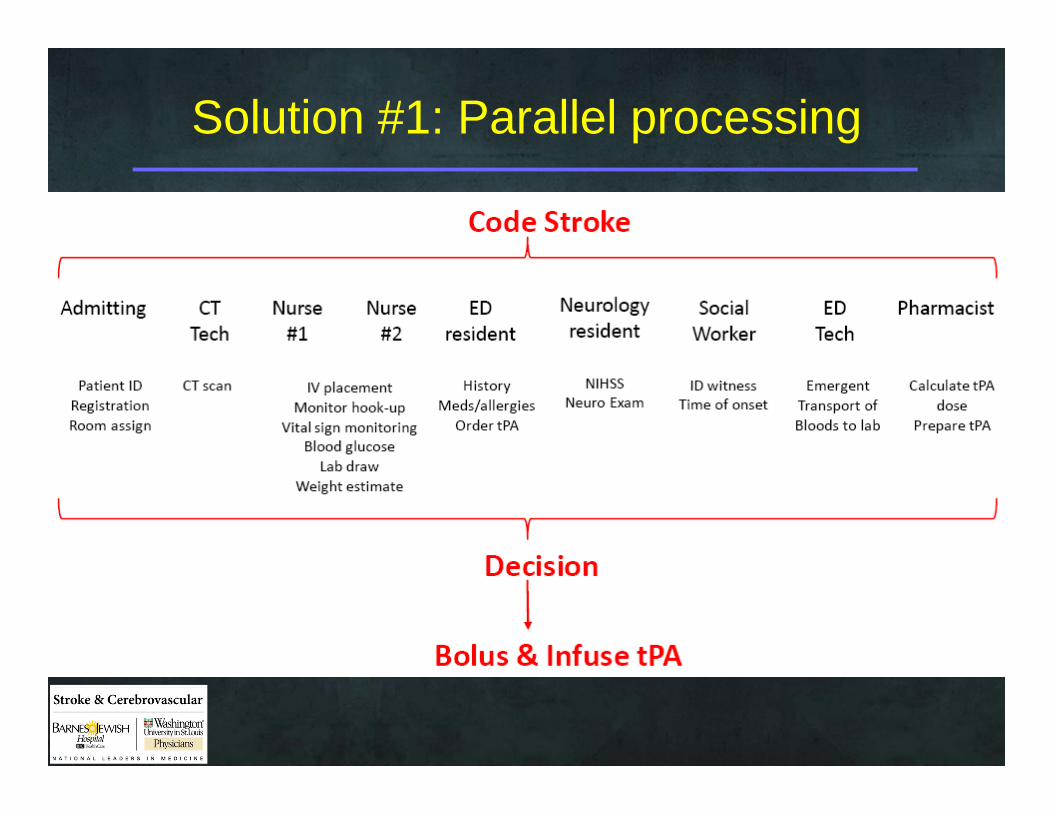
Solution #1: Parallel processing
2 3 4 5
6Nursing Station
Trauma Critical Care
CT
CT
1
2 3 4 5
6
Emergent Unit 1
Nursing Station
Trauma Critical Care
CT
CT
Ambulance Bay
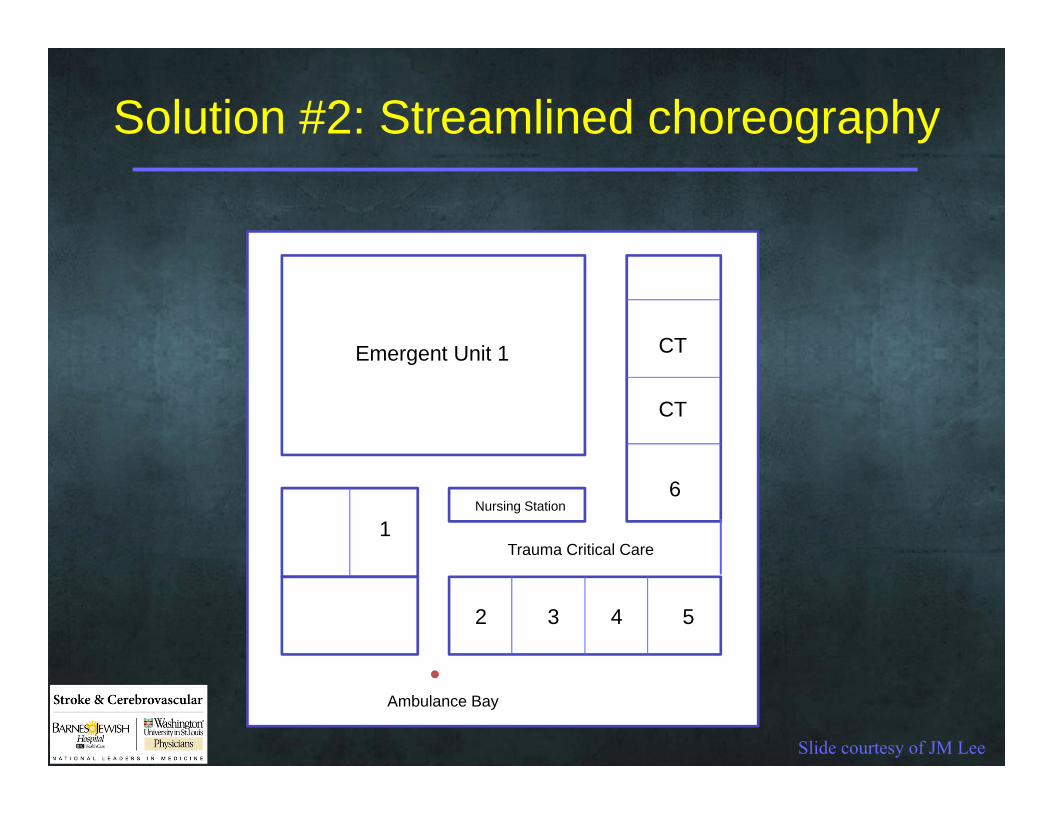
Solution #2: Streamlined choreography
Slide courtesy of JM Lee
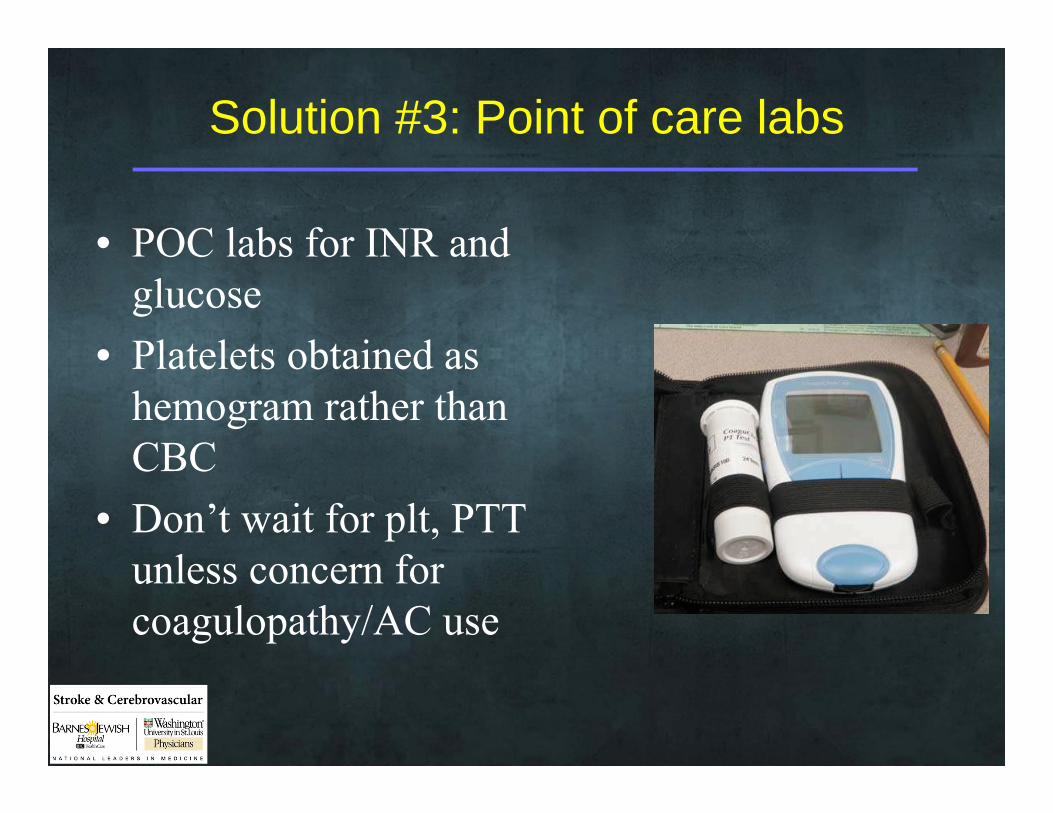
Solution #3: Point of care labs
• POC labs for INR and glucose
• Platelets obtained as hemogram rather than CBC
• Don’t wait for plt, PTT unless concern for coagulopathy/AC use
Metrics of success
• DTN time• Number treated• Safety
– Symptomatic ICH– Other hemorrhage– Stroke mimics

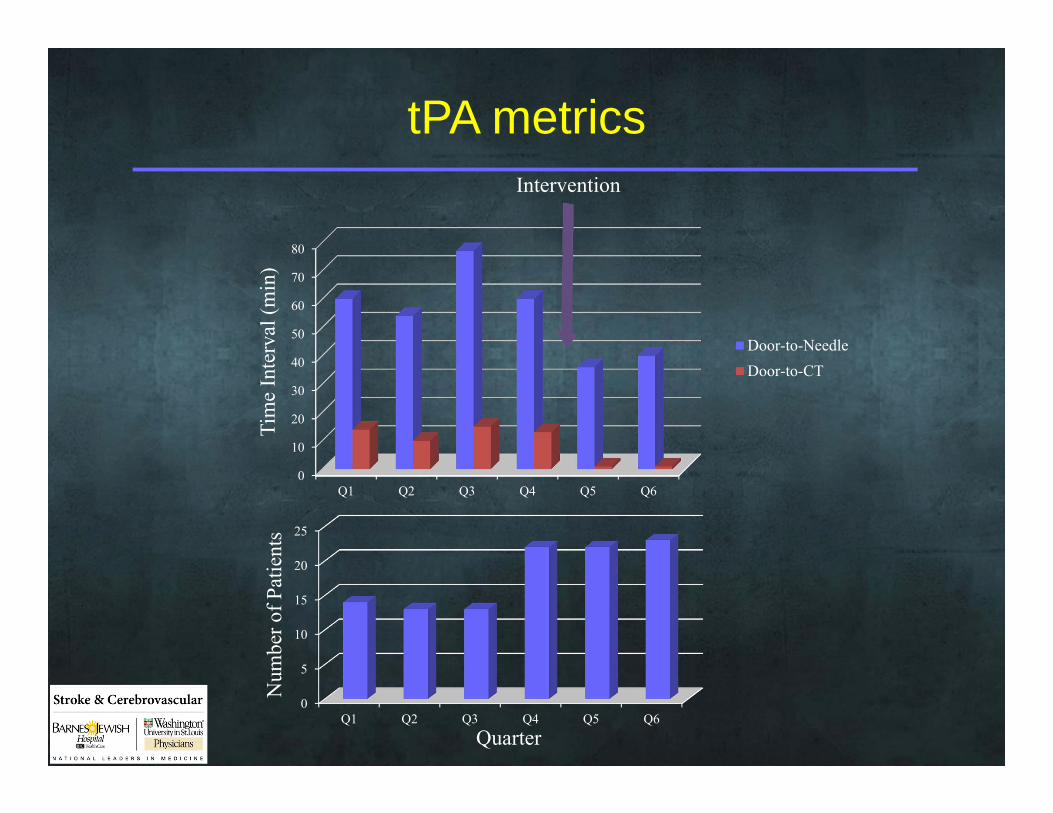
Protocol metrics
Tim
e In
terv
al (m
in)
Quarter
Intervention
0
10
20
30
40
50
60
70
80
Q1 Q2 Q3 Q4 Q5 Q6
Door-to-NeedleDoor-to-CT
0
5
10
15
20
25
Q1 Q2 Q3 Q4 Q5 Q6
Num
ber o
f Pat
ient
s
tPA metrics
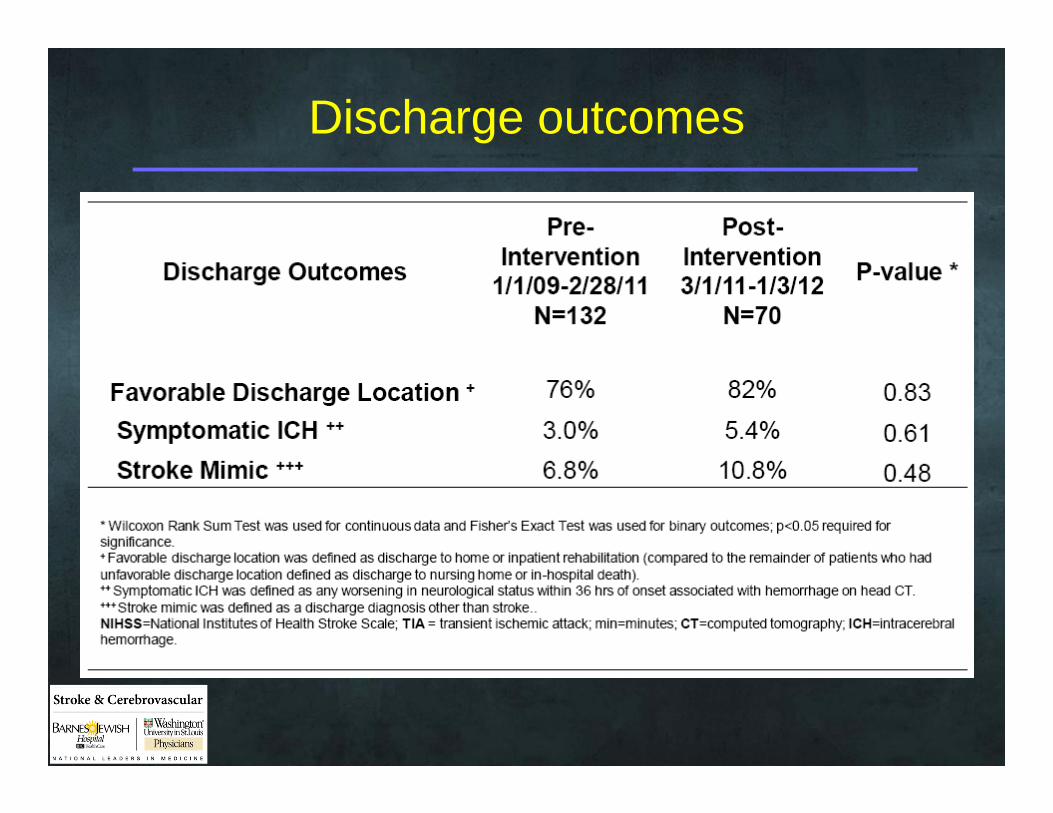
Discharge outcomes
Collateral benefits
• Greater treatment rates• More patients for research studies• Opportunities for interdepartmental
collaboration• Better education• Better resource utilization
Decreasing DTN at your institution
• Determine rate limiting step(s)– Stroke recognition?– Locating witness?– CT?– Labs?– Neurologist availability?– Radiologist availability?
Decreasing DTN:Hospital and Pre-hospital Efforts
• Community– Education: stroke recognition/mode of transport
• Hospital– Education– patient volume and tPA use
• EMS– Pre-notification– IV placement– Bring witness to ED
Decreasing DTN: ED efforts• Education: stroke recognition/counteract biases• Creation of a protocol• Parallel efforts (hx, time of onset, exam, blood, CT)• Point-of-care labs/“Code Stroke” designation• Don’t wait for plt, PT/INR, PTT (in most cases)• Ensure highest acuity status for access to CT scanner• Mix tPA early• Periodic reminders of time• Empower residents for decision-making• Telemedicine if no neurologist availability• Regular interdisciplinary review of cases/feedback
Stroke NeurologyDavid CarpenterAndria FordJin-Moo LeeRenee Van StavernAllyson Zazulia
NNICUMichael DiringerMichael Rubin
Neurology ResidentsTomoko SampsonRobert BucelliMwiza UsheScott NorrisPablo Bravo
NeuroradiologyColin Derdeyn
NeurosurgeryGreg Zipfel
Emergency MedicineBrian FroekleLaura HeitschPeter PanagosDavid Tan
Neurology FellowsNaim KhouryGyan Kumar
Neuroscience CenterMary SpencerAdrienne Ford
Neuroscience NursingJo-Ann BurnsTim TranorJennifer Wedner
Emergency NursingJennifer Williams
Lean EngineerVikas GhayalBrian Hoff