improving statewide freight routing capabilities for sub-national
TRANSCRIPT

October 2012Maura Rowell Andrea Gagliano Zun Wang Anne Goodchild Jeremy Sage Eric Jessup
WA-RD 7921
Office of Research amp Library Services
WSDOT Research Report
Improving Statewide Freight RoutingCapabilities for Sub-National Commodity Flows
Final Research Report Agreement T4118-55T4120-17K380
Statewide Freight Routing
IMPROVING STATEWIDE FREIGHT ROUTING CAPABILITIES FOR SUB-NATIONAL COMMODITY FLOWS
by Maura Rowell Andrea Gagliano Zun Wang Anne Goodchild
Graduate Research Asst Graduate Research Asst Graduate Research Asst Assistant Professor Department of Civil and Environmental Engineering
University of Washington
Jeremy Sage Eric Jessup Graduate Research Assistant Associate Professor
School of Economic Sciences Washington State University
Washington State Transportation Center (TRAC) University of Washington Box 354802
1107 NE 45th Street Suite 535 Seattle Washington 98105-4631
Washington State Department of Transportation Technical Monitor Barbara Ivanov
Co-Director Freight Systems Division
Prepared for
The State of Washington Department of Transportation
Paula J Hammond Secretary
October 2012
1 REPORT NO
WA-RD 7921 2 GOVERNMENT ACCESSION NO 3 RECIPIENTS CATALOG NO
4 TITLE AND SUBTITLE
IMPROVING STATEWIDE FREIGHT ROUTING CAPAshyBILITIES FOR SUB-NATIONAL COMMODITY FLOWS
5 REPORT DATE
October 2012 6 PERFORMING ORGANIZATION CODE
7 AUTHOR(S)
Maura Rowell Andrea Gagliano Zun Wang Anne Goodchild Jeremy Sage Eric Jessup
8 PERFORMING ORGANIZATION REPORT NO
9 PERFORMING ORGANIZATION NAME AND ADDRESS
Washington State Transportation Center (TRAC) University of Washington Box 354802 University District Building 1107 NE 45th Street Suite 535
Seattle Washington 98105-4631
10 WORK UNIT NO
11 CONTRACT OR GRANT NO
UW Agreement T4118 Task 55 WSU Agreement T4120 Task 17
SESRC WSU Agreement K380 12 SPONSORING AGENCY NAME AND ADDRESS
Research Office Washington State Department of Transportation Transportation Building MS 47372 Olympia Washington 98504-7372 Kim Willoughby Project Manager 360-705-7978
13 TYPE OF REPORT AND PERIOD COVERED
Final Research Report
14 SPONSORING AGENCY CODE
15 SUPPLEMENTARY NOTES
This study was conducted in cooperation with the US Department of Transportation Federal Highway Administration 16 ABSTRACT
The ability to fully understand and accurately characterize freight vehicle route choices is important in helping to inform regional and state decisions This project recommends improvements to WSDOTrsquos Statewide Freight GIS Network Model to more accurately characterize freight vehicle route choice This capability when combined with regional and sub-national commodity flow data will be a key attribute of an effective statewide freight modeling system To come to these recommendations the report describes project activities undertaken and their outcomes including 1) a review of commercially available routing software 2) an evaluation of the use of statewide GPS data as an input for routing analysis and 3) the design implementation and evaluation of a survey of shippers carriers and freight forwarders within the state The software review found that routing software assumes least cost paths while meeting user specified constraints and it identified criteria for evaluation in the subsequent survey The GPS data evaluation showed that significant temporal shifting occurs rather than spatial route shifting and it revealed significant limitations in the use of GPS data for evaluating routing choices largely because of the read rate Among the survey results was that the first priority of shippers carriers and freight forwarders is to not only meet customer requirements but to do so in the most cost-efficient way From a latent class analysis of routing priorities we discovered that distance-based classification best clusters similar routing behavior The report includes recommendations for implementing this within the Statewide Freight GIS Network Model 17 KEY WORDS
Freight freight modeling routing GIS network GPS data routing software
18 DISTRIBUTION STATEMENT
No restrictions This document is available to the public through the National Technical Information Service Springfield VA 22616
19 SECURITY CLASSIF (of this report)
None
20 SECURITY CLASSIF (of this page)
None
21 NO OF PAGES 22 PRICE
DISCLAIMER
The contents of this report reflect the views of the authors who are responsible
for the facts and the accuracy of the data presented herein The contents do not
necessarily reflect the official views or policies of the Washington State Department of
Transportation or the Federal Highway Administration This report does not constitute a
standard specification or regulation
iii
iv
CONTENTS
EXECUTIVE SUMMARY xi Freight Routing Software xi Evaluation of GPS Route Data xi Routing Priorities xii Recommendations xiii
1 OVERVIEW 1
2 FREIGHT ROUTING SOFTWARE REVIEW 2 Introduction 2 Software Name PCMiler (ALK Technologies) 3 Cost Alternatives 3 Industry Use 3 Primary Features 3 Unique Attributes 4 Limitations 4 PCMiler Usability 5 Software Name Rand-McNally (MilemakerIntelliroute) 8 Cost Alternatives 8 Industry Use 9 Primary Features 9 Unique Attributes 9 Limitations 10 Intelliroute Usability 10 Software Name Prophesy Transportation Software Inc 13 Cost Alternatives 13 Industry Use 13 Primary Features 14 Unique Attributes 14 Limitations 14 Software Name ProMiles 15 Cost Alternatives 15 Industry Use 15 Primary Features 15 Unique Attributes 16 Limitations 16 Software Name Cheetah 16 Cost Alternatives 16 Industry Use 16 Primary Features 17 Unique Attributes 17 Limitations 17 Software Name TSI Automation 17
v
Cost Alternatives 17 Industry Use 18 Primary Features 18 Unique Attributes 18 Limitations 18 Software Name Appian Logistics (Formerly Microanalytics) 19 Cost Alternatives 19 Industry Use 19 Primary Features 19 Unique Attributes 20 Limitations 20 Software Name Truck Dispatching Innovations (TDI) 20 Cost Alternatives 20 Industry Use 20 Primary Features 21 Unique Attributes 21 Limitations 21 Summary of Routing Software Review 21
3 EVALUATION OF USE OF GPS ROUTE DATA FOR EVALUATING ROUTE CHOICE 24 Introduction 24 The GPS Data 24 Case Studies 25
Case Study I TAZ 385mdashTAZ 545 26 Southbound Analysis 28 Northbound Analysis 31
Case Study II TAZ 180mdashTAZ 609 33 Eastbound Analysis 35 Westbound Analysis 36 Sample Size 37 Feasibility of Using GPS Truck Data to Identify Truck Routes 38 Conclusions 40
4 ROUTING PRIORITIES 42 Motivation 42 Literature Review 43 Study Methodology 45
Collection of Data via Survey 45 The Survey 47
Survey Descriptive Statistics 48 Industry Breakdown 48
Company Activity and Outside Carriers 49 Services Provided Breakdown 50 Number of Vehicles 51 Truck Type Breakdown 51
vi
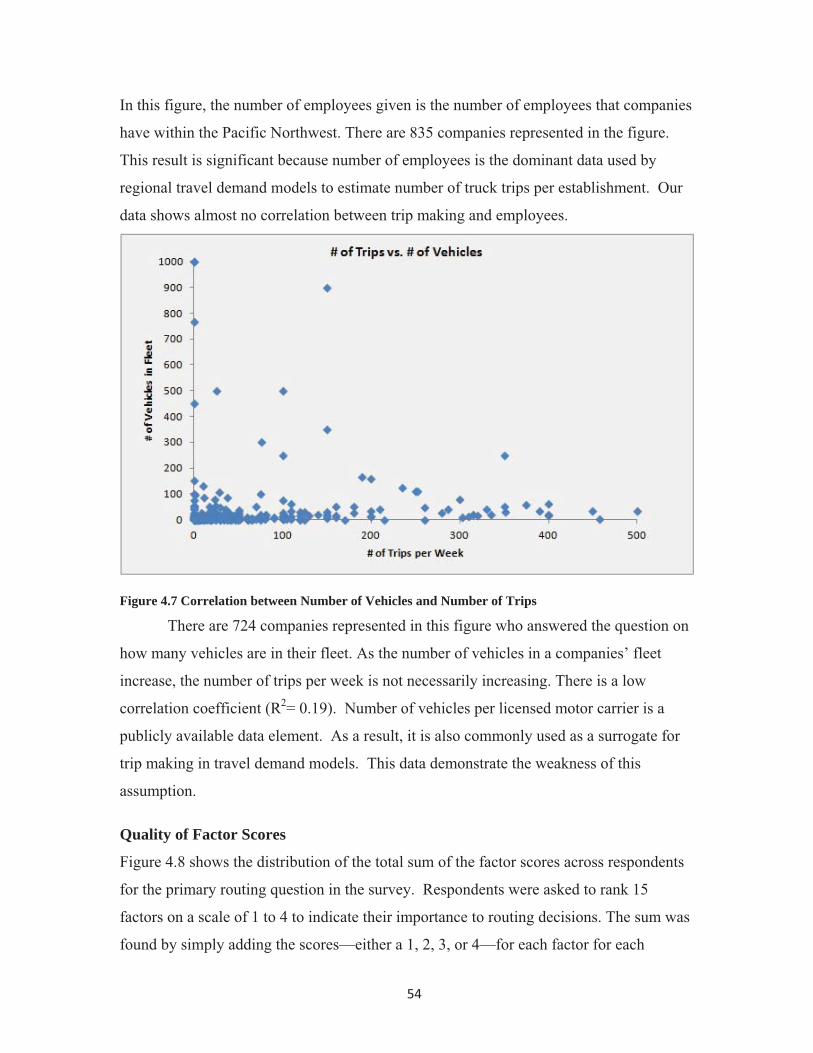
Frequency of Changes in Routing Shipments 52 Commodities 53 Number of Weekly Trips versus Numbers of Employees and Vehicles 53
Quality of Factor Scores 54 Importance of Routing Factors 55 Use of R 57
Results 57 Item Response Theory 58
Item Information 60 Correlating Individual Factors Scores with Transportation Features 61
Road Grade 62 Refueling 63 Parking 64 Hours of Service Limits 64 Size and Weight Limits 65 Conclusions 66
Routing Categories 66 Conclusion 70
5 RECOMMENDATIONS FOR MODIFICATIONS TO THE STATEWIDE GIS NETWORK MODEL 72
6 CONCLUSIONS 75
7 REFERENCES 77
vii
FIGURES
31 Monthly GPS Data and TAZ Layer 25 32 Case Study I Truck Trips between TAZ 385 and TAZ 545 26 33 Southbound Travel Time Distributions along I-5 and I-405 28 34 Southbound Travel Speed Distributions along I-5 and I-405 29 35 Southbound Truck Proportions and Travel Time Using I-5 and I-405 by
Time of Day 30 36 Northbound Travel Time Distributions along I-5 and I-405 31 37 Northbound Travel Speed Distributions along I-5 and I-405 32 38 Northbound Truck Proportions and Travel Time Using I-5 and I-405 by
Time of Day 33 39 Case Study IImdashTruck Trips between TAZ 180 and TAZ 609 34 310 Eastbound Truck Proportions and Travel Time Using I-90 and SR 520 by
Time of Day 36 311 Truck Proportions and Travel Time Using I-90 and SR 520 by Time of Day 37 312 Relationship between Truck Route Length and Distance between Two
Successive GPS Reads 39
41 Industry Breakdown 49 42 Company Activity and Outside Carriers 49 43 Service Types Provided 50 44 Number of Vehicles per Company for Carriers 51 45 Vehicle Types in Carrier Fleets 52 46 Correlation between Number of Employees and Number of Trips 53 47 Correlation between Number of Vehicles and Number of Trips 54 48 Frequency of Total Sum of 15 Factors Influencing Routing Decisions 55 49 Item Operation Characteristic Curves (IOCC) 59 410 Item Information Curves 61 411 Latent Classes with Long-Haul Covariate 67 412 Long-Haul as a Predictor of Latent Class 68 413 Parameter Coefficients 69
viii
TABLES
21 Summary of Reviewed Software Routing Attributes 22
31 Attributes of Trips between Zone 385 and Zone 545 27 32 Truck Performance along I-5 and I-405 27 33 Southbound Travel Time Distributions along I-5 and I-405 28 34 Time of Day Breakdown 29 35 Northbound Truck Performance along I-5 and I-405 31 36 Attributes of Trips between TAZ 180 and TAZ 609 34 37 Truck Performance along I-90 and SR 520 35 38 Eastbound Truck Performance along I-90 and SR 520 35 39 Westbound Truck Performance along I-90 and SR 520 37
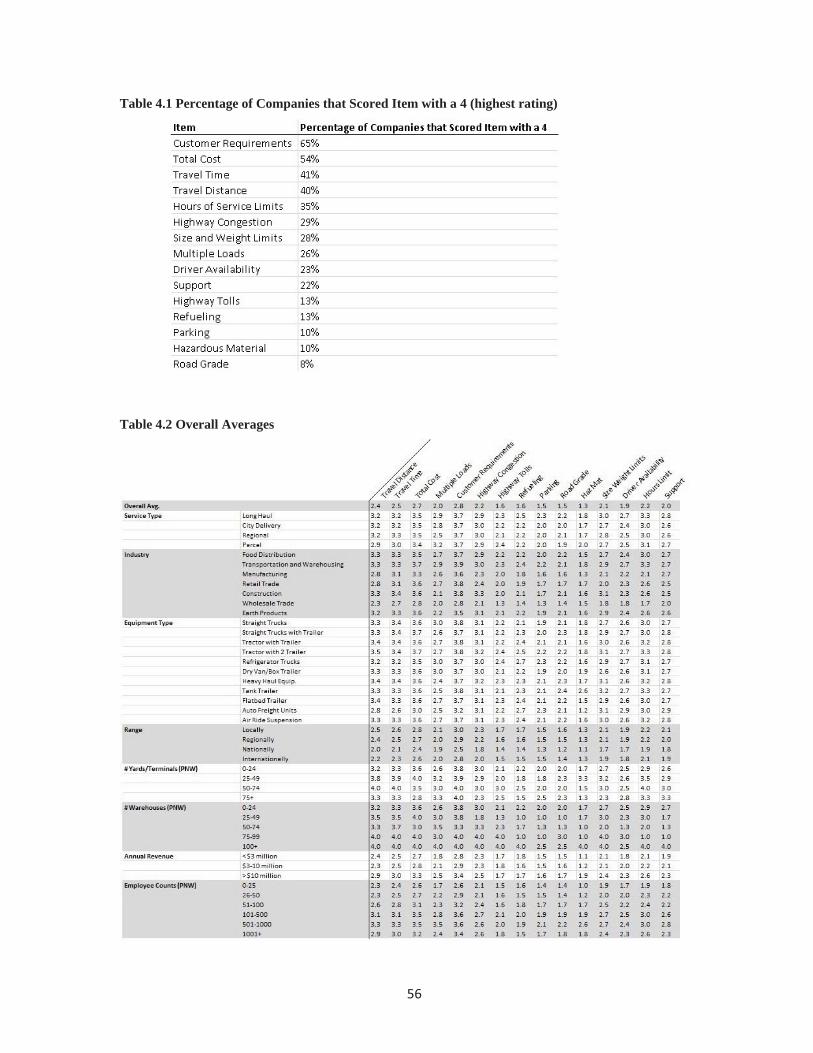
41 Percentage of Companies that Scored Item with a 4 56 42 Overall Averages 56
51 Distribution of Truck Sizes 74
ix
x
EXECUTIVE SUMMARY
Existing transportation network models assume that vehicles select the least costly path
between origin and destination This cost can entail time distance money or a
combination of these factors This project used three approaches to investigate the
reasonableness of this assumption and produced recommendations for revising the least
cost routing approach for the statersquos geographical information systems (GIS) network
model
Through this work we also described the state of the art in freight routing
software the utility of the Washington State Department of Transportationrsquos (WSDOT)
Global Positioning System (GPS) data for understanding routing patterns and the routing
priorities of shippers carriers and freight forwarders These interim results are fully
described in this report and are summarized below
FREIGHT ROUTING SOFTWARE
One task of this project was to conduct a review of commercially available routing and
mapping software These software programs are designed to optimize the routes of
individual trucks or fleets not to assign all trucks to routes (as a statewide freight model
would do) However their logic reveals the factors of importance to carriers when they
make routing decisions We identified routing factors and algorithms of PCMiler
Rand-McNally ProMiles Prophesy and ArcLogistics which were found to include
considerations for truck height and weight infrastructure height and weight restrictions
toll expenses and fuel purchasing cost While we had assumed that some hierarchy of
priorities would be built into the software we found that this was not the case Instead in
each case the prioritization is left to the user Every product examined uses a shortest
path assignment once other constraints have been met (eg size and weight restrictions)
however toll and fuel acquisition costs can be added to the route cost
EVALUATION OF GPS ROUTE DATA
To assess the utility of using GPS truck data to improve the link-cost functions that are
part of the WSDOT statewide freight model truck travel patterns were examined
Specifically two case studies examined route choice by time of day system performance
xi
and origin-destination The case studies were selected in areas that experience
congestion with the assumption that congestion may cause route shifting behavior We
discovered that instead of route shifting trucks in the Puget Sound exhibited strong time
of day shifting behavior
We found that because of the 15-minute intervals between reads route diversions
that occur within 20 miles of the previous route decision (the maximum assumed travel
distance in 15 minutes) cannot be identified This means that many route choice
decisions within the Puget Sound that is those where route choice decisions are possible
at each block or freeway exit remain undetected We concluded that although GPS data
are able to provide reliable transportation performance information they are not currently
sufficient for analyzing or estimating truck route choices
ROUTING PRIORITIES
To identify routing priorities a survey was conducted of approximately 800 shippers
receivers and carriers of freight in Washington State The survey was designed to find
the strategies that companies use when determining routes More specifically its goal
was to confirm or refute the least cost assumption used in existing network models We
found that overwhelmingly respondents were meeting customer requirements while
minimizing time cost or route distance Respondents to the survey were also asked to
rank the level of influence of 15 factors that influence routing decisions After the survey
had been completed analysis of the responses included ordinal logistic regression and
latent class analysis These tools allowed us to identify the correlations between routing
behavior and other characteristics of a company such as number of trucks or primary
commodity and to group the respondents with others who had the same routing
behaviors
The analysis found five factors that differentiated among respondents and allowed
us to group them into routing categories 1) hours of service limits 2) availability of truck
parking 3) driver availability 4) refueling locations and 5) road grade Long-haul
trucking city-delivery trucking regional trucking the equipment companies own and
whether or not a company backhauls freight were found to be important predictors of
how companies ranked the 15 routing factors and thus their routing category From
these results the respondents were classified into three groups titled urban trucking
xii
local-regional trucking and regional long-haul trucking These categories should be used
when trips are assigned to routes on the network
RECOMMENDATIONS
The state of Washington possesses a statewide GIS network model Currently if the trip
origin and destination are known the model will assign the trip to the roads that provide
the shortest route between the origin and destination Through the survey conducted for
this project we confirmed that the shortest path is overwhelmingly the appropriate logic
to use once the origin destination and road network are known However the following
general improvements should be made to this model logic
Network
a Apply a truck usable network (based on the Household Goods Mileage Guide)
not the entire road network to account for road classification
b When commodity data are available hazardous material trips should be identified
and relevant infrastructure restrictions captured in the network
c Include seasonal road closures
d Update speeds to reflect true travel speed obtained from the truck performance
measures project rather than the speed limit
Objective Function
Least distance or least time should be converted to dollars so that tolls can be added to
the cost of travel along a link This will also allow emissions cost to be added to a link
with an assumed emissions value
Spatial Variation
Three categories of carriers should be reflected in the routing logic urban trucking local-
regional trucking and regional long-haul trucking For carriers in these groups the
following changes should be incorporated
a For trips within urban regions use the distribution of truck sizes present for those
that deliver in cities and assume no backhaul
b For origin-destination pairs of over 300 miles use a network that is navigable by
large and heavy trucks
xiii
c Require origin-destination pairs that exceed 500 miles to choose routes that
include a truck parking location every 500 miles (this will require documentation
of truck parking locations)
xiv
1 OVERVIEW
This report describes the work of three distinct research streams that culminates into a
broad understanding of routing decision-making among freight carriers shippers and
freight forwarders in Washington state and on the basis of this understanding
recommendations for how to develop the Statewide Freight Geographic Information
Systems (GIS) Network Model1 to better represent routing behavior within this
community When sub-national commodity flow data are available the state freight
model will be able to assign strategic routing choices in a way that better reflects industry
practice
The first part of this report provides a thorough review of commercial routing
software identifying its primary characteristics market penetration and price This is
followed by a chapter that describes the utility of using statewide Global Positioning
System (GPS) data for routing analysis given the temporal quality of the current data
This is demonstrated through the use of two case studies Finally the development
implementation and analysis of a survey are described The survey allowed for a
detailed examination of routing decisions with timely data By synthesizing the lessons
learned from each of these tasks the report concludes with recommendations regarding
strategic routing decision making and how the Statewide Freight GIS Network Model can
be modified to better capture truck routing within the state
1 The Statewide Freight GIS Network Model was developed by UW and WSU researchers in 2009 It is housed at the University of Washington The model currently lacks statewide commodity flow data but has been used to evaluate specific supply chains including potatoes and diesel distribution
1
2 FREIGHT ROUTING SOFTWARE REVIEW
INTRODUCTION
Freight routing needs and input variables have a special set of requirements that the
typical dashboard navigation systems based heavily on and designed for passenger
vehicle travel may not be fully equipped to handle To meet the unique routing needs of
freight service providers several software and mapping companies have developed
specialized commercially available routing software Much of the freight routing
industry is founded on a handful of products with many third-party companies then using
those as the basis for their add-on (complete freight management) systems Generally
PCMiler Rand-McNally ProMiles Prophesy and to a lesser degree ArcLogistics form
the base of freight routing The common deviation from the typical dashboard navigation
system found within all versions of the freight routing software is to allow the freight
companies to dictate the special routing requirements of their trucks Special routing
inputs most often take the form of height weight and load-type restrictions that may
require trucks to avoid particular segments of a route Additionally many of these
products take into account toll expenses and fuel purchasing optimization needs that can
greatly affect the travel costs of each load
The following review highlights the applications and routing decision inputs for
each of the four major software products identified above followed by a brief outline of
the third-party systems partnering with these companies and the additional services that
they provide Many full service freight management companies utilize the mapping and
routing software of these companies to accommodate the complete needs of shippers and
carriers These third-party add-on companies integrate the routing outputs to develop
comprehensive rate quoting systems as well as accounting tax and payroll management
functions
Note that each of these companies offers multiple programs that encompass all
aspects of the freighting industry such as billing and maintenance however this review
focused mainly on routing and fueling decision inputs The content of this review was
based on readily available information from the websites and user guides of the software
producers with the exception PCMiler and Rand-McNally MileMakerregIntelliRoutereg
2
Given that these two represent the majority of industry usage the trial version of each
was obtained and tested and extended reviews are provided
SOFTWARE NAME PCMILERreg (ALK TECHNOLOGIES)
Cost Alternatives
PCMilerreg
Single User (Windows) $189500
Data Modules (single users) PCMiler Tollsreg $FREE
PCMiler Streets- USreg $110000 PCMiler Streets- Canadareg $59500 PCMiler HazMatreg $110000
Interface Modules(Requires 5-User License) PCMiler RailndashConnectreg $350000 PCMiler Connectreg $299500
This is only a partial product list See PCMilerreg Product line price list for more details
Industry Use
PCMilerreg claims to be the leader in routing mileage and mapping software with 96
percent of the top motor carriers the Department of Defense (DoD) the General Services
Administration (GSA) and the Federal Motor Carrier Safety Administration (FMCSA)
on its client list PCMilerreg generates truck-specific directions and mileage summaries at
the turn-by-turn street level Additionally it has an intermodal analysis function that
calculates alternative rail intermodal routes between origin and destination This allows
for comparisons in fuel consumption and carbon emission between modes
Primary Features
The streets application in PCMilerreg provides dock-to-dock driving directions for truck-
specific routes based on US Census TIGER files Route designation inputs account for
truck characteristics of height weight and length to ensure adherence to bridge height
load limit and other truck restrictions For example PCMilerreg has an ldquooverride
restrictionsrdquo tab that allows the user either to abide by the ldquotruck prohibitedrdquo and ldquotruck
3
restrictedrdquo designations of a given road or override them if the user has a light vehicle in
which case the generated route will include ldquotruck restrictedrdquo road but still avoid ldquotruckshy
prohibitedrdquo designations Routes are generated with either practical or shortest route
parameters in addition to toll discouraging and HazMat routing Additional route
designation choices include the avoidance of dangerous turns as well as urban road
classifications
Similar to other programs PCMilerreg offers the ability to incorporate company
fuel networks into the routing decisions and the turn-by-turn directions This application
calculates and suggests not only where to purchase fuel but also how much to purchase
at a given location given truck-specific inputs and the fuel choices further along the
current route
It also allows the user to reconcile the cost savings or losses incurred by using a
toll road or taking a longer non-toll route for all truck specific routes Similar to the fue l
optimization this software accounts for user negotiations with various toll authorities
Unique Attributes
Unique features that PCMilerreg allows include route customization along favored roads
or road segments and through specific jurisdictions The HazMat application allows the
user to generate a route on the basis of one of six different HazMat types (caustic
explosives flammable general inhalants and radioactive) These HazMat-specifi c
directions ensure compliance with department of transportation (DOT) and other Haz Mat
regulations and increase the reliability of correctly estimating operating costs and driver
pay PCMilerreg is the also only software reviewed that promotes its ability to highlight
inter-modal connectivity and provide truck versus rail comparisons including carbon
emission calculations
Limitations
The primary limitation similar to several of the other routing software programs is that
PCMilerreg does not allow or utilize less-than-truckload (LTL) inputs into its route
calculations Therefore for industries or businesses that move and ship primarily L TL
type freight this software will not be best suited for these purposes
4
PCMiler Usability
Below is a sample of the options tested within PCMiler trial version with detailed
summary descriptions from the usersrsquo manual
Generating Routes and Mileage
The PCMiler mapping representations are created through ALK Technologiesrsquo
proprietary North American Highway System representations The highway systems are
derived from official state highway state DOT county and local maps as well as
information from industry users Rendered distance calculations are a reflection of
straightforward summations of the road segments travelled on the identified routes
Where specific addresses are used for origin and destination the exact mileage and
direction are provided If no exact addresses are given then the nearest Key City is used
to provide distance and route as accurately as feasible
Basic Route Definition
PCMiler provides a basic point and click user interface that allows users to specify the
origin intermediate stops and destination locations Once routes have been created they
are displayed both in tabular and map formats The tabs display generated results for
miles cost per mile (set by default or adjusted by user inputs) and hours of the route
both in total and for each leg of the trip By default this occurs for the practical miles
route Users can quickly copy and convert that to a user selected shortest route option
By default the software generates the route in the stop order entered by the user
however the stops may be easily re-sequenced to optimize stop order efficiency The re-
sequencing can be done for the entire sequence but it leaves the first and last stops as the
directed starting and stopping endpoints
Users can easily manipulate the scale and appearance of the map displays with
point and click operations as well as adjust components such as legends and scale bars
with drag and drop operations Automatic label and icon displays are set to varying
degrees of scale For example when a map is zoomed to a detail level of eight out of
twelve points of interest such as fueling stations are displayed Users can enter stop
locations through an address window designate longitudelatitude points and also select
5
them from the map with a point and click operation Maps additionally display truck stop
locations which can be added as stoprest times Routes can be easily manipulated
within the map view The user can manually select roads or road segments to favor o r
avoid or to override default restrictions
Practical Routes
Practical routes represent the distances and driving routes that a driver would typi cally
take to minimize time and cost Practical routes are created with consideration of the
tradeoffs between the most direct paths and the advantages of staying on major high ways
Hierarchically practical routing assigns priority starting with Interstate highways
followed by toll roads then secondary highways Routing decisions made within
practical routes additionally consider truck-restricted roads urbanrural designations and
designated principal and secondary through-routes When route re-sequencing is done
under a practical routing setup the re-sequencing minim izes total time
Shortest Routes
Shortest route calculations exclude all the considerations of practical routes in favor of a simple
fewest-miles-travelled requirement while still observing truck restrictions When route re-
sequencing is done under a shortest routing setup the re-sequencing minimizes total distance
National Network Routes
Using the routes designated by the Surface Transportation Assistance Act of 1982
(STAA) PCMiller also offers a routing option that determines routes and distanc es in
accordance with those routes most reasonable and legal for the larger trucks authorized
under STAA When the user selects this routing option the software creates a route that
stays on the national network to the maxim um extent feasible Where deviation must
occur the software selects the shortest available routes that still meet other restrictions
the user has already identified When route re-sequencing is done under a national
network routing setup the re-sequencing minimizes total distance
PCMiler also offers an additional component to the National Network routing
option in the form of 53-ft102-in routing for these dimensioned trailers and their
additional restrictions Similar to the basic National Network routing the software
6
attempts to keep the route on network highways where feasible and provides a warning
indicator when deviance is required
Toll Avoidance
With the PCMiler tolls add-on module the user can compare costs between taking a toll
road and using a route that avoids the tolls thus enabling a more cost-effective decision
The toll cost calculations are available for both the US and Canada and are updated
quarterly The toll route add-on is directional-specific and allows for user entry of
discounted toll programs PCMiler identifies two potential sources of inaccuracy in its
toll calculations These may arise from weight-specific tolls if the user has not ente red
vehicle dimensions In addition some tolls vary by time of day in this instance th e
software calculates the toll based on the highest rate
The first potential inaccuracy is easily remedied by ensuring that the user has
identified truck dimensions (axles height and weight)
Manipulating the toll options is a rather simple task in the route option windows
The software produces toll estimates for each leg of the selected routes (any of the above
routing options can be used in addition to the toll avoidancecalculation) and cumulative
toll costs are observable in the state summary page Additionally toll comparisons can be
made between default settings and specified toll avoidance This action yields a
comparison of miles cost time and toll cost even when the program is told to avoid
tolls some residual tolls may be used to preclude excessive avoidance When route re-
sequencing is done under a toll avoidance routing setup the re-sequencing minimizes
total toll distance
Route Creation Highlights
One of the more valuable capabilities of the software is the ability to quickly generate
duplicate routes so that users can quickly compare different routing alternatives such as
different route types or the addition of one more stop Additionally users can adjust
driver needs such as on-duty and off-duty costs and can select to include these in the
total costs estimates as well as any potential empty miles that must be considered
Many users will likely already have significant volumes of customer addresses
loaded in some type of database PCMiler (with the Streets module) allows importation
7
of from xls or txt files through a geocoding process In testing the programrsquos ability to
successfully geocode addresses from files we attempted to input several on-hand
databases with a reasonably high success rates If longitudelatitude values are available
this will greatly increase matching These locations can then be added to the userrsquos
Custom Places records for future use
The fuel optimization add-on is another valuable asset of this program It allows
users to calculate fuel optimization for each truck in their fleet by inputting specific fu el
capacities and gallons per minute When this add-on is then applied to a specific tr uck
the software automatically adds in optimal fuel stops along the designated route In
addition the program suggests how much fuel to purchase and the estimated cost of that
purchase fuel cost data are updated daily in conjunction with wwwfueladvicecom
PCMiler offers an intermodal analysis add-on tool along with its rail-connect
add-on This tool computes the origin-destination costs of using rail rather than trucks
Comparisons are made for fuel consumption mileage an d carbon emissions This
software was found to be quite user friendly allowing for a quick grasp of its general
organizational flow The attributes to be minimized under each routing scheme are clear
make logical sense and are flexible enough to allow users to address specific demands
and truckload types Additionally the softwarersquos provisions for user customized routes
allow routes to be created with learned characteristics of roads that may not be accounted
for in the database This attribute is likely valuable where local drivers or dispatchers
know key roads or particular times of the day or year to avoid and dispatchers can also
adjust for updated information on road closures This is not done automatically in the
software but it is easily adjusted with a knowledgeable dispatcher
SOFTWARE NAME RAND-MCNALLY (MILEMAKERregINTELLIROUTEreg)
Cost Alternatives
IntelliRoutereg
1-user standalone 1st year initial license fee $1995 Annual license renewal fee (every year thereafter) $599
5-user LAN 1st year initial license fee $3495 Annual license renewal fee $1049
8
Industry Use
MileMakerreg by Rand-McNally is routing and mileage software that features both
household goods (HHG) and practical routing solutions Rand-McNally claims over 91
percent of the Fortune 500 shippers and 94 percent of the leading freight carriers as
clients
Primary Features
MileMakerreg provides truck- and trailer-specific routing options that optimize multiple
stop routes in accordance with user selected preferences and avoidance inputs Data are
updated to customers quarterly and with the IntelliRoutereg software users are updated on
construction activity every two weeks In addition to creating industry standard (HHG)
and practical routing options for the shortest or fastest routes MileMakerreg also produces
stateprovince mileage summaries and produces hub routing calculations to analyze
shipping lanes from one point to many destinations
The software also enables users to avoid out-of-route miles by accurately
accounting for truck specifications and HazMat restrictions It promotes the avoidance of
tickets and accidents by ensuring road and bridge accommodation and claims to be four
times more accurate than PCMiler
Like the other leading software Rand-McNally also optimizes routes on the basis
of daily fuel prices and produces a fuel itinerary that details where trucks should stop
along the route and how much fuel they should get Additionally the software produces
state mileage tax breakdowns
Unique Attributes
A lane rate add-on allows accurate analysis of market rates so users can competitively
quote rates The add-on works with a compilation of data from carriers in the major
market cities in the US and Canada and estimates rates on the basis of current freight
bills Reports are available for vans refrigerated carriers and flatbed carriers and include
minimum a nd maximum rates per mile as well as fuel surcharges per m ile
9
Limitations
This software does not have the intermodal capabilities that are available in PCMiler
Additionally its toll management is somewhat cumbersome and not clear (See the
detailed product test for more information)
Intelliroute Usability
In a fashion similar to PCMiler a sample of Rand McNallyrsquos IntelliRoute software was
hreviewed T e details below highlight the findings from that review along with notable
components from the Userrsquos Manual as the trial software was limited to 50 transactions
and therefore only a fraction of the product could be tested For the route generation
actually tested IntelliRoute produced results similar to those of the PCMiler software
Generating Routes and Mileage
IntelliRoute frames its route and mileage generation as inquiries Inquiries are in the
form of mileage inquiries route inquiries and a batch processing routine Mileage
inquiries have several basic forms and when they are performed in the route inquiry
application they also produce detailed routing information on a state by state basis
HHG MileageRoute
Mileage determined on the basis of the shortest distance between locations on truck-
usable roads is based on Release 19 of the Household Goods Mileage Guide (HHG) and
HHG tariffs rules rules include highways bridges and ferries designated as ldquotruckshy
authorizedrdquo These miles are used in standard freight weighting and auditing
Practical MileageRoute
This software uses the same road network as that of the HHG option however it does
not account for HHG tariff rules
Quickest MileageRoute
This function makes use of IntelliRoutersquos GPS-accurate road network and c alculates the
truck-usable mileage on the basis of shortest time between locations
10
Lowest-Cost Route
This function uses the same GPS-accurate road network as above but in this scenario it
calculates the route on the basis of lowest-cost between locations Lowest cost is based
on a combination of time fuel cost per milekilom eter fuel cost per gallon tolls and
maintenance costs These have default settings that can be adjusted for specific trucks
Route Creation Highlights
The input of locations for route generation in IntelliRoute is at least as user friendly as
that of PCMiler and offers a range of suitable entry styles Once all locations have been
entered the user can manually order the origin stops and final destination
Alternatively users can optimize the location list entirely or designate only a specified
destination point The variable that is optimized depends on the type of routing option
selected
Once a route has been created using one of the above types the program create s
an itinerary The itinerary has a user friendly color coded breakdown of points For
example orange text in the itinerary denotes roadwork information This ability is
enabled when the user has access to online RoadWorkTM updates Users can have several
options in dealing with roadwork delays Either they can apply roadwork to all quickest
and lowest-cost routes or they can choose to route around construction and delays
Additional color coding highlights include truck-type violations along an itinerary These
violations for 53-ft102-in double- and triple-trailer options are highlighted in red bo th in
tabular format and in the map giving clear indication of potential conflicts alon g the
selected route These conflicts appear as a result of using the IntelliRoute Streets feature
which gives street-level directions but without truck-type attributes
In addition to the basic routes described above the interface allows point and
click selection of truck and trailer types These types include trailer length (lt48 ft or 53
ft) truck width (lt96 in or 102 in) and number of trailers (single double or triple) The
basic route types are then applied to truck-specific guidelines Additional constraints can
be easily selected to account for hazardous materials Federal regulations regarding
hazardous material transport are coded into road attributes so that allowable roads can be
11
hierarchically utilized IntelliRoute thus recalculates the routes using the basic route
types along with the added HazMat restrictions
IntelliRoutersquos accounting for toll roads is somewhat unclear The software allows
users to select a ldquotoll road biasrdquo level This level varies from 0 (toll roads used) to 100
(toll roads not used) The clarity issue is no information is available to explain how the
varying levels of bias influence the decision to use or not use a given stretch of toll road
The end points (0 100) are clear but the difference between a ldquo40rdquo and ldquo60rdquo are not
There is no information on how many added miles and hours of driving are acceptable a t
a given bias level
Driver breaks and stops are potentially significant components in dete rmining
travel time and costs and these are easily added into the estimated arrival time
calculations These can be broken down by break type (food or fuel) with predetermine d
frequency and duration Fuel breaks can be either manually input or optimized through
the ldquofuel networkrdquo options Users can input the locations of the participants in their fuel
networks These can subsequently be included as locations for determining appropriat e
routes Alternatively users can search along the routes for truck stops with the desir ed
amenities Amenities include parking pumps service repair electrical wash driver
services and food Similar to PCMiler IntelliRoute is compatible with
wwwfueladvicecom to allow for optimizing fuel purchases
Once routes have been created the user can manipulate the results from the
generated maps page These manipulation options include designating segments as
preferred or to be avoided in order to optimize local knowledge of road issues and
company preferences With the Street-Level add-on component users can input specific
addresses for origin and destination points and receive turn by turn directions at these
locations The program generates street maps for both endpoints
This software has a slightly more user friendly interface than PCMiler however
PCMilerrsquos truck trailer and route specifications are much clearer In particular
Intelliroutersquos toll adjustments are cumbersome and despite the programrsquos ability to
highlight conflicting street segments it is unclear how the user can remedy a potentia l
conflict or the degree to which the program offers suggestions to avoid one Both
programs make use of a connection to wwwfueladvicecom and are thus comparable on
12
fuel optimization To IntelliRoutersquos credit there Roadwork add-on and the output it
generates to alert users of roadwork delays appears to be quite helpful
SOFTWARE NAME PROPHESYreg TRANSPORTATION SOFTWARE INC
Cost Alternatives2
Commercial Mileage and Routing with Map Multi-User $49500 Single-User $39500
Fuel Tax Reporting Software ndash Tax Tally Multi-User $49500 Single-User $39500
Driver Log Auditing Software - LogPlus Multi-User $49500 Single-User $39500
Freight Billing ndash FreightBill Express 1 Truck $99500 2-5 Trucks $119500 6-10 Trucks $139500
Driver Management Software ndash DriverTrax Multi-User $49500 Single-User $39500
Total Compliance Suite ndash ProphesyONE Multi-User $109500 Single-User $89500
Industry Use
Prophesyreg touts itself as the industryrsquos leading trucking software solution for truckload
carriers LTL carriers brokers and private fleets (over 12000 company clients) It offers
planning and compliance software that includes freight billing mileage and routing fuel
tax reporting driver log auditing fleet maintenance driver management fuel purchase
optimization and online mileage
2 All cost information is as of June 2010
13
Primary Features
Routing software enables the creation of Class 8 driving directions with multiple stops
and calculates industry standard and practical miles of the routes Route generation
considers height restrictions low weight bridges and overpasses seasonal road closures
and avoidance of toll roads Prophesy EasyStreetreg provides real-time dock-to-dock
directions for commercial vehicles with additional consideration for one-way streets
right hand turn restrictions and dangerous intersections It favors low-traffic lanes larger
roads and left hand turns and is continually updated to account for temporary r oadshy
closures due to weather construction or traffic accidents FuelLogicreg utilizes current fuel
price information along with the incorporation of fuel cards and fuel networks negotiated
by the company to identify the most efficient fueling locations along the route
FuelLogicreg possesses current fuel price informati on on every truck stop in North
America
Unique Attributes
Prophesyreg allows the instant matching of ava ilable drivers and provides options to
maximize b ack-haul opportunities It is one of the few programs that is readily a vailable
for both Truckload and LTL carriers
Limitation s
Prophesyreg does not have the capability to incorpo rate hazardous material considerations
It indirectly accounts for truck height by allowing the user t o select the minimu m height
needed for overpasses although other truck characteristics are not accounted for
Prophesyrsquosreg accounting for tolls is not very clear The program allows users to scale
their aversion to using tolls but it does not appear to be a systematic means by which
users can compare the costs of using a toll road versus taking an alternative route
14
SOFTWARE NAME PROMILES
Cost Alternatives
ProMiles Mileage and Routing Guide
Single User License Add-Ons Fuel Management (Pro) Fuel Management (Lite) Fuel Tax (Single Fleet) Updates HazMat Routing
$89500
$39500 $5000 $9500 $6000qtr Starts at $39500
TruckMiles
Single User License RapidLog Interface GPS Interface
$24900 $29500 $9900
Industry Use
ProMiles Software Development Corporation (PSDC) has won a wide following of
dedicated clients such as OOIDA Fleet One Hewlett Packard Petro Chemical
Oregon DOT Unocal New World Van Lines Barnes Trucking Inc and over 150 s tate
DOT auditors Washington along with 30 other states is listed as a state that has
ProMiles software solutions for IFTAM ile Tax and IRP auditing andor for port of
entryDOT purposes
Primary Features
Promiles offers a multitude of program options to cover an array of freight routing needs
The TruckMiles program provides turn by turn routing at the street level with 53-ft trailer
options that allow users to select routes with up to five stops These routes may be bas ed
on practical truck routing shortest truck routing and reduction in toll road usage
Additionally TruckMiles computes rates by empty or loaded miles produces a pro fit
rate and tracks driver expenses
Additional functionality is available with the Kingpin software which in
conjunction with the TruckMiles program function allows more detailed assignment of
vehicle types (12 options) and an increased number of stops along the route Vehicle
15
type options vary from two-axle delivery trucks to seven-axle double-trailer
configurations so that vehicle-specific routing can be generated ProMiles has data on
specific vehicle regulations and restrictions from federal state and local jurisdictions In
addition to truck type the user also inputs trailer length kingpin settings trailer axle
specifications height width and whether the cargo is hazardous material
ProMiles fuel management software allows the visualization of fuel prices from
the Oil Price Information Service (OP IS) across the region and along the selected routes
Like Prophesy ProMiles accounts for the input of co mpany n egotiated fuel prices at
specific truck stops The management software allows for filteri ng by chain route lane
and state
Unique Attributes
The ProMiles Kingpin software appears to have the greatest degree of flexibility in
selecting tr uck-specific opt ions such as number of ax les and trailer configurations
Limitations
A review of the ProMiles website did not suggest that the services offer real-time
indications of congestion and lane closures Additionally there is no ability to com pare
truck versus rail or other modes of transport
SOFTWARE NAME CHEETAH
Cost Alternatives
At the time of this review we were unable to get a price estimate on the Cheetah
Delivery and Freight software packages The pricing scheme is highly variable
depending on customer-specific needs and the various add-ons required
Industry Use
Cheetah software provides delivery dispatch services and drivers with real-time opt ions
to increase the efficiency of route planning drivers and customer service personnel
16
Primary Features
Cheetah provides two product packages Cheetah Deliverytrade and Cheetah Freighttrade
The Cheetah Delivery system allows dispatchers to see supply chains in real time
including estimated arrival times that are dynamically based on driver activity
cancellations and reschedules through GPS-enabled tracking The Cheetah Freight
system provides dispatch and routing software designed for business to business freight
companies with real-time routing delivery and dispatch information for LTL dispatch ers
drivers customer service shippers and customers
Unique Attributes
Cheetahrsquos uniqueness lies within its real-time fleet tracking and LTL sequencing
Cheetah operates within a Software-as-a-Service infrastructure that is the program is
hosted on Cheetahrsquos servers as opposed to many other programs that are delivered on
disk and receive updates at regular intervals
Limitations
A review of the companyrsquos website reveals that Cheetah focuses more on the dispatch of
delivery fleets than on freight traffic As such it does not highlight usersrsquo ability to input
truck and trailer specifics such as height and weight or load types such as HazMat
Additionally Cheetahrsquos site does not address user specifications for fuel management and
purchasing as do other freight systems These specificities are not highlighted on the
Web pages as the majority of its customers are LTL carriers and do not typically require
them However the program is flexible enough that the background routing data can be
integrated with software such as PCMiler and provide the same capabilities as th at
software does
SOFTWARE NAME TSI AUTOMATION
Cost Alternatives Webroute - $5500 per asset per month
17
Industry Use
TSI Automationrsquos Visual Control Room (VCR) program provides software aimed at
companies seeking efficiency gains through logistics optimization and management
automation for scheduling routing and dispatching workers or vehicles to work sites or
customer locations
Primary Features
TSI has two products for different sized companies The WebRoute product is Web-
based routing scheduling and dispatch software This system is designed to handle the
scheduling of up to 30 vehicles from a given site and has GPS capabilities to track truck
progress Route optimization is conducted on the basis of an algorithm that seeks t o
minimize total travel time and distance while matching appropriate trucks and delivery
time windows
TSIrsquos VCR expands the capabilities of WebRoute and can handle operations for
larger companies VCR matches a companyrsquos resources and vehicles to assigned
deliveries in order to g enerate the most appropriate delivery schedule and routing to
minimize drive time and distance Driver characteristics including breaks and lunches
are configured into the scheduling and routing outputs
Unique Attributes
The GPS tracking allows for improved customer support by increasing usersrsquo ability to
know where various shipments are located and receive more accurate times of arrival
Limitations
The primary limitation is that TSI relies on MapQuest for its routing decisions and
therefore does not consider many of the special limitations observed in the freighting
industry TSI is designed more for delivery truc ks than for Interstate freight traffic
18
SOFTWARE NAME APPIAN LOGISTICS (FORMERLY MICROANALYTICS)
Cost Alternatives
At the time of this review a price estimate on the Appian Logistics routing software
packages was unavailable The pricing scheme is highly variable depending on customer
needs and the various add-ons required
Industry Use
In January of 2010 Appian Logistics Software purchased TruckStops from
MicroAnalytics for North American Customers Appian touts itself as an industry leader
in providing solutions for transportation companies and is recognized as one of the top
100 logistics and supply chain software providers Appianrsquos clientele ranges from third
party logistics providers to the food service industry to home delivery
Primary Features
Appianrsquos Direct Route software automates client routing and scheduling by using
specified data and businesswork rules to establish software parameters from which
routes and features may be developed These businesswork rules are primarily client
details around which the shipments should be scheduled These may include items such
as including maximum work time latest return time and earliest and latest delivery
dates It combines thes e rules with truck-specific requirements such as capacity and
freight type (eg refrigerated) and then matches them with the data provided on origin
and destination and the volume of cargo to be shipped
Through Appianrsquos DRTrack software users are able to access information
regarding planned versus actual hours miles and times along with real-time route
progress tracking Additional attributes of this software include driver performance
reports truck speed mapping geographic volume reports and internal route delay al erts
These features are provided in real-time
In the Territory Pro module Appian provides a constraint-based creation of
geographic territories Territory Pro enables the adjustment and design of sales service
and delivery territories on the basis of volume service time andor coverage area thus
balancing the time and volume between territories The optimization processes seek to
19
minimize mileage while maximizing volume The software can additionally assign route
days within a territory By combining Territory Pro with Resource Pro users can further
develop efficient territories and routes by determining the optimal number of drivers and
power units needed to operate under a given set of constraints
Finally Appian offers a Continuous Move Planner package that generates optimal
truckload matches for given sets of origin-destination pairs The software seeks to
minimize time and mileage while maximizing capacity utilization Distance and time
calculations are defined by the systemrsquos proprietary engine and can utilize PCMiler or
MapPoint
Unique Attributes
Appian can be integrated with PCMiler Prophesy and other route generation software
and thus can be formatted to perform any of the operations that those soft ware programs
perform Table 21 is filled in as if the program were integrated with PCMiler though
actual capabilities are dependent upon user needs and the integration actually selected
Limitations
Limitations are dependent upon which program Appian is integrated with though its
varied connectivity allows for a broader range of applications than a stand-alone product
SOFTWARE NAME TRUCK DISPATCHING INNOVATIONS (TDI)
Cost Alternatives
TDI is a reseller of ArcLogistics From ESRI website t he cost of this program is as
follows
Up to 5 Vehicles $100000yr Up to 10 Vehicles $200000yr Up to 20 Vehicles $350000yr Up to 50 Vehicles $450000yr
Industry Use
As a reseller of ESRIrsquos ArcLogistics Route software package TDI provides tailored
packaging aimed at a target market of local delivery operations with private fleets of 5 to
50 vehicles
20
Primary Features
TDI provides small delivery companies with desktop routing and scheduling operability
The software optimizes route sequencing and allows large volume simulating for
economic evaluation Routes and sequences are developed on the basis of customer time
demand s and actual network drive times while vehicle and driver characteristics such as
volume and weight capacity and labor constraints are considered
Unique Attributes
TDI and ArcLogistics have easy to run simulations that can aid in forecasting vehicle and
driver needs and thus help balance workloads and prevent overtime and underfilled
loads
Limitations
TDI is limited to the capabilities of ArcLogistics This software does not provide the
large-scale capabilities of the freight transportation packages like PCMiler or Rand
McNally but it meets the needs of its intended market local delivery operations
SUMMARY OF ROUTING SOFTWARE REVIEW
This freight routing software review concentrated on the commercially available software
packages that are most often used in the freight and trucking industry This review
included eight software packages (see Table 21) two of which (PCMiler and Rand
McNally)received an extended analysis through the use of trial software to perform
common routing tasks The review of the remaining six software packages was based
upon publicly available information and promotional materials from the companiesrsquo
websites
It is evident from Table 21 each software pa ckage offers different types of
attribut e r most of the reviewed packages offer similar core es and options How ve
routing attributes and capabilities The software package that was found to offer the most
flexibility and routing modificationoptions was Cheetah Unfortunately the cost of this
software (like Appian) is based on each prospective user and its unique needs and is
therefore not publicly advertised This makes Cheetah somewhat difficult to compare
21
with other software packages most of which have an advertised single- or multiple-user
price but also state that the actual software price is customer-specific
Table 21 Summary of Reviewed Software Routing Attributes
Attributes Prophesy romilesP PCMiler Cheetah Global
Tranz TSI TDI Appian Logistics
Freight Ware
Rand McNally
Practical Routing This is a shipper
this is a 3rd party add-on to either
PCMilerProMiles or Milemaker
Shortest Path
National Network Routing
Toll-Discouraged Routing
Haz Mat Routing
53rsquo102rdquo Trailer Routing LTL Load Optimization Driver Optimization Fuel Cost Minimization Carbon Emission Calc Integration with Other Software (Accounts Receivable pa ledger payroll
y
taxes etc) Real-Time HighwayStreet Routing (seasonal road closures congestion road construction)
Inter-Modal Connectivity Truck vs Rail Mileage Comparison Commercial Mileage Summaries by State
Nevertheless for all dimensions considered Cheetah offers the most features
followed by Appian Logistics which does not allow real-time routing changes
necessitated by unforeseen trip-specific factors (accidentsroad closures highway
restrictions etc) PCMiler reported as the routing software used by 96 percent of the
freight industry was found to be comparable to Appian Logistics in its software
capabilities but it also does not allow real-time routing changes The Rand McNally
freight routing software does include a feature (as does Cheetah TSI and Prophesy) that
will allow each user to make route-specific real-time changes on the basis of information
received during while a truck is en route However in other dimensions the Rand
McNally software offers fewer overall capabilities than the PCMiler software such as not
22
providing truck versus rail mileage comparisons for closest rail loadingunloading
facilities identification of intermodal connectors (truckrail) and the ability to schedule
routes around driver hours of service limitations Only three of the freight routing
software packages include a feature that calculates the carbon emissions for alternative
routes PCMiler Cheetah and Appian Logistics Five of the software packages allow
routing that considers trailer width and length restrictions on streetshighways ProMiles
PCMiler Cheetah Appian Logistics and Rand McNally All packages except of
TSI and l z rial routing and all pack f TSIProphesy TDI a low ha ardous mate ages except o
and TDI incl de a featureu to select routes on the basis of minimizing re-fueling costs
All of the reviewed software packages w ill interface with othe r management software
such as inven ory contro ts receivabt l accoun le billinginvoicing payroll and tax
calculation packages
It is also i t all fremportan to remember that not ight routing software packages are
designed developed and marketed to fu ill identical services in the f lf re ight transport and
delivery market and one must consider the target market for each software package For
example a review of Table 21 may lead one to believe that TSI and TDI are lacking in
features and capa ilities in comp arison to the other freight routing software packagesb
However it is clear from the individual review of each that these two software packages
were designed and developed for local delivery and urban parcelproduct routing As a
result many of the capabilities and attributes developed for long distance trucking such
as toll road avoid nce fu el refill cost mi nia mization hazardous material routing and
driver hours of service limits are not relevant for the market served by this software
23
3 EVALUATION OF USE OF GPS ROUTE DATA FOR EVALUATING ROUTE CHOICE
INTRODUCTION
This research investigated the feasibility of using GPS truck data to inform truck
modeling logic Two case studies were considered For each case study the evaluation
included the proportions of vehicles using particular routes and the distribution of truck
travel times and speeds along each route by traffic direction and time of day The results
indicated that there is a strong relationship between route attributes and truck route
choice However other factors not described by the GPS data were also found to affect
route choice Whats more we found that given the current GPS data frequency and trav el
speed if several alternative routes between the O-D pair are available the truck route
selected can be observed only if the distance of this route is longer than the distanc e
between two consecutive GPS read points Finally with the algorithm used to identify
truck stops (defined as gt3 minutes) the relationship between stopping patterns and route
choice cannot be observed
THE GPS DATA
The GPS truck data used for this analysis were collected between October 2008 and
August 2009 Approximately 2500 trucks were represented in the Puget Sound takes 3
to 5 percent of the entire truck population in this region Millions of GPS spots were
received each month Figure 31 presents one months worth of GPS data The raw truck
GPS data received from the GPS vendor were continuous spot data and therefore we first
employed the trip end identification algorithm developed by Ma and McCormack (2010)
for identifying truck trip origins and destinations Next we geo-coded the GPS data with
a traffic analysis data (TAZ) layer by using ArcGIS to identify the corresponding TAZ in
which the GPS reads were located In this way the truck performance along each route
could be retrieved from the GPS data and analyzed by querying the zone to zone trips In
addition the GPS spot speeds had been demonstrated to be sufficiently accurate in
comparison to the speed provided by dual loop detectors (Zhao et al 2011)
24
Figure 31 Monthly GPS Data and TAZ Layer The map shows the GPS readings for the month of November 2008
Two case studies were in the basis for evaluating the feasibility of using GPS
truck data to identify truck routes in the Puget Sound area and inform the relationship
between route attrib utes and route choices For each case study the following analyses
were performed
bull Average travel distance travel time and speed between the origin and destination
for each traffic direction and time period
bull The proportion of trucks in the sample using particular routes and corresponding
route attributes (travel distance time speed and variability) between the origin
and destination for each traffic direction and time period
CASE STUDIES
Case studies were selected according to following criteria
bull The truck routes had to be major freeway andor arterial roads where vehicles
encounter traffic congestion during peak-hour periods (to observe the impact of
traffic congestion on route choice)
bull There had to be a statistically sufficient sample size between the origin and
destination (a function of the current read rate)
25
bull There had to be several alternative routes connecting the origin and destination (in
order for us to observe route choice)
bull Given that currently the vehicle location is recorded and reported every 15
minutes the travel distance between the O-D pairs had to be long enough that
different route choices could be observed
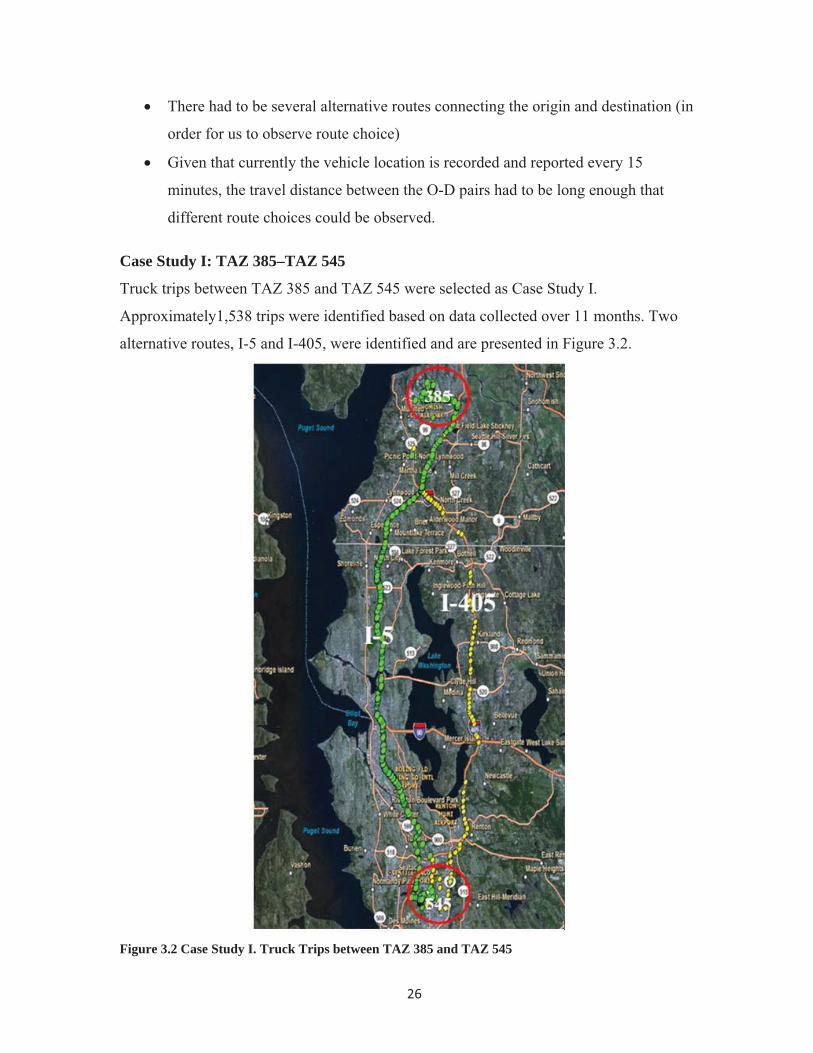
Case Study I TAZ 385ndashTAZ 545
Truck trips between TAZ 385 and TAZ 545 were selected as Case Study I
Approximately1538 trips were identified based on data collected over 11 months Two
alternative routes I-5 and I-405 were identified and are presented in Figure 32
Figure 32 Case Study I Truck Trips between TAZ 385 and TAZ 545
26
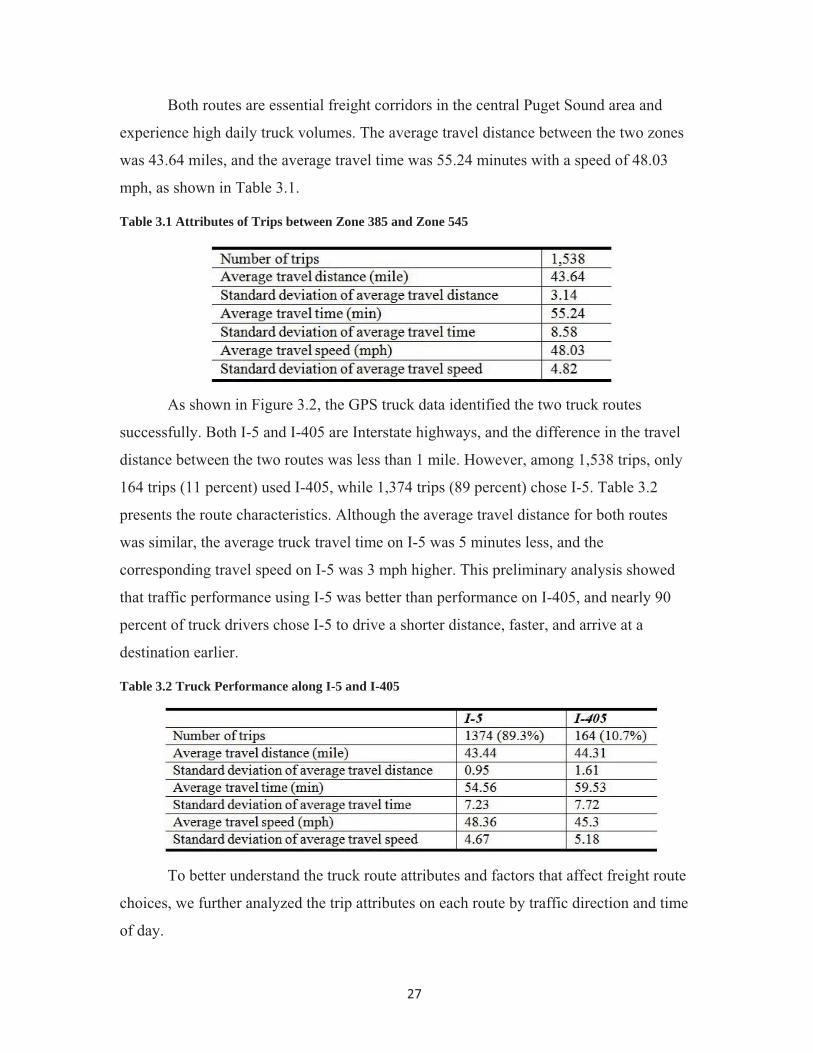
Both routes are essential freight corridors in the central Puget Sound area and
experience high daily truck volumes The average travel distance between the two zones
was 4364 miles and the average travel time was 5524 minutes with a speed of 48 03
mph as shown in Table 31
Table 31 Attributes of Trips between Zone 385 and Zone 545
As shown in Figure 32 the GPS truck data identified the two truck routes
successfully Both I-5 and I-405 are Interstate highways and the difference in the travel
distance between the two routes was less than 1 mile However among 1538 trips only
164 trips (11 percent) used I-405 while 1374 trips (89 percent) chose I-5 Table 32
presents the route characteristics Although the average travel distance for both routes
was similar the average truck travel time on I-5 was 5 minutes less and the
corresponding travel speed on I-5 was 3 mph higher This preliminary analysis showed
that traffic performance using I-5 was better than performance on I-405 and nearly 90
percent of truck drivers chose I-5 to drive a shorter distance faster and arrive at a
destination earlier
Table 32 Truck Performance along I-5 and I-405
To better understand the truck route attributes and factors that affect freight route
choices we further analyzed the trip attributes on each route by traffic direction and time
of day
27
Southbound Analysis
Southbound freight performance on both routes is presented in Table 33 and plotted in
Figure 33 and Figure 34 There were 769 southbound trips in total Similar route choices
were observed by analyzing the southbound traffic Only 75 trips (10 percent) used I-405
while most trucks chose I-5 T he average travel time along I-5 was 5458 minutes which
was 6 minutes faster than travel time on I-405 As illust rated in both figures 33 and 34
the variability of travel speed on I-405 was much higher than the speed deviation on I-5
indicating that the travel time on I-5 was more reliable Similar results for travel speed
profiles were observed Travel speed along I-5 was 48 mph which was 35 mph higher
than traffic speed along I-405 I-5 traffic had a smaller travel speed standard deviation
than I-405 as shown in Table 33 and Figure 34 indicating that the speed along I-5 was
more stable Hence the GPS data analysis indicated that the freight performance on I-5
was better in terms of travel speed travel time and travel time reliability The anal ysis
results showed that for southbound traffic there was strong relationship between route
choice and transportation-related route attributes
Table 33 Southbound Travel Time Distributions along I-5 and I-405
Figure 33 Southbound Travel Time Distributions along I-5 and I-405
28
Figure 34 Southbound Travel Speed Distributions along I-5 and I-405
The traffic conditions were further studied by five time periods separately (Table
34)
Table 34 Time of Day Breakdown
Figure 35 plots the number of trips southbound on both routes and the
corresponding travel times by time of day For both routes the analysis found that the
travel times during Night and After Peak time periods were cl ose to free flow travel time
(the free flow speed was defined as 50 mph) Travel time delays on both routes were
observed during the other three periods Trucks experienced more severe delay during the
AM Peak and PM Peak periods for both routes The number of trips on both routes was
strongly related with the traffic condition 647 trips (84 percent) occurred during the
Night and After PM periods when there was no travel delay whereas only 28 trips (36
percent) occurred during the PM peak when significant delays were observed
29
Figure 35 Southbound Truck Proportions and Travel Time Using I-5 and I-405 by Time of Day3
Generally southbound transportation performance on I-5 was better than the
performance on I-405 The travel times on I-5 during the Night and After PM periods
were close to free flow travel time and were 6 minutes and 3 mi nutes less than on I-405
respectively Therefore there were 175 trips on I-5 during the Night period but only
seven trips on I-405 and 424 trips on I-5 during the After PM period but only 41 trips on
I-405 The worst travel time delay was observed on I-405 during the PM Peak which
experienced 22 minutes of delay for a 53-minute trip without traffic congestion and there
were only six trips during that time period on I-405 over 11 months No trip occurred
during the AM Peak on I-405 over the 11-month observation period We also noted that
the travel time on I-405 during the Midday was about 15 minutes less than the travel
time along I-5 However the corresponding number of trips on I-405 was still less than
the number of trips on I-5 This result was reasonable because the difference was not
significant and drivers may not have perceived it Meanwhile it also indicated that other
factors that cannot be described by the GPS data may influence route choices as well
3 GPS data represent between 3 and 5 of the total truck population in the Puget Sound region
30
Northbound Analysis
Table 35 illustrates the northbound trip information along I-5 and I-405 The comparison
between the two routes showed that for northbound traffic the transportation
performance on I-5 was better than on I-405 The travel time and speed differences
between the two routesmdashabout 4 minutes and 3 mph respectivelymdashwere quite similar to
those for the southbound traffic Again drivers mostly chose I-5 along which they could
travel at higher speed and arrive at their destinations earlier Figures 36 and 37 show the
distributions of the travel time and speed along each route
By comparing tables 33 and 35 we also found that the trip performances for
southbound and northbound I-5 were similar and those for southbound and northbound Ishy
405 were also similar
Table 35 Northbound Truck Performance along I-5 and I-405
Figure 36 Northbound Travel Time Distributions along I-5 and I-405
31
Figure 37 Northbound Travel Speed Distributions along I-5 and I-405
The northbound time-of-day analysis indicated that travel times on both routes
during the Night and After PM periods were equal to free-flow travel time and about 73
percent of total truck trips occurred during these time periods (Figure 38) Trucks
encountered recurrent delay during the other three time periods The most severe
congestion was experienced by vehicles on I-405 during the AM Peak when the travel
time was almost 20 minutes longer than free flow The travel time delay dipped slightly
during the Midday period for both routes Another considerable delay was observed
during the PM Peak along I-405 The most significant travel time difference between the
two routes about 8 minutes occurred during the PM Peak period and the number of trips
on I-5 was significantly higher than on I-405 Most truck trips were observed along the
route with better performance (less travel time) except during the Midday period The
time difference between each route during the Midday period was quite small however
more trucks still chose I-5 A large percentage of trucks travelling outside of the peak
travel periods
32
Figure 38 Northbound Truck Proportions and Travel Time Using I-5 and I-405 by Time of Day
Case Study II TAZ 180ndashTAZ 609
Truck Trips between TAZ 180 and TAZ 609 shown in Figure 39 were selected for the
second case study There were two alternative routes I-90 and SR 520 Both routes are
major roadways crossing Lake Washington and are connectors between I-5 and I-405 On
the basis of the GPS data collected over 11 months 533 trips were identified The trip
attributes are presented in Table 36 The average travel distance was 2759 miles It took
4013 minutes on average to arrive at the destinations by traveling at 4228 mph
33
Figure 39 Case Study IImdashTruck Trips between TAZ 180 and TAZ 609
Table 36 Attributes of Trips between TAZ 180 and TAZ 609
Among all 533 trips 365 trips (685 percent) used I-90 while 168 trips (315
percent) chose SR 520 The traffic performance on each route is presented in Table 37
The comparison shows that the average travel distance travel time speed and reliability
of both routes were quite similar However the number of trips along I-90 was more than
34
twice that along SR 520 To explore this issue we conducted further analysis by traffic
direction and time-of-day
Table 37 Truck Performance along I-90 and SR 520
Eastbound Analysis
The analysis of eastbound traffic along I-90 and SR 520 is summarized in Table 38 233
trips (71 percent) traveled along I-90 The travel time difference was quite small less
than 1 minute The trip travel time and speed on I-90 were slightly more reliable
according to the time and speed standard deviations Overall there were no significant
differences between the two routes and results were insufficient to conclude that truck
route choices were based solely on the route attributes derived from the GPS data
Table 38 Eastbound Truck Performance along I-90 and SR 520
A comparison of the numbers of trips and travel times over the two routes during
different time periods is plotted in 310 For both routes the travel times during the
Night Midday and After PM periods were close to free flow travel time and 69 percent
of trips occurred during these three time periods Travel time differences between the two
routes were observed during all five periods and the differences increased during the AM
Peak period to about 5 minutes The travel time along SR 520 was longer than that on Ishy
35
90 and the number of trucks choosing I-90 during all time periods was higher than the
number of trucks using SR 520
Figure 310 Eastbound Truck Proportions and Travel Time Using I-90 and SR 520 by Time of Day
Westbound Analysis
The westbound vehicle proportions and trip information for each route are presented in
Table 39 Almost 70 percent of vehicles chose I-90 while the traffic conditions on both
routes were fairly similar According to Figure 311 no trucks tr aveled along SR 520
during the AM and PM Peak periods and therefore the traffic conditions on SR 520
during those two periods were unknown For eastbound traffic since performance along
I-90 was always better 69 percent of traffic occurred on I-90 Similar conditions were
observed for westbound traffic during the After PM period However during the Night
period the travel time along SR 520 was less and trucks switched from I-90 to SR 520
apparently to reduce travel time The travel time during the Midday periods for the two
routes were the same and the route attributes failed to explain why there were more trips
along I-90
36
Table 39 Westbound Truck Performance along I-90 and SR 520
Figure 311 Truck Proportions and Travel Time Using I-90 and SR 520 by Time of Day
SAMPLE SIZE
Sample size is one of the most critical factors in ensuring a statistically reliable analysis
Extensive literature is available on determining the appropriate sample size for estimating
transportation network performance We employed the methods developed by Li et al
(2002) to identify the GPS data sample size for a statistically significant measure of
truck performance
where a = confidence interval
= Z value for a given confidence level
37
S = sample standard deviation
= user defined allowable error in estimating the population mean
= sample mean
Although the appropriate sample size is critical it was not a major concern in this
research given the millions of GPS points that are received monthly from the GPS
vendor Here we present an example to verify whether the sample sizes of the I-5 and Ishy
405 trips in Case Study I were statistically reliable For trucks traveling along I-5 the
sample travel time mean was 5456 minutes and standard deviation was 723 as shown in
Table 32 For a confidence interval of 95 percent and a mean estimating error of 273
minutes the minimum sample size required would be 27 As the sample size of our Case
Study I was 1374 clearly greater than the minimum sample size the dataset was
considered reliable for estimating the travel time on I-5 within a 5 percent error for a
confidence level of 95 percent Similarly the minimum sample size to ensure a maximum
5 percent error for travel time estimates for I-405 was 26 and the current observation was
deemed statistically reliable
FEASIBILITY OF USING GPS TRUCK DATA TO IDENTIFY TRUCK ROUTES
The GPS truck data were capable of identifying the truck routes in Case Studies I and II
However note that the travel distance for both cases was longer than 20 miles Given the
current GPS data frequency (we expect the frequency to increase over time) and truck
travel speed the feasibility of using GPS data to define truck routes is primarily
determined by the trip distance The distance between two GPS spots is calculated
according to Equation 32
S = F V (32)
where S = distance between two location reads (mile)
F = GPS data frequency (truck location reads were collected every 5 to 15
minutes)
V = truck speed (mph)
38
According to Equation 32 if there are several alternative routes connecting the
origin and destination then the distance between the route split point and the route merge
point should be longer than the distance between the two GPS points to ensure that at
least one GPS read is located on the selected route Otherwise it is possible that no GPS
data will be collected and the route choices cannot be identified Figure 312 illustrates
the relationship between distance of alternative routes and distance between GPS spots
Figure 312(a) shows a case in which the route distance is longer than the distance
between the two GPS reads and the selected route is guaranteed to be identified
successfully Figure 312 (b) and (c) illustrate a situation in which the routes are shorter
than the distance between the two GPS spots It is possible that there will be no GPS read
on the selected route and it cannot be identified as the route the truck took as shown in
Figure 312 (b)
Figure 312 Relationship between Truck Route Length and Distance between Two Successive GPS Reads
The GPS reads employed in this rese arch were collected every 5 to 15 minutes If
the average truck speed in Puget Sound area is 40 mph then the minimum distance
between the route split point and route merge point is expected to be 33 to 10 miles for
the route to be identifiable A higher data collecting frequency lower travel speed and
traffic congestion could all shorten the route dista nce threshold
39
The trip O-D identification algorithm employed in this research identified trip
destinations by stop duration An appropriate dwell time in Seattle area is 3 m inutes
(McCormack and Hallenbeck 2006) The 3-minute period has been demonstrated to be
the appropriate dwell threshold that can separate stops for traffic signals congestion
fueling and drivers break The GPS spots are regarded as stops only when the stop time
is greater than 3 minutes However for most delivery services 3 minutes is significantly
longer than the expected stopping time Thus with the algorithm we used stops of less
than 3 minutes did not appear as stops and we were not able to distinguish route choice
from the route a truck had to take to serve its customers
CONCLUSIONS
This research investigated the feasibility of using GPS truck data to identify truck rou te
choices by examining two case studies The case studies evaluated four major truck
corridors in the central Puget Sound The case studies were selected so that a) a route
choice decision would be available and b) the outcome of this route choice could be
observed in the data
In both case studies the truck route choices were identified and it is found that
the majority of truck trips were observed during off-peak time periods (700 PM to 600
the next day)
Correlation between route performance and truck route choices were identified
within the analyses Routes with less travel time higher travel speed and better r eliability
may have a higher probability of being selected according to the two case studies
However we did not observe similar selections between routes with close travel time
characteristics so we concluded that other factors not described by the GPS data were
also affecting route choice For example road geometry especially when trucks are fully
loaded Therefore we can conclude that the GPS truck data are capable of supporting
route choice analysis but GPS data alone are not sufficient to ascertain the determinants
of truck route choice
The GPS truck data could identify the alternative routes successfully in both case
studies However as mentioned these case studies were selected because they were
likely candidates There will be many origin-destination pairs between which the routes
cannot be identified given the current GPS data read rates Namely there must not be
40
route choice decisions between two successive GPS reads otherwise it is very likely tha t
the GPS data will fail to identify the route as illustrated in Figure 312(c) Given current
read rates this window can be as long as 20 miles which is insufficient in urban region s
the areas where route choice may be of most interest However more recently collected
GPS data read rates have improved from 15 to 2 to 5 minutes so we expect the ability to
observe route choice will be improved Another limitation of the truck route choice
identification analysis is that in the current trip O-D identification algorithm stops are
observed as stops only if the stopping time is longer than 3 minutes However wi th some
delivery services eg parcel delivery 3 minutes is longer than the expected stopping
time and therefore with the algorithm we used the stopping patterns of delivery services
will not be observed
41
4 ROUTING PRIORITIES
A goal of freight planning is to identify how goods move through the transportation
network and predict how freight flows will react to operational changes Current freight
flow models assume that shortest path algorithms are appropriate to apply to freight
travel Shortest path algorithms are commonly used in routing software such as Google
Maps this routing tool however is targeted at passenger travel In addition to different
travel constraints freight and passenger travel have two distinct purposes Freight travel
is induced by the need to move goods passenger travel is induced by the need for
personal mobility Therefore the use of passenger travel predictors in freight flow
modeling may be inappropriate
This chapter describes process used to identify factors that contribute to truck
freight route choice and the development of categories of companies based on how th ey
make their route choice s A survey was designed and distributed to Washington state
shippers carriers and receivers Survey respondents were asked to score and rank a
number of factors with regard to their influence on route choice Responses to the survey
questions were almost exclusively categorical (ie discrete) therefore the respondents
sensitivity to routing factors was treated as a latent variable and was analyzed by using
latent variable modeling and class analysis The analysis identified hours of service
limits availability of truck parking driver availability refueling locations and road
grade as the top five discriminating factors among the respondents Latent class analys is
determined that the type of equipment a company owns (eg auto freight units) was a
significant predictor of the category to which class a company belonged
MOTIVATION
The ability to fully understand and accurately characterize freight route choice is one that
will inform regional an d state decisions This ability applied to regional and state
commodity flow data forms the basis of an effective statewide freight modeling
framework Existing transportation network models are designed to describe passeng er
travel and therefore may offer a poor representation of freight travel Determining how
42
different subgroups of shippers carriers and receivers make route choices and
integrating these categorized decision characteristics can advance network models to
better represent observed freight route choice
LITERATURE REVIEW
How do carriers make routing decisions What are their priorities How do they differ across carrier type
A few studies have worked to identify the factors that determine routing choices
Regan and Garrido (2002) through a review of literature concluded in regard to mode
choice in routing that a) shippers value service and reliability more than cost and b) the
important factors in determining mode choice include timeliness availability suitability
firm contact restitution and cost Regan and Garrido also reviewed studies that focused
on shipper-carrier relationships
In the early 1980s mode choice was being investigated A study by Krapfel and
Mentzer (1982) looked at the factors that influence mode choice as well as the factors
that most strongly influence carrier choice The motivation for the study was the
deregulation of the trucking industry in 1980 by the US Motor Carrier Act because it
allowed carriers to make their own routing choices yet it had limited criteria for
evaluating prioritized routing decisions Krapfel and Mentzer determined that damaged
goods in transit shipment losses and service reliability were strong instigators of mode
shifts Factors that initiate a change of carriers within a mode were found to include
availability of common carrier service carrier availability and shipment losses
Boerkamps Binsbergen and Bovy (2000) looked beyond the factors that play
into routing in their description of the GoodTrip model which is a four-step modeling
approach to building supply chains used in The Netherlands The model starts with data
on consumer demand and then applies scenario assumptions to build the supply chains
that estimate goods flows In their report they considered the roles of various parties
involved in transporting a good from production through final consumption and took into
account the elements of routing behavior that each party controls For example in the
first transportation link from manufacturer to retailer the producer is responsible for
decisions regarding private vs for-hire grouping of goods mode vehicle size damages
43
and losses while the retailer has control over the type and volume of the goods being
delivered delivery frequency and reliability From this it is important to consider the
role companies play within a supply chain when assessing their routing behavior
Crainic and Roy (1988) developed a modeling algorithm that jointly consider s
economic efficiency and service quality Economic efficiency involves operations back
hauling considerations and delay impacts Service quality is measured by service
frequency to a specified location
Figliozzi (2006) while looking at how various technologies play into routing
decisions classified goods into four categories After developing simple models and
formulas and applying routing assumptions based on supply chains determined fro m
operations research and a management science literature review he ranked each go od as
high or low on scales of both time-se nsitivity and actual value This created four
categories in which a particular good could be classified Among these four groupings
were distinctly different attributes in terms of routing strategies typically used Figliozzi
also concluded that routes are usually determined by number of customers sequencing
time of service vehicle used distance and links traveled
A model by Hunt and Stefan (2007) in Calgary Canada builds trips in a growth
format that adds stops onto the trip as they fit Building of the trip takes into
consideration routine services vehicle type trip purpose establishment type forshy
hireprivate and land-use types
The SMILE model in The Netherlands developed by Tavasszy et al (1998) has
many variables that change on the basis of commodity including
storagehandlingtransportation costs value density packaging density perishability
delivery time shipment size demand frequency and access of network A survey
conducted on product characteristics identified the logistics families that are determined
by these variables
Vieira (1992) investigated the importance and value of service quality to shippers
when they make transportation decisions A survey was conducted of five commo dities
within the rail industry to determine freight rate transit time consistency of trave l time
lossdamage payment terms and ease of working with carriers
44
Across these studies and model developments researchers sought to find patterns
within the characteristics of the commodities being moved that determine the route
choice and flow of goods movement All of the studies used minimizing total cost and
distance as the criteria for routing decisions which is consistent with this studyrsquos
findings
STUDY METHODOLOGY
For freight models to predict freight flows there must be data to support the model
formulation Currently the key data sources regarding freight data include the
Commodity Flow Survey (CFS) and the Freight Analysis Framework (FAF3) which
combines CFS data with economic figures to give a more disaggregated breakdown of
commodity flows in tonnage and value Unfortunately neither of these sources provides
number of truck trips Other sour ces give data on employee counts and economic figures
which are used to estimate freight movements on a network None of the existing federal
data is detailed enough to determine routing patterns so this study developed a survey t o
gather more information from carriers shippers and receivers on their routing de cisions
Collection of Data via Survey
The objective of the survey was to allow inference about the strategic-level routin g
decision-making process of companies that ship receive carry forward andor broker
freight in Washington state The survey design was informed by a review of the literature
and current routing software tools The review found that most software programs le t the
user choose routing constraints but there is no predetermined hierarchy The rou ting
constraints embedded in the software were used in the survey to ensure representation of
the factors present across freight routing
The survey started with questions designed to filter out companies unable to
comment on routing decision making and to identify the correct company representative
The survey then asked routing priority and freight activity questions Additional
questions were then added to classify the companies on the basis of business
characteristics The survey design was reviewed and refined in collaboration with the
University of Washington (UW) Washington State University (WSU) and the Social
and Economic Sciences Research Center (SESRC) at WSU The Washington Department
45
of Transportation (WSDOT) and SESRC had recently completed two surveys
investigating the costs of closures of I-90 and I-5 That experience provided SESRC an
understanding of the freight industry that was beneficial to this effort The survey was
finalized after it was tested by freight experts and revisions were made on the basis of
the feedback The freight experts were private industry representatives identified by
WSDOTrsquos Freight Systems Director
After a confidentiality agreement was signed between SESRC and WSDOT
SESRC gained access to the database of the Washington Employment Security
Department (ESD) and identified shippers carriers and freight forwarders In addition to
the ESD list a list of companies that hold a commercial trucking license obtained from
the Washington Department of Licensing Truck Registration Database (UTC) was used
to create the survey sampling population The ESD list included those in the
transportation sector and those in freight-dependent industries identified by WSDOT
(transportation agribusiness construction manufacturing processed food retail
trucking warehousing wholesale timber and wood products) The UTC list contained
some duplication obvious duplications (same phone numbe r address etc) were
remove d from the sampling population To achieve a well balanced and representative
sample companies were drawn from both lists
The survey was conducted by SESRC between October 2010 and March 2 011
The initial population consisted o f 73481 shippers carriers and freight forwarders To
obtain 2500 initial cases 972 companies were randomly selected then proportionate
sampling to attain a minimum of 60 cases in the 10 industry sector s After the initial list
of 2500 had been exhausted we had not met our completion goal so more sample was
drawn from the Washington Department of Licensing Truck Registration Database
Respondents were initially contacted by phone letter or email They were given the
choice of completing a live phone survey or an online version Seventy-eight percent of
respondents completed the 20 minute survey over the phone Each completed interview
required an average of six calls
46
The Survey
The 40-question survey was designed to elicit the factors contributing to routing
decisions made by Washington state companies that ship receive carry forward andor
broker freight The survey was split into three modules Freight Activity Routing and
Business Classification
bull Freight Activity This section included questions to identify freight activity in
order to distinguish respondents as shippers receivers carriers or a combina tion
Other questions aimed to capture fleet composition distance of deliveri es type of
deliveries the use of outside carriers and breakdown of single stop and multip le
stop trips Responses to these questions altered the wording of questions
presented later in the other two modules
bull Routing This section included questions designed to help us understand how
routing decisions are made They determined who makes routing decisions at a
given company the use of routing software the flexibility of routes and who
makes the decision about route changes The central question in this section
asked respondents to indicate the influence of 15 factors on routing change
decisions Commodity considerations were explored in this section as well with
questions asking about primary secondary and tertiary commodities
Seasonality perishability and back-haul associated with freight were also
investigated
bull Business Classification This section included questions designed to characterize
companies on the basis of business characteristics Data on number of facilities
number of employees annual revenues and company location were gathered
The key routing question asked the respondents to classify the intensity of influence that
15 factors (listed below) have on their companys route choices (with the option to wr ite
in more factors) Intensity was scored by using the following grading responses (1) no
influence (2) slight influence (3) moderate influence and (4) high influence The
factors were posed in the same order to all respondents Respondents were then asked to
rank the level of influence of the factors that they rated 4 (high influence)
47
1 Minimizing travel distance
2 Minimizing travel time
3 Minimizing total cost
4 Planning multiple loads stops
5 Meeting customer requirements
6 Avoiding highway congestion
7 Avoiding highway tolls
8 Refueling locations
9 Availability of truck parking to wait for scheduled delivery or pickup
times
10 Road grade and curvature
11 Hazardous material considerations
12 Size or weight limits
13 Truck driver availability
14 Truck driver hours of service limits
15 Availability of support in case of problems
Survey Descriptive Statistics
The overall response rate from the surveying process was 414 SESRC compiled 860
surveys and delivered the data to the UW The figures that follow describe the sample of
companies who responded to the survey The number of observations represented in ea ch
figure is noted
Industry Breakdown
The goal of the sampling procedure was to obtain a sample population that represente d
the industry distribution of the companies that made up the entire ESD and UTC lists
The third question in the survey asked respondents which industry category best
describes their company Of the 849 companies that responded (which included shippers
carriers and freight forwarders) t he largest subset 33 percent was the ldquoTransportation
and Warehousingrdquo industry (see Figure 41) The next largest category was the
ldquoAgriculture Forestry and Fishingrdquo industry where 15 percent of companies classified
themselves
48
Figure 41 Industry Breakdown Respondents were asked what industry they classified themselves fro m a list of nine categories The number of companies from our sample in each industry is shown in the figu re
Company Activity and Outside Carriers
Figure 42 Company Activity and Outside Carriers
49
Figure 42 shows the breakdown of the delivery service activities present among the 846
companies in the sample that answered both what activity type they were (Question 04)
and whether or not they hire outside c arriers (Question 05) Of the companies surveyed
58 percent only shippedreceived goods or were freight forwarders so they did not carry
any goods The remaining 42 percent did carry goods alongside other activities including
shipping receiving and freight brokering
Within the 42 percent of companies that carry freight (as determined by Question
04 about activity type) 72 percent h ire outside carriers Along a similar trend of the 58
percent of companies who only ship andor receive freight 80 percent hire outside
carriers (see light blue bars in Figure 42)
Services Provided Breakdown
Figure 43 Service Types Provided Respondents answered ldquoyesrdquo or ldquonordquo to each service type and the percentages are given These categories are not mutually exclusive
Figure 43 shows the percentages of respondents that provided long-haul city delivery
regional and parcel trucking 830 companies responded to this question The respondents
answered each individually so any given company may have provided none all or any
combination of these services Of the companies that responded to these questions 25
50
percent provided both city delivery and regional trucking 20 percent provided long-haul
city delivery and regional trucking and 8 percent provided all four delivery types
Number of Vehicles
Carrying companies are those that responded as carrying at least some freight in Question
04 when asked whether they ship receive carry andor forward freight Figure 44 shows
the number of vehicles that carrying companies own (n= 358) 65 percent of carriers had
10 or fewer vehicles Of companies that only ship receive andor forward goods (do not
carry) 68 percent had no vehicles in their company 75 percent of companies do not use
any form of routing software (question Q16a) rather use ldquoexperiencerdquo and ldquocommon
senserdquo to make routing decisions
Figure 44 Number of Vehicles per Company for Carriers (n=358)
Truck Type Breakdown
Figure 45 shows the breakdown of truck type for companies that carry freight (n=393)
The different colors of blue represent the fact that the data came from two separate
questions Again the respondents replied to each of the categories individually and
therefore the vehicle types are not mutually exclusive When companies were asked what
ldquootherrdquo vehicle types they had in their fleet many mentioned dump trucks logging
trucks van and pick-up trucks
51
Figure 45 Vehicle Types in Carrier Fleets
Frequency of Changes in Routing Shipments
Question Q21 in the survey asked all companies ldquoHow often does routing of shipments
changerdquo and the acceptable responses were never yearly monthly weekly or daily Of
the 637 companies that were asked to respond almost all fell into either the ldquoalmost
neverrdquo or ldquodailyrdquo categories This indicates that companies were either very flexible or
were very rigid in their routing decision-making The food distribution and retail trades
had more fixed routes than other industries This could be because their types of delivery
occur on a frequent predictable and timely basis so fixed routing is the most convenient
Representatives of the transportation and warehousing industry reported an even
distribution between fixed and variable routes Respondents for the construction earth
products and manufacturing products industries reported more route variability Note
that routing choices donrsquot always exist It depends on where deliveries and pickups are
made For example with high customer density little route flexibility is available It is
also important to note that respondents may have interpreted this question as asking about
how often customers locations changed
52
Commodities
With respect to commodities 51 percent of companies surveyed had a primary
commodity that made up at least 90 percent of their total shipments Likewise 37
percent of companies surveyed transported only one commodity (Note some companies
considered General Trucking to be their primary commodity) 68 percent of
respondents said that they did not transport perishable freight and there was a 50-50 split
between respondents that reported seasonal freight that varies but not according to a
season
Number of Weekly Trips versus Numbers of Employees and Vehicles
Another interesting result from the data analysis was the finding of no correlation
between the number of weekly trips and the number of employees or the number of
vehicles as seen in Figure 46 and Figure 47respectively Figure 46 shows responses
from 835 companies and Figure 47 includes responses from 724 companies The number
of observations differs in these figures because not all respondents provided answers to
both the number of employees and the number of vehicles questions In these figures
number of trips per week was determined by combining number of single-stop full
truckloads per week number of multiple stop shipments per week and number of parcel
shipments per week Low correlations were found in both relationships with 21 and 19
respectively for Figure 46 and 47
Figure 46 Correlation between Number of Employees and Number of Trips
53
In this figure the number of employees given is the number of employees that companies
have within the Pacific Northwest There are 835 companies represented in the figure
This result is significant because number of employees is the dominant data used by
regional travel demand models to estimate number of truck trips per establishment Our
data shows almost no correlation between trip making and employees
Figure 47 Correlation between Number of Vehicles and Number of Trips
There are 724 companies represented in this figure who answered the question on
how many vehicles are in their fleet As the number of vehicles in a companiesrsquo fleet
increase the number of trips per week is not necessarily increasing There is a low
correlation coefficient (R2= 019) Number of vehicles per licensed motor carrier is a
publicly available data element As a result it is also commonly used as a surrogate for
trip making in travel demand models This data demonstrate the weakness of this
assumption
Quality of Factor Scores
Figure 48 shows the distribution of the total sum of the factor scores across respondents
for the primary routing question in the survey Respondents were asked to rank 15
factors on a scale of 1 to 4 to indicate their importance to routing decisions The sum was
found by simply adding the scoresmdasheither a 1 2 3 or 4mdashfor each factor for each
54
respondent The minimum sum was therefore a 15 while the maximum was a 60 The
total sum was the traditio nal summated raw score used in Likert-type scaling the raw
score weights each response equally for all factors Figure 48 shows that the total sum
followed a normal distribution with a slight skew toward higher influence scores This
shows that respondents used different scores for different factors Only 10 respondents
used the same score for all factors
Figure 48 Frequency of Total Sum of 15 Factors Influencing Routing Decisions
This figure shows the distribution of the sum of ratings respondents gave to 15
factors that influence routing decisions The histogram of total sums shows a normal
distribution with a slight positive skew This signifies no bias within the sample
population to rank all factors as non-influential or all as highly influential
Importance of Routing Factors
Table 41 shows the percentage of companies that scored items with a 4 and Table 42
shows the average scores for several groups within the sample population In order to
achieve the average companies were grouped depending on the characteristic shown and
then their responses to the 15 factors were averaged
55
Table 41 Percentage of Companies that Scored Item with a 4 (highest rating)
Table 42 Overall Averages
56
In this table it is important to note that in each block of questions the responden ts
did not cover the entire sample that is included in the Overall Average For example a ll
the averages of Service Type were higher than the Overall Average This is because on ly
respondents that answered ldquoyesrdquo to Long-Haul City Delivery Regional or Parcel were
included and these four were not mutually exclusive The Overall Average included all
respondents that said ldquoyesrdquo or ldquonordquo to these service types Across all questions the
influence of Highway Tolls Refueling Parking Road Grade and HazMat on routing
decisions was consistently lower than Travel Distance Travel Time and Total Cost
which respondents consistently considered highly influential
Use of R
The open source statistical program R was chosen for statistical analysis R allows the
use of packages that utilize advanced statistical techniques to focus on factoring and
cluster analysis The majority of the questions in the survey were categorical Questions
with continuous data for responses were converted into categorical data so that they could
also be included in the categorical analysis
Once the surveys had been cleaned and data values converted from continuous to
categorical data mining was performed to extract a small subset of meaningful factors
from the full list of 15 factors The type of statistical technique used in this analysis is
called latent variable modeling Latent variable modeling can be used for both factor
analysis and class analysis Latent variables are variables that are not directly observab le
(eg intelligence) and require the use of surrogate variables (eg GPA SAT score) that
can be observed For this study the latent variable (8) was the freight companies
sensitivity to external factors in deciding their route choice The observable variables
were the factors the survey asked the company representatives to rate for their intensity of
influence on the routing decision The statistical software program R and specifically the
ltm and poLCA packages were used to determine which of the 15 factors distinguished
among the companies
RESULTS
The following discussions are focused on the central question of the survey which asked
respondents to rank the influence of fifteen factors on their routing decisions The
57
analysis separated the factors that differentiated carriers from each other and the factors
that were similar among all carriers The majority of respondents rated travel time travel
distance and meeting customer requirements as highly influential (4) indicating that
these factors are unanimously significant routing factors Specifically 87of
respondents rated customer requirements as highly influential (4) Including these factors
in a statistical analysis would diminish differentiation between responses making clusters
indistinguishable Looking beyond the highly influential factors of travel time travel
distance and customer satisfaction would highlight differences in companies
An example of this is found in `Q22c ldquohow often does highway congestion
change routes with response options being (a) never (b) yearly (c) monthly (d)
weekly or (e) daily Forty-eight percent responded (a) never Because congestion is a
recurring event in predictable locations companies already account for congestion when
they determine their usual routes
Travel time travel distance customer satisfaction and congestion are examples
of factors that can be modeled the same way for the entire company population Other
factors specifically road grade refueling locations parking availability hours of service
limits and sizeweight limits cannot be modeled the same for the entire population
Survey respondents scored this subset of factors with various levels of influence (no
influence slight influence moderate influence high influence) These factors are called
informative items in item response theory (IRT) and can be used to cluster companies
who prioritize similar factors when deciding route choice
Item Response Theory
Latent variable modeling is a method used to model responses to questions that are either
dichotomous (ie have two categories of responses) or polytomous (ie have more than
two categories of responses) Item response theory (IRT) uses latent variable modeling to
assign a probability of a certain response to an item given the respondentsrsquo sensitivity (8)
and the itemrsquos parameters In this study the ldquoitemrdquo was the factor the survey respondent
was being asked to judge with regard to its influence on route choice by using graded
responses (ie a Likert-type scale) Again the scale used by the respondents was (1) no
influence (2) slight influence (3) moderate influence and (4) high influence Item
parameters included difficulty (b) and discrimination ability (a) Difficulty was the mean
58
response of the item ie the point at which 50 percent of the respondents scored the item
with moderate to high influence and 50 percent scored the item with no to slight
influence If an item had a difficulty of 4 then it was easier to agree to than an item with
a difficulty of 2 (ie the respondent was agreeing with the high influence of the item)
Figure 49 Item Operation Characteristic Curves (IOCC) These curves illustrate the value of each item
Items with steep curves in the plots above help differentiate respondents and form
clusters The three lines represent a score of 2 or higher 3 or higher or 4 or higher
59
There are three separate lines since the item may distinguish between the companies tha t
ranked an item as a 3 and companies that ranked the item as a 4 while not distinguishing
between those companies and companies that ranked an item as a 2The IOCC for
Multiple Loads shows low steepness meaning that the item does not discrimina te well
between respondents The IOCC for Parking shows high steepness meaning that the item
is meaningful in differentiating between respondents The discrimination ability
parameter estimates were generated by using the graded response model (GRM) The
GRM models the probability of a respondent scoring an item at a certain intensit y of
influence or higher (eg 3 or higher) and uses the equation
where a and b are the item parameters and is the probability that a respondent will
give item i a score of k or above given the respondents sensitivity level 8 The GRM
does not assume that the distance between the categories of the rating scale ie between
1 and 2 and between 2 and 3 is constant This spacing between categories is controlled
by the b-parameters also called threshold parameters The GRM can be constrained to
equal discrimination if warranted by the data
Item Information
Test precision in IRT is conveyed in the form of information Information indicates ho w
useful an item is in differentiating the respondents sensitiv ity levels (8 ) Information is a
function of 8 and therefore can provide differing levels of precision across the sensitivity
spectrum Figure 411 shows the information for all items included in the GRM The
level of information corresponds to the height of the curve and the location of inflection
along the sensitivity spectrum Looking at Multiple Loads one can see that items with
low and near-constant slope carry the same amount of information for all respondents On
the other hand items with steep slope and an inflection point in the positive 8 range such
as parking carry high amounts of information for respondents with an average-to-high
sensitivity level
60
Figure 410 Item Information Curves The item information curve illustrates how informative an item is with information increasing along the y-axis The x-axis determines the sensitivity region over which the item is most informative Items that peak in the middle of the x-axis are more informative for companies whose sensitivity level is average whereas the items that peak at the far left of the x-axis are more informative for companies that have low sensitivity levels
The sections that follow discuss further investigation of the five informative items
determined here using ordinal logistic regression with the exception of driver
availability Instead of driver availability which relates to hours of service limits with
regard to personnel management size and weight limits is included which was also an
informative item
Correlating Individual Factor Scores with Transportation Features
Ordinal logistic regression was completed for those items that differentiate respondents
(road grade refueling parking hours of service and size and weight limits) The normal
form of a logistic regression model is
where is the latent variable is an explanatory variable and is its coefficient
Because the response variable is ordinal ordinal regression must be used In this study
61
there were three thresholds 1 2 and 3 which distinguished between the possible
responses as follows
To obtain the variables in the model variables were added one by one and kept i n
the model if the variables coefficient was significantly different than zero All
statistically significant variables were kept in the model The following sections d etail the
regression model for each item
The goal of performing regression was to determine the key factors that
influenced each item individually These transportation featu res (ie provides long-haul
service) can then be used to predict someonersquos routing preferences A later section
discusses the use of latent class analysis to predict a companyrsquos responses to all items
tsimultaneously but because companies migh only be sensitive to one or two items
regression was useful for predicting which company characteristics influenced the item s
separately
Road Grade
The model for road grade included whether a company provided long-haul services and
to what extent the company back-hauled freight The model was as follows
log(P[Influence gt j]) - log(P[Influence j]) = f 0
-03682 (Company does not provide long-haul services)
+08635 (Company never back-hauls)
+ 12951 (Company rarely back-hauls)
+13505 (Company sometimes back-hauls)
+12793 (Company mostly back-hauls)
+16207 (Company always back-hauls)
where
62
Here j is the level of influence the company scored a given item (either a 1 2 3
or 4) The probability of scoring less than or equal to 4 was 1 that is why there are only
three intercepts The coefficients can be interpreted in the following manner If one holds
all values constant except for one say the company does not provide long-haul services
then the odds that the company would score road grade as a j (where j = 1 2 3) or lower
would increase by exp[-03682] = 0692 if the company did not provide long-haul
services
The ordered logistic regression above provides evidence that companies that
provided long-haul services and back-hauled freight are more likely to rate road grade as
influential in routing decisions Because of the time and distance involved in long-haul
trucking these companies have an incentive to carry freight both ways These companies
also have an incentive to carry as much freight as possible and hence will drive heavier
and larger trucks that are more sensitive to road grade
Refueling
The model for refueling included whether a company provided long-haul services o nly
All other variables when added to the model were statistically insignificant The model
was as follows
log(P[Influence gt j]) - log(P[Influence j]) = f0
-09829 (Company does not provide long-haul services)
where
Again j is the level of influence the company has scored a given item either a 1
2 3 or 4 The odds that the company would score refueling as a j (where j = 1 2 3) or
lower would increase by exp[-09829] = 0374 if the company did not provide long-haul
services
The ordered logistic regression above provides evidence that companies that
provide long-haul services were more likely to rate refueling locations as influential in
63
route decisions Because of the time and distance involved in long-haul trucking the se
companies must take i nto account refueling stations along the route
Parking
The model for parking included whether a company provided long-haul services only All
other variables when added to the model were statistically insignificant The model was
as follows
log(P[Influence gt j]) - log(P[Influence j]) = f 0
-1008 (Company does not provide long-haul services)
where
Again j is the level of influence the company scored a given item (either a 1 2 3
or 4) The odds that the company would score parking as a j (where j = 1 2 3) or lower
would increase by exp[-09829] = 0374 if the company did not provide long-haul
services
The ordered logistic regression above provides evidence that companies that
provided long-haul services were more likely to rate availability of parking as influential
in route decisions Long-haul truckers are more likely to be away from a company
warehouse or terminal while traveling and therefore have a greater need for pa rking
availability (Note Respondents may have considered parki ng as either parking at the
destination or parking overnightresting breaks)
Hours of Service Limits
The model for hou rs of service limits included whether a comp any provided long-haul
services and city-delivery services and whether the company operated regionally The
model was as follows
64
log(P[Influence gt j]) - log (P[Influence j]) = f0
-12031 (Company does not provide long-haul services)
-04137 (Company does not provide city-delivery services)
-05246 (Company does not operate regionally)
where
Again j is the level of influence the company scored a given item (either a 1 2 3
or 4) The odds that the company would score hours of service limits as a j (where j = 1
2 3) or lower would increase by exp[-12031] = 0300 if the company did not provide
long-haul services
The ordered logistic regression above provides evidence that companies that (1)
provided long-haul and city-delivery services and (2) operated regionally were more
likely to rate hours of service limits as influential in route decisions
Size and Weight Limits
The model for si ze and weight limits included whether a company provided long-haul
services operated tractor-trailers andor owned heavy haul equipment The model was as
follows
log(P[Influence gt j]) - log (P[Influence j]) = f0
-03645 (Company does not provide long-haul services)
-06655 (Company does not operate tractor-trailers)
-04785 (Company does not own heavy haul equipment)
where
Again j is the level of influence the company scored a given item (either a 1 2 3
or 4) The odds that the company would score size and weight limits as a j (where j = 1
65
2 3) or lower would increase by exp[-03645] = 0695 if the company did not provide
long-haul services
The ordered logistic regression above provides evidence that companies that
provided long-haul services operated tractor-trailers andor owned heavy haul
equipment were more likely to incorporate size and weight limits into their route
decisions The reasoning here is similar to that for road grade
Conclusions
The five regression models above show that whether a company provi ded long-haul
services affected the type of factors incorporated into route decisions Long-haul
companies face different obstacles than urban delivery services or drayage trucking and
therefore have different route choice decision making processes The next section
discusses the simultaneous investigation of these five items along with customer
requirements and total cost with regard to long-haul trucking
Routing Categories
In addition to examining items individually one can also analyze them simultaneously
This can be accomplished with latent class analysis Latent class modeling groups
companies into classes on the basis of probabilities rather than a measure of distance as
used in traditional cluster analysis Latent class analysis (LCA) does so by using mixture
models Mixture models seek to determine subpopulations within a general population in
the absence of explicit group identifiers The analysis generates probabilities that a
company belongs to each of the latent classes on the basis of the responses to the
manifest variables or items The company is assigned to the class to which it has the
highest probability of belonging Prior to observing the item responses every company
has an equal probability of belonging to each latent class This analysis seeks covariates
or company characteristi cs that will a priori predict the probability that a company will
belong to a latent class
To determine covariates variables were added one by one and checked for
significance This analysis identified whether a company provided long-haul trucking as
the only significant variable Other factors may influence the decision but could not be
determined from the data The latent class model uses cross-classification tables to
66
generate the joint distribution of items With a high number of manifes t variables and
covariates the cross-classification tables become sparse (consist primarily of zeros) and
the statistical techniques used in LCA become invalid Therefore the number of
covariates was kep t to a minimum
Figure 412 shows the results of LCA using nine items and one covariate The
items w ere total cost customer requirements refueling parking road grade size and
weight limits hours of service limits driver availability and HazMat and the covariate
was whether the company provided long-haul trucking The items chosen were the most
similar and the m ost discriminating items among the companies HazMat was not
discriminating overall but was chosen because it was informative over the high sensitivity
region The graph shows the seven items on the horizontal (x) axis the possible score (1
2 3 or 4) on the skewed (y) axis and the probability (between 0 and 1) of a given
observation occurring in the specific latent class on the vertical (z) axis The analysis
generated three latent classes with the following population sizes (class population
share) (1 0411) (2 0377) and (3 0213) The graph shows that items for which
diagnostics revealed little information appear similar among all classes whereas more
informative items have d istributions that vary across the classes
Figure 411 Latent Classes with Long-Haul Covariate The plots show that the most discriminating items have varying response patterns across the latent classes whereas the least discriminating items have similar r esponse patterns across the latent classes
67
The covariate allows one to predict what class a company belongs to before
observing the companys responses to the items (manifest variables) After the analysis
was run companies in each class were examined to determine their response to the
covariate The percentages of companies that provided long-haul trucking in eac h class
were as follows
bull Class 1 1397
bull Class 2 3871
bull Class 3 5424
Class 1 consisted of primarily non-long-haul truckers while class 3 had the
highest percentage of long-haul trucking companies Many companies may provide more
than one service The companies in class 3 all provided long-haul trucking services but
they may have varied with respect to whether and what other services they provided and
to what extent Figure 413 shows the probability of belonging to a class given a
companys response to whether they provided long-haul services across the levels of
sensitivity to routing factors As sensitivity increases the probability that a company is a
long-hauler increases
Figure 412 Long-Haul as a Predictor of Latent Class The graph shows that as sensitivity to routing factors increases the company is more likely to belong to class 3 which is the class with the most lo ngshyhaulers
68
Long-haul providers travel longer distances so they have an incentive to carry as
much cargo as possible per trip This may motivate their concern for size weight and
hour limits Companies that do not provide long-haul services may be city deliver y and
regional trucking companies that do not encounter difficulties with large heavy trucks
and do not require parking or refueling along the route Class 2 consisted of about 39
percent long-haul providers and had a monotone trend with regard to influence of size
and weight limits hours of service limits and driver availability as well as more average
influence scores (2rsquos and 3rsquos) for parking refueling and road grade as seen in Figure
413 These companies provide a broader range of services and the companies that did
provide long-haul services may have done so only a minority of the time Because Class
2 and Class 3 had higher average scores HazMat was used in the model because it is
informative over the highly sensitive region Companies in Class 3 were clearly eith er
carrying hazardous material regularly or not at all (HazMat was ranked as a 1 or 4)
The predicted probabilities (the probability that a company belongs in each o f the
three latent classes without knowledge of their responses to the 15 items) can be fou nd by
using the following general form
where R is the number of latent classes The coefficients fR are listed in Figure 414
Figure 413 Parameter Coefficients The coefficients are to be input into the above formula to generate three probabilities per company one for each latent class All coefficients for latent class 1 are zero
69
The result of the latent class analysis was three distinct classes into which
companies could be classified The graph of the priority trends of each group show some
factors are important to everyone and some factors maybe unimportant to one class
moderately important to another and highly important to yet another class
CONCLUSIONS
From the analysis described in this report several conclusions can be made about the
priorities of company routing decision-making
1 From item diagnostics it is clear that the five most discriminating factors are
a hours of service limits
b availability of truck parking
c driver availability
d refueling locations and
e road grade
All of these factors are most distinguishing across the average sensitivity level
2 Long-haul trucking is a significant predictor of how a company will rank a given
item Other important predictors included
a whether and to what extent a company back-hauls freight
b whether a company provides city delivery and regional trucking
c and the equipment the company owns
3 The latent class analysis revealed three distinct groups in the data
a Urban Truckingmdash Only cost and meeting customer requirements are
important in their routing decisions
b Local-Regional Truckingmdash Regional and opportunistic firms
c Long-Haul TruckingmdashAll factors are ranked as important with the
majority of all companies ranking all factors as 4rsquos These companies most
likely have heavy and large trucks require overnight parking and drive
routes that require refueling and several hours of driving
70
To account for the differences in priorities among the categories the Statewide
Freight GIS Network Model should be modified for each class separately The
probability that a given company belongs to each of the three classes can be predicted a
priori by determining whether the company provides long-haul or city delivery services
71
5 RECOMMENDATIONS FOR MODIFICATIONS TO THE STATEWIDE FREIGHT GIS NETWORK MODEL
Through this research we gathered information on how truck freight routing
decisions are made and how these decisions vary across freight carriers shippers and
forwarders We catalogued how routing decisions vary by truck freight services type
commodity shipped industry sector served and how route choices are affected by
congestion travel time route reliability and business- and product-specific supply chain
characteristics
This section presents recommendations regarding how this knowledge can be
incorporated into WSDOTrsquos Statewide Frei ght GIS Network Model When statewide
commodity flow information is available this will provide substantial improvements in
state freight modeling capability
The state of Washington possesses a Statewide Freight GIS Network Model
Currently if trip origin and destination are known the model will assign the trip to the
roads that provide the shortest route available between the origin and destination
The survey results clearly show that respondents were trying to meet customer
requirements while minimizing time distance andor cost Truck operating costs
primarily relate to fuel consumption and driver pay Distance driven is a primary
determinant of operating cost and is strongly correlated with driving cost Time is
primarily a function of distance travelled however congestion can also be a factor So to
a large exten t meeting time cost and distance requirements can be considered to be the
same objective Through the survey conducted for this project we confirm ed that the
shortest path is overwhelmingly the appropriate logic to use once the origin destinatio n
and road network are known To improve upon the logic of the existing Statewide
Freight GIS Network Model we recommend the following changes
72
1 Use a truck usable network (based on the Household Goods Mileage Guide)mdashnot
the entire road networkmdashto account for road classification
It is possible that the network may include a shorter route but that the roads will
nevertheless not be appropriate because of geometric or legal constraints
attributable to their classification or local ordinances To capture true truck
behavior we suggest that only the truck usable network be considered
2 When commodity data are available overweight oversize and hazardous
material trips should be identified and relevant infrastructure restrictions captured
in the network
Hazardous waste should be identified by commodity code (NAICS codes 562211
562112 484230 484230) The network for trips with this commodity
classification should be limited to those links where hazardous materials are
tolerated
3 When using the network to reflect winter conditions include seasonal road
closures The model is currently run for one point in time and does not simulate
time steps of any length When the model is intended to represent winter
conditions relevant seasonal closures should be included
4 Instead of using the speed limit as the estimated travel speed on a link we suggest
using observed travel speed from the truck performance measures project This
could be an overall average or the average for a specific time of day We suggest
that these speeds then be converted to values by using a truck value of time This
would allow additional costs to be considered in the routing such as tolls and the
cost of emissions Time can be converted to dollars by using an estimated value
of time for trucks Emissions costs can be estimated in a similar fashion
The Latent Class Analysis identified three classes of carriers with respect to
routing decisions urban trucking local-regional trucking and regional long-haul
trucking These classes are strongly related to the geographic extent of their operations
as well as their ldquolocationrdquo on the supply chain (eg raw materials intermediate
processingstorage or distribution) This knowledge allows us to implement routing
logic on the basis of the geographic extent of the trip instead of or in addition to a
73
carrier-based assumption For example instead of implementing new logic for urban
trucking carriers we can implement new logic for origin-destination pairs within urban
regions We recommend the following model implementations to reflect the differen t
routing priorities of our three categories
5 For trips with origins and destinations within urban regions (specifically the four
counties of the Puget Sound) use the distribution of truck sizes for trucks that
deliver in cities
Table 51 Distribution of Truck Sizes
6 For trips with origins and destinations within urban regions (specifically the four
counties of the Puget Sound) assume no backhaul
7 For origin-destination pairs with a distance of over 300 miles use a network that
is navigable by large and heavy trucks
8 For origin-destination pairs that exceed a distance of 500 miles choose routes th at
include a truck parking location every 500 miles (this will require documen tation
of truck parking locations)
9 Add time-step simulation capacity to the model framework
10 Develop a trip chaining model to capture backhauling for trips of over 500 miles
and trip chains within urban regions (specifically the four counties of the Puget
Sound)
With tight state budgets completing all of these improvements independentl y
make prove too costly CalTrans is working with the University of Ca lifornia at Irvine to
develop a novel framework for freight modeling Dr Goodchild (UW) serves on the
advisory committee As this work develops it is prudent to judge whether or not this
framework can be applied to Washington State
74
6 CONCLUSIONS
From the analysis described in this report many conclusions c an be drawn about
the issues of concern and the methods by which companies make strategic routing
decisions We can also make conclusions regarding the utility of using statewide GPS
data for measuring routing decisions
1 Off-the-shelf routing software automatically assigns routes on the basis of le ast cost
given an origin-destination pair (determined by customer requirements) Other
concernspriorities can be input to a) limit the network upon which the freight may be
routed or b) prioritize them by level of importance
2 A small minority of companies in Washington use routing software
3 Minimizing cost while meeting customer requirements is the goal of every shipper
carrier and freight forwarder Beyond that among all classes the most importan t
motivator of rou te choice comprises policies imposed on the company Physical
constraints such as parking refueling stations and road grade appear to be issues that
companies can find ways around To account for the differences in constraints among
the classes the network model should be modified for each group
4 Routing behavior is grouped around distance travelled with long-haul trips exhibiting
different routing priorities and characteristics than urban activity Long-haul truckers
are more likely to backhaul drive larger and heavier equipment require overnight
parking and drive routes that require refueling and several hours of driving Urban
trucking is largely local and for urban trucking service providers only cost and
meeting customer requirements are important in routing decisions The majority of
this class ranked all other factors as having ldquono influencerdquo
5 In congested regions companies that can choose to shift the travel time to avoid delay
rather than shift the travel route In fact if one alternative is congested it is likely
that other alternatives are also congested and so shifting route to avoid congestion
may not be possible or the alternative may not be substantially better
6 The utility of using of currently available statewide GPS data to determine route
choice behavior is very limited The data can be used to observe route choice
75
behavior but only where network decisions are about 20 miles apart In addition
identifying stops remains challenging
76
7 REFERENCES
Binsbergen Boerkamps and Bovy (2000) Modeling Behavioral Aspects of Urban Freight Movement In Supply Chains Transportation Research Record 1725 17 -25
Crainic Teodor and Roy Jacques (1988) OR Tools For Tactical Freight Transportation Planning European Journal of Ope rational Research 33 290-297
Garrido Rodrigo and Regan Amelia (2002) ``Modeling Freight Demand and Shipper Behavior State Of The Art Future Directions Institute Of Transportation Studies University Of California Irvine CA
Hunt J D and Stefan K J (2007) Tour-Based Microsimulation of Urban Commercial Movements Transportation Research Part B 41(9) 981-1013
Krapfel Robert and Mentzer John (1982) Shippers Transportation Choice Processes under Deregulation Industrial Marketing Management Volume 11 Issue 12 Pg 117-124
Li S Zhu K V G Nagle J amp Tuttle C (2002) Reconsideration of Sample Size Requirements for Field Traffic Data Collection with Global Positioning System Devices Transportation Research Record
Ma X amp McCormack E (2010) Using Truck Fleet Management GPS Data to Develop the Foundation for a Performance Measures Program Transportation Research Record
McCormack E amp Hallenbeck M E (2006) ITS Devices Used to Collect Truck Data for Performance Benchmarks Transportation Research Record Journal of the Transportation Research Board(1957) 43-50
Miguel Figliozzi (2006) Modeling Impact of Technological Changes on Urban Commercial Trips by Commercial Activity Routing Type Transportation Research Record 1964 118-126
Tavasszy L A Van Der Vlist M J M and Ruijgrok C J (1998) A DSS For Modeling Logistics Chains In Freight Transport Systems Analysis Int Intelligent Transportation Operational Research 5(6) 447-459
Vieira LFM (1992) The Value of Service in Freight Transportation PhD Thesis Massachusetts Institute of Technology Boston MA
Zhao W Goodchild A V amp McCormack E D (2011) Evaluating the Accurancy of GPS Spot Speeed Data for Estimating Truck Travel Speed Transportation Res earch Board Annual Meeting Washington DC
77

Final Research Report Agreement T4118-55T4120-17K380
Statewide Freight Routing
IMPROVING STATEWIDE FREIGHT ROUTING CAPABILITIES FOR SUB-NATIONAL COMMODITY FLOWS
by Maura Rowell Andrea Gagliano Zun Wang Anne Goodchild
Graduate Research Asst Graduate Research Asst Graduate Research Asst Assistant Professor Department of Civil and Environmental Engineering
University of Washington
Jeremy Sage Eric Jessup Graduate Research Assistant Associate Professor
School of Economic Sciences Washington State University
Washington State Transportation Center (TRAC) University of Washington Box 354802
1107 NE 45th Street Suite 535 Seattle Washington 98105-4631
Washington State Department of Transportation Technical Monitor Barbara Ivanov
Co-Director Freight Systems Division
Prepared for
The State of Washington Department of Transportation
Paula J Hammond Secretary
October 2012
1 REPORT NO
WA-RD 7921 2 GOVERNMENT ACCESSION NO 3 RECIPIENTS CATALOG NO
4 TITLE AND SUBTITLE
IMPROVING STATEWIDE FREIGHT ROUTING CAPAshyBILITIES FOR SUB-NATIONAL COMMODITY FLOWS
5 REPORT DATE
October 2012 6 PERFORMING ORGANIZATION CODE
7 AUTHOR(S)
Maura Rowell Andrea Gagliano Zun Wang Anne Goodchild Jeremy Sage Eric Jessup
8 PERFORMING ORGANIZATION REPORT NO
9 PERFORMING ORGANIZATION NAME AND ADDRESS
Washington State Transportation Center (TRAC) University of Washington Box 354802 University District Building 1107 NE 45th Street Suite 535
Seattle Washington 98105-4631
10 WORK UNIT NO
11 CONTRACT OR GRANT NO
UW Agreement T4118 Task 55 WSU Agreement T4120 Task 17
SESRC WSU Agreement K380 12 SPONSORING AGENCY NAME AND ADDRESS
Research Office Washington State Department of Transportation Transportation Building MS 47372 Olympia Washington 98504-7372 Kim Willoughby Project Manager 360-705-7978
13 TYPE OF REPORT AND PERIOD COVERED
Final Research Report
14 SPONSORING AGENCY CODE
15 SUPPLEMENTARY NOTES
This study was conducted in cooperation with the US Department of Transportation Federal Highway Administration 16 ABSTRACT
The ability to fully understand and accurately characterize freight vehicle route choices is important in helping to inform regional and state decisions This project recommends improvements to WSDOTrsquos Statewide Freight GIS Network Model to more accurately characterize freight vehicle route choice This capability when combined with regional and sub-national commodity flow data will be a key attribute of an effective statewide freight modeling system To come to these recommendations the report describes project activities undertaken and their outcomes including 1) a review of commercially available routing software 2) an evaluation of the use of statewide GPS data as an input for routing analysis and 3) the design implementation and evaluation of a survey of shippers carriers and freight forwarders within the state The software review found that routing software assumes least cost paths while meeting user specified constraints and it identified criteria for evaluation in the subsequent survey The GPS data evaluation showed that significant temporal shifting occurs rather than spatial route shifting and it revealed significant limitations in the use of GPS data for evaluating routing choices largely because of the read rate Among the survey results was that the first priority of shippers carriers and freight forwarders is to not only meet customer requirements but to do so in the most cost-efficient way From a latent class analysis of routing priorities we discovered that distance-based classification best clusters similar routing behavior The report includes recommendations for implementing this within the Statewide Freight GIS Network Model 17 KEY WORDS
Freight freight modeling routing GIS network GPS data routing software
18 DISTRIBUTION STATEMENT
No restrictions This document is available to the public through the National Technical Information Service Springfield VA 22616
19 SECURITY CLASSIF (of this report)
None
20 SECURITY CLASSIF (of this page)
None
21 NO OF PAGES 22 PRICE
DISCLAIMER
The contents of this report reflect the views of the authors who are responsible
for the facts and the accuracy of the data presented herein The contents do not
necessarily reflect the official views or policies of the Washington State Department of
Transportation or the Federal Highway Administration This report does not constitute a
standard specification or regulation
iii
iv
CONTENTS
EXECUTIVE SUMMARY xi Freight Routing Software xi Evaluation of GPS Route Data xi Routing Priorities xii Recommendations xiii
1 OVERVIEW 1
2 FREIGHT ROUTING SOFTWARE REVIEW 2 Introduction 2 Software Name PCMiler (ALK Technologies) 3 Cost Alternatives 3 Industry Use 3 Primary Features 3 Unique Attributes 4 Limitations 4 PCMiler Usability 5 Software Name Rand-McNally (MilemakerIntelliroute) 8 Cost Alternatives 8 Industry Use 9 Primary Features 9 Unique Attributes 9 Limitations 10 Intelliroute Usability 10 Software Name Prophesy Transportation Software Inc 13 Cost Alternatives 13 Industry Use 13 Primary Features 14 Unique Attributes 14 Limitations 14 Software Name ProMiles 15 Cost Alternatives 15 Industry Use 15 Primary Features 15 Unique Attributes 16 Limitations 16 Software Name Cheetah 16 Cost Alternatives 16 Industry Use 16 Primary Features 17 Unique Attributes 17 Limitations 17 Software Name TSI Automation 17
v
Cost Alternatives 17 Industry Use 18 Primary Features 18 Unique Attributes 18 Limitations 18 Software Name Appian Logistics (Formerly Microanalytics) 19 Cost Alternatives 19 Industry Use 19 Primary Features 19 Unique Attributes 20 Limitations 20 Software Name Truck Dispatching Innovations (TDI) 20 Cost Alternatives 20 Industry Use 20 Primary Features 21 Unique Attributes 21 Limitations 21 Summary of Routing Software Review 21
3 EVALUATION OF USE OF GPS ROUTE DATA FOR EVALUATING ROUTE CHOICE 24 Introduction 24 The GPS Data 24 Case Studies 25
Case Study I TAZ 385mdashTAZ 545 26 Southbound Analysis 28 Northbound Analysis 31
Case Study II TAZ 180mdashTAZ 609 33 Eastbound Analysis 35 Westbound Analysis 36 Sample Size 37 Feasibility of Using GPS Truck Data to Identify Truck Routes 38 Conclusions 40
4 ROUTING PRIORITIES 42 Motivation 42 Literature Review 43 Study Methodology 45
Collection of Data via Survey 45 The Survey 47
Survey Descriptive Statistics 48 Industry Breakdown 48
Company Activity and Outside Carriers 49 Services Provided Breakdown 50 Number of Vehicles 51 Truck Type Breakdown 51
vi
Frequency of Changes in Routing Shipments 52 Commodities 53 Number of Weekly Trips versus Numbers of Employees and Vehicles 53
Quality of Factor Scores 54 Importance of Routing Factors 55 Use of R 57
Results 57 Item Response Theory 58
Item Information 60 Correlating Individual Factors Scores with Transportation Features 61
Road Grade 62 Refueling 63 Parking 64 Hours of Service Limits 64 Size and Weight Limits 65 Conclusions 66
Routing Categories 66 Conclusion 70
5 RECOMMENDATIONS FOR MODIFICATIONS TO THE STATEWIDE GIS NETWORK MODEL 72
6 CONCLUSIONS 75
7 REFERENCES 77
vii
FIGURES
31 Monthly GPS Data and TAZ Layer 25 32 Case Study I Truck Trips between TAZ 385 and TAZ 545 26 33 Southbound Travel Time Distributions along I-5 and I-405 28 34 Southbound Travel Speed Distributions along I-5 and I-405 29 35 Southbound Truck Proportions and Travel Time Using I-5 and I-405 by
Time of Day 30 36 Northbound Travel Time Distributions along I-5 and I-405 31 37 Northbound Travel Speed Distributions along I-5 and I-405 32 38 Northbound Truck Proportions and Travel Time Using I-5 and I-405 by
Time of Day 33 39 Case Study IImdashTruck Trips between TAZ 180 and TAZ 609 34 310 Eastbound Truck Proportions and Travel Time Using I-90 and SR 520 by
Time of Day 36 311 Truck Proportions and Travel Time Using I-90 and SR 520 by Time of Day 37 312 Relationship between Truck Route Length and Distance between Two
Successive GPS Reads 39
41 Industry Breakdown 49 42 Company Activity and Outside Carriers 49 43 Service Types Provided 50 44 Number of Vehicles per Company for Carriers 51 45 Vehicle Types in Carrier Fleets 52 46 Correlation between Number of Employees and Number of Trips 53 47 Correlation between Number of Vehicles and Number of Trips 54 48 Frequency of Total Sum of 15 Factors Influencing Routing Decisions 55 49 Item Operation Characteristic Curves (IOCC) 59 410 Item Information Curves 61 411 Latent Classes with Long-Haul Covariate 67 412 Long-Haul as a Predictor of Latent Class 68 413 Parameter Coefficients 69
viii
TABLES
21 Summary of Reviewed Software Routing Attributes 22
31 Attributes of Trips between Zone 385 and Zone 545 27 32 Truck Performance along I-5 and I-405 27 33 Southbound Travel Time Distributions along I-5 and I-405 28 34 Time of Day Breakdown 29 35 Northbound Truck Performance along I-5 and I-405 31 36 Attributes of Trips between TAZ 180 and TAZ 609 34 37 Truck Performance along I-90 and SR 520 35 38 Eastbound Truck Performance along I-90 and SR 520 35 39 Westbound Truck Performance along I-90 and SR 520 37
41 Percentage of Companies that Scored Item with a 4 56 42 Overall Averages 56
51 Distribution of Truck Sizes 74
ix
x
EXECUTIVE SUMMARY
Existing transportation network models assume that vehicles select the least costly path
between origin and destination This cost can entail time distance money or a
combination of these factors This project used three approaches to investigate the
reasonableness of this assumption and produced recommendations for revising the least
cost routing approach for the statersquos geographical information systems (GIS) network
model
Through this work we also described the state of the art in freight routing
software the utility of the Washington State Department of Transportationrsquos (WSDOT)
Global Positioning System (GPS) data for understanding routing patterns and the routing
priorities of shippers carriers and freight forwarders These interim results are fully
described in this report and are summarized below
FREIGHT ROUTING SOFTWARE
One task of this project was to conduct a review of commercially available routing and
mapping software These software programs are designed to optimize the routes of
individual trucks or fleets not to assign all trucks to routes (as a statewide freight model
would do) However their logic reveals the factors of importance to carriers when they
make routing decisions We identified routing factors and algorithms of PCMiler
Rand-McNally ProMiles Prophesy and ArcLogistics which were found to include
considerations for truck height and weight infrastructure height and weight restrictions
toll expenses and fuel purchasing cost While we had assumed that some hierarchy of
priorities would be built into the software we found that this was not the case Instead in
each case the prioritization is left to the user Every product examined uses a shortest
path assignment once other constraints have been met (eg size and weight restrictions)
however toll and fuel acquisition costs can be added to the route cost
EVALUATION OF GPS ROUTE DATA
To assess the utility of using GPS truck data to improve the link-cost functions that are
part of the WSDOT statewide freight model truck travel patterns were examined
Specifically two case studies examined route choice by time of day system performance
xi
and origin-destination The case studies were selected in areas that experience
congestion with the assumption that congestion may cause route shifting behavior We
discovered that instead of route shifting trucks in the Puget Sound exhibited strong time
of day shifting behavior
We found that because of the 15-minute intervals between reads route diversions
that occur within 20 miles of the previous route decision (the maximum assumed travel
distance in 15 minutes) cannot be identified This means that many route choice
decisions within the Puget Sound that is those where route choice decisions are possible
at each block or freeway exit remain undetected We concluded that although GPS data
are able to provide reliable transportation performance information they are not currently
sufficient for analyzing or estimating truck route choices
ROUTING PRIORITIES
To identify routing priorities a survey was conducted of approximately 800 shippers
receivers and carriers of freight in Washington State The survey was designed to find
the strategies that companies use when determining routes More specifically its goal
was to confirm or refute the least cost assumption used in existing network models We
found that overwhelmingly respondents were meeting customer requirements while
minimizing time cost or route distance Respondents to the survey were also asked to
rank the level of influence of 15 factors that influence routing decisions After the survey
had been completed analysis of the responses included ordinal logistic regression and
latent class analysis These tools allowed us to identify the correlations between routing
behavior and other characteristics of a company such as number of trucks or primary
commodity and to group the respondents with others who had the same routing
behaviors
The analysis found five factors that differentiated among respondents and allowed
us to group them into routing categories 1) hours of service limits 2) availability of truck
parking 3) driver availability 4) refueling locations and 5) road grade Long-haul
trucking city-delivery trucking regional trucking the equipment companies own and
whether or not a company backhauls freight were found to be important predictors of
how companies ranked the 15 routing factors and thus their routing category From
these results the respondents were classified into three groups titled urban trucking
xii
local-regional trucking and regional long-haul trucking These categories should be used
when trips are assigned to routes on the network
RECOMMENDATIONS
The state of Washington possesses a statewide GIS network model Currently if the trip
origin and destination are known the model will assign the trip to the roads that provide
the shortest route between the origin and destination Through the survey conducted for
this project we confirmed that the shortest path is overwhelmingly the appropriate logic
to use once the origin destination and road network are known However the following
general improvements should be made to this model logic
Network
a Apply a truck usable network (based on the Household Goods Mileage Guide)
not the entire road network to account for road classification
b When commodity data are available hazardous material trips should be identified
and relevant infrastructure restrictions captured in the network
c Include seasonal road closures
d Update speeds to reflect true travel speed obtained from the truck performance
measures project rather than the speed limit
Objective Function
Least distance or least time should be converted to dollars so that tolls can be added to
the cost of travel along a link This will also allow emissions cost to be added to a link
with an assumed emissions value
Spatial Variation
Three categories of carriers should be reflected in the routing logic urban trucking local-
regional trucking and regional long-haul trucking For carriers in these groups the
following changes should be incorporated
a For trips within urban regions use the distribution of truck sizes present for those
that deliver in cities and assume no backhaul
b For origin-destination pairs of over 300 miles use a network that is navigable by
large and heavy trucks
xiii
c Require origin-destination pairs that exceed 500 miles to choose routes that
include a truck parking location every 500 miles (this will require documentation
of truck parking locations)
xiv
1 OVERVIEW
This report describes the work of three distinct research streams that culminates into a
broad understanding of routing decision-making among freight carriers shippers and
freight forwarders in Washington state and on the basis of this understanding
recommendations for how to develop the Statewide Freight Geographic Information
Systems (GIS) Network Model1 to better represent routing behavior within this
community When sub-national commodity flow data are available the state freight
model will be able to assign strategic routing choices in a way that better reflects industry
practice
The first part of this report provides a thorough review of commercial routing
software identifying its primary characteristics market penetration and price This is
followed by a chapter that describes the utility of using statewide Global Positioning
System (GPS) data for routing analysis given the temporal quality of the current data
This is demonstrated through the use of two case studies Finally the development
implementation and analysis of a survey are described The survey allowed for a
detailed examination of routing decisions with timely data By synthesizing the lessons
learned from each of these tasks the report concludes with recommendations regarding
strategic routing decision making and how the Statewide Freight GIS Network Model can
be modified to better capture truck routing within the state
1 The Statewide Freight GIS Network Model was developed by UW and WSU researchers in 2009 It is housed at the University of Washington The model currently lacks statewide commodity flow data but has been used to evaluate specific supply chains including potatoes and diesel distribution
1
2 FREIGHT ROUTING SOFTWARE REVIEW
INTRODUCTION
Freight routing needs and input variables have a special set of requirements that the
typical dashboard navigation systems based heavily on and designed for passenger
vehicle travel may not be fully equipped to handle To meet the unique routing needs of
freight service providers several software and mapping companies have developed
specialized commercially available routing software Much of the freight routing
industry is founded on a handful of products with many third-party companies then using
those as the basis for their add-on (complete freight management) systems Generally
PCMiler Rand-McNally ProMiles Prophesy and to a lesser degree ArcLogistics form
the base of freight routing The common deviation from the typical dashboard navigation
system found within all versions of the freight routing software is to allow the freight
companies to dictate the special routing requirements of their trucks Special routing
inputs most often take the form of height weight and load-type restrictions that may
require trucks to avoid particular segments of a route Additionally many of these
products take into account toll expenses and fuel purchasing optimization needs that can
greatly affect the travel costs of each load
The following review highlights the applications and routing decision inputs for
each of the four major software products identified above followed by a brief outline of
the third-party systems partnering with these companies and the additional services that
they provide Many full service freight management companies utilize the mapping and
routing software of these companies to accommodate the complete needs of shippers and
carriers These third-party add-on companies integrate the routing outputs to develop
comprehensive rate quoting systems as well as accounting tax and payroll management
functions
Note that each of these companies offers multiple programs that encompass all
aspects of the freighting industry such as billing and maintenance however this review
focused mainly on routing and fueling decision inputs The content of this review was
based on readily available information from the websites and user guides of the software
producers with the exception PCMiler and Rand-McNally MileMakerregIntelliRoutereg
2
Given that these two represent the majority of industry usage the trial version of each
was obtained and tested and extended reviews are provided
SOFTWARE NAME PCMILERreg (ALK TECHNOLOGIES)
Cost Alternatives
PCMilerreg
Single User (Windows) $189500
Data Modules (single users) PCMiler Tollsreg $FREE
PCMiler Streets- USreg $110000 PCMiler Streets- Canadareg $59500 PCMiler HazMatreg $110000
Interface Modules(Requires 5-User License) PCMiler RailndashConnectreg $350000 PCMiler Connectreg $299500
This is only a partial product list See PCMilerreg Product line price list for more details
Industry Use
PCMilerreg claims to be the leader in routing mileage and mapping software with 96
percent of the top motor carriers the Department of Defense (DoD) the General Services
Administration (GSA) and the Federal Motor Carrier Safety Administration (FMCSA)
on its client list PCMilerreg generates truck-specific directions and mileage summaries at
the turn-by-turn street level Additionally it has an intermodal analysis function that
calculates alternative rail intermodal routes between origin and destination This allows
for comparisons in fuel consumption and carbon emission between modes
Primary Features
The streets application in PCMilerreg provides dock-to-dock driving directions for truck-
specific routes based on US Census TIGER files Route designation inputs account for
truck characteristics of height weight and length to ensure adherence to bridge height
load limit and other truck restrictions For example PCMilerreg has an ldquooverride
restrictionsrdquo tab that allows the user either to abide by the ldquotruck prohibitedrdquo and ldquotruck
3
restrictedrdquo designations of a given road or override them if the user has a light vehicle in
which case the generated route will include ldquotruck restrictedrdquo road but still avoid ldquotruckshy
prohibitedrdquo designations Routes are generated with either practical or shortest route
parameters in addition to toll discouraging and HazMat routing Additional route
designation choices include the avoidance of dangerous turns as well as urban road
classifications
Similar to other programs PCMilerreg offers the ability to incorporate company
fuel networks into the routing decisions and the turn-by-turn directions This application
calculates and suggests not only where to purchase fuel but also how much to purchase
at a given location given truck-specific inputs and the fuel choices further along the
current route
It also allows the user to reconcile the cost savings or losses incurred by using a
toll road or taking a longer non-toll route for all truck specific routes Similar to the fue l
optimization this software accounts for user negotiations with various toll authorities
Unique Attributes
Unique features that PCMilerreg allows include route customization along favored roads
or road segments and through specific jurisdictions The HazMat application allows the
user to generate a route on the basis of one of six different HazMat types (caustic
explosives flammable general inhalants and radioactive) These HazMat-specifi c
directions ensure compliance with department of transportation (DOT) and other Haz Mat
regulations and increase the reliability of correctly estimating operating costs and driver
pay PCMilerreg is the also only software reviewed that promotes its ability to highlight
inter-modal connectivity and provide truck versus rail comparisons including carbon
emission calculations
Limitations
The primary limitation similar to several of the other routing software programs is that
PCMilerreg does not allow or utilize less-than-truckload (LTL) inputs into its route
calculations Therefore for industries or businesses that move and ship primarily L TL
type freight this software will not be best suited for these purposes
4
PCMiler Usability
Below is a sample of the options tested within PCMiler trial version with detailed
summary descriptions from the usersrsquo manual
Generating Routes and Mileage
The PCMiler mapping representations are created through ALK Technologiesrsquo
proprietary North American Highway System representations The highway systems are
derived from official state highway state DOT county and local maps as well as
information from industry users Rendered distance calculations are a reflection of
straightforward summations of the road segments travelled on the identified routes
Where specific addresses are used for origin and destination the exact mileage and
direction are provided If no exact addresses are given then the nearest Key City is used
to provide distance and route as accurately as feasible
Basic Route Definition
PCMiler provides a basic point and click user interface that allows users to specify the
origin intermediate stops and destination locations Once routes have been created they
are displayed both in tabular and map formats The tabs display generated results for
miles cost per mile (set by default or adjusted by user inputs) and hours of the route
both in total and for each leg of the trip By default this occurs for the practical miles
route Users can quickly copy and convert that to a user selected shortest route option
By default the software generates the route in the stop order entered by the user
however the stops may be easily re-sequenced to optimize stop order efficiency The re-
sequencing can be done for the entire sequence but it leaves the first and last stops as the
directed starting and stopping endpoints
Users can easily manipulate the scale and appearance of the map displays with
point and click operations as well as adjust components such as legends and scale bars
with drag and drop operations Automatic label and icon displays are set to varying
degrees of scale For example when a map is zoomed to a detail level of eight out of
twelve points of interest such as fueling stations are displayed Users can enter stop
locations through an address window designate longitudelatitude points and also select
5
them from the map with a point and click operation Maps additionally display truck stop
locations which can be added as stoprest times Routes can be easily manipulated
within the map view The user can manually select roads or road segments to favor o r
avoid or to override default restrictions
Practical Routes
Practical routes represent the distances and driving routes that a driver would typi cally
take to minimize time and cost Practical routes are created with consideration of the
tradeoffs between the most direct paths and the advantages of staying on major high ways
Hierarchically practical routing assigns priority starting with Interstate highways
followed by toll roads then secondary highways Routing decisions made within
practical routes additionally consider truck-restricted roads urbanrural designations and
designated principal and secondary through-routes When route re-sequencing is done
under a practical routing setup the re-sequencing minim izes total time
Shortest Routes
Shortest route calculations exclude all the considerations of practical routes in favor of a simple
fewest-miles-travelled requirement while still observing truck restrictions When route re-
sequencing is done under a shortest routing setup the re-sequencing minimizes total distance
National Network Routes
Using the routes designated by the Surface Transportation Assistance Act of 1982
(STAA) PCMiller also offers a routing option that determines routes and distanc es in
accordance with those routes most reasonable and legal for the larger trucks authorized
under STAA When the user selects this routing option the software creates a route that
stays on the national network to the maxim um extent feasible Where deviation must
occur the software selects the shortest available routes that still meet other restrictions
the user has already identified When route re-sequencing is done under a national
network routing setup the re-sequencing minimizes total distance
PCMiler also offers an additional component to the National Network routing
option in the form of 53-ft102-in routing for these dimensioned trailers and their
additional restrictions Similar to the basic National Network routing the software
6
attempts to keep the route on network highways where feasible and provides a warning
indicator when deviance is required
Toll Avoidance
With the PCMiler tolls add-on module the user can compare costs between taking a toll
road and using a route that avoids the tolls thus enabling a more cost-effective decision
The toll cost calculations are available for both the US and Canada and are updated
quarterly The toll route add-on is directional-specific and allows for user entry of
discounted toll programs PCMiler identifies two potential sources of inaccuracy in its
toll calculations These may arise from weight-specific tolls if the user has not ente red
vehicle dimensions In addition some tolls vary by time of day in this instance th e
software calculates the toll based on the highest rate
The first potential inaccuracy is easily remedied by ensuring that the user has
identified truck dimensions (axles height and weight)
Manipulating the toll options is a rather simple task in the route option windows
The software produces toll estimates for each leg of the selected routes (any of the above
routing options can be used in addition to the toll avoidancecalculation) and cumulative
toll costs are observable in the state summary page Additionally toll comparisons can be
made between default settings and specified toll avoidance This action yields a
comparison of miles cost time and toll cost even when the program is told to avoid
tolls some residual tolls may be used to preclude excessive avoidance When route re-
sequencing is done under a toll avoidance routing setup the re-sequencing minimizes
total toll distance
Route Creation Highlights
One of the more valuable capabilities of the software is the ability to quickly generate
duplicate routes so that users can quickly compare different routing alternatives such as
different route types or the addition of one more stop Additionally users can adjust
driver needs such as on-duty and off-duty costs and can select to include these in the
total costs estimates as well as any potential empty miles that must be considered
Many users will likely already have significant volumes of customer addresses
loaded in some type of database PCMiler (with the Streets module) allows importation
7
of from xls or txt files through a geocoding process In testing the programrsquos ability to
successfully geocode addresses from files we attempted to input several on-hand
databases with a reasonably high success rates If longitudelatitude values are available
this will greatly increase matching These locations can then be added to the userrsquos
Custom Places records for future use
The fuel optimization add-on is another valuable asset of this program It allows
users to calculate fuel optimization for each truck in their fleet by inputting specific fu el
capacities and gallons per minute When this add-on is then applied to a specific tr uck
the software automatically adds in optimal fuel stops along the designated route In
addition the program suggests how much fuel to purchase and the estimated cost of that
purchase fuel cost data are updated daily in conjunction with wwwfueladvicecom
PCMiler offers an intermodal analysis add-on tool along with its rail-connect
add-on This tool computes the origin-destination costs of using rail rather than trucks
Comparisons are made for fuel consumption mileage an d carbon emissions This
software was found to be quite user friendly allowing for a quick grasp of its general
organizational flow The attributes to be minimized under each routing scheme are clear
make logical sense and are flexible enough to allow users to address specific demands
and truckload types Additionally the softwarersquos provisions for user customized routes
allow routes to be created with learned characteristics of roads that may not be accounted
for in the database This attribute is likely valuable where local drivers or dispatchers
know key roads or particular times of the day or year to avoid and dispatchers can also
adjust for updated information on road closures This is not done automatically in the
software but it is easily adjusted with a knowledgeable dispatcher
SOFTWARE NAME RAND-MCNALLY (MILEMAKERregINTELLIROUTEreg)
Cost Alternatives
IntelliRoutereg
1-user standalone 1st year initial license fee $1995 Annual license renewal fee (every year thereafter) $599
5-user LAN 1st year initial license fee $3495 Annual license renewal fee $1049
8
Industry Use
MileMakerreg by Rand-McNally is routing and mileage software that features both
household goods (HHG) and practical routing solutions Rand-McNally claims over 91
percent of the Fortune 500 shippers and 94 percent of the leading freight carriers as
clients
Primary Features
MileMakerreg provides truck- and trailer-specific routing options that optimize multiple
stop routes in accordance with user selected preferences and avoidance inputs Data are
updated to customers quarterly and with the IntelliRoutereg software users are updated on
construction activity every two weeks In addition to creating industry standard (HHG)
and practical routing options for the shortest or fastest routes MileMakerreg also produces
stateprovince mileage summaries and produces hub routing calculations to analyze
shipping lanes from one point to many destinations
The software also enables users to avoid out-of-route miles by accurately
accounting for truck specifications and HazMat restrictions It promotes the avoidance of
tickets and accidents by ensuring road and bridge accommodation and claims to be four
times more accurate than PCMiler
Like the other leading software Rand-McNally also optimizes routes on the basis
of daily fuel prices and produces a fuel itinerary that details where trucks should stop
along the route and how much fuel they should get Additionally the software produces
state mileage tax breakdowns
Unique Attributes
A lane rate add-on allows accurate analysis of market rates so users can competitively
quote rates The add-on works with a compilation of data from carriers in the major
market cities in the US and Canada and estimates rates on the basis of current freight
bills Reports are available for vans refrigerated carriers and flatbed carriers and include
minimum a nd maximum rates per mile as well as fuel surcharges per m ile
9
Limitations
This software does not have the intermodal capabilities that are available in PCMiler
Additionally its toll management is somewhat cumbersome and not clear (See the
detailed product test for more information)
Intelliroute Usability
In a fashion similar to PCMiler a sample of Rand McNallyrsquos IntelliRoute software was
hreviewed T e details below highlight the findings from that review along with notable
components from the Userrsquos Manual as the trial software was limited to 50 transactions
and therefore only a fraction of the product could be tested For the route generation
actually tested IntelliRoute produced results similar to those of the PCMiler software
Generating Routes and Mileage
IntelliRoute frames its route and mileage generation as inquiries Inquiries are in the
form of mileage inquiries route inquiries and a batch processing routine Mileage
inquiries have several basic forms and when they are performed in the route inquiry
application they also produce detailed routing information on a state by state basis
HHG MileageRoute
Mileage determined on the basis of the shortest distance between locations on truck-
usable roads is based on Release 19 of the Household Goods Mileage Guide (HHG) and
HHG tariffs rules rules include highways bridges and ferries designated as ldquotruckshy
authorizedrdquo These miles are used in standard freight weighting and auditing
Practical MileageRoute
This software uses the same road network as that of the HHG option however it does
not account for HHG tariff rules
Quickest MileageRoute
This function makes use of IntelliRoutersquos GPS-accurate road network and c alculates the
truck-usable mileage on the basis of shortest time between locations
10
Lowest-Cost Route
This function uses the same GPS-accurate road network as above but in this scenario it
calculates the route on the basis of lowest-cost between locations Lowest cost is based
on a combination of time fuel cost per milekilom eter fuel cost per gallon tolls and
maintenance costs These have default settings that can be adjusted for specific trucks
Route Creation Highlights
The input of locations for route generation in IntelliRoute is at least as user friendly as
that of PCMiler and offers a range of suitable entry styles Once all locations have been
entered the user can manually order the origin stops and final destination
Alternatively users can optimize the location list entirely or designate only a specified
destination point The variable that is optimized depends on the type of routing option
selected
Once a route has been created using one of the above types the program create s
an itinerary The itinerary has a user friendly color coded breakdown of points For
example orange text in the itinerary denotes roadwork information This ability is
enabled when the user has access to online RoadWorkTM updates Users can have several
options in dealing with roadwork delays Either they can apply roadwork to all quickest
and lowest-cost routes or they can choose to route around construction and delays
Additional color coding highlights include truck-type violations along an itinerary These
violations for 53-ft102-in double- and triple-trailer options are highlighted in red bo th in
tabular format and in the map giving clear indication of potential conflicts alon g the
selected route These conflicts appear as a result of using the IntelliRoute Streets feature
which gives street-level directions but without truck-type attributes
In addition to the basic routes described above the interface allows point and
click selection of truck and trailer types These types include trailer length (lt48 ft or 53
ft) truck width (lt96 in or 102 in) and number of trailers (single double or triple) The
basic route types are then applied to truck-specific guidelines Additional constraints can
be easily selected to account for hazardous materials Federal regulations regarding
hazardous material transport are coded into road attributes so that allowable roads can be
11
hierarchically utilized IntelliRoute thus recalculates the routes using the basic route
types along with the added HazMat restrictions
IntelliRoutersquos accounting for toll roads is somewhat unclear The software allows
users to select a ldquotoll road biasrdquo level This level varies from 0 (toll roads used) to 100
(toll roads not used) The clarity issue is no information is available to explain how the
varying levels of bias influence the decision to use or not use a given stretch of toll road
The end points (0 100) are clear but the difference between a ldquo40rdquo and ldquo60rdquo are not
There is no information on how many added miles and hours of driving are acceptable a t
a given bias level
Driver breaks and stops are potentially significant components in dete rmining
travel time and costs and these are easily added into the estimated arrival time
calculations These can be broken down by break type (food or fuel) with predetermine d
frequency and duration Fuel breaks can be either manually input or optimized through
the ldquofuel networkrdquo options Users can input the locations of the participants in their fuel
networks These can subsequently be included as locations for determining appropriat e
routes Alternatively users can search along the routes for truck stops with the desir ed
amenities Amenities include parking pumps service repair electrical wash driver
services and food Similar to PCMiler IntelliRoute is compatible with
wwwfueladvicecom to allow for optimizing fuel purchases
Once routes have been created the user can manipulate the results from the
generated maps page These manipulation options include designating segments as
preferred or to be avoided in order to optimize local knowledge of road issues and
company preferences With the Street-Level add-on component users can input specific
addresses for origin and destination points and receive turn by turn directions at these
locations The program generates street maps for both endpoints
This software has a slightly more user friendly interface than PCMiler however
PCMilerrsquos truck trailer and route specifications are much clearer In particular
Intelliroutersquos toll adjustments are cumbersome and despite the programrsquos ability to
highlight conflicting street segments it is unclear how the user can remedy a potentia l
conflict or the degree to which the program offers suggestions to avoid one Both
programs make use of a connection to wwwfueladvicecom and are thus comparable on
12
fuel optimization To IntelliRoutersquos credit there Roadwork add-on and the output it
generates to alert users of roadwork delays appears to be quite helpful
SOFTWARE NAME PROPHESYreg TRANSPORTATION SOFTWARE INC
Cost Alternatives2
Commercial Mileage and Routing with Map Multi-User $49500 Single-User $39500
Fuel Tax Reporting Software ndash Tax Tally Multi-User $49500 Single-User $39500
Driver Log Auditing Software - LogPlus Multi-User $49500 Single-User $39500
Freight Billing ndash FreightBill Express 1 Truck $99500 2-5 Trucks $119500 6-10 Trucks $139500
Driver Management Software ndash DriverTrax Multi-User $49500 Single-User $39500
Total Compliance Suite ndash ProphesyONE Multi-User $109500 Single-User $89500
Industry Use
Prophesyreg touts itself as the industryrsquos leading trucking software solution for truckload
carriers LTL carriers brokers and private fleets (over 12000 company clients) It offers
planning and compliance software that includes freight billing mileage and routing fuel
tax reporting driver log auditing fleet maintenance driver management fuel purchase
optimization and online mileage
2 All cost information is as of June 2010
13
Primary Features
Routing software enables the creation of Class 8 driving directions with multiple stops
and calculates industry standard and practical miles of the routes Route generation
considers height restrictions low weight bridges and overpasses seasonal road closures
and avoidance of toll roads Prophesy EasyStreetreg provides real-time dock-to-dock
directions for commercial vehicles with additional consideration for one-way streets
right hand turn restrictions and dangerous intersections It favors low-traffic lanes larger
roads and left hand turns and is continually updated to account for temporary r oadshy
closures due to weather construction or traffic accidents FuelLogicreg utilizes current fuel
price information along with the incorporation of fuel cards and fuel networks negotiated
by the company to identify the most efficient fueling locations along the route
FuelLogicreg possesses current fuel price informati on on every truck stop in North
America
Unique Attributes
Prophesyreg allows the instant matching of ava ilable drivers and provides options to
maximize b ack-haul opportunities It is one of the few programs that is readily a vailable
for both Truckload and LTL carriers
Limitation s
Prophesyreg does not have the capability to incorpo rate hazardous material considerations
It indirectly accounts for truck height by allowing the user t o select the minimu m height
needed for overpasses although other truck characteristics are not accounted for
Prophesyrsquosreg accounting for tolls is not very clear The program allows users to scale
their aversion to using tolls but it does not appear to be a systematic means by which
users can compare the costs of using a toll road versus taking an alternative route
14
SOFTWARE NAME PROMILES
Cost Alternatives
ProMiles Mileage and Routing Guide
Single User License Add-Ons Fuel Management (Pro) Fuel Management (Lite) Fuel Tax (Single Fleet) Updates HazMat Routing
$89500
$39500 $5000 $9500 $6000qtr Starts at $39500
TruckMiles
Single User License RapidLog Interface GPS Interface
$24900 $29500 $9900
Industry Use
ProMiles Software Development Corporation (PSDC) has won a wide following of
dedicated clients such as OOIDA Fleet One Hewlett Packard Petro Chemical
Oregon DOT Unocal New World Van Lines Barnes Trucking Inc and over 150 s tate
DOT auditors Washington along with 30 other states is listed as a state that has
ProMiles software solutions for IFTAM ile Tax and IRP auditing andor for port of
entryDOT purposes
Primary Features
Promiles offers a multitude of program options to cover an array of freight routing needs
The TruckMiles program provides turn by turn routing at the street level with 53-ft trailer
options that allow users to select routes with up to five stops These routes may be bas ed
on practical truck routing shortest truck routing and reduction in toll road usage
Additionally TruckMiles computes rates by empty or loaded miles produces a pro fit
rate and tracks driver expenses
Additional functionality is available with the Kingpin software which in
conjunction with the TruckMiles program function allows more detailed assignment of
vehicle types (12 options) and an increased number of stops along the route Vehicle
15
type options vary from two-axle delivery trucks to seven-axle double-trailer
configurations so that vehicle-specific routing can be generated ProMiles has data on
specific vehicle regulations and restrictions from federal state and local jurisdictions In
addition to truck type the user also inputs trailer length kingpin settings trailer axle
specifications height width and whether the cargo is hazardous material
ProMiles fuel management software allows the visualization of fuel prices from
the Oil Price Information Service (OP IS) across the region and along the selected routes
Like Prophesy ProMiles accounts for the input of co mpany n egotiated fuel prices at
specific truck stops The management software allows for filteri ng by chain route lane
and state
Unique Attributes
The ProMiles Kingpin software appears to have the greatest degree of flexibility in
selecting tr uck-specific opt ions such as number of ax les and trailer configurations
Limitations
A review of the ProMiles website did not suggest that the services offer real-time
indications of congestion and lane closures Additionally there is no ability to com pare
truck versus rail or other modes of transport
SOFTWARE NAME CHEETAH
Cost Alternatives
At the time of this review we were unable to get a price estimate on the Cheetah
Delivery and Freight software packages The pricing scheme is highly variable
depending on customer-specific needs and the various add-ons required
Industry Use
Cheetah software provides delivery dispatch services and drivers with real-time opt ions
to increase the efficiency of route planning drivers and customer service personnel
16
Primary Features
Cheetah provides two product packages Cheetah Deliverytrade and Cheetah Freighttrade
The Cheetah Delivery system allows dispatchers to see supply chains in real time
including estimated arrival times that are dynamically based on driver activity
cancellations and reschedules through GPS-enabled tracking The Cheetah Freight
system provides dispatch and routing software designed for business to business freight
companies with real-time routing delivery and dispatch information for LTL dispatch ers
drivers customer service shippers and customers
Unique Attributes
Cheetahrsquos uniqueness lies within its real-time fleet tracking and LTL sequencing
Cheetah operates within a Software-as-a-Service infrastructure that is the program is
hosted on Cheetahrsquos servers as opposed to many other programs that are delivered on
disk and receive updates at regular intervals
Limitations
A review of the companyrsquos website reveals that Cheetah focuses more on the dispatch of
delivery fleets than on freight traffic As such it does not highlight usersrsquo ability to input
truck and trailer specifics such as height and weight or load types such as HazMat
Additionally Cheetahrsquos site does not address user specifications for fuel management and
purchasing as do other freight systems These specificities are not highlighted on the
Web pages as the majority of its customers are LTL carriers and do not typically require
them However the program is flexible enough that the background routing data can be
integrated with software such as PCMiler and provide the same capabilities as th at
software does
SOFTWARE NAME TSI AUTOMATION
Cost Alternatives Webroute - $5500 per asset per month
17
Industry Use
TSI Automationrsquos Visual Control Room (VCR) program provides software aimed at
companies seeking efficiency gains through logistics optimization and management
automation for scheduling routing and dispatching workers or vehicles to work sites or
customer locations
Primary Features
TSI has two products for different sized companies The WebRoute product is Web-
based routing scheduling and dispatch software This system is designed to handle the
scheduling of up to 30 vehicles from a given site and has GPS capabilities to track truck
progress Route optimization is conducted on the basis of an algorithm that seeks t o
minimize total travel time and distance while matching appropriate trucks and delivery
time windows
TSIrsquos VCR expands the capabilities of WebRoute and can handle operations for
larger companies VCR matches a companyrsquos resources and vehicles to assigned
deliveries in order to g enerate the most appropriate delivery schedule and routing to
minimize drive time and distance Driver characteristics including breaks and lunches
are configured into the scheduling and routing outputs
Unique Attributes
The GPS tracking allows for improved customer support by increasing usersrsquo ability to
know where various shipments are located and receive more accurate times of arrival
Limitations
The primary limitation is that TSI relies on MapQuest for its routing decisions and
therefore does not consider many of the special limitations observed in the freighting
industry TSI is designed more for delivery truc ks than for Interstate freight traffic
18
SOFTWARE NAME APPIAN LOGISTICS (FORMERLY MICROANALYTICS)
Cost Alternatives
At the time of this review a price estimate on the Appian Logistics routing software
packages was unavailable The pricing scheme is highly variable depending on customer
needs and the various add-ons required
Industry Use
In January of 2010 Appian Logistics Software purchased TruckStops from
MicroAnalytics for North American Customers Appian touts itself as an industry leader
in providing solutions for transportation companies and is recognized as one of the top
100 logistics and supply chain software providers Appianrsquos clientele ranges from third
party logistics providers to the food service industry to home delivery
Primary Features
Appianrsquos Direct Route software automates client routing and scheduling by using
specified data and businesswork rules to establish software parameters from which
routes and features may be developed These businesswork rules are primarily client
details around which the shipments should be scheduled These may include items such
as including maximum work time latest return time and earliest and latest delivery
dates It combines thes e rules with truck-specific requirements such as capacity and
freight type (eg refrigerated) and then matches them with the data provided on origin
and destination and the volume of cargo to be shipped
Through Appianrsquos DRTrack software users are able to access information
regarding planned versus actual hours miles and times along with real-time route
progress tracking Additional attributes of this software include driver performance
reports truck speed mapping geographic volume reports and internal route delay al erts
These features are provided in real-time
In the Territory Pro module Appian provides a constraint-based creation of
geographic territories Territory Pro enables the adjustment and design of sales service
and delivery territories on the basis of volume service time andor coverage area thus
balancing the time and volume between territories The optimization processes seek to
19
minimize mileage while maximizing volume The software can additionally assign route
days within a territory By combining Territory Pro with Resource Pro users can further
develop efficient territories and routes by determining the optimal number of drivers and
power units needed to operate under a given set of constraints
Finally Appian offers a Continuous Move Planner package that generates optimal
truckload matches for given sets of origin-destination pairs The software seeks to
minimize time and mileage while maximizing capacity utilization Distance and time
calculations are defined by the systemrsquos proprietary engine and can utilize PCMiler or
MapPoint
Unique Attributes
Appian can be integrated with PCMiler Prophesy and other route generation software
and thus can be formatted to perform any of the operations that those soft ware programs
perform Table 21 is filled in as if the program were integrated with PCMiler though
actual capabilities are dependent upon user needs and the integration actually selected
Limitations
Limitations are dependent upon which program Appian is integrated with though its
varied connectivity allows for a broader range of applications than a stand-alone product
SOFTWARE NAME TRUCK DISPATCHING INNOVATIONS (TDI)
Cost Alternatives
TDI is a reseller of ArcLogistics From ESRI website t he cost of this program is as
follows
Up to 5 Vehicles $100000yr Up to 10 Vehicles $200000yr Up to 20 Vehicles $350000yr Up to 50 Vehicles $450000yr
Industry Use
As a reseller of ESRIrsquos ArcLogistics Route software package TDI provides tailored
packaging aimed at a target market of local delivery operations with private fleets of 5 to
50 vehicles
20
Primary Features
TDI provides small delivery companies with desktop routing and scheduling operability
The software optimizes route sequencing and allows large volume simulating for
economic evaluation Routes and sequences are developed on the basis of customer time
demand s and actual network drive times while vehicle and driver characteristics such as
volume and weight capacity and labor constraints are considered
Unique Attributes
TDI and ArcLogistics have easy to run simulations that can aid in forecasting vehicle and
driver needs and thus help balance workloads and prevent overtime and underfilled
loads
Limitations
TDI is limited to the capabilities of ArcLogistics This software does not provide the
large-scale capabilities of the freight transportation packages like PCMiler or Rand
McNally but it meets the needs of its intended market local delivery operations
SUMMARY OF ROUTING SOFTWARE REVIEW
This freight routing software review concentrated on the commercially available software
packages that are most often used in the freight and trucking industry This review
included eight software packages (see Table 21) two of which (PCMiler and Rand
McNally)received an extended analysis through the use of trial software to perform
common routing tasks The review of the remaining six software packages was based
upon publicly available information and promotional materials from the companiesrsquo
websites
It is evident from Table 21 each software pa ckage offers different types of
attribut e r most of the reviewed packages offer similar core es and options How ve
routing attributes and capabilities The software package that was found to offer the most
flexibility and routing modificationoptions was Cheetah Unfortunately the cost of this
software (like Appian) is based on each prospective user and its unique needs and is
therefore not publicly advertised This makes Cheetah somewhat difficult to compare
21
with other software packages most of which have an advertised single- or multiple-user
price but also state that the actual software price is customer-specific
Table 21 Summary of Reviewed Software Routing Attributes
Attributes Prophesy romilesP PCMiler Cheetah Global
Tranz TSI TDI Appian Logistics
Freight Ware
Rand McNally
Practical Routing This is a shipper
this is a 3rd party add-on to either
PCMilerProMiles or Milemaker
Shortest Path
National Network Routing
Toll-Discouraged Routing
Haz Mat Routing
53rsquo102rdquo Trailer Routing LTL Load Optimization Driver Optimization Fuel Cost Minimization Carbon Emission Calc Integration with Other Software (Accounts Receivable pa ledger payroll
y
taxes etc) Real-Time HighwayStreet Routing (seasonal road closures congestion road construction)
Inter-Modal Connectivity Truck vs Rail Mileage Comparison Commercial Mileage Summaries by State
Nevertheless for all dimensions considered Cheetah offers the most features
followed by Appian Logistics which does not allow real-time routing changes
necessitated by unforeseen trip-specific factors (accidentsroad closures highway
restrictions etc) PCMiler reported as the routing software used by 96 percent of the
freight industry was found to be comparable to Appian Logistics in its software
capabilities but it also does not allow real-time routing changes The Rand McNally
freight routing software does include a feature (as does Cheetah TSI and Prophesy) that
will allow each user to make route-specific real-time changes on the basis of information
received during while a truck is en route However in other dimensions the Rand
McNally software offers fewer overall capabilities than the PCMiler software such as not
22
providing truck versus rail mileage comparisons for closest rail loadingunloading
facilities identification of intermodal connectors (truckrail) and the ability to schedule
routes around driver hours of service limitations Only three of the freight routing
software packages include a feature that calculates the carbon emissions for alternative
routes PCMiler Cheetah and Appian Logistics Five of the software packages allow
routing that considers trailer width and length restrictions on streetshighways ProMiles
PCMiler Cheetah Appian Logistics and Rand McNally All packages except of
TSI and l z rial routing and all pack f TSIProphesy TDI a low ha ardous mate ages except o
and TDI incl de a featureu to select routes on the basis of minimizing re-fueling costs
All of the reviewed software packages w ill interface with othe r management software
such as inven ory contro ts receivabt l accoun le billinginvoicing payroll and tax
calculation packages
It is also i t all fremportan to remember that not ight routing software packages are
designed developed and marketed to fu ill identical services in the f lf re ight transport and
delivery market and one must consider the target market for each software package For
example a review of Table 21 may lead one to believe that TSI and TDI are lacking in
features and capa ilities in comp arison to the other freight routing software packagesb
However it is clear from the individual review of each that these two software packages
were designed and developed for local delivery and urban parcelproduct routing As a
result many of the capabilities and attributes developed for long distance trucking such
as toll road avoid nce fu el refill cost mi nia mization hazardous material routing and
driver hours of service limits are not relevant for the market served by this software
23
3 EVALUATION OF USE OF GPS ROUTE DATA FOR EVALUATING ROUTE CHOICE
INTRODUCTION
This research investigated the feasibility of using GPS truck data to inform truck
modeling logic Two case studies were considered For each case study the evaluation
included the proportions of vehicles using particular routes and the distribution of truck
travel times and speeds along each route by traffic direction and time of day The results
indicated that there is a strong relationship between route attributes and truck route
choice However other factors not described by the GPS data were also found to affect
route choice Whats more we found that given the current GPS data frequency and trav el
speed if several alternative routes between the O-D pair are available the truck route
selected can be observed only if the distance of this route is longer than the distanc e
between two consecutive GPS read points Finally with the algorithm used to identify
truck stops (defined as gt3 minutes) the relationship between stopping patterns and route
choice cannot be observed
THE GPS DATA
The GPS truck data used for this analysis were collected between October 2008 and
August 2009 Approximately 2500 trucks were represented in the Puget Sound takes 3
to 5 percent of the entire truck population in this region Millions of GPS spots were
received each month Figure 31 presents one months worth of GPS data The raw truck
GPS data received from the GPS vendor were continuous spot data and therefore we first
employed the trip end identification algorithm developed by Ma and McCormack (2010)
for identifying truck trip origins and destinations Next we geo-coded the GPS data with
a traffic analysis data (TAZ) layer by using ArcGIS to identify the corresponding TAZ in
which the GPS reads were located In this way the truck performance along each route
could be retrieved from the GPS data and analyzed by querying the zone to zone trips In
addition the GPS spot speeds had been demonstrated to be sufficiently accurate in
comparison to the speed provided by dual loop detectors (Zhao et al 2011)
24
Figure 31 Monthly GPS Data and TAZ Layer The map shows the GPS readings for the month of November 2008
Two case studies were in the basis for evaluating the feasibility of using GPS
truck data to identify truck routes in the Puget Sound area and inform the relationship
between route attrib utes and route choices For each case study the following analyses
were performed
bull Average travel distance travel time and speed between the origin and destination
for each traffic direction and time period
bull The proportion of trucks in the sample using particular routes and corresponding
route attributes (travel distance time speed and variability) between the origin
and destination for each traffic direction and time period
CASE STUDIES
Case studies were selected according to following criteria
bull The truck routes had to be major freeway andor arterial roads where vehicles
encounter traffic congestion during peak-hour periods (to observe the impact of
traffic congestion on route choice)
bull There had to be a statistically sufficient sample size between the origin and
destination (a function of the current read rate)
25
bull There had to be several alternative routes connecting the origin and destination (in
order for us to observe route choice)
bull Given that currently the vehicle location is recorded and reported every 15
minutes the travel distance between the O-D pairs had to be long enough that
different route choices could be observed
Case Study I TAZ 385ndashTAZ 545
Truck trips between TAZ 385 and TAZ 545 were selected as Case Study I
Approximately1538 trips were identified based on data collected over 11 months Two
alternative routes I-5 and I-405 were identified and are presented in Figure 32
Figure 32 Case Study I Truck Trips between TAZ 385 and TAZ 545
26
Both routes are essential freight corridors in the central Puget Sound area and
experience high daily truck volumes The average travel distance between the two zones
was 4364 miles and the average travel time was 5524 minutes with a speed of 48 03
mph as shown in Table 31
Table 31 Attributes of Trips between Zone 385 and Zone 545
As shown in Figure 32 the GPS truck data identified the two truck routes
successfully Both I-5 and I-405 are Interstate highways and the difference in the travel
distance between the two routes was less than 1 mile However among 1538 trips only
164 trips (11 percent) used I-405 while 1374 trips (89 percent) chose I-5 Table 32
presents the route characteristics Although the average travel distance for both routes
was similar the average truck travel time on I-5 was 5 minutes less and the
corresponding travel speed on I-5 was 3 mph higher This preliminary analysis showed
that traffic performance using I-5 was better than performance on I-405 and nearly 90
percent of truck drivers chose I-5 to drive a shorter distance faster and arrive at a
destination earlier
Table 32 Truck Performance along I-5 and I-405
To better understand the truck route attributes and factors that affect freight route
choices we further analyzed the trip attributes on each route by traffic direction and time
of day
27
Southbound Analysis
Southbound freight performance on both routes is presented in Table 33 and plotted in
Figure 33 and Figure 34 There were 769 southbound trips in total Similar route choices
were observed by analyzing the southbound traffic Only 75 trips (10 percent) used I-405
while most trucks chose I-5 T he average travel time along I-5 was 5458 minutes which
was 6 minutes faster than travel time on I-405 As illust rated in both figures 33 and 34
the variability of travel speed on I-405 was much higher than the speed deviation on I-5
indicating that the travel time on I-5 was more reliable Similar results for travel speed
profiles were observed Travel speed along I-5 was 48 mph which was 35 mph higher
than traffic speed along I-405 I-5 traffic had a smaller travel speed standard deviation
than I-405 as shown in Table 33 and Figure 34 indicating that the speed along I-5 was
more stable Hence the GPS data analysis indicated that the freight performance on I-5
was better in terms of travel speed travel time and travel time reliability The anal ysis
results showed that for southbound traffic there was strong relationship between route
choice and transportation-related route attributes
Table 33 Southbound Travel Time Distributions along I-5 and I-405
Figure 33 Southbound Travel Time Distributions along I-5 and I-405
28
Figure 34 Southbound Travel Speed Distributions along I-5 and I-405
The traffic conditions were further studied by five time periods separately (Table
34)
Table 34 Time of Day Breakdown
Figure 35 plots the number of trips southbound on both routes and the
corresponding travel times by time of day For both routes the analysis found that the
travel times during Night and After Peak time periods were cl ose to free flow travel time
(the free flow speed was defined as 50 mph) Travel time delays on both routes were
observed during the other three periods Trucks experienced more severe delay during the
AM Peak and PM Peak periods for both routes The number of trips on both routes was
strongly related with the traffic condition 647 trips (84 percent) occurred during the
Night and After PM periods when there was no travel delay whereas only 28 trips (36
percent) occurred during the PM peak when significant delays were observed
29
Figure 35 Southbound Truck Proportions and Travel Time Using I-5 and I-405 by Time of Day3
Generally southbound transportation performance on I-5 was better than the
performance on I-405 The travel times on I-5 during the Night and After PM periods
were close to free flow travel time and were 6 minutes and 3 mi nutes less than on I-405
respectively Therefore there were 175 trips on I-5 during the Night period but only
seven trips on I-405 and 424 trips on I-5 during the After PM period but only 41 trips on
I-405 The worst travel time delay was observed on I-405 during the PM Peak which
experienced 22 minutes of delay for a 53-minute trip without traffic congestion and there
were only six trips during that time period on I-405 over 11 months No trip occurred
during the AM Peak on I-405 over the 11-month observation period We also noted that
the travel time on I-405 during the Midday was about 15 minutes less than the travel
time along I-5 However the corresponding number of trips on I-405 was still less than
the number of trips on I-5 This result was reasonable because the difference was not
significant and drivers may not have perceived it Meanwhile it also indicated that other
factors that cannot be described by the GPS data may influence route choices as well
3 GPS data represent between 3 and 5 of the total truck population in the Puget Sound region
30
Northbound Analysis
Table 35 illustrates the northbound trip information along I-5 and I-405 The comparison
between the two routes showed that for northbound traffic the transportation
performance on I-5 was better than on I-405 The travel time and speed differences
between the two routesmdashabout 4 minutes and 3 mph respectivelymdashwere quite similar to
those for the southbound traffic Again drivers mostly chose I-5 along which they could
travel at higher speed and arrive at their destinations earlier Figures 36 and 37 show the
distributions of the travel time and speed along each route
By comparing tables 33 and 35 we also found that the trip performances for
southbound and northbound I-5 were similar and those for southbound and northbound Ishy
405 were also similar
Table 35 Northbound Truck Performance along I-5 and I-405
Figure 36 Northbound Travel Time Distributions along I-5 and I-405
31
Figure 37 Northbound Travel Speed Distributions along I-5 and I-405
The northbound time-of-day analysis indicated that travel times on both routes
during the Night and After PM periods were equal to free-flow travel time and about 73
percent of total truck trips occurred during these time periods (Figure 38) Trucks
encountered recurrent delay during the other three time periods The most severe
congestion was experienced by vehicles on I-405 during the AM Peak when the travel
time was almost 20 minutes longer than free flow The travel time delay dipped slightly
during the Midday period for both routes Another considerable delay was observed
during the PM Peak along I-405 The most significant travel time difference between the
two routes about 8 minutes occurred during the PM Peak period and the number of trips
on I-5 was significantly higher than on I-405 Most truck trips were observed along the
route with better performance (less travel time) except during the Midday period The
time difference between each route during the Midday period was quite small however
more trucks still chose I-5 A large percentage of trucks travelling outside of the peak
travel periods
32
Figure 38 Northbound Truck Proportions and Travel Time Using I-5 and I-405 by Time of Day
Case Study II TAZ 180ndashTAZ 609
Truck Trips between TAZ 180 and TAZ 609 shown in Figure 39 were selected for the
second case study There were two alternative routes I-90 and SR 520 Both routes are
major roadways crossing Lake Washington and are connectors between I-5 and I-405 On
the basis of the GPS data collected over 11 months 533 trips were identified The trip
attributes are presented in Table 36 The average travel distance was 2759 miles It took
4013 minutes on average to arrive at the destinations by traveling at 4228 mph
33
Figure 39 Case Study IImdashTruck Trips between TAZ 180 and TAZ 609
Table 36 Attributes of Trips between TAZ 180 and TAZ 609
Among all 533 trips 365 trips (685 percent) used I-90 while 168 trips (315
percent) chose SR 520 The traffic performance on each route is presented in Table 37
The comparison shows that the average travel distance travel time speed and reliability
of both routes were quite similar However the number of trips along I-90 was more than
34
twice that along SR 520 To explore this issue we conducted further analysis by traffic
direction and time-of-day
Table 37 Truck Performance along I-90 and SR 520
Eastbound Analysis
The analysis of eastbound traffic along I-90 and SR 520 is summarized in Table 38 233
trips (71 percent) traveled along I-90 The travel time difference was quite small less
than 1 minute The trip travel time and speed on I-90 were slightly more reliable
according to the time and speed standard deviations Overall there were no significant
differences between the two routes and results were insufficient to conclude that truck
route choices were based solely on the route attributes derived from the GPS data
Table 38 Eastbound Truck Performance along I-90 and SR 520
A comparison of the numbers of trips and travel times over the two routes during
different time periods is plotted in 310 For both routes the travel times during the
Night Midday and After PM periods were close to free flow travel time and 69 percent
of trips occurred during these three time periods Travel time differences between the two
routes were observed during all five periods and the differences increased during the AM
Peak period to about 5 minutes The travel time along SR 520 was longer than that on Ishy
35
90 and the number of trucks choosing I-90 during all time periods was higher than the
number of trucks using SR 520
Figure 310 Eastbound Truck Proportions and Travel Time Using I-90 and SR 520 by Time of Day
Westbound Analysis
The westbound vehicle proportions and trip information for each route are presented in
Table 39 Almost 70 percent of vehicles chose I-90 while the traffic conditions on both
routes were fairly similar According to Figure 311 no trucks tr aveled along SR 520
during the AM and PM Peak periods and therefore the traffic conditions on SR 520
during those two periods were unknown For eastbound traffic since performance along
I-90 was always better 69 percent of traffic occurred on I-90 Similar conditions were
observed for westbound traffic during the After PM period However during the Night
period the travel time along SR 520 was less and trucks switched from I-90 to SR 520
apparently to reduce travel time The travel time during the Midday periods for the two
routes were the same and the route attributes failed to explain why there were more trips
along I-90
36
Table 39 Westbound Truck Performance along I-90 and SR 520
Figure 311 Truck Proportions and Travel Time Using I-90 and SR 520 by Time of Day
SAMPLE SIZE
Sample size is one of the most critical factors in ensuring a statistically reliable analysis
Extensive literature is available on determining the appropriate sample size for estimating
transportation network performance We employed the methods developed by Li et al
(2002) to identify the GPS data sample size for a statistically significant measure of
truck performance
where a = confidence interval
= Z value for a given confidence level
37
S = sample standard deviation
= user defined allowable error in estimating the population mean
= sample mean
Although the appropriate sample size is critical it was not a major concern in this
research given the millions of GPS points that are received monthly from the GPS
vendor Here we present an example to verify whether the sample sizes of the I-5 and Ishy
405 trips in Case Study I were statistically reliable For trucks traveling along I-5 the
sample travel time mean was 5456 minutes and standard deviation was 723 as shown in
Table 32 For a confidence interval of 95 percent and a mean estimating error of 273
minutes the minimum sample size required would be 27 As the sample size of our Case
Study I was 1374 clearly greater than the minimum sample size the dataset was
considered reliable for estimating the travel time on I-5 within a 5 percent error for a
confidence level of 95 percent Similarly the minimum sample size to ensure a maximum
5 percent error for travel time estimates for I-405 was 26 and the current observation was
deemed statistically reliable
FEASIBILITY OF USING GPS TRUCK DATA TO IDENTIFY TRUCK ROUTES
The GPS truck data were capable of identifying the truck routes in Case Studies I and II
However note that the travel distance for both cases was longer than 20 miles Given the
current GPS data frequency (we expect the frequency to increase over time) and truck
travel speed the feasibility of using GPS data to define truck routes is primarily
determined by the trip distance The distance between two GPS spots is calculated
according to Equation 32
S = F V (32)
where S = distance between two location reads (mile)
F = GPS data frequency (truck location reads were collected every 5 to 15
minutes)
V = truck speed (mph)
38
According to Equation 32 if there are several alternative routes connecting the
origin and destination then the distance between the route split point and the route merge
point should be longer than the distance between the two GPS points to ensure that at
least one GPS read is located on the selected route Otherwise it is possible that no GPS
data will be collected and the route choices cannot be identified Figure 312 illustrates
the relationship between distance of alternative routes and distance between GPS spots
Figure 312(a) shows a case in which the route distance is longer than the distance
between the two GPS reads and the selected route is guaranteed to be identified
successfully Figure 312 (b) and (c) illustrate a situation in which the routes are shorter
than the distance between the two GPS spots It is possible that there will be no GPS read
on the selected route and it cannot be identified as the route the truck took as shown in
Figure 312 (b)
Figure 312 Relationship between Truck Route Length and Distance between Two Successive GPS Reads
The GPS reads employed in this rese arch were collected every 5 to 15 minutes If
the average truck speed in Puget Sound area is 40 mph then the minimum distance
between the route split point and route merge point is expected to be 33 to 10 miles for
the route to be identifiable A higher data collecting frequency lower travel speed and
traffic congestion could all shorten the route dista nce threshold
39
The trip O-D identification algorithm employed in this research identified trip
destinations by stop duration An appropriate dwell time in Seattle area is 3 m inutes
(McCormack and Hallenbeck 2006) The 3-minute period has been demonstrated to be
the appropriate dwell threshold that can separate stops for traffic signals congestion
fueling and drivers break The GPS spots are regarded as stops only when the stop time
is greater than 3 minutes However for most delivery services 3 minutes is significantly
longer than the expected stopping time Thus with the algorithm we used stops of less
than 3 minutes did not appear as stops and we were not able to distinguish route choice
from the route a truck had to take to serve its customers
CONCLUSIONS
This research investigated the feasibility of using GPS truck data to identify truck rou te
choices by examining two case studies The case studies evaluated four major truck
corridors in the central Puget Sound The case studies were selected so that a) a route
choice decision would be available and b) the outcome of this route choice could be
observed in the data
In both case studies the truck route choices were identified and it is found that
the majority of truck trips were observed during off-peak time periods (700 PM to 600
the next day)
Correlation between route performance and truck route choices were identified
within the analyses Routes with less travel time higher travel speed and better r eliability
may have a higher probability of being selected according to the two case studies
However we did not observe similar selections between routes with close travel time
characteristics so we concluded that other factors not described by the GPS data were
also affecting route choice For example road geometry especially when trucks are fully
loaded Therefore we can conclude that the GPS truck data are capable of supporting
route choice analysis but GPS data alone are not sufficient to ascertain the determinants
of truck route choice
The GPS truck data could identify the alternative routes successfully in both case
studies However as mentioned these case studies were selected because they were
likely candidates There will be many origin-destination pairs between which the routes
cannot be identified given the current GPS data read rates Namely there must not be
40
route choice decisions between two successive GPS reads otherwise it is very likely tha t
the GPS data will fail to identify the route as illustrated in Figure 312(c) Given current
read rates this window can be as long as 20 miles which is insufficient in urban region s
the areas where route choice may be of most interest However more recently collected
GPS data read rates have improved from 15 to 2 to 5 minutes so we expect the ability to
observe route choice will be improved Another limitation of the truck route choice
identification analysis is that in the current trip O-D identification algorithm stops are
observed as stops only if the stopping time is longer than 3 minutes However wi th some
delivery services eg parcel delivery 3 minutes is longer than the expected stopping
time and therefore with the algorithm we used the stopping patterns of delivery services
will not be observed
41
4 ROUTING PRIORITIES
A goal of freight planning is to identify how goods move through the transportation
network and predict how freight flows will react to operational changes Current freight
flow models assume that shortest path algorithms are appropriate to apply to freight
travel Shortest path algorithms are commonly used in routing software such as Google
Maps this routing tool however is targeted at passenger travel In addition to different
travel constraints freight and passenger travel have two distinct purposes Freight travel
is induced by the need to move goods passenger travel is induced by the need for
personal mobility Therefore the use of passenger travel predictors in freight flow
modeling may be inappropriate
This chapter describes process used to identify factors that contribute to truck
freight route choice and the development of categories of companies based on how th ey
make their route choice s A survey was designed and distributed to Washington state
shippers carriers and receivers Survey respondents were asked to score and rank a
number of factors with regard to their influence on route choice Responses to the survey
questions were almost exclusively categorical (ie discrete) therefore the respondents
sensitivity to routing factors was treated as a latent variable and was analyzed by using
latent variable modeling and class analysis The analysis identified hours of service
limits availability of truck parking driver availability refueling locations and road
grade as the top five discriminating factors among the respondents Latent class analys is
determined that the type of equipment a company owns (eg auto freight units) was a
significant predictor of the category to which class a company belonged
MOTIVATION
The ability to fully understand and accurately characterize freight route choice is one that
will inform regional an d state decisions This ability applied to regional and state
commodity flow data forms the basis of an effective statewide freight modeling
framework Existing transportation network models are designed to describe passeng er
travel and therefore may offer a poor representation of freight travel Determining how
42
different subgroups of shippers carriers and receivers make route choices and
integrating these categorized decision characteristics can advance network models to
better represent observed freight route choice
LITERATURE REVIEW
How do carriers make routing decisions What are their priorities How do they differ across carrier type
A few studies have worked to identify the factors that determine routing choices
Regan and Garrido (2002) through a review of literature concluded in regard to mode
choice in routing that a) shippers value service and reliability more than cost and b) the
important factors in determining mode choice include timeliness availability suitability
firm contact restitution and cost Regan and Garrido also reviewed studies that focused
on shipper-carrier relationships
In the early 1980s mode choice was being investigated A study by Krapfel and
Mentzer (1982) looked at the factors that influence mode choice as well as the factors
that most strongly influence carrier choice The motivation for the study was the
deregulation of the trucking industry in 1980 by the US Motor Carrier Act because it
allowed carriers to make their own routing choices yet it had limited criteria for
evaluating prioritized routing decisions Krapfel and Mentzer determined that damaged
goods in transit shipment losses and service reliability were strong instigators of mode
shifts Factors that initiate a change of carriers within a mode were found to include
availability of common carrier service carrier availability and shipment losses
Boerkamps Binsbergen and Bovy (2000) looked beyond the factors that play
into routing in their description of the GoodTrip model which is a four-step modeling
approach to building supply chains used in The Netherlands The model starts with data
on consumer demand and then applies scenario assumptions to build the supply chains
that estimate goods flows In their report they considered the roles of various parties
involved in transporting a good from production through final consumption and took into
account the elements of routing behavior that each party controls For example in the
first transportation link from manufacturer to retailer the producer is responsible for
decisions regarding private vs for-hire grouping of goods mode vehicle size damages
43
and losses while the retailer has control over the type and volume of the goods being
delivered delivery frequency and reliability From this it is important to consider the
role companies play within a supply chain when assessing their routing behavior
Crainic and Roy (1988) developed a modeling algorithm that jointly consider s
economic efficiency and service quality Economic efficiency involves operations back
hauling considerations and delay impacts Service quality is measured by service
frequency to a specified location
Figliozzi (2006) while looking at how various technologies play into routing
decisions classified goods into four categories After developing simple models and
formulas and applying routing assumptions based on supply chains determined fro m
operations research and a management science literature review he ranked each go od as
high or low on scales of both time-se nsitivity and actual value This created four
categories in which a particular good could be classified Among these four groupings
were distinctly different attributes in terms of routing strategies typically used Figliozzi
also concluded that routes are usually determined by number of customers sequencing
time of service vehicle used distance and links traveled
A model by Hunt and Stefan (2007) in Calgary Canada builds trips in a growth
format that adds stops onto the trip as they fit Building of the trip takes into
consideration routine services vehicle type trip purpose establishment type forshy
hireprivate and land-use types
The SMILE model in The Netherlands developed by Tavasszy et al (1998) has
many variables that change on the basis of commodity including
storagehandlingtransportation costs value density packaging density perishability
delivery time shipment size demand frequency and access of network A survey
conducted on product characteristics identified the logistics families that are determined
by these variables
Vieira (1992) investigated the importance and value of service quality to shippers
when they make transportation decisions A survey was conducted of five commo dities
within the rail industry to determine freight rate transit time consistency of trave l time
lossdamage payment terms and ease of working with carriers
44
Across these studies and model developments researchers sought to find patterns
within the characteristics of the commodities being moved that determine the route
choice and flow of goods movement All of the studies used minimizing total cost and
distance as the criteria for routing decisions which is consistent with this studyrsquos
findings
STUDY METHODOLOGY
For freight models to predict freight flows there must be data to support the model
formulation Currently the key data sources regarding freight data include the
Commodity Flow Survey (CFS) and the Freight Analysis Framework (FAF3) which
combines CFS data with economic figures to give a more disaggregated breakdown of
commodity flows in tonnage and value Unfortunately neither of these sources provides
number of truck trips Other sour ces give data on employee counts and economic figures
which are used to estimate freight movements on a network None of the existing federal
data is detailed enough to determine routing patterns so this study developed a survey t o
gather more information from carriers shippers and receivers on their routing de cisions
Collection of Data via Survey
The objective of the survey was to allow inference about the strategic-level routin g
decision-making process of companies that ship receive carry forward andor broker
freight in Washington state The survey design was informed by a review of the literature
and current routing software tools The review found that most software programs le t the
user choose routing constraints but there is no predetermined hierarchy The rou ting
constraints embedded in the software were used in the survey to ensure representation of
the factors present across freight routing
The survey started with questions designed to filter out companies unable to
comment on routing decision making and to identify the correct company representative
The survey then asked routing priority and freight activity questions Additional
questions were then added to classify the companies on the basis of business
characteristics The survey design was reviewed and refined in collaboration with the
University of Washington (UW) Washington State University (WSU) and the Social
and Economic Sciences Research Center (SESRC) at WSU The Washington Department
45
of Transportation (WSDOT) and SESRC had recently completed two surveys
investigating the costs of closures of I-90 and I-5 That experience provided SESRC an
understanding of the freight industry that was beneficial to this effort The survey was
finalized after it was tested by freight experts and revisions were made on the basis of
the feedback The freight experts were private industry representatives identified by
WSDOTrsquos Freight Systems Director
After a confidentiality agreement was signed between SESRC and WSDOT
SESRC gained access to the database of the Washington Employment Security
Department (ESD) and identified shippers carriers and freight forwarders In addition to
the ESD list a list of companies that hold a commercial trucking license obtained from
the Washington Department of Licensing Truck Registration Database (UTC) was used
to create the survey sampling population The ESD list included those in the
transportation sector and those in freight-dependent industries identified by WSDOT
(transportation agribusiness construction manufacturing processed food retail
trucking warehousing wholesale timber and wood products) The UTC list contained
some duplication obvious duplications (same phone numbe r address etc) were
remove d from the sampling population To achieve a well balanced and representative
sample companies were drawn from both lists
The survey was conducted by SESRC between October 2010 and March 2 011
The initial population consisted o f 73481 shippers carriers and freight forwarders To
obtain 2500 initial cases 972 companies were randomly selected then proportionate
sampling to attain a minimum of 60 cases in the 10 industry sector s After the initial list
of 2500 had been exhausted we had not met our completion goal so more sample was
drawn from the Washington Department of Licensing Truck Registration Database
Respondents were initially contacted by phone letter or email They were given the
choice of completing a live phone survey or an online version Seventy-eight percent of
respondents completed the 20 minute survey over the phone Each completed interview
required an average of six calls
46
The Survey
The 40-question survey was designed to elicit the factors contributing to routing
decisions made by Washington state companies that ship receive carry forward andor
broker freight The survey was split into three modules Freight Activity Routing and
Business Classification
bull Freight Activity This section included questions to identify freight activity in
order to distinguish respondents as shippers receivers carriers or a combina tion
Other questions aimed to capture fleet composition distance of deliveri es type of
deliveries the use of outside carriers and breakdown of single stop and multip le
stop trips Responses to these questions altered the wording of questions
presented later in the other two modules
bull Routing This section included questions designed to help us understand how
routing decisions are made They determined who makes routing decisions at a
given company the use of routing software the flexibility of routes and who
makes the decision about route changes The central question in this section
asked respondents to indicate the influence of 15 factors on routing change
decisions Commodity considerations were explored in this section as well with
questions asking about primary secondary and tertiary commodities
Seasonality perishability and back-haul associated with freight were also
investigated
bull Business Classification This section included questions designed to characterize
companies on the basis of business characteristics Data on number of facilities
number of employees annual revenues and company location were gathered
The key routing question asked the respondents to classify the intensity of influence that
15 factors (listed below) have on their companys route choices (with the option to wr ite
in more factors) Intensity was scored by using the following grading responses (1) no
influence (2) slight influence (3) moderate influence and (4) high influence The
factors were posed in the same order to all respondents Respondents were then asked to
rank the level of influence of the factors that they rated 4 (high influence)
47
1 Minimizing travel distance
2 Minimizing travel time
3 Minimizing total cost
4 Planning multiple loads stops
5 Meeting customer requirements
6 Avoiding highway congestion
7 Avoiding highway tolls
8 Refueling locations
9 Availability of truck parking to wait for scheduled delivery or pickup
times
10 Road grade and curvature
11 Hazardous material considerations
12 Size or weight limits
13 Truck driver availability
14 Truck driver hours of service limits
15 Availability of support in case of problems
Survey Descriptive Statistics
The overall response rate from the surveying process was 414 SESRC compiled 860
surveys and delivered the data to the UW The figures that follow describe the sample of
companies who responded to the survey The number of observations represented in ea ch
figure is noted
Industry Breakdown
The goal of the sampling procedure was to obtain a sample population that represente d
the industry distribution of the companies that made up the entire ESD and UTC lists
The third question in the survey asked respondents which industry category best
describes their company Of the 849 companies that responded (which included shippers
carriers and freight forwarders) t he largest subset 33 percent was the ldquoTransportation
and Warehousingrdquo industry (see Figure 41) The next largest category was the
ldquoAgriculture Forestry and Fishingrdquo industry where 15 percent of companies classified
themselves
48
Figure 41 Industry Breakdown Respondents were asked what industry they classified themselves fro m a list of nine categories The number of companies from our sample in each industry is shown in the figu re
Company Activity and Outside Carriers
Figure 42 Company Activity and Outside Carriers
49
Figure 42 shows the breakdown of the delivery service activities present among the 846
companies in the sample that answered both what activity type they were (Question 04)
and whether or not they hire outside c arriers (Question 05) Of the companies surveyed
58 percent only shippedreceived goods or were freight forwarders so they did not carry
any goods The remaining 42 percent did carry goods alongside other activities including
shipping receiving and freight brokering
Within the 42 percent of companies that carry freight (as determined by Question
04 about activity type) 72 percent h ire outside carriers Along a similar trend of the 58
percent of companies who only ship andor receive freight 80 percent hire outside
carriers (see light blue bars in Figure 42)
Services Provided Breakdown
Figure 43 Service Types Provided Respondents answered ldquoyesrdquo or ldquonordquo to each service type and the percentages are given These categories are not mutually exclusive
Figure 43 shows the percentages of respondents that provided long-haul city delivery
regional and parcel trucking 830 companies responded to this question The respondents
answered each individually so any given company may have provided none all or any
combination of these services Of the companies that responded to these questions 25
50
percent provided both city delivery and regional trucking 20 percent provided long-haul
city delivery and regional trucking and 8 percent provided all four delivery types
Number of Vehicles
Carrying companies are those that responded as carrying at least some freight in Question
04 when asked whether they ship receive carry andor forward freight Figure 44 shows
the number of vehicles that carrying companies own (n= 358) 65 percent of carriers had
10 or fewer vehicles Of companies that only ship receive andor forward goods (do not
carry) 68 percent had no vehicles in their company 75 percent of companies do not use
any form of routing software (question Q16a) rather use ldquoexperiencerdquo and ldquocommon
senserdquo to make routing decisions
Figure 44 Number of Vehicles per Company for Carriers (n=358)
Truck Type Breakdown
Figure 45 shows the breakdown of truck type for companies that carry freight (n=393)
The different colors of blue represent the fact that the data came from two separate
questions Again the respondents replied to each of the categories individually and
therefore the vehicle types are not mutually exclusive When companies were asked what
ldquootherrdquo vehicle types they had in their fleet many mentioned dump trucks logging
trucks van and pick-up trucks
51
Figure 45 Vehicle Types in Carrier Fleets
Frequency of Changes in Routing Shipments
Question Q21 in the survey asked all companies ldquoHow often does routing of shipments
changerdquo and the acceptable responses were never yearly monthly weekly or daily Of
the 637 companies that were asked to respond almost all fell into either the ldquoalmost
neverrdquo or ldquodailyrdquo categories This indicates that companies were either very flexible or
were very rigid in their routing decision-making The food distribution and retail trades
had more fixed routes than other industries This could be because their types of delivery
occur on a frequent predictable and timely basis so fixed routing is the most convenient
Representatives of the transportation and warehousing industry reported an even
distribution between fixed and variable routes Respondents for the construction earth
products and manufacturing products industries reported more route variability Note
that routing choices donrsquot always exist It depends on where deliveries and pickups are
made For example with high customer density little route flexibility is available It is
also important to note that respondents may have interpreted this question as asking about
how often customers locations changed
52
Commodities
With respect to commodities 51 percent of companies surveyed had a primary
commodity that made up at least 90 percent of their total shipments Likewise 37
percent of companies surveyed transported only one commodity (Note some companies
considered General Trucking to be their primary commodity) 68 percent of
respondents said that they did not transport perishable freight and there was a 50-50 split
between respondents that reported seasonal freight that varies but not according to a
season
Number of Weekly Trips versus Numbers of Employees and Vehicles
Another interesting result from the data analysis was the finding of no correlation
between the number of weekly trips and the number of employees or the number of
vehicles as seen in Figure 46 and Figure 47respectively Figure 46 shows responses
from 835 companies and Figure 47 includes responses from 724 companies The number
of observations differs in these figures because not all respondents provided answers to
both the number of employees and the number of vehicles questions In these figures
number of trips per week was determined by combining number of single-stop full
truckloads per week number of multiple stop shipments per week and number of parcel
shipments per week Low correlations were found in both relationships with 21 and 19
respectively for Figure 46 and 47
Figure 46 Correlation between Number of Employees and Number of Trips
53
In this figure the number of employees given is the number of employees that companies
have within the Pacific Northwest There are 835 companies represented in the figure
This result is significant because number of employees is the dominant data used by
regional travel demand models to estimate number of truck trips per establishment Our
data shows almost no correlation between trip making and employees
Figure 47 Correlation between Number of Vehicles and Number of Trips
There are 724 companies represented in this figure who answered the question on
how many vehicles are in their fleet As the number of vehicles in a companiesrsquo fleet
increase the number of trips per week is not necessarily increasing There is a low
correlation coefficient (R2= 019) Number of vehicles per licensed motor carrier is a
publicly available data element As a result it is also commonly used as a surrogate for
trip making in travel demand models This data demonstrate the weakness of this
assumption
Quality of Factor Scores
Figure 48 shows the distribution of the total sum of the factor scores across respondents
for the primary routing question in the survey Respondents were asked to rank 15
factors on a scale of 1 to 4 to indicate their importance to routing decisions The sum was
found by simply adding the scoresmdasheither a 1 2 3 or 4mdashfor each factor for each
54
respondent The minimum sum was therefore a 15 while the maximum was a 60 The
total sum was the traditio nal summated raw score used in Likert-type scaling the raw
score weights each response equally for all factors Figure 48 shows that the total sum
followed a normal distribution with a slight skew toward higher influence scores This
shows that respondents used different scores for different factors Only 10 respondents
used the same score for all factors
Figure 48 Frequency of Total Sum of 15 Factors Influencing Routing Decisions
This figure shows the distribution of the sum of ratings respondents gave to 15
factors that influence routing decisions The histogram of total sums shows a normal
distribution with a slight positive skew This signifies no bias within the sample
population to rank all factors as non-influential or all as highly influential
Importance of Routing Factors
Table 41 shows the percentage of companies that scored items with a 4 and Table 42
shows the average scores for several groups within the sample population In order to
achieve the average companies were grouped depending on the characteristic shown and
then their responses to the 15 factors were averaged
55
Table 41 Percentage of Companies that Scored Item with a 4 (highest rating)
Table 42 Overall Averages
56
In this table it is important to note that in each block of questions the responden ts
did not cover the entire sample that is included in the Overall Average For example a ll
the averages of Service Type were higher than the Overall Average This is because on ly
respondents that answered ldquoyesrdquo to Long-Haul City Delivery Regional or Parcel were
included and these four were not mutually exclusive The Overall Average included all
respondents that said ldquoyesrdquo or ldquonordquo to these service types Across all questions the
influence of Highway Tolls Refueling Parking Road Grade and HazMat on routing
decisions was consistently lower than Travel Distance Travel Time and Total Cost
which respondents consistently considered highly influential
Use of R
The open source statistical program R was chosen for statistical analysis R allows the
use of packages that utilize advanced statistical techniques to focus on factoring and
cluster analysis The majority of the questions in the survey were categorical Questions
with continuous data for responses were converted into categorical data so that they could
also be included in the categorical analysis
Once the surveys had been cleaned and data values converted from continuous to
categorical data mining was performed to extract a small subset of meaningful factors
from the full list of 15 factors The type of statistical technique used in this analysis is
called latent variable modeling Latent variable modeling can be used for both factor
analysis and class analysis Latent variables are variables that are not directly observab le
(eg intelligence) and require the use of surrogate variables (eg GPA SAT score) that
can be observed For this study the latent variable (8) was the freight companies
sensitivity to external factors in deciding their route choice The observable variables
were the factors the survey asked the company representatives to rate for their intensity of
influence on the routing decision The statistical software program R and specifically the
ltm and poLCA packages were used to determine which of the 15 factors distinguished
among the companies
RESULTS
The following discussions are focused on the central question of the survey which asked
respondents to rank the influence of fifteen factors on their routing decisions The
57
analysis separated the factors that differentiated carriers from each other and the factors
that were similar among all carriers The majority of respondents rated travel time travel
distance and meeting customer requirements as highly influential (4) indicating that
these factors are unanimously significant routing factors Specifically 87of
respondents rated customer requirements as highly influential (4) Including these factors
in a statistical analysis would diminish differentiation between responses making clusters
indistinguishable Looking beyond the highly influential factors of travel time travel
distance and customer satisfaction would highlight differences in companies
An example of this is found in `Q22c ldquohow often does highway congestion
change routes with response options being (a) never (b) yearly (c) monthly (d)
weekly or (e) daily Forty-eight percent responded (a) never Because congestion is a
recurring event in predictable locations companies already account for congestion when
they determine their usual routes
Travel time travel distance customer satisfaction and congestion are examples
of factors that can be modeled the same way for the entire company population Other
factors specifically road grade refueling locations parking availability hours of service
limits and sizeweight limits cannot be modeled the same for the entire population
Survey respondents scored this subset of factors with various levels of influence (no
influence slight influence moderate influence high influence) These factors are called
informative items in item response theory (IRT) and can be used to cluster companies
who prioritize similar factors when deciding route choice
Item Response Theory
Latent variable modeling is a method used to model responses to questions that are either
dichotomous (ie have two categories of responses) or polytomous (ie have more than
two categories of responses) Item response theory (IRT) uses latent variable modeling to
assign a probability of a certain response to an item given the respondentsrsquo sensitivity (8)
and the itemrsquos parameters In this study the ldquoitemrdquo was the factor the survey respondent
was being asked to judge with regard to its influence on route choice by using graded
responses (ie a Likert-type scale) Again the scale used by the respondents was (1) no
influence (2) slight influence (3) moderate influence and (4) high influence Item
parameters included difficulty (b) and discrimination ability (a) Difficulty was the mean
58
response of the item ie the point at which 50 percent of the respondents scored the item
with moderate to high influence and 50 percent scored the item with no to slight
influence If an item had a difficulty of 4 then it was easier to agree to than an item with
a difficulty of 2 (ie the respondent was agreeing with the high influence of the item)
Figure 49 Item Operation Characteristic Curves (IOCC) These curves illustrate the value of each item
Items with steep curves in the plots above help differentiate respondents and form
clusters The three lines represent a score of 2 or higher 3 or higher or 4 or higher
59
There are three separate lines since the item may distinguish between the companies tha t
ranked an item as a 3 and companies that ranked the item as a 4 while not distinguishing
between those companies and companies that ranked an item as a 2The IOCC for
Multiple Loads shows low steepness meaning that the item does not discrimina te well
between respondents The IOCC for Parking shows high steepness meaning that the item
is meaningful in differentiating between respondents The discrimination ability
parameter estimates were generated by using the graded response model (GRM) The
GRM models the probability of a respondent scoring an item at a certain intensit y of
influence or higher (eg 3 or higher) and uses the equation
where a and b are the item parameters and is the probability that a respondent will
give item i a score of k or above given the respondents sensitivity level 8 The GRM
does not assume that the distance between the categories of the rating scale ie between
1 and 2 and between 2 and 3 is constant This spacing between categories is controlled
by the b-parameters also called threshold parameters The GRM can be constrained to
equal discrimination if warranted by the data
Item Information
Test precision in IRT is conveyed in the form of information Information indicates ho w
useful an item is in differentiating the respondents sensitiv ity levels (8 ) Information is a
function of 8 and therefore can provide differing levels of precision across the sensitivity
spectrum Figure 411 shows the information for all items included in the GRM The
level of information corresponds to the height of the curve and the location of inflection
along the sensitivity spectrum Looking at Multiple Loads one can see that items with
low and near-constant slope carry the same amount of information for all respondents On
the other hand items with steep slope and an inflection point in the positive 8 range such
as parking carry high amounts of information for respondents with an average-to-high
sensitivity level
60
Figure 410 Item Information Curves The item information curve illustrates how informative an item is with information increasing along the y-axis The x-axis determines the sensitivity region over which the item is most informative Items that peak in the middle of the x-axis are more informative for companies whose sensitivity level is average whereas the items that peak at the far left of the x-axis are more informative for companies that have low sensitivity levels
The sections that follow discuss further investigation of the five informative items
determined here using ordinal logistic regression with the exception of driver
availability Instead of driver availability which relates to hours of service limits with
regard to personnel management size and weight limits is included which was also an
informative item
Correlating Individual Factor Scores with Transportation Features
Ordinal logistic regression was completed for those items that differentiate respondents
(road grade refueling parking hours of service and size and weight limits) The normal
form of a logistic regression model is
where is the latent variable is an explanatory variable and is its coefficient
Because the response variable is ordinal ordinal regression must be used In this study
61
there were three thresholds 1 2 and 3 which distinguished between the possible
responses as follows
To obtain the variables in the model variables were added one by one and kept i n
the model if the variables coefficient was significantly different than zero All
statistically significant variables were kept in the model The following sections d etail the
regression model for each item
The goal of performing regression was to determine the key factors that
influenced each item individually These transportation featu res (ie provides long-haul
service) can then be used to predict someonersquos routing preferences A later section
discusses the use of latent class analysis to predict a companyrsquos responses to all items
tsimultaneously but because companies migh only be sensitive to one or two items
regression was useful for predicting which company characteristics influenced the item s
separately
Road Grade
The model for road grade included whether a company provided long-haul services and
to what extent the company back-hauled freight The model was as follows
log(P[Influence gt j]) - log(P[Influence j]) = f 0
-03682 (Company does not provide long-haul services)
+08635 (Company never back-hauls)
+ 12951 (Company rarely back-hauls)
+13505 (Company sometimes back-hauls)
+12793 (Company mostly back-hauls)
+16207 (Company always back-hauls)
where
62
Here j is the level of influence the company scored a given item (either a 1 2 3
or 4) The probability of scoring less than or equal to 4 was 1 that is why there are only
three intercepts The coefficients can be interpreted in the following manner If one holds
all values constant except for one say the company does not provide long-haul services
then the odds that the company would score road grade as a j (where j = 1 2 3) or lower
would increase by exp[-03682] = 0692 if the company did not provide long-haul
services
The ordered logistic regression above provides evidence that companies that
provided long-haul services and back-hauled freight are more likely to rate road grade as
influential in routing decisions Because of the time and distance involved in long-haul
trucking these companies have an incentive to carry freight both ways These companies
also have an incentive to carry as much freight as possible and hence will drive heavier
and larger trucks that are more sensitive to road grade
Refueling
The model for refueling included whether a company provided long-haul services o nly
All other variables when added to the model were statistically insignificant The model
was as follows
log(P[Influence gt j]) - log(P[Influence j]) = f0
-09829 (Company does not provide long-haul services)
where
Again j is the level of influence the company has scored a given item either a 1
2 3 or 4 The odds that the company would score refueling as a j (where j = 1 2 3) or
lower would increase by exp[-09829] = 0374 if the company did not provide long-haul
services
The ordered logistic regression above provides evidence that companies that
provide long-haul services were more likely to rate refueling locations as influential in
63
route decisions Because of the time and distance involved in long-haul trucking the se
companies must take i nto account refueling stations along the route
Parking
The model for parking included whether a company provided long-haul services only All
other variables when added to the model were statistically insignificant The model was
as follows
log(P[Influence gt j]) - log(P[Influence j]) = f 0
-1008 (Company does not provide long-haul services)
where
Again j is the level of influence the company scored a given item (either a 1 2 3
or 4) The odds that the company would score parking as a j (where j = 1 2 3) or lower
would increase by exp[-09829] = 0374 if the company did not provide long-haul
services
The ordered logistic regression above provides evidence that companies that
provided long-haul services were more likely to rate availability of parking as influential
in route decisions Long-haul truckers are more likely to be away from a company
warehouse or terminal while traveling and therefore have a greater need for pa rking
availability (Note Respondents may have considered parki ng as either parking at the
destination or parking overnightresting breaks)
Hours of Service Limits
The model for hou rs of service limits included whether a comp any provided long-haul
services and city-delivery services and whether the company operated regionally The
model was as follows
64
log(P[Influence gt j]) - log (P[Influence j]) = f0
-12031 (Company does not provide long-haul services)
-04137 (Company does not provide city-delivery services)
-05246 (Company does not operate regionally)
where
Again j is the level of influence the company scored a given item (either a 1 2 3
or 4) The odds that the company would score hours of service limits as a j (where j = 1
2 3) or lower would increase by exp[-12031] = 0300 if the company did not provide
long-haul services
The ordered logistic regression above provides evidence that companies that (1)
provided long-haul and city-delivery services and (2) operated regionally were more
likely to rate hours of service limits as influential in route decisions
Size and Weight Limits
The model for si ze and weight limits included whether a company provided long-haul
services operated tractor-trailers andor owned heavy haul equipment The model was as
follows
log(P[Influence gt j]) - log (P[Influence j]) = f0
-03645 (Company does not provide long-haul services)
-06655 (Company does not operate tractor-trailers)
-04785 (Company does not own heavy haul equipment)
where
Again j is the level of influence the company scored a given item (either a 1 2 3
or 4) The odds that the company would score size and weight limits as a j (where j = 1
65
2 3) or lower would increase by exp[-03645] = 0695 if the company did not provide
long-haul services
The ordered logistic regression above provides evidence that companies that
provided long-haul services operated tractor-trailers andor owned heavy haul
equipment were more likely to incorporate size and weight limits into their route
decisions The reasoning here is similar to that for road grade
Conclusions
The five regression models above show that whether a company provi ded long-haul
services affected the type of factors incorporated into route decisions Long-haul
companies face different obstacles than urban delivery services or drayage trucking and
therefore have different route choice decision making processes The next section
discusses the simultaneous investigation of these five items along with customer
requirements and total cost with regard to long-haul trucking
Routing Categories
In addition to examining items individually one can also analyze them simultaneously
This can be accomplished with latent class analysis Latent class modeling groups
companies into classes on the basis of probabilities rather than a measure of distance as
used in traditional cluster analysis Latent class analysis (LCA) does so by using mixture
models Mixture models seek to determine subpopulations within a general population in
the absence of explicit group identifiers The analysis generates probabilities that a
company belongs to each of the latent classes on the basis of the responses to the
manifest variables or items The company is assigned to the class to which it has the
highest probability of belonging Prior to observing the item responses every company
has an equal probability of belonging to each latent class This analysis seeks covariates
or company characteristi cs that will a priori predict the probability that a company will
belong to a latent class
To determine covariates variables were added one by one and checked for
significance This analysis identified whether a company provided long-haul trucking as
the only significant variable Other factors may influence the decision but could not be
determined from the data The latent class model uses cross-classification tables to
66
generate the joint distribution of items With a high number of manifes t variables and
covariates the cross-classification tables become sparse (consist primarily of zeros) and
the statistical techniques used in LCA become invalid Therefore the number of
covariates was kep t to a minimum
Figure 412 shows the results of LCA using nine items and one covariate The
items w ere total cost customer requirements refueling parking road grade size and
weight limits hours of service limits driver availability and HazMat and the covariate
was whether the company provided long-haul trucking The items chosen were the most
similar and the m ost discriminating items among the companies HazMat was not
discriminating overall but was chosen because it was informative over the high sensitivity
region The graph shows the seven items on the horizontal (x) axis the possible score (1
2 3 or 4) on the skewed (y) axis and the probability (between 0 and 1) of a given
observation occurring in the specific latent class on the vertical (z) axis The analysis
generated three latent classes with the following population sizes (class population
share) (1 0411) (2 0377) and (3 0213) The graph shows that items for which
diagnostics revealed little information appear similar among all classes whereas more
informative items have d istributions that vary across the classes
Figure 411 Latent Classes with Long-Haul Covariate The plots show that the most discriminating items have varying response patterns across the latent classes whereas the least discriminating items have similar r esponse patterns across the latent classes
67
The covariate allows one to predict what class a company belongs to before
observing the companys responses to the items (manifest variables) After the analysis
was run companies in each class were examined to determine their response to the
covariate The percentages of companies that provided long-haul trucking in eac h class
were as follows
bull Class 1 1397
bull Class 2 3871
bull Class 3 5424
Class 1 consisted of primarily non-long-haul truckers while class 3 had the
highest percentage of long-haul trucking companies Many companies may provide more
than one service The companies in class 3 all provided long-haul trucking services but
they may have varied with respect to whether and what other services they provided and
to what extent Figure 413 shows the probability of belonging to a class given a
companys response to whether they provided long-haul services across the levels of
sensitivity to routing factors As sensitivity increases the probability that a company is a
long-hauler increases
Figure 412 Long-Haul as a Predictor of Latent Class The graph shows that as sensitivity to routing factors increases the company is more likely to belong to class 3 which is the class with the most lo ngshyhaulers
68
Long-haul providers travel longer distances so they have an incentive to carry as
much cargo as possible per trip This may motivate their concern for size weight and
hour limits Companies that do not provide long-haul services may be city deliver y and
regional trucking companies that do not encounter difficulties with large heavy trucks
and do not require parking or refueling along the route Class 2 consisted of about 39
percent long-haul providers and had a monotone trend with regard to influence of size
and weight limits hours of service limits and driver availability as well as more average
influence scores (2rsquos and 3rsquos) for parking refueling and road grade as seen in Figure
413 These companies provide a broader range of services and the companies that did
provide long-haul services may have done so only a minority of the time Because Class
2 and Class 3 had higher average scores HazMat was used in the model because it is
informative over the highly sensitive region Companies in Class 3 were clearly eith er
carrying hazardous material regularly or not at all (HazMat was ranked as a 1 or 4)
The predicted probabilities (the probability that a company belongs in each o f the
three latent classes without knowledge of their responses to the 15 items) can be fou nd by
using the following general form
where R is the number of latent classes The coefficients fR are listed in Figure 414
Figure 413 Parameter Coefficients The coefficients are to be input into the above formula to generate three probabilities per company one for each latent class All coefficients for latent class 1 are zero
69
The result of the latent class analysis was three distinct classes into which
companies could be classified The graph of the priority trends of each group show some
factors are important to everyone and some factors maybe unimportant to one class
moderately important to another and highly important to yet another class
CONCLUSIONS
From the analysis described in this report several conclusions can be made about the
priorities of company routing decision-making
1 From item diagnostics it is clear that the five most discriminating factors are
a hours of service limits
b availability of truck parking
c driver availability
d refueling locations and
e road grade
All of these factors are most distinguishing across the average sensitivity level
2 Long-haul trucking is a significant predictor of how a company will rank a given
item Other important predictors included
a whether and to what extent a company back-hauls freight
b whether a company provides city delivery and regional trucking
c and the equipment the company owns
3 The latent class analysis revealed three distinct groups in the data
a Urban Truckingmdash Only cost and meeting customer requirements are
important in their routing decisions
b Local-Regional Truckingmdash Regional and opportunistic firms
c Long-Haul TruckingmdashAll factors are ranked as important with the
majority of all companies ranking all factors as 4rsquos These companies most
likely have heavy and large trucks require overnight parking and drive
routes that require refueling and several hours of driving
70
To account for the differences in priorities among the categories the Statewide
Freight GIS Network Model should be modified for each class separately The
probability that a given company belongs to each of the three classes can be predicted a
priori by determining whether the company provides long-haul or city delivery services
71
5 RECOMMENDATIONS FOR MODIFICATIONS TO THE STATEWIDE FREIGHT GIS NETWORK MODEL
Through this research we gathered information on how truck freight routing
decisions are made and how these decisions vary across freight carriers shippers and
forwarders We catalogued how routing decisions vary by truck freight services type
commodity shipped industry sector served and how route choices are affected by
congestion travel time route reliability and business- and product-specific supply chain
characteristics
This section presents recommendations regarding how this knowledge can be
incorporated into WSDOTrsquos Statewide Frei ght GIS Network Model When statewide
commodity flow information is available this will provide substantial improvements in
state freight modeling capability
The state of Washington possesses a Statewide Freight GIS Network Model
Currently if trip origin and destination are known the model will assign the trip to the
roads that provide the shortest route available between the origin and destination
The survey results clearly show that respondents were trying to meet customer
requirements while minimizing time distance andor cost Truck operating costs
primarily relate to fuel consumption and driver pay Distance driven is a primary
determinant of operating cost and is strongly correlated with driving cost Time is
primarily a function of distance travelled however congestion can also be a factor So to
a large exten t meeting time cost and distance requirements can be considered to be the
same objective Through the survey conducted for this project we confirm ed that the
shortest path is overwhelmingly the appropriate logic to use once the origin destinatio n
and road network are known To improve upon the logic of the existing Statewide
Freight GIS Network Model we recommend the following changes
72
1 Use a truck usable network (based on the Household Goods Mileage Guide)mdashnot
the entire road networkmdashto account for road classification
It is possible that the network may include a shorter route but that the roads will
nevertheless not be appropriate because of geometric or legal constraints
attributable to their classification or local ordinances To capture true truck
behavior we suggest that only the truck usable network be considered
2 When commodity data are available overweight oversize and hazardous
material trips should be identified and relevant infrastructure restrictions captured
in the network
Hazardous waste should be identified by commodity code (NAICS codes 562211
562112 484230 484230) The network for trips with this commodity
classification should be limited to those links where hazardous materials are
tolerated
3 When using the network to reflect winter conditions include seasonal road
closures The model is currently run for one point in time and does not simulate
time steps of any length When the model is intended to represent winter
conditions relevant seasonal closures should be included
4 Instead of using the speed limit as the estimated travel speed on a link we suggest
using observed travel speed from the truck performance measures project This
could be an overall average or the average for a specific time of day We suggest
that these speeds then be converted to values by using a truck value of time This
would allow additional costs to be considered in the routing such as tolls and the
cost of emissions Time can be converted to dollars by using an estimated value
of time for trucks Emissions costs can be estimated in a similar fashion
The Latent Class Analysis identified three classes of carriers with respect to
routing decisions urban trucking local-regional trucking and regional long-haul
trucking These classes are strongly related to the geographic extent of their operations
as well as their ldquolocationrdquo on the supply chain (eg raw materials intermediate
processingstorage or distribution) This knowledge allows us to implement routing
logic on the basis of the geographic extent of the trip instead of or in addition to a
73
carrier-based assumption For example instead of implementing new logic for urban
trucking carriers we can implement new logic for origin-destination pairs within urban
regions We recommend the following model implementations to reflect the differen t
routing priorities of our three categories
5 For trips with origins and destinations within urban regions (specifically the four
counties of the Puget Sound) use the distribution of truck sizes for trucks that
deliver in cities
Table 51 Distribution of Truck Sizes
6 For trips with origins and destinations within urban regions (specifically the four
counties of the Puget Sound) assume no backhaul
7 For origin-destination pairs with a distance of over 300 miles use a network that
is navigable by large and heavy trucks
8 For origin-destination pairs that exceed a distance of 500 miles choose routes th at
include a truck parking location every 500 miles (this will require documen tation
of truck parking locations)
9 Add time-step simulation capacity to the model framework
10 Develop a trip chaining model to capture backhauling for trips of over 500 miles
and trip chains within urban regions (specifically the four counties of the Puget
Sound)
With tight state budgets completing all of these improvements independentl y
make prove too costly CalTrans is working with the University of Ca lifornia at Irvine to
develop a novel framework for freight modeling Dr Goodchild (UW) serves on the
advisory committee As this work develops it is prudent to judge whether or not this
framework can be applied to Washington State
74
6 CONCLUSIONS
From the analysis described in this report many conclusions c an be drawn about
the issues of concern and the methods by which companies make strategic routing
decisions We can also make conclusions regarding the utility of using statewide GPS
data for measuring routing decisions
1 Off-the-shelf routing software automatically assigns routes on the basis of le ast cost
given an origin-destination pair (determined by customer requirements) Other
concernspriorities can be input to a) limit the network upon which the freight may be
routed or b) prioritize them by level of importance
2 A small minority of companies in Washington use routing software
3 Minimizing cost while meeting customer requirements is the goal of every shipper
carrier and freight forwarder Beyond that among all classes the most importan t
motivator of rou te choice comprises policies imposed on the company Physical
constraints such as parking refueling stations and road grade appear to be issues that
companies can find ways around To account for the differences in constraints among
the classes the network model should be modified for each group
4 Routing behavior is grouped around distance travelled with long-haul trips exhibiting
different routing priorities and characteristics than urban activity Long-haul truckers
are more likely to backhaul drive larger and heavier equipment require overnight
parking and drive routes that require refueling and several hours of driving Urban
trucking is largely local and for urban trucking service providers only cost and
meeting customer requirements are important in routing decisions The majority of
this class ranked all other factors as having ldquono influencerdquo
5 In congested regions companies that can choose to shift the travel time to avoid delay
rather than shift the travel route In fact if one alternative is congested it is likely
that other alternatives are also congested and so shifting route to avoid congestion
may not be possible or the alternative may not be substantially better
6 The utility of using of currently available statewide GPS data to determine route
choice behavior is very limited The data can be used to observe route choice
75
behavior but only where network decisions are about 20 miles apart In addition
identifying stops remains challenging
76
7 REFERENCES
Binsbergen Boerkamps and Bovy (2000) Modeling Behavioral Aspects of Urban Freight Movement In Supply Chains Transportation Research Record 1725 17 -25
Crainic Teodor and Roy Jacques (1988) OR Tools For Tactical Freight Transportation Planning European Journal of Ope rational Research 33 290-297
Garrido Rodrigo and Regan Amelia (2002) ``Modeling Freight Demand and Shipper Behavior State Of The Art Future Directions Institute Of Transportation Studies University Of California Irvine CA
Hunt J D and Stefan K J (2007) Tour-Based Microsimulation of Urban Commercial Movements Transportation Research Part B 41(9) 981-1013
Krapfel Robert and Mentzer John (1982) Shippers Transportation Choice Processes under Deregulation Industrial Marketing Management Volume 11 Issue 12 Pg 117-124
Li S Zhu K V G Nagle J amp Tuttle C (2002) Reconsideration of Sample Size Requirements for Field Traffic Data Collection with Global Positioning System Devices Transportation Research Record
Ma X amp McCormack E (2010) Using Truck Fleet Management GPS Data to Develop the Foundation for a Performance Measures Program Transportation Research Record
McCormack E amp Hallenbeck M E (2006) ITS Devices Used to Collect Truck Data for Performance Benchmarks Transportation Research Record Journal of the Transportation Research Board(1957) 43-50
Miguel Figliozzi (2006) Modeling Impact of Technological Changes on Urban Commercial Trips by Commercial Activity Routing Type Transportation Research Record 1964 118-126
Tavasszy L A Van Der Vlist M J M and Ruijgrok C J (1998) A DSS For Modeling Logistics Chains In Freight Transport Systems Analysis Int Intelligent Transportation Operational Research 5(6) 447-459
Vieira LFM (1992) The Value of Service in Freight Transportation PhD Thesis Massachusetts Institute of Technology Boston MA
Zhao W Goodchild A V amp McCormack E D (2011) Evaluating the Accurancy of GPS Spot Speeed Data for Estimating Truck Travel Speed Transportation Res earch Board Annual Meeting Washington DC
77