improving smallholder farmers’ marketed supply and market access for dairy products in arsi zone,...
TRANSCRIPT
Improving smallholder farmers’ marketed supply and market access for dairy products in Arsi Zone, Ethiopia
ILRIInternational Livestock Research Institute
Research Report 21
i
Improving smallholder farmers’ marketed supply and market access for dairy products in Arsi Zone, Ethiopia
Asfaw Negassa
ILRIINTERNATIONALLIVESTOCK RESEARCH
I N S T I T U T E
International Livestock Research Institute
Food and Agriculture Organization of the United Nations
ii
Author’s affiliation
Asfaw Negassa, formerly with ILRI (International Livestock Research Institute), Addis Ababa,
Ethiopia, now with IFPRI (IFPRI (International Food Policy Research Institute), Addis Ababa,
Ethiopia
© 2009 ILRI (International Livestock Research Institute).
All rights reserved. Parts of this publication may be reproduced for non-commercial use
provided that such reproduction shall be subject to acknowledgement of ILRI as holder of
copyright.
Editing, design and layout—ILRI Publication Unit, Addis Ababa, Ethiopia.
ISBN 92–9146–198–9
Correct citation: Asfaw Negassa. 2009. Improving smallholder farmers’ marketed supply
and market access for dairy products in Arsi Zone, Ethiopia. Research Report 21. ILRI (International Livestock Research Institute), Nairobi, Kenya. 107 pp.
iii
Table of ContentsList of Tables v
List of Figures viii
Abbreviations ix
Acknowledgements x
Executive summary xi
1 Introduction 1
1.1 Background 1
1.2 Study objectives 3
1.3 Outline of the report 3
2 Literature review 5
3 Modelling household marketing and consumption decisions 8
3.1 Theoretical framework 8
3.2 Specifications of empirical models 9
4 Data collection and analysis 15
4.1 Dairy producer survey 15
4.2 Milk collection cooperative survey 16
4.3 Urban consumer survey 16
5 Empirical results for dairy producer survey 17
5.1 Introduction 17
5.2 Results of descriptive analysis 17
5.3 Results of econometric analysis 29
5.4 Section summary 40
6 Empirical results for milk marketing cooperative survey 41
6.1 Introduction 41
6.2 Results of descriptive analysis 41
6.3 Section summary 61
7 Empirical results for consumer survey 63
7.1 Introduction 63
7.2 Results of descriptive analysis 63

iv
7.3 Results of econometric analysis 73
7.4 Section summary 83
8 Conclusion and implications 85
9 References 86
v
List of TablesTable 1. Size of livestock holdings of milk marketing cooperative members and non-members in Arsi Zone 18
Table 2. Production performance of small-scale dairy production systems in Arsi Zone 19
Table 3. Person mainly responsible for dairy farm operations and herd management 20
Table 4. Dairy cattle feeding regimes practised by smallholder farmers 21
Table 5. Sources of water supply 21
Table 6. Type of housing for dairy cattle and whether shelter is used during the day 22
Table 7. Local breeding methods practised by service providers, distances from the farm, rate of conception and payments 23
Table 8. Disease and parasite control practices for dairy cattle and its costs (1999 EC) 24
Table 9. Dairy producers’ perspectives on constraints in dairy farm operation 25
Table 10. Total quantity of dairy products produced, processed, consumed and sold per week per household during 1999 EC 26
Table 11. Major reasons for not selling milk 28
Table 12. Important uses of income generated from dairy products sales 28
Table 13. Market outlets for dairy product sales by dairy producers 29
Table 14. Main buyers of dairy and dairy products produced by smallholder farmers 29
Table 15. Name and description of dependent and independent variables used in the regression analysis for dairy producer survey 30
Table 16. First-stage probit estimation results of determinants of probability to sell fluid milk and butter 32
Table 17. Second-stage Heckman and Tobit estimation results of determinants of the levels of household sale of fluid milk 37
Table 18. Second-stage results: determinants of the levels of household sale of butter 38
Table 19. Historical background of milk marketing cooperative establishment 41
Table 20. Management structure and background of cooperative management staff 44
Table 21. Decision-making by milk marketing cooperatives 45
vi
Table 22. Perspectives of cooperative management staff on members’ satisfaction with cooperative services 46
Table 23. Operational details of milk collection, processing and marketing 47
Table 24. Dairy products marketed by cooperatives, market outlets and buyers 53
Table 25. Capacity of raw milk collection by milk marketing cooperative 54
Table 26. Level of satisfaction of cooperative management with services provided 56
Table 27. Organizations providing support to the cooperatives 56
Table 28. Description of management practices at milk collection centres 57
Table 29. Description of the building used for milk collection centre 58
Table 30. Selected equipment and durable goods owned by cooperatives 59
Table 31. Cooperative management perspectives on the constraints to expansion of milk collection, processing and marketing 60
Table 32 Cooperative management perspective on the areas where training technical support is needed to expand their activities 60
Table 33. Monthly patterns of household dairy product purchases during wet and dry seasons, 1999 EC 64
Table 34. Places of purchases and main sellers of major dairy products during wet and dry season, 1999 EC 65
Table 35. Monthly per capita consumption of dairy products by income group during wet and dry season (litre or kg), 1999 EC 66
Table 36. Monthly per capita dairy product consumption expenditure by income group during wet and dry seasons 66
Table 37. Forms in which dairy products are consumed 67
Table 38. Priority in the household allocation of major dairy products consumed 68
Table 39. Household’s preference rating for important dairy product attributes 68
Table 40. Consumer perceptions of availability of dairy products 69
Table 41. Consumer usage of information sources on dairy product prices and markets 70
Table 42. Changes in current levels of consumption, expenditure, price, quality and availability of dairy products 71
Table 43. Household exposure to various promotional items for dairy products 71
Table 44. Outlook for consumption of major dairy products 72
Table 45. Factors limiting consumer ability to increase dairy consumption 73
Table 46. Name and description of dependent and independent variables used in the regression analysis for consumer survey 74
vii
Table 47. First-stage probit results of determinants of probability to purchase raw milk and butter 77
Table 48. Second-stage Heckman two-step and Tobit results of determinants of levels of household raw milk consumption 81
Table 49. Second-stage Heckman two-step and Tobit results of determinants of levels of household edible butter consumption 82

viii
List of FiguresFigure 1. Monthly average quantities of raw milk collected (2003–04 to 2007–08) 48
Figure 2. Monthly average quantities of dairy products sold by cooperatives
(2003–04 to 2007–08) 49
Figure 3. Trends in monthly average quantities of raw milk collected 50
Figure 4. Trends in monthly average quantities of dairy products sold 50
Figure 5. Monthly average prices of dairy products sold by cooperatives
(2003–04 to 2007–08) 51
Figure 6. Trends in monthly average prices of dairy products sold by cooperatives
(2003–04 to 2007–08) 52
Figure 7. Monthly average gross profits (2003–04 to 2007–08) 54
Figure 8. Trends in monthly average gross profits 55
ix
Abbreviations
AI Artificial insemination
EC Ethiopian Calendar (1996 EC corresponds to 2003–04; and 2000 EC corresponds to
2007–08)
ETB Ethiopian birr
FAO Food and Agriculture Organization of the United Nations
ha hectare
hh household
IFPRI International Food Policy Research Institute
ILRI International Livestock Research Institute
NGO Non-governmental organization
TLU Tropical livestock unit
x
AcknowledgementsThe International Livestock Research Institute (ILRI) would like to thank the Food and
Agriculture Organization of the United Nations (FAO) for providing financial assistance for
this research through the Crop Diversification and Marketing Development Project (GTFS/
ETH/067/ITA) financed by the governments of Ethiopia and Italy and implemented by the
Ministry of Agriculture and Rural Development, Oromia Bureau of Agricultural and Rural
Development and FAO.
This research tremendously benefited from the technical support of many people both at
ILRI and FAO at different stages of the study. The author would like to thank the following:
Mohammad Jabbar, Derek Baker, Hassen Ali, Emmanuelle GuerneBleich, Fikere Mulugeta,
Hizikias Ketema, Jemberu Eshete, Susan Minae, Anthony Bennett and Jerome Mounsey.
This paper also benefited from comments and suggestions of the participants of a validation
workshop organized by ILRI and FAO. Particularly, the author is grateful for the constructive
comments and suggestions provided by Chipeta Mafa, Berhanu Gebremedhin, Moti Jaleta,
Aynalem Haile, Juergen Greiling, Getachew Felleke, Adrian Vernooij and Richard Fulss.
The author would also like to thank Elias Mulugeta and Mahlet Mulugeta for their technical
assistance and field supervision of various surveys. People from the Arsi Zone Bureau
of Agricultural and Rural Development also provided very kind support in identifying
the sample households and gave timely advice on the appropriate channels to contact
the selected households for the survey. In this regard, the author would like to gratefully
acknowledge the help of Gemechu Tulu and Tefera Feleke. The author would also like
to thank the cooperation of sample households involved in different surveys and the
enumerators who administered the survey instruments.
Finally, the author is also very grateful to Selamawit Dominique and Messelu Derejie for their
administrative and secretarial assistance at ILRI and FAO field offices, respectively. The author
alone is responsible for the content of the paper.
xi
Executive summaryThe potential economic and social advantages of market-oriented smallholder dairy
production in improving the welfare of farm households and its multiplier effects on other
sectors of the economy are well known. For example, it generates regular income for the
farm households. The milk from dairy production also provides a highly nutritious food for
all age groups of farm household members and particularly for infants and lactating mothers
thus reducing the problem of malnutrition among rural households.
Realizing such potential economic and social advantages of smallholder dairy production,
various governmental and non-governmental organizations and donor agencies have been
trying to develop market oriented smallholder dairy production in developing countries
like Ethiopia. The Food and Agriculture Organization of the United Nations (FAO) project
in partnership with Oromia Bureau of Agriculture and Rural Development on improving
smallholders’ marketed supply and market access for dairy and dairy products in Arsi Zone
is a good example. However, to be effective, the efforts to improve the productivity of
smallholder dairy production and improve its market orientation needs to be supported and
informed by detailed understanding of the current and dynamic conditions of production,
marketing, processing and consumption of milk and dairy products in the project area and
beyond.
The major objective of this study was to provide a comprehensive review documenting dairy
supply and demand and the role of collective action in Arsi Zone/Ethiopia. The specific
objectives were:
To assess current and prospective demand for milk and milk products in Asella (the •zonal headquarters) and Adama,To assess the current milk production, consumption and marketing behaviour of •farmers in selected woredas taking both participants and non-participants in farmer milk cooperatives in order to asses current and prospective supply of milk, andTo assess the role of collective action, e.g. farmer groups and other possible forms in •overcoming problems of remunerative marketing and market access by smallholder milk producers, with a particular focus on the role and implications of gender
Research methodology
The analytical framework for this research was based on the value chain concept. There
are three main actors in the dairy value chain which are considered in this study: dairy
producers, milk marketing cooperatives and consumers. Primary data were collected through
3 surveys of 200 smallholder dairy producers, 24 dairy marketing cooperatives in Arsi Zone
and 200 urban consumers. The main data collected from the smallholder dairy producers
xii
were related to household demographics, dairy production and marketing practices and
consumption behaviour. Data collected from the consumer survey focused on household
demographics and patterns of dairy purchase and consumption. Data from the survey of dairy
marketing cooperatives concentrated on generating information that can be used to assess
the opportunities and challenges of collective action in the commercialization of smallholder
dairy production and the prospects of scaling-up. Both descriptive and econometric analyses
of the survey data were made. In addition to the administration of the three formal surveys,
several informal interviews were also conducted with officials and key informants in Arsi
Zone. The purposes of these informal interviews were to obtain information that supplements
the data that was collected through sample surveys. Additional secondary data at the zonal
and lower administrative levels were also collected.
Findings from the dairy producer survey
Smallholders’ dairy cowherds are characterized by low reproductive and productive
performances. Dairy farmers own few dairy cows (either local or crossbred). In general, these
dairy cows are characterized by low milk yield, long calving interval, long age at first calving
and short lactation length.
Various household members have different responsibilities for different dairy farm operations
and dairy herd managements. Thus, the training and extension service provisions need to
identify responsible household members and target them accordingly. For example, most
of the time wives are responsible for dairy farm operations such as milking cows, cleaning
of milk containers, milk storing and preserving etc. On the other hand, most of the time
husbands are responsible for dairy herd management such as feeding dairy cattle, health
management, heat detection and mating.
There are three dairy cattle feeding regimes practised in the zone. These feeding regimes are
zero grazing, private grazing and communal grazing. The zero grazing system is practised by
most of the dairy producers. Straws and crop residues are extensively used and animals are
grazed on the crop stubbles. Crop residues are also separated and sold for animal feeds. Lack
of feed is one of the most important constraints reported by dairy producers.
There is a limited water supply for dairy cows. Streams and rivers are the major sources of
water supply for dairy farmers in the zone and this represents considerable energy wastage
for dairy cows in terms of travel time required to the watering points. Furthermore, only
42% of sample dairy farmers reported that their dairy cows have continuous access to water
supply.
xiii
There are limited controls of dairy diseases and parasites by the dairy producers. Across the
whole sample, only 22%, 54%, 54% and 20% reported vaccination against foot-and-mouth
disease, black leg, anthrax and lumpy skin diseases, respectively. Furthermore, only about
34% and 53% of sample dairy producers reported the treatment against ticks and liver flukes,
respectively. The treatment for mastitis, brucellosis and salmonellosis was reported by less
than 25% of dairy producers.
The membership in milk marketing cooperative is associated with higher quantities of
milk produced, marketed and consumed. For example, during the wet season of 2006–07
production calendar, the quantity of milk produced, marketed and consumed by the dairy
producers who are the members of the cooperative was 98, 46 and 23 litres per week,
respectively while for the non-members the respective figure was 65, 7 and 18 litres per
week, respectively. The proportion of milk marketed was also higher for the dairy cooperative
members. The proportion of milk marketed (milk off-take rate) was 46% and 8% for members
and non-members, respectively.
Low level of production is one of the main reasons for not selling milk in the market. About
43% and 47% of the dairy farmers did not sell milk in the market during the wet and dry
season, respectively, in 2006–07 (1999 Ethiopian Calendar [EC])1. The main reason given for
not selling milk in the market was low-level of milk production which was not sufficiently
larger than the family home consumption needs.
Milk marketing cooperatives are the main market outlets for and buyers of fluid milk. The
main market outlet for cheese and butter is the town market and the main buyers are urban
consumers. The three most important uses of income generated from dairy sell are for buying
dairy feed (72%), to cover health expenses (71%) and to repay loans (67%).
Membership in a milk marketing cooperative is the key determinant of decisions to sell
and the quantities of milk and butter sold by the dairy producers. Membership in a milk
marketing cooperative significantly increases (decreases) the likelihood of household to
sell milk (butter) and the quantities of milk (butter) sold. The female-headed households
are more likely to sell milk and butter as compared to the male-headed households. The
female-headed households also sold significantly higher quantities of milk than male-headed
households did. However, the effect of household-head gender on the quantities of butter
sold is not significant.
1. 1996 EC corresponds to 2003–04; and 2000 EC corresponds to 2007–08.
xiv
Findings from the milk marketing cooperative survey
Milk marketing cooperatives are few in number and recent. There are about 24 milk
marketing cooperatives in Arsi Zone with average service year of 4 and 67% of them are
legally licensed. About half of the cooperatives are initiated by the government.
Cooperatives are managed by dairy producers who are the members of milk marketing
cooperative. The cooperatives are managed by cooperative members who are mostly
male, about 40 years old and mostly had only primary school education. The cooperative
management positions are the chair, secretary, auditor, treasurer, accountant, record keeper
and one member.
Cooperatives are engaged mainly in bulking raw milk from the members (also from non-
members), processing and marketing of processed dairy products. The milk deliveries are
received at the collection centre mainly in the morning only (87%) and the evening milk is
usually not collected. The capacity of the cooperative is limited in terms of the quantities
of milk collected and processed, geographic coverage and number of peasant associations
and dairy producers involved. The dairy cooperative’s product offerings are limited mainly
to butter, skimmed milk, yoghurt and cheese and the sale of fresh fluid milk is not very
common.
Milk quality testing is rarely practised. There are certain quality requirements for the milk
deliveries at the collection centres. However, only 44% reported that the quality test is done
at the time of milk delivery.
Cooperatives practice direct marketing of dairy products with no formal vertical business
linkages. The main point of dairy product sale by cooperative is the cooperative milk
collection centre itself. The main buyers are rural and urban consumers in the area. The
cooperatives are engaged in direct marketing of dairy products to the consumers and as
such there are no contractual arrangements and strong vertical linkages to the supermarkets,
institutional users and private and/or public processing plants.
Cooperatives provide limited services to their members. Less than 10% reported that
cooperative has received loan, veterinary services, grant money, buildings and AI services for
its members. However, significant number of cooperatives reported that they have supplied
milk collection equipment, provided training in management and provided administrative
support and market information to their members.
Milk collection premises are unhygienic. The main characteristic features of milk collection
centres are that they comprise small rooms consisting of cream separator, butter churner,
milk storage cans, few tables and chairs or benches and drinking cups. There are obvious
xv
hygienic concerns such as lower frequency of cleaning per week, unavailability of running
water, inadequacy of room size for milk collection, use of single room for milk collection and
retailing of dairy products for immediate use and take-home services, presence of messes and
rubbishes on the floor, lack of waste disposal pits and limited use of toilets.
Quantities of milk collected and milk prices vary seasonally. The monthly collections are
relatively lower during the months of January to April that correspond to the dry season.
There are annual trends in the quantities of milk collected and dairy products sold by
cooperatives. The average annual raw milk collected by dairy cooperatives declined from
1996 EC to 2000 EC and similar patterns are observed for most of dairy products sold by the
cooperative. The monthly gross profit shows clear seasonal pattern where months of May to
July show low average gross profit. On the other hand, there is no clear trend in the average
gross profits of the cooperative.
Cooperatives have limited milk collecting, storage and processing equipment and facilities.
All of the cooperatives have cream separator and more than 95% have butter churner and
only about 44% of them have power supply. Collection centres lacked cooling facilities and
some necessary equipment. Due to lack of cooling facilities the cooperatives neither have
the capacity to collect milk from very distant areas nor store milk over longer period of time.
The cooperatives immediately process milk into butter and the opportunity of transporting
fresh milk to other regional markets does not exit. In general, the collection and processing
capacity of the existing milk marketing cooperatives are limited in terms of the milk
catchments area to be served.
Constraints: The most frequently reported constraints are poor animal breeds owned by
members (92%), low milk supply (88%) and lack of feed (83%). All respondents cited
technical support needs in record keeping, financial management, quality control, marketing
and cooperative administration, while 68% of respondents said they needed technical
support in packaging. More than 65% reported willingness to pay for these services. The
mean rating of the support needed also indicate that quality control ranked number one
which is followed by administration.
Opportunities: So far the activities of cooperative are limited to bulking, minor processing
and marketing of the dairy products. Therefore, there are opportunities for more value adding
processing. There are no observable business linkages along the dairy value chain. There are
opportunities for strong vertical coordination through linkages such as with local institutional
milk buyers, supermarkets and private milk processors. The other option to be considered is
the vertical integration of the milk marketing cooperatives through the establishment of union
of cooperatives at the zone level which collect, process, and market milk and milk products
xvi
from the milk marketing cooperatives. Currently, there is one cooperative union which is
under establishment. The union can also potentially provide the opportunities for economies
of scale for coordination various services among the cooperative members.
Findings from the consumer survey
Only a few types of dairy products are purchased and consumed. There are four main dairy
products locally produced and consumed in the area: raw milk, edible butter, cosmetic butter
and cheese. Fewer purchases and limited consumption of these dairy products are observed
except for raw milk. On average raw milk is purchased 25 times per month while soft cheese,
edible butter and cosmetic butter are purchased about three times a month. These purchase
patterns are the same for both wet and dry seasons.
Peri-urban and urban dairy producers are still very important sources of milk for urban
consumers. The major consumers purchase points for raw milk is a neighbour dairy producer
through contractual arrangement (76%). On the other hand, for other dairy products like soft
cheese, edible butter and cosmetic butter, the major points of purchase are town markets and
the main sellers are traders. The use of supermarkets is limited.
Per capita dairy product consumption and expenditure are very low for urban consumers.
The monthly per capita dairy products consumption and the expenditure on dairy products
are observed to be very low. For example, the average monthly per capita consumption for
all households during the wet season for raw milk, soft cheese, edible butter and cosmetic
butter is 4.44 litres, 0.41 kg, 0.44 kg and 0.11 kg, respectively. This indicates the potential to
expand milk consumption provided the prices are affordable. The average monthly per capita
expenditure on raw milk, soft cheese, edible butter and cosmetic butter based on all samples
is Ethiopian birr (ETB)2 14, 4, 16 and 2 respectively.
The dairy products are consumed mainly in three forms. For example, raw milk is taken alone
(37%), taken with other foods (45%) or processed into other dairy products (18%). Cottage
yoghurt, pasteurized milk, and cosmetic butter are mostly taken alone while powder milk
and edible butter are taken with other foods. The household processing of dairy products
purchased is mainly limited to fresh milk and skimmed milk. It is observed that the household
preference in the fresh milk allocation is given to infants followed by younger children while
adults and elderly members are least considered for fresh milk consumption.
For all dairy products, product safety and quality were ranked by the consumers in their
purchase decisions. For example, for fresh milk the important dairy product attributes
2. As of 28 July 2009, USD 1 = Ethiopian birr (ETB) 12.4665.
xvii
considered in decision to purchase it in order of importance are: safety and quality, price,
freshness, availability and taste. Packaging and brand names are still not well developed in
promoting the dairy products consumption.
Unavailability is the main reason for not consuming dairy products: It is observed that large
proportion of households reported that their lack of dairy product purchase and consumption
is related to the fact that the dairy products are not available on the market for purchase. For
example, about 27% of the consumers reported that they would like to purchase fresh milk
but it is not available on the market. Similar observations are made for other dairy products.
These indicate that there are potential markets for dairy products if availabilities of dairy
products in the local markets improve.
The most important sources of information used by the consumers are market visits,
neighbours and friends. Dairy consumers have limited exposure to promotional activities for
dairy products through television (45%) and radio (24%). The use of modern communication
media like radio and television are very limited. This shows that there is a potential to
expand dairy product consumption through the use of modern communication technologies
and educating consumers and providing information that facilitate their abilities to process
information and make purchase and consumption decisions.
The outlook for dairy products is good. It is observed that significant proportion of the sample
consumers think that their current monthly consumption level is inadequate for fresh milk
(72%), edible butter (62%), cheese (43%) and cosmetic butter (38%). More than 95% of
those who reported inadequate level of consumption also indicated their interest to increase
their level of consumption. Given low levels of per capita dairy product consumptions and
the consumer’s interest to increase their level of consumption, there is good prospect for
dairy products market expansion. Increased availability at affordable prices and promotional
activities are required to increase the dairy products consumption levels.
Marital status of household head and household income are key determinants of purchase
and quantities of milk and butter consumed by the urban consumers. Married households are
more likely to purchase milk and butter. As the household income increases the probability
to purchase butter also increases while the impact of household income on the household
decision to purchase milk is not significant. Married households purchase significantly larger
quantities of milk and butter than unmarried households. The higher is the household income
the higher is also the quantities of milk and butter consumed.
xviii
Conclusion and implications
This study has indicated that the membership of smallholder dairy producers in a milk
marketing cooperative is a key factor in determining their decision to participate in milk
and butter markets and their levels of market participation. The quantities of milk and butter
produced, marketed and consumed by the members of cooperatives are significantly larger
than those of non-members. However, the current level of cooperative milk collection,
processing and marketing is very much limited.
The quantity of milk collected is low. There are few numbers of milk marketing cooperatives
and milk collection centres. The numbers of dairy producers who are the members of the
milk marketing cooperatives are also few compared to the total population of dairy producers
in the area. Usually, there is only one milk collection centre per one milk marketing
cooperative. The milk marketing cooperatives do not exist in all areas, particularly in remote
off-all-weather roads. The range of dairy products handled and the processing capacity of
the cooperatives are also limited. The major dairy products sold by the cooperatives are
skimmed milk, butter, cheese and yoghurt. Therefore, there is a clear justification for scaling-
up cooperative marketing activities, to organize more dairy producers into milk marketing
cooperatives, increase milk collection centres and widen the cooperatives’ geographic
coverage.
There is very good market prospect for increased production of dairy products through
scaling-up. Analysis of consumer patterns of purchase and consumption of dairy products
points to good prospects for expanding the market for dairy products. This is because the
current per capita consumption of dairy products is very low and the consumers think their
current level of consumption is inadequate and are interested to increase their level of
consumption provided that the dairy products are available at affordable prices. In general,
the demand for dairy and dairy products is unsatisfied locally and there are also clear
regional and national market opportunities.
Efforts to scale-up cooperative marketing activities and to enhance the local capacity for
smallholder dairy development requires detailed understanding of the production, marketing
and consumption situations for dairy and dairy products in the project area and beyond. In
this regard, in this study effort has been made to collect, analyse and generate information
that informs the scaling-up efforts by the governmental and non-governmental organizations
and the donor agencies. In the future, a continued research support is also needed to monitor
changes in the production, marketing and consumptions environments and draw implications
for smallholder dairy development.
xix
Options for strategic interventions
Based on the research findings, highlighted below are some strategic interventions suggested
for improving the productivity and market orientation of smallholder dairy producers,
scaling-up of cooperative dairy development activities and promoting dairy products
consumptions.
Supply sideGiven the fact that smallholder dairy farmers own few heads of dairy cows and •increasing the number owned is unlikely due to limited farm sizes, the improvement of dairy cow’s reproductive and productive performances is critical to the smallholder dairy development and competitiveness. There is a need to increase milk yield, reduce age at first calving, shortening calving intervals and increasing the lactation length. It is important to improve smallholder dairy producers’ access to improved dairy breeds, AI services and improved breeding managements. These roles can be played by a mix of different actors (governmental and non-governmental organizations, union of cooperatives, donor agencies, and the private sectors).Improving animal feeds availability and utilization (improved pastures, forage and •fodder crops and crop residues).Improving water supply to dairy farms.•Improving animal health through vaccination and treatments against major diseases •and parasites.Linking smallholder dairy farmers to financial institutions (commercial banks and •micro-finances) in order to invest in improved dairy cows and other important dairy related operations and businesses.Continuous research support in breeding, nutrition, animal health and management.•Extension services in dairy production and management.•
Collective actionTechnical support to the marketing cooperatives is required in several areas: in •cooperative management, financial management and record keeping, milk quality testing, dairy product development and milk collection, storage, transportation and processing.Instituting rigorous quality testing procedures and building cooperatives’ quality •testing capacities in terms of human resources and equipment and facilities. There is also a need to introduce quality based price payments in order to enhance the quality of milk delivered at the milk collection centres.Increasing horizontal integration of cooperative activities: this involves organizing •more smallholder dairy producers into a milk marketing cooperatives in several locations and establishing more milk collection centres for new and existing cooperatives.

xx
Increasing vertical integration and increasing vertical business linkages: strengthening •the already established zonal level union of cooperatives. It is also important to establish and strengthen formal vertical business linkages of the milk marketing cooperatives and union of cooperatives with institutional dairy and dairy product users, processors, supermarkets etc. Improving service provisions to cooperative members (animal health, breeds, feeds, •and technical skills).Improving the hygienic situation of milk collection centres in order to ensure •the safety and quality of dairy and dairy products which build the consumers’ and customers’ confidence in the dairy products produced and handled by the cooperatives. There is a need to provide regular training for the workers at the milk collection centres on hygienic milk handling and milk quality testing.Improving cooperative capacity to collect, store, transport, process more milk from •smallholder farmers, for example, bulk cooling tanks and refrigerated transport facilities. Expanding dairy product ranges available to consumers and customers through value-•adding processing. It is also important to develop brand name (e.g. Arsi Dairy).Improving access to loans for the cooperatives business activities based on careful •financial feasibility assessment of the business plans. Care must be taken in providing free and/or subsidized financial supports which might undermine the sustainability of the cooperative business activities in the long run.Establishing dairy products quality and safety standards and grades.•Formulating and implementing dairy product safety and quality regulations.•
Demand sideImproving availability of safe and quality dairy products at competitive prices.•Increasing ranges of dairy products available to the consumers.•Promoting activities of dairy products to improve utilization.•Providing market information on prices and nutritional and health benefits of dairy •products.Continuous assessment of the market dynamics which guide the production and •marketing strategies and decision-making.
1
1 Introduction1.1 Background
In the context of developing countries, the potential advantages of market-oriented
smallholder dairying in improving the welfare of farm households and its multiplier effects
on other sectors of the economy are well known (Walshe et al. 1991; Hemme et al. 2003;
Bennet et al. 2006). First, it generates income for the farm households on regular basis which
can be used for different purposes, e.g. purchase of goods for household consumption,
school fees and medical expenses. Income generated from the sale of milk can also be
used for productive investment in other farm or non-farm sectors. Second, milk from dairy
production provides a highly nutritious food for people of all age groups and particularly
for infants and lactating mothers thus reducing the problem of malnutrition among rural
households. Third, the value adding activities such as the processing, marketing and
distribution of milk and milk products also create employment opportunities in the rural
and urban sectors. It is also argued that in situations where the arable land is shrinking and
where there is high population density, the dairy farming may be one of the few agricultural
activities that can support viable smallholder farming (Staal et al. 1997). In general, there are
also several other functions attached to the livestock production such as manure production,
store of wealth, risk mitigation, and display of social status (Moll et al. 2007).
Realizing these potential economic and social advantages, FAO in partnership with the
Ministry of Agriculture and Rural Development and Oromia Bureau of Agricultural and Rural
Development initiated the project, ‘improving smallholders’ marketed supply and market
access for dairy and dairy products’ in Arsi Zone. This is a sub-project under the project,
‘crop diversification and marketing development’, which is financed by the governments of
Ethiopia and Italy. The project aims at demonstrating the potential to raise smallholder dairy
farms productivity to commercial level. The project also focuses on those community groups
or individuals with potential to scale up milk production and value addition and links such
farmers to formal markets.
Arsi Zone could be considered one of the most productive agricultural zones in Oromia
Region with a great potential to supply milk to local towns and major urban centres. The
zone is strategically located in terms of its geographic proximity to the major urban centres.
It is well connected to the major cities such as Addis Ababa and Adama through all-weather
roads. This provides the opportunity to expand the market for its dairy and other agricultural
products beyond the local and rural markets to the large urban markets like Addis Ababa and
Adama. A major all-weather road construction is also underway which links the zone to the
major milk deficit towns in the South such as Awaasa, Shashemene, and Bale Robe. There are
other situations that favour increased demand for dairy products produced in the zone such
2
as increased urbanization, population growth, emergence and expansion of supermarkets,
cafés and restaurants and growth in western-style dietary habits requiring dairy and dairy
products as major food ingredients. However, the key question is whether the smallholder
would be able to seize these emerging market opportunities.
To be effective, the on-going FAO project efforts to improve the productivity of smallholder
dairy production and improve its market orientation need to be supported and informed by
detailed understanding of the current conditions of production, marketing and consumption
of milk and dairy products in the area. For example, there is a limited understanding of what
factors can increase the level of commercialization of dairy production in the area. There
is a need for detailed and systematic research to describe the production practices of dairy
producers and identify areas for project interventions. Lack of detailed understanding of local
production and marketing conditions and incorporating these in the development programs
will result in the failure of smallholder dairy interventions.
In order to efficiently and effectively respond to the changes in consumer demands in the
domestic markets, the dairy producers and other market actors require detailed information
on the current milk consumption patterns and food quality and safety requirements of the
consumers. However, there is also lack of in-depth information on the consumption and
expenditure patterns, quality, and health and safety requirements by the dairy consumers in
the project area. For example, how the consumer economic, socioeconomic, demographic
variables impact on the likelihood of purchasing dairy products? What is the current level of
dairy consumption by income groups? In general, there is a need to continuously monitor
the dynamic changes in the consumer demand for milk and milk products quality and safety.
It is also important to assess the market size and prospects for expanding milk production
in the area. In this regard, there is a need to assess the likelihood of locally purchasing and
absorbing an increased dairy production due to project interventions. In other words, what is
the future prospect or outlook for dairy products in the project area?
The small-scale nature of smallholder dairy production could also be one of the factors
limiting dairy producers’ entry into and level of their participation in the emerging milk
markets. It is argued that in many developing countries, milk production remains small-scale,
scattered and poorly integrated to the market chain (Bennet et al. 2006). The implication
of this observation is that smallholder dairy producers face higher transaction costs as
compared to large farms in accessing and competing in the input and output markets due to
their small-scale operations. It has been observed that high transaction costs for production
and marketing limit market participation by asset- and information-poor households (Staal
et al. 1997). In this regard, the milk marketing cooperatives through milk collection centres
provide external economies of scale in the collection, bulking, transporting, processing
3
and marketing of dairy products and provide regular income and sale guarantee to their
members. Lack of economies of scale may also constrain smallholder farmers’ adoption of
new technologies as some of large fixed investments required for dairy operations are not
feasible and profitable at smaller levels of production.
Milk marketing cooperatives can also serve as focal points where the necessary technical
production, marketing and processing and extension services required by milk producers can
be organized by private sector, public sector and non-governmental organizations (NGOs)
with minimum transaction costs. Furthermore, cooperatives can improve the bargaining
power of smallholder dairy producers. The establishment of cooperative union can also
further vertically integrate the smallholder dairy producers in terms of value addition and
marketing activities. In general, the cooperatives represent significant institutional change
which can alter the economic opportunities available to smallholder dairy farmers by
altering the scale of operations. In Arsi Zone, there are several milk cooperatives which
are operational and one zone-level cooperative union is under formation with the support
of FAO project interventions. However, the extent to which cooperatives are fulfilling the
various roles indicated above and the problems they are facing are not well documented.
Detailed information and assessment of cooperatives would assist the designing of
development programs to enhance their role and vertically integrate them.
1.2 Study objectives
The main objective of this study was to provide a comprehensive review documenting dairy
supply and demand and the role of collective action study in Arsi Zone/Ethiopia. The specific
objectives were:
To assess current and prospective demand for milk and milk products in Asella (the •zonal headquarters) and Adama.To assess the current milk production, consumption and marketing behaviour of •farmers in selected woredas taking both participants and non-participants in farmer milk cooperatives in order to asses current and prospective supply of milk.To assess the role of collective action (e.g. farmer groups) and other possible forms in •overcoming problems of remunerative marketing and market access by smallholder milk producers, with a particular focus on the role and implications of gender.
1.3 Outline of the report
The remainder of this report is organized as follows. An overview of the global food system
which sets the context is presented in Section 2. Theoretical and empirical models to model
household milk production and marketing decisions are presented in Section 3. Methods of
data collection and data analyses are presented in Section 4. Results and discussions of the

4
survey findings for producers, cooperatives and consumers are discussed in Sections 5, 6 and
7, respectively. The report ends with conclusions and implications.
5
2 Literature reviewThis section provides an overview of demand driven global food system which sets the
context within which private sector and public sector interventions in the livestock sector
have to be contemplated. It is shown that the global consumption, production and trade of
livestock products in developing countries have increased rapidly in the last two decades and
are expected to continue to rise (Delgado et al. 1999; Delgado 2003; Hall et al. 2004). This
trend has been termed as the ‘livestock revolution’ (Delgado et al. 1999). Factors that have
led to this increased demand include population growth, urbanization, changes in lifestyle
and consumer preferences, rise in incomes in growing urban centres of developing countries,
international influence (globalization and more liberal international trade) and technological
changes in production, communication, and transport sectors (de Haan et al. 2003; Hall et
al. 2004).
There are opportunities and risks created by livestock revolution for smallholder livestock
producers and consumers. The particular opportunities and threats that the global food
market presents to the poor farmers and consumers in developing countries are very well
documented (Faiguenbaum et al. 2002; de Haan et al. 2003; Reardon et al. 2003; Reardon
and Swinnen 2004; Reardon et al. 2004; Reardon and Timmer 2005). The opportunities
could be in the form of increased market outlets for live animals and live animal products,
increased employment opportunities, and improved availabilities of choices and qualities
of products at lower prices to the consumers. Furthermore, it is argued that the changing
consumer preferences in the domestic and export markets have also created an opportunity
for producers to gain new markets and develop niche markets with potential price premiums.
The livestock revolution has also increased the risks and challenges facing smallholders.
At the same time, there have been rising consumer demands for food safety and quality,
enhanced environmental protection and other quality attributes (Hall et al. 2004). Consumers
are demanding food products with certain characteristics, such as products perceived to be
safe, healthy, and convenient or produced in ways that are beneficial to the environment
and take animal welfare and equitable labour concerns into consideration. That is, the
consumers are not only demanding greater choices of food with different characteristics but
also requiring assurances that the products they consume are produced in environmentally
responsible manner and meet ethical standards (e.g. labour and employment standards,
and animal welfare standards). In other words, the consumers want to be knowledgeable or
well informed in terms of how food is produced and issues such as food safety and ethics
requiring information both on product attributes and process attributes.
6
Furthermore, producers are also required to meet an increasing need for supply assurance in
terms of required quantity, quality, space, and time, need to have the flexibility and ability to
respond to the changing consumers’ needs and demographics, increasing product innovation
and differentiation, and increasing competitive pressure to lower systemic costs. Thus, in this
global food market, the challenge facing the producers and processors is how to respond to
these dynamic changes in consumer demands. In general, the traditional way of production
and marketing is challenged.
The required functions and capacitates to enter and maintain a presence in high value
markets are significant. It requires the ability to produce and meet the basic quality standards
and the ability to supply on reliable basis to strict quality, timing, and quality control
requirements, whether in domestic or export markets. The livestock producers must adapt if
they want to capitalize on the opportunities that are available by meeting these consumer
demands or else the producers will be out of the game in the global food markets. There is a
need to bridge the information gap between the producers and consumers in order to build
confidence in the markets. Producers are required to learn new management expertise, new
skills in contract evaluation and negotiation, understand specific quality traits required by
buyer, contractual obligations of both parties and risks involved.
The response of industries to address food quality and safety demands of consumers required
to ensure traceability of the livestock product movements from farm to fork. This response,
in turn, is requiring tighter vertical coordination and concentration of production and
marketing activities among the actors both vertically and horizontally within the chain. In
developed countries like USA, closer vertical coordination has emerged because addressing
the food quality and safety issues result in higher relative transaction costs for the traditional
spot market transactions (Young and Hobbs 2002). Detailed discussion of transaction cost
approach in supply chain management is found in Hobbs (1996). It is argued that the
drivers of change affect the product characteristics and consequently the nature of vertical
coordination from spot market to vertical integration.
The objective to decrease the transaction costs led to the emergence of vertically coordinated
firms and global supermarkets. Through close working relationships or ownership of the
processing and distribution firms are able to tailor their products to the needs of particular
market segments. Thus, communication, coordination, and cooperation are central to
international competitiveness through their effect in reducing transaction costs.
There are several implications of tighter vertical coordination and value chains for
smallholder farmers in developing countries. In general, the potential exclusion of small-
scale producers from the growing market is the main concern for the people concerned
with development of poor farmers in developing countries (Reardon et al. 2003; Reardon
7
et al. 2004). It is argued that the emergence of strict vertical coordination and supermarkets
in response to the forces of globalization and urbanization may force out the small farmers
unless they are able to supply what supermarkets demand.
Furthermore, small farmers are also facing threats of losing traditional domestic market
outlets to supermarkets. This is because an increasing number of urban consumers might
depend on supermarkets rather than traditional markets as their main food sources thus
reducing market outlets for small farmers. There is need for policies and strategies on how to
incorporate small-scale farmers in vertically coordinated commercial livestock production
and marketing systems. There is also need to encourage the development of local market
access and improve opportunities for small-scale farmers. Farmers need access to resources
and training to be able to actively participate in the rapidly transforming domestic and global
livestock and livestock product markets. All these issues point to the need to understand
the patterns of value-chain organizations and involvement of small-scale producers which
is crucial in designing successful interventions. Intervention strategies and policies to
enhance small farmers’ participation in the domestic and export markets needs to be
informed regarding where and how to intervene to enable the small farmers to gain from the
participation in the high value chain market on a sustainable basis.
In general, the need to meet diverse consumer demand requires commercial interactions and
coordination along the value chain which is central to competitiveness in the global food
market. Value chains are evolving in order to ensure adherence to food safety regulations,
provide food quality assurance and allow traceability. Many development interventions also
consider the value chain approach to be an important entry point for small farmers, either
individually or collectively, into the high-value domestic and export markets.
In general, new strategic approach is required. Building up farmers’ production capabilities
is no longer sufficient to ensure sustainable income growth. Availability of land and the
climate conditions within a given country represent a competitive advantage for raising
cattle. Nonetheless, there are several constraints for the country to achieve real competitive
advantages due to the lack of coordination and efficient governance of the product chain
(Zylbersztajn and Filho 2003). Producer-support activities must be linked to market demand
and that farm-level activities must be looked at within the context of the whole value chain
and the linkages within that chain. Thus, the main argument is that value coordination must
be taken as one of the sources of competitive advantage.
8
3 Modelling household marketing and consumption decisions3.1 Theoretical framework
Theoretical framework used in modelling farm households’ choice of whether to enter into
dairy products markets and their choice of the level of market participation is conditional
upon their entry into the market (Key et al. 2000). This theoretical framework extends the
standard household model by incorporating the assumption that households face large
transaction costs in food markets which influence their decision to enter into the market and
their level of market participation conditional upon their entry into the market. In this regard,
Key et al. (2000) identified two types of transaction costs: fixed and proportional transaction
costs. Fixed transaction costs are assumed to determine household’s decision whether or not
to enter into the market. Often the problem is that high fixed transaction costs can result in
market failure in which case the households fail to enter into the market. For example, high
fixed transaction costs due to lack of transport and communication infrastructure, distance
and/or trade barriers make costly for the households to discover trading opportunities and
hence fail to enter into the market. On the other hand, proportional transaction costs are
costs which vary with the volume of transaction and determine households’ decisions on by
how much to participate in the market conditional upon their market participation decisions.
Some of the recent applications of the extended standard household model include Heltberg
and Tarp (2002), Lapar et al. (2003), Holloway et al. (2004) and Bellemare and Barrett (2006).
Barrett (2008) also provided a recent detailed review and synthesis of market participation
literature.
One of the key concepts related to the existence of transaction costs is that with large
transaction costs in the food market, the purchase price for food (Pb) is substantially higher
than the price received (Ps) by a potential seller, i.e. transaction costs create bands between
purchase and sale prices (Sadoulet and de Janvry 1995). Higher transaction costs increase the
margin between buyer and seller prices. Thus, when food is traded, the decision price is the
market price facing the buyer or the seller and when food is not traded, the decision price is
the unobservable internal shadow price (P*). From this it follows that at a given point in time
the household optimally chose to be a buyer only when the purchase price is lower than its
own shadow price, and to be a seller only when the sale price is higher than its own shadow
price. Thus, the empirical models to investigate household’s optimum choices whether to
enter into the market and their level of market participation conditional upon their entry into
the market have to take into account the existence of these two types of transaction costs.
9
3.2 Specifications of empirical models
In this study, the specifications of the empirical models used to determine the factors
influencing households’ decision to enter into the market and their level of participation in
the market conditional upon their entry into the market follows the selectivity models widely
discussed in the market participation literature (e.g. Gotez 1992; Key et al. 2000; Heltberg
and Trap 2002; Holloway et al. 2004; Bellemare and Barrett 2006). In selectivity models, the
decision to participate in the market can be seen as a sequential two-stage decision-making
process due to the influence of various types of transaction costs on household market
participation decisions. In the first stage, farm households make a discrete decision whether
or not to participate in the market. As discussed above, this decision is mainly influenced by
fixed transaction costs. In the second stage, conditional on their decision to enter into the
market, the households make a continuous decision on the level of their participation in the
market, e.g. how much fresh milk to sell or how much fresh milk to consume. This decision
is mainly influenced by the variable transaction costs. In the first stage, we used the standard
probit model to analyse the household’s discrete decision to enter into in the market. In the
second stage, we used the censored regression model with correction for selection bias to
model the effects of variables influencing the level of market participation in terms of the
quantities of a given product sold. Similar modelling approach is also used to analyse the
household consumption decision. Consumption decision can also be considered as a two-
stage decision-making process in which case the households first decide whether or not to
purchase a given dairy product and in the second stage, conditional upon their decision to
purchase, the households decide on the level of their consumption. Specifications for the
empirical probit and censored regression models are discussed next. Standard probit model
to assess the household market-entry (purchase or consumption) decision follows random
utility model and its specification is given below following Wooldridge (2003).
0001
'
*
*1
*
≤=
>=
+=
yifyyify
zy (1)
where, y* is a latent (unobservable) variable representing households’ discrete decision
whether or not to participate in the market, it is associated with the desired level of
participation or utility derived from market participation; z is a vector of independent
variables hypothesized to affect household’s decision to participate in the market; is
a vector of parameters to be estimated which measure the effects of various explanatory
variables on the household’s decision whether to participate in the market; 1 is normally
distributed disturbance term with zero mean and constant standard deviation of 1, the
10
disturbance term captures all unmeasured variables that influence the likelihood of the
producer’s decision to participate in the market; y is a discrete response (dependent) variable
for status of households’ participation in the market which takes on the value of 1 if the
household participates in the market and 0 otherwise. If some of z is endogenous, the probit
parameter estimates are not consistent.
Standard normal density functions or the probability of the farm household choosing and not
choosing to participate in the market are given, respectively, as:
)'(1)0()0(
)'()0()1(
*
*
zyPyP
zyPyP
F−=≤==
F=== (2)
Signs of parameter estimates and statistical significance of the coefficients from the probit
model estimation indicate the direction of the response associated with the presence or level
of a particular variable. For example, positive parameter estimate of a given variable indicates
that the probability of a farm household choosing to participate in a market increases with
the presence or level of that variable while a negative parameter estimate has the opposite
effect. However, the probit parameter estimate does not show by how much a particular
variable increases or decreases the likelihood of choosing to participate in the market. For
this purpose we need to calculate the marginal effects of the independent variables on the
probability of household to choose to participate in the market. For continuous independent
variables, the marginal effect of the probit model is calculated by multiplying the coefficient
estimate ( ) by the standard probability density function given above by holding the other
independent variables at their mean values:
)'()1( zzyP
F=∂
=∂ (3)
On the other hand, the marginal effects of the dummy independent variables are analysed
by comparing the probabilities that result when the dummy variables take their two
different values while holding all other independent variables at their sample mean values
(Wooldridge 2002). Finally, the log-likelihood function which is maximized to obtain the
parameter estimates and the corresponding marginal effects for the probit model is given as:
))'(1ln()'(ln(),(01 ∑∑ ==
F−+F=yy
zzzyLLn (4)
11
Probit model is estimated using maximum likelihood estimation commands given in STATA
Version 10. ML estimates are consistent, asymptotically normal, and asymptotically efficient.
Conditional on the decision to enter into the market, the variables influencing household
market participation (quantity of milk sold or consumed) in the market is modelled using
Tobit or censored regression model. Tobit model was developed by Tobin (1958) for a
situation where the dependent variable is censored from above, below, or both. It is indicated
that in a situation where the dependent variable is censored the Ordinary Least Squares
estimators are biased downwards and the use of Tobit regression model is recommended
(Green 1993). In our case, the dependent variables (the amount of dairy and dairy products
marketed or consumed) involve lower limit censoring at zero for a significant fraction of
the observations. Greene (1993) argued that when the dependent variable is censored the
conventional regression methods fail to account for the qualitative difference between limit
(zero) observations and non-limit (continuous) observations. Therefore, the Tobit model is
estimated using the maximum likelihood method and is given as follows:
00
0
'
*
**2
*
≤=
=
+=
vifvvifvv
xv
i
i (5)
where v* is a latent variable representing the desired or optimal sale or consumption level
of household which is observed if v* > 0 and unobserved otherwise; v is the observed
quantity of a given dairy product sold or consumed depending on whether the household is
a dairy producer or a consumer; x is a vector of independent variables affecting the level of
household’s participation in the market which is a subset of z; is a vector of parameters to
be estimated; and 2 is assumed to be independently normally distributed disturbance term
with zero mean and constant standard deviation of 2. According to this specification, the
observed sale (or consumption) is equal to the desired sale (or consumption) if the desired
sale or consumption is greater than zero. Otherwise, zero sale or consumption is observed.
Furthermore, the desired purchase or sale can take on negative values; however, values of
v* less than or equal to zero are unobserved, hence v* is censored at zero. Condition for the
censored regression model is that at least some of the observations must be censored, or v*
would always equal to v and the true model would be a linear regression instead of being
Tobit regression model.
Because v* is normally distributed, v has a continuous distribution over strictly positive
values. There are two important density functions for Tobit estimation. First, the density of v
equal to zero given x is given as:
12
F===
'-1x)|0()|0( * xvPxvP (6)
Second, the density of v given x for v greater than zero is given as:
)]/'[(1)0()0( * xvxvPxvP −== (7)
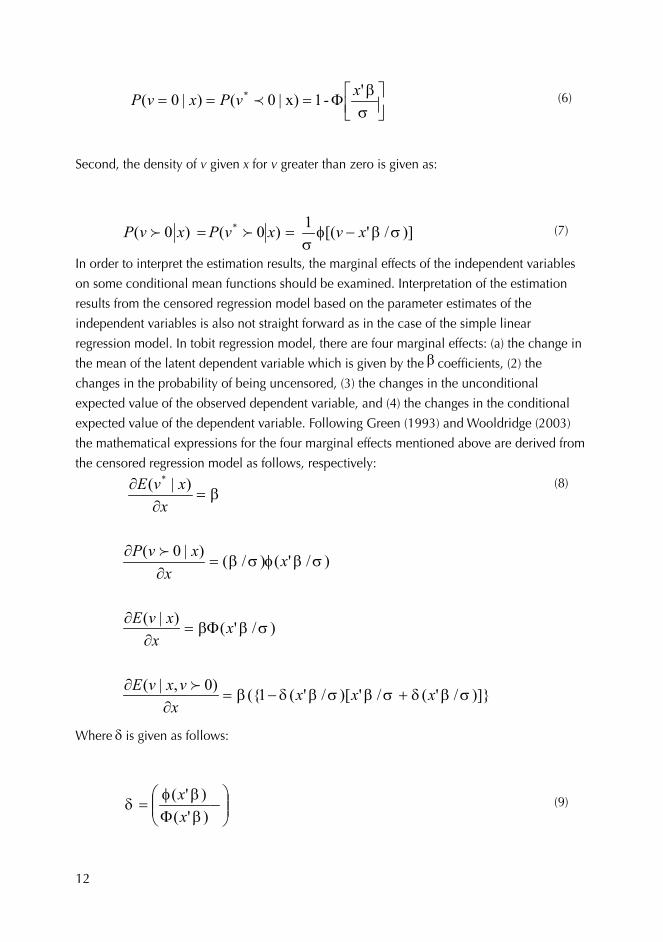
In order to interpret the estimation results, the marginal effects of the independent variables
on some conditional mean functions should be examined. Interpretation of the estimation
results from the censored regression model based on the parameter estimates of the
independent variables is also not straight forward as in the case of the simple linear
regression model. In tobit regression model, there are four marginal effects: (a) the change in
the mean of the latent dependent variable which is given by the coefficients, (2) the
changes in the probability of being uncensored, (3) the changes in the unconditional
expected value of the observed dependent variable, and (4) the changes in the conditional
expected value of the dependent variable. Following Green (1993) and Wooldridge (2003)
the mathematical expressions for the four marginal effects mentioned above are derived from
the censored regression model as follows, respectively:
)]}/'(/')[/'(1({)0,|(
)/'()|(
)/'()/()|0(
)|( *
xxxx
vxvE
xx
xvE
xx
xvP
xxvE
+−=∂
∂
F=∂
∂
=∂
∂
=∂
∂
(8)
Where δ is given as follows:
F
=)'()'(
xx (9)
13
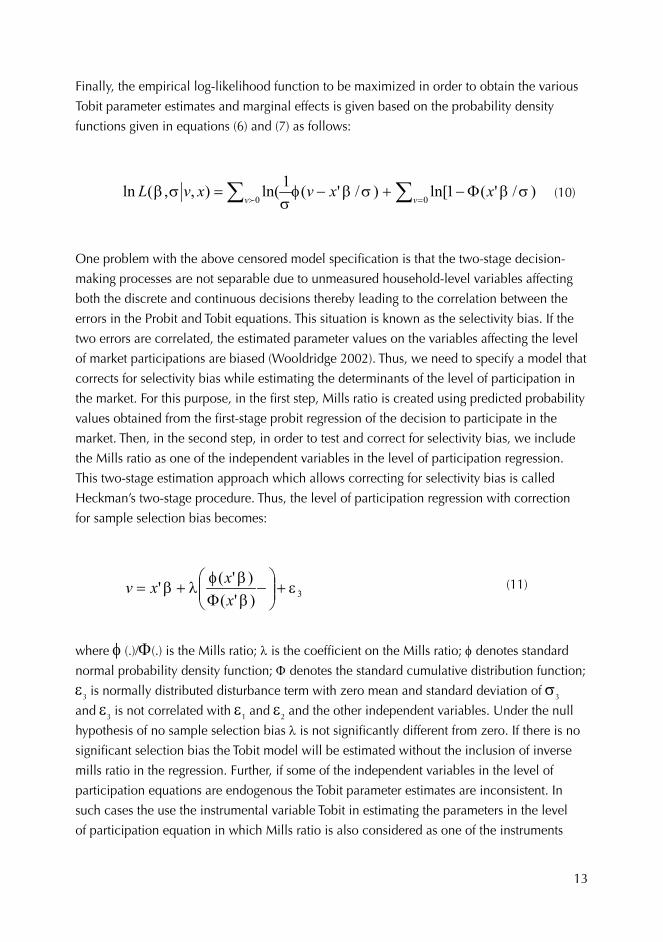
Finally, the empirical log-likelihood function to be maximized in order to obtain the various
Tobit parameter estimates and marginal effects is given based on the probability density
functions given in equations (6) and (7) as follows:
∑∑ =F−+−=
00)/'(1ln[)/'(1ln(),,(ln
vvxxvxvL
(10)
One problem with the above censored model specification is that the two-stage decision-
making processes are not separable due to unmeasured household-level variables affecting
both the discrete and continuous decisions thereby leading to the correlation between the
errors in the Probit and Tobit equations. This situation is known as the selectivity bias. If the
two errors are correlated, the estimated parameter values on the variables affecting the level
of market participations are biased (Wooldridge 2002). Thus, we need to specify a model that
corrects for selectivity bias while estimating the determinants of the level of participation in
the market. For this purpose, in the first step, Mills ratio is created using predicted probability
values obtained from the first-stage probit regression of the decision to participate in the
market. Then, in the second step, in order to test and correct for selectivity bias, we include
the Mills ratio as one of the independent variables in the level of participation regression.
This two-stage estimation approach which allows correcting for selectivity bias is called
Heckman’s two-stage procedure. Thus, the level of participation regression with correction
for sample selection bias becomes:
3)'()'(' +
F
+=xxxv (11)
where f (.)/F(.) is the Mills ratio; l is the coefficient on the Mills ratio; f denotes standard
normal probability density function; F denotes the standard cumulative distribution function;
e3 is normally distributed disturbance term with zero mean and standard deviation of s3
and e3 is not correlated with e1 and e2 and the other independent variables. Under the null
hypothesis of no sample selection bias l is not significantly different from zero. If there is no
significant selection bias the Tobit model will be estimated without the inclusion of inverse
mills ratio in the regression. Further, if some of the independent variables in the level of
participation equations are endogenous the Tobit parameter estimates are inconsistent. In
such cases the use the instrumental variable Tobit in estimating the parameters in the level
of participation equation in which Mills ratio is also considered as one of the instruments

14
is recommended. Maximum likelihood Tobit estimation is implemented using STATA
econometric software version 10. Validity of normality and heteroskedasticity assumptions
are critical to the Tobit model estimations. Since heteroskedasticity problem is very evident
in cross-sectional data the standard error estimation for Tobit model was made under the
assumption that the standard errors are not constant using interval regression method in
STATA.
15
4 Data collection and analysisThree formal surveys were conducted in this study: smallholder dairy producers, dairy
marketing cooperatives and urban consumers. The main data collected from the producer
survey were related to household demographics, dairy production, marketing and
consumption behaviour (de Janvry et al. 1991). Data collected from the consumer survey
focused on the household demographics, dairy purchasing behaviour and consumption
patterns. The survey of dairy marketing cooperatives concentrated on generating information
that can be used to assess the opportunities and challenges of collective action in the
commercialization of smallholder dairy production. In addition to the administration of
the three formal surveys, several informal interviews were conducted with officials and key
informants in Arsi Zone in order to obtain supplementary information. Additional secondary
data at the zonal and lower administrative levels were also collected. The following sections
discuss in detail the sampling procedure used.
4.1 Dairy producer survey
There are seven districts in Arsi Zone which are covered by the FAO crop diversification
and marketing development project: Tiyo, Hetosa, Dodota, Bekoji, Munesa, Digelu Tijo
and Lemu Bilbilo. Secondary data obtained from the zonal office and collected by FAO
project personnel in the field, together with information obtained from the field visits by the
research team were used to determine the appropriate sampling procedure. Some of the key
secondary data used for the sampling purpose include: list of project districts, number and
list of peasant associations by districts and number of dairy marketing cooperatives active by
districts and peasant associations.
The survey used a multistage stratified sampling along the administrative structure and
membership in a dairy marketing cooperative. In general, the study districts were similar in
terms of their agro-climatic conditions, production and marketing patterns and marketing
infrastructure. Therefore, there was no need to include all the project districts in sampling
of dairy producers. Thus, in the first stage, three project districts with active dairy marketing
cooperatives (Tiyo, Digelu Tijo and Bekoji) were purposively selected.
In the second stage, a list of all of the peasant associations for these three districts was
obtained. For each peasant associations in each district, information was obtained on
whether the cooperatives were active. The three districts were further subdivided into peasant
associations with and without active dairy marketing cooperatives and peasant associations
were randomly selected from each group. Households in areas where cooperatives were
active were classified as cooperative members or non-members and households were
sampled from these two groups. Households were also sampled from peasant associations
16
where cooperatives were not active. Thus, 17 peasant associations were sampled from the
three districts and cooperatives were active in 11 of these.
4.2 Milk collection cooperative survey
There were 24 dairy marketing cooperatives in 5 of the 7 FAO project districts at the time of
this study. Distribution of dairy marketing cooperatives varied among the project districts;
there were seven each in Lemu Bilbilo and Tiyo, five in Munesa, four in Hetosa and only
one in Digelu Tijo. There was only one cooperative per peasant association and one milk
collection centre per cooperative. All dairy marketing cooperatives were surveyed by
structured questionnaire and interviews of cooperative officers or managers. Also examined
were cooperative records on income and expenditure related to dairy production and
marketing activities.
4.3 Urban consumer survey
Consumer survey was designed to provide representative household milk consumption
data for Assella and Adama towns. This required stratifying each town in order to draw
representative samples. Stratification took into account the different economic structure,
income group, religion etc. of the town in order to draw samples from different strata. Based
on discussions with officials in Asella and Adama town municipalities, households were
classified into three income groups based on their location of residence which reflects their
income status. In the second stage, list of kebeles in each stratum were obtained and sample
of kebeles were selected. Finally, the sample households were selected from the selected
kebeles using systematic sampling procedure. Total sample size was 200 households, 100
from each town. In terms of the income groups, the proportion of low-, middle- and high-
income households included in the survey was 49%, 23% and 28%, respectively. These
proportions were also determined based on the discussion with the municipalities in each
town.

17
5 Empirical results for dairy producer survey5.1 Introduction
Smallholder dairy production and marketing is still at early stage of development in Ethiopia
and understanding the existing dairy production and marketing system is critical in designing
and implementing dairy development programs. In this section, we provide the discussion
of the results of descriptive and econometric analyses of smallholder dairy production and
marketing systems in Arsi Zone. The results may also have implications for other similar areas
in Ethiopia. The results are based on a sample survey of cross-sections of 200 smallholder
dairy producers conducted in June and July 2008. The major objective of this study is to
identify factors that enhance or inhibit smallholder dairy producer’s decision to participate
in the market and their level of market participation. In other words, what are the drivers
of commercialization of smallholder dairy production? Identifying these factors is useful
in designing and implementing appropriate dairy development policies and institutions in
order to improve market orientation of smallholder dairy producers. In this regard, one of the
key research questions in the smallholder dairy producer survey was that what is the effect
of dairy producer’s membership in a cooperative on the dairy producer’s likelihood to sell
dairy products and, conditional on decision to sell, on the quantities of dairy products sold?
Thus, the discussions of the results of descriptive analyses are provided for the whole sample
and by cooperative membership status. This grouping provides a general insight on how the
members and non-members of milk marketing cooperatives are different in terms of their
milk production and marketing behaviour.
5.2 Results of descriptive analysis5.2.1 Productivity of smallholder dairy production system
Size of livestock holdings for sample dairy producers in Arsi Zone by their status of
membership in a milk marketing cooperative is summarized in Table 1. Sampled dairy
producers own an average of 11 head of cattle, with cooperative members owning relatively
more animals than non-members. There was no statistically significant difference between
members and non-members of cooperatives in terms of the size of holdings for different
livestock species except for crossbred cows. Additionally, cooperative members own
significantly more crossbred cows than non-members.
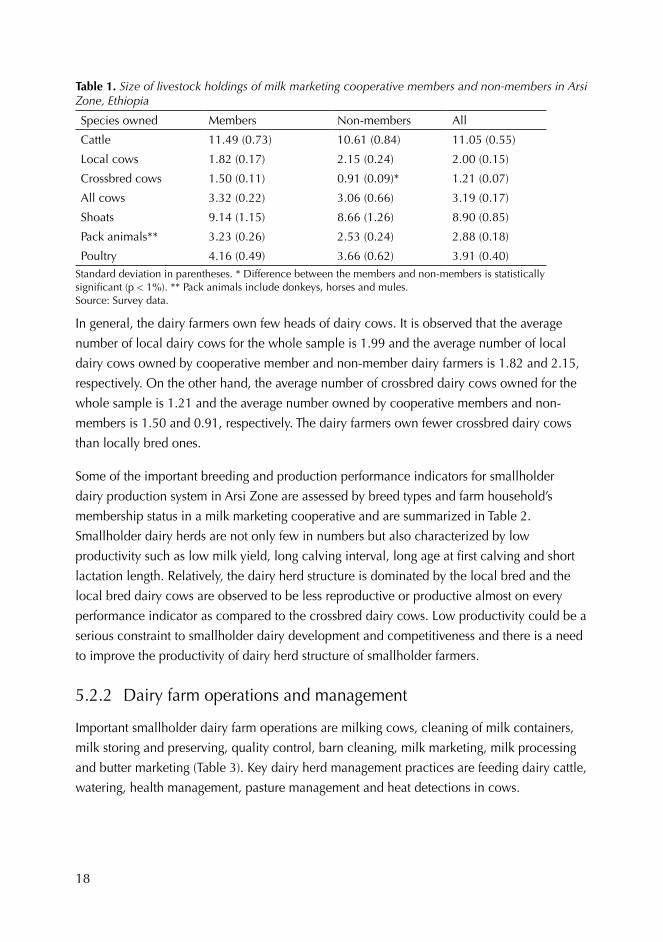
18
Table 1. Size of livestock holdings of milk marketing cooperative members and non-members in Arsi Zone, Ethiopia
Species owned Members Non-members All
Cattle 11.49 (0.73) 10.61 (0.84) 11.05 (0.55)
Local cows 1.82 (0.17) 2.15 (0.24) 2.00 (0.15)
Crossbred cows 1.50 (0.11) 0.91 (0.09)* 1.21 (0.07)
All cows 3.32 (0.22) 3.06 (0.66) 3.19 (0.17)
Shoats 9.14 (1.15) 8.66 (1.26) 8.90 (0.85)
Pack animals** 3.23 (0.26) 2.53 (0.24) 2.88 (0.18)
Poultry 4.16 (0.49) 3.66 (0.62) 3.91 (0.40)Standard deviation in parentheses. * Difference between the members and non-members is statistically significant (p < 1%). ** Pack animals include donkeys, horses and mules. Source: Survey data.
In general, the dairy farmers own few heads of dairy cows. It is observed that the average
number of local dairy cows for the whole sample is 1.99 and the average number of local
dairy cows owned by cooperative member and non-member dairy farmers is 1.82 and 2.15,
respectively. On the other hand, the average number of crossbred dairy cows owned for the
whole sample is 1.21 and the average number owned by cooperative members and non-
members is 1.50 and 0.91, respectively. The dairy farmers own fewer crossbred dairy cows
than locally bred ones.
Some of the important breeding and production performance indicators for smallholder
dairy production system in Arsi Zone are assessed by breed types and farm household’s
membership status in a milk marketing cooperative and are summarized in Table 2.
Smallholder dairy herds are not only few in numbers but also characterized by low
productivity such as low milk yield, long calving interval, long age at first calving and short
lactation length. Relatively, the dairy herd structure is dominated by the local bred and the
local bred dairy cows are observed to be less reproductive or productive almost on every
performance indicator as compared to the crossbred dairy cows. Low productivity could be a
serious constraint to smallholder dairy development and competitiveness and there is a need
to improve the productivity of dairy herd structure of smallholder farmers.
5.2.2 Dairy farm operations and management
Important smallholder dairy farm operations are milking cows, cleaning of milk containers,
milk storing and preserving, quality control, barn cleaning, milk marketing, milk processing
and butter marketing (Table 3). Key dairy herd management practices are feeding dairy cattle,
watering, health management, pasture management and heat detections in cows.
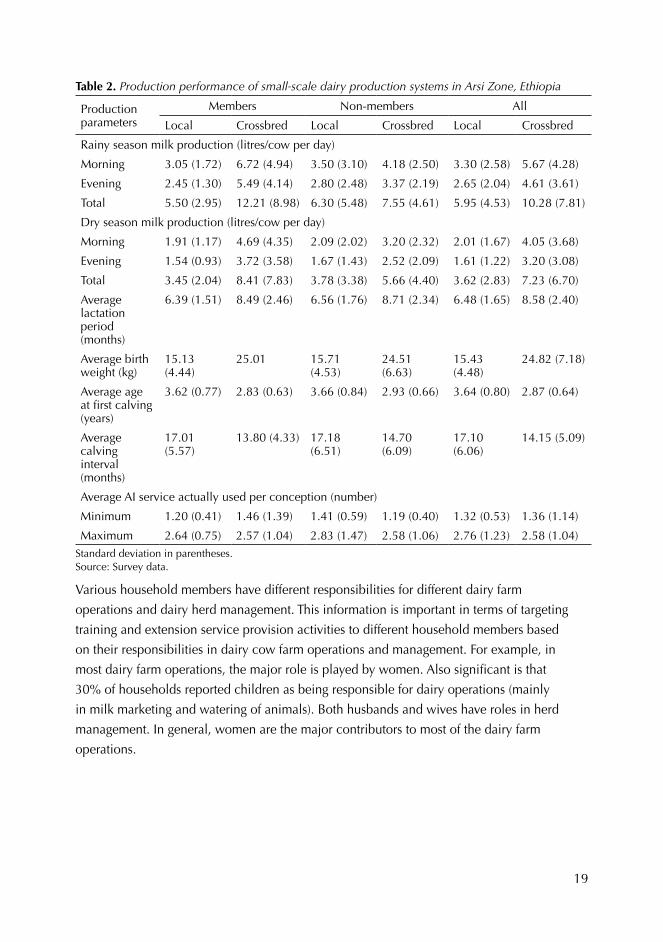
19
Table 2. Production performance of small-scale dairy production systems in Arsi Zone, Ethiopia
Production parameters
Members Non-members All
Local Crossbred Local Crossbred Local Crossbred
Rainy season milk production (litres/cow per day)
Morning 3.05 (1.72) 6.72 (4.94) 3.50 (3.10) 4.18 (2.50) 3.30 (2.58) 5.67 (4.28)
Evening 2.45 (1.30) 5.49 (4.14) 2.80 (2.48) 3.37 (2.19) 2.65 (2.04) 4.61 (3.61)
Total 5.50 (2.95) 12.21 (8.98) 6.30 (5.48) 7.55 (4.61) 5.95 (4.53) 10.28 (7.81)
Dry season milk production (litres/cow per day)
Morning 1.91 (1.17) 4.69 (4.35) 2.09 (2.02) 3.20 (2.32) 2.01 (1.67) 4.05 (3.68)
Evening 1.54 (0.93) 3.72 (3.58) 1.67 (1.43) 2.52 (2.09) 1.61 (1.22) 3.20 (3.08)
Total 3.45 (2.04) 8.41 (7.83) 3.78 (3.38) 5.66 (4.40) 3.62 (2.83) 7.23 (6.70)
Average lactation period (months)
6.39 (1.51) 8.49 (2.46) 6.56 (1.76) 8.71 (2.34) 6.48 (1.65) 8.58 (2.40)
Average birth weight (kg)
15.13 (4.44)
25.01 15.71 (4.53)
24.51 (6.63)
15.43 (4.48)
24.82 (7.18)
Average age at first calving (years)
3.62 (0.77) 2.83 (0.63) 3.66 (0.84) 2.93 (0.66) 3.64 (0.80) 2.87 (0.64)
Average calving interval (months)
17.01 (5.57)
13.80 (4.33) 17.18 (6.51)
14.70 (6.09)
17.10 (6.06)
14.15 (5.09)
Average AI service actually used per conception (number)
Minimum 1.20 (0.41) 1.46 (1.39) 1.41 (0.59) 1.19 (0.40) 1.32 (0.53) 1.36 (1.14)
Maximum 2.64 (0.75) 2.57 (1.04) 2.83 (1.47) 2.58 (1.06) 2.76 (1.23) 2.58 (1.04)Standard deviation in parentheses. Source: Survey data.
Various household members have different responsibilities for different dairy farm
operations and dairy herd management. This information is important in terms of targeting
training and extension service provision activities to different household members based
on their responsibilities in dairy cow farm operations and management. For example, in
most dairy farm operations, the major role is played by women. Also significant is that
30% of households reported children as being responsible for dairy operations (mainly
in milk marketing and watering of animals). Both husbands and wives have roles in herd
management. In general, women are the major contributors to most of the dairy farm
operations.
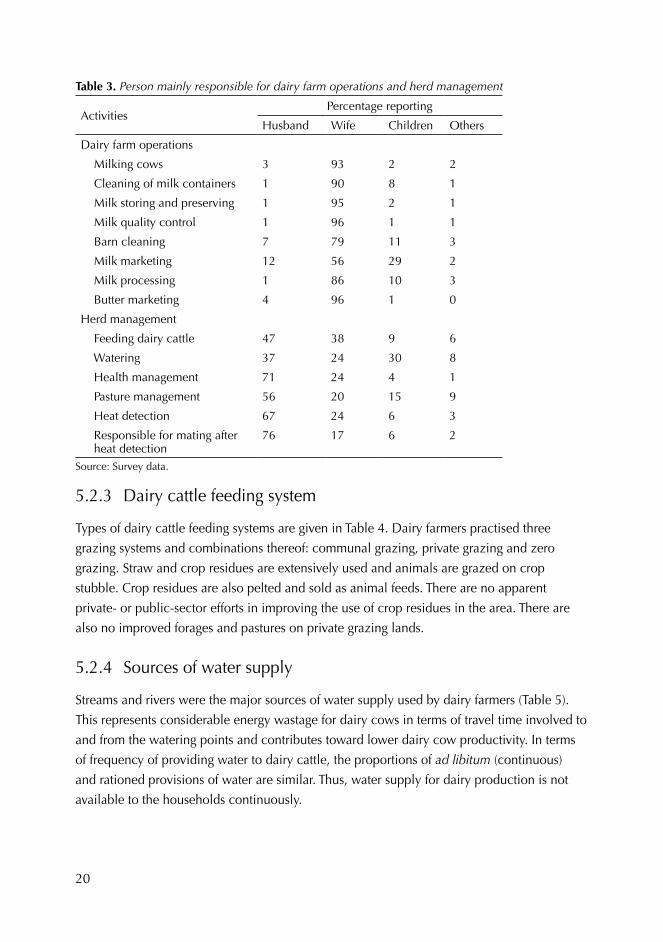
20
Table 3. Person mainly responsible for dairy farm operations and herd management
ActivitiesPercentage reporting
Husband Wife Children Others
Dairy farm operations
Milking cows 3 93 2 2
Cleaning of milk containers 1 90 8 1
Milk storing and preserving 1 95 2 1
Milk quality control 1 96 1 1
Barn cleaning 7 79 11 3
Milk marketing 12 56 29 2
Milk processing 1 86 10 3
Butter marketing 4 96 1 0
Herd management
Feeding dairy cattle 47 38 9 6
Watering 37 24 30 8
Health management 71 24 4 1
Pasture management 56 20 15 9
Heat detection 67 24 6 3
Responsible for mating after heat detection
76 17 6 2
Source: Survey data.
5.2.3 Dairy cattle feeding system
Types of dairy cattle feeding systems are given in Table 4. Dairy farmers practised three
grazing systems and combinations thereof: communal grazing, private grazing and zero
grazing. Straw and crop residues are extensively used and animals are grazed on crop
stubble. Crop residues are also pelted and sold as animal feeds. There are no apparent
private- or public-sector efforts in improving the use of crop residues in the area. There are
also no improved forages and pastures on private grazing lands.
5.2.4 Sources of water supply
Streams and rivers were the major sources of water supply used by dairy farmers (Table 5).
This represents considerable energy wastage for dairy cows in terms of travel time involved to
and from the watering points and contributes toward lower dairy cow productivity. In terms
of frequency of providing water to dairy cattle, the proportions of ad libitum (continuous)
and rationed provisions of water are similar. Thus, water supply for dairy production is not
available to the households continuously.
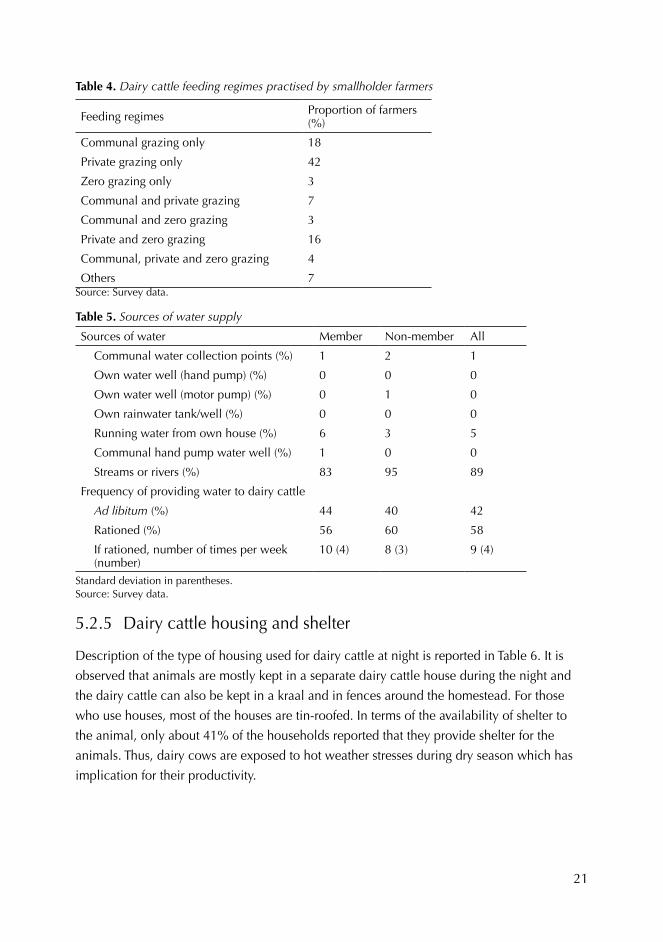
21
Table 4. Dairy cattle feeding regimes practised by smallholder farmers
Feeding regimes Proportion of farmers (%)
Communal grazing only 18
Private grazing only 42
Zero grazing only 3
Communal and private grazing 7
Communal and zero grazing 3
Private and zero grazing 16
Communal, private and zero grazing 4
Others 7Source: Survey data.
Table 5. Sources of water supply
Sources of water Member Non-member All
Communal water collection points (%) 1 2 1
Own water well (hand pump) (%) 0 0 0
Own water well (motor pump) (%) 0 1 0
Own rainwater tank/well (%) 0 0 0
Running water from own house (%) 6 3 5
Communal hand pump water well (%) 1 0 0
Streams or rivers (%) 83 95 89
Frequency of providing water to dairy cattle
Ad libitum (%) 44 40 42
Rationed (%) 56 60 58
If rationed, number of times per week (number)
10 (4) 8 (3) 9 (4)
Standard deviation in parentheses. Source: Survey data.
5.2.5 Dairy cattle housing and shelter
Description of the type of housing used for dairy cattle at night is reported in Table 6. It is
observed that animals are mostly kept in a separate dairy cattle house during the night and
the dairy cattle can also be kept in a kraal and in fences around the homestead. For those
who use houses, most of the houses are tin-roofed. In terms of the availability of shelter to
the animal, only about 41% of the households reported that they provide shelter for the
animals. Thus, dairy cows are exposed to hot weather stresses during dry season which has
implication for their productivity.

22
Table 6. Type of housing for dairy cattle and whether shelter is used during the day
Member Non-member All
Inside family house (%) 5 8 6
Separate dairy cattle house (%) 83 68 75
Kraal (%) 17 20 18
Fenced homestead (%) 14 27 20
If housed, nature of roof
Thatched (%) 52 54 53
Tin (%) 33 19 26
Shelter available for animals during the day (% )
55 27 41
Source: Survey data.
5.2.6 Breeding methods and service providers
Local breeding methods practised by dairy farmers are given in Table 7. Dairy farmers
practice three breeding methods: crossbred bulls, indigenous bulls and artificial insemination
(AI). Across the whole sample, the private sector is the most important service provider for
crossbred and indigenous bulls while more than 95% reported the AI service is provided
by the government. AI service centre is on average 6 km away from the farmers’ residence.
NGOs are also involved in bull service provision. On average, there were more AI services
per conception than natural services probably due to poor AI techniques, poor quality semen
or poor heat detection techniques.
5.2.7 Disease and parasite control practices for dairy cattle
Dairy farmers’ disease and parasite control practices for dairy cattle and the costs incurred
are given in Table 8. Dairy farmers are characterized by limited control of dairy cattle
diseases and parasites. Across the whole sample, it is observed that vaccination against major
diseases such as foot-and-mouth disease, black leg, anthrax and lumpy skin diseases are
practised by less than 55% of the households. Similarly, the proportion of households who
treat dairy cattle against worms and parasites, mastitis, brucellosis and salmonellosis is very
low (less than 25%). Most of the households disinfect the udder with hot water and soap.

23
Tabl
e 7.
Loc
al b
reed
ing
met
hods
pra
ctis
ed b
y se
rvic
e pr
ovid
ers,
dis
tanc
es fr
om th
e fa
rm, r
ate
of c
once
ptio
n an
d pa
ymen
ts
Item
sM
embe
rN
on-m
embe
rA
ll
Cro
ssbr
ed
bulls
Loca
l bul
lsA
IC
ross
bred
bu
llsLo
cal b
ulls
A
IC
ross
bred
bu
llsLo
cal b
ulls
AI
Serv
ice
prov
ider
s (%
yes
)
Gov
ernm
ent
125
958
710
010
696
.67
Priv
ate
agen
cy46
405
6845
055
433.
33
Ow
n20
400
1324
017
31
NG
Os
2215
010
240
1720
Dis
tanc
e fr
om h
ome
(km
)1.
8 (3
.0)
4.4
(12.
0)5.
8 (5
.3)
2.1
(2.9
)0.
6 (0
.9)
6.7
(10.
3)2.
0 (3
.0)
2.4
(8.3
)6.
14 (7
.54)
Serv
ice
per
conc
eptio
n (n
umbe
r)1.
7 (0
.7)
1.7
(0.7
)2.
4 (1
.3)
1.8
(1.0
)1.
6 (0
.9)
2.6
(1.5
)1.
7 (0
.8)
1.6
(0.8
)2.
48 (1
.33)
Paym
ent i
n 19
99 E
C (E
TB/
serv
ice)
5.4
(1.6
)10
.0 (8
.8)
5.4
(1.1
)6.
3 (2
.7)
4.5
(2.1
)5.
7 (0
.6)
5. 8
(2.1
)7.
8 (6
.9)
5.50
(0.9
4)
Stan
dard
dev
iatio
n in
par
enth
eses
. So
urce
: Sur
vey
data
.
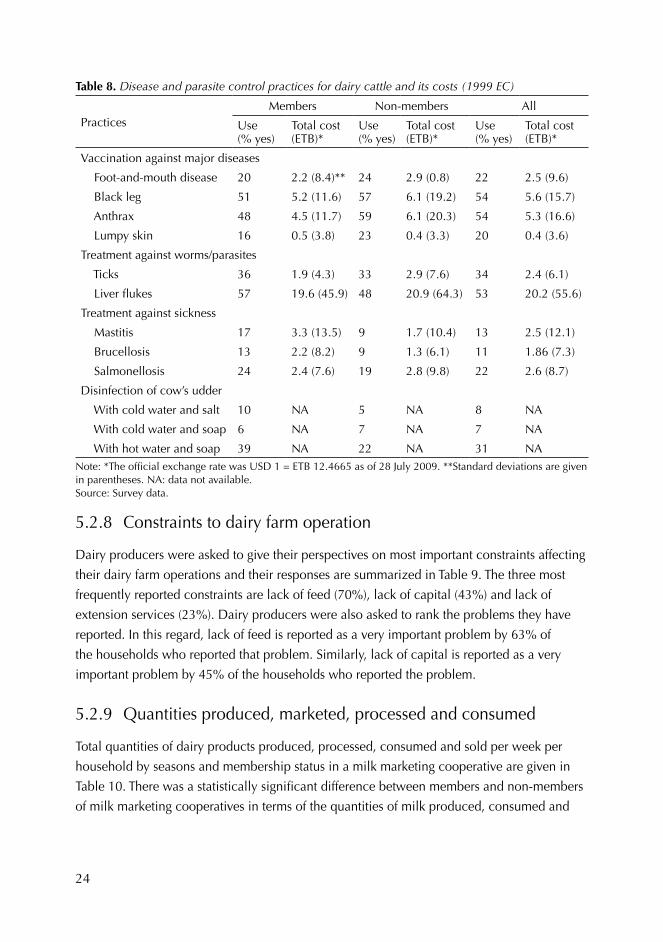
24
Table 8. Disease and parasite control practices for dairy cattle and its costs (1999 EC)
PracticesMembers Non-members All
Use (% yes)
Total cost (ETB)*
Use (% yes)
Total cost (ETB)*
Use (% yes)
Total cost (ETB)*
Vaccination against major diseases
Foot-and-mouth disease 20 2.2 (8.4)** 24 2.9 (0.8) 22 2.5 (9.6)
Black leg 51 5.2 (11.6) 57 6.1 (19.2) 54 5.6 (15.7)
Anthrax 48 4.5 (11.7) 59 6.1 (20.3) 54 5.3 (16.6)
Lumpy skin 16 0.5 (3.8) 23 0.4 (3.3) 20 0.4 (3.6)
Treatment against worms/parasites
Ticks 36 1.9 (4.3) 33 2.9 (7.6) 34 2.4 (6.1)
Liver flukes 57 19.6 (45.9) 48 20.9 (64.3) 53 20.2 (55.6)
Treatment against sickness
Mastitis 17 3.3 (13.5) 9 1.7 (10.4) 13 2.5 (12.1)
Brucellosis 13 2.2 (8.2) 9 1.3 (6.1) 11 1.86 (7.3)
Salmonellosis 24 2.4 (7.6) 19 2.8 (9.8) 22 2.6 (8.7)
Disinfection of cow’s udder
With cold water and salt 10 NA 5 NA 8 NA
With cold water and soap 6 NA 7 NA 7 NA
With hot water and soap 39 NA 22 NA 31 NANote: *The official exchange rate was USD 1 = ETB 12.4665 as of 28 July 2009. **Standard deviations are given in parentheses. NA: data not available. Source: Survey data.
5.2.8 Constraints to dairy farm operation
Dairy producers were asked to give their perspectives on most important constraints affecting
their dairy farm operations and their responses are summarized in Table 9. The three most
frequently reported constraints are lack of feed (70%), lack of capital (43%) and lack of
extension services (23%). Dairy producers were also asked to rank the problems they have
reported. In this regard, lack of feed is reported as a very important problem by 63% of
the households who reported that problem. Similarly, lack of capital is reported as a very
important problem by 45% of the households who reported the problem.
5.2.9 Quantities produced, marketed, processed and consumed
Total quantities of dairy products produced, processed, consumed and sold per week per
household by seasons and membership status in a milk marketing cooperative are given in
Table 10. There was a statistically significant difference between members and non-members
of milk marketing cooperatives in terms of the quantities of milk produced, consumed and
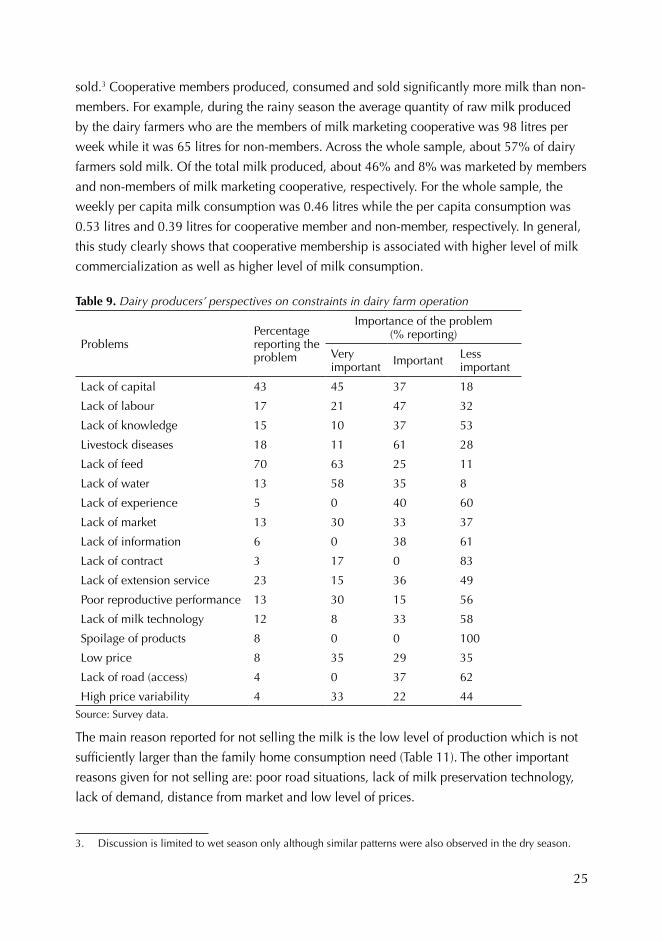
25
sold.3 Cooperative members produced, consumed and sold significantly more milk than non-
members. For example, during the rainy season the average quantity of raw milk produced
by the dairy farmers who are the members of milk marketing cooperative was 98 litres per
week while it was 65 litres for non-members. Across the whole sample, about 57% of dairy
farmers sold milk. Of the total milk produced, about 46% and 8% was marketed by members
and non-members of milk marketing cooperative, respectively. For the whole sample, the
weekly per capita milk consumption was 0.46 litres while the per capita consumption was
0.53 litres and 0.39 litres for cooperative member and non-member, respectively. In general,
this study clearly shows that cooperative membership is associated with higher level of milk
commercialization as well as higher level of milk consumption.
Table 9. Dairy producers’ perspectives on constraints in dairy farm operation
ProblemsPercentage reporting the problem
Importance of the problem (% reporting)
Very important Important Less
important
Lack of capital 43 45 37 18
Lack of labour 17 21 47 32
Lack of knowledge 15 10 37 53
Livestock diseases 18 11 61 28
Lack of feed 70 63 25 11
Lack of water 13 58 35 8
Lack of experience 5 0 40 60
Lack of market 13 30 33 37
Lack of information 6 0 38 61
Lack of contract 3 17 0 83
Lack of extension service 23 15 36 49
Poor reproductive performance 13 30 15 56
Lack of milk technology 12 8 33 58
Spoilage of products 8 0 0 100
Low price 8 35 29 35
Lack of road (access) 4 0 37 62
High price variability 4 33 22 44Source: Survey data.
The main reason reported for not selling the milk is the low level of production which is not
sufficiently larger than the family home consumption need (Table 11). The other important
reasons given for not selling are: poor road situations, lack of milk preservation technology,
lack of demand, distance from market and low level of prices.
3. Discussion is limited to wet season only although similar patterns were also observed in the dry season.
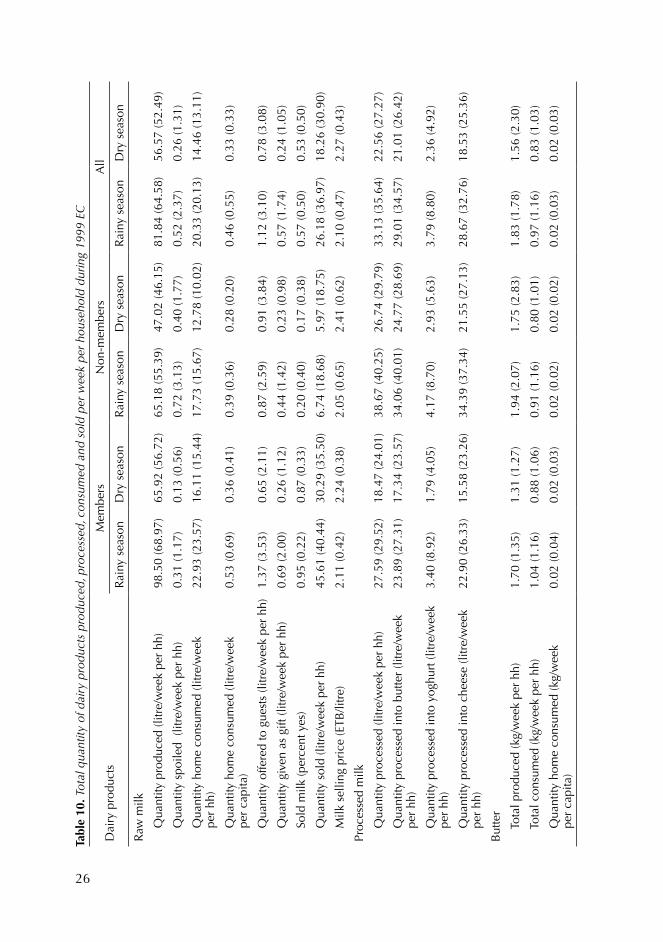
26
Tabl
e 10
. Tot
al q
uant
ity o
f dai
ry p
rodu
cts
prod
uced
, pro
cess
ed, c
onsu
med
and
sol
d pe
r w
eek
per
hous
ehol
d du
ring
1999
EC
Dai
ry p
rodu
cts
Mem
bers
Non
-mem
bers
All
Rai
ny s
easo
nD
ry s
easo
nR
ainy
sea
son
Dry
sea
son
Rai
ny s
easo
nD
ry s
easo
n
Raw
milk
Q
uant
ity p
rodu
ced
(litr
e/w
eek
per
hh)
98.5
0 (6
8.97
)65
.92
(56.
72)
65.1
8 (5
5.39
)47
.02
(46.
15)
81.8
4 (6
4.58
)56
.57
(52.
49)
Q
uant
ity s
poile
d (l
itre/
wee
k pe
r hh
)0.
31 (1
.17)
0.13
(0.5
6)0.
72 (3
.13)
0.40
(1.7
7)0.
52 (2
.37)
0.26
(1.3
1)
Q
uant
ity h
ome
cons
umed
(litr
e/w
eek
per
hh)
22.9
3 (2
3.57
)16
.11
(15.
44)
17.7
3 (1
5.67
)12
.78
(10.
02)
20.3
3 (2
0.13
)14
.46
(13.
11)
Q
uant
ity h
ome
cons
umed
(litr
e/w
eek
per
cap
ita)
0.53
(0.6
9)0.
36 (0
.41)
0.39
(0.3
6)0.
28 (0
.20)
0.46
(0.5
5)0.
33 (0
.33)
Q
uant
ity o
ffere
d to
gue
sts
(litr
e/w
eek
per
hh)
1.37
(3.5
3)0.
65 (2
.11)
0.87
(2.5
9)0.
91 (3
.84)
1.12
(3.1
0)0.
78 (3
.08)
Q
uant
ity g
iven
as
gift
(litr
e/w
eek
per
hh)
0.69
(2.0
0)0.
26 (1
.12)
0.44
(1.4
2)0.
23 (0
.98)
0.57
(1.7
4)0.
24 (1
.05)
S
old
milk
(per
cent
yes
) 0.
95 (0
.22)
0.87
(0.3
3)0.
20 (0
.40)
0.17
(0.3
8)0.
57 (0
.50)
0.53
(0.5
0)
Q
uant
ity s
old
(litr
e/w
eek
per
hh)
45.6
1 (4
0.44
)30
.29
(35.
50)
6.74
(18.
68)
5.97
(18.
75)
26.1
8 (3
6.97
)18
.26
(30.
90)
M
ilk s
ellin
g pr
ice
(ETB
/litr
e)2.
11 (0
.42)
2.24
(0.3
8)2.
05 (0
.65)
2.41
(0.6
2)2.
10 (0
.47)
2.27
(0.4
3)
Proc
esse
d m
ilk
Q
uant
ity p
roce
ssed
(litr
e/w
eek
per
hh)
27.5
9 (2
9.52
)18
.47
(24.
01)
38.6
7 (4
0.25
)26
.74
(29.
79)
33.1
3 (3
5.64
)22
.56
(27.
27)
Q
uant
ity p
roce
ssed
into
but
ter
(litr
e/w
eek
p
er h
h)23
.89
(27.
31)
17.3
4 (2
3.57
)34
.06
(40.
01)
24.7
7 (2
8.69
)29
.01
(34.
57)
21.0
1 (2
6.42
)
Q
uant
ity p
roce
ssed
into
yog
hurt
(litr
e/w
eek
per
hh)
3.40
(8.9
2)1.
79 (4
.05)
4.17
(8.7
0)2.
93 (5
.63)
3.79
(8.8
0)2.
36 (4
.92)
Q
uant
ity p
roce
ssed
into
che
ese
(litr
e/w
eek
per
hh)
22.9
0 (2
6.33
)15
.58
(23.
26)
34.3
9 (3
7.34
)21
.55
(27.
13)
28.6
7 (3
2.76
)18
.53
(25.
36)
But
ter
T
otal
pro
duce
d (k
g/w
eek
per
hh)
1.70
(1.3
5)1.
31 (1
.27)
1.94
(2.0
7)1.
75 (2
.83)
1.83
(1.7
8)1.
56 (2
.30)
T
otal
con
sum
ed (k
g/w
eek
per
hh)
1.04
(1.1
6)0.
88 (1
.06)
0.91
(1.1
6)0.
80 (1
.01)
0.97
(1.1
6)0.
83 (1
.03)
Q
uant
ity h
ome
cons
umed
(kg/
wee
k
per
cap
ita)
0.02
(0.0
4)0.
02 (0
.03)
0.02
(0.0
2)0.
02 (0
.02)
0.02
(0.0
3)0.
02 (0
.03)
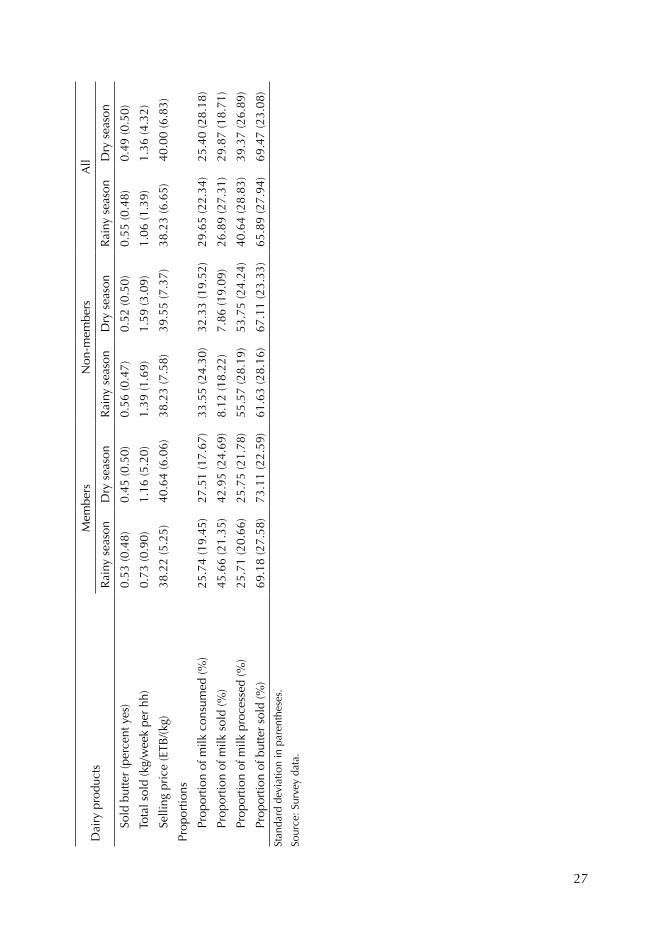
27
Dai
ry p
rodu
cts
Mem
bers
Non
-mem
bers
All
Rai
ny s
easo
nD
ry s
easo
nR
ainy
sea
son
Dry
sea
son
Rai
ny s
easo
nD
ry s
easo
n
S
old
butte
r (p
erce
nt y
es)
0.53
(0.4
8)0.
45 (0
.50)
0.56
(0.4
7)0.
52 (0
.50)
0.55
(0.4
8)0.
49 (0
.50)
T
otal
sol
d (k
g/w
eek
per
hh)
0.73
(0.9
0)1.
16 (5
.20)
1.39
(1.6
9)1.
59 (3
.09)
1.06
(1.3
9)1.
36 (4
.32)
S
ellin
g pr
ice
(ETB
/(kg)
38.2
2 (5
.25)
40.6
4 (6
.06)
38.2
3 (7
.58)
39.5
5 (7
.37)
38.2
3 (6
.65)
40.0
0 (6
.83)
Prop
ortio
ns
P
ropo
rtio
n of
milk
con
sum
ed (%
)25
.74
(19.
45)
27.5
1 (1
7.67
)33
.55
(24.
30)
32.3
3 (1
9.52
)29
.65
(22.
34)
25.4
0 (2
8.18
)
P
ropo
rtio
n of
milk
sol
d (%
)45
.66
(21.
35)
42.9
5 (2
4.69
)8.
12 (1
8.22
)7.
86 (1
9.09
)26
.89
(27.
31)
29.8
7 (1
8.71
)
P
ropo
rtio
n of
milk
pro
cess
ed (%
)25
.71
(20.
66)
25.7
5 (2
1.78
)55
.57
(28.
19)
53.7
5 (2
4.24
)40
.64
(28.
83)
39.3
7 (2
6.89
)
P
ropo
rtio
n of
but
ter
sold
(%)
69.1
8 (2
7.58
)73
.11
(22.
59)
61.6
3 (2
8.16
)67
.11
(23.
33)
65.8
9 (2
7.94
)69
.47
(23.
08)
Stan
dard
dev
iatio
n in
par
enth
eses
.
Sour
ce: S
urve
y da
ta.
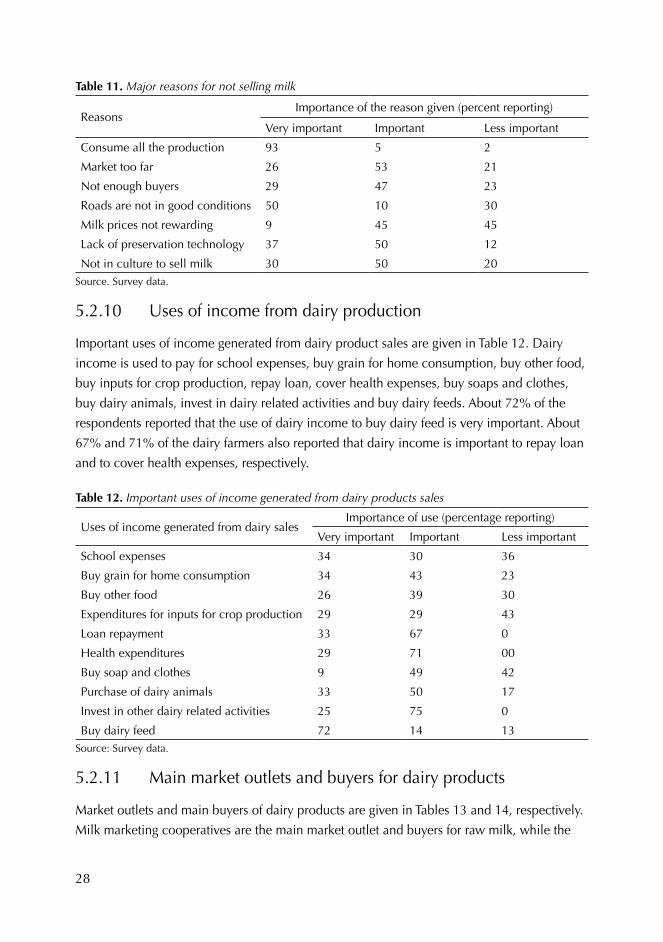
28
Table 11. Major reasons for not selling milk
ReasonsImportance of the reason given (percent reporting)
Very important Important Less important
Consume all the production 93 5 2
Market too far 26 53 21
Not enough buyers 29 47 23
Roads are not in good conditions 50 10 30
Milk prices not rewarding 9 45 45
Lack of preservation technology 37 50 12
Not in culture to sell milk 30 50 20Source. Survey data.
5.2.10 Uses of income from dairy production
Important uses of income generated from dairy product sales are given in Table 12. Dairy
income is used to pay for school expenses, buy grain for home consumption, buy other food,
buy inputs for crop production, repay loan, cover health expenses, buy soaps and clothes,
buy dairy animals, invest in dairy related activities and buy dairy feeds. About 72% of the
respondents reported that the use of dairy income to buy dairy feed is very important. About
67% and 71% of the dairy farmers also reported that dairy income is important to repay loan
and to cover health expenses, respectively.
Table 12. Important uses of income generated from dairy products sales
Uses of income generated from dairy salesImportance of use (percentage reporting)
Very important Important Less important
School expenses 34 30 36
Buy grain for home consumption 34 43 23
Buy other food 26 39 30
Expenditures for inputs for crop production 29 29 43
Loan repayment 33 67 0
Health expenditures 29 71 00
Buy soap and clothes 9 49 42
Purchase of dairy animals 33 50 17
Invest in other dairy related activities 25 75 0
Buy dairy feed 72 14 13Source: Survey data.
5.2.11 Main market outlets and buyers for dairy products
Market outlets and main buyers of dairy products are given in Tables 13 and 14, respectively.
Milk marketing cooperatives are the main market outlet and buyers for raw milk, while the
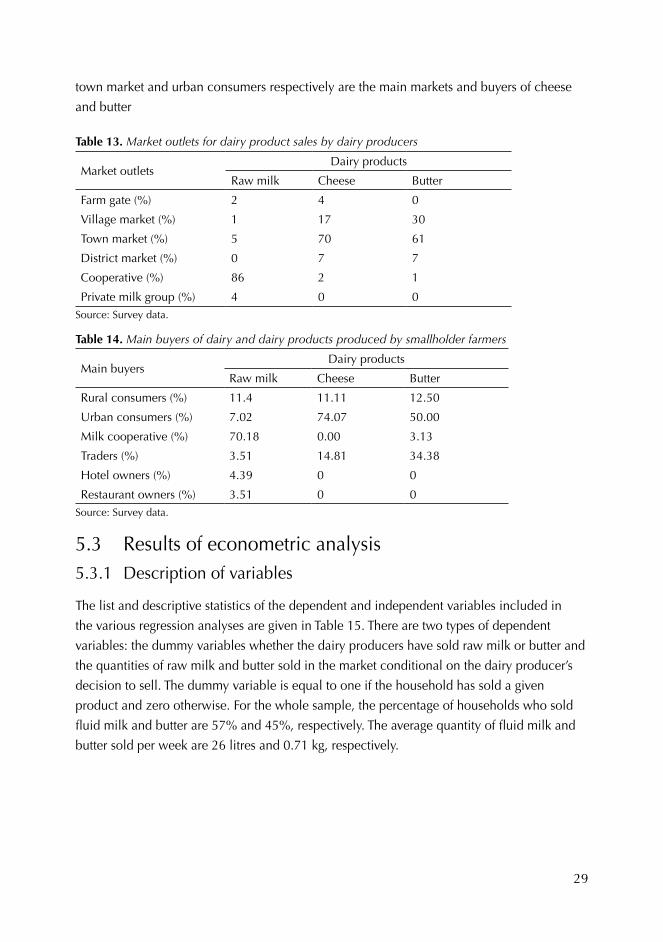
29
town market and urban consumers respectively are the main markets and buyers of cheese
and butter
Table 13. Market outlets for dairy product sales by dairy producers
Market outletsDairy products
Raw milk Cheese Butter
Farm gate (%) 2 4 0
Village market (%) 1 17 30
Town market (%) 5 70 61
District market (%) 0 7 7
Cooperative (%) 86 2 1
Private milk group (%) 4 0 0Source: Survey data.
Table 14. Main buyers of dairy and dairy products produced by smallholder farmers
Main buyersDairy products
Raw milk Cheese Butter
Rural consumers (%) 11.4 11.11 12.50
Urban consumers (%) 7.02 74.07 50.00
Milk cooperative (%) 70.18 0.00 3.13
Traders (%) 3.51 14.81 34.38
Hotel owners (%) 4.39 0 0
Restaurant owners (%) 3.51 0 0Source: Survey data.
5.3 Results of econometric analysis5.3.1 Description of variables
The list and descriptive statistics of the dependent and independent variables included in
the various regression analyses are given in Table 15. There are two types of dependent
variables: the dummy variables whether the dairy producers have sold raw milk or butter and
the quantities of raw milk and butter sold in the market conditional on the dairy producer’s
decision to sell. The dummy variable is equal to one if the household has sold a given
product and zero otherwise. For the whole sample, the percentage of households who sold
fluid milk and butter are 57% and 45%, respectively. The average quantity of fluid milk and
butter sold per week are 26 litres and 0.71 kg, respectively.
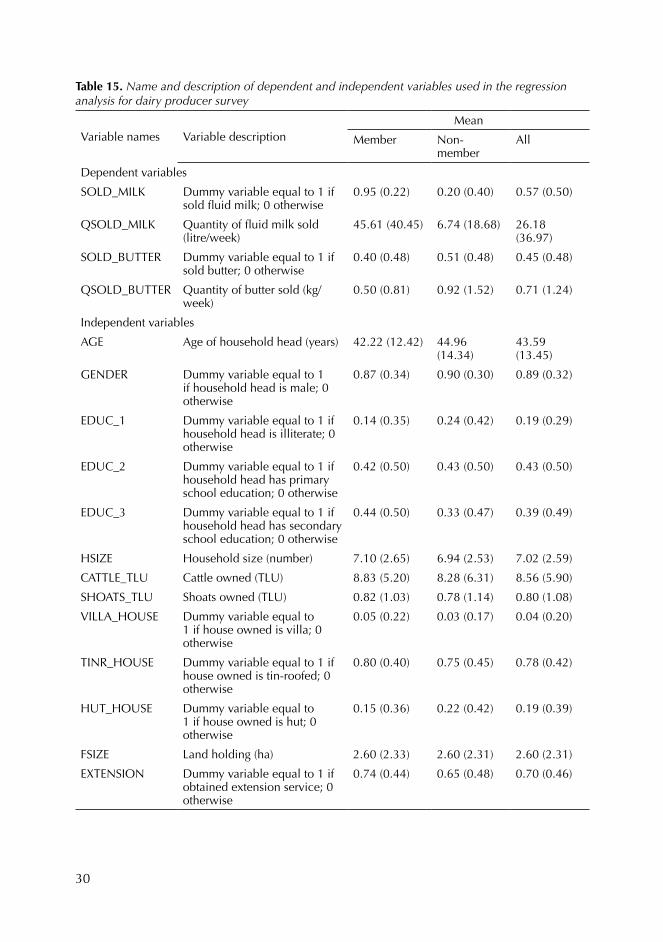
30
Table 15. Name and description of dependent and independent variables used in the regression analysis for dairy producer survey
Variable names Variable descriptionMean
Member Non- member
All
Dependent variables
SOLD_MILK Dummy variable equal to 1 if sold fluid milk; 0 otherwise
0.95 (0.22) 0.20 (0.40) 0.57 (0.50)
QSOLD_MILK Quantity of fluid milk sold (litre/week)
45.61 (40.45) 6.74 (18.68) 26.18 (36.97)
SOLD_BUTTER Dummy variable equal to 1 if sold butter; 0 otherwise
0.40 (0.48) 0.51 (0.48) 0.45 (0.48)
QSOLD_BUTTER Quantity of butter sold (kg/week)
0.50 (0.81) 0.92 (1.52) 0.71 (1.24)
Independent variables
AGE Age of household head (years) 42.22 (12.42) 44.96 (14.34)
43.59 (13.45)
GENDER Dummy variable equal to 1 if household head is male; 0 otherwise
0.87 (0.34) 0.90 (0.30) 0.89 (0.32)
EDUC_1 Dummy variable equal to 1 if household head is illiterate; 0 otherwise
0.14 (0.35) 0.24 (0.42) 0.19 (0.29)
EDUC_2 Dummy variable equal to 1 if household head has primary school education; 0 otherwise
0.42 (0.50) 0.43 (0.50) 0.43 (0.50)
EDUC_3 Dummy variable equal to 1 if household head has secondary school education; 0 otherwise
0.44 (0.50) 0.33 (0.47) 0.39 (0.49)
HSIZE Household size (number) 7.10 (2.65) 6.94 (2.53) 7.02 (2.59)
CATTLE_TLU Cattle owned (TLU) 8.83 (5.20) 8.28 (6.31) 8.56 (5.90)
SHOATS_TLU Shoats owned (TLU) 0.82 (1.03) 0.78 (1.14) 0.80 (1.08)
VILLA_HOUSE Dummy variable equal to 1 if house owned is villa; 0 otherwise
0.05 (0.22) 0.03 (0.17) 0.04 (0.20)
TINR_HOUSE Dummy variable equal to 1 if house owned is tin-roofed; 0 otherwise
0.80 (0.40) 0.75 (0.45) 0.78 (0.42)
HUT_HOUSE Dummy variable equal to 1 if house owned is hut; 0 otherwise
0.15 (0.36) 0.22 (0.42) 0.19 (0.39)
FSIZE Land holding (ha) 2.60 (2.33) 2.60 (2.31) 2.60 (2.31)
EXTENSION Dummy variable equal to 1 if obtained extension service; 0 otherwise
0.74 (0.44) 0.65 (0.48) 0.70 (0.46)
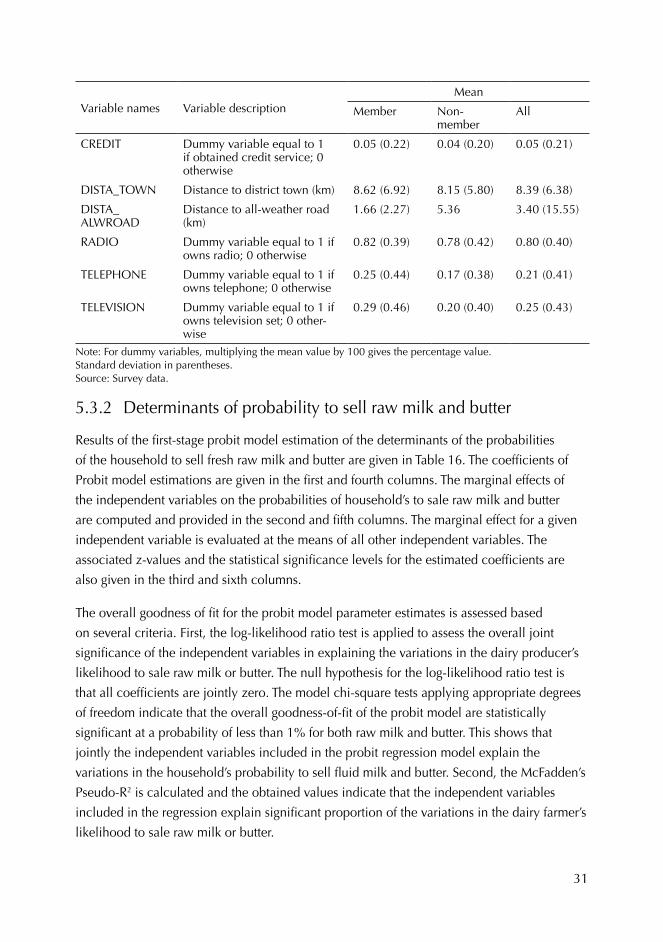
31
Variable names Variable descriptionMean
Member Non- member
All
CREDIT Dummy variable equal to 1 if obtained credit service; 0 otherwise
0.05 (0.22) 0.04 (0.20) 0.05 (0.21)
DISTA_TOWN Distance to district town (km) 8.62 (6.92) 8.15 (5.80) 8.39 (6.38)
DISTA_ ALWROAD
Distance to all-weather road (km)
1.66 (2.27) 5.36 3.40 (15.55)
RADIO Dummy variable equal to 1 if owns radio; 0 otherwise
0.82 (0.39) 0.78 (0.42) 0.80 (0.40)
TELEPHONE Dummy variable equal to 1 if owns telephone; 0 otherwise
0.25 (0.44) 0.17 (0.38) 0.21 (0.41)
TELEVISION Dummy variable equal to 1 if owns television set; 0 other-wise
0.29 (0.46) 0.20 (0.40) 0.25 (0.43)
Note: For dummy variables, multiplying the mean value by 100 gives the percentage value. Standard deviation in parentheses. Source: Survey data.
5.3.2 Determinants of probability to sell raw milk and butter
Results of the first-stage probit model estimation of the determinants of the probabilities
of the household to sell fresh raw milk and butter are given in Table 16. The coefficients of
Probit model estimations are given in the first and fourth columns. The marginal effects of
the independent variables on the probabilities of household’s to sale raw milk and butter
are computed and provided in the second and fifth columns. The marginal effect for a given
independent variable is evaluated at the means of all other independent variables. The
associated z-values and the statistical significance levels for the estimated coefficients are
also given in the third and sixth columns.
The overall goodness of fit for the probit model parameter estimates is assessed based
on several criteria. First, the log-likelihood ratio test is applied to assess the overall joint
significance of the independent variables in explaining the variations in the dairy producer’s
likelihood to sale raw milk or butter. The null hypothesis for the log-likelihood ratio test is
that all coefficients are jointly zero. The model chi-square tests applying appropriate degrees
of freedom indicate that the overall goodness-of-fit of the probit model are statistically
significant at a probability of less than 1% for both raw milk and butter. This shows that
jointly the independent variables included in the probit regression model explain the
variations in the household’s probability to sell fluid milk and butter. Second, the McFadden’s
Pseudo-R2 is calculated and the obtained values indicate that the independent variables
included in the regression explain significant proportion of the variations in the dairy farmer’s
likelihood to sale raw milk or butter.
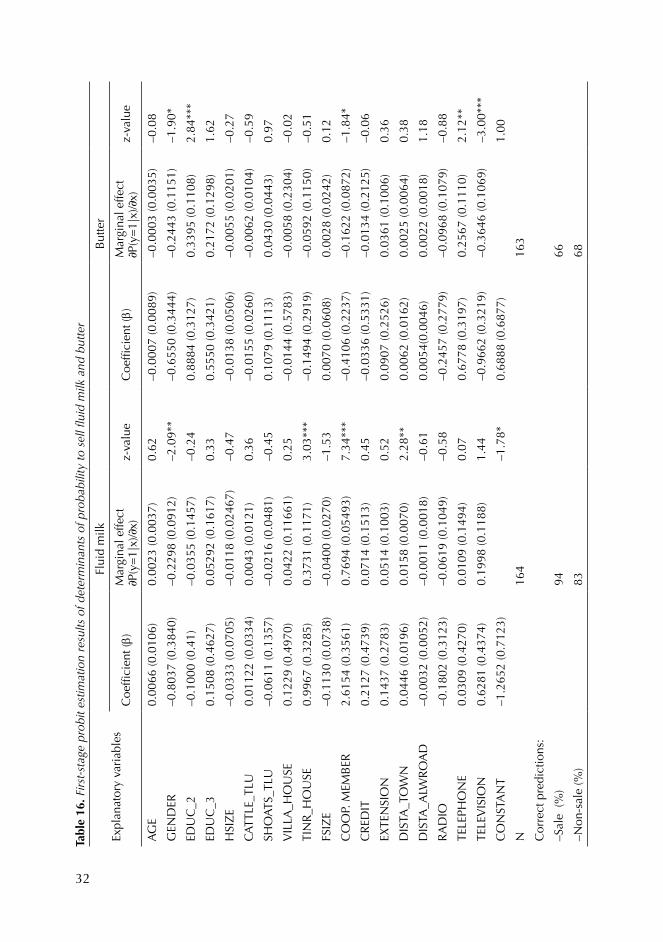
32
Tabl
e 16
. Firs
t-sta
ge p
robi
t est
imat
ion
resu
lts o
f det
erm
inan
ts o
f pro
babi
lity
to s
ell fl
uid
milk
and
but
ter
Expl
anat
ory
vari
able
sFl
uid
milk
But
ter
Coe
ffici
ent (
b)M
argi
nal e
ffect
P(
y=1|
x)/
x)z-
valu
eC
oeffi
cien
t (b)
Mar
gina
l effe
ct
P(y=
1|x)
/x)
z-va
lue
AG
E0.
0066
(0.0
106)
0.00
23 (0
.003
7)0.
62–0
.000
7 (0
.008
9)–0
.000
3 (0
.003
5)–0
.08
GEN
DER
–0.8
037
(0.3
840)
–0.2
298
(0.0
912)
–2.0
9**
–0.6
550
(0.3
444)
–0.2
443
(0.1
151)
–1.9
0*
EDU
C_2
–0.1
000
(0.4
1)–0
.035
5 (0
.145
7)–0
.24
0.88
84 (0
.312
7)0.
3395
(0.1
108)
2.84
***
EDU
C_3
0.15
08 (0
.462
7)0.
0529
2 (0
.161
7)0.
330.
5550
(0.3
421)
0.21
72 (0
.129
8)1.
62
HSI
ZE
–0.0
333
(0.0
705)
–0.0
118
(0.0
2467
)–0
.47
–0.0
138
(0.0
506)
–0.0
055
(0.0
201)
–0.2
7
CAT
TLE_
TLU
0.01
122
(0.0
334)
0.00
43 (0
.012
1)0.
36–0
.015
5 (0
.026
0)–0
.006
2 (0
.010
4)–0
.59
SHO
ATS_
TLU
–0.0
611
(0.1
357)
–0.0
216
(0.0
481)
–0.4
50.
1079
(0.1
113)
0.04
30 (0
.044
3)0.
97
VIL
LA_H
OU
SE0.
1229
(0.4
970)
0.04
22 (0
.116
61)
0.25
–0.0
144
(0.5
783)
–0.0
058
(0.2
304)
–0.0
2
TIN
R_H
OU
SE0.
9967
(0.3
285)
0.37
31 (0
.117
1)3.
03**
*–0
.149
4 (0
.291
9)–0
.059
2 (0
.115
0)–0
.51
FSIZ
E–0
.113
0 (0
.073
8)–0
.040
0 (0
.027
0)–1
.53
0.00
70 (0
.060
8)0.
0028
(0.0
242)
0.12
CO
OP.
MEM
BER
2.61
54 (0
.356
1)0.
7694
(0.0
5493
)7.
34**
*–0
.410
6 (0
.223
7)–0
.162
2 (0
.087
2)–1
.84*
CR
EDIT
0.21
27 (0
.473
9)0.
0714
(0.1
513)
0.45
–0.0
336
(0.5
331)
–0.0
134
(0.2
125)
–0.0
6
EXTE
NSI
ON
0.14
37 (0
.278
3)0.
0514
(0.1
003)
0.52
0.09
07 (0
.252
6)0.
0361
(0.1
006)
0.36
DIS
TA_T
OW
N0.
0446
(0.0
196)
0.01
58 (0
.007
0)2.
28**
0.00
62 (0
.016
2)0.
0025
(0.0
064)
0.38
DIS
TA_A
LWR
OA
D–0
.003
2 (0
.005
2)–0
.001
1 (0
.001
8)–0
.61
0.00
54(0
.004
6)0.
0022
(0.0
018)
1.18
RA
DIO
–0.1
802
(0.3
123)
–0.0
619
(0.1
049)
–0.5
8–0
.245
7 (0
.277
9)–0
.096
8 (0
.107
9)–0
.88
TELE
PHO
NE
0.03
09 (0
.427
0)0.
0109
(0.1
494)
0.07
0.67
78 (0
.319
7)0.
2567
(0.1
110)
2.12
**
TELE
VIS
ION
0.62
81 (0
.437
4)0.
1998
(0.1
188)
1.44
–0.9
662
(0.3
219)
–0.3
646
(0.1
069)
–3.0
0***
CO
NST
AN
T–1
.265
2 (0
.712
3)–1
.78*
0.68
88 (0
.687
7)1.
00
N16
416
3
Cor
rect
pre
dict
ions
:
–Sal
e (%
)94
66
–Non
-sal
e (%
)83
68
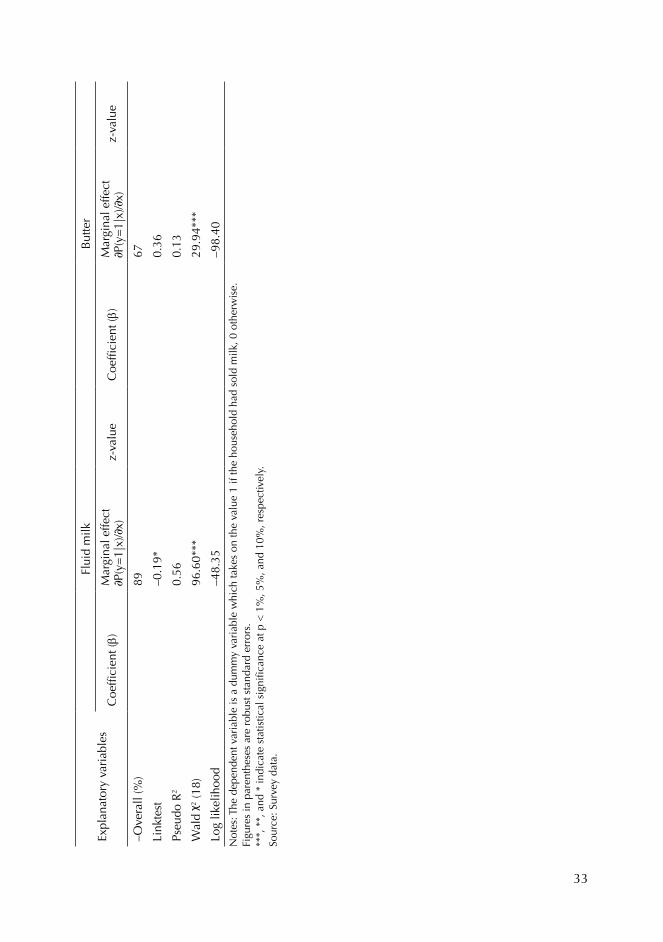
33
Expl
anat
ory
vari
able
sFl
uid
milk
But
ter
Coe
ffici
ent (
b)M
argi
nal e
ffect
P(
y=1|
x)/
x)z-
valu
eC
oeffi
cien
t (b)
Mar
gina
l effe
ct
P(y=
1|x)
/x)
z-va
lue
–Ove
rall
(%)
8967
Link
test
–0.1
9*0.
36
Pseu
do R
20.
560.
13
Wal
d 2
(18)
96
.60*
**29
.94*
**
Log
likel
ihoo
d –4
8.35
–98.
40N
otes
: The
dep
ende
nt v
aria
ble
is a
dum
my
vari
able
whi
ch ta
kes
on th
e va
lue
1 if
the
hous
ehol
d ha
d so
ld m
ilk, 0
oth
erw
ise.
Fi
gure
s in
par
enth
eses
are
rob
ust s
tand
ard
erro
rs.
***,
**,
and
* in
dica
te s
tatis
tical
sig
nific
ance
at p
< 1
%, 5
%, a
nd 1
0%, r
espe
ctiv
ely.
So
urce
: Sur
vey
data
.
34
The probit model explains 56% and 13% of the variations in the likelihood of households to
sell fluid milk and butter, respectively. Third, the correct prediction rate of the probit model
is obtained. In the case of raw milk, it is observed that the probit model predicts about 89%
of the cases correctly while in the case of butter the probit model predicts 67% of the cases
correctly. Fourth, the linktest is also conducted to test for the omitted variable problem. The
null hypothesis of no omitted variable is not rejected at a probability of less than 5% for both
fluid milk and butter. Fifth, the standard errors of the parameters estimated are also corrected
for the non-constant variances.
The age of the head of household is observed to be positively associated with the household’s
likelihood to sell raw milk while it is negatively associated with the household’s likelihood
to sell butter but is not statistically significant in either case. The gender of household is
negatively associated with the likelihood of household selling raw milk and butter. However,
the effect of gender is statistically significant only for fluid milk at a probability of less than
5%. The negative coefficient on gender, given the omitted category for gender dummy
variable is female-headed households, suggests that female-headed households are more
likely to sell either fluid milk or butter. For example, in the case of fluid milk as compared
to male-headed households, female-headed households are about 23% more likely to sell
raw milk in the market. This might be because female-headed households are more cash
constrained than male-headed households.
The effect of the education level of the head of household head on the household likelihood
to sell raw milk is not significant. However, the effect of the education level of the head of
household on the household’s likelihood to sell butter is positive and statistically significant
at a probability less than 5%. The positive coefficient on the dummy variable for primary
education indicates that the dairy producers with primary education are more likely to
sell their raw milk than households with illiterate heads. The effect of household size on
the likelihood of dairy producer to sell raw milk and butter is as expected negative but
statistically not significant. The negative coefficients indicate that as the household size
increases the likelihood that the household sell raw milk or butter decreases. This seems
reasonable as the household consumption needs increase with the size of the household,
the amount of milk and butter left for sale in the market decreases and this decreases the
likelihood of the household selling raw milk or butter in the market.
As expected, the number of cattle owned by the household is positively associated with
household’s likelihood to sell raw milk but is not statistically significant. On the other hand,
the number of shoats is negatively associated with the household’s likelihood to sell raw milk
but similar to the size of cattle owned the effect is not statistically significant. The negative
association between the size of shoats owned and the household’s likelihood to sell raw
35
milk indicates that as the size of shoats increase the need for the household to sell milk to
generate cash decreases and this increases the household’s likelihood to consume milk at
home instead of selling it in the market.
The type (quality) of house owned by the dairy producers is a proxy for the wealth of the
household. There are three major types of houses owned by the dairy farmers in the study
area: hut, tin-roofed and villa houses. The type of house owned by the household is observed
to have a positive and statistically significant impact on the household’s likelihood to sell
raw milk. This indicates that wealthy dairy producers are more likely to sell raw milk. For
example, the ownership of tin-roofed houses increases the likelihood of households selling
the raw milk by more than 30% as compared to the ownership of huts which is the omitted
category for the type of house dummy variable. The effect of the type of house owned on the
likelihood of household selling butter is negative but statistically not significant.
Contrary to theoretical expectation, it is observed that there is negative association between
farm size and the household’s likelihood to sell fluid milk. The effect of farm size on
likelihood of selling butter is positive. However, the effect of farm size is not statistically
significant for either raw milk or for butter. Thus, farm size has no significant effect on the
commercialization of smallholder dairy production. The implication of this result is that
smallholder dairy farmers can also participate in the market without much of the problem
related to small farm sizes.
The household membership in a milk marketing cooperative is found to be strongly and
positively associated with the likelihood of household to sell raw milk and the effect is
statistically significant at a probability of less than 1%. Sellers are more likely to be a member
of a cooperative. For example, the membership increases the probability of household to sell
raw milk by 77%. This clearly indicates the important role the milk marketing cooperatives
are playing in terms of improving smallholder dairy producers’ access to the market by
reducing the fixed transaction costs to participate in the raw milk market such as the costs of
searching and negotiating with buyers. However, the membership cooperative is observed
to have a negative effect on the household’s likelihood to sell butter. Cooperative members
are less likely to sell butter as compared to the non-members. This result is reasonable
since in most cases the cooperatives accept whatever amount of raw milk is supplied from
its members and members have little milk left for processing and producing butter for the
market.
Access to credit and extension services is often mentioned as an important condition to
increase smallholder commercialization. As expected, the household’s access to credit
for dairy farm operation is positively associated with the likelihood of selling raw milk.
However, the effect of credit is not statistically significant at a probability of less than 5%. The
36
effect of access to credit on the household’s likelihood to sell butter is negative though not
statistically significant. The effects of household access to extension service on the likelihood
of household to sell raw milk and butter are positive but are not statistically significant at a
probability of less than 5%. The distances to the town and to all-weather road are expected
to negatively affect households’ likelihood to sell raw milk. However, the effect of distance
to the town is found to be positive and statistically significant at a probability of less than
5%. This result is hard to interpret. On the other hand, the effect of distance to all weather
roads is found to be negatively associated with the household’s likelihood to sell raw milk
in the market though these effects are not significant statistically. The effects of households’
access to different communication technology were not found to be significant in terms of
influencing the likelihood of household’s selling raw milk but are significant for butter.
5.3.3 Determinants of quantities of raw milk and butter sold
The results of Heckman two-stage and tobit regression estimations for quantity of milk and
butter sold conditional on household’s decision to sale these products are given in Tables 17
and 18. The coefficients on the Mill’s ratio (lambda) in the Heckman two-stage estimation are
not significant at the probability of less than 5% for both fluid milk and butter. This indicates
there is no sample selection bias, there are no unobservable household characteristics
influencing the household’s likelihood to sell raw milk and butter and thereby affecting the
quantities of products sold. Thus, since there is no sample selection bias, the determinants of
the quantities of raw milk and butter sold are analysed and reported based on the results of
Tobit model. Four marginal effects for the Tobit model are calculated at the means of all other
variables and given in columns 2 to 5 of Tables 17 and 18. The model chi-square for Tobit
model regression indicates that the overall goodness of fit of the Tobit model is statistically
significant at a probability of less than 1% for both fluid milk and butter. This indicates that
jointly the variables included in the Tobit model explain the variations in the household’s
quantity of raw milk and butter sold.
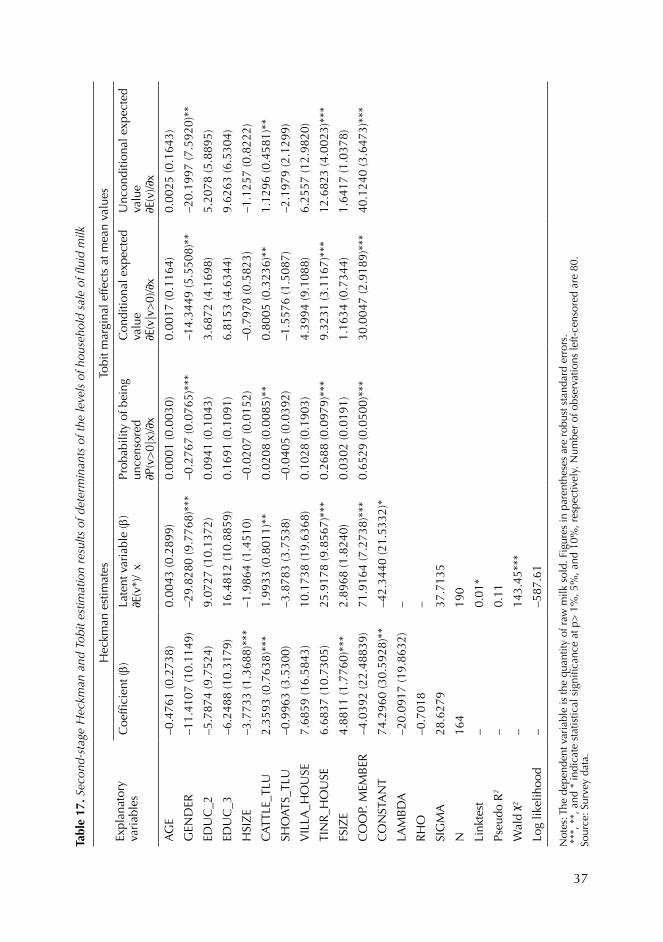
37
Tabl
e 17
. Sec
ond-
stag
e H
eckm
an a
nd T
obit
estim
atio
n re
sults
of d
eter
min
ants
of t
he le
vels
of h
ouse
hold
sal
e of
flui
d m
ilk
Expl
anat
ory
va
riab
les
Hec
kman
est
imat
esTo
bit m
argi
nal e
ffect
s at
mea
n va
lues
Coe
ffici
ent (
b)La
tent
var
iabl
e (b
) E(
v*)/
xPr
obab
ility
of b
eing
un
cens
ored
P(
v>0|
x)/
x
Con
ditio
nal e
xpec
ted
valu
e E(
v|v>
0)/
x
Unc
ondi
tiona
l exp
ecte
d va
lue
E(v)
/x
AG
E–0
.476
1 (0
.273
8)0.
0043
(0.2
899)
0.00
01 (0
.003
0)0.
0017
(0.1
164)
0.00
25 (0
.164
3)
GEN
DER
–11.
4107
(10.
1149
)–2
9.82
80 (9
.776
8)**
*–0
.276
7 (0
.076
5)**
*–1
4.34
49 (5
.550
8)**
–20.
1997
(7.5
920)
**
EDU
C_2
–5.7
874
(9.7
524)
9.07
27 (1
0.13
72)
0.09
41 (0
.104
3)3.
6872
(4.1
698)
5.20
78 (5
.889
5)
EDU
C_3
–6.2
488
(10.
3179
)16
.481
2 (1
0.88
59)
0.16
91 (0
.109
1)6.
8153
(4.6
344)
9.62
63 (6
.530
4)
HSI
ZE
–3.7
733
(1.3
688)
***
–1.9
864
(1.4
510)
–0.0
207
(0.0
152)
–0.7
978
(0.5
823)
–1.1
257
(0.8
222)
CAT
TLE_
TLU
2.35
93 (0
.763
8)**
*1.
9933
(0.8
011)
**0.
0208
(0.0
085)
**0.
8005
(0.3
236)
**1.
1296
(0.4
581)
**
SHO
ATS_
TLU
–0.9
963
(3.5
300)
–3.8
783
(3.7
538)
–0.0
405
(0.0
392)
–1.5
576
(1.5
087)
–2.1
979
(2.1
299)
VIL
LA_H
OU
SE7.
6859
(16.
5843
)10
.173
8 (1
9.63
68)
0.10
28 (0
.190
3)4.
3994
(9.1
088)
6.25
57 (1
2.98
20)
TIN
R_H
OU
SE6.
6837
(10.
7305
)25
.917
8 (9
.856
7)**
*0.
2688
(0.0
979)
***
9.32
31 (3
.116
7)**
*12
.682
3 (4
.002
3)**
*
FSIZ
E4.
8811
(1.7
760)
***
2.89
68 (1
.824
0)0.
0302
(0.0
191)
1.16
34 (0
.734
4)1.
6417
(1.0
378)
CO
OP.
MEM
BER
–4
.039
2 (2
2.48
839)
71.9
164
(7.2
738)
***
0.65
29 (0
.050
0)**
*30
.004
7 (2
.918
9)**
*40
.124
0 (3
.647
3)**
*
CO
NST
AN
T74
.296
0 (3
0.59
28)*
*–4
2.34
40 (2
1.53
32)*
LAM
BD
A–2
0.09
17 (1
9.86
32)
–
RH
O–0
.701
8–
SIG
MA
28.6
279
37.7
135
N16
419
0
Link
test
–0.
01*
Pseu
do R
2–
0.11
Wal
d 2
–14
3.45
***
Log
likel
ihoo
d –
–587
.61
Not
es: T
he d
epen
dent
var
iabl
e is
the
quan
tity
of r
aw m
ilk s
old.
Fig
ures
in p
aren
thes
es a
re r
obus
t sta
ndar
d er
rors
. *
**, *
*, a
nd *
indi
cate
sta
tistic
al s
igni
fican
ce a
t p>
1%
, 5%
, and
10%
, res
pect
ivel
y. N
umbe
r of
obs
erva
tions
left-
cens
ored
are
80.
So
urce
: Sur
vey
data
.
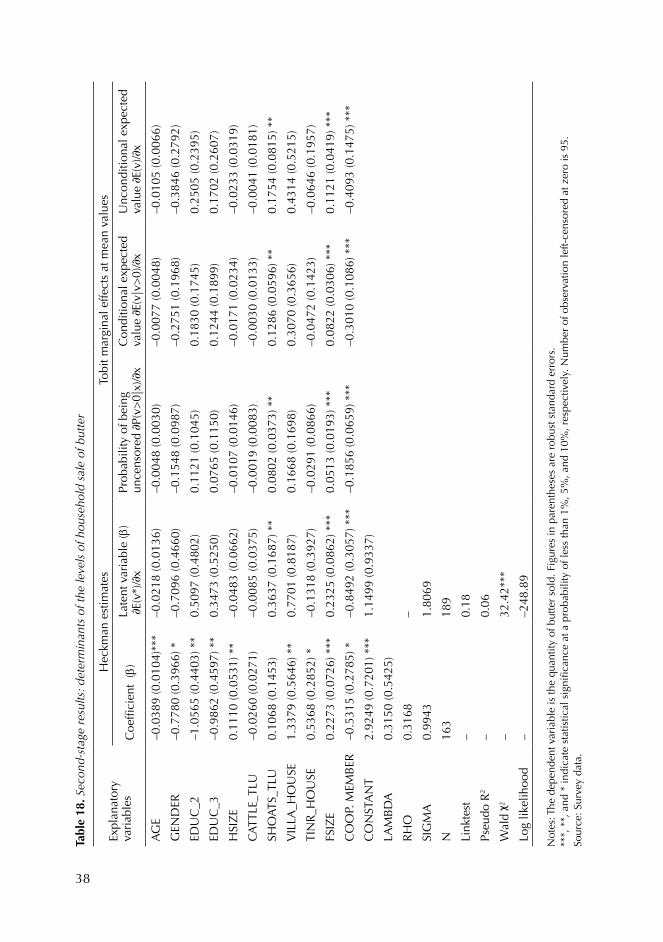
38
Tabl
e 18
. Sec
ond-
stag
e re
sults
: det
erm
inan
ts o
f the
leve
ls o
f hou
seho
ld s
ale
of b
utte
r
Expl
anat
ory
va
riab
les
Hec
kman
est
imat
esTo
bit m
argi
nal e
ffect
s at
mea
n va
lues
Coe
ffici
ent
(b)
Late
nt v
aria
ble
(b)
E(
v*)/
xPr
obab
ility
of b
eing
un
cens
ored
P(
v>0|
x)/
xC
ondi
tiona
l exp
ecte
d va
lue
E(v|
v>0)
/x
Unc
ondi
tiona
l exp
ecte
d va
lue
E(v)
/x
AG
E–0
.038
9 (0
.010
4)**
*–0
.021
8 (0
.013
6)–0
.004
8 (0
.003
0)–0
.007
7 (0
.004
8)–0
.010
5 (0
.006
6)
GEN
DER
–0.7
780
(0.3
966)
*–0
.709
6 (0
.466
0)–0
.154
8 (0
.098
7)–0
.275
1 (0
.196
8)–0
.384
6 (0
.279
2)
EDU
C_2
–1.0
565
(0.4
403)
**
0.50
97 (0
.480
2)0.
1121
(0.1
045)
0.18
30 (0
.174
5)0.
2505
(0.2
395)
EDU
C_3
–0.9
862
(0.4
597)
**
0.34
73 (0
.525
0)0.
0765
(0.1
150)
0.12
44 (0
.189
9)0.
1702
(0.2
607)
HSI
ZE
0.11
10 (0
.053
1) *
*–0
.048
3 (0
.066
2)–0
.010
7 (0
.014
6)–0
.017
1 (0
.023
4)–0
.023
3 (0
.031
9)
CAT
TLE_
TLU
–0.0
260
(0.0
271)
–0.0
085
(0.0
375)
–0.0
019
(0.0
083)
–0.0
030
(0.0
133)
–0.0
041
(0.0
181)
SHO
ATS_
TLU
0.10
68 (0
.145
3)0.
3637
(0.1
687)
**
0.08
02 (0
.037
3) *
*0.
1286
(0.0
596)
**
0.17
54 (0
.081
5) *
*
VIL
LA_H
OU
SE1.
3379
(0.5
646)
**
0.77
01 (0
.818
7)0.
1668
(0.1
698)
0.30
70 (0
.365
6)0.
4314
(0.5
215)
TIN
R_H
OU
SE0.
5368
(0.2
852)
*–0
.131
8 (0
.392
7)–0
.029
1 (0
.086
6)–0
.047
2 (0
.142
3)–0
.064
6 (0
.195
7)
FSIZ
E0.
2273
(0.0
726)
***
0.23
25 (0
.086
2) *
**0.
0513
(0.0
193)
***
0.08
22 (0
.030
6) *
**0.
1121
(0.0
419)
***
CO
OP.
MEM
BER
–0
.531
5 (0
.278
5) *
–0.8
492
(0.3
057)
***
–0.1
856
(0.0
659)
***
–0.3
010
(0.1
086)
***
–0.4
093
(0.1
475)
***
CO
NST
AN
T2.
9249
(0.7
201)
***
1.14
99 (0
.933
7)
LAM
BD
A0.
3150
(0.5
425)
RH
O0.
3168
–
SIG
MA
0.99
431.
8069
N16
318
9
Link
test
–0.
18
Pseu
do R
2–
0.06
Wal
d 2
–32
.42*
**
Log
likel
ihoo
d –
–248
.89
Not
es: T
he d
epen
dent
var
iabl
e is
the
quan
tity
of b
utte
r so
ld. F
igur
es in
par
enth
eses
are
rob
ust s
tand
ard
erro
rs.
***,
**,
and
* in
dica
te s
tatis
tical
sig
nific
ance
at a
pro
babi
lity
of le
ss th
an 1
%, 5
%, a
nd 1
0%, r
espe
ctiv
ely.
Num
ber
of o
bser
vatio
n le
ft-ce
nsor
ed a
t zer
o is
95.
So
urce
: Sur
vey
data
.
39
The age of household head is positively associated with the quantity of raw milk sold while
it is negatively associated with the quantity of butter sold. However, the magnitudes of the
effects are small and statistically not significant. The gender of the head of household is
negatively and strongly associated with the quantity of fluid milk sold. The female headed
households are 28% more likely to have a positive quantities of milk sold. Conditional on
positive quantity of milk sold, female-headed households sell about 14 litres of milk more
than the male-headed households. Similar to fluid milk, the effect of gender on the quantity
of butter sold is negative. However, unlike fluid milk, the effect of gender on the quantity of
butter sold is not statistically significant.
The effects of education of the head of household on the quantities of fluid milk and butter
sold are positive but these effects are not statistically significant. It is interesting to note
that the effects of household size on the quantities of milk and butter sold are negative as
expected but these effects are not statistically significant.
The effect of the number of cattle owned by the household is positive as expected and
statistically significant at a probability of less than 5%. The increase in the size of cattle
owned increases both the potential and actual quantities of raw milk sold. The increase in the
cattle size also significantly increases the likelihood that the household would sell positive
quantities of fluid milk. However, the effect of the size of cattle owned on the quantity of
butter sold is negative and is not statistically significant. The effect of the size of shoats owned
by the household has no significant effect on the quantities of fluid milk sold while there is
statistically significant positive relationship between the quantity of butter sold and the size of
shoats owned.
The type of house owned by the household is an indicator for the wealth of the household
and is positively and strongly associated with the potential and actual market supply of fluid
milk. The households with tin-roofed houses are 27% more likely to have positive quantities
of milk sold as compared to households with hut houses. The magnitude of the effect of the
type of house owned on the quantity of milk sold is very large. For example, conditional
on positive quantity of milk sold, the tin-roofed households sell about 9 litres of milk per
week more than the households with hut houses. Thus, the wealth factor plays significant
role on the quantities of milk sold. The type of house owned has no effect on the quantity
of butter sold. The farm size is positively associated with the quantity of milk sold but is not
statistically significant. On the other hand, it is observed that there is positive and statistically
significant effect of farm size on the quantity of butter sold.
The membership of household in a milk marketing cooperative is found to be positively and
significantly increase the quantity of milk sold. Thus, after controlling for other variables,
membership has a very significant positive effect both on the household’s probability to
40
sell raw milk; and conditional on the sell of the raw milk, on the volume of the raw milk
sold. However, the effect of membership on the quantity of butter sold is strongly negative.
Membership in a milk marketing cooperative decreases the quantity of butter sold by the
household, ceteris paribus.
5.4 Section summary
After controlling for demographic and socioeconomic characteristics of the dairy producers,
the econometric analysis shows that the most important determinant of commercialization of
smallholder dairy production is membership in a milk marketing cooperative. Membership
significantly increased the likelihood of smallholder dairy producer to selling milk and butter
in the market. Conditional on sale of milk and butter, membership in a dairy marketing
cooperative also significantly increases the volume of milk and butter sold in the market.
Membership in a milk marketing cooperative has also significantly increased the quantities of
milk produced, and consumed by cooperative member dairy producers. Thus, encouraging
non-member households to join cooperatives and enhancing the role of these institutions are
the keys to commercializing smallholder dairy production.
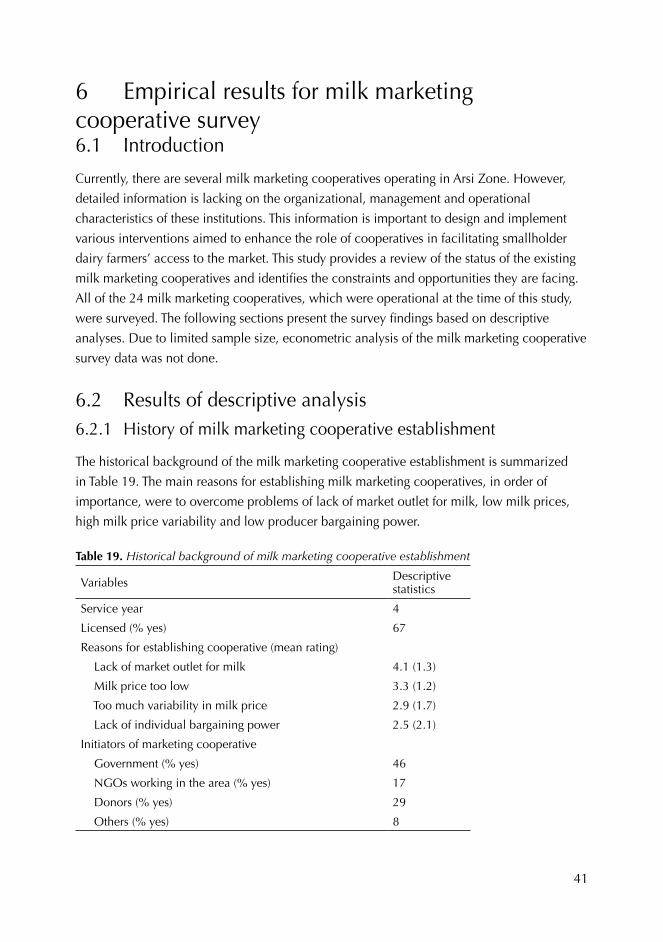
41
6 Empirical results for milk marketing cooperative survey6.1 Introduction
Currently, there are several milk marketing cooperatives operating in Arsi Zone. However,
detailed information is lacking on the organizational, management and operational
characteristics of these institutions. This information is important to design and implement
various interventions aimed to enhance the role of cooperatives in facilitating smallholder
dairy farmers’ access to the market. This study provides a review of the status of the existing
milk marketing cooperatives and identifies the constraints and opportunities they are facing.
All of the 24 milk marketing cooperatives, which were operational at the time of this study,
were surveyed. The following sections present the survey findings based on descriptive
analyses. Due to limited sample size, econometric analysis of the milk marketing cooperative
survey data was not done.
6.2 Results of descriptive analysis6.2.1 History of milk marketing cooperative establishment
The historical background of the milk marketing cooperative establishment is summarized
in Table 19. The main reasons for establishing milk marketing cooperatives, in order of
importance, were to overcome problems of lack of market outlet for milk, low milk prices,
high milk price variability and low producer bargaining power.
Table 19. Historical background of milk marketing cooperative establishment
Variables Descriptive statistics
Service year 4
Licensed (% yes) 67
Reasons for establishing cooperative (mean rating)
Lack of market outlet for milk 4.1 (1.3)
Milk price too low 3.3 (1.2)
Too much variability in milk price 2.9 (1.7)
Lack of individual bargaining power 2.5 (2.1)
Initiators of marketing cooperative
Government (% yes) 46
NGOs working in the area (% yes) 17
Donors (% yes) 29
Others (% yes) 8
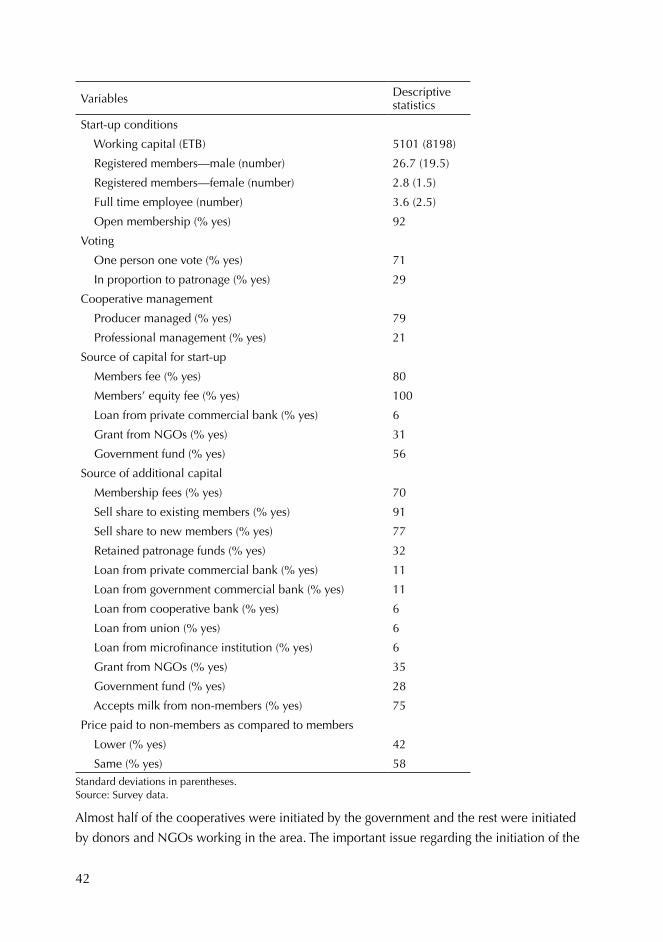
42
Variables Descriptive statistics
Start-up conditions
Working capital (ETB) 5101 (8198)
Registered members—male (number) 26.7 (19.5)
Registered members—female (number) 2.8 (1.5)
Full time employee (number) 3.6 (2.5)
Open membership (% yes) 92
Voting
One person one vote (% yes) 71
In proportion to patronage (% yes) 29
Cooperative management
Producer managed (% yes) 79
Professional management (% yes) 21
Source of capital for start-up
Members fee (% yes) 80
Members’ equity fee (% yes) 100
Loan from private commercial bank (% yes) 6
Grant from NGOs (% yes) 31
Government fund (% yes) 56
Source of additional capital
Membership fees (% yes) 70
Sell share to existing members (% yes) 91
Sell share to new members (% yes) 77
Retained patronage funds (% yes) 32
Loan from private commercial bank (% yes) 11
Loan from government commercial bank (% yes) 11
Loan from cooperative bank (% yes) 6
Loan from union (% yes) 6
Loan from microfinance institution (% yes) 6
Grant from NGOs (% yes) 35
Government fund (% yes) 28
Accepts milk from non-members (% yes) 75
Price paid to non-members as compared to members
Lower (% yes) 42
Same (% yes) 58Standard deviations in parentheses. Source: Survey data.
Almost half of the cooperatives were initiated by the government and the rest were initiated
by donors and NGOs working in the area. The important issue regarding the initiation of the
43
cooperatives is that whether the cooperatives initiated by the government can be allowed
to freely operate as a business enterprise without government interferences. In other words,
the government initiation of the cooperative should not lead to political and bureaucratic
interferences which negatively affect the business activities of the cooperatives. This is
important given the recent memory of bad cooperative management and performance
during the socialist regime among many smallholder farmers. Therefore, it is essential for
those engaged in cooperative establishment to make clear to the members regarding the
cooperatives roles, functions, benefits and its sustainability.
The source of capital for start-up was mainly from the membership fee (80%) and members’
equity share fee payment (100%) while about 56% of the cooperatives reported the use of
government fund to start the milk marketing cooperative. The major sources of additional
capital even after the cooperative has been established were membership fees (70%), sell of
share to existing members (91%) and new members (77%). About 75% of the cooperatives
reported they collect milk not only from the members but also from the non-members.
However, as compared to the members, the non-members are paid lower prices in 42% of
the cases and paid same price in 58% of the cases. The reason why some farmers are not
members but would prefer to sell to the cooperatives at lower prices than the cooperative
members needs investigation. The main bottleneck for new entry was observed to be high
initial share payment to be on the par with old cooperative members. Some noted that the
old cooperative members have increased the share value to use it as entry barrier to other
producers who wish to join the cooperative.
6.2.2 Cooperative management
The existence of effective cooperative management system is essential to manage and adapt
the cooperative to dynamic market environments and to effectively manage the relationships
among the cooperative members and the cooperative and other market actors in the dairy
product value chain. The cooperatives studied are managed by farmer cooperative-members
and the management team is mostly composed of the chair, secretary, auditor, treasurer,
accountant, record keeper and one cooperative member. The demographic characteristics of
cooperative management position holders were analysed in terms of their gender, age, level
of education, cooperative membership status, primary activity and marital status (Table 20).
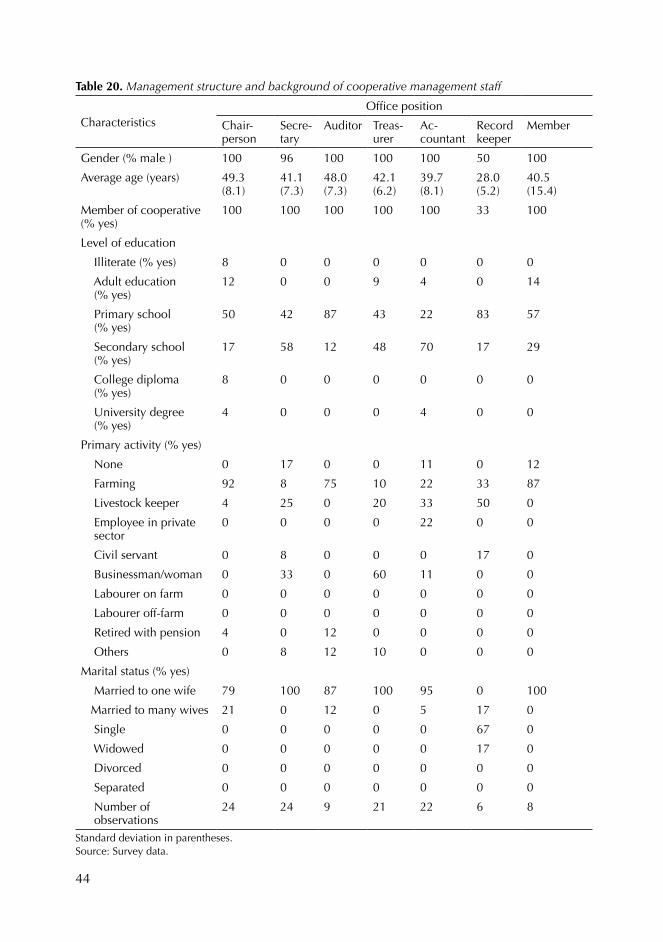
44
Table 20. Management structure and background of cooperative management staff
CharacteristicsOffice position
Chair-person
Secre-tary
Auditor Treas-urer
Ac-countant
Record keeper
Member
Gender (% male ) 100 96 100 100 100 50 100
Average age (years) 49.3 (8.1)
41.1 (7.3)
48.0 (7.3)
42.1 (6.2)
39.7 (8.1)
28.0 (5.2)
40.5 (15.4)
Member of cooperative (% yes)
100 100 100 100 100 33 100
Level of education
Illiterate (% yes) 8 0 0 0 0 0 0
Adult education (% yes)
12 0 0 9 4 0 14
Primary school (% yes)
50 42 87 43 22 83 57
Secondary school (% yes)
17 58 12 48 70 17 29
College diploma (% yes)
8 0 0 0 0 0 0
University degree (% yes)
4 0 0 0 4 0 0
Primary activity (% yes)
None 0 17 0 0 11 0 12
Farming 92 8 75 10 22 33 87
Livestock keeper 4 25 0 20 33 50 0
Employee in private sector
0 0 0 0 22 0 0
Civil servant 0 8 0 0 0 17 0
Businessman/woman 0 33 0 60 11 0 0
Labourer on farm 0 0 0 0 0 0 0
Labourer off-farm 0 0 0 0 0 0 0
Retired with pension 4 0 12 0 0 0 0
Others 0 8 12 10 0 0 0
Marital status (% yes)
Married to one wife 79 100 87 100 95 0 100
Married to many wives 21 0 12 0 5 17 0
Single 0 0 0 0 0 67 0
Widowed 0 0 0 0 0 17 0
Divorced 0 0 0 0 0 0 0
Separated 0 0 0 0 0 0 0
Number of observations
24 24 9 21 22 6 8
Standard deviation in parentheses. Source: Survey data.
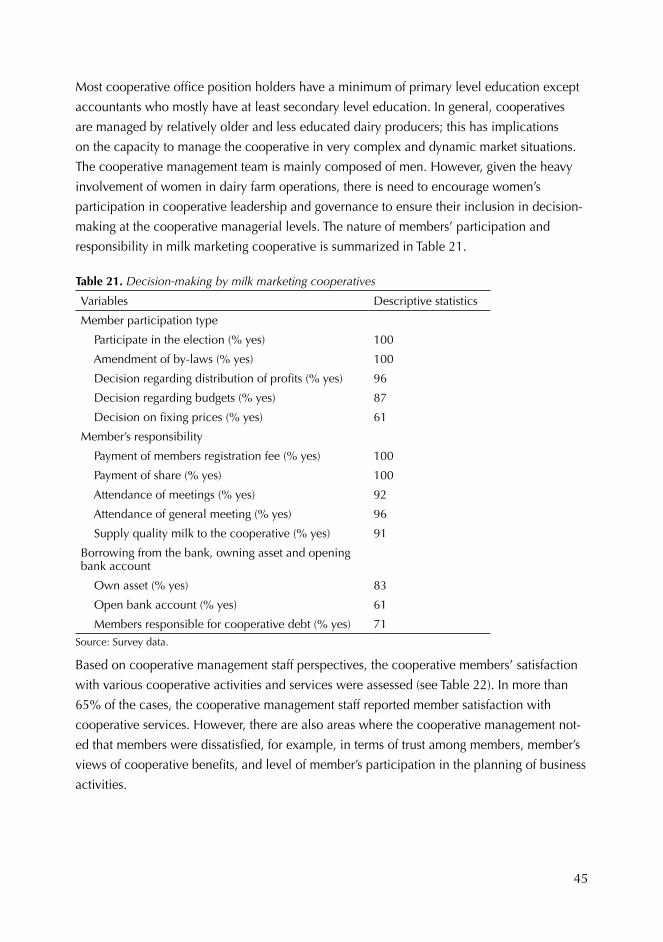
45
Most cooperative office position holders have a minimum of primary level education except
accountants who mostly have at least secondary level education. In general, cooperatives
are managed by relatively older and less educated dairy producers; this has implications
on the capacity to manage the cooperative in very complex and dynamic market situations.
The cooperative management team is mainly composed of men. However, given the heavy
involvement of women in dairy farm operations, there is need to encourage women’s
participation in cooperative leadership and governance to ensure their inclusion in decision-
making at the cooperative managerial levels. The nature of members’ participation and
responsibility in milk marketing cooperative is summarized in Table 21.
Table 21. Decision-making by milk marketing cooperatives
Variables Descriptive statistics
Member participation type
Participate in the election (% yes) 100
Amendment of by-laws (% yes) 100
Decision regarding distribution of profits (% yes) 96
Decision regarding budgets (% yes) 87
Decision on fixing prices (% yes) 61
Member’s responsibility
Payment of members registration fee (% yes) 100
Payment of share (% yes) 100
Attendance of meetings (% yes) 92
Attendance of general meeting (% yes) 96
Supply quality milk to the cooperative (% yes) 91
Borrowing from the bank, owning asset and opening bank account
Own asset (% yes) 83
Open bank account (% yes) 61
Members responsible for cooperative debt (% yes) 71Source: Survey data.
Based on cooperative management staff perspectives, the cooperative members’ satisfaction
with various cooperative activities and services were assessed (see Table 22). In more than
65% of the cases, the cooperative management staff reported member satisfaction with
cooperative services. However, there are also areas where the cooperative management not-
ed that members were dissatisfied, for example, in terms of trust among members, member’s
views of cooperative benefits, and level of member’s participation in the planning of business
activities.
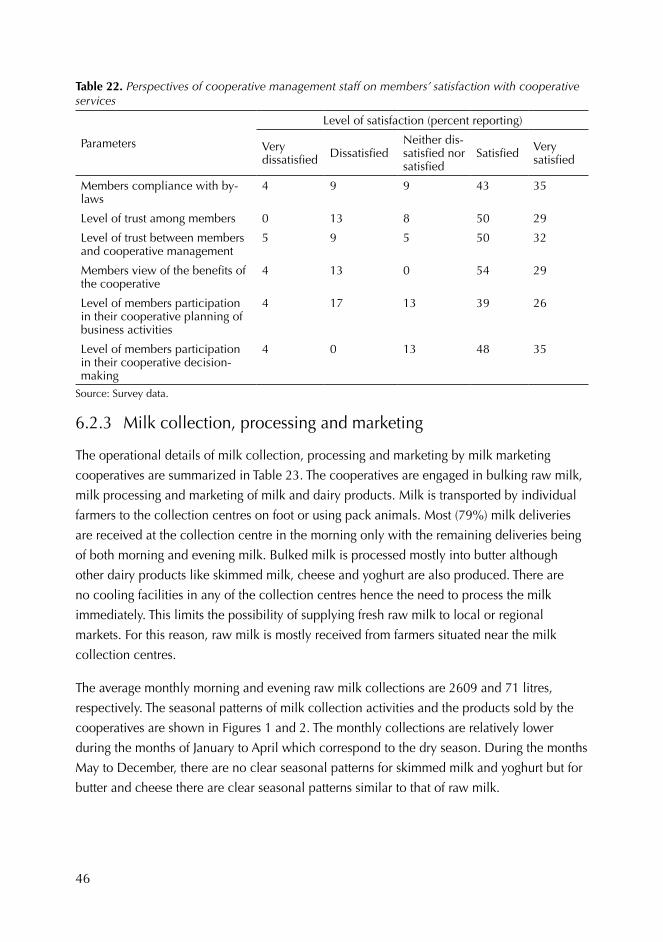
46
Table 22. Perspectives of cooperative management staff on members’ satisfaction with cooperative services
Parameters
Level of satisfaction (percent reporting)
Very dissatisfied Dissatisfied
Neither dis-satisfied nor satisfied
Satisfied Very satisfied
Members compliance with by-laws
4 9 9 43 35
Level of trust among members 0 13 8 50 29
Level of trust between members and cooperative management
5 9 5 50 32
Members view of the benefits of the cooperative
4 13 0 54 29
Level of members participation in their cooperative planning of business activities
4 17 13 39 26
Level of members participation in their cooperative decision-making
4 0 13 48 35
Source: Survey data.
6.2.3 Milk collection, processing and marketing
The operational details of milk collection, processing and marketing by milk marketing
cooperatives are summarized in Table 23. The cooperatives are engaged in bulking raw milk,
milk processing and marketing of milk and dairy products. Milk is transported by individual
farmers to the collection centres on foot or using pack animals. Most (79%) milk deliveries
are received at the collection centre in the morning only with the remaining deliveries being
of both morning and evening milk. Bulked milk is processed mostly into butter although
other dairy products like skimmed milk, cheese and yoghurt are also produced. There are
no cooling facilities in any of the collection centres hence the need to process the milk
immediately. This limits the possibility of supplying fresh raw milk to local or regional
markets. For this reason, raw milk is mostly received from farmers situated near the milk
collection centres.
The average monthly morning and evening raw milk collections are 2609 and 71 litres,
respectively. The seasonal patterns of milk collection activities and the products sold by the
cooperatives are shown in Figures 1 and 2. The monthly collections are relatively lower
during the months of January to April which correspond to the dry season. During the months
May to December, there are no clear seasonal patterns for skimmed milk and yoghurt but for
butter and cheese there are clear seasonal patterns similar to that of raw milk.
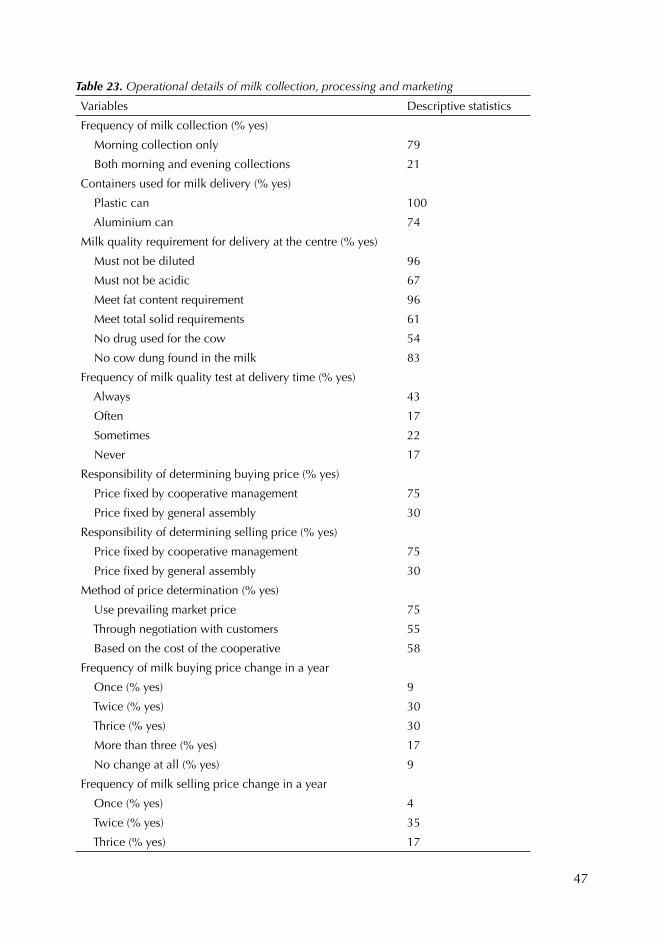
47
Table 23. Operational details of milk collection, processing and marketing
Variables Descriptive statistics
Frequency of milk collection (% yes)
Morning collection only 79
Both morning and evening collections 21
Containers used for milk delivery (% yes)
Plastic can 100
Aluminium can 74
Milk quality requirement for delivery at the centre (% yes)
Must not be diluted 96
Must not be acidic 67
Meet fat content requirement 96
Meet total solid requirements 61
No drug used for the cow 54
No cow dung found in the milk 83
Frequency of milk quality test at delivery time (% yes)
Always 43
Often 17
Sometimes 22
Never 17
Responsibility of determining buying price (% yes)
Price fixed by cooperative management 75
Price fixed by general assembly 30
Responsibility of determining selling price (% yes)
Price fixed by cooperative management 75
Price fixed by general assembly 30
Method of price determination (% yes)
Use prevailing market price 75
Through negotiation with customers 55
Based on the cost of the cooperative 58
Frequency of milk buying price change in a year
Once (% yes) 9
Twice (% yes) 30
Thrice (% yes) 30
More than three (% yes) 17
No change at all (% yes) 9
Frequency of milk selling price change in a year
Once (% yes) 4
Twice (% yes) 35
Thrice (% yes) 17
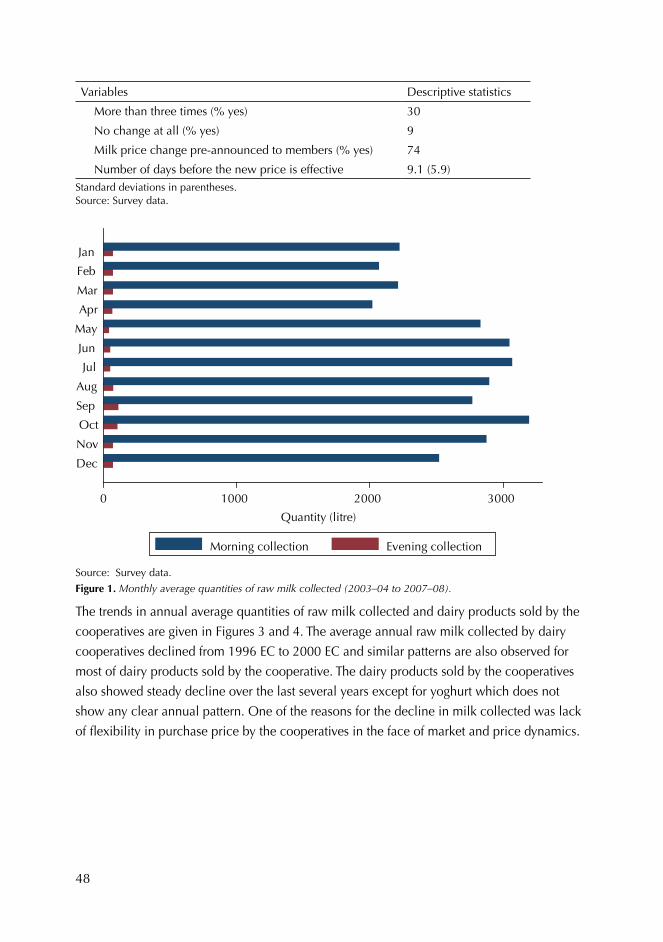
48
Variables Descriptive statistics
More than three times (% yes) 30
No change at all (% yes) 9
Milk price change pre-announced to members (% yes) 74
Number of days before the new price is effective 9.1 (5.9)Standard deviations in parentheses. Source: Survey data.
0 1000 2000 3000
Quantity (litre)
Dec
Nov
Oct
Sep
Aug
Jul
Jun
May
Apr
Mar
Feb
Jan
Morning collection Evening collection
Source: Survey data.
Figure 1. Monthly average quantities of raw milk collected (2003–04 to 2007–08).
The trends in annual average quantities of raw milk collected and dairy products sold by the
cooperatives are given in Figures 3 and 4. The average annual raw milk collected by dairy
cooperatives declined from 1996 EC to 2000 EC and similar patterns are also observed for
most of dairy products sold by the cooperative. The dairy products sold by the cooperatives
also showed steady decline over the last several years except for yoghurt which does not
show any clear annual pattern. One of the reasons for the decline in milk collected was lack
of flexibility in purchase price by the cooperatives in the face of market and price dynamics.
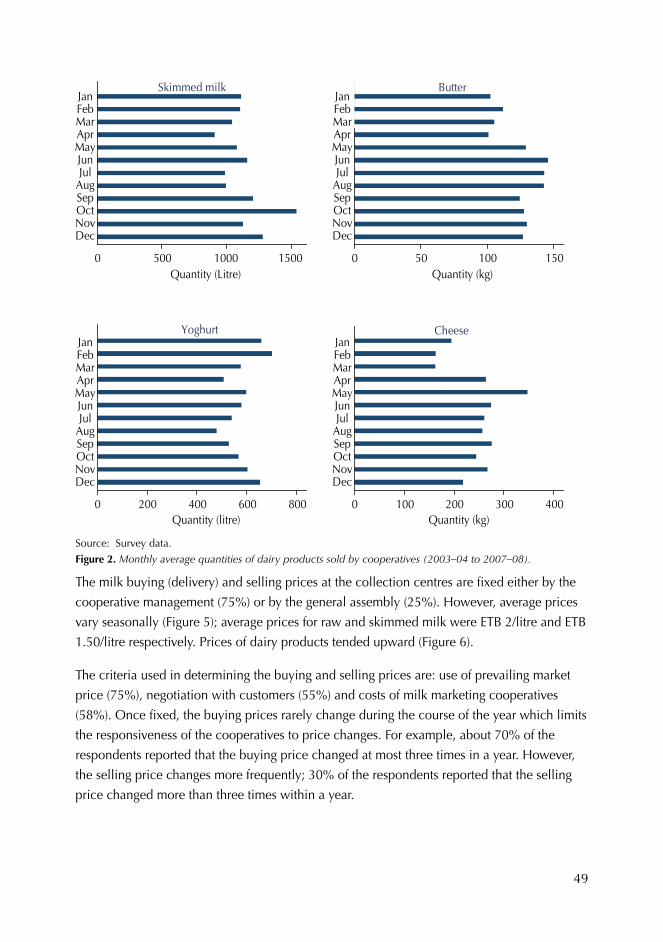
49
0 500 1000 1500Quantity (Litre)
DecNovOctSepAugJulJunMayAprMarFebJan
Skimmed milk
0 50 100 150Quantity (kg)
DecNovOctSepAugJulJunMayAprMarFebJan
Butter
0 200 400 600 800Quantity (litre)
DecNovOctSepAugJulJunMayAprMarFebJan
Yoghurt
0 100 200 300 400Quantity (kg)
DecNovOctSepAugJulJunMayAprMarFebJan
Cheese
Source: Survey data.
Figure 2. Monthly average quantities of dairy products sold by cooperatives (2003–04 to 2007–08).
The milk buying (delivery) and selling prices at the collection centres are fixed either by the
cooperative management (75%) or by the general assembly (25%). However, average prices
vary seasonally (Figure 5); average prices for raw and skimmed milk were ETB 2/litre and ETB
1.50/litre respectively. Prices of dairy products tended upward (Figure 6).
The criteria used in determining the buying and selling prices are: use of prevailing market
price (75%), negotiation with customers (55%) and costs of milk marketing cooperatives
(58%). Once fixed, the buying prices rarely change during the course of the year which limits
the responsiveness of the cooperatives to price changes. For example, about 70% of the
respondents reported that the buying price changed at most three times in a year. However,
the selling price changes more frequently; 30% of the respondents reported that the selling
price changed more than three times within a year.
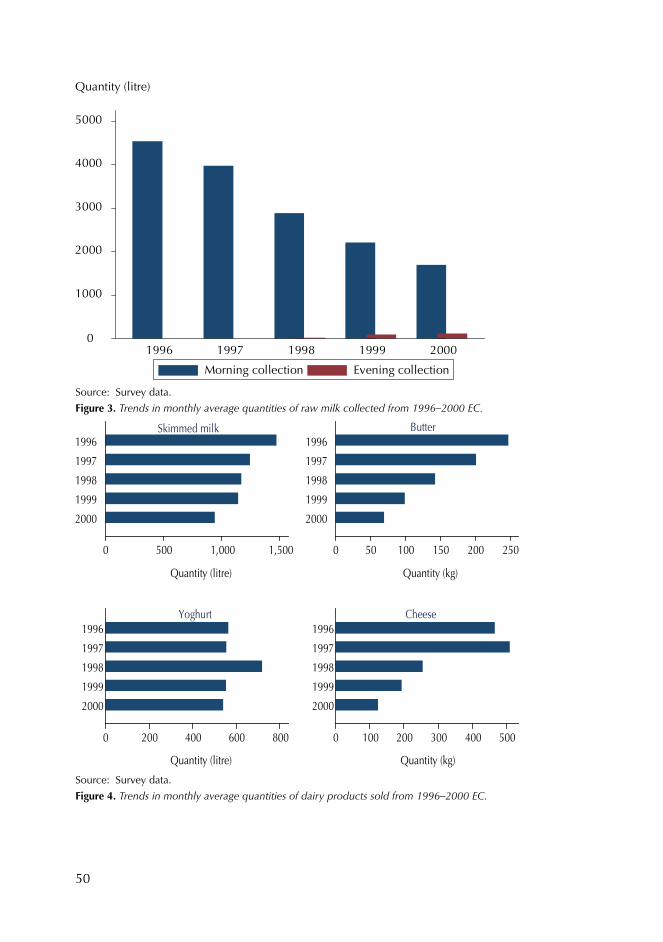
50
0
1000
2000
3000
4000
5000
Quantity (litre)
1996 1997 1998 1999 2000
Morning collection Evening collection Source: Survey data.
Figure 3. Trends in monthly average quantities of raw milk collected from 1996–2000 EC.
0 500 1,000 1,500
Quantity (litre)
2000
1999
1998
1997
1996Skimmed milk
0 50 100 150 200 250
Quantity (kg)
2000
1999
1998
1997
1996Butter
0 200 400 600 800
Quantity (litre)
2000
1999
1998
1997
1996Yoghurt
0 100 200 300 400 500
Quantity (kg)
2000
1999
1998
1997
1996Cheese
Source: Survey data.
Figure 4. Trends in monthly average quantities of dairy products sold from 1996–2000 EC.
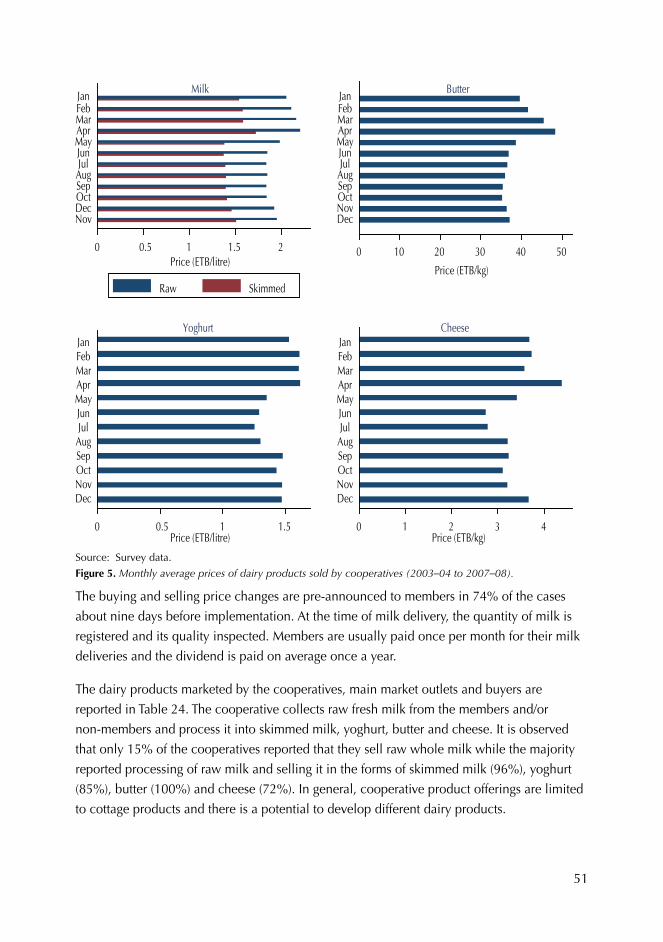
51
0 0.5 1 1.5 2Price (ETB/litre)
DecNov
OctSepAugJulJunMayAprMarFebJan Milk
Raw Skimmed
0 10 20 30 40 50
Price (ETB/kg)
DecNovOctSepAugJulJunMayAprMarFebJan Butter
0 0.5 1 1.5Price (ETB/litre)
DecNovOctSepAugJulJunMayAprMarFebJan
Yoghurt
0 1 2 3 4Price (ETB/kg)
DecNovOctSepAugJulJunMayAprMarFebJan
Cheese
Source: Survey data.
Figure 5. Monthly average prices of dairy products sold by cooperatives (2003–04 to 2007–08).
The buying and selling price changes are pre-announced to members in 74% of the cases
about nine days before implementation. At the time of milk delivery, the quantity of milk is
registered and its quality inspected. Members are usually paid once per month for their milk
deliveries and the dividend is paid on average once a year.
The dairy products marketed by the cooperatives, main market outlets and buyers are
reported in Table 24. The cooperative collects raw fresh milk from the members and/or
non-members and process it into skimmed milk, yoghurt, butter and cheese. It is observed
that only 15% of the cooperatives reported that they sell raw whole milk while the majority
reported processing of raw milk and selling it in the forms of skimmed milk (96%), yoghurt
(85%), butter (100%) and cheese (72%). In general, cooperative product offerings are limited
to cottage products and there is a potential to develop different dairy products.
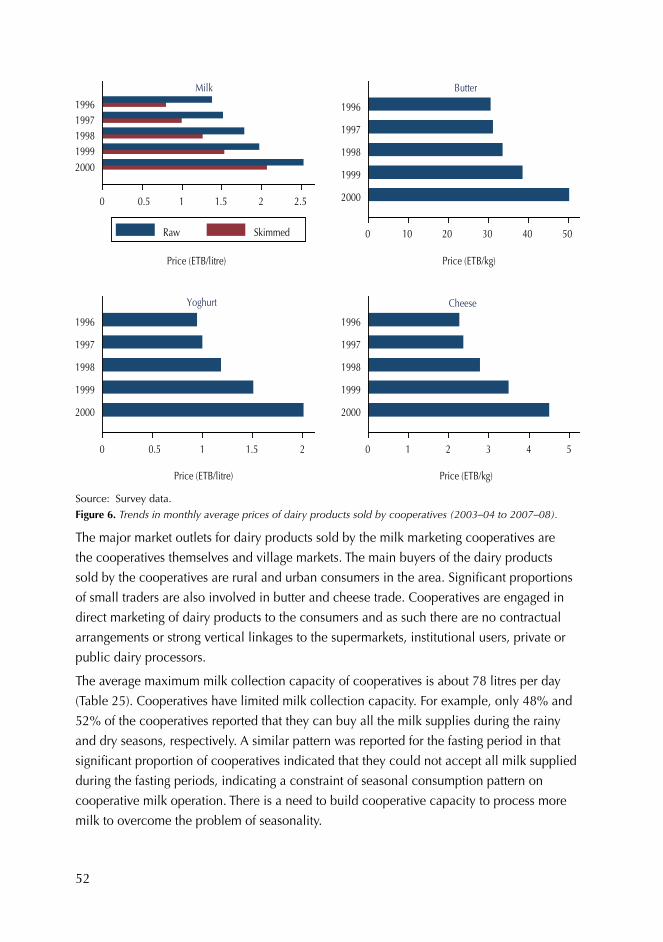
52
0 0.5 1 1.5 2 2.5
Price (ETB/litre)
20001999199819971996
Milk
Raw Skimmed 0 10 20 30 40 50
Price (ETB/kg)
2000
1999
1998
1997
1996
Butter
0 0.5 1 1.5 2
Price (ETB/litre)
2000
1999
1998
1997
1996
Yoghurt
0 1 2 3 4 5
Price (ETB/kg)
2000
1999
1998
1997
1996
Cheese
Source: Survey data.
Figure 6. Trends in monthly average prices of dairy products sold by cooperatives (2003–04 to 2007–08).
The major market outlets for dairy products sold by the milk marketing cooperatives are
the cooperatives themselves and village markets. The main buyers of the dairy products
sold by the cooperatives are rural and urban consumers in the area. Significant proportions
of small traders are also involved in butter and cheese trade. Cooperatives are engaged in
direct marketing of dairy products to the consumers and as such there are no contractual
arrangements or strong vertical linkages to the supermarkets, institutional users, private or
public dairy processors.
The average maximum milk collection capacity of cooperatives is about 78 litres per day
(Table 25). Cooperatives have limited milk collection capacity. For example, only 48% and
52% of the cooperatives reported that they can buy all the milk supplies during the rainy
and dry seasons, respectively. A similar pattern was reported for the fasting period in that
significant proportion of cooperatives indicated that they could not accept all milk supplied
during the fasting periods, indicating a constraint of seasonal consumption pattern on
cooperative milk operation. There is a need to build cooperative capacity to process more
milk to overcome the problem of seasonality.
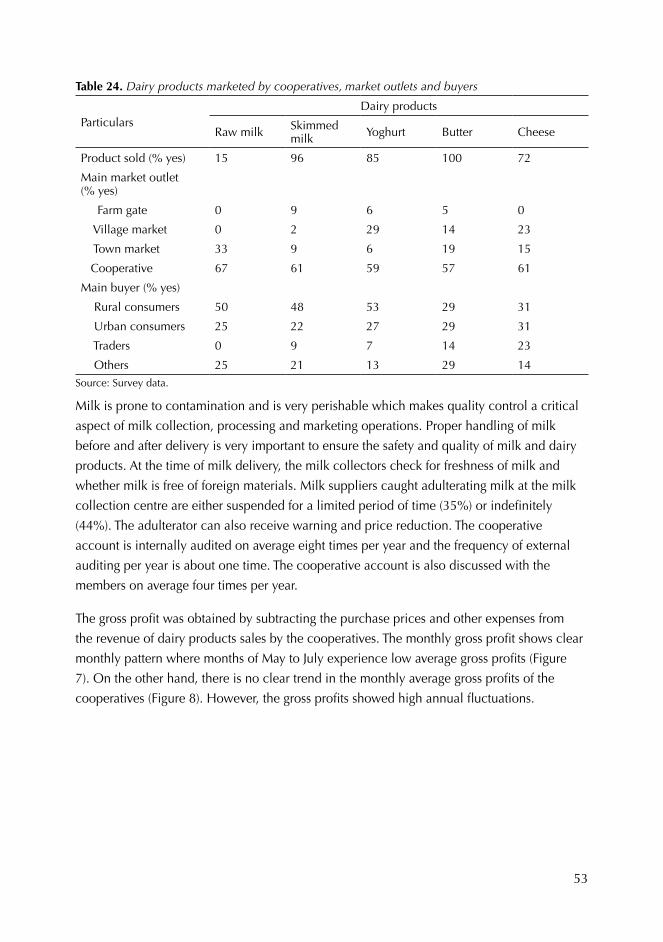
53
Table 24. Dairy products marketed by cooperatives, market outlets and buyers
ParticularsDairy products
Raw milk Skimmed milk Yoghurt Butter Cheese
Product sold (% yes) 15 96 85 100 72
Main market outlet (% yes)
Farm gate 0 9 6 5 0
Village market 0 2 29 14 23
Town market 33 9 6 19 15
Cooperative 67 61 59 57 61
Main buyer (% yes)
Rural consumers 50 48 53 29 31
Urban consumers 25 22 27 29 31
Traders 0 9 7 14 23
Others 25 21 13 29 14Source: Survey data.
Milk is prone to contamination and is very perishable which makes quality control a critical
aspect of milk collection, processing and marketing operations. Proper handling of milk
before and after delivery is very important to ensure the safety and quality of milk and dairy
products. At the time of milk delivery, the milk collectors check for freshness of milk and
whether milk is free of foreign materials. Milk suppliers caught adulterating milk at the milk
collection centre are either suspended for a limited period of time (35%) or indefinitely
(44%). The adulterator can also receive warning and price reduction. The cooperative
account is internally audited on average eight times per year and the frequency of external
auditing per year is about one time. The cooperative account is also discussed with the
members on average four times per year.
The gross profit was obtained by subtracting the purchase prices and other expenses from
the revenue of dairy products sales by the cooperatives. The monthly gross profit shows clear
monthly pattern where months of May to July experience low average gross profits (Figure
7). On the other hand, there is no clear trend in the monthly average gross profits of the
cooperatives (Figure 8). However, the gross profits showed high annual fluctuations.
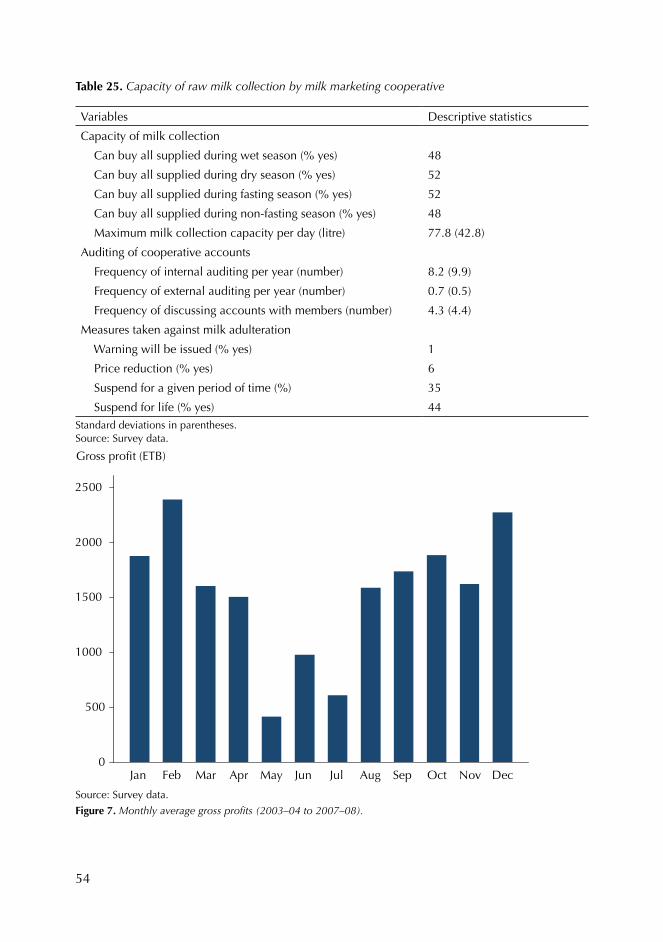
54
Table 25. Capacity of raw milk collection by milk marketing cooperative
Variables Descriptive statistics
Capacity of milk collection
Can buy all supplied during wet season (% yes) 48
Can buy all supplied during dry season (% yes) 52
Can buy all supplied during fasting season (% yes) 52
Can buy all supplied during non-fasting season (% yes) 48
Maximum milk collection capacity per day (litre) 77.8 (42.8)
Auditing of cooperative accounts
Frequency of internal auditing per year (number) 8.2 (9.9)
Frequency of external auditing per year (number) 0.7 (0.5)
Frequency of discussing accounts with members (number) 4.3 (4.4)
Measures taken against milk adulteration
Warning will be issued (% yes) 1
Price reduction (% yes) 6
Suspend for a given period of time (%) 35
Suspend for life (% yes) 44Standard deviations in parentheses. Source: Survey data.
0
500
1000
1500
2000
2500
Gross profit (ETB)
Jan Feb Mar Apr May Jun Jul Aug Sep Oct Nov Dec
Source: Survey data.
Figure 7. Monthly average gross profits (2003–04 to 2007–08).
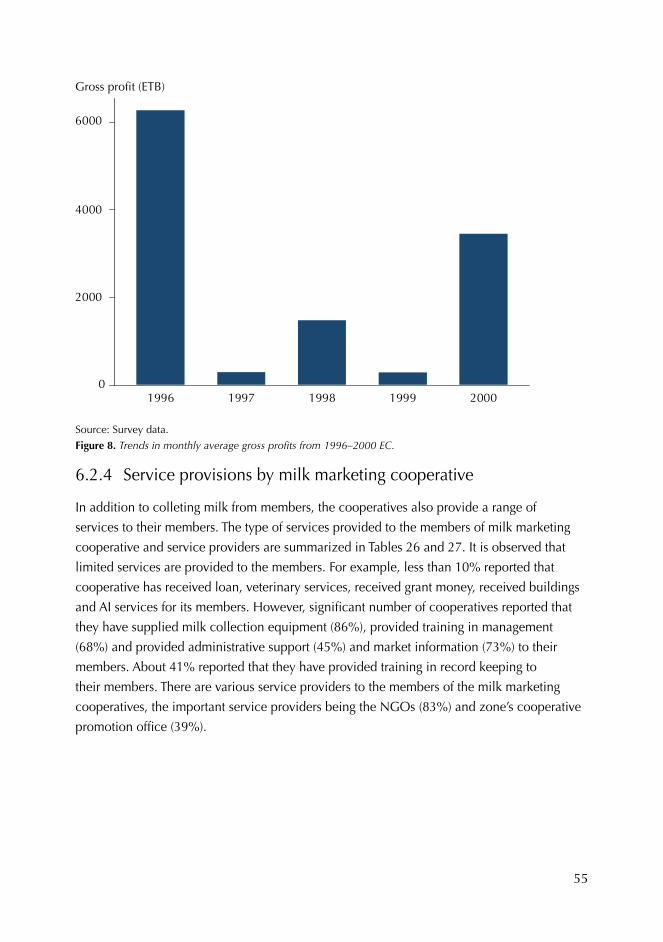
55
0
2000
4000
6000
Gross profit (ETB)
1996 1997 1998 1999 2000
Source: Survey data.
Figure 8. Trends in monthly average gross profits from 1996–2000 EC.
6.2.4 Service provisions by milk marketing cooperative
In addition to colleting milk from members, the cooperatives also provide a range of
services to their members. The type of services provided to the members of milk marketing
cooperative and service providers are summarized in Tables 26 and 27. It is observed that
limited services are provided to the members. For example, less than 10% reported that
cooperative has received loan, veterinary services, received grant money, received buildings
and AI services for its members. However, significant number of cooperatives reported that
they have supplied milk collection equipment (86%), provided training in management
(68%) and provided administrative support (45%) and market information (73%) to their
members. About 41% reported that they have provided training in record keeping to
their members. There are various service providers to the members of the milk marketing
cooperatives, the important service providers being the NGOs (83%) and zone’s cooperative
promotion office (39%).
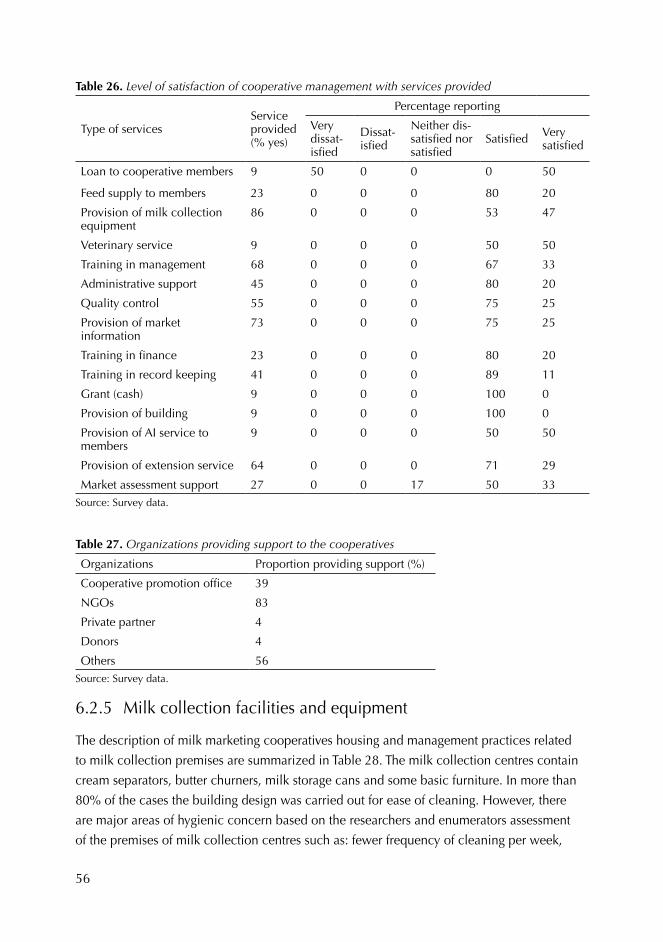
56
Table 26. Level of satisfaction of cooperative management with services provided
Type of services Service provided (% yes)
Percentage reporting
Very dissat-isfied
Dissat-isfied
Neither dis-satisfied nor satisfied
Satisfied Very satisfied
Loan to cooperative members 9 50 0 0 0 50
Feed supply to members 23 0 0 0 80 20
Provision of milk collection equipment
86 0 0 0 53 47
Veterinary service 9 0 0 0 50 50
Training in management 68 0 0 0 67 33
Administrative support 45 0 0 0 80 20
Quality control 55 0 0 0 75 25
Provision of market information
73 0 0 0 75 25
Training in finance 23 0 0 0 80 20
Training in record keeping 41 0 0 0 89 11
Grant (cash) 9 0 0 0 100 0
Provision of building 9 0 0 0 100 0
Provision of AI service to members
9 0 0 0 50 50
Provision of extension service 64 0 0 0 71 29
Market assessment support 27 0 0 17 50 33Source: Survey data.
Table 27. Organizations providing support to the cooperatives
Organizations Proportion providing support (%)
Cooperative promotion office 39
NGOs 83
Private partner 4
Donors 4
Others 56Source: Survey data.
6.2.5 Milk collection facilities and equipment
The description of milk marketing cooperatives housing and management practices related
to milk collection premises are summarized in Table 28. The milk collection centres contain
cream separators, butter churners, milk storage cans and some basic furniture. In more than
80% of the cases the building design was carried out for ease of cleaning. However, there
are major areas of hygienic concern based on the researchers and enumerators assessment
of the premises of milk collection centres such as: fewer frequency of cleaning per week,
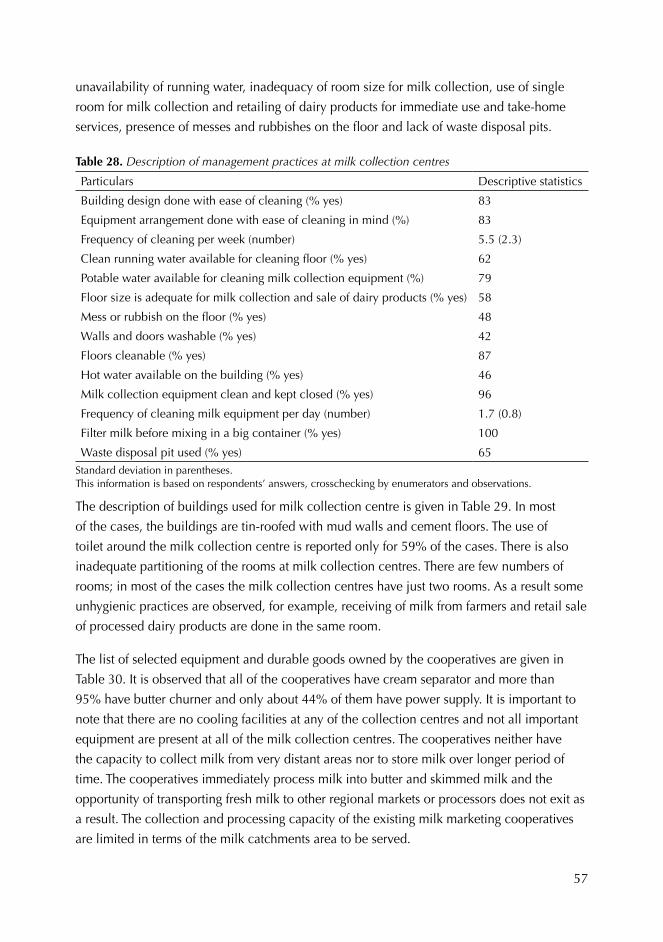
57
unavailability of running water, inadequacy of room size for milk collection, use of single
room for milk collection and retailing of dairy products for immediate use and take-home
services, presence of messes and rubbishes on the floor and lack of waste disposal pits.
Table 28. Description of management practices at milk collection centres
Particulars Descriptive statistics
Building design done with ease of cleaning (% yes) 83
Equipment arrangement done with ease of cleaning in mind (%) 83
Frequency of cleaning per week (number) 5.5 (2.3)
Clean running water available for cleaning floor (% yes) 62
Potable water available for cleaning milk collection equipment (%) 79
Floor size is adequate for milk collection and sale of dairy products (% yes) 58
Mess or rubbish on the floor (% yes) 48
Walls and doors washable (% yes) 42
Floors cleanable (% yes) 87
Hot water available on the building (% yes) 46
Milk collection equipment clean and kept closed (% yes) 96
Frequency of cleaning milk equipment per day (number) 1.7 (0.8)
Filter milk before mixing in a big container (% yes) 100
Waste disposal pit used (% yes) 65Standard deviation in parentheses. This information is based on respondents’ answers, crosschecking by enumerators and observations.
The description of buildings used for milk collection centre is given in Table 29. In most
of the cases, the buildings are tin-roofed with mud walls and cement floors. The use of
toilet around the milk collection centre is reported only for 59% of the cases. There is also
inadequate partitioning of the rooms at milk collection centres. There are few numbers of
rooms; in most of the cases the milk collection centres have just two rooms. As a result some
unhygienic practices are observed, for example, receiving of milk from farmers and retail sale
of processed dairy products are done in the same room.
The list of selected equipment and durable goods owned by the cooperatives are given in
Table 30. It is observed that all of the cooperatives have cream separator and more than
95% have butter churner and only about 44% of them have power supply. It is important to
note that there are no cooling facilities at any of the collection centres and not all important
equipment are present at all of the milk collection centres. The cooperatives neither have
the capacity to collect milk from very distant areas nor to store milk over longer period of
time. The cooperatives immediately process milk into butter and skimmed milk and the
opportunity of transporting fresh milk to other regional markets or processors does not exit as
a result. The collection and processing capacity of the existing milk marketing cooperatives
are limited in terms of the milk catchments area to be served.
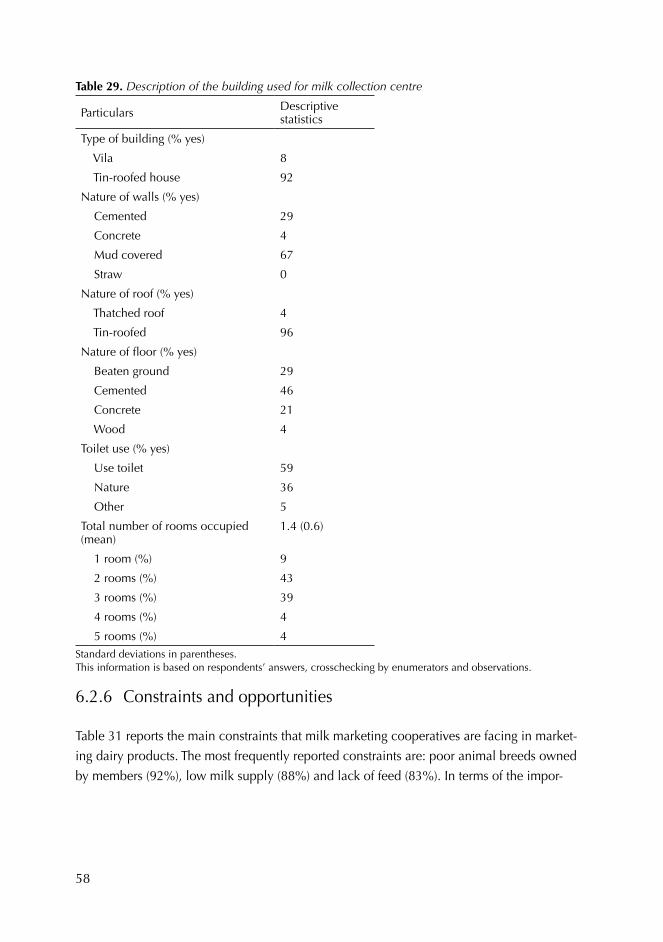
58
Table 29. Description of the building used for milk collection centre
Particulars Descriptive statistics
Type of building (% yes)
Vila 8
Tin-roofed house 92
Nature of walls (% yes)
Cemented 29
Concrete 4
Mud covered 67
Straw 0
Nature of roof (% yes)
Thatched roof 4
Tin-roofed 96
Nature of floor (% yes)
Beaten ground 29
Cemented 46
Concrete 21
Wood 4
Toilet use (% yes)
Use toilet 59
Nature 36
Other 5
Total number of rooms occupied (mean)
1.4 (0.6)
1 room (%) 9
2 rooms (%) 43
3 rooms (%) 39
4 rooms (%) 4
5 rooms (%) 4Standard deviations in parentheses. This information is based on respondents’ answers, crosschecking by enumerators and observations.
6.2.6 Constraints and opportunities
Table 31 reports the main constraints that milk marketing cooperatives are facing in market-
ing dairy products. The most frequently reported constraints are: poor animal breeds owned
by members (92%), low milk supply (88%) and lack of feed (83%). In terms of the impor-
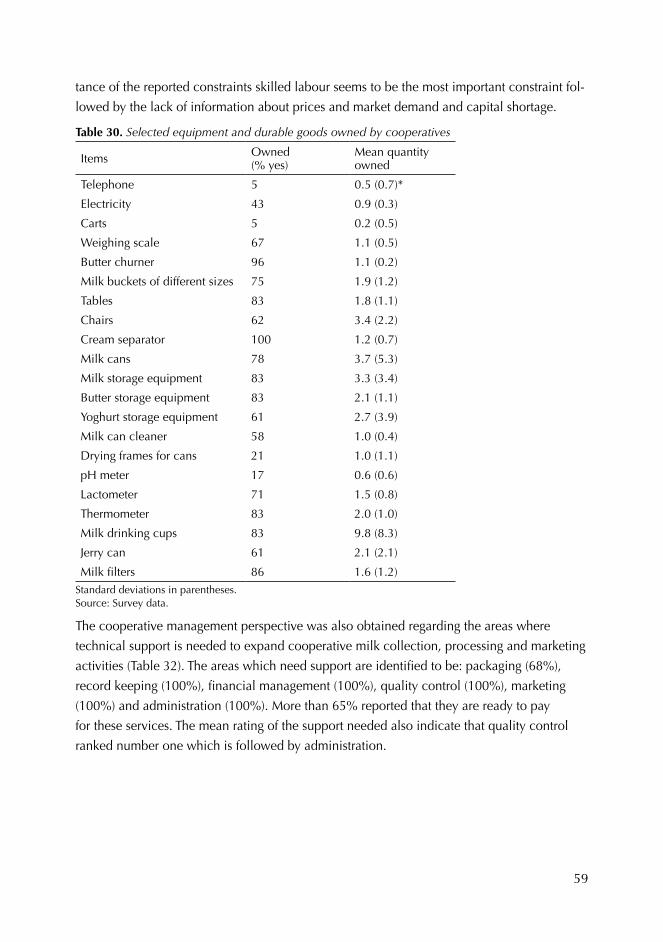
59
tance of the reported constraints skilled labour seems to be the most important constraint fol-
lowed by the lack of information about prices and market demand and capital shortage.
Table 30. Selected equipment and durable goods owned by cooperatives
Items Owned (% yes)
Mean quantity owned
Telephone 5 0.5 (0.7)*
Electricity 43 0.9 (0.3)
Carts 5 0.2 (0.5)
Weighing scale 67 1.1 (0.5)
Butter churner 96 1.1 (0.2)
Milk buckets of different sizes 75 1.9 (1.2)
Tables 83 1.8 (1.1)
Chairs 62 3.4 (2.2)
Cream separator 100 1.2 (0.7)
Milk cans 78 3.7 (5.3)
Milk storage equipment 83 3.3 (3.4)
Butter storage equipment 83 2.1 (1.1)
Yoghurt storage equipment 61 2.7 (3.9)
Milk can cleaner 58 1.0 (0.4)
Drying frames for cans 21 1.0 (1.1)
pH meter 17 0.6 (0.6)
Lactometer 71 1.5 (0.8)
Thermometer 83 2.0 (1.0)
Milk drinking cups 83 9.8 (8.3)
Jerry can 61 2.1 (2.1)
Milk filters 86 1.6 (1.2)Standard deviations in parentheses. Source: Survey data.
The cooperative management perspective was also obtained regarding the areas where
technical support is needed to expand cooperative milk collection, processing and marketing
activities (Table 32). The areas which need support are identified to be: packaging (68%),
record keeping (100%), financial management (100%), quality control (100%), marketing
(100%) and administration (100%). More than 65% reported that they are ready to pay
for these services. The mean rating of the support needed also indicate that quality control
ranked number one which is followed by administration.
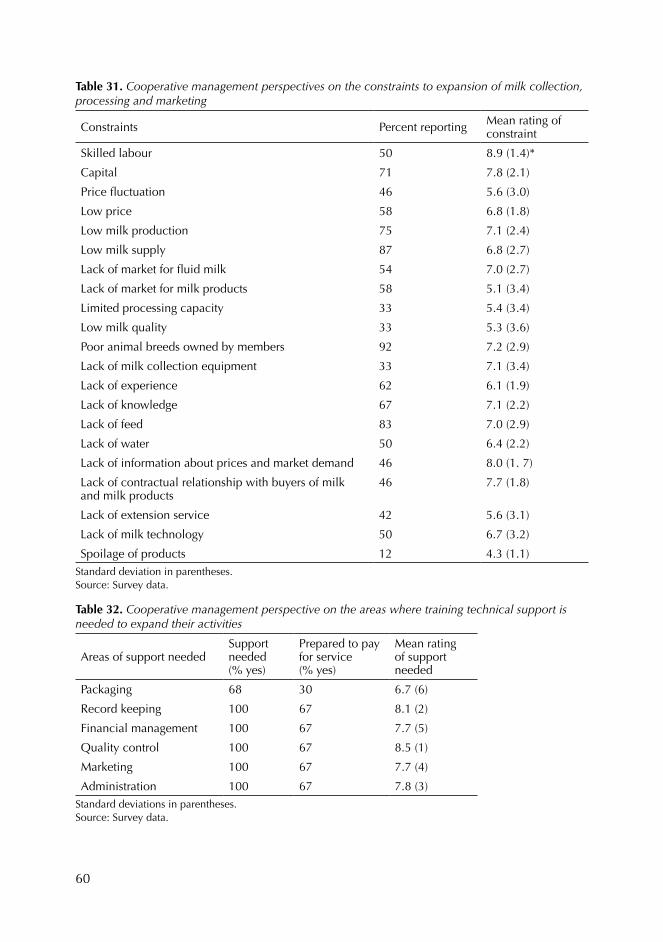
60
Table 31. Cooperative management perspectives on the constraints to expansion of milk collection, processing and marketing
Constraints Percent reporting Mean rating of constraint
Skilled labour 50 8.9 (1.4)*
Capital 71 7.8 (2.1)
Price fluctuation 46 5.6 (3.0)
Low price 58 6.8 (1.8)
Low milk production 75 7.1 (2.4)
Low milk supply 87 6.8 (2.7)
Lack of market for fluid milk 54 7.0 (2.7)
Lack of market for milk products 58 5.1 (3.4)
Limited processing capacity 33 5.4 (3.4)
Low milk quality 33 5.3 (3.6)
Poor animal breeds owned by members 92 7.2 (2.9)
Lack of milk collection equipment 33 7.1 (3.4)
Lack of experience 62 6.1 (1.9)
Lack of knowledge 67 7.1 (2.2)
Lack of feed 83 7.0 (2.9)
Lack of water 50 6.4 (2.2)
Lack of information about prices and market demand 46 8.0 (1. 7)
Lack of contractual relationship with buyers of milk and milk products
46 7.7 (1.8)
Lack of extension service 42 5.6 (3.1)
Lack of milk technology 50 6.7 (3.2)
Spoilage of products 12 4.3 (1.1)Standard deviation in parentheses. Source: Survey data.
Table 32. Cooperative management perspective on the areas where training technical support is needed to expand their activities
Areas of support neededSupport needed (% yes)
Prepared to pay for service (% yes)
Mean rating of support needed
Packaging 68 30 6.7 (6)
Record keeping 100 67 8.1 (2)
Financial management 100 67 7.7 (5)
Quality control 100 67 8.5 (1)
Marketing 100 67 7.7 (4)
Administration 100 67 7.8 (3)Standard deviations in parentheses. Source: Survey data.
61
So far the activities of milk marketing cooperatives are limited to bulking, basic processing
and marketing of the dairy products. There are no observable business linkages along
the dairy product value chain. There are opportunities for strong vertical coordination
through linkages such as with local institutional milk buyers, supermarkets and private milk
processors. The other option to be considered is the vertical integration of the milk marketing
cooperatives through the establishment of union of cooperatives at the zone level which
collect, process, and market milk and milk products from the milk marketing cooperatives.
Currently, there is one cooperative union which is under establishment.
6.3 Section summary
The principal dairy products that are handled by the dairy cooperatives are: butter, skimmed
milk, cheese and yoghurt. These products are mainly destined for local consumers. There is
no fresh fluid milk available for sale from the cooperatives. The average milk collected by
each milk collection centre is 78 litres fluid milk per day. This means that the total amount of
milk that can be collected by all milk collection centres is 1872 litres per day. This amount
of milk is very small to engage in further value adding activities like milk chilling plant or
processing plant operations. Thus, there is a need to expand the capacity of the existing
milk collection centres required to procure and market increasing volume of milk and milk
products. With the increase in number of milk collection centres and cooperatives, the
volume of milk to be collected and processed also increases. As the volume increases there
is a need to form a cooperative union which buys all cooperatives milk, then processes and
markets fluid milk and milk products. There is a need to strengthen the local zone level
cooperatives union which would serve as a mechanism in further vertically integrating the
cooperative to local and regional markets.
The scaling-up is needed because the quantity of milk collected is small and the membership
coverage is limited given the potential number of dairy producers that could be the members
of the milk marketing cooperative and the geographic areas that could be included. There are
very few milk collection centres and the milk marketing cooperatives do not exist in all areas,
particularly in remote off-all-weather roads. Usually, where the cooperatives exist, in one
peasant association there is only one marketing cooperative with only one milk collection
centre. Furthermore, the cooperative members account for insignificant proportion of the
total farmers in the peasant associations which indicate limited membership in the milk
marketing cooperative. The range of dairy products handled and the processing capacity of
the cooperatives are also limited. The major dairy products sold are cottage skimmed milk,
butter, cheese and yoghurt.
62
There is opportunity for scaling up the cooperative marketing activities and increase milk
collection. The analyses of consumer purchase and consumption patterns indicate that
there is very good prospect for dairy product market expansion. The demand for milk
and milk products is unsatisfied locally and there are also regional and national market
opportunities given unmet demand. However, it is important to investigate the reason for
limited membership in the cooperative, especially why some dairy farmers sell milk to the
cooperatives but prefer to remain non-members.
The cooperative capacity needs to develop not only to meet local demand but also to
exploit regional market opportunities. There is a need to organize dairy producers into
milk marketing cooperatives by increasing the membership of existing cooperatives and/or
establishing new milk marketing cooperatives and increase the number of milk collection
centres. There is also a need to move to distant markets to expand their sales opportunities.
However, for up-scaling to work there is a need to either link the milk collection centres to
existing milk processing plants or vertically integrate them through the development of a
cooperative union in order to assure market for increased milk production.
63
7 Empirical results for consumer survey7.1 Introduction
Historically, there have been continued efforts to promote smallholder dairy production in
Ethiopia by the government and non-governmental organizations (for recent studies and
review of past dairy interventions in Ethiopia see Ahmed et al. 2004; Bernard et al. 2008 and
Yigrem et al. 2008). However, very little attention has been given in terms of understanding
the local purchase and consumption patterns for dairy products by the consumers in the
production area. For example, what are the most important demographic and socioeconomic
variables which influence consumers’ dairy product purchase and consumption decisions?
To what extent can the existing local market absorb an increase in dairy production through
various project efforts and what promotional strategies, pricing methods and product
development strategies can be used to maintain sustainable consumption base for an
increased dairy production resulting from project interventions?
In general, to be effective, private sector dairy marketing strategies and the public sector
efforts to promote the production and consumption of dairy products in a given area need
to be informed about the consumers dairy products purchase and consumption behaviours.
The perspective of the final consumer is very important in identifying marketing actions and
strategies to improve dairy products production and consumption. This section presents the
results of descriptive and econometric analyses of dairy products consumers’ purchase and
consumption behaviours in the FAO dairy project area based on sample survey of cross-
sections of urban consumers in two towns. This study is an attempt to bridge the empirical
gap in the understanding of dairy consumers’ behaviours in the area which has implications
for different actors involved (dairy producers, dairy agribusiness firms, governmental and
non-governmental organizations etc.) in dairy development.
7.2 Results of descriptive analysis7.2.1 Dairy product categories, purchase frequencies and seasonality
The dairy product categories purchased and consumer purchase frequencies during wet and
dry seasons are given in Table 33. There are four dairy product categories produced locally
which are widely consumed in the area: fluid milk, edible butter, cosmetic butter and soft
cheese. The other dairy products that exist in the market but less frequently purchased are
cottage yoghurt, skimmed milk, powder milk, pasteurized milk and imported butter. For each
of these dairy product categories, the percentages of consumers who reported purchases
are less than 10%. This shows the consumption of imported dairy products is very limited in
the area which indicates currently there is low level of competitive pressures from imported
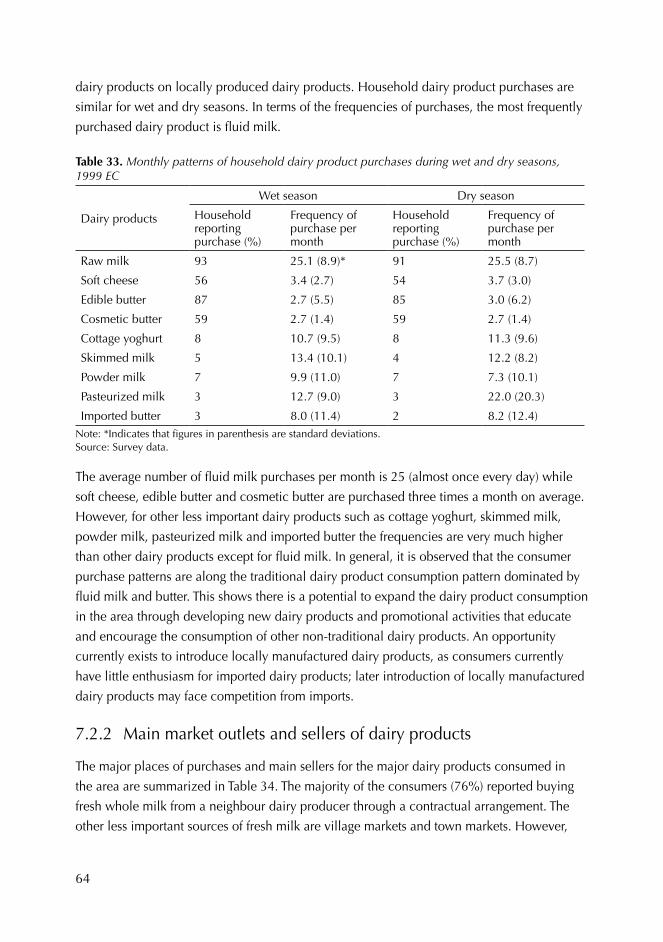
64
dairy products on locally produced dairy products. Household dairy product purchases are
similar for wet and dry seasons. In terms of the frequencies of purchases, the most frequently
purchased dairy product is fluid milk.
Table 33. Monthly patterns of household dairy product purchases during wet and dry seasons, 1999 EC
Dairy products
Wet season Dry season
Household reporting purchase (%)
Frequency of purchase per month
Household reporting purchase (%)
Frequency of purchase per month
Raw milk 93 25.1 (8.9)* 91 25.5 (8.7)
Soft cheese 56 3.4 (2.7) 54 3.7 (3.0)
Edible butter 87 2.7 (5.5) 85 3.0 (6.2)
Cosmetic butter 59 2.7 (1.4) 59 2.7 (1.4)
Cottage yoghurt 8 10.7 (9.5) 8 11.3 (9.6)
Skimmed milk 5 13.4 (10.1) 4 12.2 (8.2)
Powder milk 7 9.9 (11.0) 7 7.3 (10.1)
Pasteurized milk 3 12.7 (9.0) 3 22.0 (20.3)
Imported butter 3 8.0 (11.4) 2 8.2 (12.4)Note: *Indicates that figures in parenthesis are standard deviations. Source: Survey data.
The average number of fluid milk purchases per month is 25 (almost once every day) while
soft cheese, edible butter and cosmetic butter are purchased three times a month on average.
However, for other less important dairy products such as cottage yoghurt, skimmed milk,
powder milk, pasteurized milk and imported butter the frequencies are very much higher
than other dairy products except for fluid milk. In general, it is observed that the consumer
purchase patterns are along the traditional dairy product consumption pattern dominated by
fluid milk and butter. This shows there is a potential to expand the dairy product consumption
in the area through developing new dairy products and promotional activities that educate
and encourage the consumption of other non-traditional dairy products. An opportunity
currently exists to introduce locally manufactured dairy products, as consumers currently
have little enthusiasm for imported dairy products; later introduction of locally manufactured
dairy products may face competition from imports.
7.2.2 Main market outlets and sellers of dairy products
The major places of purchases and main sellers for the major dairy products consumed in
the area are summarized in Table 34. The majority of the consumers (76%) reported buying
fresh whole milk from a neighbour dairy producer through a contractual arrangement. The
other less important sources of fresh milk are village markets and town markets. However,
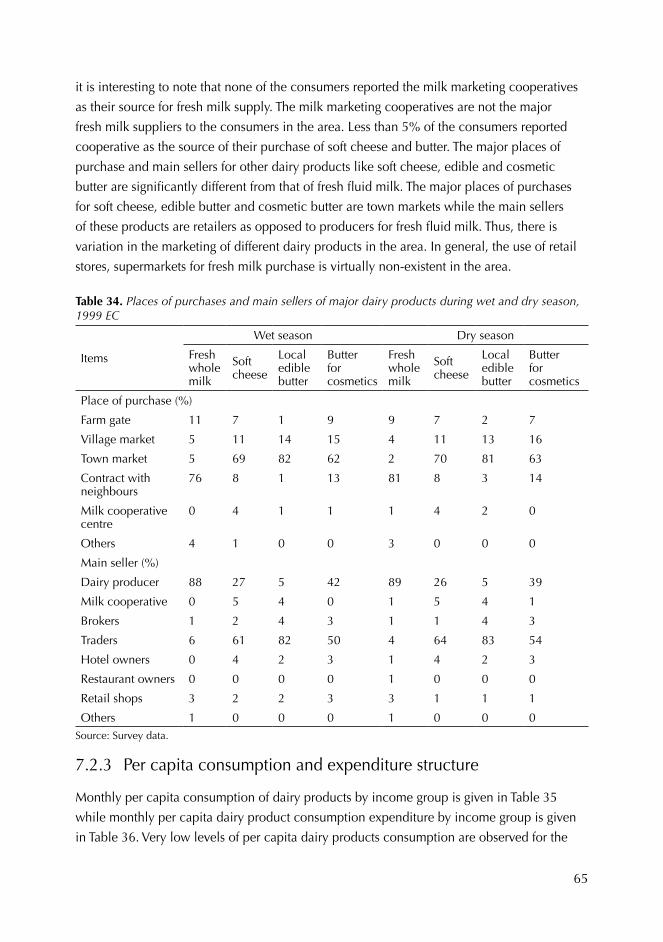
65
it is interesting to note that none of the consumers reported the milk marketing cooperatives
as their source for fresh milk supply. The milk marketing cooperatives are not the major
fresh milk suppliers to the consumers in the area. Less than 5% of the consumers reported
cooperative as the source of their purchase of soft cheese and butter. The major places of
purchase and main sellers for other dairy products like soft cheese, edible and cosmetic
butter are significantly different from that of fresh fluid milk. The major places of purchases
for soft cheese, edible butter and cosmetic butter are town markets while the main sellers
of these products are retailers as opposed to producers for fresh fluid milk. Thus, there is
variation in the marketing of different dairy products in the area. In general, the use of retail
stores, supermarkets for fresh milk purchase is virtually non-existent in the area.
Table 34. Places of purchases and main sellers of major dairy products during wet and dry season, 1999 EC
Items
Wet season Dry season
Fresh whole milk
Soft cheese
Local edible butter
Butter for cosmetics
Fresh whole milk
Soft cheese
Local edible butter
Butter for cosmetics
Place of purchase (%)
Farm gate 11 7 1 9 9 7 2 7
Village market 5 11 14 15 4 11 13 16
Town market 5 69 82 62 2 70 81 63
Contract with neighbours
76 8 1 13 81 8 3 14
Milk cooperative centre
0 4 1 1 1 4 2 0
Others 4 1 0 0 3 0 0 0
Main seller (%)
Dairy producer 88 27 5 42 89 26 5 39
Milk cooperative 0 5 4 0 1 5 4 1
Brokers 1 2 4 3 1 1 4 3
Traders 6 61 82 50 4 64 83 54
Hotel owners 0 4 2 3 1 4 2 3
Restaurant owners 0 0 0 0 1 0 0 0
Retail shops 3 2 2 3 3 1 1 1
Others 1 0 0 0 1 0 0 0Source: Survey data.
7.2.3 Per capita consumption and expenditure structure
Monthly per capita consumption of dairy products by income group is given in Table 35
while monthly per capita dairy product consumption expenditure by income group is given
in Table 36. Very low levels of per capita dairy products consumption are observed for the
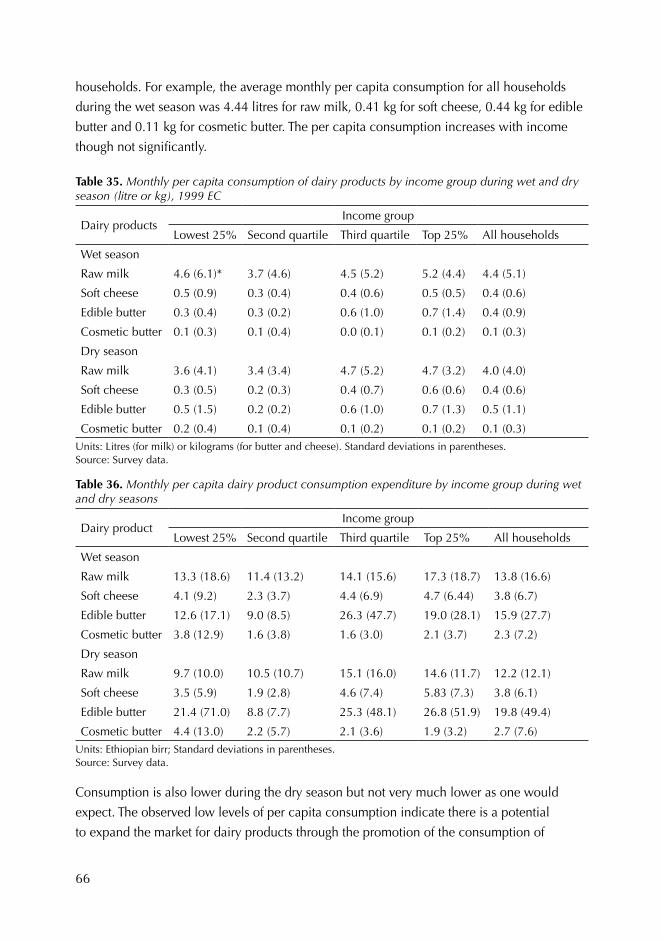
66
households. For example, the average monthly per capita consumption for all households
during the wet season was 4.44 litres for raw milk, 0.41 kg for soft cheese, 0.44 kg for edible
butter and 0.11 kg for cosmetic butter. The per capita consumption increases with income
though not significantly.
Table 35. Monthly per capita consumption of dairy products by income group during wet and dry season (litre or kg), 1999 EC
Dairy productsIncome group
Lowest 25% Second quartile Third quartile Top 25% All households
Wet season
Raw milk 4.6 (6.1)* 3.7 (4.6) 4.5 (5.2) 5.2 (4.4) 4.4 (5.1)
Soft cheese 0.5 (0.9) 0.3 (0.4) 0.4 (0.6) 0.5 (0.5) 0.4 (0.6)
Edible butter 0.3 (0.4) 0.3 (0.2) 0.6 (1.0) 0.7 (1.4) 0.4 (0.9)
Cosmetic butter 0.1 (0.3) 0.1 (0.4) 0.0 (0.1) 0.1 (0.2) 0.1 (0.3)
Dry season
Raw milk 3.6 (4.1) 3.4 (3.4) 4.7 (5.2) 4.7 (3.2) 4.0 (4.0)
Soft cheese 0.3 (0.5) 0.2 (0.3) 0.4 (0.7) 0.6 (0.6) 0.4 (0.6)
Edible butter 0.5 (1.5) 0.2 (0.2) 0.6 (1.0) 0.7 (1.3) 0.5 (1.1)
Cosmetic butter 0.2 (0.4) 0.1 (0.4) 0.1 (0.2) 0.1 (0.2) 0.1 (0.3)Units: Litres (for milk) or kilograms (for butter and cheese). Standard deviations in parentheses. Source: Survey data.
Table 36. Monthly per capita dairy product consumption expenditure by income group during wet and dry seasons
Dairy productIncome group
Lowest 25% Second quartile Third quartile Top 25% All households
Wet season
Raw milk 13.3 (18.6) 11.4 (13.2) 14.1 (15.6) 17.3 (18.7) 13.8 (16.6)
Soft cheese 4.1 (9.2) 2.3 (3.7) 4.4 (6.9) 4.7 (6.44) 3.8 (6.7)
Edible butter 12.6 (17.1) 9.0 (8.5) 26.3 (47.7) 19.0 (28.1) 15.9 (27.7)
Cosmetic butter 3.8 (12.9) 1.6 (3.8) 1.6 (3.0) 2.1 (3.7) 2.3 (7.2)
Dry season
Raw milk 9.7 (10.0) 10.5 (10.7) 15.1 (16.0) 14.6 (11.7) 12.2 (12.1)
Soft cheese 3.5 (5.9) 1.9 (2.8) 4.6 (7.4) 5.83 (7.3) 3.8 (6.1)
Edible butter 21.4 (71.0) 8.8 (7.7) 25.3 (48.1) 26.8 (51.9) 19.8 (49.4)
Cosmetic butter 4.4 (13.0) 2.2 (5.7) 2.1 (3.6) 1.9 (3.2) 2.7 (7.6)Units: Ethiopian birr; Standard deviations in parentheses. Source: Survey data.
Consumption is also lower during the dry season but not very much lower as one would
expect. The observed low levels of per capita consumption indicate there is a potential
to expand the market for dairy products through the promotion of the consumption of
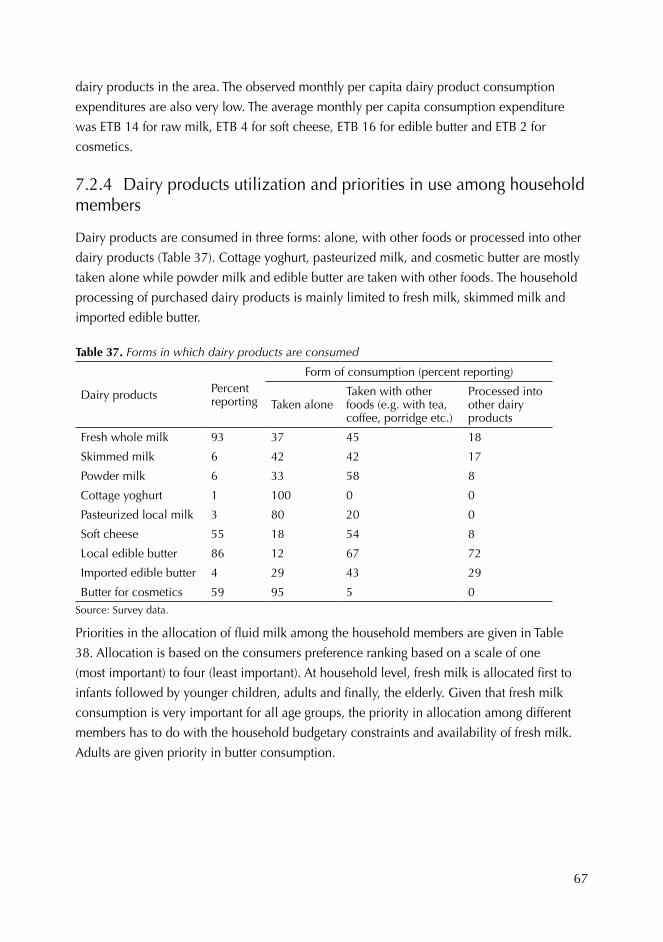
67
dairy products in the area. The observed monthly per capita dairy product consumption
expenditures are also very low. The average monthly per capita consumption expenditure
was ETB 14 for raw milk, ETB 4 for soft cheese, ETB 16 for edible butter and ETB 2 for
cosmetics.
7.2.4 Dairy products utilization and priorities in use among household members
Dairy products are consumed in three forms: alone, with other foods or processed into other
dairy products (Table 37). Cottage yoghurt, pasteurized milk, and cosmetic butter are mostly
taken alone while powder milk and edible butter are taken with other foods. The household
processing of purchased dairy products is mainly limited to fresh milk, skimmed milk and
imported edible butter.
Table 37. Forms in which dairy products are consumed
Dairy products Percent reporting
Form of consumption (percent reporting)
Taken alone Taken with other foods (e.g. with tea, coffee, porridge etc.)
Processed into other dairy products
Fresh whole milk 93 37 45 18
Skimmed milk 6 42 42 17
Powder milk 6 33 58 8
Cottage yoghurt 1 100 0 0
Pasteurized local milk 3 80 20 0
Soft cheese 55 18 54 8
Local edible butter 86 12 67 72
Imported edible butter 4 29 43 29
Butter for cosmetics 59 95 5 0Source: Survey data.
Priorities in the allocation of fluid milk among the household members are given in Table
38. Allocation is based on the consumers preference ranking based on a scale of one
(most important) to four (least important). At household level, fresh milk is allocated first to
infants followed by younger children, adults and finally, the elderly. Given that fresh milk
consumption is very important for all age groups, the priority in allocation among different
members has to do with the household budgetary constraints and availability of fresh milk.
Adults are given priority in butter consumption.
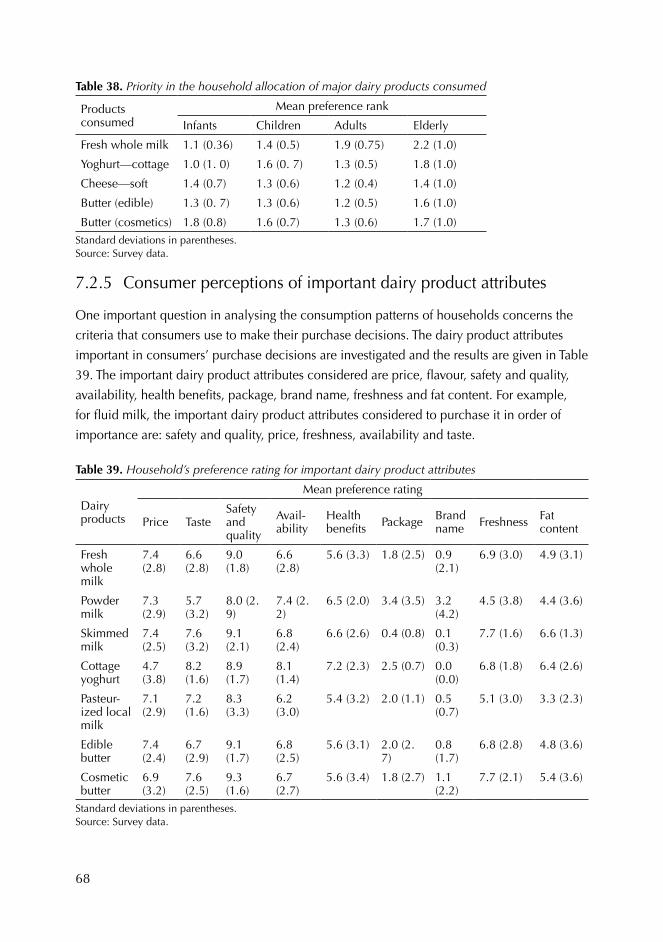
68
Table 38. Priority in the household allocation of major dairy products consumed
Products consumed
Mean preference rank
Infants Children Adults Elderly
Fresh whole milk 1.1 (0.36) 1.4 (0.5) 1.9 (0.75) 2.2 (1.0)
Yoghurt—cottage 1.0 (1. 0) 1.6 (0. 7) 1.3 (0.5) 1.8 (1.0)
Cheese—soft 1.4 (0.7) 1.3 (0.6) 1.2 (0.4) 1.4 (1.0)
Butter (edible) 1.3 (0. 7) 1.3 (0.6) 1.2 (0.5) 1.6 (1.0)
Butter (cosmetics) 1.8 (0.8) 1.6 (0.7) 1.3 (0.6) 1.7 (1.0)Standard deviations in parentheses. Source: Survey data.
7.2.5 Consumer perceptions of important dairy product attributes
One important question in analysing the consumption patterns of households concerns the
criteria that consumers use to make their purchase decisions. The dairy product attributes
important in consumers’ purchase decisions are investigated and the results are given in Table
39. The important dairy product attributes considered are price, flavour, safety and quality,
availability, health benefits, package, brand name, freshness and fat content. For example,
for fluid milk, the important dairy product attributes considered to purchase it in order of
importance are: safety and quality, price, freshness, availability and taste.
Table 39. Household’s preference rating for important dairy product attributes
Dairy products
Mean preference rating
Price Taste Safety and quality
Avail-ability
Health benefits Package Brand
name Freshness Fat content
Fresh whole milk
7.4 (2.8)
6.6 (2.8)
9.0 (1.8)
6.6 (2.8)
5.6 (3.3) 1.8 (2.5) 0.9 (2.1)
6.9 (3.0) 4.9 (3.1)
Powder milk
7.3 (2.9)
5.7 (3.2)
8.0 (2. 9)
7.4 (2. 2)
6.5 (2.0) 3.4 (3.5) 3.2 (4.2)
4.5 (3.8) 4.4 (3.6)
Skimmed milk
7.4 (2.5)
7.6 (3.2)
9.1 (2.1)
6.8 (2.4)
6.6 (2.6) 0.4 (0.8) 0.1 (0.3)
7.7 (1.6) 6.6 (1.3)
Cottage yoghurt
4.7 (3.8)
8.2 (1.6)
8.9 (1.7)
8.1 (1.4)
7.2 (2.3) 2.5 (0.7) 0.0 (0.0)
6.8 (1.8) 6.4 (2.6)
Pasteur-ized local milk
7.1 (2.9)
7.2 (1.6)
8.3 (3.3)
6.2 (3.0)
5.4 (3.2) 2.0 (1.1) 0.5 (0.7)
5.1 (3.0) 3.3 (2.3)
Edible butter
7.4 (2.4)
6.7 (2.9)
9.1 (1.7)
6.8 (2.5)
5.6 (3.1) 2.0 (2. 7)
0.8 (1.7)
6.8 (2.8) 4.8 (3.6)
Cosmetic butter
6.9 (3.2)
7.6 (2.5)
9.3 (1.6)
6.7 (2.7)
5.6 (3.4) 1.8 (2.7) 1.1 (2.2)
7.7 (2.1) 5.4 (3.6)
Standard deviations in parentheses. Source: Survey data.
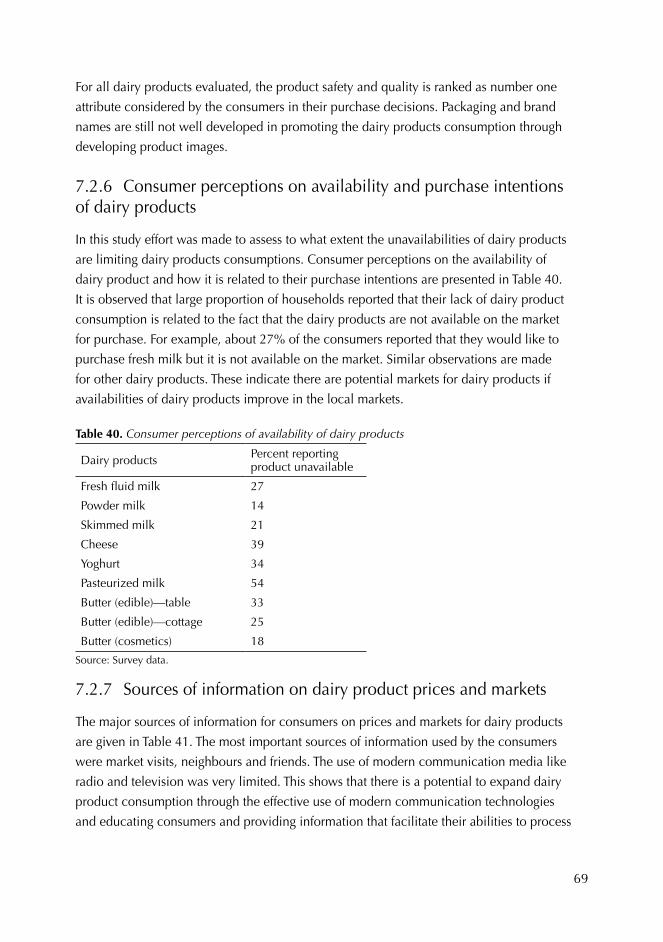
69
For all dairy products evaluated, the product safety and quality is ranked as number one
attribute considered by the consumers in their purchase decisions. Packaging and brand
names are still not well developed in promoting the dairy products consumption through
developing product images.
7.2.6 Consumer perceptions on availability and purchase intentions of dairy products
In this study effort was made to assess to what extent the unavailabilities of dairy products
are limiting dairy products consumptions. Consumer perceptions on the availability of
dairy product and how it is related to their purchase intentions are presented in Table 40.
It is observed that large proportion of households reported that their lack of dairy product
consumption is related to the fact that the dairy products are not available on the market
for purchase. For example, about 27% of the consumers reported that they would like to
purchase fresh milk but it is not available on the market. Similar observations are made
for other dairy products. These indicate there are potential markets for dairy products if
availabilities of dairy products improve in the local markets.
Table 40. Consumer perceptions of availability of dairy products
Dairy products Percent reporting product unavailable
Fresh fluid milk 27
Powder milk 14
Skimmed milk 21
Cheese 39
Yoghurt 34
Pasteurized milk 54
Butter (edible)—table 33
Butter (edible)—cottage 25
Butter (cosmetics) 18
Source: Survey data.
7.2.7 Sources of information on dairy product prices and markets
The major sources of information for consumers on prices and markets for dairy products
are given in Table 41. The most important sources of information used by the consumers
were market visits, neighbours and friends. The use of modern communication media like
radio and television was very limited. This shows that there is a potential to expand dairy
product consumption through the effective use of modern communication technologies
and educating consumers and providing information that facilitate their abilities to process
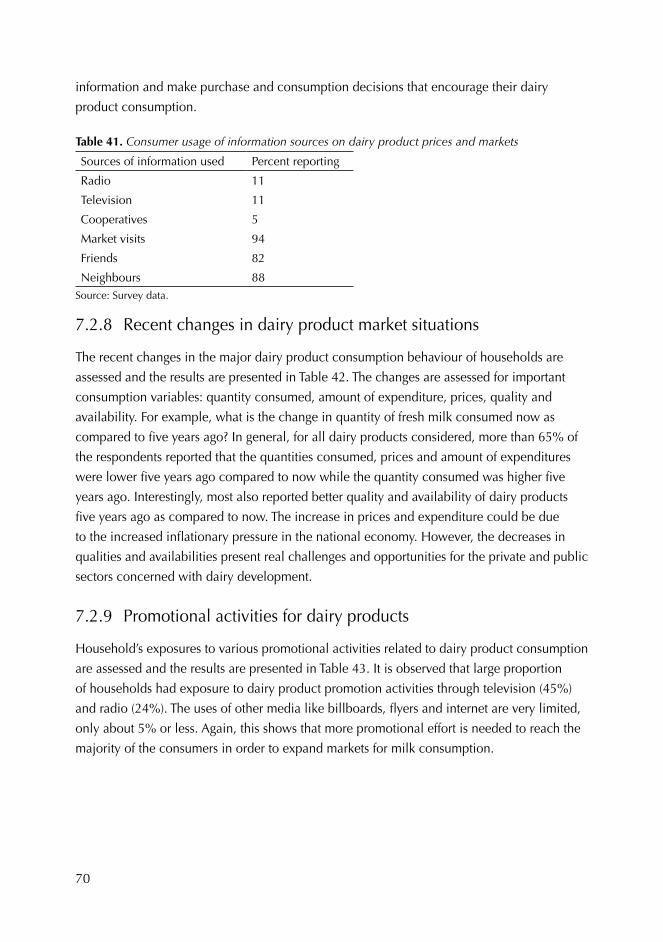
70
information and make purchase and consumption decisions that encourage their dairy
product consumption.
Table 41. Consumer usage of information sources on dairy product prices and markets
Sources of information used Percent reporting
Radio 11
Television 11
Cooperatives 5
Market visits 94
Friends 82
Neighbours 88Source: Survey data.
7.2.8 Recent changes in dairy product market situations
The recent changes in the major dairy product consumption behaviour of households are
assessed and the results are presented in Table 42. The changes are assessed for important
consumption variables: quantity consumed, amount of expenditure, prices, quality and
availability. For example, what is the change in quantity of fresh milk consumed now as
compared to five years ago? In general, for all dairy products considered, more than 65% of
the respondents reported that the quantities consumed, prices and amount of expenditures
were lower five years ago compared to now while the quantity consumed was higher five
years ago. Interestingly, most also reported better quality and availability of dairy products
five years ago as compared to now. The increase in prices and expenditure could be due
to the increased inflationary pressure in the national economy. However, the decreases in
qualities and availabilities present real challenges and opportunities for the private and public
sectors concerned with dairy development.
7.2.9 Promotional activities for dairy products
Household’s exposures to various promotional activities related to dairy product consumption
are assessed and the results are presented in Table 43. It is observed that large proportion
of households had exposure to dairy product promotion activities through television (45%)
and radio (24%). The uses of other media like billboards, flyers and internet are very limited,
only about 5% or less. Again, this shows that more promotional effort is needed to reach the
majority of the consumers in order to expand markets for milk consumption.
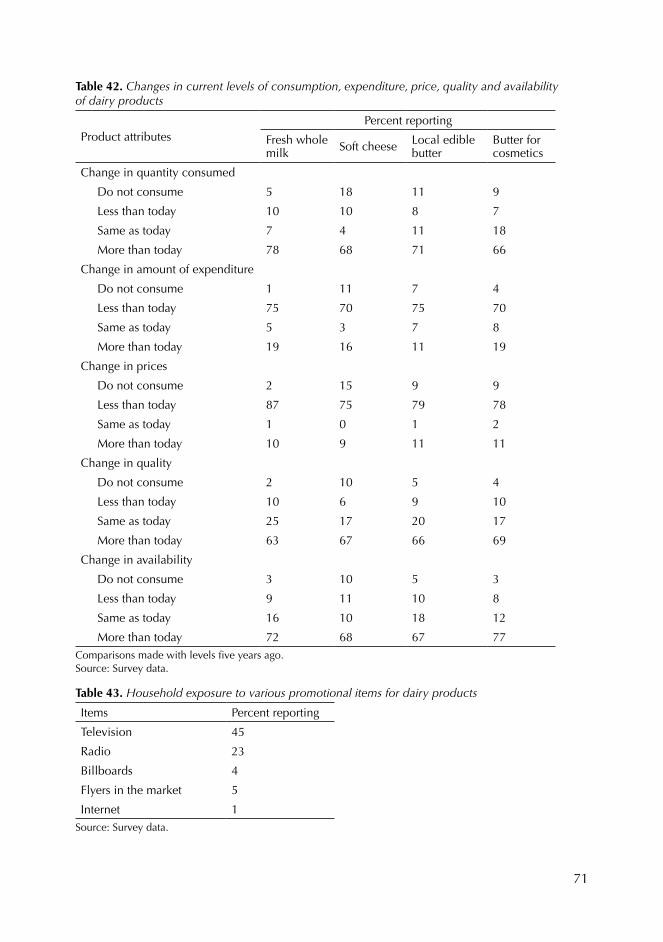
71
Table 42. Changes in current levels of consumption, expenditure, price, quality and availability of dairy products
Product attributesPercent reporting
Fresh whole milk Soft cheese Local edible
butterButter for cosmetics
Change in quantity consumed
Do not consume 5 18 11 9
Less than today 10 10 8 7
Same as today 7 4 11 18
More than today 78 68 71 66
Change in amount of expenditure
Do not consume 1 11 7 4
Less than today 75 70 75 70
Same as today 5 3 7 8
More than today 19 16 11 19
Change in prices
Do not consume 2 15 9 9
Less than today 87 75 79 78
Same as today 1 0 1 2
More than today 10 9 11 11
Change in quality
Do not consume 2 10 5 4
Less than today 10 6 9 10
Same as today 25 17 20 17
More than today 63 67 66 69
Change in availability
Do not consume 3 10 5 3
Less than today 9 11 10 8
Same as today 16 10 18 12
More than today 72 68 67 77Comparisons made with levels five years ago. Source: Survey data.
Table 43. Household exposure to various promotional items for dairy products
Items Percent reporting
Television 45
Radio 23
Billboards 4
Flyers in the market 5
Internet 1Source: Survey data.
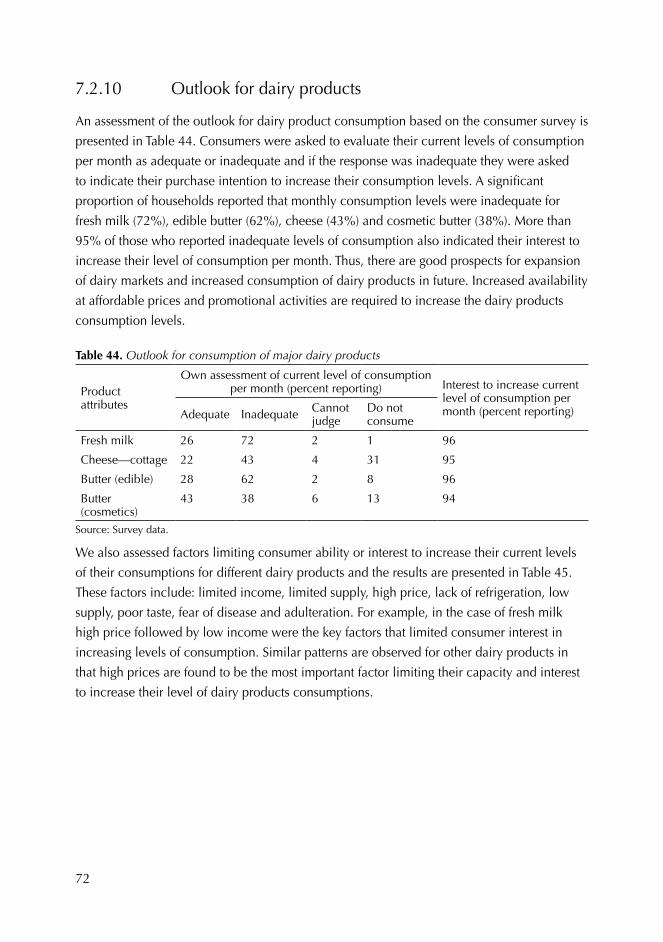
72
7.2.10 Outlook for dairy products
An assessment of the outlook for dairy product consumption based on the consumer survey is
presented in Table 44. Consumers were asked to evaluate their current levels of consumption
per month as adequate or inadequate and if the response was inadequate they were asked
to indicate their purchase intention to increase their consumption levels. A significant
proportion of households reported that monthly consumption levels were inadequate for
fresh milk (72%), edible butter (62%), cheese (43%) and cosmetic butter (38%). More than
95% of those who reported inadequate levels of consumption also indicated their interest to
increase their level of consumption per month. Thus, there are good prospects for expansion
of dairy markets and increased consumption of dairy products in future. Increased availability
at affordable prices and promotional activities are required to increase the dairy products
consumption levels.
Table 44. Outlook for consumption of major dairy products
Product attributes
Own assessment of current level of consumption per month (percent reporting) Interest to increase current
level of consumption per month (percent reporting)Adequate Inadequate Cannot
judgeDo not consume
Fresh milk 26 72 2 1 96
Cheese—cottage 22 43 4 31 95
Butter (edible) 28 62 2 8 96
Butter (cosmetics)
43 38 6 13 94
Source: Survey data.
We also assessed factors limiting consumer ability or interest to increase their current levels
of their consumptions for different dairy products and the results are presented in Table 45.
These factors include: limited income, limited supply, high price, lack of refrigeration, low
supply, poor taste, fear of disease and adulteration. For example, in the case of fresh milk
high price followed by low income were the key factors that limited consumer interest in
increasing levels of consumption. Similar patterns are observed for other dairy products in
that high prices are found to be the most important factor limiting their capacity and interest
to increase their level of dairy products consumptions.
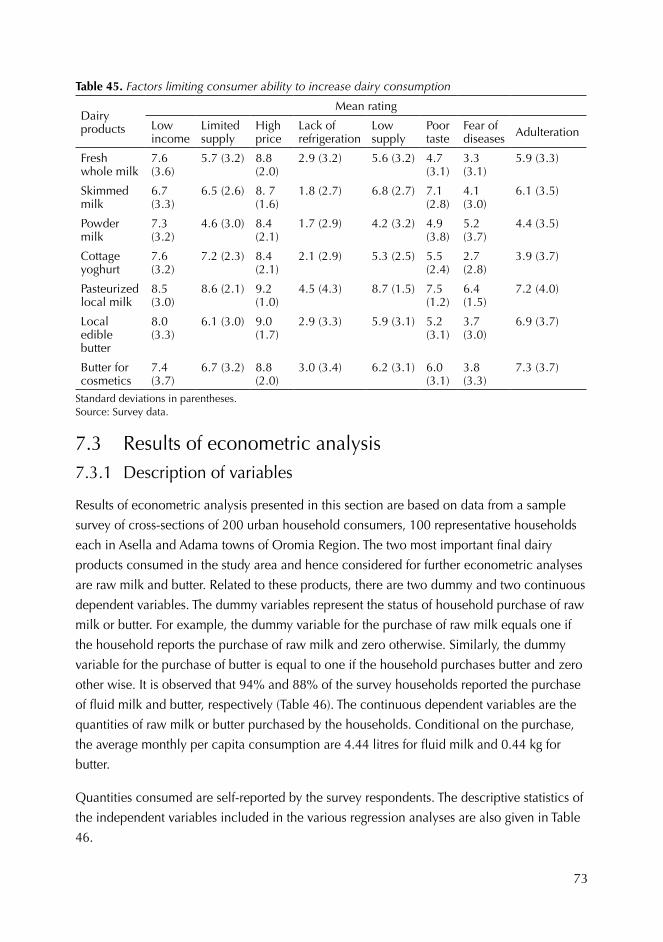
73
Table 45. Factors limiting consumer ability to increase dairy consumption
Dairy products
Mean rating
Low income
Limited supply
High price
Lack of refrigeration
Low supply
Poor taste
Fear of diseases Adulteration
Fresh whole milk
7.6 (3.6)
5.7 (3.2) 8.8 (2.0)
2.9 (3.2) 5.6 (3.2) 4.7 (3.1)
3.3 (3.1)
5.9 (3.3)
Skimmed milk
6.7 (3.3)
6.5 (2.6) 8. 7 (1.6)
1.8 (2.7) 6.8 (2.7) 7.1 (2.8)
4.1 (3.0)
6.1 (3.5)
Powder milk
7.3 (3.2)
4.6 (3.0) 8.4 (2.1)
1.7 (2.9) 4.2 (3.2) 4.9 (3.8)
5.2 (3.7)
4.4 (3.5)
Cottage yoghurt
7.6 (3.2)
7.2 (2.3) 8.4 (2.1)
2.1 (2.9) 5.3 (2.5) 5.5 (2.4)
2.7 (2.8)
3.9 (3.7)
Pasteurized local milk
8.5 (3.0)
8.6 (2.1) 9.2 (1.0)
4.5 (4.3) 8.7 (1.5) 7.5 (1.2)
6.4 (1.5)
7.2 (4.0)
Local edible butter
8.0 (3.3)
6.1 (3.0) 9.0 (1.7)
2.9 (3.3) 5.9 (3.1) 5.2 (3.1)
3.7 (3.0)
6.9 (3.7)
Butter for cosmetics
7.4 (3.7)
6.7 (3.2) 8.8 (2.0)
3.0 (3.4) 6.2 (3.1) 6.0 (3.1)
3.8 (3.3)
7.3 (3.7)
Standard deviations in parentheses. Source: Survey data.
7.3 Results of econometric analysis7.3.1 Description of variables
Results of econometric analysis presented in this section are based on data from a sample
survey of cross-sections of 200 urban household consumers, 100 representative households
each in Asella and Adama towns of Oromia Region. The two most important final dairy
products consumed in the study area and hence considered for further econometric analyses
are raw milk and butter. Related to these products, there are two dummy and two continuous
dependent variables. The dummy variables represent the status of household purchase of raw
milk or butter. For example, the dummy variable for the purchase of raw milk equals one if
the household reports the purchase of raw milk and zero otherwise. Similarly, the dummy
variable for the purchase of butter is equal to one if the household purchases butter and zero
other wise. It is observed that 94% and 88% of the survey households reported the purchase
of fluid milk and butter, respectively (Table 46). The continuous dependent variables are the
quantities of raw milk or butter purchased by the households. Conditional on the purchase,
the average monthly per capita consumption are 4.44 litres for fluid milk and 0.44 kg for
butter.
Quantities consumed are self-reported by the survey respondents. The descriptive statistics of
the independent variables included in the various regression analyses are also given in Table
46.
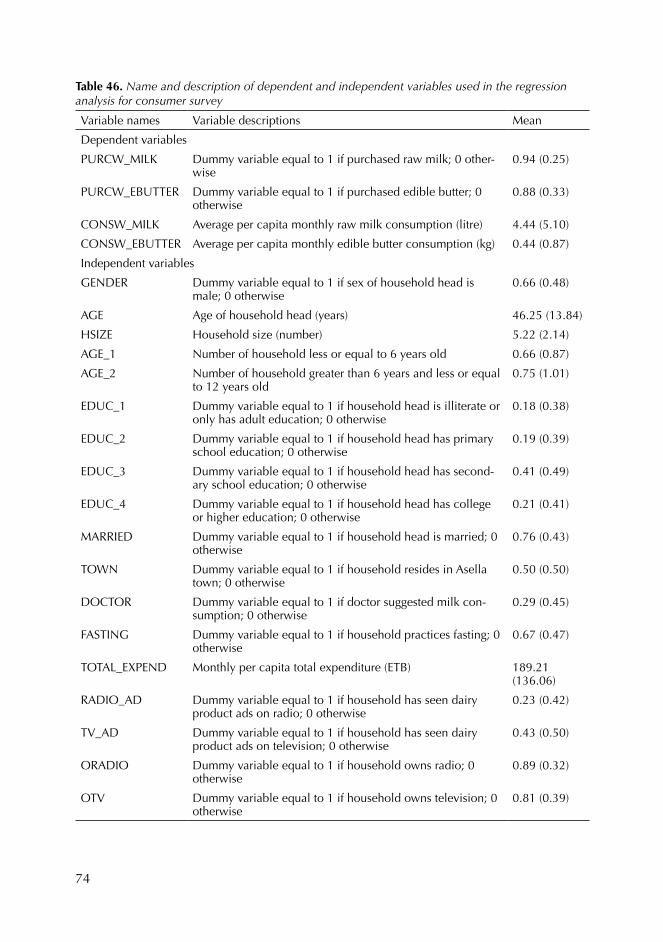
74
Table 46. Name and description of dependent and independent variables used in the regression analysis for consumer survey
Variable names Variable descriptions Mean
Dependent variables
PURCW_MILK Dummy variable equal to 1 if purchased raw milk; 0 other-wise
0.94 (0.25)
PURCW_EBUTTER Dummy variable equal to 1 if purchased edible butter; 0 otherwise
0.88 (0.33)
CONSW_MILK Average per capita monthly raw milk consumption (litre) 4.44 (5.10)
CONSW_EBUTTER Average per capita monthly edible butter consumption (kg) 0.44 (0.87)
Independent variables
GENDER Dummy variable equal to 1 if sex of household head is male; 0 otherwise
0.66 (0.48)
AGE Age of household head (years) 46.25 (13.84)
HSIZE Household size (number) 5.22 (2.14)
AGE_1 Number of household less or equal to 6 years old 0.66 (0.87)
AGE_2 Number of household greater than 6 years and less or equal to 12 years old
0.75 (1.01)
EDUC_1 Dummy variable equal to 1 if household head is illiterate or only has adult education; 0 otherwise
0.18 (0.38)
EDUC_2 Dummy variable equal to 1 if household head has primary school education; 0 otherwise
0.19 (0.39)
EDUC_3 Dummy variable equal to 1 if household head has second-ary school education; 0 otherwise
0.41 (0.49)
EDUC_4 Dummy variable equal to 1 if household head has college or higher education; 0 otherwise
0.21 (0.41)
MARRIED Dummy variable equal to 1 if household head is married; 0 otherwise
0.76 (0.43)
TOWN Dummy variable equal to 1 if household resides in Asella town; 0 otherwise
0.50 (0.50)
DOCTOR Dummy variable equal to 1 if doctor suggested milk con-sumption; 0 otherwise
0.29 (0.45)
FASTING Dummy variable equal to 1 if household practices fasting; 0 otherwise
0.67 (0.47)
TOTAL_EXPEND Monthly per capita total expenditure (ETB) 189.21 (136.06)
RADIO_AD Dummy variable equal to 1 if household has seen dairy product ads on radio; 0 otherwise
0.23 (0.42)
TV_AD Dummy variable equal to 1 if household has seen dairy product ads on television; 0 otherwise
0.43 (0.50)
ORADIO Dummy variable equal to 1 if household owns radio; 0 otherwise
0.89 (0.32)
OTV Dummy variable equal to 1 if household owns television; 0 otherwise
0.81 (0.39)
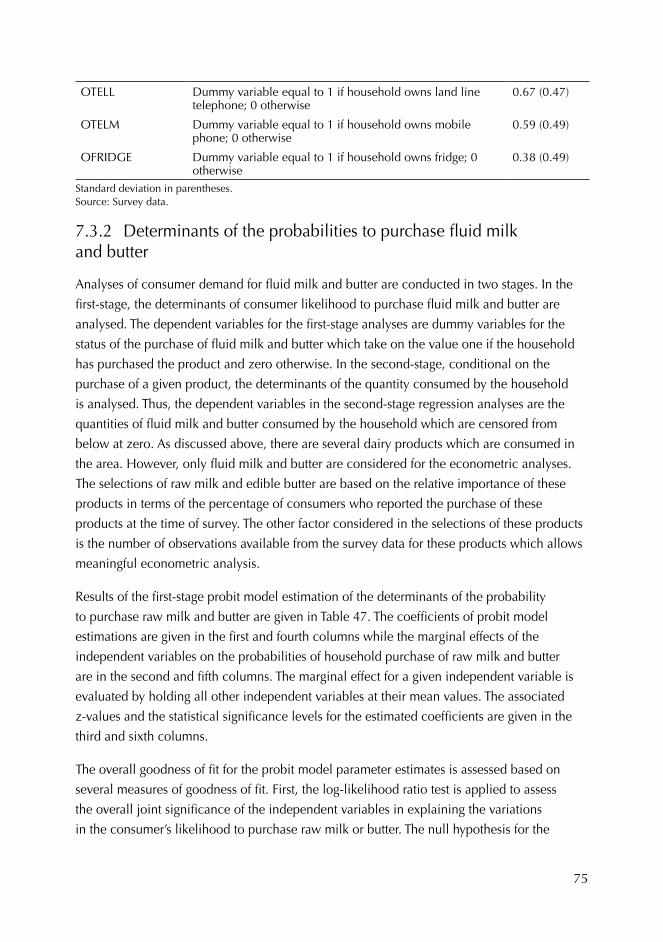
75
OTELL Dummy variable equal to 1 if household owns land line telephone; 0 otherwise
0.67 (0.47)
OTELM Dummy variable equal to 1 if household owns mobile phone; 0 otherwise
0.59 (0.49)
OFRIDGE Dummy variable equal to 1 if household owns fridge; 0 otherwise
0.38 (0.49)
Standard deviation in parentheses. Source: Survey data.
7.3.2 Determinants of the probabilities to purchase fluid milk and butter
Analyses of consumer demand for fluid milk and butter are conducted in two stages. In the
first-stage, the determinants of consumer likelihood to purchase fluid milk and butter are
analysed. The dependent variables for the first-stage analyses are dummy variables for the
status of the purchase of fluid milk and butter which take on the value one if the household
has purchased the product and zero otherwise. In the second-stage, conditional on the
purchase of a given product, the determinants of the quantity consumed by the household
is analysed. Thus, the dependent variables in the second-stage regression analyses are the
quantities of fluid milk and butter consumed by the household which are censored from
below at zero. As discussed above, there are several dairy products which are consumed in
the area. However, only fluid milk and butter are considered for the econometric analyses.
The selections of raw milk and edible butter are based on the relative importance of these
products in terms of the percentage of consumers who reported the purchase of these
products at the time of survey. The other factor considered in the selections of these products
is the number of observations available from the survey data for these products which allows
meaningful econometric analysis.
Results of the first-stage probit model estimation of the determinants of the probability
to purchase raw milk and butter are given in Table 47. The coefficients of probit model
estimations are given in the first and fourth columns while the marginal effects of the
independent variables on the probabilities of household purchase of raw milk and butter
are in the second and fifth columns. The marginal effect for a given independent variable is
evaluated by holding all other independent variables at their mean values. The associated
z-values and the statistical significance levels for the estimated coefficients are given in the
third and sixth columns.
The overall goodness of fit for the probit model parameter estimates is assessed based on
several measures of goodness of fit. First, the log-likelihood ratio test is applied to assess
the overall joint significance of the independent variables in explaining the variations
in the consumer’s likelihood to purchase raw milk or butter. The null hypothesis for the
76
log-likelihood ratio test is that all coefficients are jointly zero. The model chi-square tests
applying appropriate degrees of freedom indicate that the overall goodness of fit of the probit
model are statistically significant at a probability of less than 1% for both raw milk and
butter. This shows that jointly the independent variables included in the probit regression
model explain the variations in the household’s probability to purchase raw milk and butter.
Second, the McFadden’s Pseudo-R2 is calculated and the obtained values indicate that
the independent variables included in the regression explain significant proportion of the
variations in the consumer’s likelihood to purchase fluid milk or butter. Third, the correct
prediction rate of the probit model is obtained assuming a 50–50% classification scheme.
In the case of raw milk, it is observed that the probit model predicts about 94% of the cases
correctly while in the case of butter the probit model predicts 89% of the cases correctly.
Fourth, the linktest is also conducted to test for the omitted variable problem. The null
hypothesis of no omitted variable is not rejected at a probability of less than 5%, suggesting
that the model is well specified. Fifth, the standard errors of the parameters estimated are also
corrected for the non-constant variances. Overall, the probit model appears to provide a very
good prediction of the likelihood that consumers purchase fluid milk and butter.
The gender of the head of the household is negatively associated with the likelihood of
household purchase of fluid milk and butter (Table 47). Given the base (omitted) category
for gender dummy variable is female-headed household; the negative coefficient indicates
that female-headed households are more likely to purchase raw milk for consumption as
compared to male-headed households. However, the effect of gender is not statistically
significant, suggesting that gender has no influence on the household’s likelihood to purchase
milk or butter.
Age of the head of household was negatively associated with the household’s likelihood to
purchase raw milk and the effect is statistically significant at a probability of less than 1%.
The negative coefficient indicates that as the head of household gets older the likelihood
of raw milk purchase decreases, ceteris paribus. However, the magnitude of the effect of
change in the age of the head of household on the household’s probability to purchase raw
milk for consumption is very small. For example, a one-year increase in the age of the head
of household increases the likelihood of milk purchase by household only by less than 1%.
Similarly, the effect of age on the likelihood of household to purchase butter is negative but
the effect is not statistically significant.
The effects of both the absolute number of household size and age composition of household
size on the likelihood of household to purchase raw milk and butter are analysed. The
absolute number of household size is positively associated with the household likelihood
to purchase milk and butter, suggesting that as the family size increases the likelihood of
household purchasing fluid milk and butter for consumption increases, ceteris paribus.
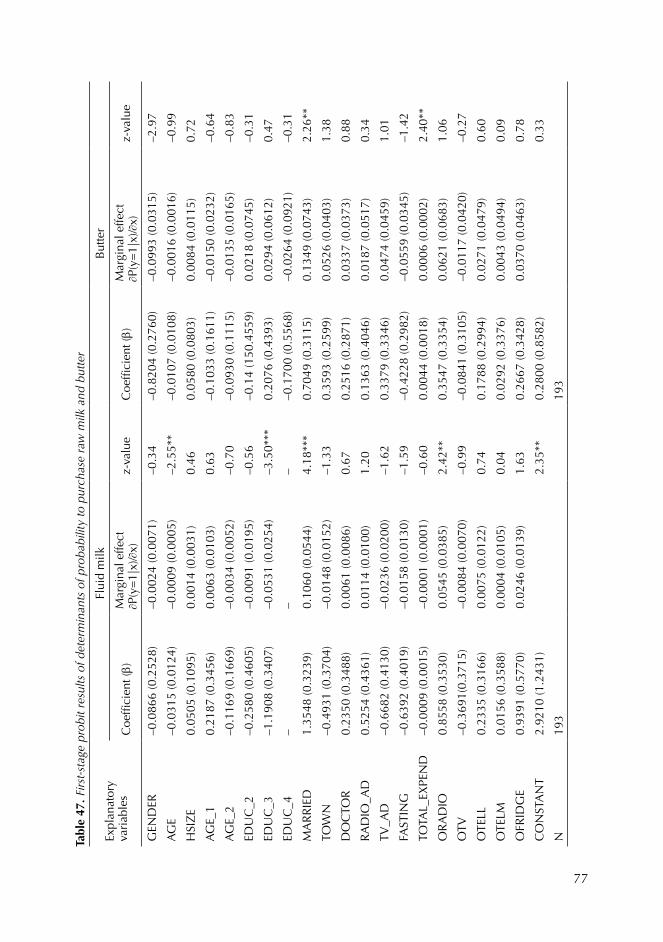
77
Tabl
e 47
. Firs
t-sta
ge p
robi
t res
ults
of d
eter
min
ants
of p
roba
bilit
y to
pur
chas
e ra
w m
ilk a
nd b
utte
r
Expl
anat
ory
va
riab
les
Flui
d m
ilkB
utte
r
Coe
ffici
ent (
b)M
argi
nal e
ffect
∂ P
(y=
1|x)
/∂x)
z-va
lue
Coe
ffici
ent (
b)M
argi
nal e
ffect
∂ P
(y=
1|x)
/∂x)
z-va
lue
GEN
DER
–0.0
866
(0.2
528)
–0.0
024
(0.0
071)
–0.3
4–0
.820
4 (0
.276
0)–0
.099
3 (0
.031
5)–2
.97
AG
E–0
.031
5 (0
.012
4)–0
.000
9 (0
.000
5)–2
.55*
*–0
.010
7 (0
.010
8)–0
.001
6 (0
.001
6)–0
.99
HSI
ZE
0.05
05 (0
.109
5)0.
0014
(0.0
031)
0.46
0.05
80 (0
.080
3)0.
0084
(0.0
115)
0.72
AG
E_1
0.21
87 (0
.345
6)0.
0063
(0.0
103)
0.63
–0.1
033
(0.1
611)
–0.0
150
(0.0
232)
–0.6
4
AG
E_2
–0.1
169
(0.1
669)
–0.0
034
(0.0
052)
–0.7
0–0
.093
0 (0
.111
5)–0
.013
5 (0
.016
5)–0
.83
EDU
C_2
–0.2
580
(0.4
605)
–0.0
091
(0.0
195)
–0.5
6–0
.14
(150
.455
9)0.
0218
(0.0
745)
–0.3
1
EDU
C_3
–1.1
908
(0.3
407)
–0.0
531
(0.0
254)
–3.5
0***
0.20
76 (0
.439
3)0.
0294
(0.0
612)
0.47
EDU
C_4
––
––0
.170
0 (0
.556
8)–0
.026
4 (0
.092
1)–0
.31
MA
RR
IED
1.35
48 (0
.323
9)0.
1060
(0.0
544)
4.18
***
0.70
49 (0
.311
5)0.
1349
(0.0
743)
2.26
**
TOW
N–0
.493
1 (0
.370
4)–0
.014
8 (0
.015
2)–1
.33
0.35
93 (0
.259
9)0.
0526
(0.0
403)
1.38
DO
CTO
R0.
2350
(0.3
488)
0.00
61 (0
.008
6)0.
670.
2516
(0.2
871)
0.03
37 (0
.037
3)0.
88
RA
DIO
_AD
0.52
54 (0
.436
1)0.
0114
(0.0
100)
1.20
0.13
63 (0
.404
6)0.
0187
(0.0
517)
0.34
TV_A
D–0
.668
2 (0
.413
0)–0
.023
6 (0
.020
0)–1
.62
0.33
79 (0
.334
6)0.
0474
(0.0
459)
1.01
FAST
ING
–0.6
392
(0.4
019)
–0.0
158
(0.0
130)
–1.5
9–0
.422
8 (0
.298
2)–0
.055
9 (0
.034
5)–1
.42
TOTA
L_EX
PEN
D–0
.000
9 (0
.001
5)–0
.000
1 (0
.000
1)–0
.60
0.00
44 (0
.001
8)0.
0006
(0.0
002)
2.40
**
OR
AD
IO0.
8558
(0.3
530)
0.05
45 (0
.038
5)2.
42**
0.35
47 (0
.335
4)0.
0621
(0.0
683)
1.06
OTV
–0.3
691(
0.37
15)
–0.0
084
(0.0
070)
–0.9
9–0
.084
1 (0
.310
5)–0
.011
7 (0
.042
0)–0
.27
OTE
LL0.
2335
(0.3
166)
0.00
75 (0
.012
2)0.
740.
1788
(0.2
994)
0.02
71 (0
.047
9)0.
60
OTE
LM0.
0156
(0.3
588)
0.00
04 (0
.010
5)0.
040.
0292
(0.3
376)
0.00
43 (0
.049
4)0.
09
OFR
IDG
E0.
9391
(0.5
770)
0.02
46 (0
.013
9)1.
630.
2667
(0.3
428)
0.03
70 (0
.046
3)0.
78
CO
NST
AN
T2.
9210
(1.2
431)
2.35
**0.
2800
(0.8
582)
0.33
N19
319
3

78
Cor
rect
pr
edic
tions
:
–Pur
chas
e94
88
–Non
-pur
chas
e67
100
–Ove
rall
9488
Link
test
0.05
–0.0
7
Pseu
do R
20.
330.
18
Wal
d 2
(19)
48
.92*
**30
.58*
Log
likel
ihoo
d –3
0.29
–61.
42Th
e de
pend
ent v
aria
ble
is a
dum
my
vari
able
whi
ch ta
kes
on th
e va
lue
1 if
the
hous
ehol
d ha
d pu
rcha
sed
a gi
ven
dair
y pr
oduc
t, 0
othe
rwis
e.
Figu
res
in th
e pa
rent
hese
s ar
e ro
bust
sta
ndar
d er
rors
*
**, *
*, a
nd *
indi
cate
sta
tistic
al s
igni
fican
ce a
t a p
roba
bilit
y of
less
than
1%
, 5%
, and
10%
, res
pect
ivel
y.
Sour
ce: S
urve
y da
ta.
79
However, the effect of household size is not statistically significant. The age composition of
household size is captured in terms of the number of children aged less than 6 years (age_1)
and between 6 and 12 years (age_2). Households with more children aged less than six years
old are more likely to purchase milk for consumption. However, this effect is not statistically
significant while the opposite is true in the case of butter. On the other hand, the number
of children aged between 6 and 12 years old is negatively associated with likelihood of
household purchase of fluid milk and butter but again not statistically significant. Overall,
the size and age composition of household size have no significant effect on the household’s
likelihood of fluid milk and butter purchases. This result does not conform to a priori
theoretical expectation that as the number of younger children in the family increases the
likelihood to purchase milk or butter significantly increases.
The level of education is related to the ability to process more complex information and
make decisions. The effect of the education level of the head of household on the household
likelihood to purchase raw milk is found to be negative in all cases. The omitted category
for education dummy variable is household heads with no formal schooling (illiterate or just
adult education). Thus, the negative coefficient on the education dummy variable indicates
that households with heads of households having higher level of education are less likely to
purchase fluid milk. However, the effect of the level of education is statistically significant
only for heads of households with secondary education. For example, households with
secondary schooling of the head of household are 5% less likely to purchase fluid milk for
consumption. Furthermore, there is no difference between the households with illiterate
heads and households with heads having at least primary education in terms of the likelihood
to purchase raw milk. The effect of education level of the head of household on the
household’s likelihood to purchase butter is found to be not significant.
The marital status of the head of household appears to be positive and significant determinant
of a household’s likelihood to purchase fluid milk and butter for consumption. For example,
households with married head of household are about 11% and 13% more likely to purchase
fluid milk and butter for consumption as compared to households with unmarried head of
household.
The dummy variable town captures the effect of variation in household’s place of residence
on the likelihood of household to purchase raw milk and butter. There is no statistically
significant effect of household’s place of residence on the household’s likelihood to purchase
fluid milk and butter. However, the signs on town dummy variable for fluid milk and butter
are different; the sign is negative for fluid milk while it is positive for butter. Given the omitted
category for the location of residence dummy variable is Adama town, the negative sign
for fluid milk indicates that households residing in Asella town are less likely to purchase
80
fluid milk than households residing in Adama town, ceteris paribus. On the other hand,
the positive sign for butter indicates households residing in Asella town are more likely to
purchase butter than households residing in Adama town, ceteris paribus.
The effect of doctor’s suggestion of milk consumption on the likelihood of households to
purchase milk and butter was positive as expected although the effect is not statistically
significant. The effects of household’s exposure to various dairy products consumption
promotional activities on the household likelihood to purchase milk for consumption are
also analysed. The effect of radio ads is found to have positive effects on the likelihood
of household to purchase milk and butter while the effect of television advertisements
is negative for both fluid milk and butter. However, the effects of radio and television
advertisements are not statistically significant in all cases. The lack of statistical significance
might be due to limited promotional activities.
As expected, households who are fasting are less likely to purchase raw milk and butter.
However, the effect of fasting is not statistically significant in all cases. The per capita total
expenditure on food and non-food products is used as a proxy for the household’s per capita
income. The effect of household income on the likelihood of household to purchase milk and
butter is found to be negative and positive, respectively. However, it is observed that only the
effect of average per capita income of household on the likelihood of household to purchase
butter is statistically significant.
The effects of the ownership of communication equipment like radio, television and
telephone on the likelihood that household to purchase raw milk and butter are also
assessed. It is observed that the effect is significant only for the ownership of radio in the case
of milk at a probability of less than 5%. The households who own radio are about 6% more
likely to purchase fluid milk than households without a radio. As expected, the ownership
of fridge is observed to have a positive effect on the household’s likelihood to purchase fluid
milk and butter for consumption. However, the effect is not statistically significant in all
cases. This might be because of small purchases and immediate consumptions which lessen
the need for fridge to increase the shelf life of milk and butter.
7.3.3 Determinants of quantities of raw milk and butter consumed
Results of Heckman two-stage and tobit regression estimations for quantity of milk and
butter consumed conditional on household’s purchases are given in Tables 48 and 49. The
coefficient on the mill’s ratio (lambda) in the Heckman two-stage estimation is not significant
at the probability of less than 5% in both cases.
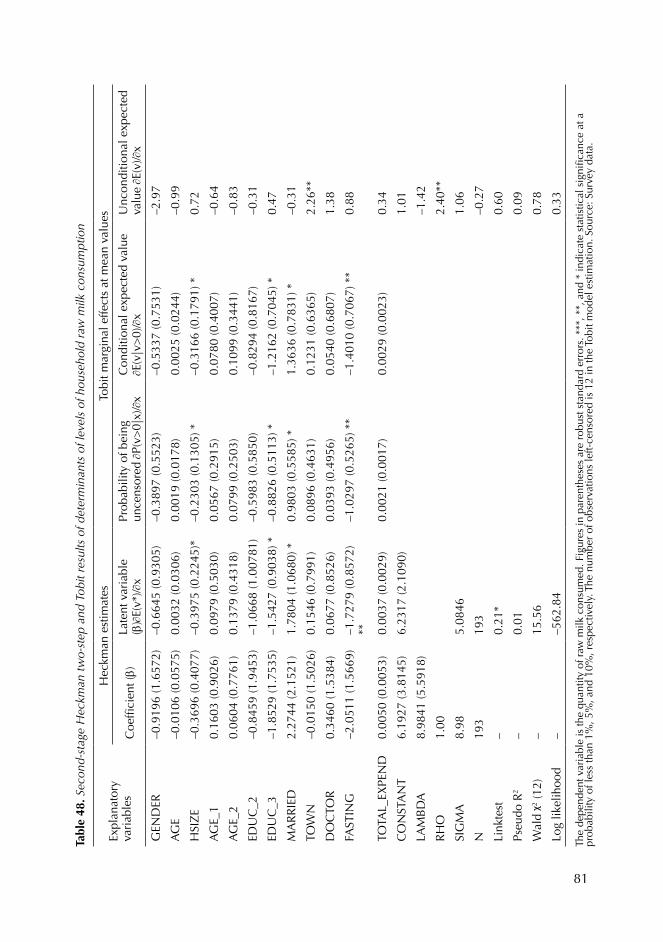
81
Tabl
e 48
. Sec
ond-
stag
e H
eckm
an tw
o-st
ep a
nd T
obit
resu
lts o
f det
erm
inan
ts o
f lev
els
of h
ouse
hold
raw
milk
con
sum
ptio
n
Expl
anat
ory
va
riab
les
Hec
kman
est
imat
esTo
bit m
argi
nal e
ffect
s at
mea
n va
lues
Coe
ffici
ent (
b)La
tent
var
iabl
e
(b)∂
E(v*
)/∂x
Prob
abili
ty o
f bei
ng
unce
nsor
ed ∂
P(v>
0|x)
/∂x
Con
ditio
nal e
xpec
ted
valu
e
∂ E(v
|v>
0)/∂
xU
ncon
ditio
nal e
xpec
ted
valu
e ∂ E
(v)/∂
x
GEN
DER
–0.9
196
(1.6
572)
–0.6
645
(0.9
305)
–0.3
897
(0.5
523)
–0.5
337
(0.7
531)
–2.9
7
AG
E–0
.010
6 (0
.057
5)0.
0032
(0.0
306)
0.00
19 (0
.017
8)0.
0025
(0.0
244)
–0.9
9
HSI
ZE
–0.3
696
(0.4
077)
–0.3
975
(0.2
245)
*–0
.230
3 (0
.130
5) *
–0.3
166
(0.1
791)
*0.
72
AG
E_1
0.16
03 (0
.902
6)0.
0979
(0.5
030)
0.05
67 (0
.291
5)0.
0780
(0.4
007)
–0.6
4
AG
E_2
0.06
04 (0
.776
1)0.
1379
(0.4
318)
0.07
99 (0
.250
3)0.
1099
(0.3
441)
–0.8
3
EDU
C_2
–0.8
459
(1.9
453)
–1.0
668
(1.0
0781
)–0
.598
3 (0
.585
0)–0
.829
4 (0
.816
7)–0
.31
EDU
C_3
–1.8
529
(1.7
535)
–1.5
427
(0.9
038)
*–0
.882
6 (0
.511
3) *
–1.2
162
(0.7
045)
*0.
47
MA
RR
IED
2.27
44 (2
.152
1)1.
7804
(1.0
680)
*0.
9803
(0.5
585)
*1.
3636
(0.7
831)
*–0
.31
TOW
N–0
.015
0 (1
.502
6)0.
1546
(0.7
991)
0.08
96 (0
.463
1)0.
1231
(0.6
365)
2.26
**
DO
CTO
R0.
3460
(1.5
384)
0.06
77 (0
.852
6)0.
0393
(0.4
956)
0.05
40 (0
.680
7)1.
38
FAST
ING
–2.0
511
(1.5
669)
–1.7
279
(0.8
572)
**
–1.0
297
(0.5
265)
**
–1.4
010
(0.7
067)
**
0.88
TOTA
L_EX
PEN
D0.
0050
(0.0
053)
0.00
37 (0
.002
9)0.
0021
(0.0
017)
0.00
29 (0
.002
3)0.
34
CO
NST
AN
T6.
1927
(3.8
145)
6.23
17 (2
.109
0)1.
01
LAM
BD
A8.
9841
(5.5
918)
–1.4
2
RH
O1.
002.
40**
SIG
MA
8.98
5.08
461.
06
N19
319
3–0
.27
Link
test
–0.
21*
0.60
Pseu
do R
2–
0.01
0.09
Wal
d 2
(12)
–
15.5
60.
78
Log
likel
ihoo
d –
–562
.84
0.33
The
depe
nden
t var
iabl
e is
the
quan
tity
of r
aw m
ilk c
onsu
med
. Fig
ures
in p
aren
thes
es a
re r
obus
t sta
ndar
d er
rors
. ***
, **,
and
* in
dica
te s
tatis
tical
sig
nific
ance
at a
pr
obab
ility
of l
ess
than
1%
, 5%
, and
10%
, res
pect
ivel
y. T
he n
umbe
r of
obs
erva
tions
left-
cens
ored
is 1
2 in
the
Tobi
t mod
el e
stim
atio
n. S
ourc
e: S
urve
y da
ta.
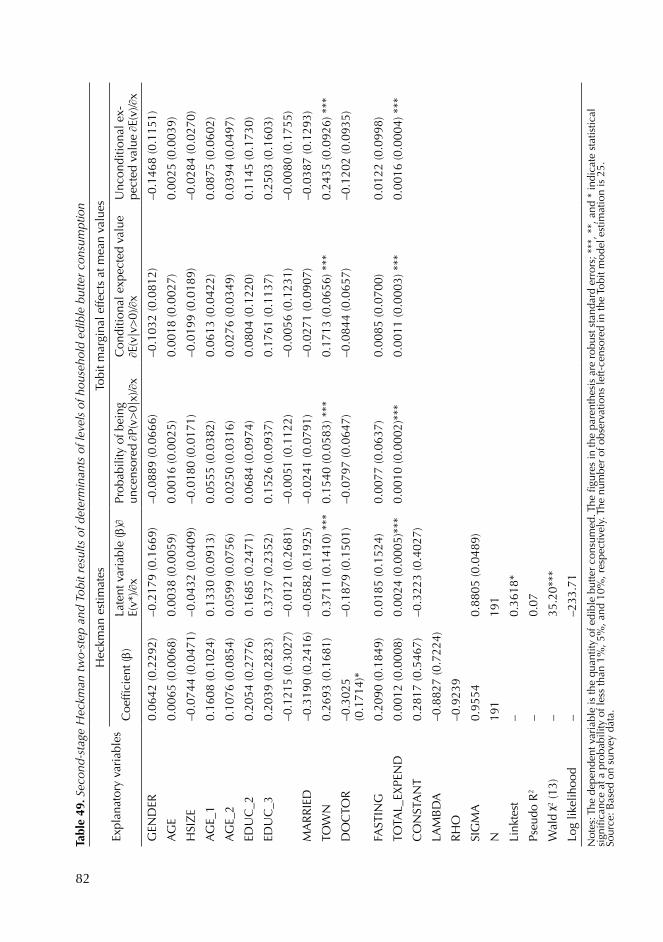
82
Tabl
e 49
. Sec
ond-
stag
e H
eckm
an tw
o-st
ep a
nd T
obit
resu
lts o
f det
erm
inan
ts o
f lev
els
of h
ouse
hold
edi
ble
butte
r co
nsum
ptio
n
Expl
anat
ory
vari
able
sH
eckm
an e
stim
ates
Tobi
t mar
gina
l effe
cts
at m
ean
valu
es
Coe
ffici
ent (
b)La
tent
var
iabl
e (b
)∂E(
v*)/∂
xPr
obab
ility
of b
eing
un
cens
ored
∂P(
v>0|
x)/∂
xC
ondi
tiona
l exp
ecte
d va
lue
∂ E(v
|v>
0)/∂
xU
ncon
ditio
nal e
x-pe
cted
val
ue ∂
E(v)
/∂x
GEN
DER
0.06
42 (0
.229
2)–0
.217
9 (0
.166
9)–0
.088
9 (0
.066
6)–0
.103
2 (0
.081
2)–0
.146
8 (0
.115
1)
AG
E0.
0065
(0.0
068)
0.00
38 (0
.005
9)0.
0016
(0.0
025)
0.00
18 (0
.002
7)0.
0025
(0.0
039)
HSI
ZE
–0.0
744
(0.0
471)
–0.0
432
(0.0
409)
–0.0
180
(0.0
171)
–0.0
199
(0.0
189)
–0.0
284
(0.0
270)
AG
E_1
0.16
08 (0
.102
4)0.
1330
(0.0
913)
0.05
55 (0
.038
2)0.
0613
(0.0
422)
0.08
75 (0
.060
2)
AG
E_2
0.10
76 (0
.085
4)0.
0599
(0.0
756)
0.02
50 (0
.031
6)0.
0276
(0.0
349)
0.03
94 (0
.049
7)
EDU
C_2
0.20
54 (0
.277
6)0.
1685
(0.2
471)
0.06
84 (0
.097
4)0.
0804
(0.1
220)
0.11
45 (0
.173
0)
EDU
C_3
0.20
39 (0
.282
3)0.
3737
(0.2
352)
0.15
26 (0
.093
7)0.
1761
(0.1
137)
0.25
03 (0
.160
3)
–0.1
215
(0.3
027)
–0.0
121
(0.2
681)
–0.0
051
(0.1
122)
–0.0
056
(0.1
231)
–0.0
080
(0.1
755)
MA
RR
IED
–0.3
190
(0.2
416)
–0.0
582
(0.1
925)
–0.0
241
(0.0
791)
–0.0
271
(0.0
907)
–0.0
387
(0.1
293)
TOW
N0.
2693
(0.1
681)
0.37
11 (0
.141
0) *
**0.
1540
(0.0
583)
***
0.17
13 (0
.065
6) *
**0.
2435
(0.0
926)
***
DO
CTO
R–0
.302
5 (0
.171
4)*
–0.1
879
(0.1
501)
–0.0
797
(0.0
647)
–0.0
844
(0.0
657)
–0.1
202
(0.0
935)
FAST
ING
0.20
90 (0
.184
9)0.
0185
(0.1
524)
0.00
77 (0
.063
7)0.
0085
(0.0
700)
0.01
22 (0
.099
8)
TOTA
L_EX
PEN
D0.
0012
(0.0
008)
0.00
24 (0
.000
5)**
*0.
0010
(0.0
002)
***
0.00
11 (0
.000
3) *
**0.
0016
(0.0
004)
***
CO
NST
AN
T0.
2817
(0.5
467)
–0.3
223
(0.4
027)
LAM
BD
A–0
.882
7 (0
.722
4)
RH
O–0
.923
9
SIG
MA
0.95
540.
8805
(0.0
489)
N19
119
1
Link
test
–0.
3618
*
Pseu
do R
2–
0.07
Wal
d 2
(13)
–
35.2
0***
Log
likel
ihoo
d –
–233
.71
Not
es: T
he d
epen
dent
var
iabl
e is
the
quan
tity
of e
dibl
e bu
tter
cons
umed
. The
figu
res
in th
e pa
rent
hesi
s ar
e ro
bust
sta
ndar
d er
rors
; ***
, **,
and
* in
dica
te s
tatis
tical
si
gnifi
canc
e at
a p
roba
bilit
y of
less
than
1%
, 5%
, and
10%
, res
pect
ivel
y. T
he n
umbe
r of
obs
erva
tions
left-
cens
ored
in th
e To
bit m
odel
est
imat
ion
is 2
5.
Sour
ce: B
ased
on
surv
ey d
ata.
83
This indicates there are no sample selection biases in that there are no unobservable
household characteristics influencing the household’s likelihood to consume milk and
butter and hence the quantities of milk and butter consumed. Thus, since there is no sample
selection biases the determinants of the quantity of raw milk and butter consumed are
analysed based on Tobit model. Four marginal effects are calculated for the Tobit model at the
means of all other variables and are given in columns 2 to 5 of Tables 48 and 49. The model
chi-square for Tobit model indicates that the overall goodness-of-fit of the Tobit model is
statistically significant at a probability of less than 1% for fluid milk and butter. This indicates
that jointly the variables included in the Tobit model explain the variations in the household’s
quantity of raw milk and butter consumed.
The gender of the head of household is negatively associated with the quantities of fluid
milk and butter consumed. However, the effects are not statistically significant in all cases.
The age of household head is positively associated with the quantity of raw milk and butter
consumed by the household. However, the effect is also not statistically significant in all
cases. It is interesting to note that the effect of household size on the quantity of milk and
butter consumed is negative as expected but is statistically significant at a probability of less
than 10% in the case of fluid milk. The effects of the age composition of household size on
the quantities of milk and butter consumed are positive but statistically not significant. The
effect of education on the quantity of milk consumed is statistically significant at a probability
of less than 10% while in the case of butter it is not significant at this probability level.
The effect of the location of the residence of household is positive for both milk and butter
but is statistically significant only for butter. The per capita butter consumption is higher
for Asella town than Adam town. The doctor’s advice appears to have a positive effect on
milk consumption while it has negative effect on the butter consumption but these effects
are not statistically significant. As expected, fasting has negative and statistically significant
impact on the quantity of milk consumed. However, the effect of fasting on quantity of
butter consumed is not statistically significant. In agreement to the theoretical expectation,
the household income is observed to have positive effect on both fluid milk and butter
consumption. However, statistically significant relationship is found only between household
income and the consumption of butter. Income does not seem to constrain the consumption
of milk.
7.4 Section summary
It is observed that significant proportion of the households reported that they think their
current monthly consumption level is inadequate for fresh milk (72%), edible butter (62%),
cheese (43%) and cosmetic butter (38%). These indicate potential market exists for increased
84
milk production. In general, given low levels of dairy products consumptions and the
consumer’s interest to increase their level of consumption, there is good prospect for dairy
products market expansion in the area. Increased availability at the affordable prices and
promotional activities are required to increase the dairy products consumption levels. In
general, the market for dairy products exists and the outlook is also good.
85
8 Conclusion and implicationsMembership of smallholder dairy producers in a milk marketing cooperative is a key factor
in determining their decision to participate in milk and butter markets and levels of market
participation. Quantities of milk and butter produced, marketed and consumed by the
members of cooperatives are significantly larger than those of non-members. However, the
current levels of cooperative milk collection, processing and marketing activities are not large
enough to have significant impact.
The quantity of milk collected is low. There are few numbers of milk marketing cooperatives
and milk collection centres. The numbers of dairy producers who are the members of the
milk marketing cooperatives are also few compared to the total population of dairy producers
in the area. Usually, there is only one milk collection centre per one milk marketing
cooperative. The milk marketing cooperatives do not exist in all areas, particularly in remote
off-all-weather roads. The range of dairy products handled and the processing capacity of the
cooperatives are also limited. The major dairy products sold by the cooperatives are skimmed
milk, butter, cheese and yoghurt. Therefore, there is a clear need for scaling-up cooperative
marketing activities, to organize more dairy producers into milk marketing cooperatives,
increase milk collection centres and widen the cooperatives’ geographic coverage.
Analysis of patterns of consumer purchase and consumption of dairy products points to
promising prospects for expansion of markets for dairy products through scaling-up efforts.
This is because the current per capita consumption of dairy products is very low and the
consumers think their current level of consumption is inadequate and are interested in
increasing their level of consumption, provided that dairy products are available at affordable
prices. In general, demand for milk and dairy products is unsatisfied locally despite the
presence of regional and national market opportunities.
Efforts to scale up cooperative marketing activities and enhance local capacity for
smallholder dairy development requires continuous assessment of the dynamics of
production, marketing and consumption situations for milk and dairy products in the project
area and beyond. In this regard, this study has made efforts to collect, analyse and generate
information to inform scaling-up efforts by the government, NGOs and donor agencies.
86
ReferencesAhmed MA, Ehui S and Assefa Y. 2004. Dairy development in Ethiopia. EPTD Discussion Paper 123.
IFPRI (International Food Policy Research Institute), Washington, DC, USA.
Barrett C. 2001. Livestock pricing and markets performance. Research Brief 01–05–PARIMA. Global Livestock Collaborative Research Support Program (GL–CRSP), University of California Davis, USA.
Barrett C. 2008. Smallholder market participation: Concepts and evidence from Eastern and Southern Africa. Food Policy 33(4):299–317.
Bellemare MF and Barrett CB. 2006. An ordered Tobit model of market participation: Evidence from Kenya and Ethiopia. American Journal of Agricultural Economics 88(2):324–337.
Bennett A, Lhoste F, Crook J and Phelan J. 2006. The future of small scale dairy. FAO (Food and Agriculture Organization of the United Nations) Livestock Report. FAO, Rome, Italy.
Bernard T, Seyoum A and Gabre-Madhin E. 2008. Impact of cooperatives on smallholders’ commercialization behaviour: Evidence from Ethiopia. Agricultural Economics 39:47–161.
Delgado C. 2003. Rising consumption of meat and milk in developing countries has created a new food revolution. Journal of Nutrition 133(11):3907S–3910S.
Delgado C, Rosegrant M, Steinfeld H, Ehui S and Courbois C. 1999. Livestock to 2020: The next food revolution. Food, Agriculture and the Environment Discussion Paper 28. IFPRI (International Food Policy Research Institute), Washington, DC, USA, FAO (Food and Agriculture Organization of the United Nations), and ILRI (International Livestock Research Institute), Nairobi, Kenya. 83 pp.
Faiguenbaum S, Berdegue J and Reardon T. 2002. The rapid rise of supermarkets in Chile: Effects on dairy, vegetable, and beef value chain. Development Policy Review 20(4).
Gotez S. 1992. A selectivity model of household food marketing behaviour in sub-Saharan Africa. American Journal of Agricultural Economics 74:444–452.
Greene W. 1993. Econometric analysis. 2nd edition. Macmillan, New York, USA.
de Haan H, Stamoulis K, Shetty P and Pingali P. 2003. The world food economy in the twenty-first century: Challenges for international co-operation. Development Policy Review 21:683–698.
Hall DC, Ehui S and Delgado C. 2004. The livestock revolution, food safety and small-scale farmers: Why they matter to us all. Journal of Agricultural and Environmental Ethics 17:425–444.
Heltberg and Tarp F. 2002. Agricultural supply response and poverty in Mozambique. Food Policy 27:103–124.
Hemme T, Garcia O and Saha A. 2003. A review of milk production in Haryana-India with special emphasis on small milk producers. Pro-Poor Livestock Policy Initiative Paper No. 2. FAO (Food and Agriculture Organization of the United Nations), Rome, Italy.
Hobbs JE. 1996. A transaction cost approach to supply chain management. Supply Chain Management 1(2):15–27.
Holloway G, Nicholson C, Delgado C, Staal S and Ehui S. 2004. A revised Tobit procedure for mitigating bias in the presence of non-zero censoring with an application to milk market participation in the Ethiopian highlands. Agricultural Economics 31:97–106.
87
de Janvry A, Fafchamps M and Sadoulet E. 1991. Peasant household behaviour with missing markets: Some paradoxes explained. Economic Journal 101:1400–1417.
Key N, Sadoulet E and de Janvry A. 2000. Transactions costs and agricultural household supply response. American Journal of Agricultural Economics 82:245–245.
Lapar ML, Holloway G and Ehui S. 2003. Policy options promoting market participation among smallholder livestock producers: A case study from the Philippines. Food Policy 28:187–211.
Moll H, Staal S and Ibrahim MNM. 2007. Smallholder dairy production and markets: A comparison of production systems in Zambia, Kenya and Sri Lanka. Agricultural Systems 94:593–603.
Reardon T and Swinnen JFM. 2004. Agrifood sector liberalization and the rise of supermarkets in former state-controlled economies: A comparative overview. Development Policy Review 22(5):515–523.
Reardon T and Timmer CP. 2005. Transformation of markets for agricultural output in developing countries since 1950: How has thinking changed? In: Evenson R and Pingali P (eds), Handbook of agricultural economics. Volume 3A. Elsevier Press, Maryland, USA.
Reardon T, Berdegué JA, Timmer CP, Cabot T, Mainville D, Flores L, Hernandez R, Neven D and Balsevich F. 2004. Links among supermarkets, wholesalers and small farmers in developing countries: Conceptualization and emerging evidence. Michigan State University, Michigan, USA.
Reardon T, Timmer CP, Barrett, CB and Berdegué J. 2003. The rise of supermarkets in Africa, Asia and Latin America. American Journal of Agricultural Economics 85(5):1140–1146.
Sadoulet E and de Janvry A. 1995. Quantitative development policy analysis. Johns Hopkins University Press, Baltimore, USA.
Staal S, Delgado C and Nicholson C. 1997. Smallholder dairying under transaction costs in East Africa. World Development 25(5):779–794.
Tobin J. 1958. Estimation of relationships for limited dependent variables. Econometrics 26: 24–36.
Walshe MJ, Grindle J, Nell A and Bachmann M. 1991. Dairy development in sub-Saharan Africa: Study of issues and options. World Bank Technical Paper 135. Africa Technical Department Service.
Wooldridge J. 2002. Econometric analysis of cross section and panel data. MIT Press, USA.
Yigrem S, Beyene F, Tegene A and Gebremedhin B. 2008. Dairy production, processing and marketing systems of Shashemene–Dilla area, South Ethiopia. IPMS (Improving Productivity and Market Success) of Ethiopian Farmers Project Working Paper No. 9. ILRI (International Livestock Research Institute), Nairobi, Kenya. 62 pp.
Young L and Hobbs J. 2002. Vertical linkages in agri-food supply chains: Changing roles for producers, commodity groups, and government policy. Review of Agricultural Economics 24(2):428–441.
Zylberstztajn D and Filho C. 2003. Competitiveness of meat agri-food chain in Brazil. Supply Chain Management 8(2):155–165.

ISBN 92–9146–198–9