improving secondary school students’ … · an action research proposal submitted to the graduate...
TRANSCRIPT
IMPROVING SECONDARY SCHOOL STUDENTS’ ACHIEVEMENT USING INTRINSIC MOTIVATION
Erik Albrecht, B. A. Rebecca Haapanen, B. A.
Erin Hall, B. A. Michelle Mantonya, B. A.
An Action Research Proposal Submitted to the Graduate Faculty of the
School of Education in Partial Fulfillment of the Requirements
for the Degree of Master of Arts in Teaching and Leadership
Saint Xavier University
Chicago, Illinois
May 2009

i
ABSTRACT
This report describes a program for increasing students’ intrinsic motivation in an effort to increase academic achievement. The targeted population consisted of secondary level students in a middle to upper-middle class suburban area. The students of the targeted secondary level classes appeared to be disengaged from learning due to a lack of motivation. The aforementioned issue had a tendency to lead to negative classroom behavior and a hindrance of academic progress. A review of current literature indicated significant low motivation among secondary level students as well as coexisting behaviors. Further evidence was gathered in the project supporting the existence of this problem including academic records as well as anecdotal records of student behavior. The problem as defined by professional sources and educational literature led to the development of the following three interventions: student autonomy, goal-setting, and positive teacher feedback. By offering a greater amount of choices to the students, providing more authentic assessments, and allowing students to take a more active role in their education, intrinsic motivation of secondary school students will improve and a mentality of learning for mastery as opposed to extrinsic rewards will be instilled.
ii
TABLE OF CONTENTS
ABSTRACT ………………………………………………………………………….…i CHAPTER 1: PROBLEM STATEMENT AND CONTEXT…………………………..1
General Statement of the Problem………………………………………………1
Local Context of the Problem..………………………………………………….2
The Surrounding Community……………………………………………….…...15
National Context of the Problem………………………………………………...23
CHAPTER 2 : PROBLEM DOCUMENTATION……………..………………..………30
Problem Evidence………………………………………………………….…….30
Probable Causes …………………………………………...……………...……..36
CHAPTER 3 : THE SOLUTION STRATEGY...……………………………………….45
Literature Review……………………………………………………...…………45
Project Objectives and Processes………………………………………….……..49
Project Action Plan………………………………………………………………50
Methods of Assessment………………………………………………………….52
CHAPTER 4 : PROJECT RESULTS……………………………………….…………...54
Historical Description of the Intervention………………….……………………54
Presentation and Analysis of the Results…………………………….………..…55
Conclusions and Recommendations.………………..…………………………...65
Reflections ………………………..………………………………………….….67
REFERENCES…………………………………………………………………………..74
APPENDICES……………………………………………………………………...……79
1
CHAPTER 1 PROBLEM STATEMENT AND CONTEXT
General Statement of the Problem
The targeted students were members of one eighth grade physical education class at Site
A, one sophomore literature and composition class at Site B, one twelfth grade geography class
at Site C, and one ninth grade world history class at Site D. The students were from three
different high schools and one middle school located in three different districts in the suburbs of
a metropolitan area in the Midwest. The teacher researchers who taught theses four classes
believed their students showed signs of low motivation and underachievement. The combination
of these two problems was significant in its impact on the students’ ability to succeed both inside
and outside the classroom. Evidence of this problem included the teacher researchers’
observations of student achievement, teacher researcher reflections on student engagement in
activities, and student assessments and grade records indicating performance.
Immediate Context of the Problem
Four teacher researchers conducted this action research project. All teacher researchers
taught at the secondary level. The teacher researcher at Site A taught two classes of physical
education for each grade, fifth through eighth. Only the eighth grade class was included in this
project. The teacher researcher from Site B taught four classes of sophomore literature and
composition and one senior elective of science fiction, but only the sophomore class was used in
the research. Site C’s teacher researcher instructed 11th and 12th grade geography and U.S.
history and used the 12th grade geography class as subjects in this project. Site D’s teacher
researcher taught 9th and 10th grade world history and economics and included the 9th grade
world history class in this project.

2
Local Context
Site A Site A had a student body of 533 students in kindergarten through eighth grade in 2006.
The school was not very racially diverse with 88.7 percent White students. Many of the minority
students were Hispanic or Asian/ Pacific Islander and the remaining 3.1 percent were Black or
Multiracial. With the limited racial diversity it made sense that less than one percent of the
students had a low English efficiency rate. Site A was in an upper middle class neighborhood
with only 3.2 percent of their students requiring Low-Income Rates. The school was in the top
ten in its county for attendance with a 96.2 attendance rate and a zero chronic truancy rate. The
student population was very steady with only a 1.9 percent mobility rate (2007 State Report
Card).
There were 118 full time teachers in District A with 54 of those teachers working at Site
A. Each grade had three teachers with the exception of second and third grade, which had four
teachers each. In addition to classroom teachers there were three physical education teachers,
three music teachers, three computers teachers, a health teacher, two art teachers, as well as
seven teachers for special education and gifted students. The majority of teachers were female at
88.1 percent. The faculty, like the students, was almost one hundred percent white with only 1.6
percent of teachers from the Asian/ Pacific Islander and Hispanic races. The faculty at Site A
was experienced, seeing as the average years of experience among teachers was just less than ten
years. All of the teachers at Site A were considered highly qualified in their respective content
areas. Slightly more than half of the teachers had obtained a bachelor’s degree and just over 46
percent of teachers had achieved their master’s degree. The school had 3.3 percent of teachers

3
teaching with emergency or provisional credentials. The instructional setting at School A was an
intimate one with the class sizes averaging 19 students (State School Report Card).
Site A had a variety of educational and recreational programs. The required subjects of
math, science, English/ language arts, social studies, literature and physical education had 41
minutes per day devoted to them. Students also took four “specials” classes that included health,
technology, art and music, throughout the year. Each special lasted one quarter of the school
year. For students who required special services for learning disabilities, speech, occupational
therapy, social work, giftedness, or psychology there were staff members available to
accommodate them. In addition to academics, Site A offered a variety of other opportunities
including band, choir, mathematics club, mathematics team, chess club, game club, academic
bowl, spelling bee, yearbook, newspaper, boys and girls basketball, girls volleyball, cross
country, track, wrestling, cheerleading, and soccer. These activities were offered to all middle
school students. Almost 100% of these activities were staffed by school staff, which helped build
relationships between teachers and students. Students were offered many activities and were
afforded the luxury of attending a school that was equipped for student learning and research.
Site A had a learning resource center (LRC) with over 13,000 titles. The LRC was also equipped
with 45 computers that were connected to the internet. Site A also had two laptop carts each with
a classroom set of laptops that were available for teachers to check out for their classrooms. Site
A had two computer labs in order to teach technology to students in first through eighth grade.
Teachers were not left out of the availability of technology. Each teacher was issued, for school
use, one laptop, which could access the Internet anywhere there is an open wireless network.
As Site A was one of two schools in a small district, the administrative structure was very
simple. There was a superintendent and an elected school board that oversaw the entire district.

4
Each school in the district had one principal who served the faculty, students and parents at their
school. The district also shared other administrators that included a curriculum director, special
education director and technology director. All of the administrators were just a phone call or an
email away from all teachers and parents.
School A was considered a neighborhood school with 42%of the students walking to
school in 2006. The school, which was built in 2005, is situated on 10 acres in a suburban/ rural
area. At this time their school was surrounded on two sides by a subdivision development and by
farmland on the other two sides. The grounds of the school included areas that had been
designated for playground and playing fields. The playing fields were used for school and park
district soccer and softball games. Physical education classes also had access to these playing
fields for activities such as kickball, soccer, football, baseball, and other outdoor activities.
Site B
Site B, a high school located in the mid-west, was built in 1918 and run as the largest
high school in its community for years. The ever increasing development of land and residential
growth created the need for a larger facility to meet the area’s educational demands. In 1953, the
current building opened its doors just ¼ mile west of the original campus’ site. This large brick
two-story building was surrounded by mature trees, athletic fields, ample parking, and a 12-acre
lake. The school property was and remains bordered by a residential community on all but the
lake side.
This structure met the demands placed on it for several years until other communities
within the township began to feel the need for a district of their own, and started splintering off.
The fist community to break away created a school 10.6 miles directly to the west. Several years
later, another school was built just three miles to the west. Each of these new schools became a
5
district of their own, and had no affiliation with Site B. The growth of Site B continued
throughout the 1960s. There were additions made to the current site in 1971, adding 20
classrooms and a larger library. Throughout the 1980s and 1990s, the growth of the student
population forced the reopening of the original 1918 site to satisfy some of the space needs for
the students. Freshmen were taught at the original site, and were allowed to commute to the
current site to take classes not offered in the freshmen building. From time to time, mobile units
were placed outside the freshman site when enrollments surpassed its capacity.
It was becoming obvious that changes were needed, but the community had been
reluctant to support the development of an additional building. In 1997, when enrollments
swelled to a record 2,479 students, a referendum was passed in the community which allowed for
the building of an entirely new facility just six miles south of the current site. The new building,
finished for the 1999-2000 school year, would remain part of the district. Further additions were
made to Site B in 1998, when 10 more classrooms were added. Site B underwent construction
again in 2004. Because of the space problems which continued to plague the district, class sizes
were above the state average. This addition was to provide the space needed to educate the
students who were enrolled at the time. It included 18 classrooms, new offices, 4 bathrooms, and
a music facility. From 2006-2007, yet even more structures were added as the football field
received new turf and a new concession stand, the student auditorium received new seating, and
the athletic department received two new gymnasiums. The building also became equipped with
new security cameras.
The school’s total enrollment for the 2006-2007 year was 1, 950 students. The
demographics of the site reflect those of the community. In this predominantly White locale, the
school reported an ethnic breakdown of 87% White students, while 5.7% were Asian. Another

6
3.6% were Hispanic, 1.5% were Black, 0.1% were Native American, and 2.1% were Multiracial.
Among these students, 3.1% were low-income and 0.4% had limited English proficiency. The
chronic truancy rate was 0.2%, while the overall attendance rate was 95.1%. The high school
graduation rate was 97.2% with a dropout rate of 0.5% (State School Profile, 2007).
Diversity at Site B was limited, not only in the context of students, but also in that of
teachers. Of the 204 faculty members, 96.4% were White, 1.9% were Asian/Pacific Islander,
0.5% were Black and 0.5% were Hispanic. Distinct from the state in its teacher gender ratios,
Site B had an equal number of men and women in its breakdown among faculty members: 50.5%
male and 49.5% female. This was more than twice the percentage of male teachers than the state
average. Educationally, Site B’s faculty members were well above the state average. Of the
teachers, 74.9% had a degree beyond a bachelor’s. The average teacher experience level was
more comparable to the state at 12.7 years. The student-staff ratio was17.3:1, while the
administrator-student ratio was 134.8:1. Income for Site B teachers was well above the state
average, with the mean teacher income at $79,975. This was generally equalized due to the
higher cost of living in the Site B community (Interactive State Report Card, 2007).
Financially, students at Site B were well supported by the community in their academic
funding. This allowed the school to offer a wide array of subjects, and provided a well-developed
support network for those willing or needing to use it. The 223 courses available fell into 16
different areas, including Applied Arts, Art, Business Education, Driver Education, English,
Family and Consumer Sciences, International Language, Mathematics, Music, Physical Welfare,
School Publications, Science, Social Studies, Special Services, and Theatre Arts. In each of these
areas there was a wide variety of courses. Students also had the opportunity of attending the
Technology Campus at a local community college to study vocational occupations. At Site B,
7
educational support came in a number of modes. Students who struggled with study skills or had
deficiencies but were not given Instructional Education Plans could receive one-on-one tutoring
through an extra study hall called PAWS. Academic assistance was also available every hour and
before and after school through the Writing Lab and Math and Science resource room. In
addition to a fully-stocked library resource center, there were five staffed computer labs located
throughout the building. The building could provide further support to students through the three
Learning Support Teams which were in place. Each Learning Support Team was comprised of a
dean, three counselors, and a social worker. A Student Assistance Program Coordinator, a nurse,
and a Community Resource Officer provided support to all three teams. Administrative duties
were addressed by a building level staff of 10, which included a Principal, two Associate
Principals, a Pupil/Personnel Supervisor, and six Department Heads (Site B Website, 2007).
Academically, the majority of Site B students tended to have high success. According to
the school report card scores, standardized measures of academic achievement were consistently
above average. Most recent ACT results reported an average score of 24.8, compared to a state
average of 20.3. This site offered 20 AP courses. Almost 400 students wrote a total of 751 AP
examinations, and of the tests taken, 85% of the grades scored a 3 or better. The graduation rate
was 97.2%, with many of Site B’s students winning numerous academic honors yearly (State
School Profile, 2007).
The academic year in the school is one of the longest in the state at 186 contact days.
Students started during the third week of August, and ended during the first week of June.
Students are given sufficient time off for all of the typical holidays. Each school day is
comprised of eight 50-minute periods which began at 7:30 a.m. and are separated by 5-minute
passing periods. Third period was lengthened by five minutes for the Pledge of Allegiance and
8
building announcements. One to two Wednesdays a month were run on a late start/first class
schedule which provided time for department meetings during the late start, and 20 minutes for a
character education program called First Class between second and third periods. Grades were
issued every nine weeks, with mid-term grades being issued every four weeks (Site B Website,
2007).
Extracurricular opportunities at Site B were plentiful. There were 46 student activities
available through the district, which were either academic or recreational in nature. Options
ranged from Future Business Leaders of America to the Ping Pong Club, to The Gay Straight
Alliance, and seemed to offer an option for most students. Fine Arts were also a strong part of
the Site B culture, with what many educators considered to be the finest music program in the
state. These groups often received local, state, and national honors for their achievement (Site B
Website, 2007).
Athletic activities made up a large part of the culture of Site B, and were eagerly
embraced by the members of the community. Activities available for males and females were
very broad in scope. With the large student population, there were enough students to make all of
the standard high school athletic offerings viable. Site B tended to produce teams which were
quite competitive, and frequently vied for conference, division, and state titles. Teams were
coached primarily by faculty members, but community members often assisted in coaching
efforts. To participate in any of the Class AA athletics students had to maintain academic
eligibility, which included passing all but 20% of their classes. Clubs and activities did not have
an eligibility requirement, but there were many of them that met after school or in the early
evening at Site B (Site B Website, 2007)
9
Site C
According to the State School Report Card (2007), School Site C served 2,190 students in
an 11th through 12th grade setting. The student population was composed of 63.5% White, 9.65%
Black, 14.5% Hispanic, 10.7 % Asian/Pacific Islander, 0.6% Native American, and 1.1% Multi-
racial/Ethnic. Of the 2,190 students at Site C, 11.2% were from low-income families, 3.4% had a
limited-English proficient rate, the high school dropout rate was 0.7%, the chronic truancy rate
was 12.1 %, the attendance rate was 91.8%, and the mobility rate was 4.6%. The graduation rate
at School Site C was 96.4% and was made up of the following: 95% of males, 97.8% of females,
97.7% of Whites, 95.2% of Blacks, 87.8% of Hispanics, 100% of Asian/Pacific Islanders, 100%
of the Multi racial/ethnic group, 97.7% of the students with disabilities, and 93.3% of the
economically disadvantaged students.
The students at School Site C were very high achieving students. For example, according
to the 2007-2008 School Profile, in the class of 2007 of 971 graduation candidates, there were
two National Merit finalists, 82% of graduates were college bound, 24 National Merit
Commended students, 139 Illinois State Scholars, 58 President’s Education Awards, one
National Merit Hispanic Recognition, and two National Merit Achievement Program recipients.
In the 2006-2007 school year, the composite score for the ACT was a 21.8, which 99% of the
class took, and 6% of the class took the SAT and scored a 654 in Critical Reading 679 in Math
and a 641 in Writing. Required testing was not the only form of testing students took last year;
426 students took 802 Advanced Placement Examinations. With a score of a 3, 4, or 5 92% of
students reached this with the A.P Biology exam, 92% of the A.P. Calculus AB exam, 95% of
the A.P. Calculus CD exam, 79% of the A.P. Chemistry exam, 98% of the A.P. English
Language & Composition exam, 97% of the A.P. English Literature & Composition, 88% of the
10
A.P. European History exam, 91% of the A.P. Physics B exam, 85% of the A.P. Physics C exam,
94% of the A.P. Statistics exam, 82% of the A.P. U.S. History exam, 92% of the A.P.
Psychology exam, 78% of the A.P. Economics-Micro exam, 52% of the A.P. Economics-Macro
exam, 50% of the A.P. German exam, and 100% of the A.P. Government exam.
According to the State School Report Card in 2007, School Site C had 110 teachers. Of
the 110 teachers, 55.5% female and 44.5 were male, 93.4% White, 0.9% Black, 3.9 Hispanic, 1.7
Asian/Pacific Islander, and 0% Native American. The average teaching experience was 10.7
years. Teachers with bachelor’s degrees accounted for 49.3% of teachers, while 50.7% had a
master’s degree or above. The 110 teachers were spread across 10 teaching categories. There
were 4 in business, 12 in physical education/health/drivers education, 15 in social studies, 16 in
English, 13 in science, 14 in math, 20 in special education, 2 in industrial technology, 7 in fine
arts, and 7 in foreign language. The average teacher salary was $63,556. The pupil-teacher ratio
was 1 to 19.2. The average class size was 20.3 students (State School Report Card, 2007).
School Site C had many academic programs that benefitted students in various areas.
According to district statistics, the operating cost per student was $10,433. A portion of this was
distributed to various services granted such as student services, clubs, and sports. At Site C,
student services included in house special education composed of 19 teachers and aids, an
academic recovery program called ARC with one teacher, and a guidance department with 6
counselors, one social worker, one psychologist, and two deans. The individuals involved with
the academic programs of Site C aided students with personal, social, academic advisement,
college selection, and career/vocational plans. There were more than 2,600 students involved in
the 32 clubs and 24 interscholastic sports at Site C.

11
The administrative structure at Site C was as follows. At the district level, there was a
Superintendent, Assistant Superintendent, Director of Business Services, and Director of
Instruction and School Improvement. Located at Site C, there was a Principal, an Assistant
Principal, a Director of Special Education, and two Deans. Problems often arose as there was one
set of building administrators at each building.
Site C was very unique among the 20 public high schools in its county. Site C was one of
three split campus high schools. Site C was the junior/senior campus and Site D was the
freshman/sophomore campus. The two schools were located about 15 minutes from one another
both located in the same village. The split campus at Site C and Site D had existed since 1997
when a second high school was built to accommodate increased enrollment and expanding
housing developments in the district. Site C was built with the intention that it would eventually
be converted into a second four-year school. Ten years later, this idea still had not materialized
due to an unsupportive community and failure to pass referendums. When the school was built in
1997, it was built with the intent to form it into a four-year school. Because of this, there is a lot
of open space surrounding the school. To the north was land owned by the local park district, to
the east was a single family residential subdivision, to the south were numerous acres of open
land currently being used as soccer and softball fields, and to the west was more park district
owned land, which backed into another single family residential subdivision.
Site D
According to the State School Report Card (2007), which is where the following
information is drawn from, School Site D served 2190 students in a 9th and 10th grade setting.
The student population was 63.5% white, 14.5% Hispanic, 10.7% Asian/Pacific Islander, 9.65%
Black, 1.1% Multi-Racial/Ethnic, and .6% Native American. Students from low income families

12
made up 11.2% of the population. The school report card also indicated that 3.4% of the student
population had a limited-English proficiency. For 2007, Site D had a 91.8% attendance rate and
also had a mobility rate of 4.6%. The chronic rate of truancy at Site D was 12.1% for 2007. The
graduation rate was 96.4% and the drop-out rate was .7%. Lastly, the pupil-teacher ratio was
19.2 to 1 and the average class size was 20.3 students.
School Site D, according to the 2007 state report card had 139 teachers. The teacher
population was 44.5% male and 55.5% female, 93.4% white, 3.9% Hispanic, 1.7%
Asian/Pacific Islander, and .9% Black. The total number of staff by category was as follows:
Business had 6 teachers, Math had 17 teachers, Foreign Language had 15 teachers, Social
Studies had 16 teachers, Art, Music, and Theater had 6 teachers, English had 21 teachers, Drivers
Education, Health, and Physical Education had 15 teachers, Science had 19 teachers, Industrial
Technology had 5 teachers, and Special Education had 19 teachers. The average level of teaching
experience for teachers at Site D was 10.7 years and the average teacher salary was $63,556.
Fifty three percent of the teachers at Site D had a Master’s Degree or beyond.
As a large high school, Site D was faced with the difficult task of preparing students for
adulthood. Whether the students were to go to college or to the working world, the school was
intended to provide valuable academic and social skills necessary for success. Students at site D
took a core curriculum of math, science, English, and social studies, which was further
differentiated by ability level. Speaking to ability levels, Site D served a large population of
academically advanced students with over 25 Honors and Advanced Placement classes. On the
opposite end of the academic scale, Site D offered a unique program called SWS or School
Within a School. SWS was designed for students who had a difficult transition from middle
school to high school and provided a much lower pupil-teacher ratio and a much more structured

13
environment and academic setting. SWS also served its students in Reading Recovery. Site D
had a large population of special education students who received direct attention from a staff of
19 teachers. Additionally, students who struggled academically yet whom could not qualify for
special education services from the state could request a 504 plan. All of these programs were
modeled on the fact that every student could and would succeed if given the opportunity.
School Site D offered an extensive social work program in 2007. There were six school
counselors, two social workers, and one school psychologist. These professionals assisted
students with personal, social, academic advisement, college selection, and career/vocational
plans. Students typically requested to speak to their assigned counselors, but teachers and staff
can and do notify the counselors or social workers if there is a potential problem.
School Site D’s students were highly involved with over 1200 students who participated
in at least one club, organization, or athletic program in 2007. The activities offered were band,
hockey, academic team (Scholastic Bowl) Astronomy Club, Art Club, choir, EXCEL, Future
Business Leaders of America, French Club, German Club, International Club, Knitting Club,
Mother Earth’s Concerned Students, Ski Club, Spanish Club, Speech Team, Student Council,
Scratch Paper (student newspaper) Students of Service, yearbook, Winter Guard, and Council for
Exceptional Children. The various athletic offerings at school Site D were football, wrestling,
soccer, swimming, cheerleading, baseball, softball, bowling, basketball, hockey, track, cross
country, tennis, golf, gymnastics, volleyball, and lacrosse. All of the athletic programs and extra-
curricular activities were staffed by teachers which allowed for a much closer relationship
between staff and students.
The administrative structure of Site D was traditional with one principal, one assistant
principal, and three deans. The upper administration consisted of the Superintendent, Assistant
14
Superintendent, Director of Business Services, and the Director of Instruction and School
Improvement split their time between Site C and Site D.
School Site D was very unique due to the fact that its student body consisted entirely of
freshman and sophomore students. Without the benefit of upperclassmen, the school made
generating camaraderie and school spirit a priority. To generate school spirit, the school
regularly had pep assemblies, sports awards nights, sports boosters, celebrations of freshman and
sophomore athletes, and the school recognized every Friday as a school spirit day. Homecoming
was the premier spirit event with a highly publicized football game and a parade that involved
the community as a whole. By instilling school spirit early on in the freshman students, that spirit
continued along with the students as they moved on to the Junior and Senior campus. The end
result was a student body truly dedicated to the school, athletic programs, and their fellow
classmates.
Site D was first built in 1917 and opened with 57 students in attendance. The school grew
over the years necessitating a number of additions built in 1951, 1956, 1960, 1968, and 1974.
The original building was destroyed by a major fire in 1984 that was set by a student. The
building for Site D was opened in 1987 and served a student population of 2190. A second
campus serving the junior and senior students (school site C) was opened in 1995. Site D was
bordered on the north by a major thoroughfare, the east and the west by an upper-middle class
neighborhood, and bordered on the south by the public library. The school’s grounds
encompassed a large field house with an indoor track and workout facility, an indoor swimming
pool with a diving well, a very large gymnasium, four outdoor tennis courts, the varsity football
stadium with lights for night games, and a number of practice fields for the various outdoor
sports.

15
School Site D, which served the freshman and sophomore students of the district, in
conjunction with school Site C which served the junior and senior students, created a very unique
high school experience for its students. Though splitting the campuses at first was a way to cope
with outgrowing the original school, an interesting, unintended benefit has taken place. With a
two campus school, over the course of a student’s four year experience, they had the opportunity
to be upperclassmen on two separate occasions; once as a sophomore at Site D and once as a
senior at Site C. The benefit is the fact that students at Site D seemed to mature faster than those
at other four-year high schools because they had the responsibility to act as “seniors,” in a sense,
while they were sophomores and then the process repeated itself once again when they actually
become seniors. The end result was a student body that knew what was expected of them which
allowed the teachers to treat them as young adults rather than adolescents.
The Districts and Surrounding Communities Context
Schools are a microcosm of the communities that they serve. Looking at the make up of
the student body at a school can give an accurate representation of the make up of the
community. All three school sites were located in the same county in the Midwest and were
approximately in an 11 square mile radius. Although the communities represented different
demographics and characteristics, the students in this study were all at the secondary level and
exhibited similar motivational behaviors and underachievement.
Community A
Site A’s community was classified as a village and was located in an outlying suburb of a
major Midwest metropolitan area. According to the most recent data from the U.S. Census
Bureau the community Site A’s community had a population of 12.539 in 2000. The population
breakdown was similar to that of Site A’s with 92.8% White, 3.0% Asian, 4.1% Hispanic, 1.5 %
16
Black, 0.2 % American Indian or Alaska Native, 1.3% representing some other race, and 1.2%
representing two or more races. The distribution of ages in the community were 9.5% under age
5, 69.7 % were 18 years and older and 6.7% of the population was 65 and over (U.S. Census
2000).
As indicated by the 2000 U.S. Census, the average family size in Community A was 3.27
and the mean family income in 1999 was $78,271. There were 37 families below poverty level.
Of the community members over 16, 63.9% were in the labor force. The percentage of
community members with bachelor’s degrees was 28.3% and 9.5% of community members had
obtained a graduate or professional degree.
According to the village’s website information, students attended several schools
depending on where they resided within the village. There were four kindergarten through sixth
grade schools, one kindergarten through first grade school, three second through fifth grade
schools, two middle schools and at Site A, a kindergarten through eighth grade school. There
were two public high schools that students fed into based on the location of their residence as
well as a Catholic high school in a nearby town. Site A was one of two schools in its district. The
two schools were within a mile of each other. The district’s mission statement was “efficiently
preparing students to become productive, responsible members of a changing world by providing
a nurturing environment that stimulates a voluntary desire to learn and educational experiences
that rigorously promote the realization of individual potential and excellence in achievement”
(Site A’s website). The State School Report Card for School District A reported that 64.6% of
revenue was generated by local property taxes. The most recent referendum was passed in 2003.
This referendum was intended to fund the building Site A, which was completed in 2005.
17
Site A was a school that was located in a rapidly growing area. In 2007 there were six
new housing developments in the area. The addition of these developments will continue to
impact student population, class size and diversity in the schools. There had been very little
commercial development in the area. The village that Site A was located in was investigating the
possibility of more commercial development. Additional commercial development could offer
more tax revenue for the school at Site A.
Community B
The district in which the research site exists was founded in 1916. Formerly a one-
building district, the creation of a second high school in 1999 brought the school total to two.
The addition of a new school made for friendly rivalry between the two campuses in areas of
academics and athletics, with both schools proving they were very capable. Despite the fact that
there were multiple school locations, the district was fairly homogenous in nature (Site B
website, 2007).
Demographics for the district as a whole were very similar to either of the schools’
frameworks. The district reports student racial breakdown of 80.5% White, 9.8% Asian, 5.7%
Hispanic, and 1.7% Black. The district found itself to be a predominantly white upper-middle
class in composition. A low-income rate of 4.6% existed in stark contrast to the state average of
40.9% (Interactive State Report Card, 2007).
The academic focus of the district was clearly demonstrated through statistics such as a
graduation rate of 95.4%, an attendance rate of 94.9%, a dropout rate of 0.6%, and a truancy rate
of 0.2%, which were all on the favorable side of state averages by a sizeable margin (Interactive
Illinois Report Card, 2007). The district for Site B received many honors as well, including the
18
SchoolSearch Bright A+ Award of Excellence and being named to Newsweek Magazine’s
“America’s Best High Schools” list (Site B website, 2007).
The district was well financed, with salaries and expenditures reflecting that. Teacher
salaries averaged $79,975, which was almost $20,000 more than the state average.
Administrators’ salaries averaged $138,784 which was nearly $36,000 above the state average.
The superintendent earned an annual salary of $176,914, which was in line with superintendents
of surrounding districts. An annual operating expenditure of $15,753 per student was almost
$6,000 above the state average, with $8,864 of that spent on instruction (Interactive Illinois
Report Card, 2007).
Community B has a commuter rail station located in the downtown area, and there is
public bus transportation. The community was located between two major airports, and was also
very close to one major state highway.
Demographically, the 20,742 person suburban community in which Site B existed was
normal in only a couple of ways. Both the gender breakdown and the average resident age of
37.3 years were very close to state and national averages. In most measurements, the community
in which Site B existed found itself far from national averages. The research community was
considered a fairly densely populated suburban area with a population density of 2,364.54
individuals per square mile, approximately 10 times that of the state average, and 30 times the
national average (ePodunk, 2007).
The community was considered stable and upper-middle class, according to most
measurements. The average 2.89 member family had lived in the community for 9 years. Of
these families, 79.2% resided in single-family owner-occupied dwellings built mostly in the mid
1970’s. These homes had a median value of $258,000, a value far above that of the state average

19
of $127,800, or the national average of $111,800. The total absence of mobile homes provided
additional insight into the nature of the community. Median household income in the research
community was $88,832. This was almost twice the state average of $46,590, and more than
twice the national average of $41,994. Minority incomes were consistently below those of the
White community members, yet far above state and national averages. This could be attributed to
an above average cost of living. The research community’s above average income figures could
be directly tied to the above average educational attainment among community members. Of the
research community residents, 32.6% had earned a bachelor’s degree, approximately twice state
and national averages. Masters, professional, or doctorate degrees were obtained by 23.6% of
residents. This was far above the state and national averages of 9.5% and 8.9% respectively
(City-Data.com website, 2007).
A racial statistical breakdown indicated that the research community was predominantly
composed of White residents. They composed 92.2% of the community members, compared to
state and national averages in the mid 70% range. The most common minority group in the
research community was Asian. Asian residents made up 4.6% of the community, which was
approximately 30 % higher than state and national averages. Other than this exception, the
minority component of the research community was far below state and national averages for all
reporting groups. Hispanic residents composed 2.7% of the population. Black residents
composed 1.0% of the population. Both of these figures were far below state and national
averages in the 12-15% range (ePodunk, 2007).
There were numerous early learning centers located in the research community.
Depending on the location of the home, children were sent to one of five public elementary
schools. Parents could also choose to send their child or children to one of the three private
20
schools located in the research community. There was one middle school and one high school
found in the research community. Twenty-four colleges or universities were located within thirty
miles of the research community (ePodunk, 2007).
The community serviced a wide variety of cultures, and religion, yet it still held on to its
historical value and reached out to its residents. Two major cultural centers held historical value
to the community. One was the dwelling of a library and the other was a museum for Victorian
homes. They both offered multi-disciplinary programs in their facilities. The research
community had worshipping facilities representing 14 different religious denominations in 23
locations (ePodunk, 2007).
Numerous recreational activities were another feature of the research community. There
were 18 parks that encompassed approximately 320 acres of land. There were 10 baseball
diamonds, 13 soccer fields, 2 football fields and 15 playgrounds spread throughout the
community. For the athletes in the research community there were 2 golf courses, 7 tennis courts,
5 volleyball courts, 4 basketball courts and 6 ice skating rinks. If relaxation was desired, there
were 5 fishing holes, 2 pools, and 7 biking trails surrounded by numerous picnic areas. The local
park district provided many activities for a fee (ePodunk, 2007).
With regards to commerce, the research community had 7 banks in 12 locations. These
banks include nationally known institutions as well as local entities. The community was also
bustling with restaurants, stores, and entertainment. Most of the town’s businesses were along
one main street in the research community. It was a historical street with neatly manicured
gardens and New England-type shops. The main street area included 13 restaurants, as well as an
abundance of apparel, jewelry, and specialty shops. There was also one small movie theater on
this strip.

21
Community C
According to the 2000 U.S. Census, Community C contained Sites C and D. Community
C covers 50 square miles and includes all or part of 12 communities and served approximately
61,000 residents. Although there were twelve towns located within the district, one town
accounted for the majority of the student population. This community was located 40 miles from
a major metropolitan Midwestern city and 10 miles from major body of fresh water. There was
ample public transportation that existed throughout the community including commuter rail
system, bus system, and a taxi service. Community C is 5 miles from a regional charter airport
and 30 miles from an international airport. It was also located 10 miles within a major
international port and a major interstate highway system ran directly through Community C in
2007. District C reaped economic benefits from the large tax base generated from the major
outlet mall and amusement park located within the community.
According to the 2000 Census Data, Community C had a total population of 28,834
citizens covering 13.4 square miles. The population of the county was increasing at an estimated
rate of 6.3% from 2000 to 2003 according to the Census Bureau statistics. The demographic
make up of this community included 48.5% male and 51.5% female, the median age is 25-44
which accounts for 37.2% of the total population. The ethnic composition of the community
follows: 82.1% White, 5.1% Black, 0.2% American Indian and Alaska native, 8.3%
Asian/Pacific Islander, 6.0% Hispanic, 2.2% Multi-racial/ethnic, and 2.2% other.
Community C was located in the third wealthiest county in the United States in 2000.
According to the 2000 Census, the community’s median house value was $199,000 and median
rent was $806. The community was also fairly educated as 94.1% were a high school graduate or
higher and 47.8% had a Bachelor’s degree or higher. The median household income was $75,742
22
in 2000 with most citizens holding professional middle class occupations. The number of citizens
in the labor force (16 years and over) included 75.4% of this specific population. The most
common occupations for males were in management as farm managers (9%), sales
representatives, services, wholesale and manufacturing (7%), top executives (5%), Other sales
and related workers including supervisors (5%), computer specialists (5%), engineers (5%), and
other production occupations including supervisors (4%). The most common occupations for
females were secretaries and administrative assistants (6%), business operations specialists (5%),
teachers (5%), other management occupations except farmers and farm managers (5%),
information and record clerks except customer service representatives (5%), registered nurses
(5%), and other office and administrative support workers including supervisors (5%).
District C was located within Community C and encompassed both Sites C and D.
District C was a very large high school district that had a total enrollment of over 4,200 students.
The schools in this district were comprised of 1,122 9th grade students, 1,068 10th grade students,
966 11th grade students, and 1,075 12th grade students. This district was ethnically made up of
63.5% White, 14.5% Hispanic, 10.7% Asian/Pacific Islander, 9.65% Black, 1.1% Multi-
Racial/Ethnic, and .6% Native American. The school district had a low income rate of 11.2%, a
limited English proficient rate of 3.4%, and a chronic truancy rate of 12.1%. The mobility rate
for school district C was 4.6% and the average attendance rate was 91.8%. The graduation rate
for school district C was 96.4%.
School District C has undergone a tremendous growth spurt over the last 15 years. For
example, the student population in 1990 was 1,413 students; in 2000, the student population was
2,874; and the current student population is 4,200. This tremendous growth of over 200% lead to
23
a number of fiscal problems as budgeting in anticipation of an ever expanding student population
became quite complex and an operational deficit of over $6 million occurred.
School District C recently attempted to pass a referendum that would provide funds for
building upgrades and expansion of programs. The referendum was voted down which
consequently required a number of cut backs in the school system budget. The teachers and the
union approved their new contract which was active through 2011.
National Context of the Problem
The concept of intrinsic motivation has been a hot topic since the late 1960s. The
psychological and educational communities have been divided for a number of years on whether
or not students self-motivate or if there are external factors that elicit a response that we would
call learning. The psychological community largely relies upon the self-determination theory, or
SDT, pioneered by Edward Deci and Richard M. Ryan. This theory applies to more than
educational development, but the core of the argument directly applies to our research. SDT
states that “humans are active organisms with innate tendencies toward psychological growth
and development, who strive to master ongoing challenges and to integrate their experiences into
a coherent sense of self.” (Deci 2004, p.246). Upon further reading however, it becomes quite
clear that SDT is not completely natural and requires active encouragement from the
environment, i.e. extrinsic motivation. The educational community, however, views motivation
in an entirely different light.
In large part, the educational community feels that extrinsic and intrinsic motivation are
so closely tied and interwoven to the point that all motivation is essentially intrinsic motivation
with extrinsic stimulators. Educational psychology and educators feel this way because the
bottom line on whether or a student is motivated to learn is still the student’s decision. In
24
Harper’s article “Making Good Choices,” Kohn and Ormrod, leading supporters from the
educational community, argue for a combination of early programming which instills a need and
desire to achieve the goal-setting theory, which calls for clearly defined goals and benchmarks,
and the unconscious motivation theory using Maslow as its foundation, which essentially states
that learning is the brain’s reaction to a lack of knowledge.
As a whole, the educational and psychological communities both agree that motivation,
whether intrinsic or extrinsic, is one of the most important topics currently being discussed and
researched. The results are clear regardless of the approach: proper motivation leads to direct
behavior towards particular goals, increases effort and energy, increases initiation of, and
persistence in activities, enhances cognitive processing, and leads to improved performance.
There have been copious amounts of research conducted to study the effects of intrinsic
motivation on student achievement. After analyzing the research pertaining to intrinsic
motivation, it seemed as though intrinsic versus extrinsic motivational techniques benefited
students of all grade levels, ethnic groups, and content areas. More specifically, students
performed tasks worse if they are expecting a reward than compared to those students who
expected nothing in return (Harper, 2007). As Gottfried demonstrated in the Journal of
Educational Psychology, a positive correlation exists between intrinsic motivation and
achievement (Gottfried, 1985).
The educational arena also has proven that beneficial strategies for increasing
achievement using intrinsic motivation included “involving students in the learning process,
responding positively and praising students, promoting mastery learning, providing stimulating
challenges, and evaluating the task rather than the student” (Dev, 1997).

25
Teacher Researcher Reflections
Teacher Researcher A
The topic that I was most interested in and decided to do my action research project on is
student motivation. I, along with my other group members, have noticed a pattern of student
behavior that leads us to believe that there are many students who are not intrinsically motivated.
Our students are always interested in what they are going to get out of an activity and will only
put an honest effort into it if there is something in it for them. It worries me that my students are
motivated by rewards or how they can get out of completing one thing if they complete another,
which seems to lead to them doing only the bare minimum to get by. It is important for us as
teachers to help our students learn to be intrinsically motivated. Our topic of research, improving
student achievement through intrinsic motivation, fits into all of our classrooms. I feel that my
students will be best served if I can find strategies to shift the source of their motivation from
extrinsic rewards to intrinsic satisfaction.
While I have a clear vision of the problem that I want to change, I am still a little hazy
about how I am going to create this change. I understand the action research process as a whole,
but I am not very clear about some of the specifics of collecting our data and how we will create
and implement our strategies. I do suppose that as we research and get further along in the
process that these things will become much clearer for me. One of my professional goals is to be
a reflective teacher. By doing this research project I will be reflecting on many aspects of my
classroom. Doing all of this reflecting and research will also help me work towards one of my
other professional goals, which is to properly motivate my students. Working in a group on this
research project will help bring in different perspectives. When I get stuck or confused about one
area I will be able to reach out to my group members for help. I will also benefit from hearing

26
about their experiences in their classrooms. Another major benefit of working with a group of
people on a research project is that you have the support of your peers. We will all hopefully
succeed together and feel accomplished as teachers and as researchers. When we are finished
with our interventions we hope to see a change in our students and their source of motivation. I
will be able to tell if our research has paid off by observing the attitudes of my students. It is my
hope that they will no longer want to know how to barely get by. I will be able to tell if they truly
care about what they are doing by the change in the quality of their work. This will help set up
my students to achieve not only in my class, but in life.
Teacher Researcher B
This research is being done with the hope of increasing student achievement at the
secondary level using intrinsic motivation. My students live in a community where high
standards and expectations abound. The problem, however, is that this is also a very affluent
community, and through learned behavior, students want to reap the benefits of their efforts for
the extrinsic rewards they will receive rather than the intrinsic satisfaction they will gain.
On any given day my students will ask, “What’s in it for me?” They want to know what I
am going to give them in order for them to achieve. I see this in a wide variety of aspects. For
instance, at the beginning of the year I asked my students to bring in Kleenex for the classroom.
They wanted to know if there would be extra credit attached. I told them no, and out of my 135
students, only 3 brought in a box. I have students who will not do any of the regularly assigned
homework, yet they become indignant if I don’t offer extra credit. We have a First Class program
at our school designed to build student character. During First Class discussions, students will
only answer questions and participate if given candy. Many times their responses are not even on
target, yet just by raising their hands, they are given a treat. When I ask students to read or I
27
point out specifics from a lesson, they frequently ask “Is this going to be on the test?” They also
respond with, “If not, I’m not going to study it or bother with it.” The state has implemented the
mandated PLAN test each year for sophomore students. Because they view this as something
that doesn’t count, they don’t try and couldn’t care less. Overall, if the reward is lacking or does
not meet their standards, this directly impacts their motivation and achievement.
I believe it’s very important for teachers to help students be intrinsically motivated. This
is an issue that can be dealt with across the board, in all classrooms. A lack of intrinsic
motivation is something that will impact our kids not only in the classroom, but out as well. It
will help set a pattern of poor behaviors and expectations for all they do. Changing our students’
mode of motivation will hopefully facilitate new patterns and expectations.
Our group plans to use a variety of researching methods, from student and teacher
surveys and teacher observations, to student work samples and grade reports. Though we have a
variety of demographics, I am excited to see the commonalities I believe will emerge during the
research and implementation of strategies for this issue. It will only reinforce what we have all
been noticing in our classrooms. At this point I still have questions about what strategies we will
implement in the classroom in order to increase intrinsic motivation, but I am confident that after
research is conducted, we will find several that will be feasible and effective.
My ultimate goal is to help my students become better, more independent thinkers who
will strive to achieve for what they are learning, not for what they are receiving.
Teacher Researcher C
Our teacher researcher group has decided to focus on ways to improve student
achievement in the secondary school setting using intrinsic motivation. Throughout our
preliminary research, it has been found that this topic of intrinsic motivation is a necessity of
28
which to improve upon in all of the four content areas of focus. The relevance of this research
topic for Site C is as a result of the past three years, a consistent drop of student motivation to do
well on homework and tests has been plainly visible, which is translating negatively in their
grades. I know this is not just a regional issue as research has also been conducted worldwide to
assess and fix the problem. It is also hypothesized that after research is conducted, my students’
grades will improve, their participation will increase, their critical thinking skills will unfold, and
their test scores (both content area and standardized) will change greatly. As a result of the action
research project, I hope to have increased faith in educational research and to have actually
benefited from realistic classroom tested strategies. There are multiple ways in which we will
measure the results of the action research process. Some of the methods to gauge success will
include surveys before and after the action research process is completed, a spreadsheet
comparing grades or points in multiple areas such as homework, assessments, class participation,
and critical thinking.
Teacher Researcher D
Over the last few years, I have come to realize that student motivation has become a true
problem. In this unfortunate era of high stakes, objective, standardized testing, it becomes
increasingly difficult to “convince” or “persuade” students to work if they have even the slightest
perception that it does not “count towards their grade.” Assignments or activities that we as
teachers consider informal assessment are viewed by our students as a waste of their incredibly
valuable time. That scenario is the basis for our group’s research. In the name of action research,
we seek to improve student achievement by using intrinsic motivation. We, as a group, feel that
with a better understanding of what motivates our students, we will be able to develop more
content rich, critical thinking oriented lessons, because students will be much more willing to
29
participate. Developing and using more effective and challenging lessons will, in turn, increase
student achievement because we are accessing higher order thinking. The question then becomes,
what actually motivates our students? After a number of discussions within our group, we
generated a list of what we felt motivates our students ranging from extra credit to receiving
money from parents in exchange for good grades. I personally feel that student motivation,
though it is obviously unique to each individual student, is largely based on the importance they
place on the subject they are studying. If the teacher does not take the time to show relevance,
importance, and the value of their subject, they might as well be teaching a dead language.
Seeing the daunting task ahead of completing our action research project, I am left with
one question. When developing our questionnaires, surveys, and interview questions, how
specific should our questions be? Is this a situation where “less is more?” In any case, I view this
upcoming project as an excellent way to develop an incredibly in-depth and detailed study of
intrinsic motivation that encompasses a wide variety of students all across the socio-economic
and demographic scale. The true benefit of a collaborative project such as this is that because we
all teach at different schools, and in different districts and towns, we can make this study
objective and non-biased, which ensures accurate results. I feel that this research project will be
an overwhelming success and will aid in our development as novice researchers and lifelong
learners because of the relevance and necessity of this study. After the completion of our
research and the implementation of our changes, we hope to see a marked response of an
increase of achievement within a matter of a few short weeks. Developing more effective
motivational strategies that translate to an undeniable increase in achievement will enhance the
validity of our study and attest to our ability as true researchers.
30
CHAPTER 2 PROBLEM DOCUMENTATION
Problem Evidence
Through preliminary observation, the teacher researchers at the four sites involved in this
study observed specific behaviors, which led the group to identify intrinsic motivation as a
problem for their students. This lack of intrinsic motivation was seen as impacting the 8th grade
through 12th grade students in physical education, English, history, and geography and was
believed to detract from student achievement. This conclusion was drawn by observing the
following behavior: incomplete homework, truancy, poor effort for school related
assignments/activities, lethargic attitudes, acting out or disrespectful conduct to teacher or peers
in class, sleeping, poor self-confidence, student boredom, poor semester grades and/or test scores
and homework grades, and student desire to complete the bare minimum required.
The purpose of our research was to increase our secondary students’ intrinsic motivation
for school activities by increasing student autonomy, goal setting, and student reinforcement.
The changes that resulted from the strategies we chose were documented using the following
tools: Student Motivation Strategy, observation checklist, goal sheet, and Grade Record
Analysis.
Student Motivation Survey
The purpose of the pre-intervention Student Motivation Survey (see Appendix A) was to
gather baseline data to support our belief that there was a problem of low intrinsic motivation for
school activities among our secondary students. The post-intervention Student Motivation
Survey (see Appendix A) was distributed at the end of the process to see how the students say
their motivation changed over time. Questions in the survey were focused on three categories “I
try harder...” which analyzed the conditions under which a student applies extra effort in school,
31
“I try in school…” analyzed why students try in general in school, and “My top reasons for not
trying…”, which analyzed what made a student put forth minimal effort in school. The pre-
survey was administered on Week 3 of the study to establish a baseline to measure
improvements in our students’ motivation. Our students were given 10 minutes to individually
reflect and answer the survey questions. The same survey was repeated during Week 10 to assess
the change in students’ intrinsic motivation. The results of the pre-intervention Student
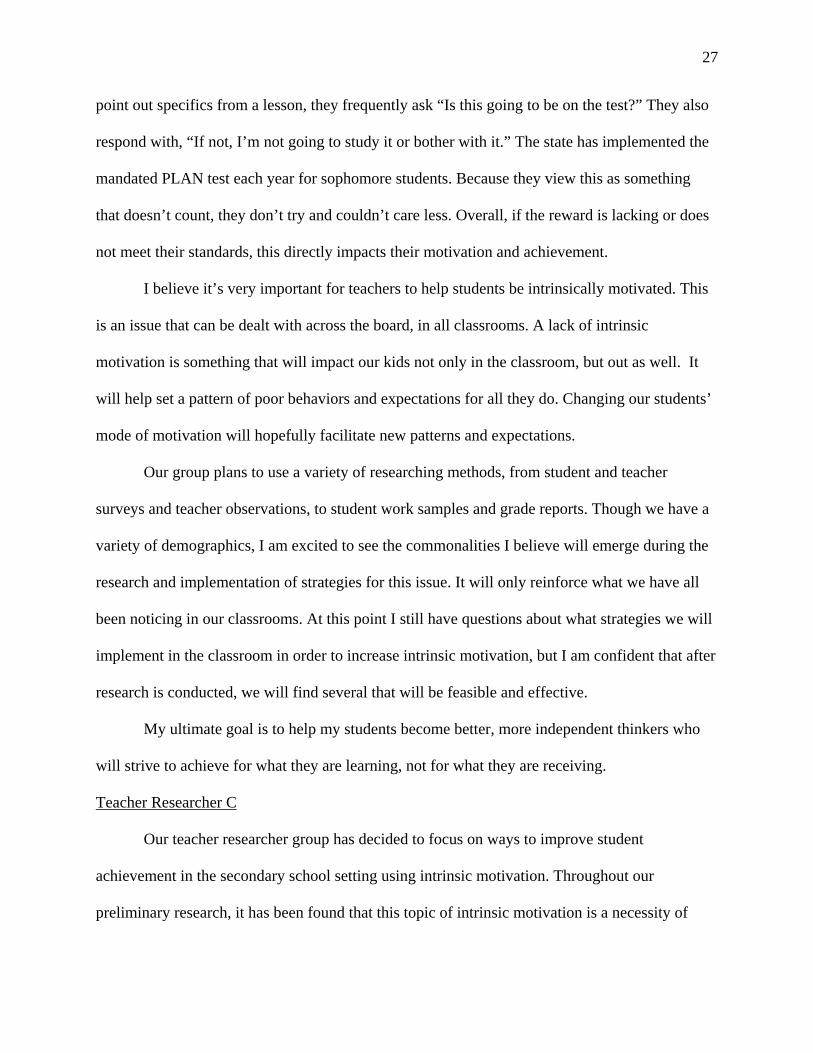
Motivation Survey are illustrated in Figures 1, 2, and 3.
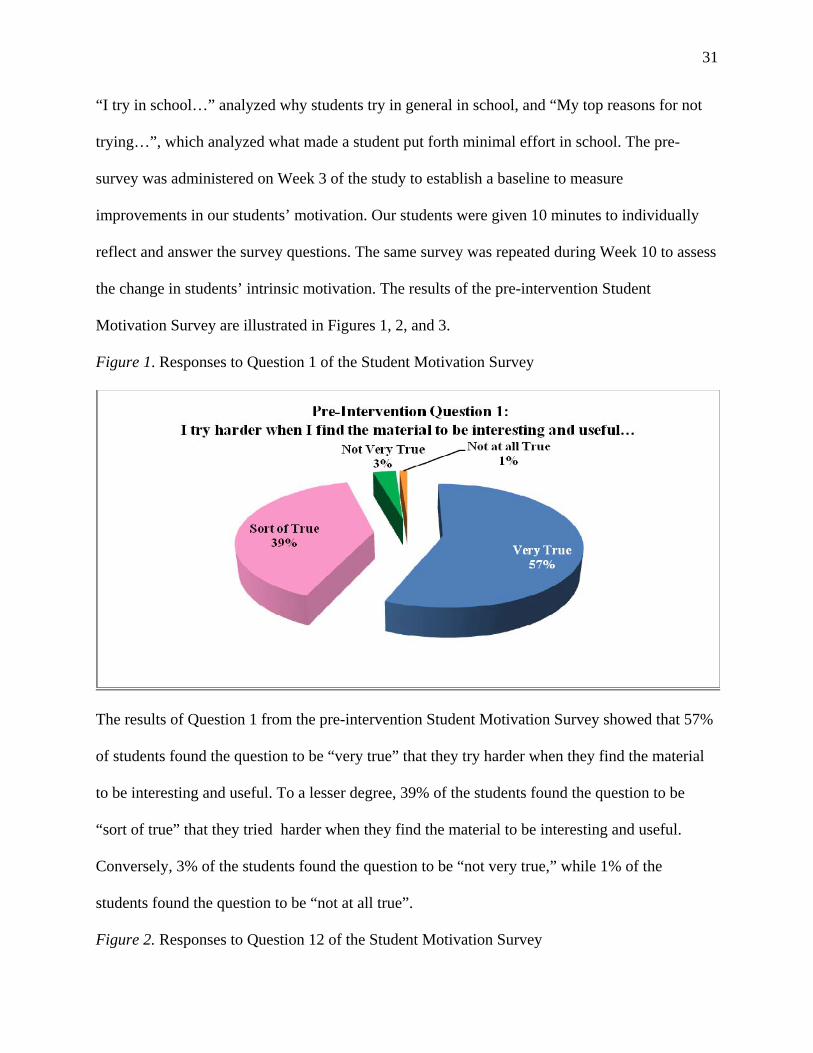
Figure 1. Responses to Question 1 of the Student Motivation Survey
The results of Question 1 from the pre-intervention Student Motivation Survey showed that 57%
of students found the question to be “very true” that they try harder when they find the material
to be interesting and useful. To a lesser degree, 39% of the students found the question to be
“sort of true” that they tried harder when they find the material to be interesting and useful.
Conversely, 3% of the students found the question to be “not very true,” while 1% of the
students found the question to be “not at all true”.
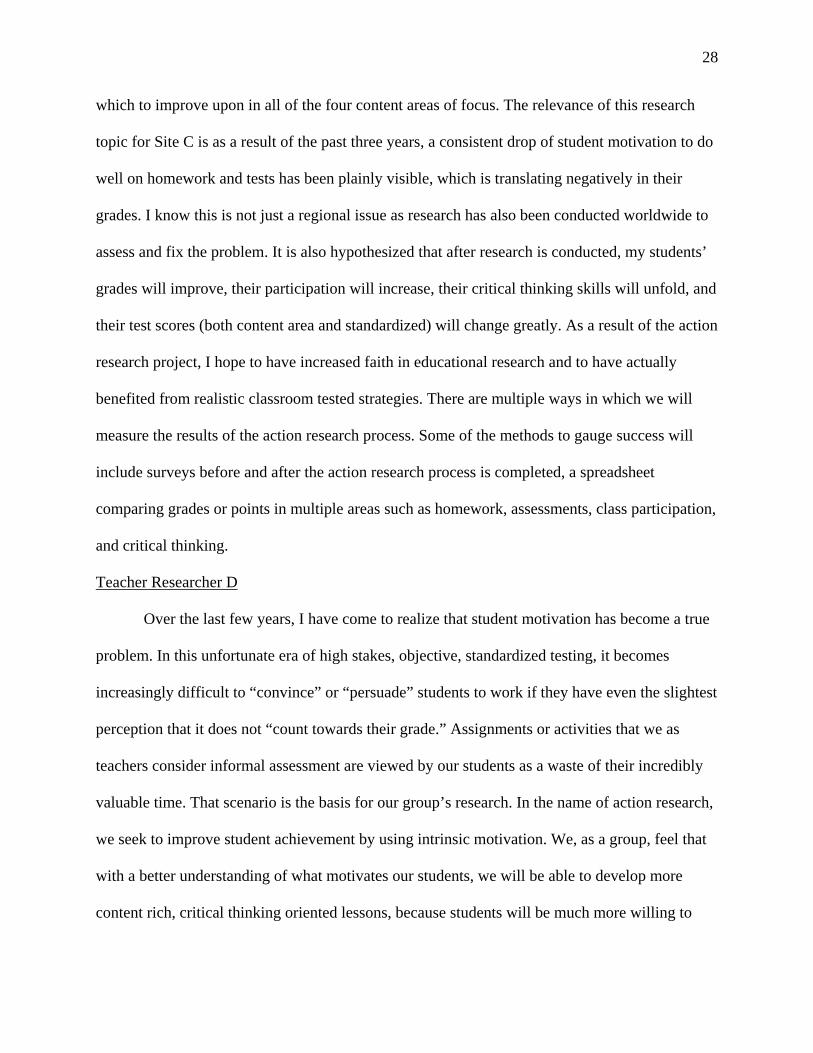
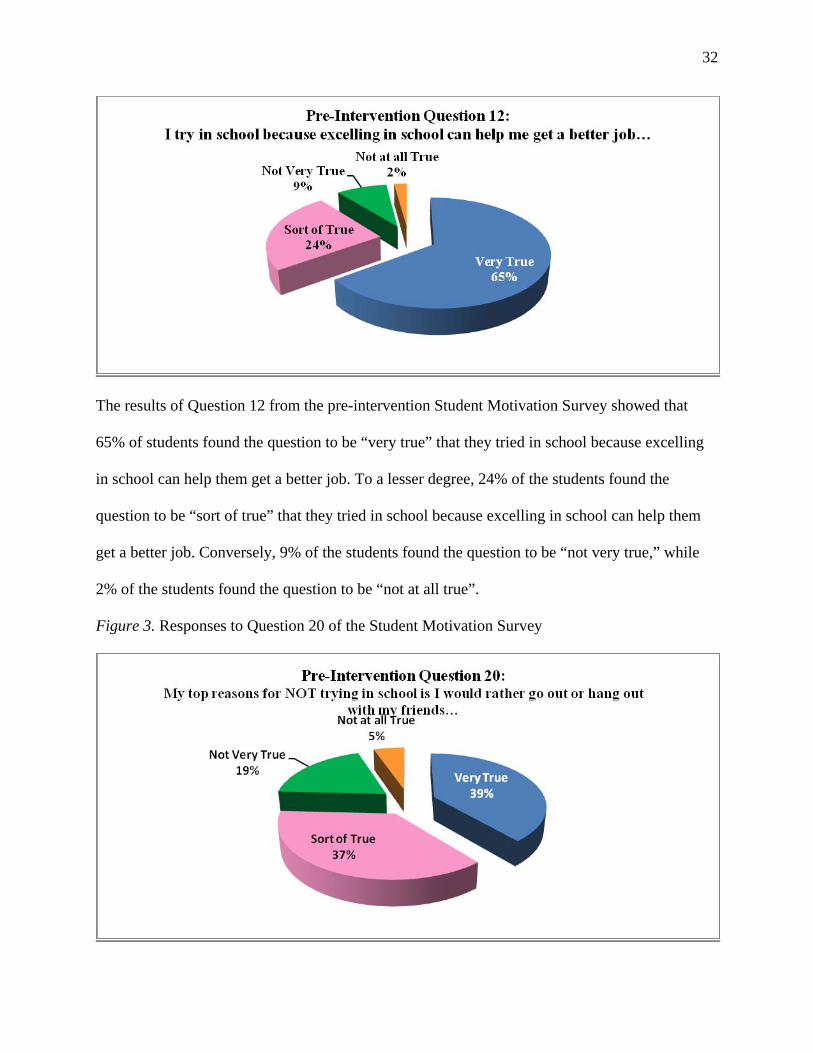
Figure 2. Responses to Question 12 of the Student Motivation Survey
32
The results of Question 12 from the pre-intervention Student Motivation Survey showed that
65% of students found the question to be “very true” that they tried in school because excelling
in school can help them get a better job. To a lesser degree, 24% of the students found the
question to be “sort of true” that they tried in school because excelling in school can help them
get a better job. Conversely, 9% of the students found the question to be “not very true,” while
2% of the students found the question to be “not at all true”.
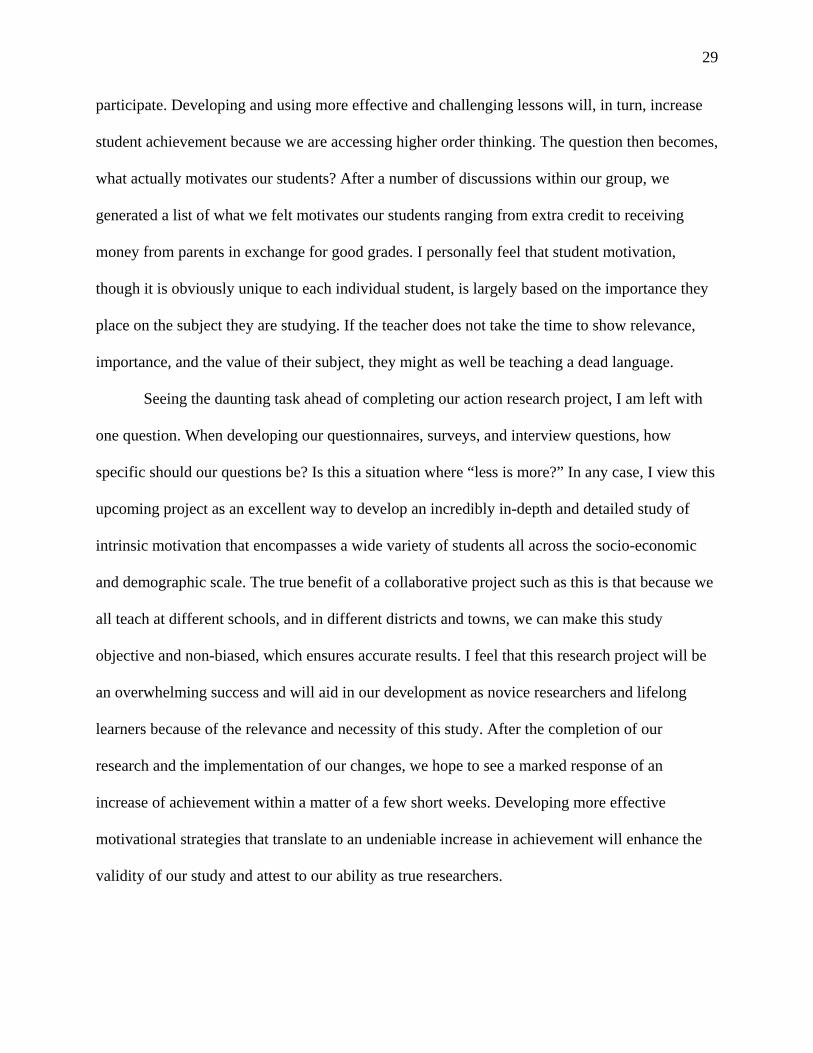
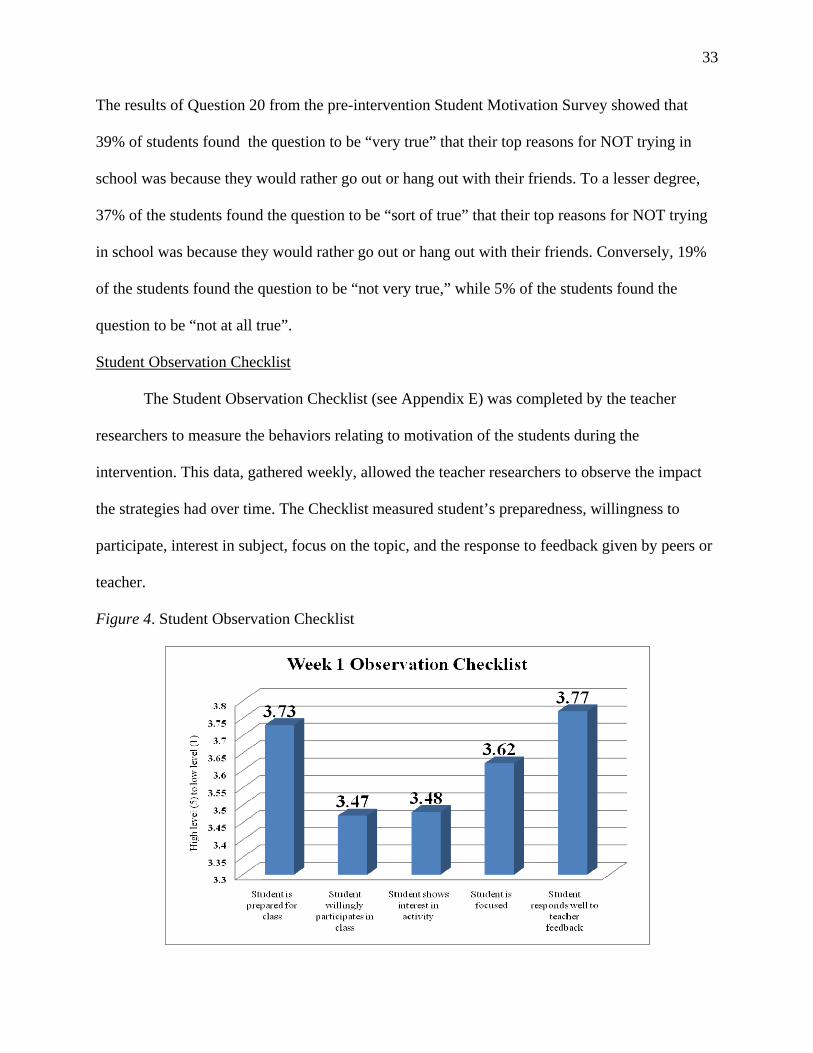
Figure 3. Responses to Question 20 of the Student Motivation Survey
33
The results of Question 20 from the pre-intervention Student Motivation Survey showed that
39% of students found the question to be “very true” that their top reasons for NOT trying in
school was because they would rather go out or hang out with their friends. To a lesser degree,
37% of the students found the question to be “sort of true” that their top reasons for NOT trying
in school was because they would rather go out or hang out with their friends. Conversely, 19%
of the students found the question to be “not very true,” while 5% of the students found the
question to be “not at all true”.
Student Observation Checklist
The Student Observation Checklist (see Appendix E) was completed by the teacher
researchers to measure the behaviors relating to motivation of the students during the
intervention. This data, gathered weekly, allowed the teacher researchers to observe the impact
the strategies had over time. The Checklist measured student’s preparedness, willingness to
participate, interest in subject, focus on the topic, and the response to feedback given by peers or
teacher.
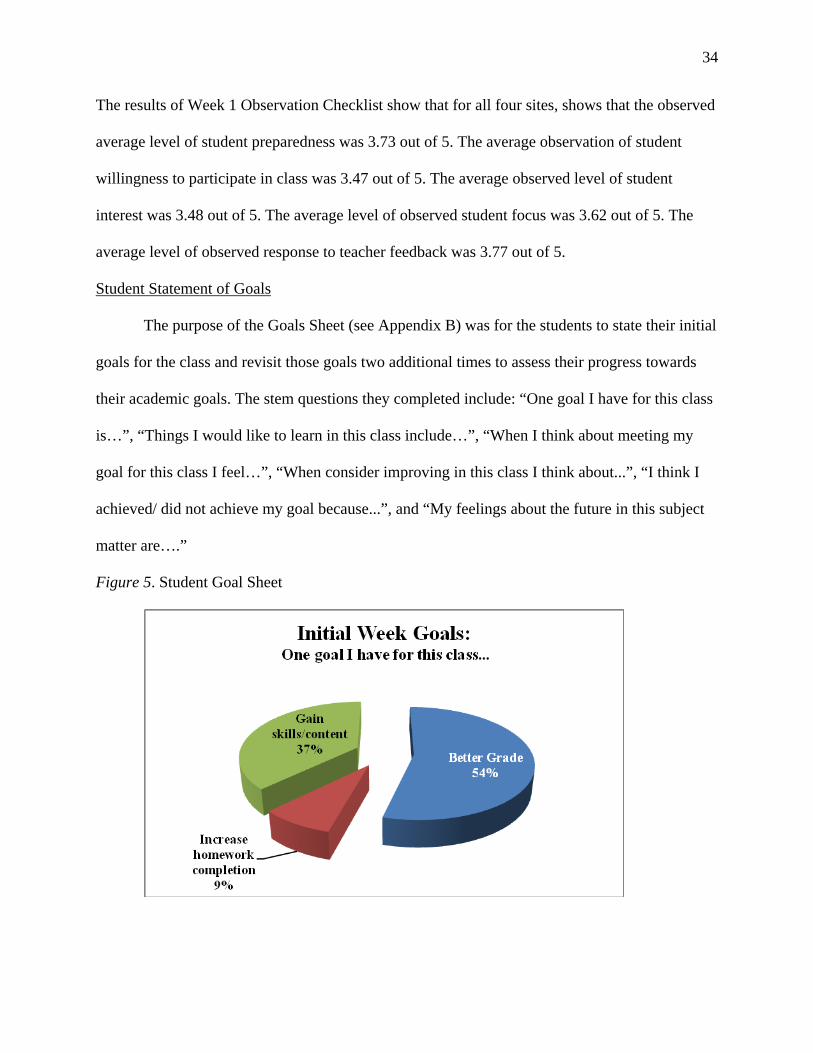
Figure 4. Student Observation Checklist
34
The results of Week 1 Observation Checklist show that for all four sites, shows that the observed
average level of student preparedness was 3.73 out of 5. The average observation of student
willingness to participate in class was 3.47 out of 5. The average observed level of student
interest was 3.48 out of 5. The average level of observed student focus was 3.62 out of 5. The
average level of observed response to teacher feedback was 3.77 out of 5.
Student Statement of Goals
The purpose of the Goals Sheet (see Appendix B) was for the students to state their initial
goals for the class and revisit those goals two additional times to assess their progress towards
their academic goals. The stem questions they completed include: “One goal I have for this class
is…”, “Things I would like to learn in this class include…”, “When I think about meeting my
goal for this class I feel…”, “When consider improving in this class I think about...”, “I think I
achieved/ did not achieve my goal because...”, and “My feelings about the future in this subject
matter are….”
Figure 5. Student Goal Sheet
35
As a result of the responses from the Student Goal Sheet, 54% of students stated that their intial
week goal for the class was to “get a better grade”. To a lesser degree, 37% of the students
responded that they would like to “gain skills or content” from the class. Lastly, 9% of the
students responded that they would like to “increase their homework completion.”
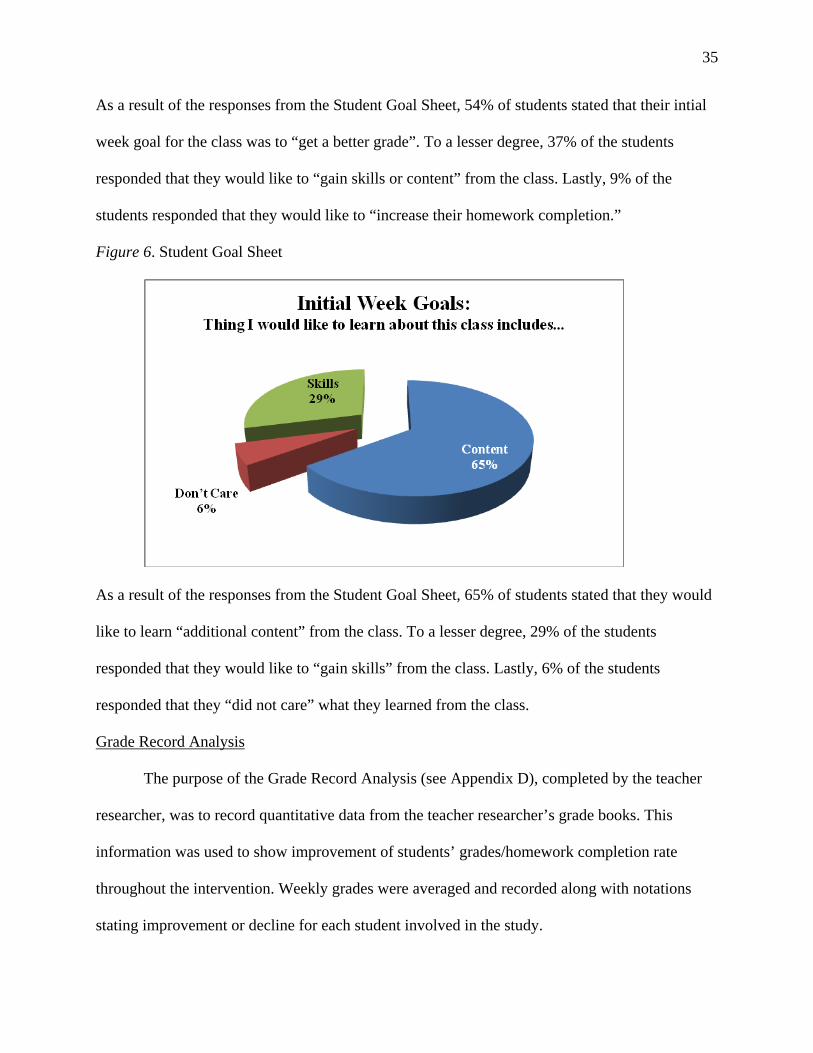
Figure 6. Student Goal Sheet
As a result of the responses from the Student Goal Sheet, 65% of students stated that they would
like to learn “additional content” from the class. To a lesser degree, 29% of the students
responded that they would like to “gain skills” from the class. Lastly, 6% of the students
responded that they “did not care” what they learned from the class.
Grade Record Analysis
The purpose of the Grade Record Analysis (see Appendix D), completed by the teacher
researcher, was to record quantitative data from the teacher researcher’s grade books. This
information was used to show improvement of students’ grades/homework completion rate
throughout the intervention. Weekly grades were averaged and recorded along with notations
stating improvement or decline for each student involved in the study.
36
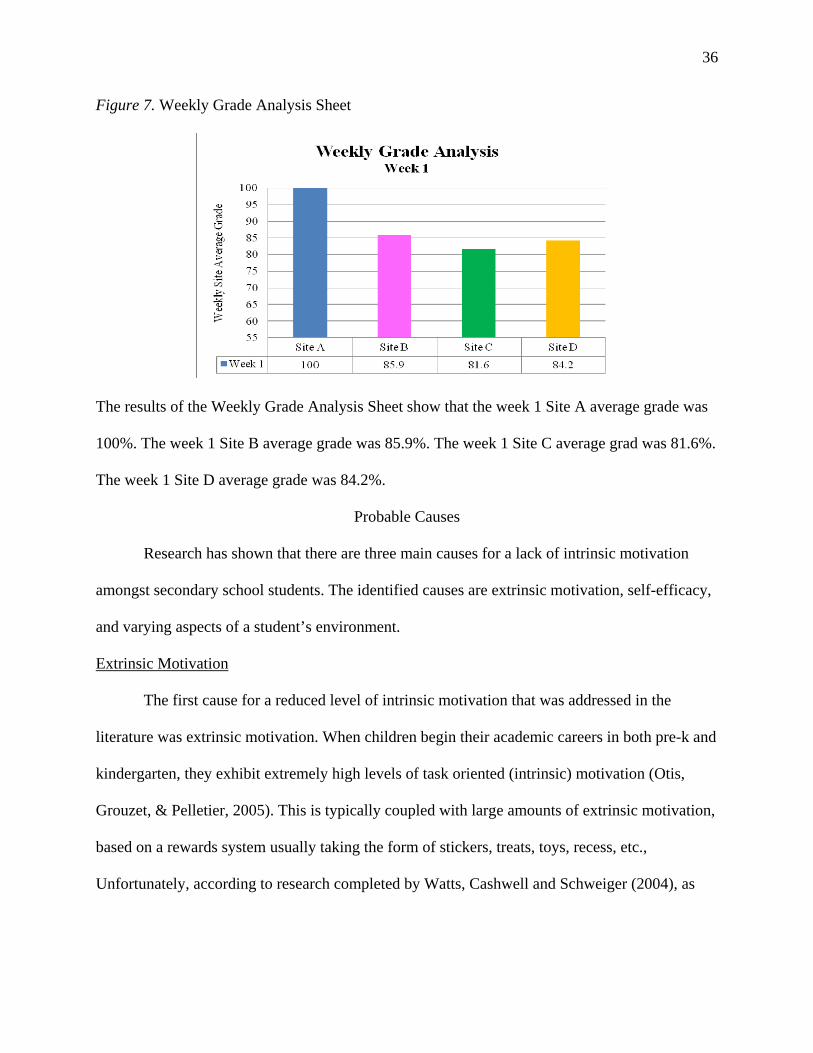
Figure 7. Weekly Grade Analysis Sheet
The results of the Weekly Grade Analysis Sheet show that the week 1 Site A average grade was
100%. The week 1 Site B average grade was 85.9%. The week 1 Site C average grad was 81.6%.
The week 1 Site D average grade was 84.2%.
Probable Causes
Research has shown that there are three main causes for a lack of intrinsic motivation
amongst secondary school students. The identified causes are extrinsic motivation, self-efficacy,
and varying aspects of a student’s environment.
Extrinsic Motivation
The first cause for a reduced level of intrinsic motivation that was addressed in the
literature was extrinsic motivation. When children begin their academic careers in both pre-k and
kindergarten, they exhibit extremely high levels of task oriented (intrinsic) motivation (Otis,
Grouzet, & Pelletier, 2005). This is typically coupled with large amounts of extrinsic motivation,
based on a rewards system usually taking the form of stickers, treats, toys, recess, etc.,
Unfortunately, according to research completed by Watts, Cashwell and Schweiger (2004), as
37
students are promoted through the grades levels, their level of intrinsic motivation gradually
decreases and this fact is easily observed once students reach secondary school.
Throughout the educational world, far more emphasis is placed on extrinsic rewards as
opposed to developing intrinsic motivation. From some teachers, extrinsic motivation can take
the form of “When teachers, parents, and students perceive daily class work as source of points,
grades, and treats, as opposed to a source of learning and deep fulfillment, they are blinded to the
other reasons students may want to excel including an internal desire to create meaning
significance” (Bowman, 2007, p.82). This emphasis on extrinsic rewards comes from the self-
concern of some teachers who are so pressed for time they would prefer to externally motivate
their students rather than integrate lessons that help to develop intrinsic motivation. The short-
sightedness of extrinsic motivation in education is that the only people who benefit are the
teachers and parents, and for that reason, it would be very difficult to make any significant
changes to education as a whole. The question that we must then focus on is not how to motivate
students but rather, how can teachers and parents be prevented from diminishing or possibly
destroying student motivation through the over-justification of external rewards and minimizing
the true meaning of education (Bowman, 2007)?
The Over-Justification Theory states that over justification, or placing great emphasis on
external rewards or verbal praise for desired behaviors leads to a decrease in intrinsic
motivation because education for the student becomes a series of tasks to be completed in
the quickest, most efficient, and least time consuming manner, to get the reward (i.e.
grades, extra credit, or money), which, as a result, leaves no desire for creativity,
excellence, and perseverance in challenging tasks. (Watts, Cashwell, & Schweiger, 2004,
p. 17)
38
The loss of personal autonomy has also been attributed to extrinsic rewards because it
lowers the sense of control (Martens, Gulikers, & Bastiaens, 2004). This valuable and, more
importantly, necessary sense of control over one’s academic career and future, is the key
building block for a student’s intrinsic motivation and their desire to learn for the sake of
learning.
One final aspect of the importance of a shift from intrinsic value to extrinsic value is the
physical and emotional transition from middle school to high school. According to research, high
school students become more focused on extracurricular activities and social involvement and
become less interested in academic pursuits (Otis, Grouzet, & Pelletier, 2005). For a young,
elementary school student, there are very few opportunities to become involved in
extracurricular activities, such as sports and clubs. The same could be said for social involvement
because even though social interaction is important at all ages, it is not valued as a young child in
the same manner in which it is valued by an adolescent in high school. Placing different levels of
importance on social involvement and extracurricular activities yields academically focused and
intrinsically motivated elementary school students and socially focused, extrinsically motivated
secondary school students (Otis, Grouzet, & Pelletier, 2005).
Self-efficacy
The next cause that was addressed for low intrinsic motivation among secondary students
was the self-efficacy of our students, or to be more precise, the lack thereof. The steady decline
of intrinsic motivation through a student’s academic career closely correlates with a decline in
self-efficacy. In secondary schools, students continue the pattern of losing self-efficacy as they
continue to give up on tasks similar to ones previously failed and resist academics because these
students think they lack the ability to succeed. “Students need this self-efficacy or confidence in

39
themselves so that they can achieve their tasks in school” (Strahan, 2008, p. 5). Student
assignments are meant to be challenging, not frustrating. A properly developed assignment
provides challenge and rigor while also showing the student that the task at hand is not
impossible. Challenging assignments will push the student to achieve higher levels of thinking
and make positive connections which will be used at a later date as prior knowledge. However,
“Once a student assesses they cannot achieve academic competence with a task, they
superficially attempt the task, give up quickly, or avoid or resist the task” (Margolis & McCabe,
2006, p. 219).
Presenting material that is too difficult and leads students to experience a large number of
failures over the course of their academic career will cause students to exhibit significantly lower
levels of self-efficacy. By the time they reach secondary school they have very little intrinsic
motivation, which drives them to not attempt, let alone, persevere in challenging tasks. “Students
with consistent low self-efficacy in school tend to develop a self-fulfilling prophesy that they
cannot achieve given tasks and as a result of this belief we see greater frequency of poor grades,
conflict with teachers, lower track placement, special education placement, failure on high-stakes
tests, and retention” (Margolis & McCabe, 2006, p. 219). Once this “self-fulfilling prophesy” has
been set in motion, even the most effective motivational strategies will be marginalized by the
student who is convinced they are incapable of success. The next step is that the educators,
family, and society have lower expectations that only add to the student’s diminished self-
efficacy. There is hope however, research has shown that challenging low self-efficacy is not an
impossible feat, but instead a modifiable, task-specific attitude and viewpoint that comes from
frequent failure. Research supports that “By linking new work to recent successes, the teacher
can show the student that work the student previously failed, can in actuality, be accomplished”
40
(Margolis & McCabe, 2004, p. 241). Stressing and teaching students the reasons for their
successes and failures and showing them how schoolwork can help them achieve personally
important goals will strengthen the self-efficacy of these struggling learners.
Environment: Social
Although external motivators and self-efficacy are significant causes that contribute to a
student’s low intrinsic motivation, the most significant cause that contributes to low intrinsic
motivation is the student’s environment. Environment as a cause for low intrinsic motivation can
be broken into three categories: social environment, home life environment, and educational
environment. The latter is the cause that the teacher researchers had the greatest chance to
change.
A student’s social environment has a significant impact on the strength of their intrinsic
motivation. Two factors contribute to a student’s social environment including match
perspective, and a lack of socialization. Research shows that the concept of match perspective is
a contributing factor to low intrinsic motivation. Specifically, stating students’ acquaintances that
they interact with have a strong impact on the goals that this particular student chooses for
themselves. In other words, if this student has highly motivated friends, chances are, they too
will become highly motivated as well (Vansteenkiste, Soenens, Van den Broeck, Timmermans &
Lens, 2008). Conversely, this idea also leads to social acceptability, which is an extrinsic
motivator. Whereas before, the student typically had similar goals as their accelerated friends,
with the pressures of social acceptability, it can also dampen intrinsic motivation due to the
desire to fit in and be “cool” in the eyes of their peers, and not be “overly intelligent.”
Another contributing factor that causes the social environment to be categorized as a
cause for decreased intrinsic motivation among secondary students is a lack of socialization.
41
Students who choose to focus on their academic tasks tend to have greater intrinsic motivation
than those who choose participating in social activities, and are thus making a conscious
decision. Students have made a choice not to pursue the extrinsic motivator of social acceptance
(Otis, Grouzet, & Pelletier, 2005, p. 179).
Environment: Home Life
In addition to the social environment potentially decreasing a student’s intrinsic
motivation, a student’s home life environment can be another cause. Preliminary observations
have shown the teacher researchers that some students were not getting the necessary support
and encouragement at home that they needed to be intrinsically motivated in school. Research
states that for intrinsic motivation to flourish at home, additional extrinsic rewards such as
recognition, praise, and support from parents or guardians are necessary (Phillips & Lindsay,
2006). It is not only the lack of support for achievement but, as research also shows, there is a
strong correlation between parent involvement and student attributes such as academic
achievement, sense of self, attendance, student motivation, homework preparedness, grades,
increased high school withdrawal (Prescott & Simpson, 2004), and educational aspirations
(DeHass, Willems, & Holbein, 2005). Research has found that it is important to keep in mind
that encouragement from parents can help to mold a child’s interests, but it must be noted that a
fine line exists between being supportive of a child and too controlling over them (Remedios,
Ritchie, and Lieberman, 2005). In today’s society, it is not so much an over supporting role that
is taking place at home, it is more often than not, a lack of support for the student at home. This
lack of parental or guardian interaction snowballs into impacting many additional factors that
lead to a student’s motivation which directly impact these students within their school
environment.
42
Environment: Educational
The final source of environmental disruption to a student’s intrinsic motivation takes
place in the educational arena (Lyke and Young, 2006). There are many reasons why the school
environment is not conducive to encouraging intrinsic motivation, most of which can be
categorized in a student’s academic momentum (Strahan, 2008). Academic momentum is the
strength of students’ engagement in learning (Strahan, 2008). This strength can be determined by
many elements, including a student’s opinion of education, inability to grasp self-regulation, a
lack of performance appropriate goals to achieve, and a lack of basic skills needed to achieve
their goals.
Many contributing factors to a student’s academic motivation can be dictated by a
student’s opinion of education (Kostelecky & Hoskinson, 2005). Direct learning experiences are
important in deciding a student’s opinion of education. These learning experiences could have
been impacted by a student’s perceived control over learning, a lack of teacher-student
interaction (Prescott & Simpson, 2004), prior experiences, interest in the subject matter, opinion
about the subject matter, the efficiency and effectiveness of what is taught, previous judgments
made about the subject matter, values in dealing with the subject matter, and lastly, curiosity
about the subject matter (Boekaerts, 2002).
In addition, another education environmental concern that can lower intrinsic motivation
can be found when instruction is inappropriate for the student’s functioning level, either being
too difficult or oversimplified. When the material is too simplistic, students complain of
boredom due to the monotony of the “average” classroom instruction. To prevent this boredom,
it is crucial to remove the learning strategies that students view as dissatisfying and thus,
triggering a negative perception of education before the student withdraws emotionally or
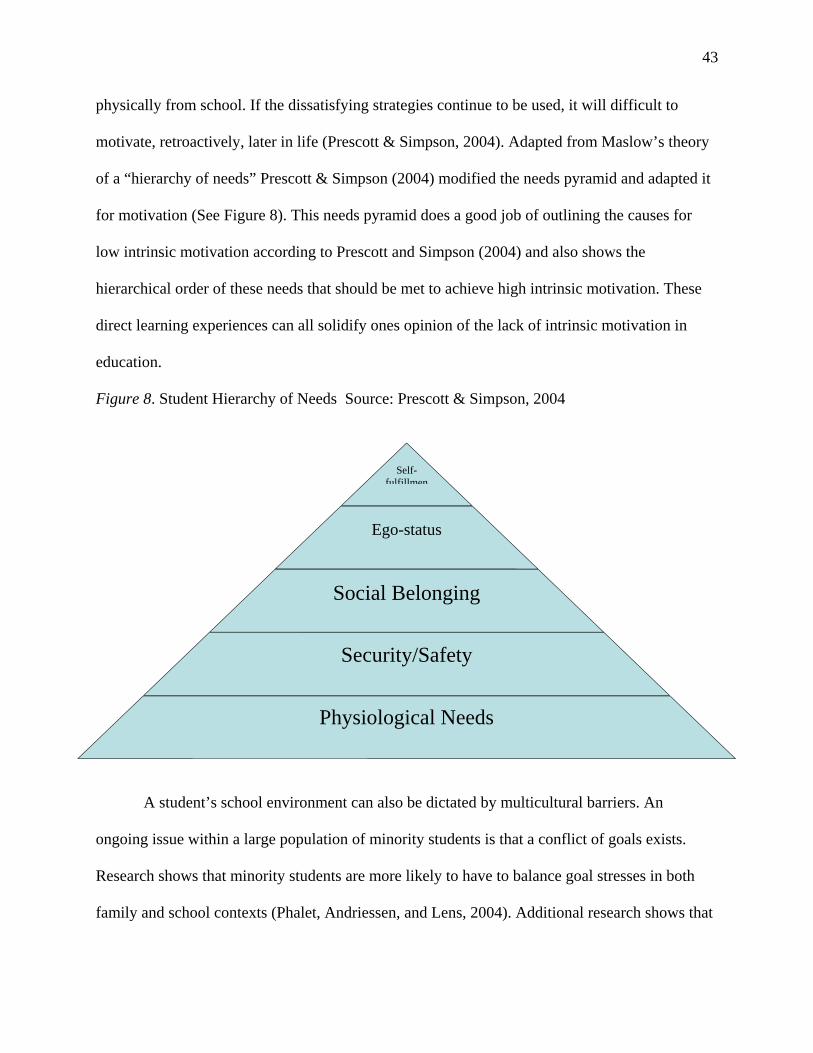
43
Self-fulfillmen
Ego-status
Social Belonging
Security/Safety
Physiological Needs
physically from school. If the dissatisfying strategies continue to be used, it will difficult to
motivate, retroactively, later in life (Prescott & Simpson, 2004). Adapted from Maslow’s theory
of a “hierarchy of needs” Prescott & Simpson (2004) modified the needs pyramid and adapted it
for motivation (See Figure 8). This needs pyramid does a good job of outlining the causes for
low intrinsic motivation according to Prescott and Simpson (2004) and also shows the
hierarchical order of these needs that should be met to achieve high intrinsic motivation. These
direct learning experiences can all solidify ones opinion of the lack of intrinsic motivation in
education.
Figure 8. Student Hierarchy of Needs Source: Prescott & Simpson, 2004
A student’s school environment can also be dictated by multicultural barriers. An
ongoing issue within a large population of minority students is that a conflict of goals exists.
Research shows that minority students are more likely to have to balance goal stresses in both
family and school contexts (Phalet, Andriessen, and Lens, 2004). Additional research shows that
44
although there are differences between all races in how their home life differs from their school
environment, this is most profound in minority students. Researcher Karen Phalet (1995) states,
…minority children may experience more difficulty in engaging with their schoolwork,
when behavioral norms and repertoires in class differ greatly from familiar norms and
practices at home. This is the case when minority cultures are characterized by a
normative emphasis non collectivism or relatedness, in contrast with dominant cultural
values of individualism or separateness in the host culture. (2004, p. 59)
An additional environmental aspect in low intrinsic motivation is a lack academic will
and skills. Stehan (2008) found that those students, who lack the will to grow academically, also
lack the basic skills of how to apply prior knowledge to the learning process (Strahan, 2008). The
following are skills that students must possess to grow academically and skills which will impact
their intrinsic motivation: self-observation, self-evaluation, goal setting, strategic planning, and
strategy implementation/monitoring (Strahan, 2008). Additional basic skills needed for students
to gain intrinsic motivation are self-regulation and a student’s ability to set appropriate goals.
Another cause of a low intrinsic motivation in the educational environment results from a
student’s inability to self-regulate. “Many students do some self-regulated learning, often
without even being aware of it. However, self-regulation is contingent is upon the demands of
the course context. Students must become aware of their own skills, but must also be challenged
to use them” (Lyke & Young, 2006, p. 477). Without a student understanding how to self-
regulate, there is little chance of they will show intrinsic motivation in the classroom.
An educational environment can impact intrinsic motivation when students lack
established performance-appropriate goals. Setting goals is considered a basic skill that many
students lack (Strahan, 2008). As stated previously, stressing and teaching reasons for success

45
and failure and helping students see how their school work can help them achieve “personally
important goals,” teachers can improve students’ self-efficacy (Margolis & McCabe 2004). As a
teacher monitors student’s establishment of goals, it is important to be sure their goals are task
appropriate, possible, and established with the proper motivation. When creating goals, students
choose either task-involved vs. ego-involved (Lyke & Young, 2006, p. 479).
These causes are believed to be the significant contributing factors to a lack of intrinsic
motivation according to the literature. Of the aforementioned causes (extrinsic motivation, self-
efficacy, and varying aspects of a student’s environment), the teacher researchers were able to
address all causes except for the students’ home life. In order to positively impact intrinsic
motivation amongst secondary school students, several strategies were implemented at the four
sites in this project.
46
CHAPTER 3 THE SOLUTION STRATEGY
Literature Review
There is a need for motivational will to do well in school (Linnenbrink, 2002).
“Typically, motivation has been defined as an internal state or condition that activates, guides,
and maintains or directs behavior” (Kostelecky, 2005, p. 438). Many instructors struggle with
motivating their students to learn. Not every student has the same needs, desires, values, wants,
and goals; therefore, not every student will be motivated in the same way. Intrinsically motivated
students are driven by the task itself or accomplishing the task (Fulk, 1994). Others are
motivated extrinsically from their peers or classroom challenges (Kostelecky, 2005). Points,
tokens, parties, or other tangible reinforcers are also employed by parents and teachers as
extrinsic motivators (Cameron, 1996). Fulk (1994), reports research showing students are more
willingly engaged in academic tasks and have an increased effectiveness in their learning when
they are intrinsically motivated.
Instructional Practices
The need for intrinsic motivation stems from the fact that students’ interest and
enjoyment in what they learn is highly correlated to the outcomes of learning (Yair, 2000). Lyke
(2006) also suggests instructors need to develop intrinsic motivation in students so they engage
in their own learning. Because intrinsic motivation results in increased student interest and
positive learning outcomes, educators need to identify the strategies that support an increase in
intrinsic motivation. Guthrie (2006) lists instructional practices that increase motivation as:
supporting student autonomy, providing content goals and using reinforcement to foster positive
student-teacher relationships.

47
Student Autonomy
Autonomy is the state of being independent, free and self-directing (Harper, 2007).
Providing choice helps students make independent and self-directed decisions in their learning.
Students’ intrinsic motivation is highly correlated with the structure of instruction which
suggests that more choices students have, the higher their enjoyment and interest in learning.
(Yair, 2000). “Affording students choices in the classroom is a well-supported motivational
practice” (Guthrie, 2006, p.233). Phillips (2006) contends that children in learning environments
should be afforded the chance to explore areas of their own interest. Fulk (1994) recommends
that instructors allow students to make decisions in issues that are both simple and complex. This
could include choice in classroom activity, time sequence of projects, product output, and even
self-assessment. No matter the task, students enjoy having a choice in the activities and projects
they approach (Bowman 2007). Most people, when given the chance, will make the appropriate
choice and increase their sense of autonomy, which produces greater persistence and effort
(Stellino, 2008). Another avenue for students to gain independence and self-direction in their
learning is through the setting and accomplishments of goals.
The more opportunities students are given to set goals, the better. “Goal orientation is a
particularly important motivation variable because it explains why learners engage in various
learning activities” (Song, 2006, p.446). Goal orientation also has a large impact on student
learning processes and outcomes (Lyke, 2006). Inviting students to set their own goals develops
positive expectations (Bowman, 2007). Setting goals also elicits effort toward learning activities
(Paas 2005). This self-regulatory strategy of setting goals is extremely valuable for increasing
learner independence as well as on-task behavior (Fulk, 1994). Though goals can vary, the main
difference lies in the approach of the goal, whether it is intrinsic or extrinsic. “Intrinsic goals
48
reflect people’s natural growth tendencies and are characterized by an inwardly oriented frame”
(Vansteenkiste, 2008, p.388). Thus, students with intrinsic goals can evaluate their competence
through self-referenced perceptions of growth or improvement (Nelson, 2008). Reflection and
evaluation are an important part of the goal-striving process (Boekarts, 2002). This may be a
difficult process for some learners, so teacher reinforcement and feedback are essential.
Teacher Involvement
Teacher involvement that shows students the teacher understands and cares about their
progress is associated with intrinsic motivation for academic activities (Guthrie, 2006). “Adept
teachers are aware that reinforcing processes can amplify small actions into larger consequences
for students” (Bowman, 2007, p.84). Research indicates that reinforcement strategies are
effective for increasing and shaping positive behaviors in any learning environment, and such
strategies positively impact intrinsic motivation (Downing, 2005). For example, showing
students their effort is valued, helps student view themselves as responsible for their own
learning (Boekarts, 2002). Teachers should provide feedback to their students so they are
motivated to engage in these desirable behaviors (Downing, 2005). “Informational feedback
helps the individual to understand why they have performed well, and it can be used
diagnostically to improve future performance” (Remedios, 2005, p.436). Additionally, Bowman
(2007) suggests that feedback given informationally has a positive effect on intrinsic motivation.
Four guidelines for performance feedback that will intrinsically motivate students are frequency,
clarity, constructiveness, and encouragement (Fulk, 1994). Promoting student autonomy, helping
students with goal-setting, and providing reinforcement and feedback increases intrinsic
motivation in students and helps them see themselves as effective learners. “When students see
49
themselves as effective learners, they are highly motivated, work harder on learning tasks,
expend more effort, and display more self-regulatory behaviors” (Song, 2006, p.448).
Project Objectives and Processes
As a result of the teacher researchers restructuring their lessons and adjusting their
teaching styles by incorporating student autonomy, goal-setting, and reinforcement in their
classrooms during the period of September 22, 2008, through January 12th, 2009, the 8th through
12th grade students from the targeted classes will have increased intrinsic motivation as measured
by a motivation survey, student observation checklist, student goal sheet, and weekly grade
record analysis.
The teacher researchers elected to use the motivation survey (See Appendix A) as a
means by which they could foster student understanding of their own attitudes towards
motivation. This survey allowed students to have a voice about what was important to them and
their learning. The teacher researchers wanted to see perspective changes in motivation levels
In order to increase academic achievement and overall interest in learning, the
researchers structured their lessons to increase student autonomy by offering student choice in
the learning process. This was done by offering choice in activity, product output, and
assessment.
Student reflections through the use of the student goal sheet’s (See Appendix B) stems
allowed students to realize their expectations for learning, as well as monitor their progress
towards their goals. The student goal sheet was also used as a data collection tool. They allowed
teachers to assess student views on expectations and progress throughout the learning process.
50
Teacher researcher reinforcement and feedback (See Appendix C) were implemented to
shape positive student thoughts and behaviors about their learning. Each student was given
verbal and written feedback once a week.
The student observation checklist (See Appendix E) gave teachers the opportunity to
record data on specific student behaviors that occurred within their classrooms. These records
provided information on how teacher researchers could adapt their lessons to best help their
students. They provided measurements of the changes and strides that took place with regard to
student participation and preparedness. The checklists offered student reaction to specific
situations and how the teacher researchers could, in turn, respond to them. These checklists also
gave the researchers clues on whether or not students were beginning to take ownership of their
learning.
The teacher researchers maintained a weekly grade analysis sheet (See Appendix D) in
order to monitor student grades. Grades were averaged weekly by each teacher and were
recorded for each student. This sheet was used as a data collection tool that provided evidence
for academic progress.
The detailed review of literature helps show the importance of intrinsic motivation in
education by explaining what intrinsic motivation is. The literature also discusses the factors and
methods to be used in the classroom that influence motivation in students.
Action Plan
The following is an outline of the Teacher Researchers’ activities and timeline of the action research project. Week 1 – September 22, 2008
- Copy Parent Consent Forms and Student Assent Forms - Copy Student Motivation Survey - Copy Student Observation Checklist - Copy Student Goal Sheet

51
Week 2 – September 29, 2008
- Distribute Parent Consent Forms - Distribute Student Assent Form and collect immediately
Week 3 – October 6, 2008
- Collect previously distributed Parent Consent Forms - Administer Student Motivation Survey (Pre)
Week 4 – October 13, 2008
- Analyze baseline data from student surveys Week 5 – October 20, 2008
- Begin Interventions o Handout Student Goal Sheet and have students complete Initial Week Stems o Begin positive reinforcement and feedback for each student once per week in
class o Begin/ Introduce student-choice activity in each teacher researcher class
- Complete Student Observation Checklist for each student once per week in class - Record weekly grade of each student
Week 6 – October 27, 2008
- Give positive reinforcement and feedback to each student once per week in class - Complete Student Observation Checklist for each student once per week in class - Record weekly grade of each student
Week 7 – November 3, 2008
- Redistribute Student Goal Sheets and have students respond to Intermediate Week Stems - Give positive reinforcement and feedback to each student once per week in class - Complete Student Observation Checklist for each student once per week in class - Record weekly grade of each student
Week 8 – November 10, 2008
- Give positive reinforcement and feedback to each student once per week in class - Complete Student Observation Checklist for each student once per week in class - Record weekly grade of each student
Week 9 – November 17, 2008
- Give positive reinforcement and feedback to each student once per week in class - Complete Student Observation Checklist for each student once per week in class - Record weekly grade of each student - At the end of the week redistribute Student Goal Sheet and have students respond to Final
Week Stems Week 10 – November 24, 2008
- Administer Student Motivation Survey (Post)
52
Week 11 – December 1, 2008
- Gather and organize data from all teacher researchers Week 12 – December 8, 2008
- Analyze Student Goal Setting Sheets Week 13 – December 15, 2008
- Analyze Student Observation Checklists Week 15 – January 5, 2008
- Compare pre and post Student Motivation Surveys Week 16 – January 12, 2008
- Summarize and reflect on findings from data
Methods of Assessment
The teacher researchers used several methods to assess the outcomes of the interventions.
The teacher researchers gathered data before the interventions and once the study was completed
the researchers analyzed the data collected after the interventions. The methods of assessment for
the interventions are detailed below.
The teacher researchers gave the Student Motivation Survey prior to the beginning of the
intervention to collect baseline data. The same survey was given at the completion of the
interventions to give comparative data to the initial survey. The teacher researchers used Student
Goal-setting Sheets to assess student views on expectations and progress throughout the
intervention, at the first week, the intermediate week and the final week. This data shows
changes in their beliefs about the learning process and their motivation from the beginning to the
end of the intervention.
The teacher researchers analyzed the weekly grade analysis sheet to show changes in student
achievement during the intervention. Lastly, the teacher researchers completed weekly Student
Observation Checklists, which were analyzed during the week of December 15, 2008. These

53
checklists reflected the behaviors and reactions of students to the teacher researcher interventions
and the effects of the interventions on their motivation.
54
Chapter 4
Historical Description of the Intervention
Over a period of nine weeks the teacher researchers restructured their lessons and
adjusted their teaching styles by incorporating student autonomy, goal-setting, and teacher
reinforcement in their classrooms. The goal of the teacher researchers was for the 8th through 12th
grade students from the targeted classes to have increased intrinsic motivation as measured by
motivation surveys, student observation checklists, student goal sheets, and weekly grade record
analyses. The action research plan was carried out according to the Action Plan described in
Chapter 3.
One of the interventions researchers chose in order to increase academic achievement and
overall interest in learning was to allow for student autonomy by offering choice in the learning
process. The teacher researchers structured their lessons to offer students more choice in activity,
product output, and assessment. For instance, students were allowed to choose which physical
education activity to do, how they wanted to present their history projects or what book to read in
their literature class.
A Goal Sheet (See Appendix B) was used as an intervention that would encourage
students’ reflections of their own expectations for learning. The students monitored their
progress towards their goals at the Intermediate and Final Weeks of the intervention period.
Students could set goals for a wide variety of classroom elements: grades, homework
completion, behavior and preparedness.
The final intervention that was used was positive teacher reinforcement and feedback
(See Appendix C). This intervention was implemented to develop positive student reactions and
behaviors to their learning. Each student was given verbal and written feedback once a week.

55
Teacher researchers employed a variety of phrases that were conducive to boosting self-
confidence and motivation.
Presentation and Analysis of the Results
One week after the interventions were completed the Post-Motivation Survey (See
Appendix A) was given to the study participants. The results were then organized and tabulated.
The Goal Sheets (see Appendix B) were collected and analyzed for student aspirations and
perceived achievement. The teacher researchers then compiled Weekly Grade Analysis Sheets
(see Appendix D) that had been previously tracked by the researchers throughout the study to see
if there was an improvement in students’ grades. The teacher researchers also gathered Student
Observation Checklists (see Appendix E) that had amassed over the course of the intervention.
Student Motivation Survey
The purpose of the pre-intervention Student Motivation Survey (see Appendix A) was to
gather baseline data to support our belief that there was a problem of low intrinsic motivation for
school activities among our secondary students. The post-intervention Student Motivation
Survey (see Appendix A) was distributed at the end of the process to see how the students say
their motivation changed over time. Questions in the survey were focused on three categories “I
try harder...” which analyzed the conditions under which a student applies extra effort in school,
“I try in school…” analyzed why students try in general in school, and “My top reasons for not
trying…”, which analyzed what made a student put forth minimal effort in school. The results of
the pre-intervention and the post-intervention Student Motivation Surveys are illustrated in
Figures 1 through 6.
Figure 1. Responses to Question 1 of the Student Motivation Survey
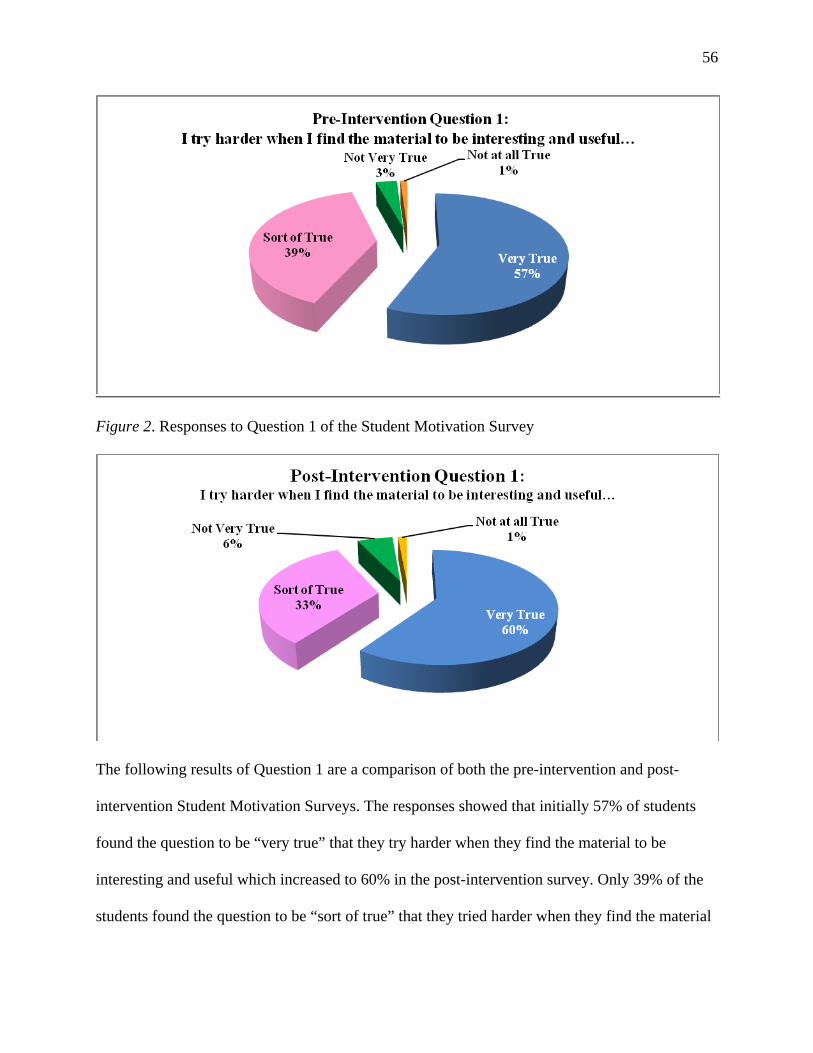
56
Figure 2. Responses to Question 1 of the Student Motivation Survey
The following results of Question 1 are a comparison of both the pre-intervention and post-
intervention Student Motivation Surveys. The responses showed that initially 57% of students
found the question to be “very true” that they try harder when they find the material to be
interesting and useful which increased to 60% in the post-intervention survey. Only 39% of the
students found the question to be “sort of true” that they tried harder when they find the material
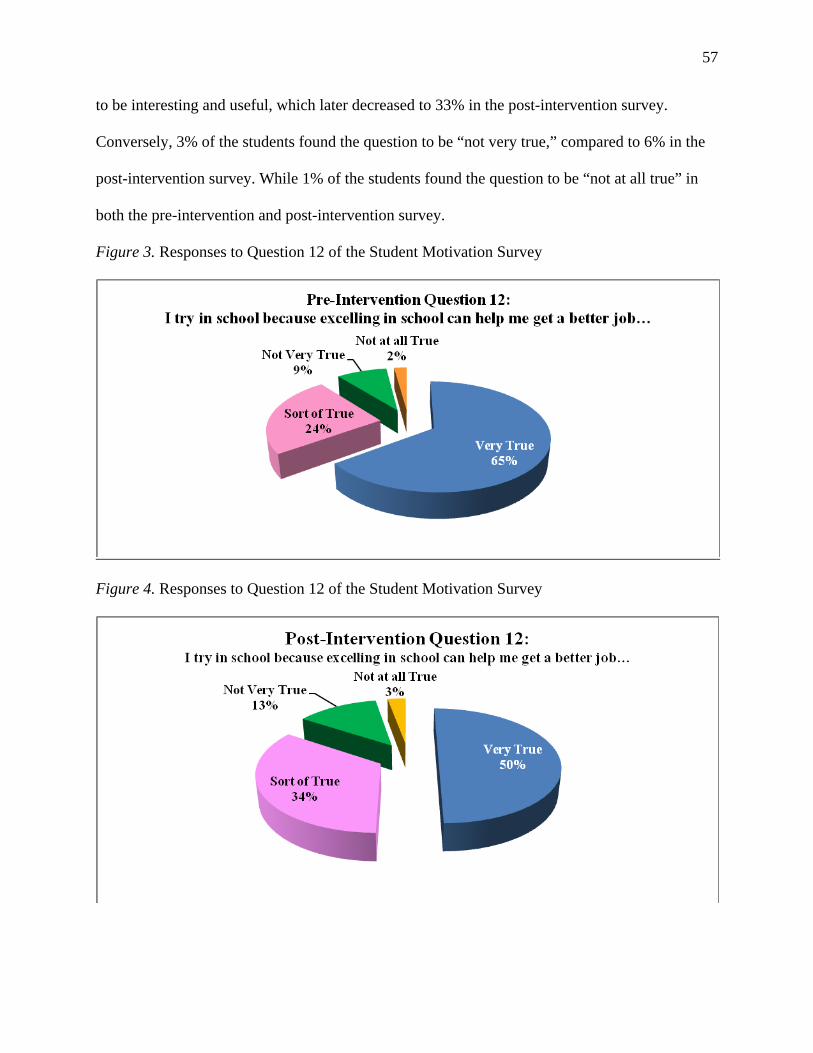
57
to be interesting and useful, which later decreased to 33% in the post-intervention survey.
Conversely, 3% of the students found the question to be “not very true,” compared to 6% in the
post-intervention survey. While 1% of the students found the question to be “not at all true” in
both the pre-intervention and post-intervention survey.
Figure 3. Responses to Question 12 of the Student Motivation Survey
Figure 4. Responses to Question 12 of the Student Motivation Survey

58
The following results of Question 12 are a comparison of both the pre-intervention and post-
intervention Student Motivation Surveys. The responses showed that initially 65% of students
found the question to be “very true” that they tried in school because excelling in school can help
them get a better job, which decreased to 50% in the post-intervention survey. Only, 24% of the
students found the question to be “sort of true” that they tried in school because excelling in
school can help them get a better job, which later increased to 34% in the post-intervention
survey. Conversely, 9% of the students found the question to be “not very true,” compared to
13% in the post-intervention survey. While 2% of the students found the question to be “not at
all true” in the pre-intervention survey and 3% in the post-intervention survey.
Figure 5. Responses to Question 20 of the Student Motivation Survey
Figure 6. Responses to Question 20 of the Student Motivation Survey
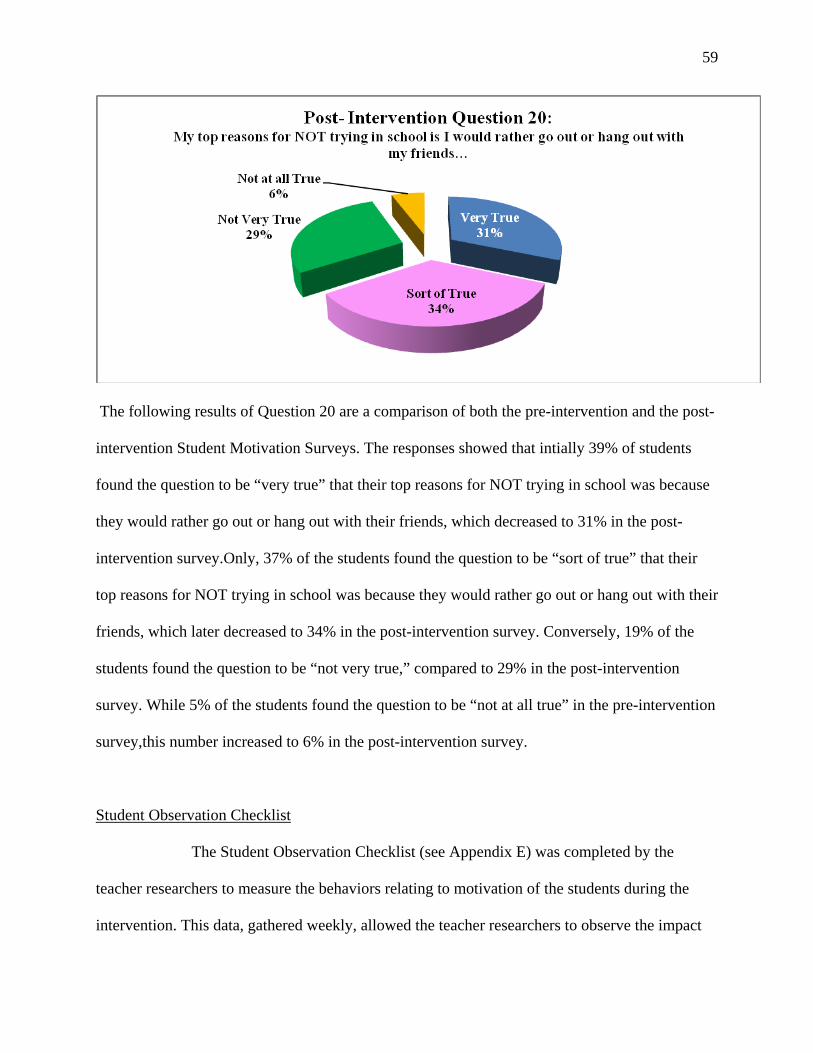
59
The following results of Question 20 are a comparison of both the pre-intervention and the post-
intervention Student Motivation Surveys. The responses showed that intially 39% of students
found the question to be “very true” that their top reasons for NOT trying in school was because
they would rather go out or hang out with their friends, which decreased to 31% in the post-
intervention survey.Only, 37% of the students found the question to be “sort of true” that their
top reasons for NOT trying in school was because they would rather go out or hang out with their
friends, which later decreased to 34% in the post-intervention survey. Conversely, 19% of the
students found the question to be “not very true,” compared to 29% in the post-intervention
survey. While 5% of the students found the question to be “not at all true” in the pre-intervention
survey,this number increased to 6% in the post-intervention survey.
Student Observation Checklist
The Student Observation Checklist (see Appendix E) was completed by the
teacher researchers to measure the behaviors relating to motivation of the students during the
intervention. This data, gathered weekly, allowed the teacher researchers to observe the impact
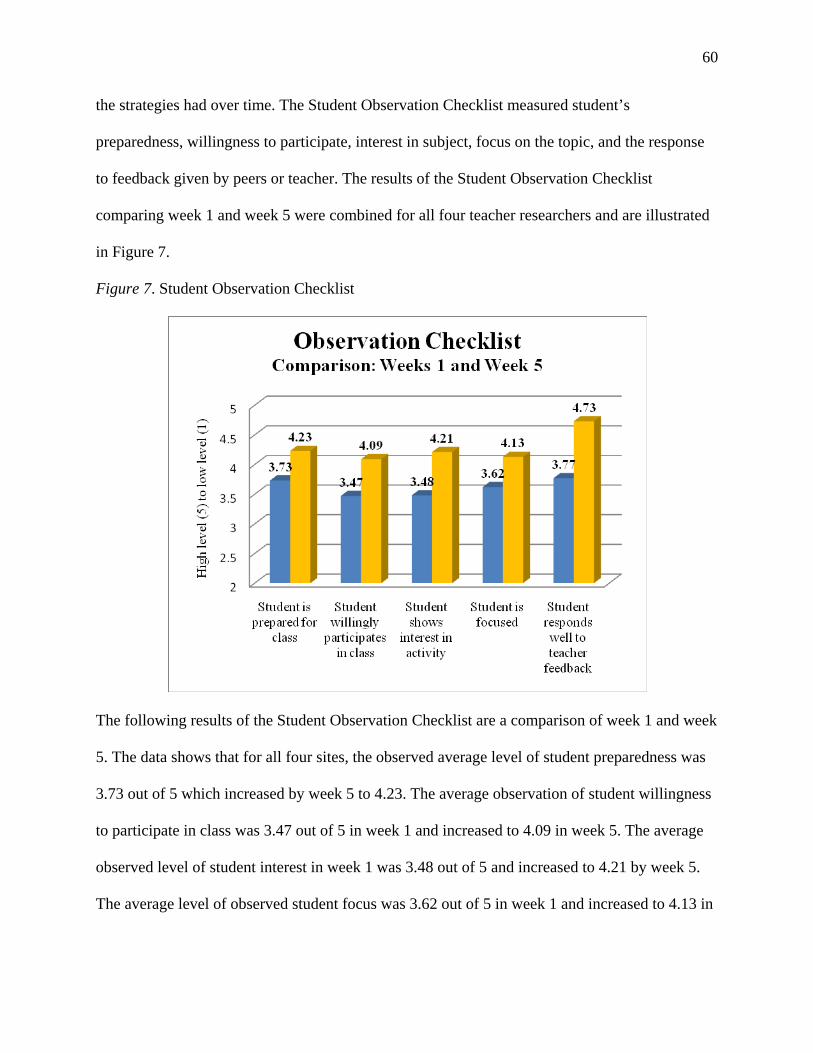
60
the strategies had over time. The Student Observation Checklist measured student’s
preparedness, willingness to participate, interest in subject, focus on the topic, and the response
to feedback given by peers or teacher. The results of the Student Observation Checklist
comparing week 1 and week 5 were combined for all four teacher researchers and are illustrated
in Figure 7.
Figure 7. Student Observation Checklist
The following results of the Student Observation Checklist are a comparison of week 1 and week
5. The data shows that for all four sites, the observed average level of student preparedness was
3.73 out of 5 which increased by week 5 to 4.23. The average observation of student willingness
to participate in class was 3.47 out of 5 in week 1 and increased to 4.09 in week 5. The average
observed level of student interest in week 1 was 3.48 out of 5 and increased to 4.21 by week 5.
The average level of observed student focus was 3.62 out of 5 in week 1 and increased to 4.13 in
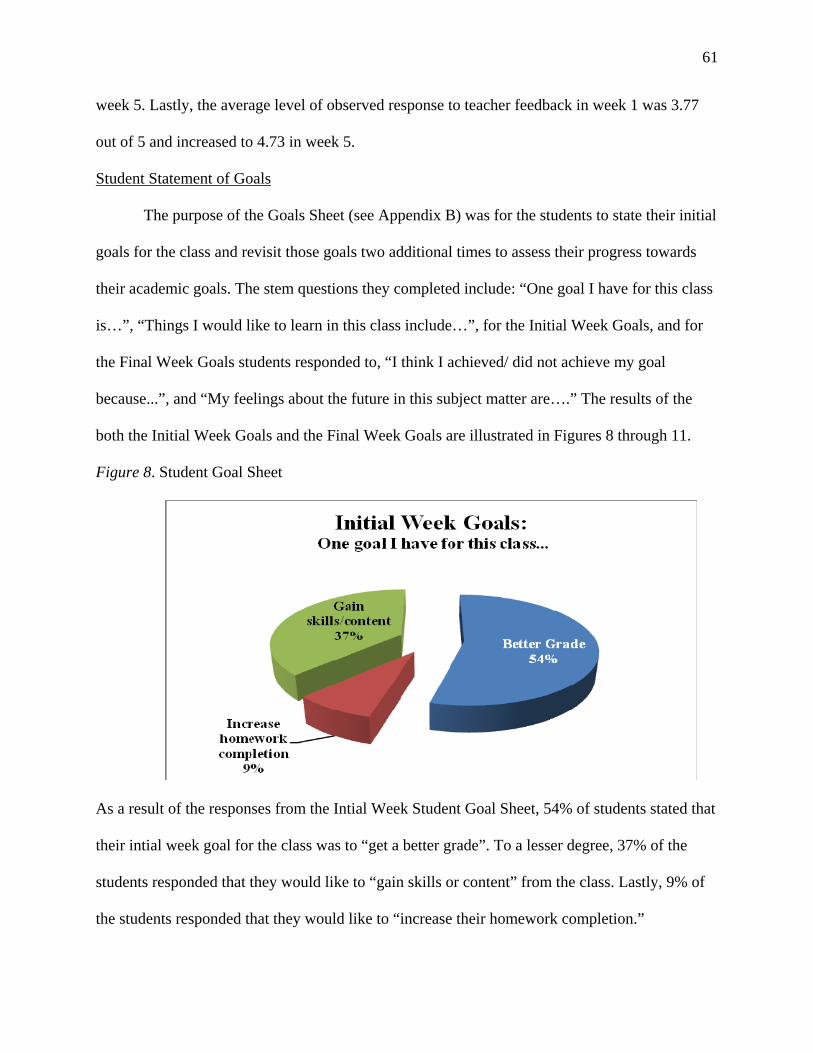
61
week 5. Lastly, the average level of observed response to teacher feedback in week 1 was 3.77
out of 5 and increased to 4.73 in week 5.
Student Statement of Goals
The purpose of the Goals Sheet (see Appendix B) was for the students to state their initial
goals for the class and revisit those goals two additional times to assess their progress towards
their academic goals. The stem questions they completed include: “One goal I have for this class
is…”, “Things I would like to learn in this class include…”, for the Initial Week Goals, and for
the Final Week Goals students responded to, “I think I achieved/ did not achieve my goal
because...”, and “My feelings about the future in this subject matter are….” The results of the
both the Initial Week Goals and the Final Week Goals are illustrated in Figures 8 through 11.
Figure 8. Student Goal Sheet
As a result of the responses from the Intial Week Student Goal Sheet, 54% of students stated that
their intial week goal for the class was to “get a better grade”. To a lesser degree, 37% of the
students responded that they would like to “gain skills or content” from the class. Lastly, 9% of
the students responded that they would like to “increase their homework completion.”
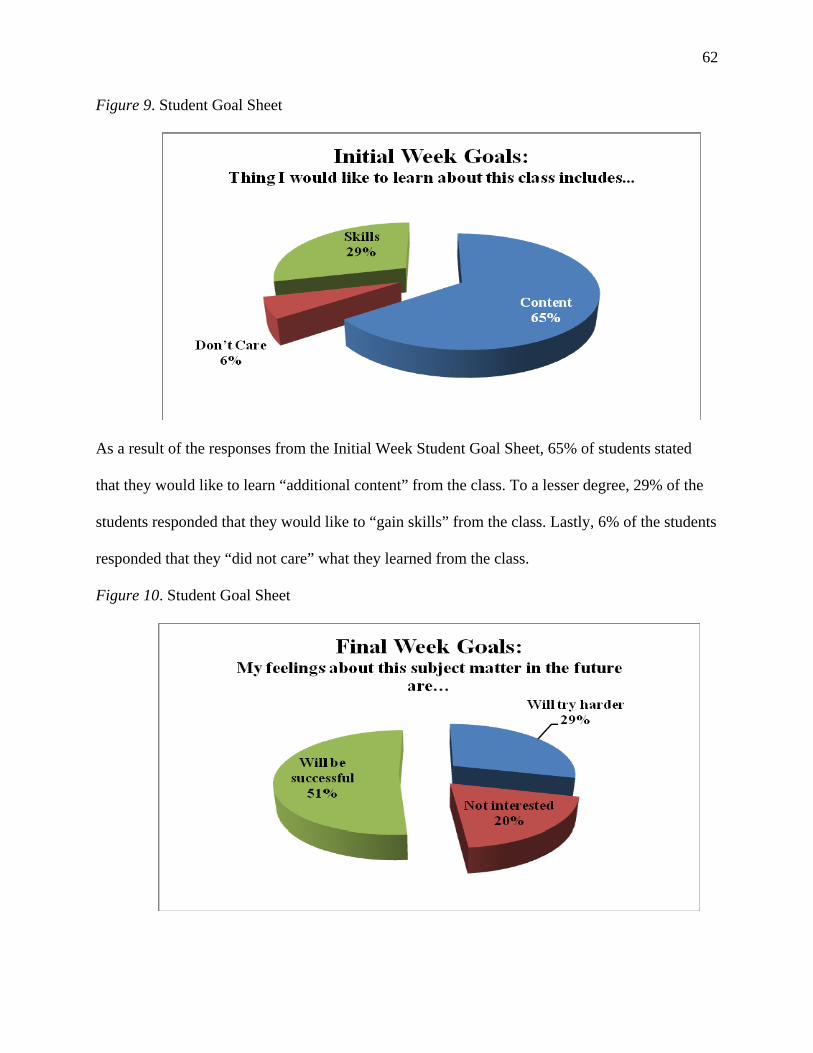
62
Figure 9. Student Goal Sheet
As a result of the responses from the Initial Week Student Goal Sheet, 65% of students stated
that they would like to learn “additional content” from the class. To a lesser degree, 29% of the
students responded that they would like to “gain skills” from the class. Lastly, 6% of the students
responded that they “did not care” what they learned from the class.
Figure 10. Student Goal Sheet

63
As a result of the responses from the Final Week Student Goal Sheet, 51% of students stated that
they feel they “will be successful” with the subject matter in the future. To a lesser degree, 29%
of the students responded that they “will try harder” with the subject matter in the future. Lastly,
20% of the students responded that they “were not interested” in the subject matter of the class.
Figure 11. Student Goal Sheet
As a result of the responses from the Final Week Student Goal Sheet, 92% of students stated that
they did or did not achieve their goal due to their “effort”. On the other hand, 8% of the students
responded that they did not achieve their goal because of a “lack of opportunity.”
Grade Record Analysis
The purpose of the Grade Record Analysis (see Appendix D), completed by the teacher
researchers, was to record quantitative data from the teacher researchers’ grade books. This
information was used to show improvement of students’ grades/homework completion rate
throughout the intervention. Weekly grades were averaged and recorded along with notations
stating improvement or decline for each student involved in the study. The results of the five
week grade analysis for all four sites are illustrated in Figure 12.
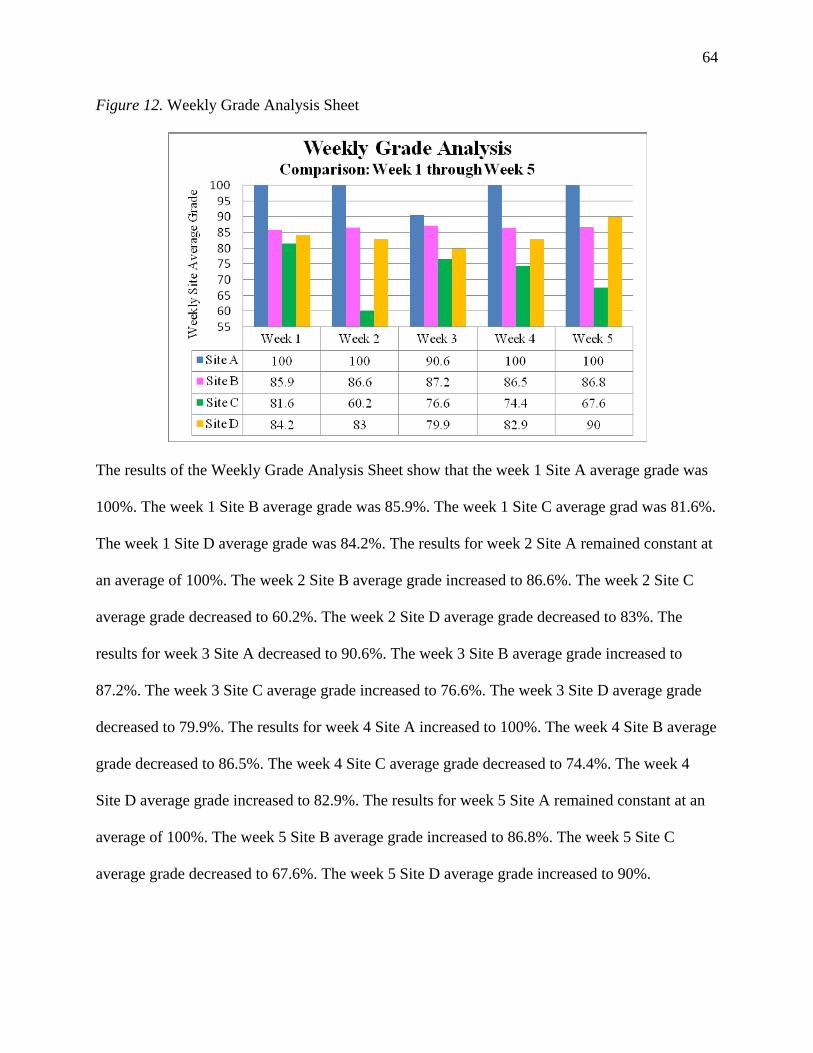
64
Figure 12. Weekly Grade Analysis Sheet
The results of the Weekly Grade Analysis Sheet show that the week 1 Site A average grade was
100%. The week 1 Site B average grade was 85.9%. The week 1 Site C average grad was 81.6%.
The week 1 Site D average grade was 84.2%. The results for week 2 Site A remained constant at
an average of 100%. The week 2 Site B average grade increased to 86.6%. The week 2 Site C
average grade decreased to 60.2%. The week 2 Site D average grade decreased to 83%. The
results for week 3 Site A decreased to 90.6%. The week 3 Site B average grade increased to
87.2%. The week 3 Site C average grade increased to 76.6%. The week 3 Site D average grade
decreased to 79.9%. The results for week 4 Site A increased to 100%. The week 4 Site B average
grade decreased to 86.5%. The week 4 Site C average grade decreased to 74.4%. The week 4
Site D average grade increased to 82.9%. The results for week 5 Site A remained constant at an
average of 100%. The week 5 Site B average grade increased to 86.8%. The week 5 Site C
average grade decreased to 67.6%. The week 5 Site D average grade increased to 90%.

65
Conclusions and Recommendations
After the completion of our 16-week action research project and implementation of our
interventions, we saw an increase in intrinsic motivation among secondary school students. We
have come to this conclusion after analyzing the collected data from the pre-intervention and
post-intervention Student Motivation Survey, the Student Observation Checklist, Student Goals
Sheet, and the Weekly Grade Analysis. The following data unmistakably shows a decrease in
extrinsic motivation and in increase in intrinsic motivation over the course of our five week
intervention process.
This conclusion is supported by comparing the results of the pre-intervention and post-
intervention Student Motivation Surveys. When addressing Question 1, “I try harder when I find
the material to be interesting and useful…”, the students found the material to be in fact more
interesting and useful over the course of the five week intervention process, which is evidence of
an increase of intrinsic motivation. When answering Question 12, “I try in school because
excelling in school can help me get a better job…”, there was a noticeable decrease in
extrinsically motivated responses from week 1 to week 5, which inadvertently shows an increase
in intrinsic motivation. Lastly, when responding to Question 20, “My top reason for NOT trying
in school is I would rather go out or hang out with my friends…”, the number of students who
agreed with the statement decreased thus showing a decrease in extrinsic motivation.
Further support of the increase of intrinsic motivation among all four sites was generated
by comparing week 1 and week 5 of the Student Observation Checklist. In the five observed
categories of intrinsically related student behaviors such as preparedness, participation, interest,
focus, and response to teacher feedback, the data reflects an increase by all four teacher
researchers. The most notable was the increase of student response to teacher feedback.
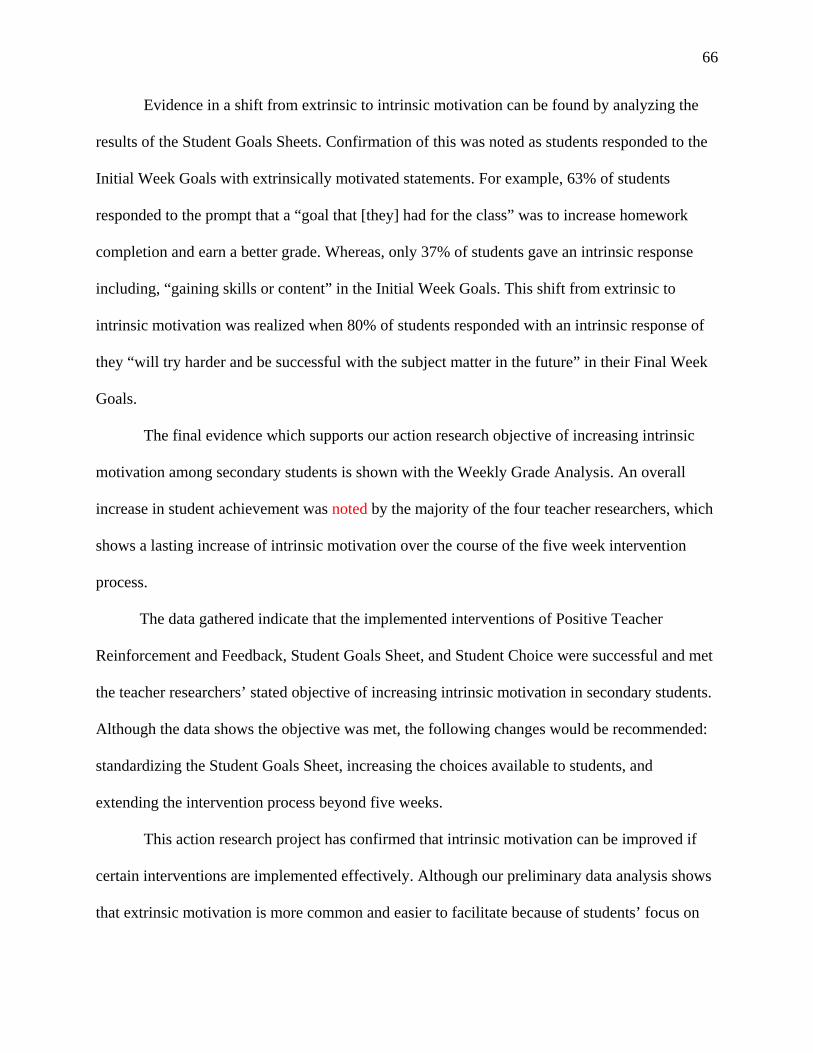
66
Evidence in a shift from extrinsic to intrinsic motivation can be found by analyzing the
results of the Student Goals Sheets. Confirmation of this was noted as students responded to the
Initial Week Goals with extrinsically motivated statements. For example, 63% of students
responded to the prompt that a “goal that [they] had for the class” was to increase homework
completion and earn a better grade. Whereas, only 37% of students gave an intrinsic response
including, “gaining skills or content” in the Initial Week Goals. This shift from extrinsic to
intrinsic motivation was realized when 80% of students responded with an intrinsic response of
they “will try harder and be successful with the subject matter in the future” in their Final Week
Goals.
The final evidence which supports our action research objective of increasing intrinsic
motivation among secondary students is shown with the Weekly Grade Analysis. An overall
increase in student achievement was noted by the majority of the four teacher researchers, which
shows a lasting increase of intrinsic motivation over the course of the five week intervention
process.
The data gathered indicate that the implemented interventions of Positive Teacher
Reinforcement and Feedback, Student Goals Sheet, and Student Choice were successful and met
the teacher researchers’ stated objective of increasing intrinsic motivation in secondary students.
Although the data shows the objective was met, the following changes would be recommended:
standardizing the Student Goals Sheet, increasing the choices available to students, and
extending the intervention process beyond five weeks.
This action research project has confirmed that intrinsic motivation can be improved if
certain interventions are implemented effectively. Although our preliminary data analysis shows
that extrinsic motivation is more common and easier to facilitate because of students’ focus on
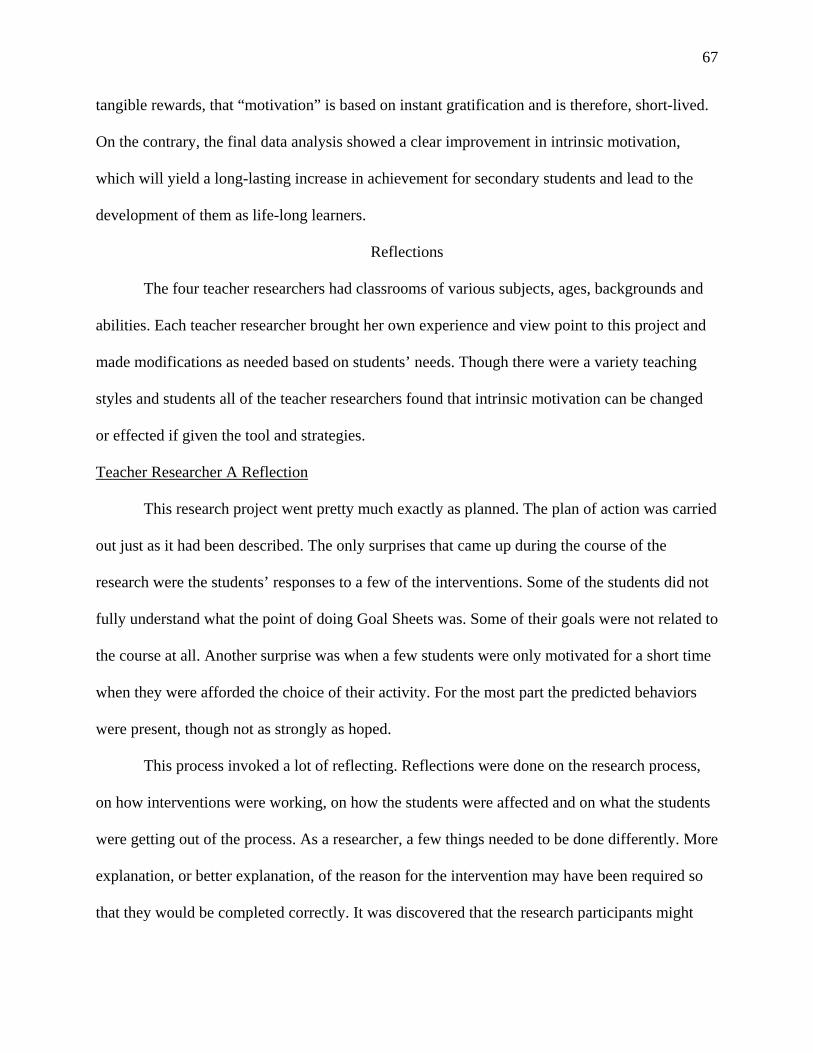
67
tangible rewards, that “motivation” is based on instant gratification and is therefore, short-lived.
On the contrary, the final data analysis showed a clear improvement in intrinsic motivation,
which will yield a long-lasting increase in achievement for secondary students and lead to the
development of them as life-long learners.
Reflections
The four teacher researchers had classrooms of various subjects, ages, backgrounds and
abilities. Each teacher researcher brought her own experience and view point to this project and
made modifications as needed based on students’ needs. Though there were a variety teaching
styles and students all of the teacher researchers found that intrinsic motivation can be changed
or effected if given the tool and strategies.
Teacher Researcher A Reflection
This research project went pretty much exactly as planned. The plan of action was carried
out just as it had been described. The only surprises that came up during the course of the
research were the students’ responses to a few of the interventions. Some of the students did not
fully understand what the point of doing Goal Sheets was. Some of their goals were not related to
the course at all. Another surprise was when a few students were only motivated for a short time
when they were afforded the choice of their activity. For the most part the predicted behaviors
were present, though not as strongly as hoped.
This process invoked a lot of reflecting. Reflections were done on the research process,
on how interventions were working, on how the students were affected and on what the students
were getting out of the process. As a researcher, a few things needed to be done differently. More
explanation, or better explanation, of the reason for the intervention may have been required so
that they would be completed correctly. It was discovered that the research participants might

68
have problems understanding the objectives more often than the researcher had realized. It
doesn’t seem that the research participants reflected much beyond when the goal sheets
prompted them to. They did not seem to learn much about the teacher researcher or each other
during the process. This is not a problem as it was not the main goal of the research.
The climate of the research setting stayed constant throughout the process. It may have
helped that the interventions only took place over a five week period and there was not much of a
chance for change to occur. The overall changes that took place during the research process were
in the students. There was a slight change in their intrinsic motivation levels. There may have
been much more of a change if these, or other research based interventions, were implemented
on a bigger scale. If the focus on intrinsic motivation was more encompassing of the entire
school environment, a bigger change may occur. Overall, the research process itself was a
rewarding one. Even though the research did not produce the desired result to a desired degree, a
lot was gained by completing the process.
Teacher Researcher B Reflection
Motivation is something I have long been interested in with my students, so when I first
began this research project I was excited. I was a bit cynical as well, however, because in my
thirteen years as a teacher, motivation is the one topic that has consistently been an issue in the
classroom, regardless of my students’ gender or age. No matter what I have tried, it seems my
students have been motivated solely by extrinsic factors. Researching new ways to motivate and
encourage my students was something I thought would be of great value to me.
This year, to my surprise, I had very highly motivated students. This made the project in and of
itself a bit unusual because I had expected to have the usual set of students who constantly
struggled to get homework done, didn’t care about school, and only wanted to know what their
69
grades were. While it’s true I certainly have some students for whom these stereotypes hold true,
the majority of my students this year are already motivated to do well. My goal was to see what
it was exactly that motivated them and to see how I could more effectively turn the extrinsic
motivators to those that were intrinsic.
The research went very smoothly in the beginning. My fellow researchers and I worked
together well and divided the tasks equally among us. We were able to work in teams of two,
which helped us organize the information more easily and communicate the flow of ideas more
smoothly. We were also able to effectively bring out one another’s strengths within the group.
I was also pleased with how well things went when I presented my research project to my
students. In fact, my students were both excited about and interested in the research I was doing.
This surprised me so much because I had expected them to be disinterested and nonchalant.
While the students were already highly motivated to do homework and had it done on an almost
daily basis, I quickly realized it was still for extrinsic factors. Because my school and community
are very competitive, my students are very driven by grades. They constantly want to know if I
am taking down their homework for points, and they want to know how much something is
going to be worth. I realized that all the research, all the positive reinforcement and all the goal
sheets in the world couldn’t change that-unfortunately. Students who are internally driven will be
internally driven. It’s as simple as that.
While I believe there are some students who can be further encouraged to increase their
intrinsic motivation, the interventions we employed need to be in place for a longer amount of
time to truly have a long-term impact on a greater number of students.
As a teacher I learned that it is good to challenge myself and reflect on my teaching
strategies and if I am asking my students to do the same. Otherwise I am being hypocritical. In
70
the long run, I become a better teacher for it, and my students become better learners because of
it.
Teacher Researcher C Reflection
After following through with the 16 week action research plan to study intrinsic
motivation of secondary students in the fall of 2008, many things were found to be surprising
from Site C. These surprising occurrences included the immediate support for the process, the
students’ reaction to the action research process, and also the students’ data after the
interventions.
There were many surprising aspects to the action research process, one on which was the
immediate support that was received from both parents and the students. The parent support was
experienced after sending home the parent consent forms and speaking with parents about the
project at Open House in the fall. Parents emailed letters of support and reminisced about their
experiences with their respective graduate research. The geography students that were involved
in the study were also overall supportive of the action research plan. They were frequently asking
questions about the progress and if they were going to be published. The positive support from
both parents and students was truly appreciated.
After the immediate support of the action research project dwindled, students began to
learn more about the project, particularly about their role. What students did not understand, was
that there were going to be very few changes that would impact their role or involvement in the
class. Instead, they were convinced they had to do additional work and put forth more effort for
the project. However, one beneficial response to the interventions was how well they responded
to having the freedom of choice.
71
The immediate support that was given from both parents and students, and the students’
reaction to the action research project were both surprising, but what was most interesting, were
the results that were drawn from the students after the interventions went into place. After the
interventions of positive teacher feedback, the Student Goal Sheets, and the freedom of choice on
projects were implemented, it was expected that the amount of intrinsic motivation would
increase as well; however, this was not the case. In fact, the data collection tools of the Student
Goal Sheet, Weekly Grade Analysis, and the Observation Checklist were conducted, the students
showed signs at Site C, that their intrinsic motivation was actually decreasing. For example their
grades had in fact decreased showing a lack of motivation. After reviewing data from the
Observation Checklists, it was found that this was also frequently the case with many students.
After reflecting upon the response received from parents and students, the data collected,
the results that have been concluded, the action research project implemented in the fall of 2008
was from Site C unsuccessful. Greater success could have been achieved if a different, more
serious group of students were chosen to complete the research process. Greater success could
have been achieved if more opportunities for freedom of choice were incorporated, this proved to
be the best intervention. Finally, greater success could have been achieved if for the Weekly
Grade Analysis was analyzing data from five weeks of assignments that were of the exact same
type, point value, and number. This was not the case and unfortunately distorted this data.
The belief that teachers are also learners was reaffirmed through the MATL Action
Research courses and project. The desire to be a teacher and learner will continue as additional
professional development opportunities are in the near future.
72
Teacher Researcher D Reflection As a whole, I feel that the interventions were successful and they did meet the needs of
our students but the true benefit could not be realized because the intervention period took place
in such a short time frame. The vast majority of my intervention was based on increasing student
choice in the classroom, providing more authentic assessments, and allowing students to take a
more active role in their education.
My earliest intervention and data collection was a student goal sheet that students
constantly updated throughout my research. This was excellent because through reflection,
students were able to assess whether or not they were meeting their own expectations. Secondly,
I offered many types of authentic assessment that allowed students to choose how they met the
stated objectives. Lastly, many of the activities were student-led and allowed students to attach
importance to material they felt was instrumental to the lesson.
Over the course of the intervention period, I worked very hard to instill the mindset that
our class should operate as a learning community that encourages mastery by not only the
individual, but the class as well. By the time we reached the end of our stated research period, I
began to notice that certain members of each group began to assume a leadership role within the
group and sought to help all students achieve.
Improving intrinsic motivation, as you know, is no small task because we are essentially
attempting to change the “mind set” of our students in relation to their viewpoint on education.
Our early interventions showed that extrinsic motivation is far easier to influence because of the
importance our students place on rewards such as grades, privileges, or possibly receiving money
from their parents. This type of motivation however is not nearly as effective as intrinsic
motivation because students will immediately default to rote memorization so they can simply
73
“get their reward” as opposed to working towards mastery. I feel confident in saying that my
interventions were a success even though the true value was not realized until the final week and
after the intervention period was complete. I continued my interventions through the remainder
of the semester and continue to encourage the culture of collaboration within my classroom.
With the knowledge I have gained through this process, but more importantly the success
I have seen through the use of these interventions, it has led me to implement these strategies on
a permanent basis. By offering a greater amount of choices available to our students, providing
more authentic assessments, and allowing students to take a more active role in their education,
we will in fact improve intrinsic motivation of secondary school students and instill a mentality
of learning for mastery as opposed to extrinsic rewards.
74
REFERENCES
Boekaerts, M. (2002). Motivation to learn. International Bureau of Education, 7-28. Retrieved
June 16, 2008, from ERIC database.
Bowman, R. (2007). How can students be motivated: A misplaced question? Clearing House, 81,
81-86. Retrieved June 16, 2008, from ERIC database.
Cameron, J. P., Banko, K., & Gear, A. (2005). Achievement-based rewards and intrinsic
motivation: A test of cognitive mediators. Journal of Educational Psychology, 97, 641-
655. Retrieved June 16, 2008, from ERIC database.
Cashwell, C., Schweiger, W. K., & Watts Jr., R. H. (2004). Fostering intrinsic motivation in
children: A humanistic counseling process. Journal of Humanistic Counseling,
Education, and Development. 43, 16-24. Retrieved June 16, 2008, from ERIC database.
Chulkov, D. (2006) Student response to grading incentives: Evidence from college economics
courses. Journal of Instructional Psychology, 33, 206-211. Retrieved June 16, 2008, from
ERIC database.
Corpus, J. H., Ogle, C. M., & Love-Geiger, K. E. (2006). The effects of social-comparison
versus mastery praise on children's intrinsic motivation. Motivation and Emotion. 30,
333-343. Retrieved June 16, 2008, from ERIC database.
Covington, M., & Mueller, K. J. (2001). Intrinsic versus extrinsic motivation: an
approach/avoidance reformulation. Educational Psychology Review, 13, 157-176.
Retrieved June 16, 2008, from ERIC database.
Deci, E., Lens, W., Sheldon, K. M., Simons, J. & Vansteenkiste, M. (2004). Motivating
learning, performance, and persistence: The synergistic effects of intrinsic goal contents
75
and autonomy-supportive contexts. 87, 246-260. Retrieved June 16, 2008, from ERIC
database.
DeLisle, R., & Hargis, J. (2005). The big fish. Education, 125, 702-706. Retrieved June 16,
2008, from ERIC database.
Downing, J., Keating, T., & Bennett, C. (2005). Effective reinforcement techniques in
elementary physical education: The key to behavior management. Physical Educator, 62,
114-122. Retrieved June 16, 2008, from ERIC database.
Fulk, B., & Montgomery-Grymes, D. J. (1994). Strategies to improve student motivation.
Intervention in School & Clinic, 30, 28-34. Retrieved June 16, 2008, from ERIC database.
Gonzalez-DeHass, A. R., Willems, P. P., & Doan Holbein, M. F. (2005) Examining the
relationship between parental involvement and student motivation. Educational
Psychology Review, 17, 99-123. Retrieved June 11, 2008, from ERIC database.
Guthrie, J., Wigfield, A., Humenick, N., Perencevich, K., Taboada, A., & Barbosa, P. (2006).
Influences of stimulating tasks on reading motivation and comprehension. Journal of
Educational Research, 99, 232-245. Retrieved June 16, 2008, from ERIC database.
Harper, E. (2007). Making good choices: How autonomy support influences the behavior change
and motivation of troubled and troubling youth. Reclaiming Children and Youth, 16, 23-28.
Retrieved June 16, 2008, from ERIC database.
Knollmann, M., & Wild, E. (2007). Quality of parental support and students’ emotions during
homework: Moderating effects of students’ motivational orientations. European Journal
of Psychology of Education, 22, 63-76. Retrieved June 11, 2008, from ERIC database.
Kostelecky, K., & Hoskinson, M. (2005). A novel approach to motivating students. Education,
125, 438-443. Retrieved June 16, 2008, from ERIC database.
76
Legault, L., Green-Demers, I., & Pelletier, L. (2006). Why do high school students lack
motivation in the classroom? Toward an understanding of academic amotivation and the
role of social support. Journal of Educational Psychology, 98, 567-582. Retrieved June
11, 2008, from ERIC database.
Lepper, M. R., Corpus, Henderlong, J. & Iyengar, S. S. (2005). Intrinsic and extrinsic
motivational orientations in the classroom: Age differences and academic correlates.
Journal of Educational Psychology, 97, 184-196. Retrieved December 4, 2007, from
ERIC database.
Linnenbrink, E., & Pintrich, P. R. (2002). Motivation as an enabler for academic success. School
Psychology Review, 31, 313-328. Retrieved June 16, 2008, from ERIC database.
Lyke, J., & Kelaher Young, A. (2006). Cognition in context: students’ perceptions of classroom
goal structures and reported cognitive strategy use in the college classroom. Research in
Higher Education, 47, 477-490. Retrieved June 16, 2008 from ERIC database.
Margolis, H., & McCabe, P. P. (2004). Self-efficacy: A key to improving the motivation of
struggling learners. Clearing House, 77, 241-249. Retrieved June 11, 2008, from ERIC
database.
Margolis, H., & McCabe, P. P. (2007). Improving self-efficacy and motivation: What to do,
what to say. Intervention in School and Clinic, 41, 218-227. Retrieved June 11, 2008,
from ERIC database.
Martens, R. L., Gulikers, J., & Bastiaens, T. (2004). The impact of intrinsic motivation on e-
learning in authentic computer tasks. Journal of Computer Assisted Learning, 20, 368-
376. Retrieved June 11, 2008, from ERIC database.

77
Mehta, A., H. Clayton, & Sankar, C. S. (2007). Impact of multi-media case studies on improving
intrinsic learning motivation of students. J. Educational Technology Systems, 36, 79-103.
Retrieved June 16, 2008, from ERIC database.
Nelson, M. R., & T. DeBacker. (2008). Achievement motivation in adolescents: the role of peer
climate and best friends. The Journal of Experimental Education, 76, 170-189. Retrieved
June 16, 2008 from ERIC database.
Noddings, N. (2005). Identifying and responding to needs in education. Cambridge Journal of
Education, 35. Retrieved June 16, 2008, from ERIC database.
O’Neil, H. F., Abedi, J., Miyoshi, J. & Mastergeorge. A. (2005). Monetary incentives for low-
stake tests. Educational Assessment, 10, 185-208. Retrieved June 16, 2008 from ERIC
database.
Otis, N., Grouzet, F. M.E., & Pelletier, L.G. (2005). Latent motivational change in an
academic setting: A 3-year longitudinal study. Journal of Edcational Psychology . 97,
170-183. Retrieved June 16, 2008, from ERIC database.
Paas, F., Tuovinen, J.E., Van Merrienboer, J.J.G., & Darabi, A. (2005). A motivational
perspective on the relation between mental effort and performance: Optimizing learner
involvement in instruction. ETR&D, 53, 25-34. Retrieved June 16, 2008 from ERIC
database.
Patall, E. A., Cooper, H., & Robinson, J. C. (2008). The effects of choice on intrinsic
motivation and related outcomes: A meta-analysis of research findings. Psychological
Bulletin, 134, 270-300. Retrieved June 11, 2008, from ERIC database.
78
Phalet, K., Andriessen, I., & Lens, W. (2004). How future goals enhance motivation and learning
in multicultural classrooms. Educational Psychology Review, 16, 59-89. Retrieved June
16, 2008, from ERIC database.
Phillips, N., & Lindsay, G. (2006). Motivation in gifted students. High Ability Studies, 17, 57-73.
Retrieved June 16, 2008, from ERIC database.
Prescott, A., & Simpson, E. (2004). Effective student motivation commences with resolving
“dissatisfiers.” Journal of Further and Higher Education, 28, 247-259. Retrieved June
11, 2008, from ERIC database.
Remedios, R., Ritchie, K., & Lieberman, D. (2005). I used to like it but now I don't: The effect
of the transfer test in Northern Ireland on pupils' intrinsic motivation. British Journal of
Educational Psychology, 75, 435-452. Retrieved June 16, 2008, from ERIC database.
Rieck, W., & Dugger-Wadsworth, D. (2008). From broadway to classroom: Using
entertainment media to get your point across. Clearing House, 81, 165-168. Retrieved
June 11, 2008, from ERIC database.
Sansone, C., & Harackiewicz, J. (2003). Intrinsic motivation, extrinsic rewards, and divergent
views of reality. Educational Psychology Review, 15, 311-325. Retrieved June 16, 2008
from ERIC database.
Sinclair, C. D., & Stellino, M.B. (2008). Intrinsically motivated, free-time physical activity. The
Journal of Physical Education, Recreation & Dance, 79, 37-40. Retrieved June 16, 2008,
from ERIC database.
Song, H., & Grabowski, L. (2006). Stimulating intrinsic motivation for problem solving using
goal-oriented contexts and peer group composition. Educational Technology Research
and Development. 54, 445-466. Retrieved June 16, 2008, from ERIC database.
79
Strahan, D. (2008). Successful teachers develop academic momentum with reluctant students.
Middle School Journal, 39, 4-12. Retrieved June 11, 2008, from ERIC database.
Unrau, N., & Schlackman, J. (2006). Motivaton and its relationship with reading achievement
in an urban middle school. Journal of Educational Research . 100, 81-101. Retrieved
June 16, 2008, from ERIC database.
Vansteenkiste, M. Lens, W. & Deci, E. (2006). Intrinsic versus extrinsic goal contents in self-
determination theory: Another look at the quality of academic motivation. Educational
Psychologist, 41, 19-31. Retrieved June 16, 2008, from ERIC database.
Vansteenkiste, M., Simons, J., Lens, W., Soenens, B., & Matos, L. (2005). Examining the
motivational impact of intrinsic versus extrinsic goal framing and autonomy-supportive
versus internally controlling communication style on early adolescents’ academic
achievement. Child Development, 76, 483-501. Retrieved June 16, 2008 from ERIC
database.
Vansteenkiste, M. Soenens, M., Timmermans, B., Lens, T., & Van den Broeck, A. (2008).
Does extrinsic goal framing enhance extrinsic goal-oriented individuals' learning and
performance? An experimental test of the match perspective versus self-determination
theory. Journal of Educational Psychology. 100, 387-397. Retrieved from June 16, 2008,
from ERIC database.
Xie, K., Debacker, T., & Ferguson, C. (2006). Extending the traditional classroom through
online discussion: The role of student motivation. Journal of Educational Computing
Research. 34, 67-89. Retrieved June 16, 2008, from ERIC database.

APPENDIXES
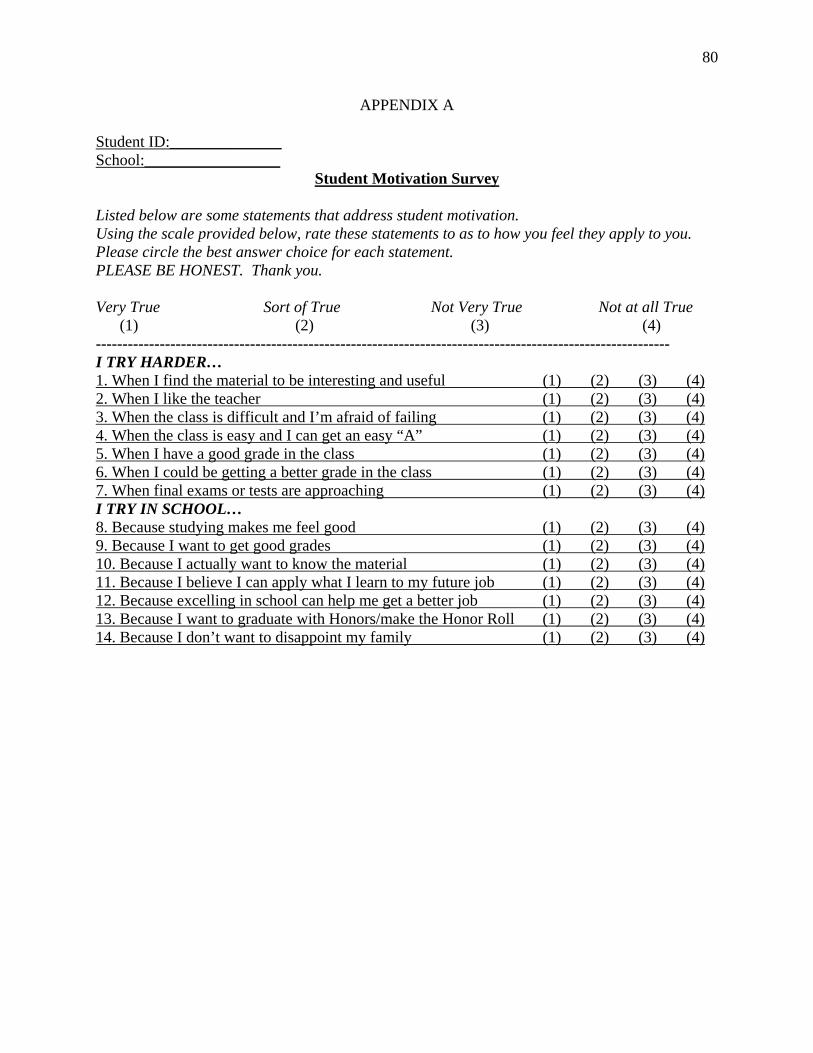
80
APPENDIX A
Student ID:______________ School:_________________
Student Motivation Survey Listed below are some statements that address student motivation. Using the scale provided below, rate these statements to as to how you feel they apply to you. Please circle the best answer choice for each statement. PLEASE BE HONEST. Thank you. Very True Sort of True Not Very True Not at all True (1) (2) (3) (4) ------------------------------------------------------------------------------------------------------------ I TRY HARDER… 1. When I find the material to be interesting and useful (1) (2) (3) (4) 2. When I like the teacher (1) (2) (3) (4) 3. When the class is difficult and I’m afraid of failing (1) (2) (3) (4) 4. When the class is easy and I can get an easy “A” (1) (2) (3) (4) 5. When I have a good grade in the class (1) (2) (3) (4) 6. When I could be getting a better grade in the class (1) (2) (3) (4) 7. When final exams or tests are approaching (1) (2) (3) (4) I TRY IN SCHOOL… 8. Because studying makes me feel good (1) (2) (3) (4) 9. Because I want to get good grades (1) (2) (3) (4) 10. Because I actually want to know the material (1) (2) (3) (4) 11. Because I believe I can apply what I learn to my future job (1) (2) (3) (4) 12. Because excelling in school can help me get a better job (1) (2) (3) (4) 13. Because I want to graduate with Honors/make the Honor Roll (1) (2) (3) (4) 14. Because I don’t want to disappoint my family (1) (2) (3) (4)
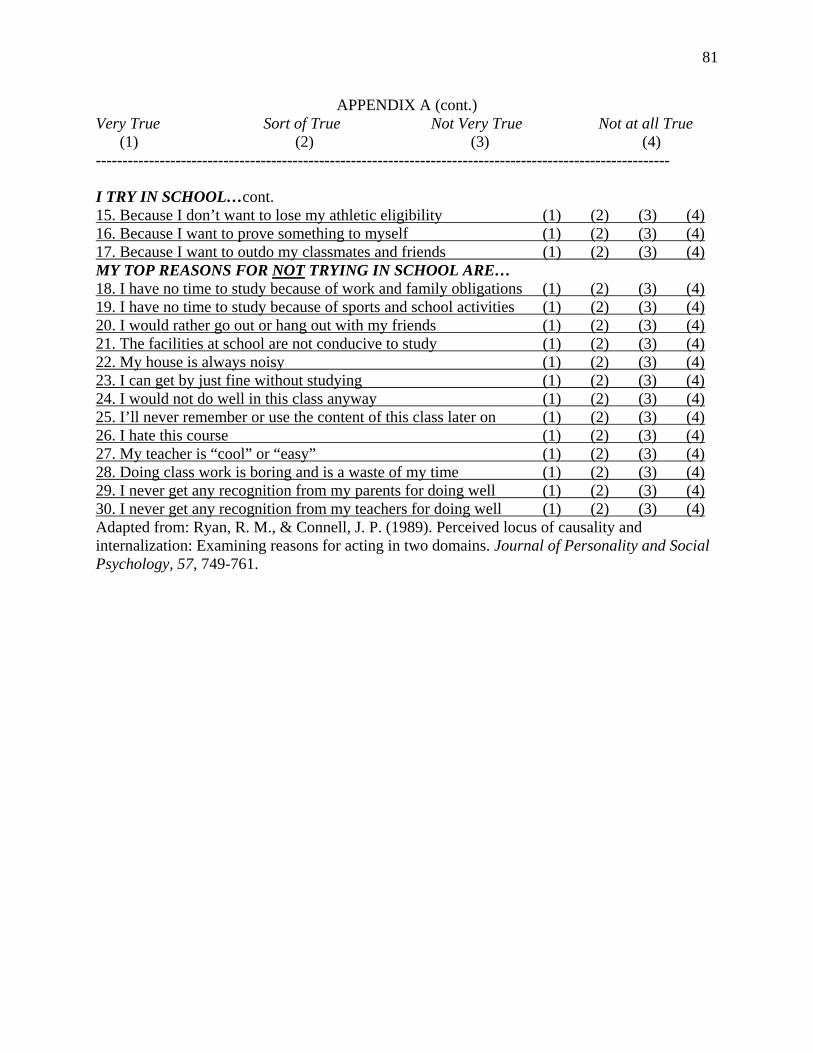
81
APPENDIX A (cont.) Very True Sort of True Not Very True Not at all True (1) (2) (3) (4) ------------------------------------------------------------------------------------------------------------ I TRY IN SCHOOL…cont. 15. Because I don’t want to lose my athletic eligibility (1) (2) (3) (4) 16. Because I want to prove something to myself (1) (2) (3) (4) 17. Because I want to outdo my classmates and friends (1) (2) (3) (4) MY TOP REASONS FOR NOT TRYING IN SCHOOL ARE… 18. I have no time to study because of work and family obligations (1) (2) (3) (4) 19. I have no time to study because of sports and school activities (1) (2) (3) (4) 20. I would rather go out or hang out with my friends (1) (2) (3) (4) 21. The facilities at school are not conducive to study (1) (2) (3) (4) 22. My house is always noisy (1) (2) (3) (4) 23. I can get by just fine without studying (1) (2) (3) (4) 24. I would not do well in this class anyway (1) (2) (3) (4) 25. I’ll never remember or use the content of this class later on (1) (2) (3) (4) 26. I hate this course (1) (2) (3) (4) 27. My teacher is “cool” or “easy” (1) (2) (3) (4) 28. Doing class work is boring and is a waste of my time (1) (2) (3) (4) 29. I never get any recognition from my parents for doing well (1) (2) (3) (4) 30. I never get any recognition from my teachers for doing well (1) (2) (3) (4) Adapted from: Ryan, R. M., & Connell, J. P. (1989). Perceived locus of causality and internalization: Examining reasons for acting in two domains. Journal of Personality and Social Psychology, 57, 749-761.
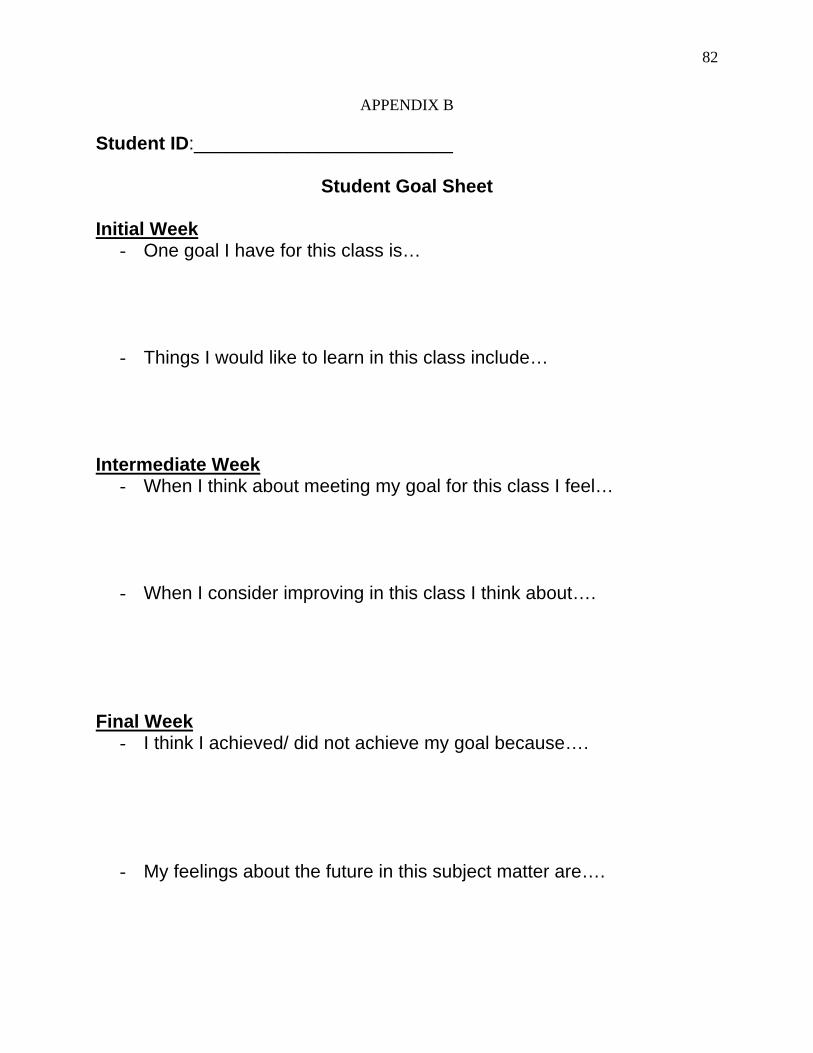
82
APPENDIX B
Student ID:_________________________
Student Goal Sheet
Initial Week - One goal I have for this class is…
- Things I would like to learn in this class include… Intermediate Week
- When I think about meeting my goal for this class I feel…
- When I consider improving in this class I think about….
Final Week
- I think I achieved/ did not achieve my goal because….
- My feelings about the future in this subject matter are….

83
APPENDIX C
Sample Teacher Reinforcement and Feedback
1. Nice Work
2. I like what you are doing here
3. I love how hard you are working
4. You should be proud of yourself
5. Great effort
6. Stellar Job
7. Wow
8. I think you are doing great work, what do you think?
9. This is a great product, how do you think you did?
10. Great try
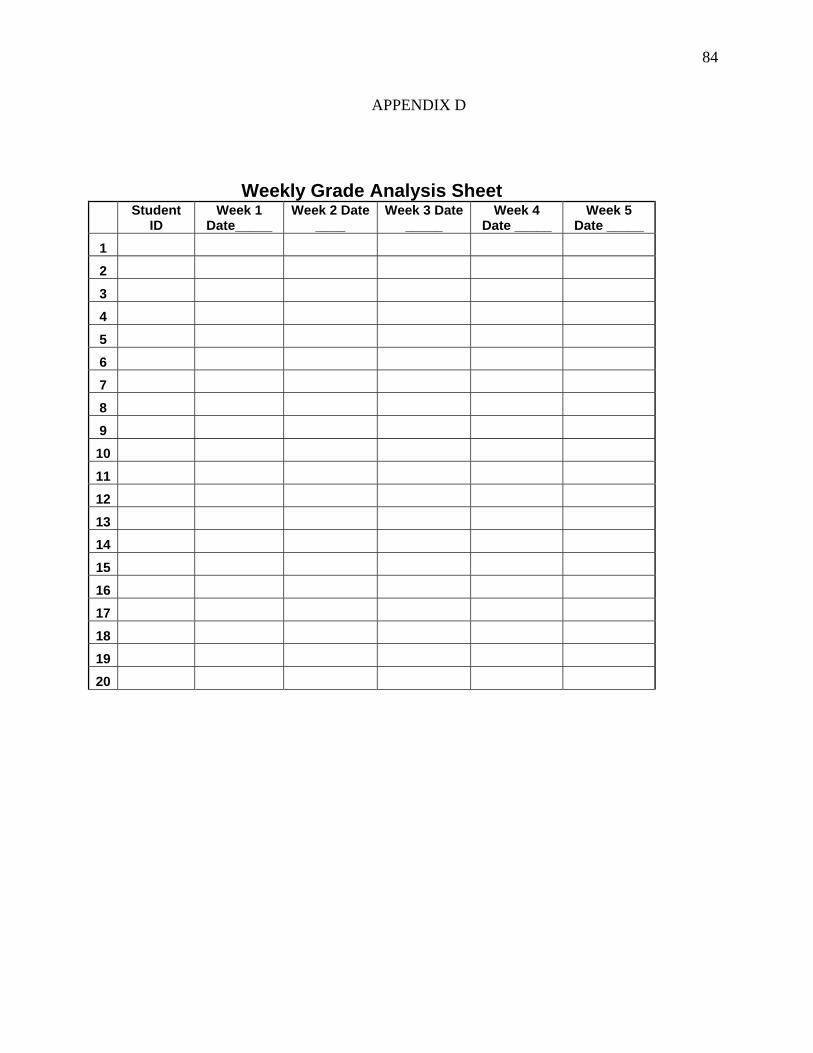
84
APPENDIX D
Weekly Grade Analysis Sheet
Student
ID Week 1
Date_____ Week 2 Date
____ Week 3 Date
_____ Week 4
Date _____ Week 5
Date _____
1
2
3
4
5
6
7
8
9
10
11
12
13
14
15
16
17
18
19
20
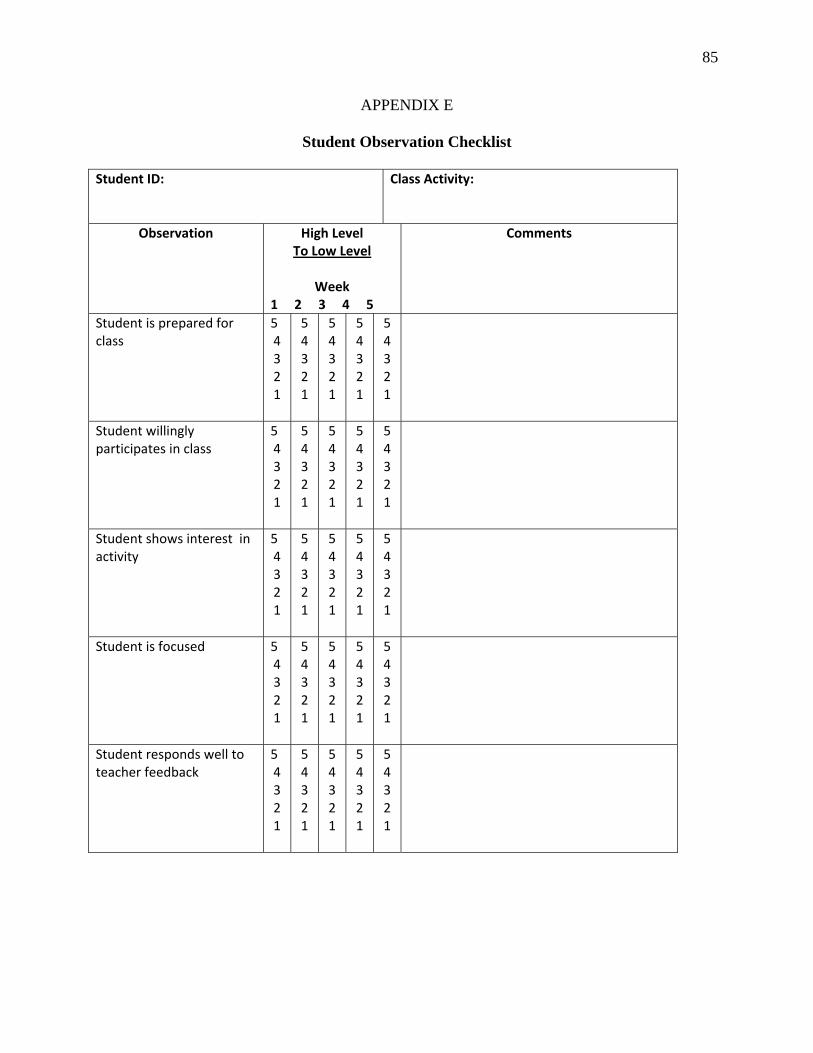
85
APPENDIX E
Student Observation Checklist
Student ID:
Class Activity:
Observation
High Level To Low Level
Week
1 2 3 4 5
Comments
Student is prepared for class
5 4 3 2 1
5 4 3 2 1
5 4 3 2 1
5 4 3 2 1
5 4 3 2 1
Student willingly participates in class
5 4 3 2 1
5 4 3 2 1
5 4 3 2 1
5 4 3 2 1
5 4 3 2 1
Student shows interest in activity
5 4 3 2 1
5 4 3 2 1
5 4 3 2 1
5 4 3 2 1
5 4 3 2 1
Student is focused 5 4 3 2 1
5 4 3 2 1
5 4 3 2 1
5 4 3 2 1
5 4 3 2 1
Student responds well to teacher feedback
5 4 3 2 1
5 4 3 2 1
5 4 3 2 1
5 4 3 2 1
5 4 3 2 1