improving rudder effectiveness with sweeping jet actuatorsemil.io/documents/seele2012aiaa.pdf · 1...
TRANSCRIPT
1
Improving Rudder Effectiveness with Sweeping Jet Actuators
Roman Seele*, Emilio Graff†, Morteza Gharib‡ California Institute of Technology, Pasadena, CA, 91125, USA
Lutz Taubert§ The University of Arizona, Tucson, AZ, 85721, USA
John Lin** and Israel Wygnanski†† NASA Langley Research Center, Hampton, Virginia, 23681, USA
The application of active flow control on a vertical tail of a typical twin engine aircraft was investigated. Sweeping jets installed into the rudder surface were used and their effect was assessed by force measurements, flow visualization and local pressure distributions. The airfoil forming the tail is a NACA 0012 with a rudder using 35% of its chord. The tests were carried out at the Lucas Wind Tunnel at the California Institute of Technology at representative Reynolds numbers of up to Re=1.5 million. Multiple flap deflections and spanwise actuator configurations were tested resulting in an increase of up to 50-70% in side force depending on the free stream velocity and momentum input.
Nomenclature β: Angle of incidence δR: Flap deflection angle [normalized] ρ∞: Free stream density Λ: Sweep back angle AFC: Active Flow Control Anozzle: Total area of all active nozzle exits Aref: Total area of the entire model b: total span width c: total chord length CYn: Normalized side force coefficient relative to baseline of 60% rudder and β=0° CDn: Normalized drag coefficient relative to baseline of 60% rudder and β=0° CP: Pressure Coefficient CQ: Mass Flow coefficient 𝑄
𝐴𝑟𝑒𝑓∗𝑢∞
Cµ: Momentum coefficient 𝐽0.5∗𝐴𝑟𝑒𝑓∗𝜌∞∗𝑢∞
2 = 2 𝐴𝑛𝑜𝑧𝑧𝑙𝑒𝐴𝑟𝑒𝑓
∗ �𝑢𝑗𝑒𝑡𝑢∞�2
J: Jet/Actuation Momentum LE: Leading Edge M: Mach number MAC: Mean aerodynamic chord Re: Reynolds number based on MAC
* Research Associate, Graduate Aerospace Laboratories, [email protected] † Research Project Manager, Graduate Aerospace Laboratories ‡ Professor, Graduate Aerospace Laboratories § Research Assistant Professor, Aerospace and Mechanical Engineering Department ** Senior Research Engineer, Flow Physics and Controls Branch, AIAA Associate Fellow †† IPA, Senior Aerodynamicist, Research Directorate, AIAA Fellow
6th AIAA Flow Control Conference25 - 28 June 2012, New Orleans, Louisiana
AIAA 2012-3244
Copyright © 2012 by the American Institute of Aeronautics and Astronautics, Inc. All rights reserved.
2
Q: Actual volume flow rate of actuation TE: Trailing Edge ujet: Theoretical jet velocity of the sweeping jet at the nozzle u∞: Free stream velocity x': Direction perpendicular to the LE of the vertical stabilizer and the rudder respectively x: Streamwise direction (parallel to free stream) z: Spanwise direction (perpendicular to free stream and tunnel floor)
I. Introduction The size of the vertical tail on a commercial airliner is determined by the eventuality of losing an engine
during takeoff and low speed climb. It is a large surface that is not flight critical under normal conditions although it is indispensible during “engine out” emergency and cross-wind takeoff and landing. The safe landing of the tailless B-52 shown above attests to some of its redundancy. Although seldom used to its full capability, its presence adds drag and weight to the aircraft and thus increasing fuel consumption. Active flow control devices that delay flow separation over a highly deflected rudder may enable a smaller rudder to provide the control authority needed during emergency. The present experiment was initiated to establish the efficacy of such system.
The capabilities of Active Flow Control have been demonstrated on airplane and component models in laboratory environment. In few instances they were demonstrated in flight and in even fewer they were actually used on military airplanes but they were not incorporated into a commercial airliner. The reasons given are many but the popular beliefs focus on the complexity, reliability and weight of the actuation system and on its appetite for power.
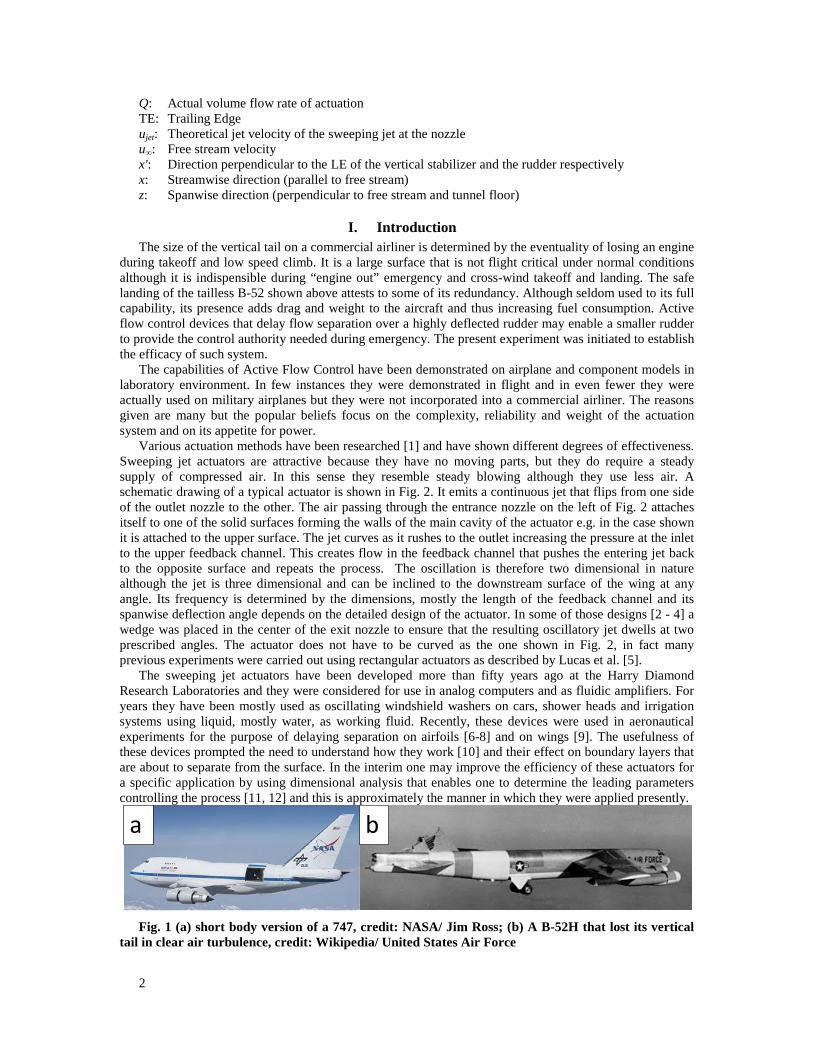
Various actuation methods have been researched [1] and have shown different degrees of effectiveness. Sweeping jet actuators are attractive because they have no moving parts, but they do require a steady supply of compressed air. In this sense they resemble steady blowing although they use less air. A schematic drawing of a typical actuator is shown in Fig. 2. It emits a continuous jet that flips from one side of the outlet nozzle to the other. The air passing through the entrance nozzle on the left of Fig. 2 attaches itself to one of the solid surfaces forming the walls of the main cavity of the actuator e.g. in the case shown it is attached to the upper surface. The jet curves as it rushes to the outlet increasing the pressure at the inlet to the upper feedback channel. This creates flow in the feedback channel that pushes the entering jet back to the opposite surface and repeats the process. The oscillation is therefore two dimensional in nature although the jet is three dimensional and can be inclined to the downstream surface of the wing at any angle. Its frequency is determined by the dimensions, mostly the length of the feedback channel and its spanwise deflection angle depends on the detailed design of the actuator. In some of those designs [2 - 4] a wedge was placed in the center of the exit nozzle to ensure that the resulting oscillatory jet dwells at two prescribed angles. The actuator does not have to be curved as the one shown in Fig. 2, in fact many previous experiments were carried out using rectangular actuators as described by Lucas et al. [5].
The sweeping jet actuators have been developed more than fifty years ago at the Harry Diamond Research Laboratories and they were considered for use in analog computers and as fluidic amplifiers. For years they have been mostly used as oscillating windshield washers on cars, shower heads and irrigation systems using liquid, mostly water, as working fluid. Recently, these devices were used in aeronautical experiments for the purpose of delaying separation on airfoils [6-8] and on wings [9]. The usefulness of these devices prompted the need to understand how they work [10] and their effect on boundary layers that are about to separate from the surface. In the interim one may improve the efficiency of these actuators for a specific application by using dimensional analysis that enables one to determine the leading parameters controlling the process [11, 12] and this is approximately the manner in which they were applied presently.
Fig. 1 (a) short body version of a 747, credit: NASA/ Jim Ross; (b) A B-52H that lost its vertical
tail in clear air turbulence, credit: Wikipedia/ United States Air Force
ba
3
Fig. 2 Conceptual design of sweeping jet actuator [13]
In this experiment we follow the path of Rathay et al [14] who applied synthetic jet actuators to a typical vertical stabilizer of a commercial airplane model. Their actuators were placed in a linear array next to the hinge of the rudder for the purpose of attaching the flow over the rudder surface at large rudder deflection angles, thereby increasing its effectiveness.
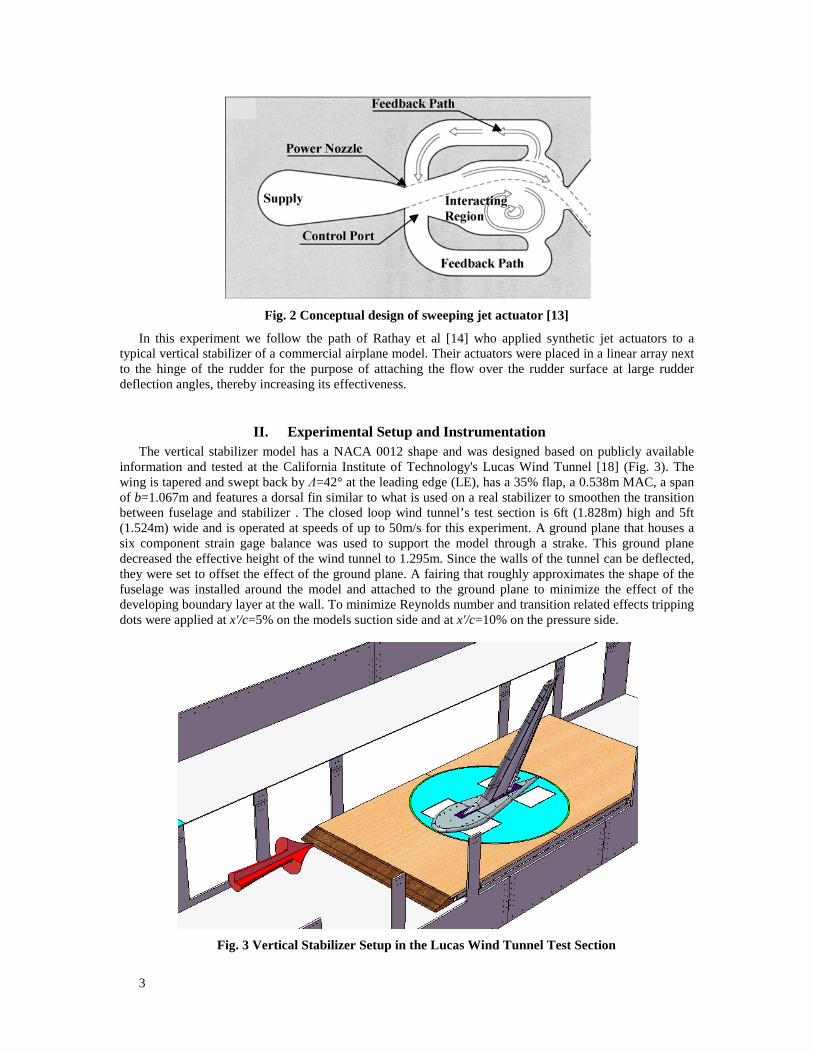
II. Experimental Setup and Instrumentation The vertical stabilizer model has a NACA 0012 shape and was designed based on publicly available
information and tested at the California Institute of Technology's Lucas Wind Tunnel [18] (Fig. 3). The wing is tapered and swept back by Λ=42° at the leading edge (LE), has a 35% flap, a 0.538m MAC, a span of b=1.067m and features a dorsal fin similar to what is used on a real stabilizer to smoothen the transition between fuselage and stabilizer . The closed loop wind tunnel’s test section is 6ft (1.828m) high and 5ft (1.524m) wide and is operated at speeds of up to 50m/s for this experiment. A ground plane that houses a six component strain gage balance was used to support the model through a strake. This ground plane decreased the effective height of the wind tunnel to 1.295m. Since the walls of the tunnel can be deflected, they were set to offset the effect of the ground plane. A fairing that roughly approximates the shape of the fuselage was installed around the model and attached to the ground plane to minimize the effect of the developing boundary layer at the wall. To minimize Reynolds number and transition related effects tripping dots were applied at x'/c=5% on the models suction side and at x'/c=10% on the pressure side.
Fig. 3 Vertical Stabilizer Setup in the Lucas Wind Tunnel Test Section
4
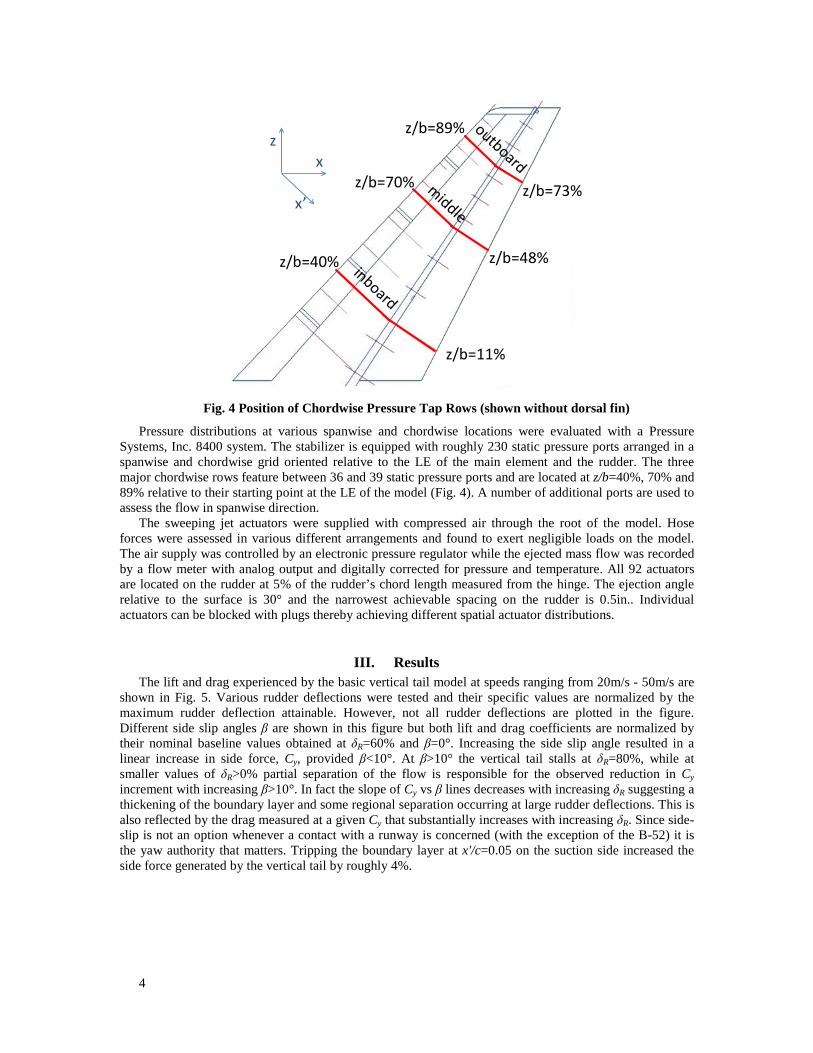
Fig. 4 Position of Chordwise Pressure Tap Rows (shown without dorsal fin)
Pressure distributions at various spanwise and chordwise locations were evaluated with a Pressure Systems, Inc. 8400 system. The stabilizer is equipped with roughly 230 static pressure ports arranged in a spanwise and chordwise grid oriented relative to the LE of the main element and the rudder. The three major chordwise rows feature between 36 and 39 static pressure ports and are located at z/b=40%, 70% and 89% relative to their starting point at the LE of the model (Fig. 4). A number of additional ports are used to assess the flow in spanwise direction.
The sweeping jet actuators were supplied with compressed air through the root of the model. Hose forces were assessed in various different arrangements and found to exert negligible loads on the model. The air supply was controlled by an electronic pressure regulator while the ejected mass flow was recorded by a flow meter with analog output and digitally corrected for pressure and temperature. All 92 actuators are located on the rudder at 5% of the rudder’s chord length measured from the hinge. The ejection angle relative to the surface is 30° and the narrowest achievable spacing on the rudder is 0.5in.. Individual actuators can be blocked with plugs thereby achieving different spatial actuator distributions.
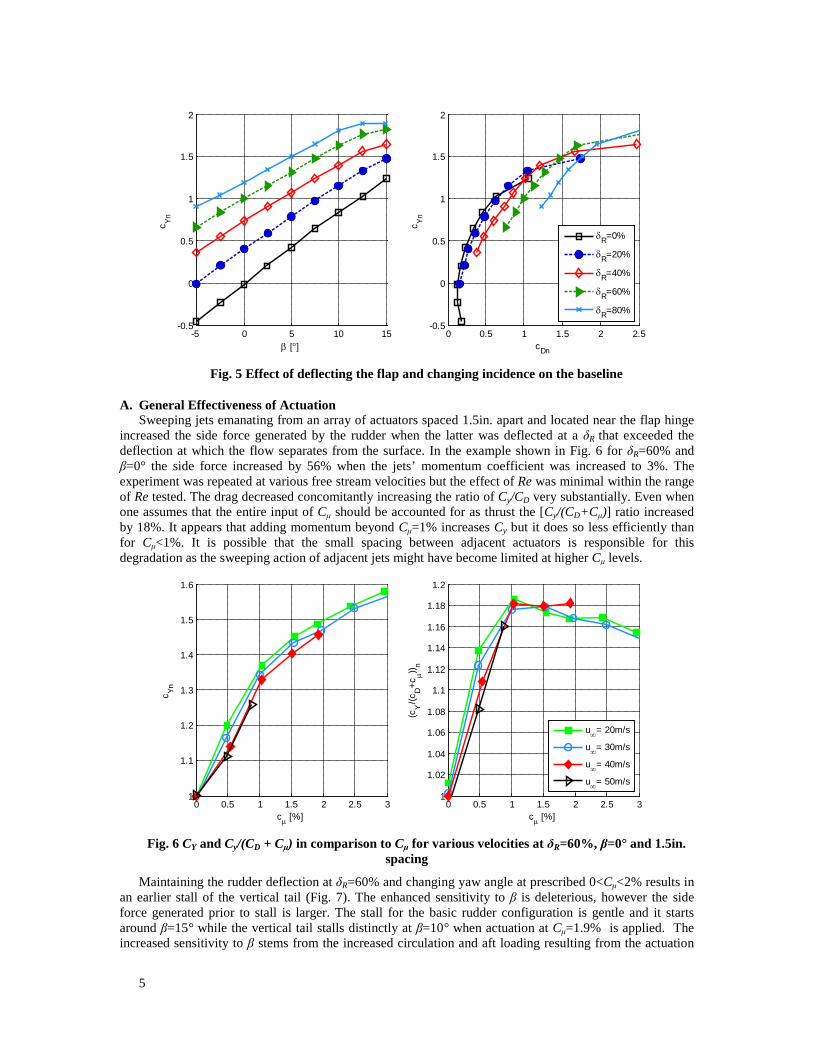
III. Results The lift and drag experienced by the basic vertical tail model at speeds ranging from 20m/s - 50m/s are
shown in Fig. 5. Various rudder deflections were tested and their specific values are normalized by the maximum rudder deflection attainable. However, not all rudder deflections are plotted in the figure. Different side slip angles β are shown in this figure but both lift and drag coefficients are normalized by their nominal baseline values obtained at δR=60% and β=0°. Increasing the side slip angle resulted in a linear increase in side force, Cy, provided β<10°. At β>10° the vertical tail stalls at δR=80%, while at smaller values of δR>0% partial separation of the flow is responsible for the observed reduction in Cy increment with increasing β>10°. In fact the slope of Cy vs β lines decreases with increasing δR suggesting a thickening of the boundary layer and some regional separation occurring at large rudder deflections. This is also reflected by the drag measured at a given Cy that substantially increases with increasing δR. Since side-slip is not an option whenever a contact with a runway is concerned (with the exception of the B-52) it is the yaw authority that matters. Tripping the boundary layer at x'/c=0.05 on the suction side increased the side force generated by the vertical tail by roughly 4%.
z/b=40%
z/b=70%
z/b=89%
z/b=11%
z/b=48%
z/b=73%
zx
x’
5
Fig. 5 Effect of deflecting the flap and changing incidence on the baseline
A. General Effectiveness of Actuation Sweeping jets emanating from an array of actuators spaced 1.5in. apart and located near the flap hinge
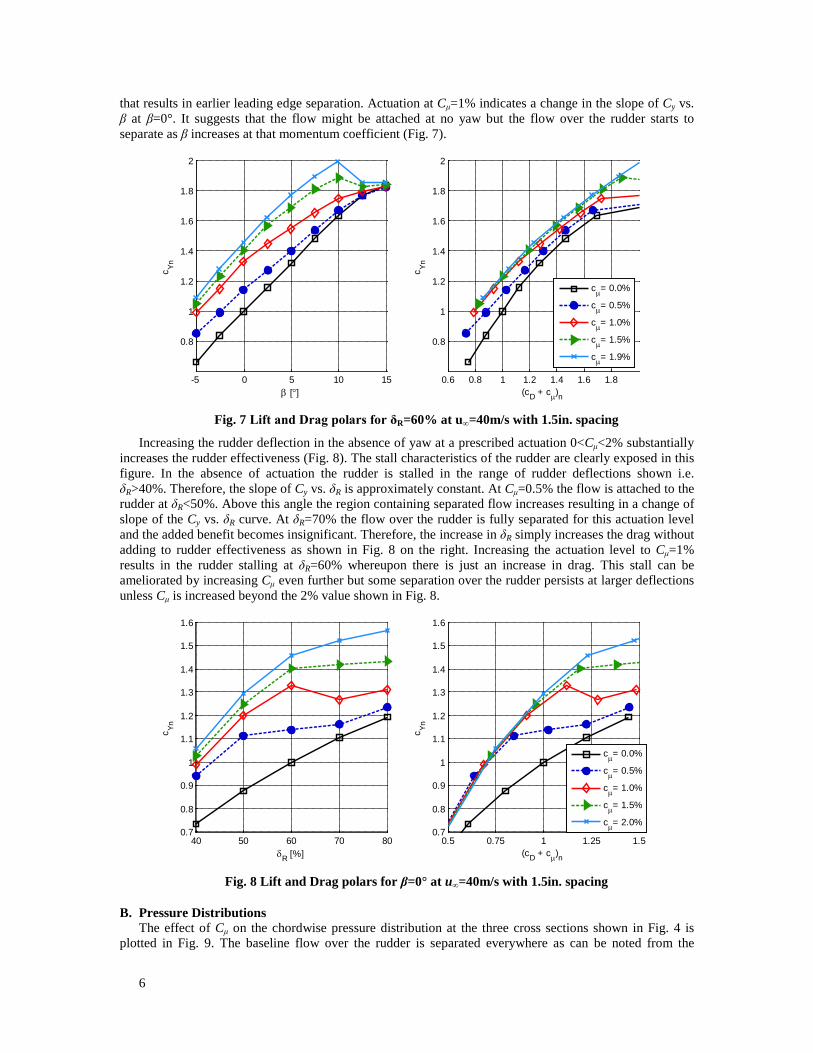
increased the side force generated by the rudder when the latter was deflected at a δR that exceeded the deflection at which the flow separates from the surface. In the example shown in Fig. 6 for δR=60% and β=0° the side force increased by 56% when the jets’ momentum coefficient was increased to 3%. The experiment was repeated at various free stream velocities but the effect of Re was minimal within the range of Re tested. The drag decreased concomitantly increasing the ratio of Cy/CD very substantially. Even when one assumes that the entire input of Cμ should be accounted for as thrust the [Cy/(CD+Cμ)] ratio increased by 18%. It appears that adding momentum beyond Cμ=1% increases Cy but it does so less efficiently than for Cμ<1%. It is possible that the small spacing between adjacent actuators is responsible for this degradation as the sweeping action of adjacent jets might have become limited at higher Cμ levels.
Fig. 6 CY and Cy/(CD + Cμ) in comparison to Cμ for various velocities at δR=60%, β=0° and 1.5in.
spacing
Maintaining the rudder deflection at δR=60% and changing yaw angle at prescribed 0<Cμ<2% results in an earlier stall of the vertical tail (Fig. 7). The enhanced sensitivity to β is deleterious, however the side force generated prior to stall is larger. The stall for the basic rudder configuration is gentle and it starts around β=15° while the vertical tail stalls distinctly at β=10° when actuation at Cμ=1.9% is applied. The increased sensitivity to β stems from the increased circulation and aft loading resulting from the actuation
-5 0 5 10 15-0.5
0
0.5
1
1.5
2
β [°]
c Yn
0 0.5 1 1.5 2 2.5-0.5
0
0.5
1
1.5
2
cDn
c Yn
δR=0%
δR=20%
δR=40%
δR=60%
δR=80%
0 0.5 1 1.5 2 2.5 31
1.1
1.2
1.3
1.4
1.5
1.6
cµ [%]
c Yn
0 0.5 1 1.5 2 2.5 31
1.02
1.04
1.06
1.08
1.1
1.12
1.14
1.16
1.18
1.2
cµ [%]
(cY
/(cD+c
µ)) n
u∞= 20m/s
u∞= 30m/s
u∞= 40m/s
u∞= 50m/s
6
that results in earlier leading edge separation. Actuation at Cμ=1% indicates a change in the slope of Cy vs. β at β=0°. It suggests that the flow might be attached at no yaw but the flow over the rudder starts to separate as β increases at that momentum coefficient (Fig. 7).
Fig. 7 Lift and Drag polars for δR=60% at u∞=40m/s with 1.5in. spacing
Increasing the rudder deflection in the absence of yaw at a prescribed actuation 0<Cμ<2% substantially increases the rudder effectiveness (Fig. 8). The stall characteristics of the rudder are clearly exposed in this figure. In the absence of actuation the rudder is stalled in the range of rudder deflections shown i.e. δR>40%. Therefore, the slope of Cy vs. δR is approximately constant. At Cμ=0.5% the flow is attached to the rudder at δR<50%. Above this angle the region containing separated flow increases resulting in a change of slope of the Cy vs. δR curve. At δR=70% the flow over the rudder is fully separated for this actuation level and the added benefit becomes insignificant. Therefore, the increase in δR simply increases the drag without adding to rudder effectiveness as shown in Fig. 8 on the right. Increasing the actuation level to Cμ=1% results in the rudder stalling at δR=60% whereupon there is just an increase in drag. This stall can be ameliorated by increasing Cμ even further but some separation over the rudder persists at larger deflections unless Cμ is increased beyond the 2% value shown in Fig. 8.
Fig. 8 Lift and Drag polars for β=0° at u∞=40m/s with 1.5in. spacing
B. Pressure Distributions The effect of Cμ on the chordwise pressure distribution at the three cross sections shown in Fig. 4 is
plotted in Fig. 9. The baseline flow over the rudder is separated everywhere as can be noted from the
-5 0 5 10 15
0.8
1
1.2
1.4
1.6
1.8
2
β [°]
c Yn
0.6 0.8 1 1.2 1.4 1.6 1.8
0.8
1
1.2
1.4
1.6
1.8
2
(cD + cµ)n
c Yn
cµ= 0.0%
cµ= 0.5%
cµ= 1.0%
cµ= 1.5%
cµ= 1.9%
40 50 60 70 800.7
0.8
0.9
1
1.1
1.2
1.3
1.4
1.5
1.6
δR [%]
c Yn
0.5 0.75 1 1.25 1.50.7
0.8
0.9
1
1.1
1.2
1.3
1.4
1.5
1.6
(cD + cµ)n
c Yn
cµ= 0.0%
cµ= 0.5%
cµ= 1.0%
cµ= 1.5%
cµ= 2.0%

7
constancy of Cp on the suction side of the rudder and the large disparity between the trailing edge values of Cp recorded on the suction and pressure sides. Deflecting the rudder near the juncture of the vertical tail and the floor of the tunnel creates a gap between the two surfaces that allows the air to flow from the high pressure side to the lower pressured suction side. This flow generates a strong streamwise vortex that originates near the intersection between the rudder hinge and the floor. It reverses the direction of the spanwise flow over the inboard section of the rudder, creating a pressure distribution that is akin to one that typically characterizes a bubble. Blowing into the core of this vortex changes the pressure within the vortex but it does little to support flow reattachment (Fig. 9). Upstream of the actuation line a somewhat lower pressure is generated by the blowing. This suggests that the best actuation location over the most inboard rudder section might be well upstream of the hinge and may possibly need to be directed differently than the rest of the actuation is in relation to the rudder hinge or the free stream. Keeping the flow attached at the root of the rudder is preferable because the chord of the inboard section of the vertical tail is largest and thus has the largest potential of increasing side force due to its area.
Fig. 9 Chordwise pressure distributions at δR=60%, β=0°, u∞=40m/s and 1.5in. spacing (see Fig. 4)
Fig. 10 Spanwise pressure distributions at various stations, β=0°, u∞=40m/s and 1.5in. spacing
In the middle and outboard sections (Fig. 9), the actuation at Cμ≥1% attaches the flow over the rudder that is deflected at δR=60% while a much higher Cμ is required to do so inboard. Attaching the flow generates an adverse pressure gradient over the rudder and it brings the pressure coefficients measured on
0 0.2 0.4 0.6 0.8 1
-6
-5
-4
-3
-2
-1
0
1
x/c
c P
cµ= 0.0%
cµ= 0.5%
cµ= 1.0%
cµ= 1.9%
0 0.2 0.4 0.6 0.8 1x/c
0 0.2 0.4 0.6 0.8 1x/c
inboard outboardmiddle
0.2 0.4 0.6 0.8 1
-3
-2.5
-2
-1.5
-1
-0.5
0
z/b
c P
0.2 0.4 0.6 0.8 1
-4
-3
-2
-1
0
1
c P
0.2 0.4 0.6 0.8 1
-1.5
-1
-0.5
0
0.5
z/b
cµ= 0.0%
cµ= 0.5%
cµ= 1.0%
cµ= 1.9%
c) x'/c=0.96
a) x'/c=0
b) x'/c=0.55
8
both surfaces to the same value at the trailing edge i.e. CpTE=0. However, the main contribution to rudder effectiveness comes from the low pressure generated over the upper surface of the vertical stabilizer (i.e. upstream of the rudder hinge line and the location of actuation) at this rudder deflection while the Cp over the pressure side is hardly affected by the actuation. Most obvious is the negative pressure peak near the hinge that is created by the curved streamlines that turn around the solid surface.
Flow attachment over the rudder affects the Cp at the leading edge of the stabilizer reducing the upper surface Cp from Cp= -1 to Cp= -4 at Cμ<2% at δR=60% (Fig. 10a). The effect around the mid chord is smaller but the negative pressure increases with increasing Cμ. At the trailing edge the trend is reversed since attached flow at this location implies that Cp≈0 (Fig.10c).
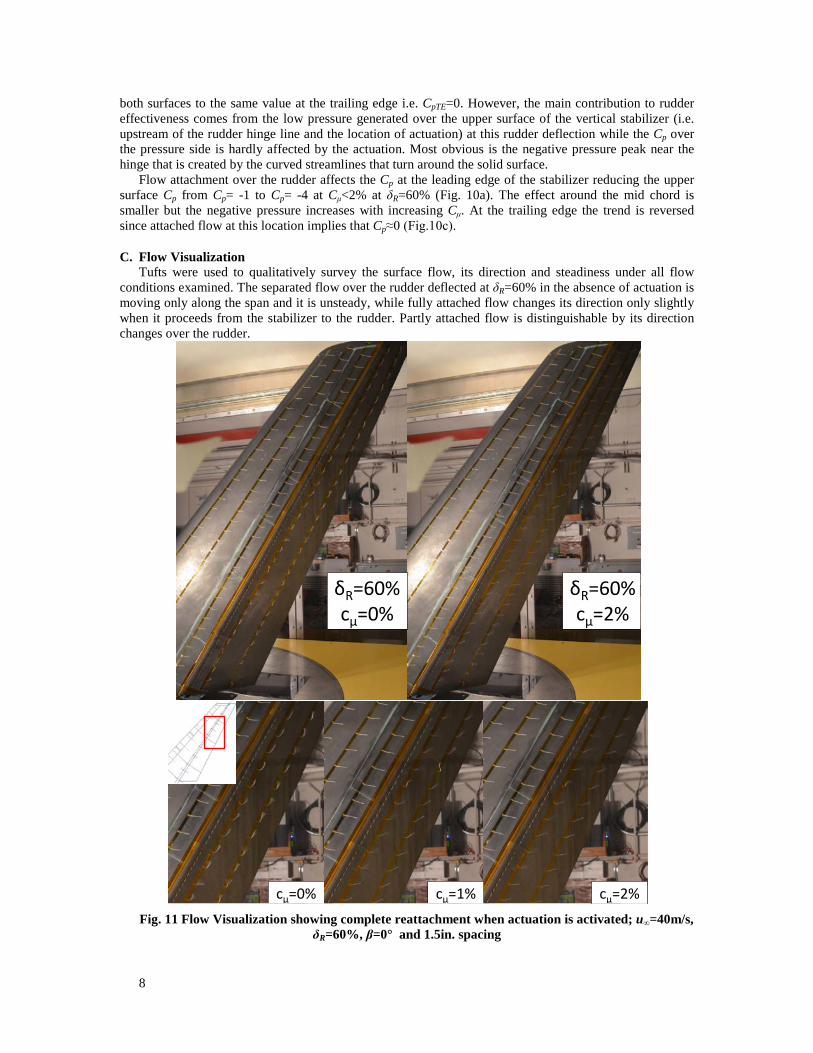
C. Flow Visualization Tufts were used to qualitatively survey the surface flow, its direction and steadiness under all flow
conditions examined. The separated flow over the rudder deflected at δR=60% in the absence of actuation is moving only along the span and it is unsteady, while fully attached flow changes its direction only slightly when it proceeds from the stabilizer to the rudder. Partly attached flow is distinguishable by its direction changes over the rudder.
Fig. 11 Flow Visualization showing complete reattachment when actuation is activated; u∞=40m/s,
δR=60%, β=0° and 1.5in. spacing
δR=60%cμ=0%
δR=60%cμ=2%
cμ=0% cμ=1% cμ=2%
9
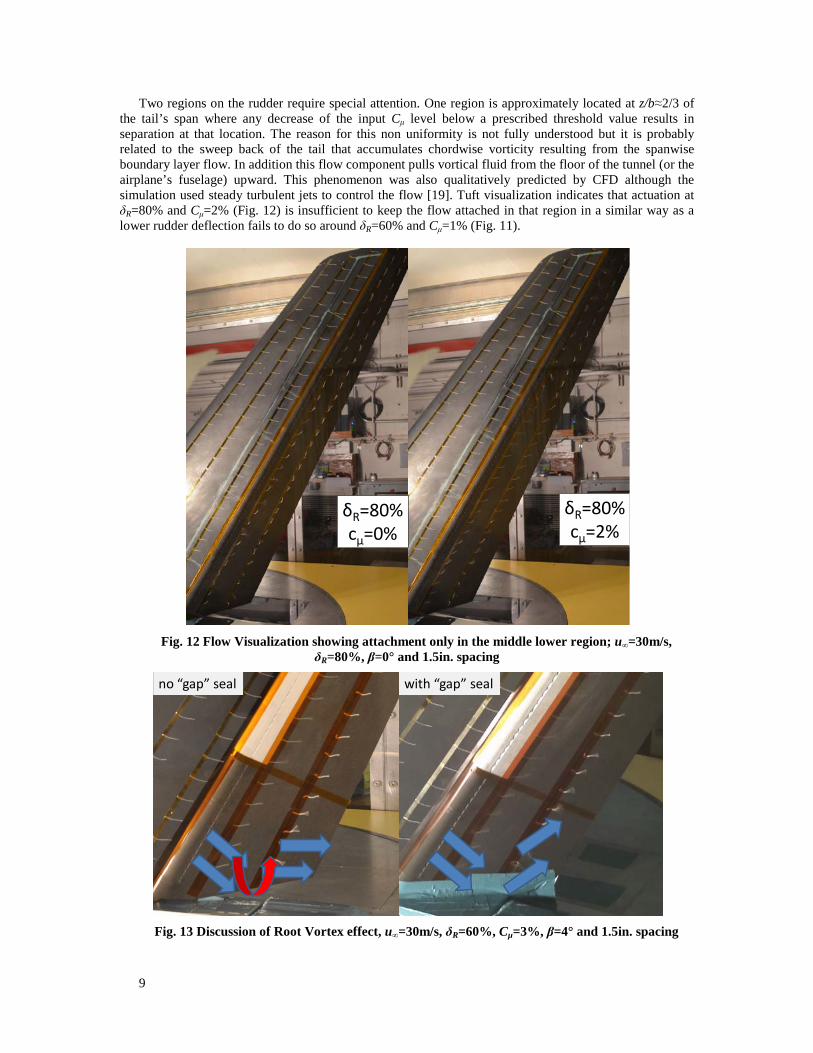
Two regions on the rudder require special attention. One region is approximately located at z/b≈2/3 of the tail’s span where any decrease of the input Cμ level below a prescribed threshold value results in separation at that location. The reason for this non uniformity is not fully understood but it is probably related to the sweep back of the tail that accumulates chordwise vorticity resulting from the spanwise boundary layer flow. In addition this flow component pulls vortical fluid from the floor of the tunnel (or the airplane’s fuselage) upward. This phenomenon was also qualitatively predicted by CFD although the simulation used steady turbulent jets to control the flow [19]. Tuft visualization indicates that actuation at δR=80% and Cμ=2% (Fig. 12) is insufficient to keep the flow attached in that region in a similar way as a lower rudder deflection fails to do so around δR=60% and Cμ=1% (Fig. 11).
Fig. 12 Flow Visualization showing attachment only in the middle lower region; u∞=30m/s,
δR=80%, β=0° and 1.5in. spacing
Fig. 13 Discussion of Root Vortex effect, u∞=30m/s, δR=60%, Cµ=3%, β=4° and 1.5in. spacing
δR=80%cμ=0%
δR=80%cμ=2%
no “gap” seal with “gap” seal
10
A second region of significance is at the rudder root where a strong streamwise vortex persists regardless of actuation input (Fig. 13). This phenomenon was discussed in conjunction with the pressure distribution in the root region (Fig. 9). Blocking the gap is impractical as it cannot be done on the airplane but whenever it was tried it was shown to have a deleterious effect. It appears that the high speed jets emanating from the actuators are redirected in the direction of streaming thus pulling the necklace vortex generated by the dorsal fin (or the stabilizer’s leading edge) toward the rudder surface. This effect is weakened by the gap that allows flow to be entrained from the pressure side of the rudder (Fig. 13).
D. Initial Efforts in optimizing performance: Some effects of actuator spacing and spanwise distribution
Throughout this experiment the actuators were located on the rudder (Fig. 11 and Fig. 12), therefore being downstream of the mean flow separation line at larger rudder deflections. The present location was chosen on the basis of Woszidlo et al.'s [11, 12] conclusions based on experiments carried out in two dimensional flow. The main advantage of locating the actuators on the rudder stems from the constancy of the angle formed between the plane in which the jets sweep and the downstream surface. Installing the actuators on the vertical stabilizer increases this injection angle with increasing δR. This has a significant effect on flow reattachment especially when the range of deflection angles is large. For practical rudder applications the range of δR requiring AFC is small, thus an installation of the actuators on the stabilizer might have practical value. The distance between adjacent actuators in this installation was 0.5in. although it was known that this distance is most likely to be too short. The design relied on the possibility of blocking individual actuators thus increasing the distance between adjacent ones at quantum steps of 0.5in..
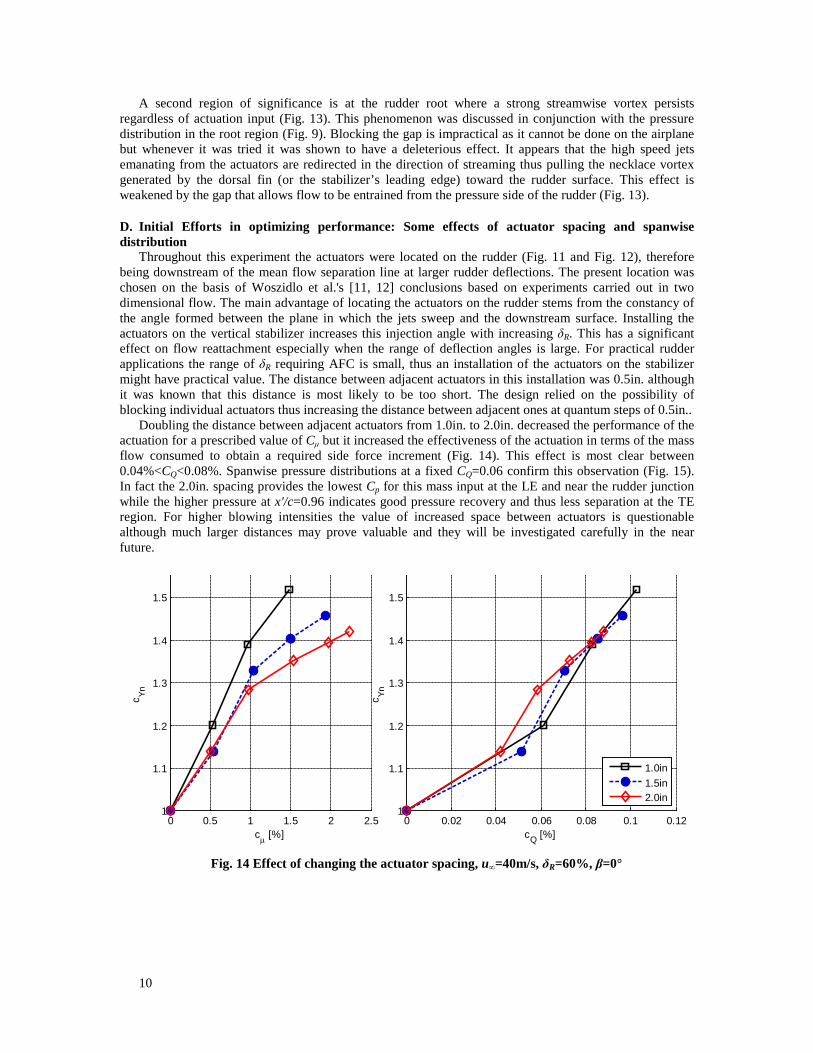
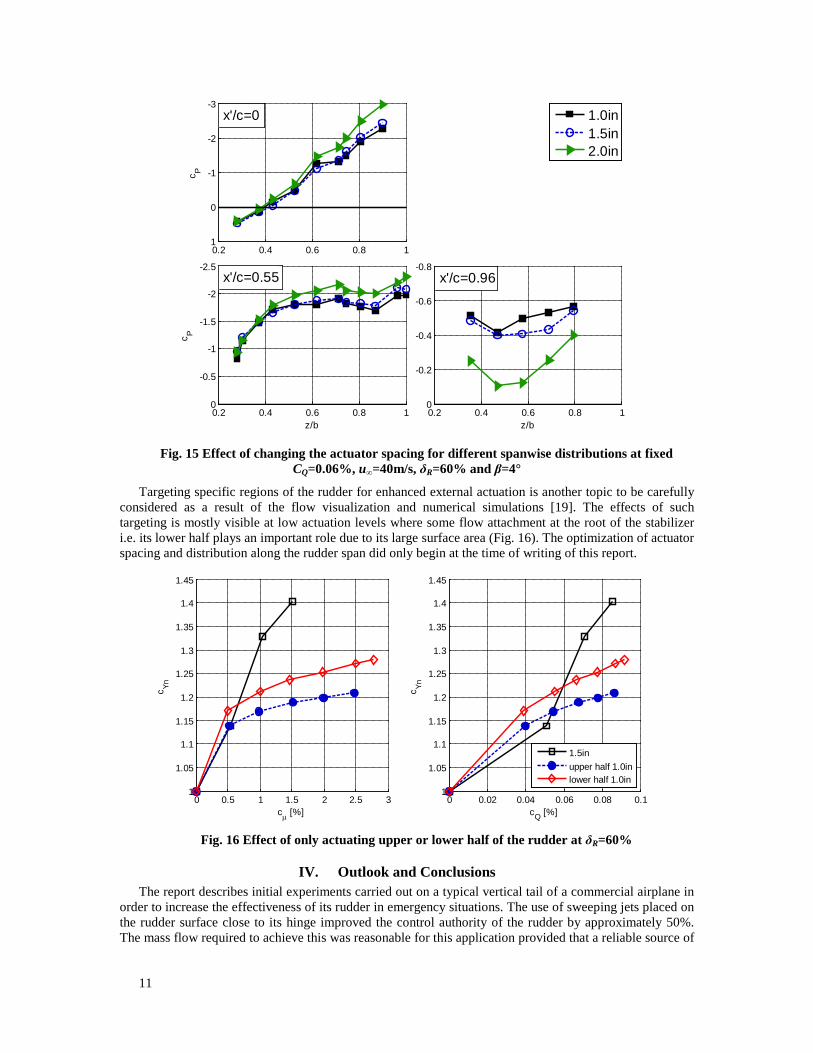
Doubling the distance between adjacent actuators from 1.0in. to 2.0in. decreased the performance of the actuation for a prescribed value of Cμ but it increased the effectiveness of the actuation in terms of the mass flow consumed to obtain a required side force increment (Fig. 14). This effect is most clear between 0.04%<CQ<0.08%. Spanwise pressure distributions at a fixed CQ=0.06 confirm this observation (Fig. 15). In fact the 2.0in. spacing provides the lowest Cp for this mass input at the LE and near the rudder junction while the higher pressure at x'/c=0.96 indicates good pressure recovery and thus less separation at the TE region. For higher blowing intensities the value of increased space between actuators is questionable although much larger distances may prove valuable and they will be investigated carefully in the near future.
Fig. 14 Effect of changing the actuator spacing, u∞=40m/s, δR=60%, β=0°
0 0.5 1 1.5 2 2.51
1.1
1.2
1.3
1.4
1.5
cµ [%]
c Yn
0 0.02 0.04 0.06 0.08 0.1 0.121
1.1
1.2
1.3
1.4
1.5
cQ [%]
c Yn
1.0in1.5in2.0in
11
Fig. 15 Effect of changing the actuator spacing for different spanwise distributions at fixed
CQ=0.06%, u∞=40m/s, δR=60% and β=4°
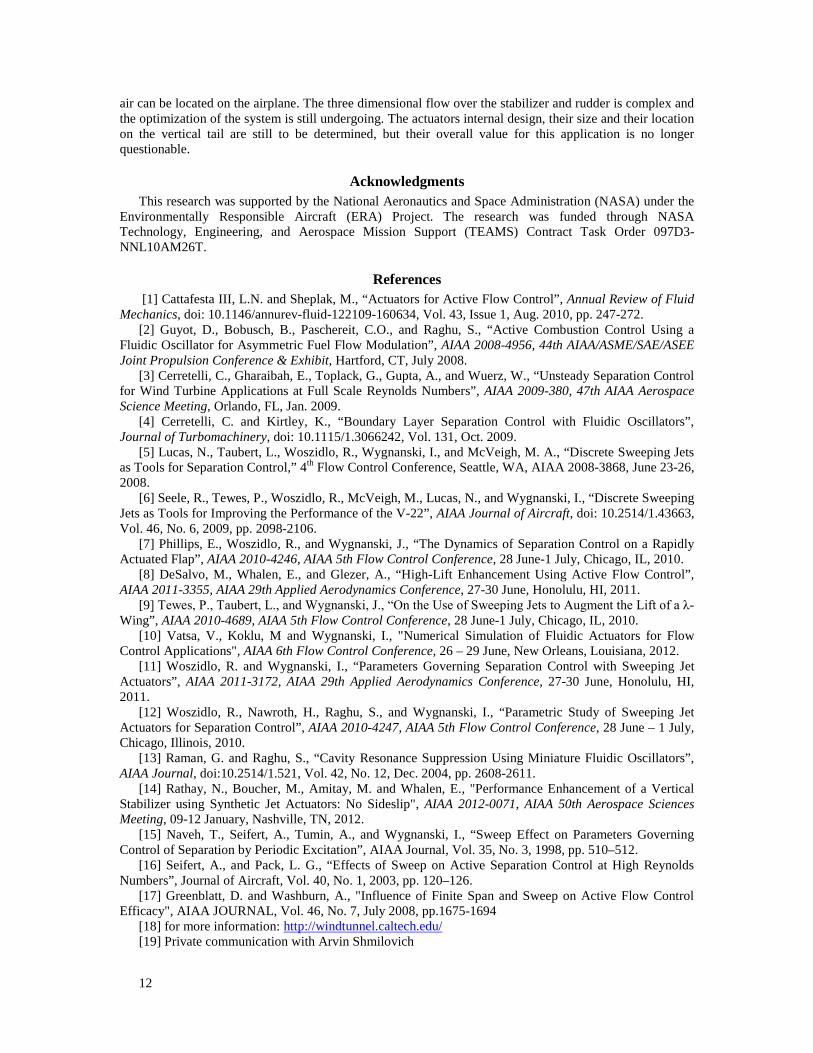
Targeting specific regions of the rudder for enhanced external actuation is another topic to be carefully considered as a result of the flow visualization and numerical simulations [19]. The effects of such targeting is mostly visible at low actuation levels where some flow attachment at the root of the stabilizer i.e. its lower half plays an important role due to its large surface area (Fig. 16). The optimization of actuator spacing and distribution along the rudder span did only begin at the time of writing of this report.
Fig. 16 Effect of only actuating upper or lower half of the rudder at δR=60%
IV. Outlook and Conclusions The report describes initial experiments carried out on a typical vertical tail of a commercial airplane in
order to increase the effectiveness of its rudder in emergency situations. The use of sweeping jets placed on the rudder surface close to its hinge improved the control authority of the rudder by approximately 50%. The mass flow required to achieve this was reasonable for this application provided that a reliable source of
0.2 0.4 0.6 0.8 1
-3
-2
-1
0
1
c P
0.2 0.4 0.6 0.8 1
-2.5
-2
-1.5
-1
-0.5
0
z/b
c P
0.2 0.4 0.6 0.8 1
-0.8
-0.6
-0.4
-0.2
0
z/b
1.0in1.5in2.0in
x'/c=0.55 x'/c=0.96
x'/c=0
0 0.5 1 1.5 2 2.5 31
1.05
1.1
1.15
1.2
1.25
1.3
1.35
1.4
1.45
cµ [%]
c Yn
0 0.02 0.04 0.06 0.08 0.11
1.05
1.1
1.15
1.2
1.25
1.3
1.35
1.4
1.45
cQ [%]
c Yn
1.5inupper half 1.0inlower half 1.0in
12
air can be located on the airplane. The three dimensional flow over the stabilizer and rudder is complex and the optimization of the system is still undergoing. The actuators internal design, their size and their location on the vertical tail are still to be determined, but their overall value for this application is no longer questionable.
Acknowledgments This research was supported by the National Aeronautics and Space Administration (NASA) under the
Environmentally Responsible Aircraft (ERA) Project. The research was funded through NASA Technology, Engineering, and Aerospace Mission Support (TEAMS) Contract Task Order 097D3-NNL10AM26T.
References [1] Cattafesta III, L.N. and Sheplak, M., “Actuators for Active Flow Control”, Annual Review of Fluid
Mechanics, doi: 10.1146/annurev-fluid-122109-160634, Vol. 43, Issue 1, Aug. 2010, pp. 247-272. [2] Guyot, D., Bobusch, B., Paschereit, C.O., and Raghu, S., “Active Combustion Control Using a
Fluidic Oscillator for Asymmetric Fuel Flow Modulation”, AIAA 2008-4956, 44th AIAA/ASME/SAE/ASEE Joint Propulsion Conference & Exhibit, Hartford, CT, July 2008.
[3] Cerretelli, C., Gharaibah, E., Toplack, G., Gupta, A., and Wuerz, W., “Unsteady Separation Control for Wind Turbine Applications at Full Scale Reynolds Numbers”, AIAA 2009-380, 47th AIAA Aerospace Science Meeting, Orlando, FL, Jan. 2009.
[4] Cerretelli, C. and Kirtley, K., “Boundary Layer Separation Control with Fluidic Oscillators”, Journal of Turbomachinery, doi: 10.1115/1.3066242, Vol. 131, Oct. 2009.
[5] Lucas, N., Taubert, L., Woszidlo, R., Wygnanski, I., and McVeigh, M. A., “Discrete Sweeping Jets as Tools for Separation Control,” 4th Flow Control Conference, Seattle, WA, AIAA 2008-3868, June 23-26, 2008.
[6] Seele, R., Tewes, P., Woszidlo, R., McVeigh, M., Lucas, N., and Wygnanski, I., “Discrete Sweeping Jets as Tools for Improving the Performance of the V-22”, AIAA Journal of Aircraft, doi: 10.2514/1.43663, Vol. 46, No. 6, 2009, pp. 2098-2106.
[7] Phillips, E., Woszidlo, R., and Wygnanski, J., “The Dynamics of Separation Control on a Rapidly Actuated Flap”, AIAA 2010-4246, AIAA 5th Flow Control Conference, 28 June-1 July, Chicago, IL, 2010.
[8] DeSalvo, M., Whalen, E., and Glezer, A., “High-Lift Enhancement Using Active Flow Control”, AIAA 2011-3355, AIAA 29th Applied Aerodynamics Conference, 27-30 June, Honolulu, HI, 2011.
[9] Tewes, P., Taubert, L., and Wygnanski, J., “On the Use of Sweeping Jets to Augment the Lift of a λ-Wing”, AIAA 2010-4689, AIAA 5th Flow Control Conference, 28 June-1 July, Chicago, IL, 2010.
[10] Vatsa, V., Koklu, M and Wygnanski, I., "Numerical Simulation of Fluidic Actuators for Flow Control Applications", AIAA 6th Flow Control Conference, 26 – 29 June, New Orleans, Louisiana, 2012.
[11] Woszidlo, R. and Wygnanski, I., “Parameters Governing Separation Control with Sweeping Jet Actuators”, AIAA 2011-3172, AIAA 29th Applied Aerodynamics Conference, 27-30 June, Honolulu, HI, 2011.
[12] Woszidlo, R., Nawroth, H., Raghu, S., and Wygnanski, I., “Parametric Study of Sweeping Jet Actuators for Separation Control”, AIAA 2010-4247, AIAA 5th Flow Control Conference, 28 June – 1 July, Chicago, Illinois, 2010.
[13] Raman, G. and Raghu, S., “Cavity Resonance Suppression Using Miniature Fluidic Oscillators”, AIAA Journal, doi:10.2514/1.521, Vol. 42, No. 12, Dec. 2004, pp. 2608-2611.
[14] Rathay, N., Boucher, M., Amitay, M. and Whalen, E., "Performance Enhancement of a Vertical Stabilizer using Synthetic Jet Actuators: No Sideslip", AIAA 2012-0071, AIAA 50th Aerospace Sciences Meeting, 09-12 January, Nashville, TN, 2012.
[15] Naveh, T., Seifert, A., Tumin, A., and Wygnanski, I., “Sweep Effect on Parameters Governing Control of Separation by Periodic Excitation”, AIAA Journal, Vol. 35, No. 3, 1998, pp. 510–512.
[16] Seifert, A., and Pack, L. G., “Effects of Sweep on Active Separation Control at High Reynolds Numbers”, Journal of Aircraft, Vol. 40, No. 1, 2003, pp. 120–126.
[17] Greenblatt, D. and Washburn, A., "Influence of Finite Span and Sweep on Active Flow Control Efficacy", AIAA JOURNAL, Vol. 46, No. 7, July 2008, pp.1675-1694
[18] for more information: http://windtunnel.caltech.edu/ [19] Private communication with Arvin Shmilovich