improving quality parameters of steel balls …2. ball wheel depth was ok. 3. gap plate depth was...
TRANSCRIPT

International Research Journal of Engineering and Technology (IRJET) e-ISSN: 2395 -0056
Volume: 03 Issue: 06 | June-2016 www.irjet.net p-ISSN: 2395-0072
© 2016, IRJET | Impact Factor value: 4.45 | ISO 9001:2008 Certified Journal | Page 2297
Improving Quality Parameters of Steel Balls Affecting Noise in Ball
Bearing
Chirag Ashokkumar Gandhi1, Dr. K. N. Vijaykumar2, Frank Crasta3,
1 M.E. Student, Mechanical Engineering, Dwarkadas J. Sanghvi College of Engineering, Mumbai University,
Mumbai, India, 2 Professor and Head, Mechanical Engineering, Dwarkadas J. Sanghvi College of Engineering, India,
3 Assistant Professor, Mechanical Engineering, Dwarkadas J. Sanghvi College of Engineering, Mumbai, India.
---------------------------------------------------------------------***---------------------------------------------------------------------
Abstract - Bearing is a basic work-piece in machinery devices, and surface quality of steel ball is the main factor which affects the precision and longevity of bearing. The quality of steel balls has a substantial influence on bearing performance. In many industries, defects of steel ball are detected manually. It is inefficiency and of high probability of misidentification. The conventional way of measuring steel balls by examining randomly selected specimens owing to the lack of efficient test methods. However, this cannot guarantee that every individual ball meets a certain standard. The traditional measurement is not acceptable in those fields where stability and reliability are highly demanded. An automatic method to measure a steel ball's quality to make exhaustive examination feasible and efficient was investigated. This paper describes the relationship between the surface sphericity, ball size, lot diameter variations, etc. of a steel ball and its vibration level, which is the major criterion to judge the quality of a steel ball and also includes some important quality parameters of steel ball in ball manufacturing.
Key Words: Burn mark, high band, smearing, uneven, scratches.
1. INTRODUCTION
A ball bearing is a type of rolling-element bearing that uses balls to maintain the separation between the bearing races. The purpose of a ball bearing is to reduce rotational friction and support radial and axial loads. It achieves this by using at least two races to contain the balls and transmit the loads through the balls. In most applications, one race is stationary and the other is attached to the rotating assembly (e.g., a hub or shaft). As one of the bearing races rotates it causes the balls to rotate as well. Because the balls are rolling they have a much lower coefficient of friction than if two flat surfaces were sliding against each other. Ball bearings tend to have lower load capacity for their size than other kinds of rolling-element bearings
due to the smaller contact area between the balls and races. However, they can tolerate some misalignment of the inner and outer races.
1.1 Ball Manufacturing Process
Annealing Wire drawing Cold forging Flashing Heat treatment Grinding Lapping Inspection
Fig -1: Ball manufacturing processes
In annealing, steel is heat treated at a high temperature and control cooled to primarily soften

International Research Journal of Engineering and Technology (IRJET) e-ISSN: 2395 -0056
Volume: 03 Issue: 06 | June-2016 www.irjet.net p-ISSN: 2395-0072
© 2016, IRJET | Impact Factor value: 4.45 | ISO 9001:2008 Certified Journal | Page 2298
metal and to simultaneously provide change in microstructure to improve machine ability and facilitation in cold working. In wire drawing, the wire rod is drawn to the required size, in closer tolerances so that it can be used in cold forging. In cold forging, calculated length of wire is sheared and cold forged in a close die to give it the spherical shape. In flashing, the second production step is the rolling between plates with concentric grooves in order to eliminate the heading witness marks and to increase the precision of the ball. In this operation, the spheres are ground between two concentric pressure plates to correct the spherical shape and remove the seam formed in the cold forging. In heat treatment, the balls are heat treated, i.e. hardened and tempered to attain the desired level of hardness and microstructure. The heat treatment, when necessary, gives the maximum possible hardness and the desired microstructure to the ball and therefore the best obtainable technical features in compliance with materials used. In grinding, the hardened balls are ground to improve surface finish and geometrical parameters. Several careful grinding processes with ceramic wheels lead to a higher size precision preparing the balls for the next final lapping operation. Then lapping operation gives the ball a perfect bright, compact surface, without any defect, with a very low surface roughness, very low deviations from spherical form, very low roughness values, very low waviness values and total lack of surface defects assured by optical control machines. These four basic parameters guarantee final customer an extremely qualified product for its relevant use. At last to ensure the highest quality, each and every parameter of the balls is thoroughly inspected before packing and dispatch. All precision, hardness, material features, etc. are tested at every stage of the production and again before shipping, at the end of the manufacturing process, in order to assure and guarantee the quality.
2. LITERATURE REVIEW
Ball bearings are used to provide smooth, low friction motion in rotary applications. Ball bearings are able to provide high performance and long lifetime in order to transfer the load from the balls to the inner races. The balls have minimal contact with the inner and outer races due to their spherical shape and this allows them to spin smoothly [1, 8].
A disadvantage of ball bearings is that the balls can become "flattened" over time with too much pressure on the outer races leading to eventual failure. Therefore it is very important that the load ratings and other parameters are monitored regularly [3, 5].
The main class of bearing problems can be characterized as “distributed” defects, which involve the entire structure of the bearing. It includes surface roughness,
waviness, misaligned races, and off-size rolling elements. These defects often give rise to excessive contact forces, which in turn result in premature surface fatigue and ultimate failure. Tallion and Gustafsson (1965) experimentally explored spectral properties of bearings outer ring vibration as a function of speed, load, waviness, and other geometrical parameters. Sunnersjo (1985) studied the vibration characteristics of the bearings having inner race waviness and varying ball diameter and found that significant peaks occur at the cage speed for a non uniform ball diameter [7, 9].
Yhland (1992) proposed a linear model for the vibrations of the shaft bearing system caused by ball bearing geometric imperfections. These imperfections covered are radial and axial waviness of outer and inner rings, ball waviness, and ball diameter oversize. Aktürk (1999) simulated the effect of bearings surface waviness on the vibration by a computer program [12, 14].
3. DMAIC METHODOLOGY
This section discusses reduction of noise in ball bearing by improving quality of steel balls at New Heaven Bearing (NHB) Ltd., Gujarat (India) using DMAIC cycle.
3.1 Define
The purpose of this step is to clearly articulate the business problem, goal, potential resources, project scope and high-level project timeline. As per project charter, the main objective is to reduce noise in ball bearing by improving quality and eliminating defects from steel ball manufacturing.
3.2 Measure
From the quality data of N.H.B. Ltd. for the pre-dispatch inspection (PDI), the first time through (FTT) trend chart and the defect trend chart are generated.
Chart -1: Pre-dispatch Inspection FTT % trend
75% 72% 82%
76.33%
87.32%
91.10%
0%
20%
40%
60%
80%
100%
FTT
International Research Journal of Engineering and Technology (IRJET) e-ISSN: 2395 -0056
Volume: 03 Issue: 06 | June-2016 www.irjet.net p-ISSN: 2395-0072
© 2016, IRJET | Impact Factor value: 4.45 | ISO 9001:2008 Certified Journal | Page 2299
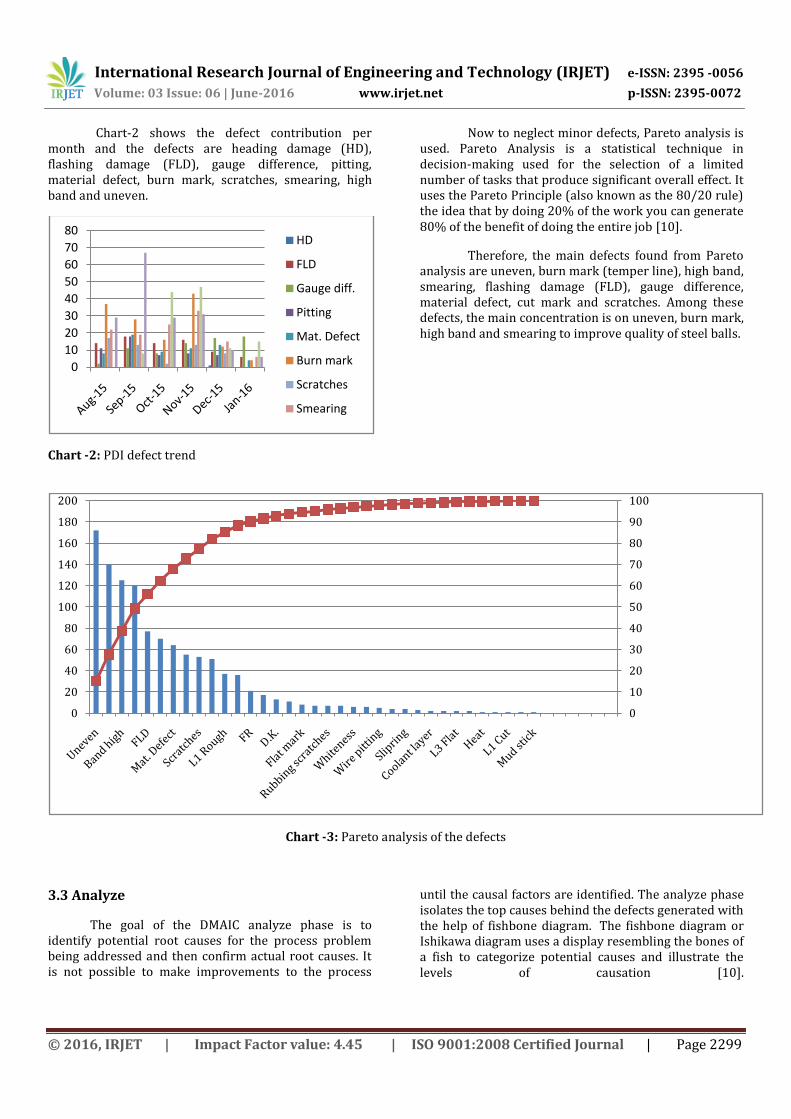
Chart-2 shows the defect contribution per month and the defects are heading damage (HD), flashing damage (FLD), gauge difference, pitting, material defect, burn mark, scratches, smearing, high band and uneven.
Chart -2: PDI defect trend
Now to neglect minor defects, Pareto analysis is used. Pareto Analysis is a statistical technique in decision-making used for the selection of a limited number of tasks that produce significant overall effect. It uses the Pareto Principle (also known as the 80/20 rule) the idea that by doing 20% of the work you can generate 80% of the benefit of doing the entire job [10].
Therefore, the main defects found from Pareto analysis are uneven, burn mark (temper line), high band, smearing, flashing damage (FLD), gauge difference, material defect, cut mark and scratches. Among these defects, the main concentration is on uneven, burn mark, high band and smearing to improve quality of steel balls.
Chart -3: Pareto analysis of the defects
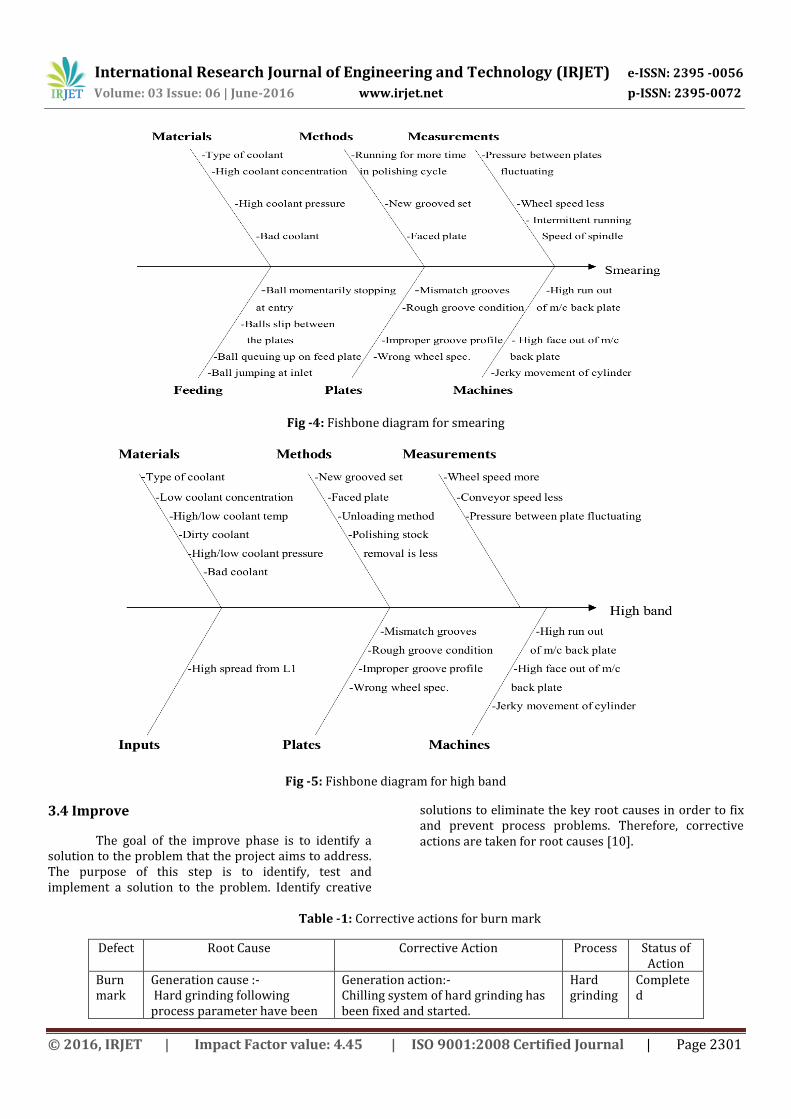
3.3 Analyze
The goal of the DMAIC analyze phase is to identify potential root causes for the process problem being addressed and then confirm actual root causes. It is not possible to make improvements to the process
until the causal factors are identified. The analyze phase isolates the top causes behind the defects generated with the help of fishbone diagram. The fishbone diagram or Ishikawa diagram uses a display resembling the bones of a fish to categorize potential causes and illustrate the levels of causation [10].
0
10
20
30
40
50
60
70
80HD
FLD
Gauge diff.
Pitting
Mat. Defect
Burn mark
Scratches
Smearing
0
10
20
30
40
50
60
70
80
90
100
0
20
40
60
80
100
120
140
160
180
200

International Research Journal of Engineering and Technology (IRJET) e-ISSN: 2395 -0056
Volume: 03 Issue: 06 | June-2016 www.irjet.net p-ISSN: 2395-0072
© 2016, IRJET | Impact Factor value: 4.45 | ISO 9001:2008 Certified Journal | Page 2300
Fig -2: Fishbone diagram for uneven
Fishbone diagram for the defect uneven is shown in fig. 3.4. There are seven major parameters for uneven. They are feeding, materials, methods, inputs, measurements, plates and machines. Potential root causes for each and
every parameter are shown in fig. 3.4. These root causes are the main reason behind the defect uneven. Similarly, the fishbone diagrams for high band, smearing and burn mark were also generated.
Fig -3: Fishbone diagram for burn mark
International Research Journal of Engineering and Technology (IRJET) e-ISSN: 2395 -0056
Volume: 03 Issue: 06 | June-2016 www.irjet.net p-ISSN: 2395-0072
© 2016, IRJET | Impact Factor value: 4.45 | ISO 9001:2008 Certified Journal | Page 2301
Fig -4: Fishbone diagram for smearing
Fig -5: Fishbone diagram for high band
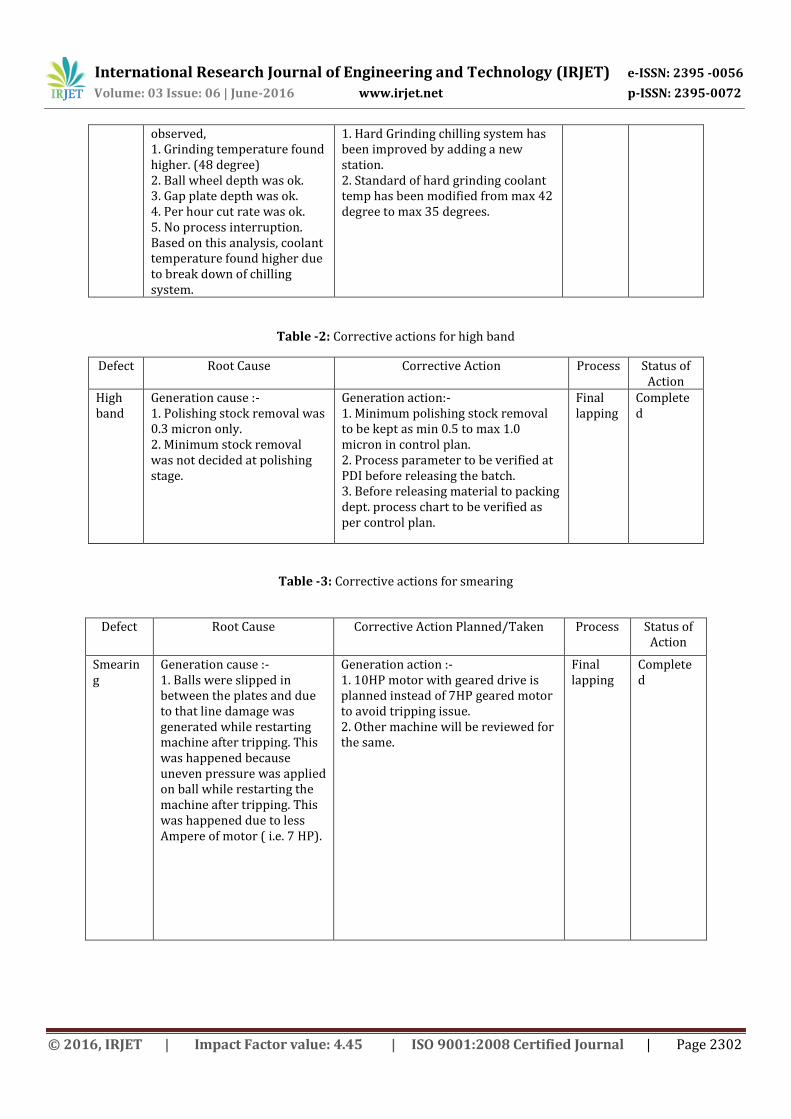
3.4 Improve
The goal of the improve phase is to identify a solution to the problem that the project aims to address. The purpose of this step is to identify, test and implement a solution to the problem. Identify creative
solutions to eliminate the key root causes in order to fix and prevent process problems. Therefore, corrective actions are taken for root causes [10].
Table -1: Corrective actions for burn mark
Defect Root Cause Corrective Action Process Status of Action
Burn mark
Generation cause :- Hard grinding following process parameter have been
Generation action:- Chilling system of hard grinding has been fixed and started.
Hard grinding
Completed
International Research Journal of Engineering and Technology (IRJET) e-ISSN: 2395 -0056
Volume: 03 Issue: 06 | June-2016 www.irjet.net p-ISSN: 2395-0072
© 2016, IRJET | Impact Factor value: 4.45 | ISO 9001:2008 Certified Journal | Page 2302
observed, 1. Grinding temperature found higher. (48 degree) 2. Ball wheel depth was ok. 3. Gap plate depth was ok. 4. Per hour cut rate was ok. 5. No process interruption. Based on this analysis, coolant temperature found higher due to break down of chilling system.
1. Hard Grinding chilling system has been improved by adding a new station. 2. Standard of hard grinding coolant temp has been modified from max 42 degree to max 35 degrees.
Table -2: Corrective actions for high band
Defect Root Cause Corrective Action Process Status of Action
High band
Generation cause :- 1. Polishing stock removal was 0.3 micron only. 2. Minimum stock removal was not decided at polishing stage.
Generation action:- 1. Minimum polishing stock removal to be kept as min 0.5 to max 1.0 micron in control plan. 2. Process parameter to be verified at PDI before releasing the batch. 3. Before releasing material to packing dept. process chart to be verified as per control plan.
Final lapping
Completed
Table -3: Corrective actions for smearing
Defect Root Cause Corrective Action Planned/Taken Process Status of Action
Smearing
Generation cause :- 1. Balls were slipped in between the plates and due to that line damage was generated while restarting machine after tripping. This was happened because uneven pressure was applied on ball while restarting the machine after tripping. This was happened due to less Ampere of motor ( i.e. 7 HP).
Generation action :- 1. 10HP motor with geared drive is planned instead of 7HP geared motor to avoid tripping issue. 2. Other machine will be reviewed for the same.
Final lapping
Completed

International Research Journal of Engineering and Technology (IRJET) e-ISSN: 2395 -0056
Volume: 03 Issue: 06 | June-2016 www.irjet.net p-ISSN: 2395-0072
© 2016, IRJET | Impact Factor value: 4.45 | ISO 9001:2008 Certified Journal | Page 2303
Table -4: Corrective actions for uneven
Defect Root Cause Corrective Action Planned/Taken Process Status of Action
Uneven Generation cause :- 1. Ball bounce back at entry. 2. Balls queuing up at the time of feeding. 3. Feed board angle too big. 4. Conveyer speed vary & creates tripping. 5. Standard of feed board angle not available. 6. Conveyer gear box ratio not properly defined.
Generation action:- 1. Feed board angle changed from 5 to 4 degree in lapping 3 to eliminate risk of ball bouncing back at entry and to eliminate risk of ball queuing at the time of feeding. 2. Conveyer gear box speed reduction ratio changed from 100 to 180 to avoid machine tripping issue and ensure smoother conveyor rotation.
Final lapping
Completed
3.5 Control
Control phase is about sustaining the changes made in the improve phase. Monitor the improvements to ensure continued and sustainable success. Create a control plan. Update documents, business process and
training records as required. A Control chart can be useful during the control stage to assess the stability of the improvements over time by serving as a guide to continue monitoring the process and provide a response plan for each of the measures being monitored in case the process becomes unstable [10].
Table -5: Control plan for hard grinding process
Product characteristic
Process characteristic
Specification Measurement technique
Sample size
Sample freq.
Control method
Reaction plan
Ball diameter As per customer requirement
Dial gauge/ Electro gauge
10 First off
First off approval
Stop m/c & refer fault diagnosis
Surface Free from rust, grinding damage & burn mark
Microscope 10 During PDI
Inspection report
Reject the lot & inform to process head
Feeding Uniform flow in each groove
Visual Once Every 2 hour
Process monitoring sheet
If not ok then correct it.
Coolant flow Uniform & sufficient
Visual Once Every 2 hour
Process monitoring sheet
Increase or decrease with flow control valve
Coolant temp.
25˚C to 40˚C Digital temp. display
Once Every 2 hour
Process monitoring sheet
Inform to maintenance for rectification
Comb condition
No damage Visual Once At the time of every new batch loading
Remark in the process monitoring sheet
If comb is damaged then change it
International Research Journal of Engineering and Technology (IRJET) e-ISSN: 2395 -0056
Volume: 03 Issue: 06 | June-2016 www.irjet.net p-ISSN: 2395-0072
© 2016, IRJET | Impact Factor value: 4.45 | ISO 9001:2008 Certified Journal | Page 2304
Table -6: Control plan for final lapping process
Product characteristic
Process characteristic
Specification Measurement technique
Sample size
Sample freq.
Control method
Reaction plan
Surface roughness
As per customer requirement/ grade
Talysurf/ Taly round
5 One lot/ type
Layout inspection
Reject/ rework the batch
Smearing/ temper line
Uniform surface
Microscope 20X to 60X
30 During final inspection
Final inspection
Reject/ rework the batch
Conveyor speed
Continuous uniform flow
Visual Once Every hour
Process chart
Reset speed w.r.t. feeding
Comb groove depth
Approx 2/3 of ball dia.
Depth gauge Once Before setting
Verify Rectify
Groove profile radius
Matching with ball radius
Profile match with finish ball
Once Before setting
First off Rectify
Coolant flow Proper & uniform
Visual Once Every batch
Process chart
Set the proper coolant flow
Ball flow at inlet
No jumping of balls in any groove
Visual Once Just after starting the batch
Process chart
Stop the m/c & rectify
4. RESULT
Improper roundness, surface roughness and waviness on the steel balls can cause high vibration levels in most applications. The amplitude of these waves is as small as some nanometers. Therefore, the measuring accuracy and resolution is a high demand. SKF MWA 160B machine is used to measure these parameters. It is a computer-based analyzer which provides macro
geometry measurements and analysis of roundness, harmonics, waviness and flatness. The standard upper limits of all the parameters are according to the American Bearing Manufacturers Association (ABMA). The data from MWA 160B for the ball grade G10Q 6 mm to 10 mm is shown in table 4.1 for the month of January 2016. From table 4.1 we can see the average upper limit for roundness, low band, medium band and high band exceeds.
Table -7: G10Q 6 mm to 10 mm for Jan-16
Parameter Upper limit (μm)
Batch reading (μm) Average (μm)
1 2 3 4 5
Roundness 0.130 0.132 0.117 0.129 0.135 0.146 0.131
Waviness 0.130 0.147 0.113 0.085 0.154 0.076 0.115
Low band 2.500 2.304 6.496 3.480 4.701 3.352 4.066
Medium band 3.600 3.463 4.282 3.966 3.568 3.324 3.720
High band 12.500 11.874 11.117 14.485 12.356 13.143 12.595
International Research Journal of Engineering and Technology (IRJET) e-ISSN: 2395 -0056
Volume: 03 Issue: 06 | June-2016 www.irjet.net p-ISSN: 2395-0072
© 2016, IRJET | Impact Factor value: 4.45 | ISO 9001:2008 Certified Journal | Page 2305
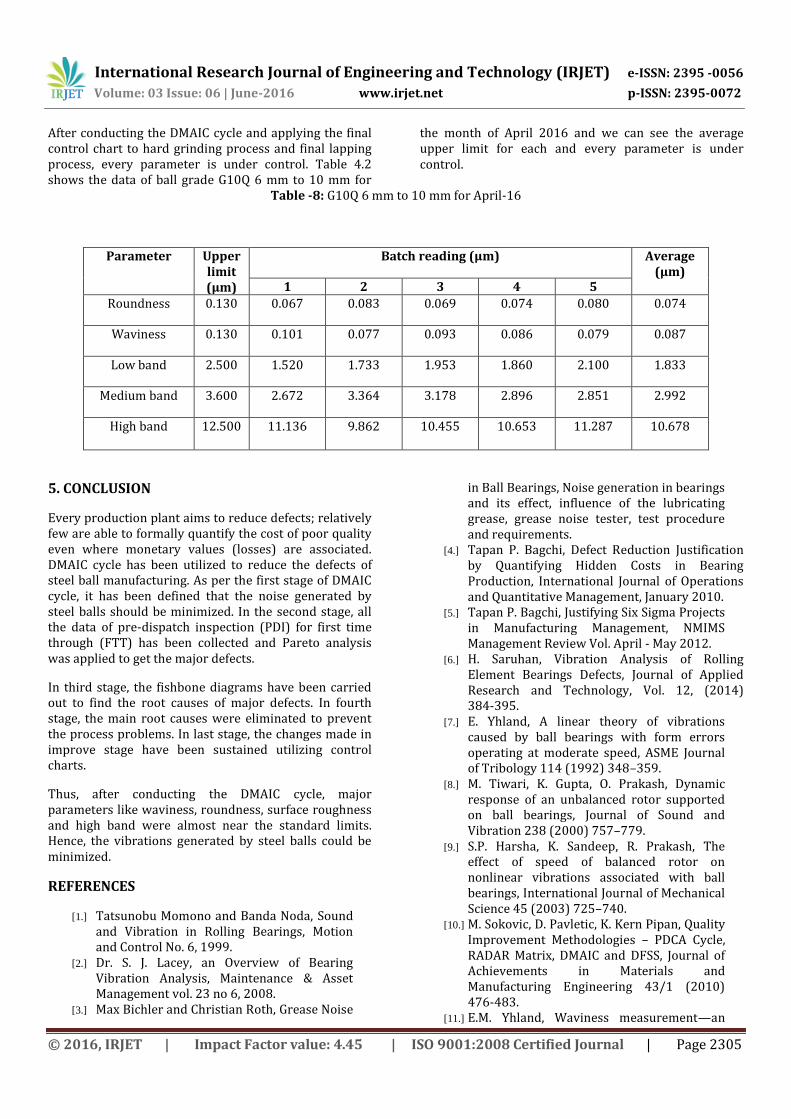
After conducting the DMAIC cycle and applying the final control chart to hard grinding process and final lapping process, every parameter is under control. Table 4.2 shows the data of ball grade G10Q 6 mm to 10 mm for
the month of April 2016 and we can see the average upper limit for each and every parameter is under control.
Table -8: G10Q 6 mm to 10 mm for April-16
Parameter Upper limit (μm)
Batch reading (μm) Average (μm)
1 2 3 4 5
Roundness 0.130 0.067 0.083 0.069 0.074 0.080 0.074
Waviness 0.130 0.101 0.077 0.093 0.086 0.079 0.087
Low band 2.500 1.520 1.733 1.953 1.860 2.100 1.833
Medium band 3.600 2.672 3.364 3.178 2.896 2.851 2.992
High band 12.500 11.136 9.862 10.455 10.653 11.287 10.678
5. CONCLUSION
Every production plant aims to reduce defects; relatively few are able to formally quantify the cost of poor quality even where monetary values (losses) are associated. DMAIC cycle has been utilized to reduce the defects of steel ball manufacturing. As per the first stage of DMAIC cycle, it has been defined that the noise generated by steel balls should be minimized. In the second stage, all the data of pre-dispatch inspection (PDI) for first time through (FTT) has been collected and Pareto analysis was applied to get the major defects.
In third stage, the fishbone diagrams have been carried out to find the root causes of major defects. In fourth stage, the main root causes were eliminated to prevent the process problems. In last stage, the changes made in improve stage have been sustained utilizing control charts.
Thus, after conducting the DMAIC cycle, major parameters like waviness, roundness, surface roughness and high band were almost near the standard limits. Hence, the vibrations generated by steel balls could be minimized.
REFERENCES
[1.] Tatsunobu Momono and Banda Noda, Sound and Vibration in Rolling Bearings, Motion and Control No. 6, 1999.
[2.] Dr. S. J. Lacey, an Overview of Bearing Vibration Analysis, Maintenance & Asset Management vol. 23 no 6, 2008.
[3.] Max Bichler and Christian Roth, Grease Noise
in Ball Bearings, Noise generation in bearings and its effect, influence of the lubricating grease, grease noise tester, test procedure and requirements.
[4.] Tapan P. Bagchi, Defect Reduction Justification by Quantifying Hidden Costs in Bearing Production, International Journal of Operations and Quantitative Management, January 2010.
[5.] Tapan P. Bagchi, Justifying Six Sigma Projects in Manufacturing Management, NMIMS Management Review Vol. April - May 2012.
[6.] H. Saruhan, Vibration Analysis of Rolling Element Bearings Defects, Journal of Applied Research and Technology, Vol. 12, (2014) 384‐395.
[7.] E. Yhland, A linear theory of vibrations caused by ball bearings with form errors operating at moderate speed, ASME Journal of Tribology 114 (1992) 348–359.
[8.] M. Tiwari, K. Gupta, O. Prakash, Dynamic response of an unbalanced rotor supported on ball bearings, Journal of Sound and Vibration 238 (2000) 757–779.
[9.] S.P. Harsha, K. Sandeep, R. Prakash, The effect of speed of balanced rotor on nonlinear vibrations associated with ball bearings, International Journal of Mechanical Science 45 (2003) 725–740.
[10.] M. Sokovic, D. Pavletic, K. Kern Pipan, Quality Improvement Methodologies – PDCA Cycle, RADAR Matrix, DMAIC and DFSS, Journal of Achievements in Materials and Manufacturing Engineering 43/1 (2010) 476-483.
[11.] E.M. Yhland, Waviness measurement—an

International Research Journal of Engineering and Technology (IRJET) e-ISSN: 2395 -0056
Volume: 03 Issue: 06 | June-2016 www.irjet.net p-ISSN: 2395-0072
© 2016, IRJET | Impact Factor value: 4.45 | ISO 9001:2008 Certified Journal | Page 2306
instrument for quality control in rolling bearing industry, Proceedings of the Institution of Mechanical Engineering 182 (Part 3K) (1967) 438–445.
[12.] F.P. Wardle, S.Y. Poon, Rolling bearings noise, cause and cure, Chartered Mechanical Engineering (July/August) (1983) 36–40.
[13.] N. Aktu¨uk, The effect of waviness on vibrations associated with ball bearings, ASME Journal of
Tribology 121 (1999) 667–676. [14.] P.K. Gupta, Advanced Dynamics of Rolling
Elements, Wiley, New York, 1984. [15.] J.Q. Zhou, Y.Y. Zhu, Nonlinear Vibrations, Xi’an
Jioatong University Press, China, 1998. [16.] ‘Steel Balls’ Glossary’, Miniature Ball
Industries, Technologic Concepts, India, 2008.