improving operations: the toolbox, part 1
TRANSCRIPT

Jeffrey Sommer, Managing DirectorJohn Behn, Principal
Jonathan Pantenburg, Principal
September 2019
Improving Operations: The Toolbox, Part 1
2
Agenda
The challenge: significant headwinds are eroding margins while new demands to employ providers and address regulatory, consumer and technology needs pose daunting investment requirements.
National Trends Overview The Operational Tool Box The Clinic Designation Opportunity The Revenue Cycle Imperative Questions

INDUSTRY TRENDS
4
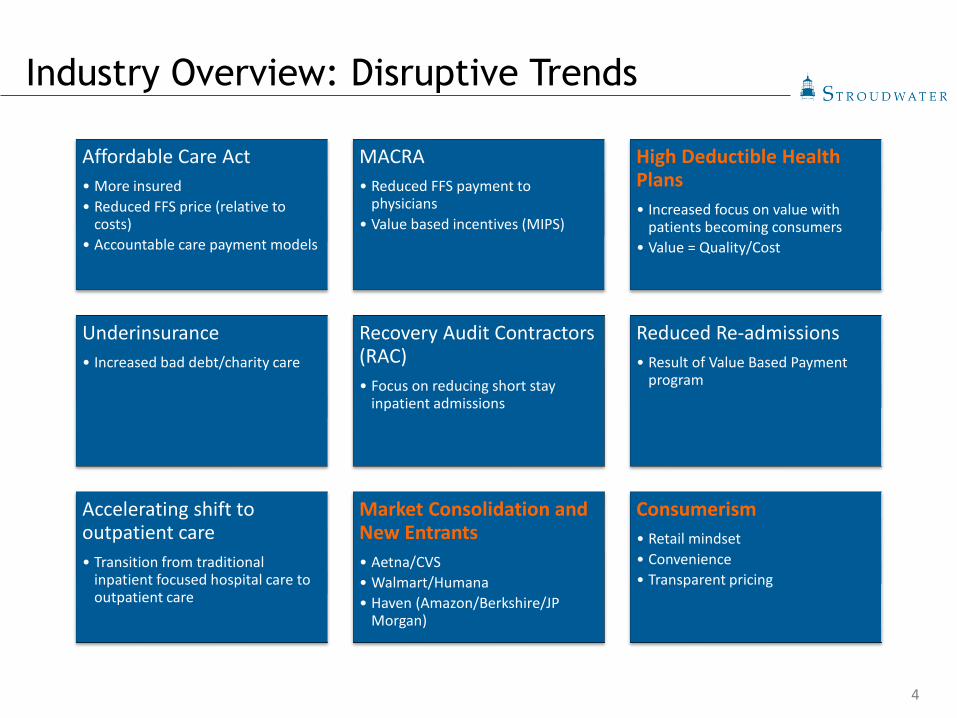
Affordable Care Act• More insured• Reduced FFS price (relative to
costs)• Accountable care payment models
MACRA• Reduced FFS payment to
physicians• Value based incentives (MIPS)
High Deductible Health Plans• Increased focus on value with
patients becoming consumers • Value = Quality/Cost
Underinsurance• Increased bad debt/charity care
Recovery Audit Contractors (RAC)• Focus on reducing short stay
inpatient admissions
Reduced Re-admissions• Result of Value Based Payment
program
Accelerating shift to outpatient care• Transition from traditional
inpatient focused hospital care to outpatient care
Market Consolidation and New Entrants• Aetna/CVS• Walmart/Humana• Haven (Amazon/Berkshire/JP
Morgan)
Consumerism• Retail mindset• Convenience• Transparent pricing
Industry Overview: Disruptive Trends
MARKET OVERVIEW

5
Fee-For-Service Financial Model – Results
Source: MedPac Annual Report to Congress, March 2019
-12.0%
-10.0%
-8.0%
-6.0%
-4.0%
-2.0%
0.0%
2.0%
2007 2008 2009 2010 2011 2012 2013 2014 2015 2016 2017 2018 P 2019 P
Medicare Margins
All (exc. CAHs) NFP FP All ProjectedMedicare margins are expected to decline due to a tightening labor market and other sources of cost inflation projected to outpace growth in payment rates.
Private commercial insurers are also applying pressure to control and limit growth in reimbursement.
6
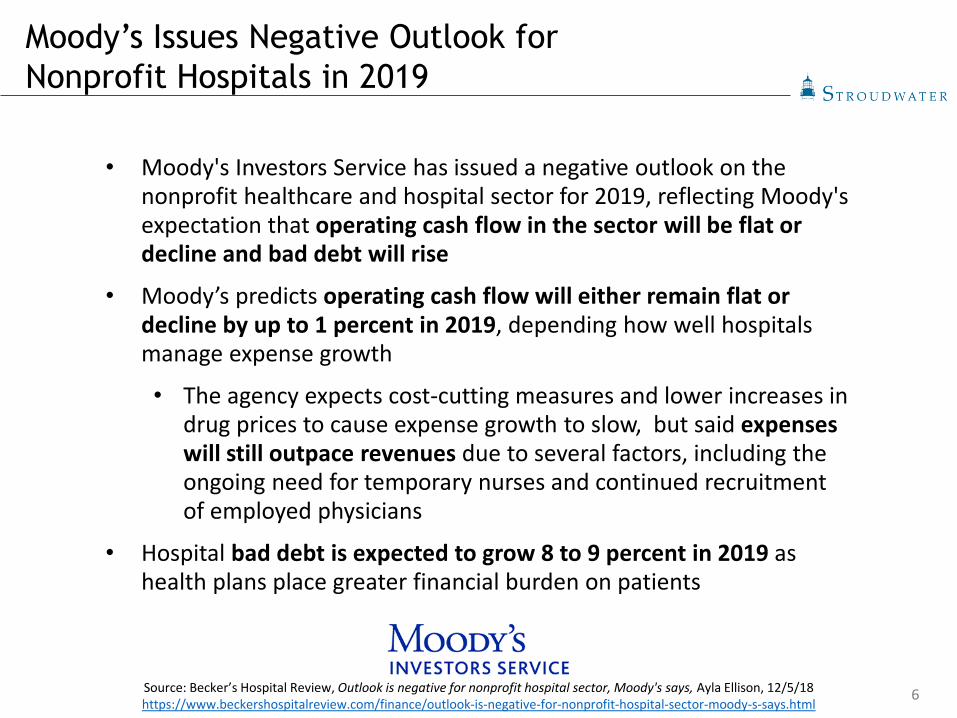
Moody’s Issues Negative Outlook for Nonprofit Hospitals in 2019
• Moody's Investors Service has issued a negative outlook on the nonprofit healthcare and hospital sector for 2019, reflecting Moody's expectation that operating cash flow in the sector will be flat or decline and bad debt will rise
• Moody’s predicts operating cash flow will either remain flat or decline by up to 1 percent in 2019, depending how well hospitals manage expense growth
• The agency expects cost-cutting measures and lower increases in drug prices to cause expense growth to slow, but said expenses will still outpace revenues due to several factors, including the ongoing need for temporary nurses and continued recruitment of employed physicians
• Hospital bad debt is expected to grow 8 to 9 percent in 2019 as health plans place greater financial burden on patients
Source: Becker’s Hospital Review, Outlook is negative for nonprofit hospital sector, Moody's says, Ayla Ellison, 12/5/18 https://www.beckershospitalreview.com/finance/outlook-is-negative-for-nonprofit-hospital-sector-moody-s-says.html
7
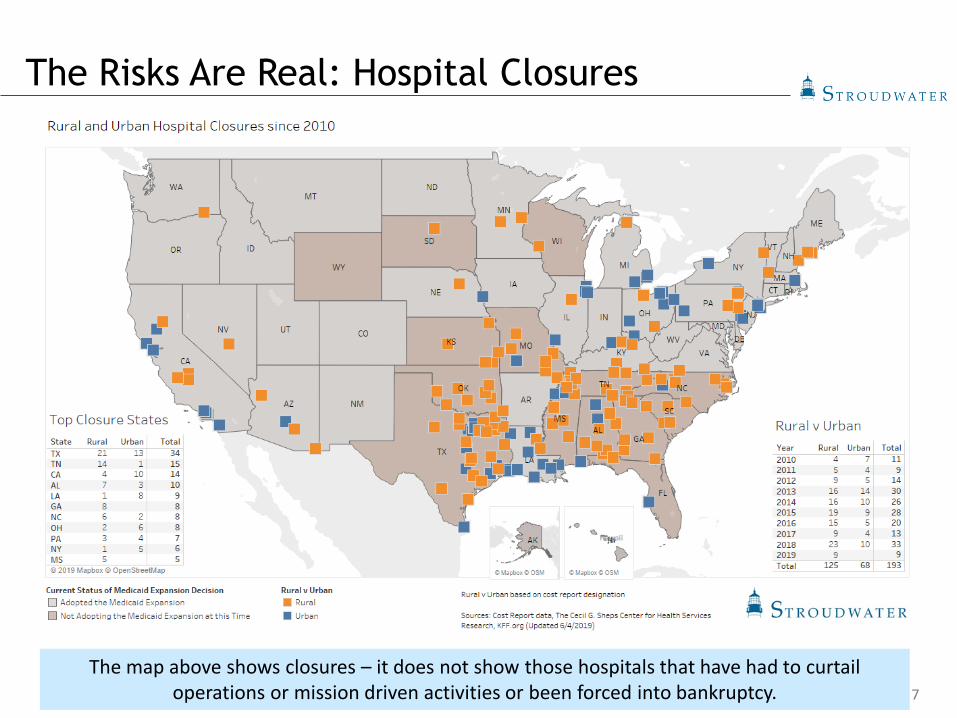
The Risks Are Real: Hospital Closures
The map above shows closures – it does not show those hospitals that have had to curtail operations or mission driven activities or been forced into bankruptcy.
8
The Consequences of Failing to Act
• Researchers examined outcomes in California hospital service areas (HSAs) with and without closure(s) between 1995-2011 both before and after the closure year.
• Adjusted inpatient mortality was studied for time-sensitive conditions: sepsis, stroke, asthma/chronic obstructive pulmonary disease (COPD) and acute myocardial infarction (AMI).
• To the researchers’ best knowledge, this is also the first paper explicitly studying patient outcomes of California's rural closures.
• Results suggest that when treatment groups are not differentiated by hospital rurality, closures appear to have no measurable impact.
• However, estimating differential impacts of rural and urban closures shows that rural closures increase inpatient mortality by 0.46% points (an increase of 5.9%), whereas urban closures have no impact.
Impact of Rural and Urban Hospital Closures on Inpatient Mortality. NBER Working Paper No. 26182, Issued in August 2019; Kritee Gujral, Anirban Basu.

9
Polling Question #1
• What best described your organization?• Healthy: Adequate cash flow to fund needed investments and
initiatives; healthy top line revenue growth and good expense management; positive operating margin; strong and stable market position
• Compromised: Struggling to keep expenses in line with top line revenue; negative operating margin in danger of swamping portfolio returns or tax proceeds; signs of weakness in market position
• Stressed: 2+ years of material deferred investment; 2+ years of top line revenue growth less than 3% annually; negative total margin; market position beginning to erode
• Distressed: 3+ years of material deferred investment; 3+ years of top line revenue growth less than 2% annually; negative cash flow; reserves are being depleted; market position materially eroded; trajectory cannot be sustained
OPERATIONAL PERFORMANCE IMPROVEMENT TOOL BOX
11
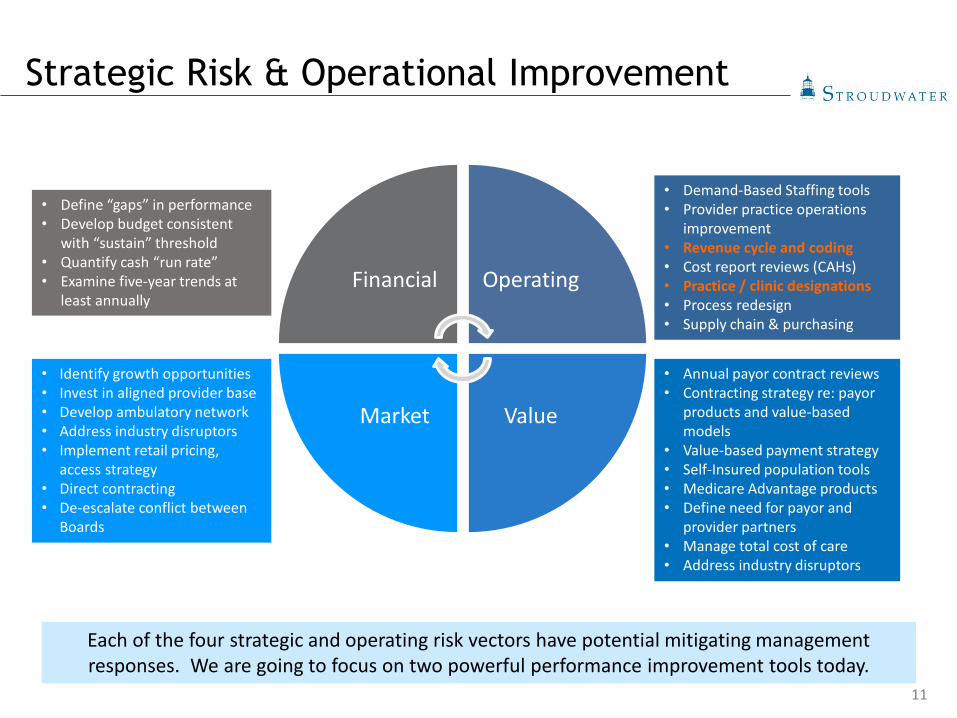
Strategic Risk & Operational Improvement
Financial Operating
ValueMarket
Each of the four strategic and operating risk vectors have potential mitigating management responses. We are going to focus on two powerful performance improvement tools today.
• Demand-Based Staffing tools• Provider practice operations
improvement• Revenue cycle and coding• Cost report reviews (CAHs)• Practice / clinic designations• Process redesign• Supply chain & purchasing
• Annual payor contract reviews• Contracting strategy re: payor
products and value-based models
• Value-based payment strategy• Self-Insured population tools• Medicare Advantage products• Define need for payor and
provider partners• Manage total cost of care• Address industry disruptors
• Identify growth opportunities• Invest in aligned provider base • Develop ambulatory network• Address industry disruptors• Implement retail pricing,
access strategy • Direct contracting• De-escalate conflict between
Boards
• Define “gaps” in performance• Develop budget consistent
with “sustain” threshold• Quantify cash “run rate”• Examine five-year trends at
least annually

OPERATIONAL PERFORMANCE IMPROVEMENT TOOLBOX:THE CLINIC DESIGNATION OPPORTUNITY
13
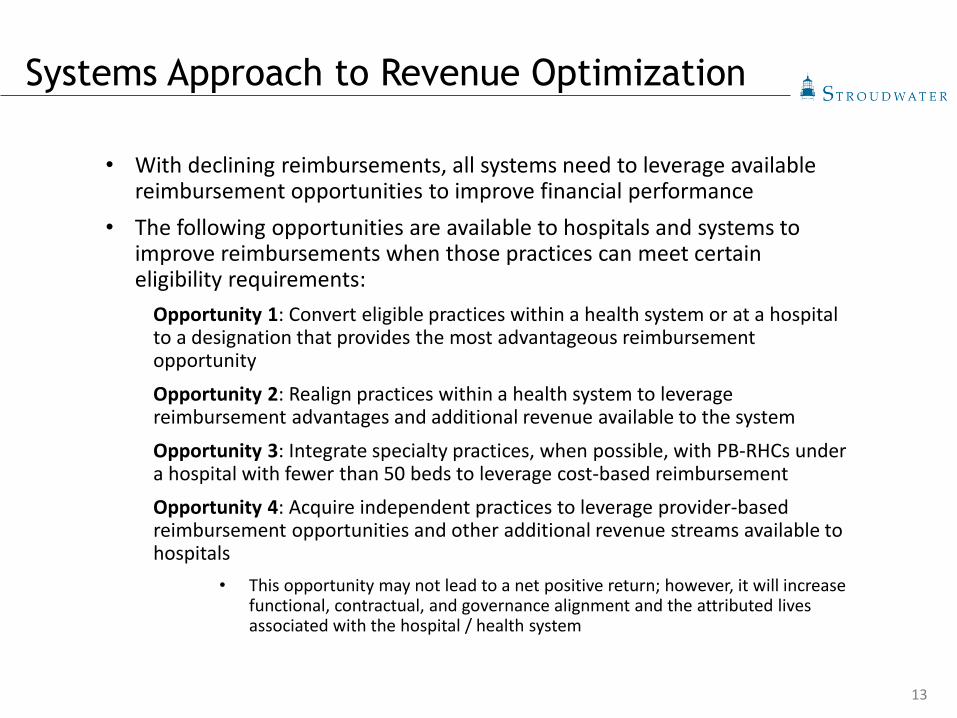
Systems Approach to Revenue Optimization
• With declining reimbursements, all systems need to leverage available reimbursement opportunities to improve financial performance
• The following opportunities are available to hospitals and systems to improve reimbursements when those practices can meet certain eligibility requirements:
Opportunity 1: Convert eligible practices within a health system or at a hospital to a designation that provides the most advantageous reimbursement opportunity
Opportunity 2: Realign practices within a health system to leverage reimbursement advantages and additional revenue available to the system
Opportunity 3: Integrate specialty practices, when possible, with PB-RHCs under a hospital with fewer than 50 beds to leverage cost-based reimbursementOpportunity 4: Acquire independent practices to leverage provider-based reimbursement opportunities and other additional revenue streams available to hospitals
• This opportunity may not lead to a net positive return; however, it will increase functional, contractual, and governance alignment and the attributed lives associated with the hospital / health system
14
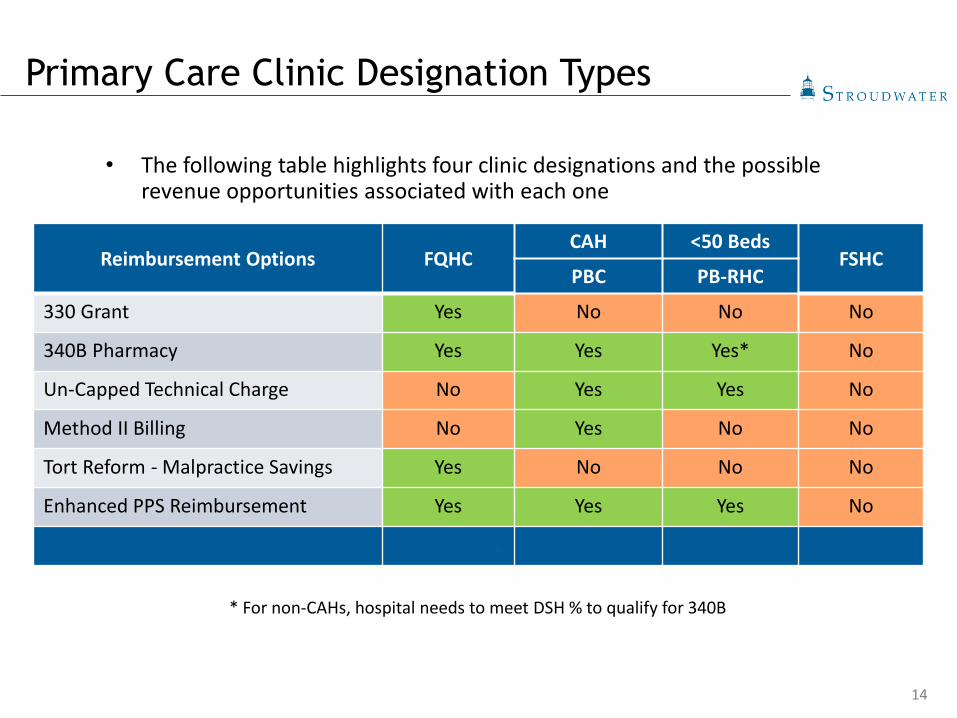
• The following table highlights four clinic designations and the possible revenue opportunities associated with each one
* For non-CAHs, hospital needs to meet DSH % to qualify for 340B
Reimbursement Options FQHCCAH <50 Beds
FSHCPBC PB-RHC
330 Grant Yes No No No
340B Pharmacy Yes Yes Yes* No
Un-Capped Technical Charge No Yes Yes No
Method II Billing No Yes No No
Tort Reform - Malpractice Savings Yes No No No
Enhanced PPS Reimbursement Yes Yes Yes No
Additional Materials Appendix 1 Appendix 2 Appendix 3 Appendix 4
Primary Care Clinic Designation Types
15
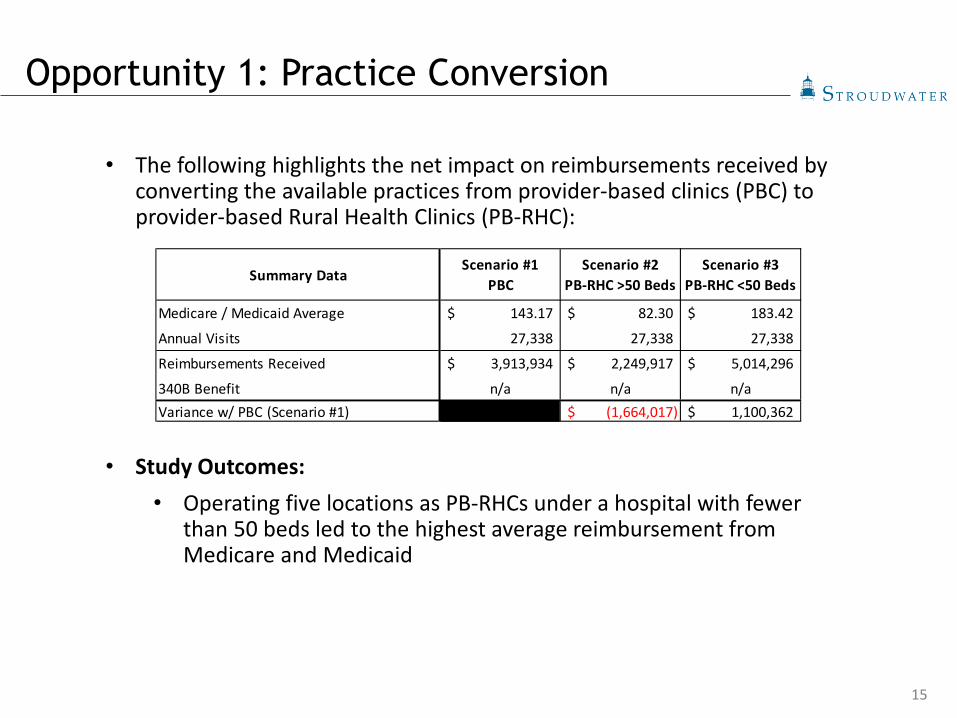
• The following highlights the net impact on reimbursements received by converting the available practices from provider-based clinics (PBC) to provider-based Rural Health Clinics (PB-RHC):
• Study Outcomes: • Operating five locations as PB-RHCs under a hospital with fewer
than 50 beds led to the highest average reimbursement from Medicare and Medicaid
Opportunity 1: Practice Conversion
Summary DataScenario #1
PBCScenario #2
PB-RHC >50 BedsScenario #3
PB-RHC <50 Beds
Medicare / Medicaid Average 143.17$ 82.30$ 183.42$
Annual Visits 27,338 27,338 27,338
Reimbursements Received 3,913,934$ 2,249,917$ 5,014,296$
340B Benefit n/a n/a n/aVariance w/ PBC (Scenario #1) (1,664,017)$ 1,100,362$
16
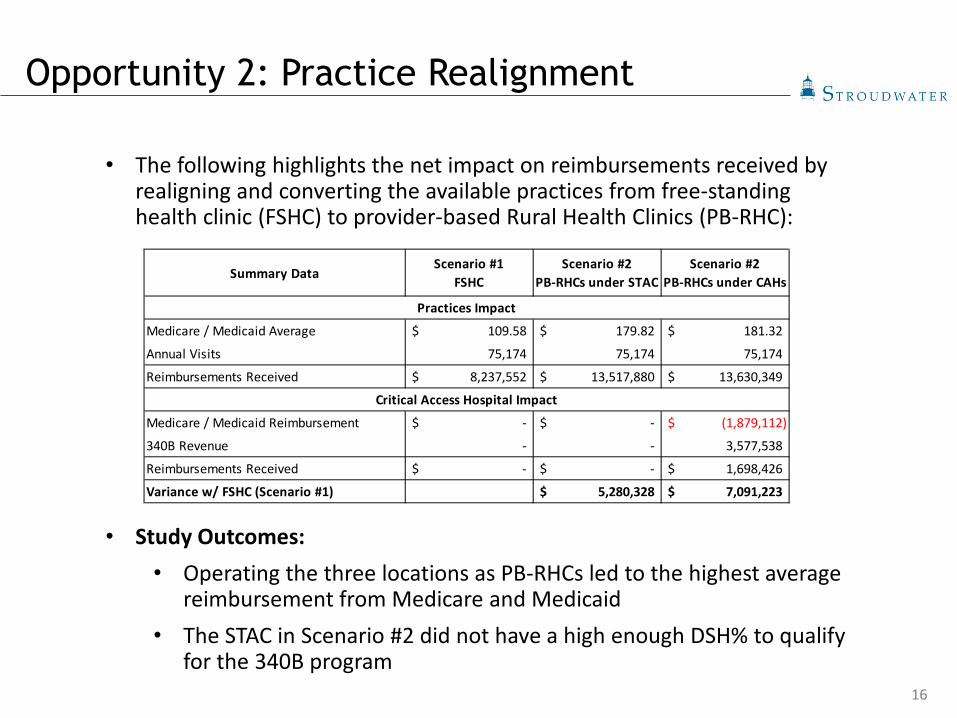
• The following highlights the net impact on reimbursements received by realigning and converting the available practices from free-standing health clinic (FSHC) to provider-based Rural Health Clinics (PB-RHC):
• Study Outcomes: • Operating the three locations as PB-RHCs led to the highest average
reimbursement from Medicare and Medicaid• The STAC in Scenario #2 did not have a high enough DSH% to qualify
for the 340B program
Summary DataScenario #1
FSHCScenario #2
PB-RHCs under STACScenario #2
PB-RHCs under CAHs
Medicare / Medicaid Average 109.58$ 179.82$ 181.32$
Annual Visits 75,174 75,174 75,174
Reimbursements Received 8,237,552$ 13,517,880$ 13,630,349$
Medicare / Medicaid Reimbursement -$ -$ (1,879,112)$
340B Revenue - - 3,577,538
Reimbursements Received -$ -$ 1,698,426$
Variance w/ FSHC (Scenario #1) 5,280,328$ 7,091,223$
Practices Impact
Critical Access Hospital Impact
Opportunity 2: Practice Realignment

17
• The following highlights the net impact on reimbursements received by integrating a specialty provider-based clinics (PBC) into a provider-based Rural Health Clinics (PB-RHC):
• Study Outcomes: • Integrating the specialty practice (PBC) with the PB-RHC would lead
to an increase in reimbursements of $505K from Medicare and Medicaid
Summary DataScenario #1
PB-RHC & PBEScenario #2
PB-RHC
Medicare / Medicaid Average 217.55$ 235.57$
Annual Visits 2,954 2,954
Reimbursements Received 642,655$ 695,874$
Medicare / Medicaid Average 174.30$ 235.57$
Annual Visits 7,378 7,378
Reimbursements Received 1,285,949$ 1,738,036$
Variance w/ PB-RHC & PBE (Scenario #1) 505,306$
Primary Care Practice
Specialty Practice
Opportunity 3: Specialty Integration
18
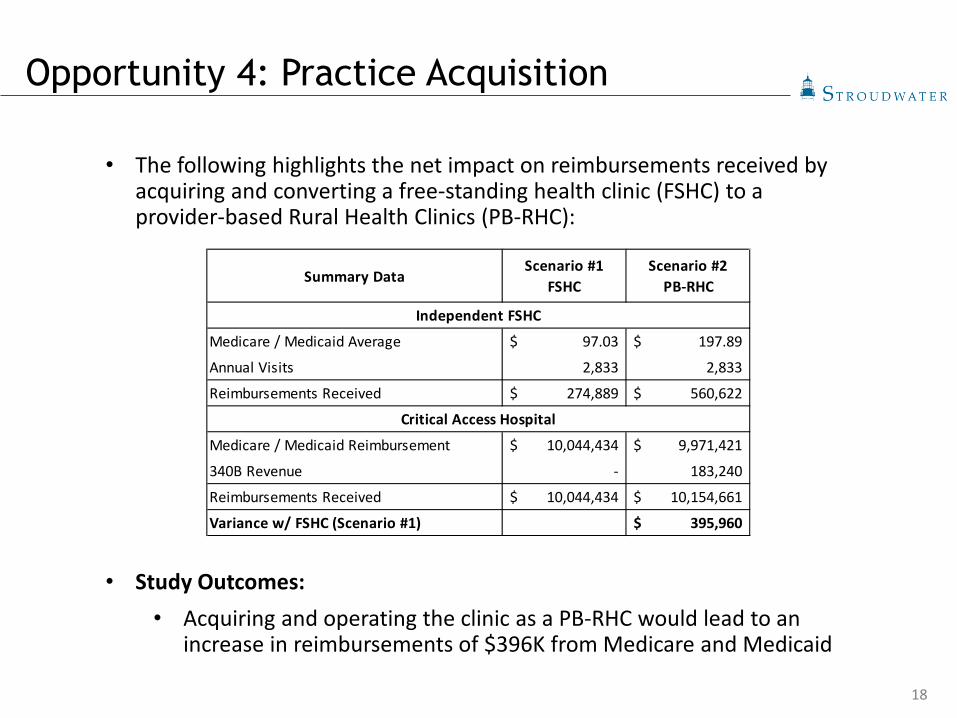
• The following highlights the net impact on reimbursements received by acquiring and converting a free-standing health clinic (FSHC) to a provider-based Rural Health Clinics (PB-RHC):
• Study Outcomes: • Acquiring and operating the clinic as a PB-RHC would lead to an
increase in reimbursements of $396K from Medicare and Medicaid
Summary DataScenario #1
FSHCScenario #2
PB-RHC
Medicare / Medicaid Average 97.03$ 197.89$
Annual Visits 2,833 2,833
Reimbursements Received 274,889$ 560,622$
Medicare / Medicaid Reimbursement 10,044,434$ 9,971,421$
340B Revenue - 183,240
Reimbursements Received 10,044,434$ 10,154,661$
Variance w/ FSHC (Scenario #1) 395,960$
Independent FSHC
Critical Access Hospital
Opportunity 4: Practice Acquisition
19
Polling Question #2
• Have you implemented any of the strategies? (Check all that apply)
• Opportunity 1: Convert existing practices• Opportunity 2: Realign practices within a system• Opportunity 3: Specialty Integration • Opportunity 4: Practice Acquisition• None of the above
20
Key Takeaways
• Due to continued changes in reimbursement, organizations must continue to evaluate the designations and alignment of practices to optimize reimbursement
• Although the strategies may be similar across hospitals and systems, there is no one-size-fits-all approach to realize these benefits
• Engage your state agencies, whether hospital associations or the state offices of rural health, to help with HPS
• Most of these programs require a rural area designation, health professional shortage area (HPSA), and or some other designation to qualify
• Continue to evaluate all opportunities available to the hospital/system to improve reimbursements and financial position
OPERATIONAL PERFORMANCE IMPROVEMENT TOOLBOX:THE REVENUE CYCLE IMPERATIVE
22
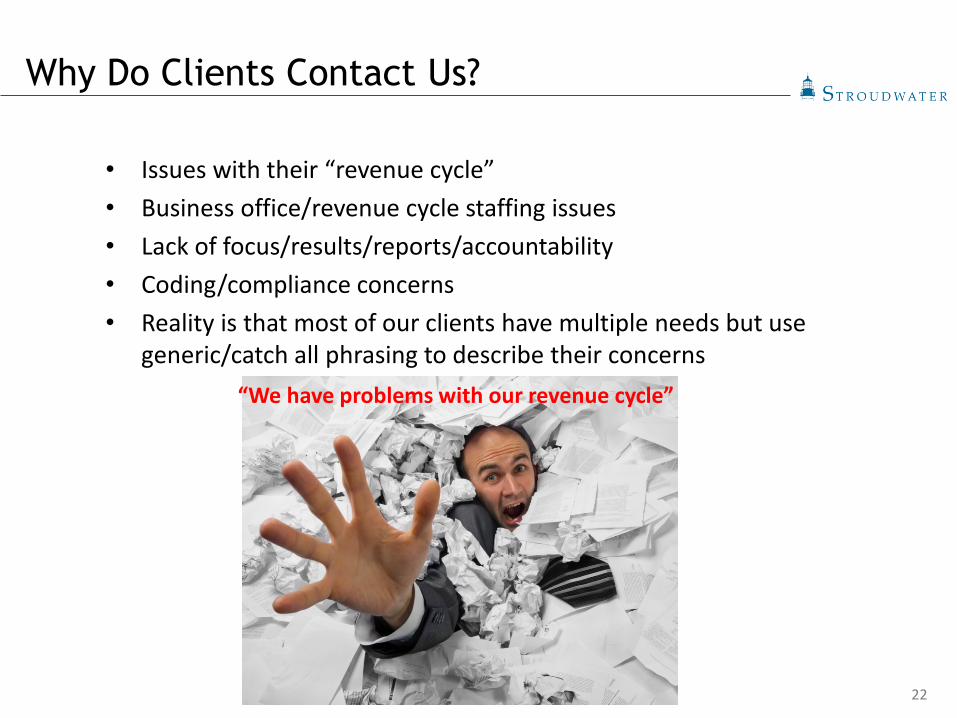
Why Do Clients Contact Us?
• Issues with their “revenue cycle”• Business office/revenue cycle staffing issues• Lack of focus/results/reports/accountability• Coding/compliance concerns• Reality is that most of our clients have multiple needs but use
generic/catch all phrasing to describe their concerns“We have problems with our revenue cycle”
23
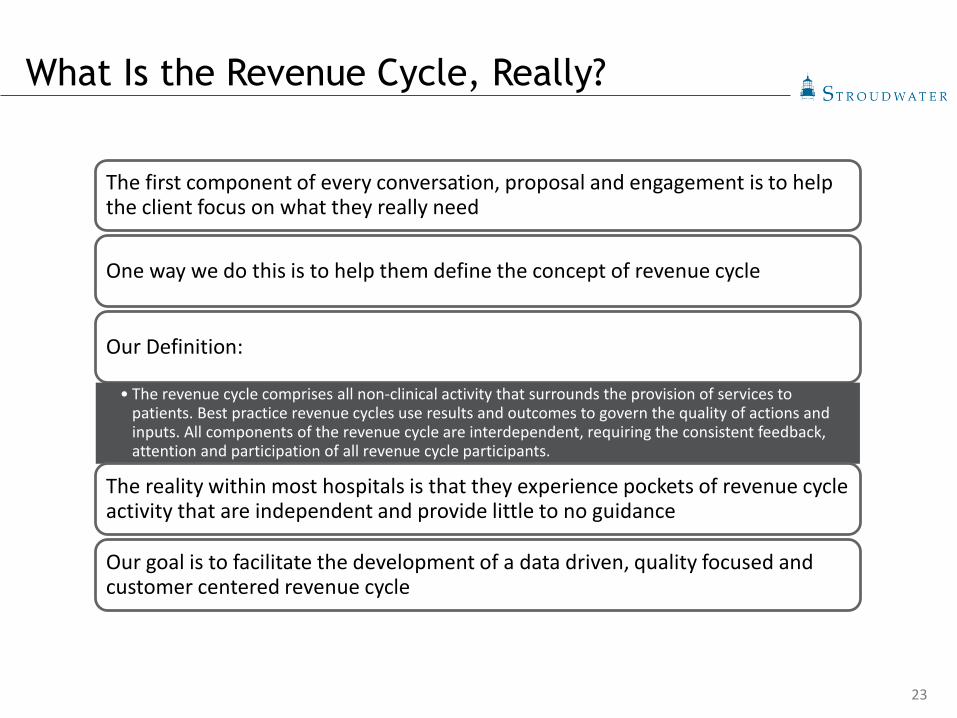
What Is the Revenue Cycle, Really?
The first component of every conversation, proposal and engagement is to help the client focus on what they really need
One way we do this is to help them define the concept of revenue cycle
Our Definition:
• The revenue cycle comprises all non-clinical activity that surrounds the provision of services to patients. Best practice revenue cycles use results and outcomes to govern the quality of actions and inputs. All components of the revenue cycle are interdependent, requiring the consistent feedback, attention and participation of all revenue cycle participants.
The reality within most hospitals is that they experience pockets of revenue cycle activity that are independent and provide little to no guidance
Our goal is to facilitate the development of a data driven, quality focused and customer centered revenue cycle

24
Tales from the Field:On-Site Revenue Cycle Leadership
Statement of Service:
• On-site leadership takes the form of either Revenue Cycle Director or Business Office Manager roles.
• The goal of the service is to have SRCS resources work directly alongside hospital administration, department heads and revenue cycle participants in partnership to prioritize activities which provide the greatest impact and act on those priorities.
• SRCS will customize project plans to meet customer needs, facility culture and administrative priority to ensure short- and long-term sustainable results.
25
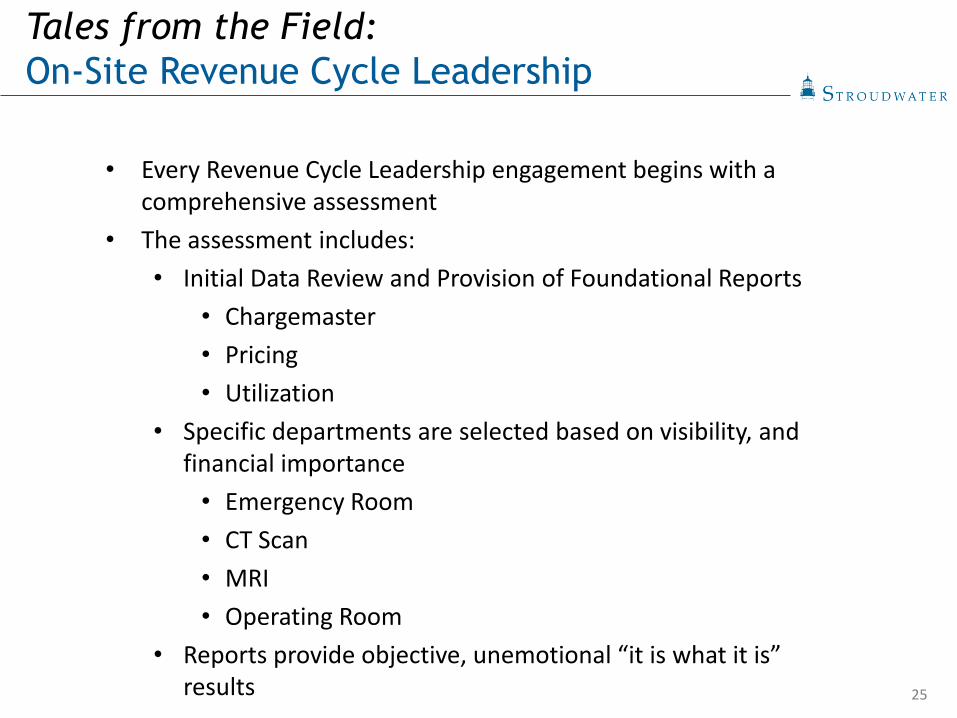
Tales from the Field:On-Site Revenue Cycle Leadership
• Every Revenue Cycle Leadership engagement begins with a comprehensive assessment
• The assessment includes:• Initial Data Review and Provision of Foundational Reports
• Chargemaster • Pricing• Utilization
• Specific departments are selected based on visibility, and financial importance
• Emergency Room• CT Scan• MRI• Operating Room
• Reports provide objective, unemotional “it is what it is” results

26
• Initial Review/Assessment Components• Assessment components provide enough detail to generate
ROI• Assessment scope is based on hospital training, culture and
priorities • For example:
• Client One started with an assessment of the ER: Documented ROI $1.2 million
• Client two started with a detailed assessment across multiple modalities: Documented ROI $2.3 million
• Clients three and four treated the assessment as Phase 1 of a larger strategic and financial improvement project: Documented ROI of $2.85 million $3.65 million, respectively
Tales from the Field:On-Site Revenue Cycle Leadership

27
• During the engagement we focus on four distinct access points:• Administration involvement, command and
control• Departmental accountability and ownership• Sustainable systematic operational improvement• SRCS activity
• SRCS becomes a part of hospital staff• We become part of “us” rather than “them”
• The establishment of trust and becoming part of the team are critical components for success
• SRCS doesn’t just manage the process—we participate in the process
How we make a
difference
Tales from the Field:On-Site Revenue Cycle Leadership
28
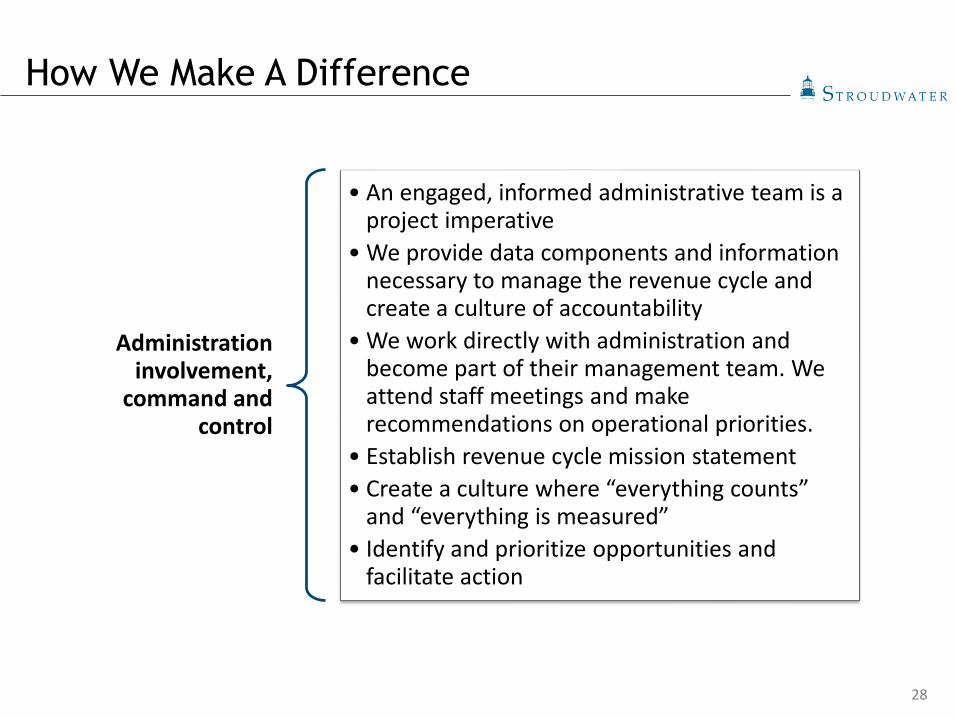
Administration involvement,
command and control
• An engaged, informed administrative team is a project imperative
• We provide data components and information necessary to manage the revenue cycle and create a culture of accountability
• We work directly with administration and become part of their management team. We attend staff meetings and make recommendations on operational priorities.
• Establish revenue cycle mission statement• Create a culture where “everything counts”
and “everything is measured”• Identify and prioritize opportunities and
facilitate action
How We Make A Difference
29
How We Make A Difference
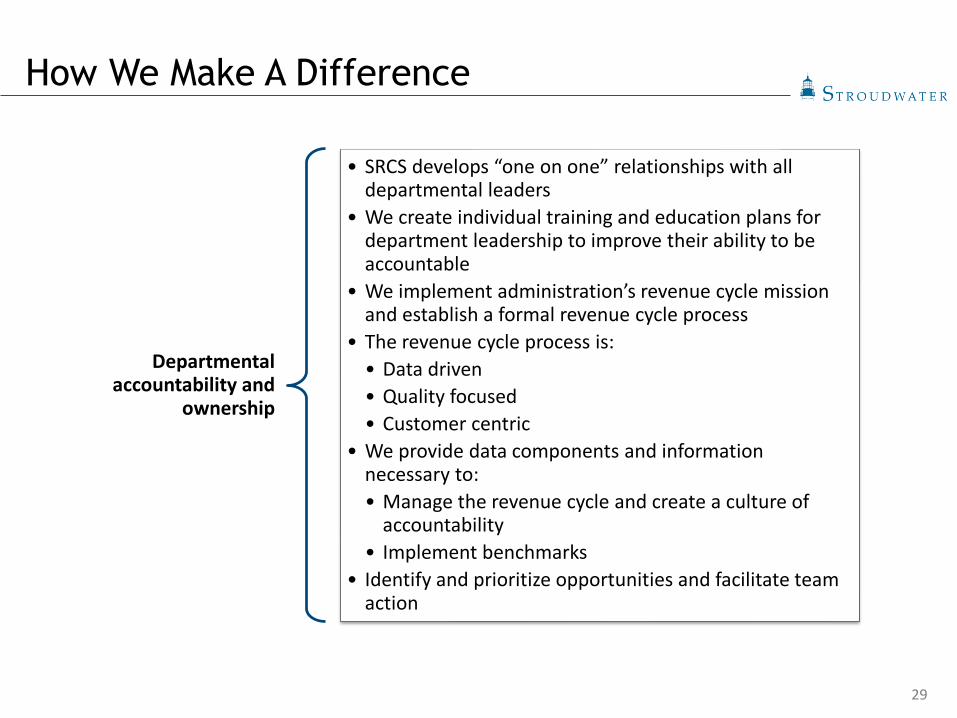
Departmental accountability and
ownership
• SRCS develops “one on one” relationships with all departmental leaders
• We create individual training and education plans for department leadership to improve their ability to be accountable
• We implement administration’s revenue cycle mission and establish a formal revenue cycle process
• The revenue cycle process is:• Data driven• Quality focused• Customer centric
• We provide data components and information necessary to:• Manage the revenue cycle and create a culture of
accountability• Implement benchmarks
• Identify and prioritize opportunities and facilitate team action
30
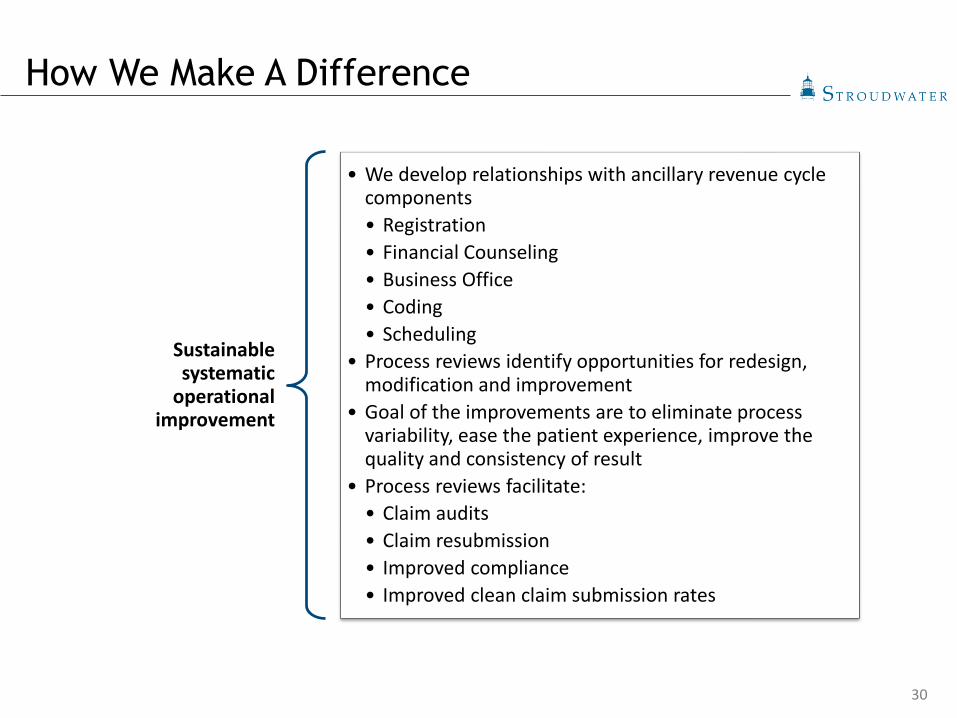
Sustainable systematic
operational improvement
• We develop relationships with ancillary revenue cycle components• Registration• Financial Counseling• Business Office• Coding• Scheduling
• Process reviews identify opportunities for redesign, modification and improvement
• Goal of the improvements are to eliminate process variability, ease the patient experience, improve the quality and consistency of result
• Process reviews facilitate:• Claim audits• Claim resubmission• Improved compliance• Improved clean claim submission rates
How We Make A Difference
31
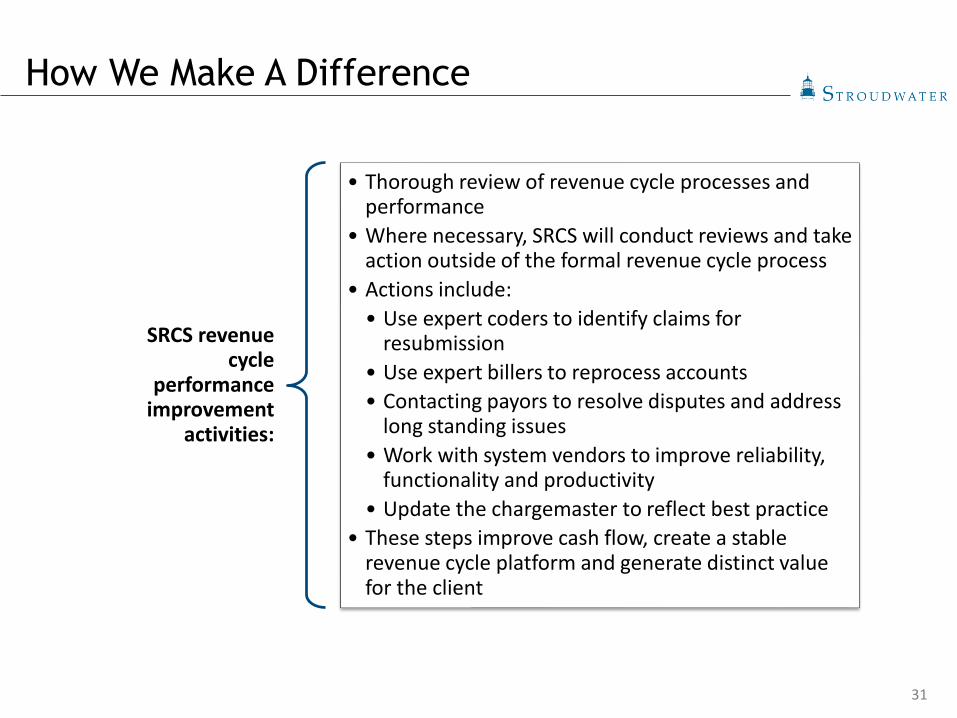
SRCS revenue cycle
performance improvement
activities:
• Thorough review of revenue cycle processes and performance
• Where necessary, SRCS will conduct reviews and take action outside of the formal revenue cycle process
• Actions include:• Use expert coders to identify claims for
resubmission• Use expert billers to reprocess accounts• Contacting payors to resolve disputes and address
long standing issues• Work with system vendors to improve reliability,
functionality and productivity• Update the chargemaster to reflect best practice
• These steps improve cash flow, create a stable revenue cycle platform and generate distinct value for the client
How We Make A Difference
32
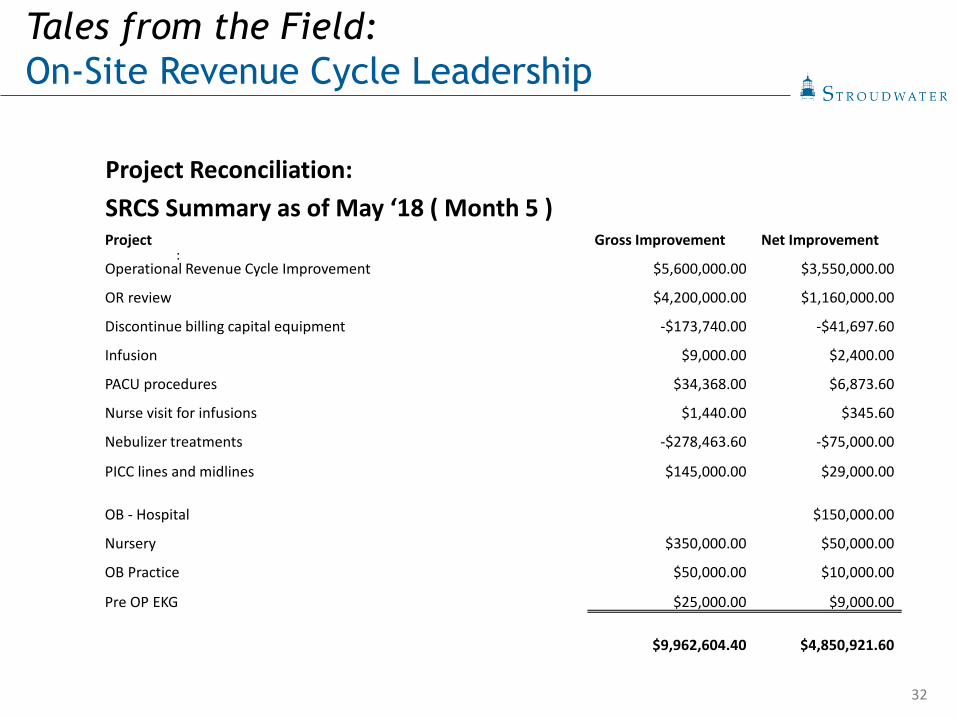
Project Reconciliation:SRCS Summary as of May ‘18 ( Month 5 ) Project Gross Improvement Net Improvement
Operational Revenue Cycle Improvement $5,600,000.00 $3,550,000.00
OR review $4,200,000.00 $1,160,000.00
Discontinue billing capital equipment -$173,740.00 -$41,697.60
Infusion $9,000.00 $2,400.00
PACU procedures $34,368.00 $6,873.60
Nurse visit for infusions $1,440.00 $345.60
Nebulizer treatments -$278,463.60 -$75,000.00
PICC lines and midlines $145,000.00 $29,000.00
OB - Hospital $150,000.00
Nursery $350,000.00 $50,000.00
OB Practice $50,000.00 $10,000.00
Pre OP EKG $25,000.00 $9,000.00
$9,962,604.40 $4,850,921.60
:
Tales from the Field:On-Site Revenue Cycle Leadership

33
Final Project ROI for two recent clients:
Client One
Initially losing $700k per month
After 10 months, net $200K+ per month
Reduced credit balances
Total documented ROI $6.75 million
Client Two
Gained $1 million net per month for 12 straight months
Eliminated credit balances over 30 days
Reduced FTE without a RIF through attrition, better personnel management and improved workflows
Tales from the Field:On-Site Revenue Cycle Leadership

34
Polling Question #3
• Areas of greatest concern (Check all that apply):• Chargemaster• Coding• Collections• Revenue Cycle Leadership / Systems• Pricing Transparency

QUESTIONS?

36
Questions & Thank You
(207) 221-8255
Jeff Sommer, MPPManaging Director
(207) 221-8277
John BehnPresident, SRCS
(207) 221-8253
Jonathan PantenburgPrincipal

Real-world, mission-critical, actionable advisory services as you and your community navigate the dynamic risks of today’s healthcare environment.
Stroudwater Associates is a leading national healthcare consulting firm serving healthcare clients exclusively. We focus on strategic, operational,and financial areas where our perspective offers the highest value.
We’re proud of our 34-year track record with rural hospitals, community hospitals, healthcare systems, and large physician groups.
ATLANTA | NASHVILLE | PORTLAND, ME
www.stroudwater.com800-947-5712
Strategic Advisory• Strategic Planning• Mergers, Affiliations & Partnerships• Population Health Strategies • Physician-Hospital Alignment• Strategic Facility Planning• Capital Planning & Access• Post-Acute Care Strategy
Operational Advisory • Performance Improvement & Restructuring• Provider Practice Operations Improvement• Revenue Cycle Solutions• Post-Acute Care Operations• Payor Contracting Advisory• Staffing & Productivity Improvement• Cost Report Reviews and Analysis