improving natural gas safety in...
TRANSCRIPT

PrepaASCECommEarthSafetyGas S CalifoSeismComm State CalifoGray Gove SSC-0
Improving Natural Gas Safety in Earthquakes Adopted July 11, 2002
red by: -25 Task ittee On
quake Issues For ystems
rnia ic Safety ission
of rnia Davis, rnor
2-03

Picture of a burnt home with a toppled water heater from the Upland Earthquake, February 28, 1990 Magnitude 5.5 Cover photo courtesy of Office of Emergency Services (OES)

i
Seismic Safety Commission Elaine White Alquist Assemblywoman William L. Gates (Alternate for Assemblywoman Alquist)
Richard Alarcon Senator Chris Modrzejewski (Alternate for Senator Alarcon)
Lawrence Klein Utilities
Mark Church Local Government
Linden Nishinaga Cities Government
Celestine Palmer Insurance
Andrew A. Adelman Cities/Building Official
Lucy Jones, Ph.D. Seismology
Stan Y. Moy Architecture and Planning
Daniel Shapiro Structural Engineering
Ashok S. Patwardhan Mechanical and Electrical Engineering
Bruce R. Clark, Ph.D. Geology, Commission Chairman
James Beall County Government Douglas E. Mochizuki Emergency Services
Don Parker Fire Protection
Commission StaffRichard J. McCarthy Executive Director
Robert Anderson Karen Cogan Kathy Goodell Henry Reyes Henry Sepulveda
Fred Turner Project Manager Sue Celli Abigail Browning Kyshia Davis Adam Myers Vincent S. Vibat
Project Consultant to the American Society of Civil Engineers Douglas Honegger Project consultant

ii
Acknowledgments This report was prepared by an Ad-Hoc task committee of the ASCE 25 standards committee for earthquake actuated automatic gas shutoff Devices Standards Committee of the American Society of Civil Engineers. The Task Committee was formed in the spring of 2001 with the goal of providing information on natural gas safety in earthquakes to the California Seismic Safety Commission (Commission). The Task Committee gratefully acknowledges the many guests that attended our meetings and provided valuable input to the final report. Major funding to facilitate the Task Committee’s efforts were provided by Pacific Gas and Electric Company and Southern California Gas Company. Financial support was also provided by several committee members whose organizations waived travel reimbursement for their representatives to attend Task Committee meetings. The Task Committee is also appreciative of the contractual support provided by the American Society of Civil Engineers, and Mr. Douglas Honegger for facilitating meetings and editing the report and guide insert.
ASCE 25 Natural Gas Safety in Earthquakes Task Committee Members
Massoud H. Abolhoda, Building Official City of Fremont
James C. McGill, Smart Safety Systems, Inc.
Paul Brooks Pacific Gas and Electric Company
Ishmael Messer, alternate for Bortugno Governor’s Office of Emergency Services,
Ed Bortugno Governor’s Office of Emergency Services
Stan Y. Moy, Task Committee Chair California Seismic Safety Commission
Patrick Campbell Division of State Architect
James Nishimoto, City of Los Angeles Dept of Building & Safety, thru 9/01
Richard Clark, alternate for Stepanian California Public Utilities Commission,
Richard J. Roth Jr., California Insurance Actuaries
Richard Conrad, alternate for Campbell Division of State Architect,
Raffy Stepanian, State of California Public Utilities Commission
Donald E. Dockray, Southern California Gas Company
Carl L. Strand, Strand Earthquake Consultants
Simon A. Davis, Brasscraft Inc.
Amir Tabakh, City of Los Angeles Department of Building and Safety, after 9/01
Perry Halterman, Fire Marshall, City of Riverside
Fred Turner California Seismic Safety Commission Staff
Douglas G. Honegger, D.G. Honegger Consulting
Stanley Weig, California Association of Realtors
Lawrence Klein, Commissioner California Seismic Safety Commission
R. Brady Williamson, Professor University of California at Berkeley
Brian James Plus 1 Safety Products, Inc.
Chris Wright, Business & Industry Council on Earthquake Planning/Preparedness
LeVal Lund, alternate for Wright Consultant
John Zanzi, Fire Chief Sebastopol Fire Department
Disclaimer: This report was prepared using a consensus process as agreed by the members. The opinions, findings, and recommendations presented in this report represent a consensus of the Task Committee and not necessarily those of individual task committee members or of the Commission. No warranty or representation, expressed or implied, with respect to the accuracy, completeness, or usefulness of the information contained in this report. The members of the Task Committee do not assume liability for any injury, death, property damage, loss of revenue, or any other effects of earthquakes.
iii
Improving Natural Gas Safety In Earthquakes
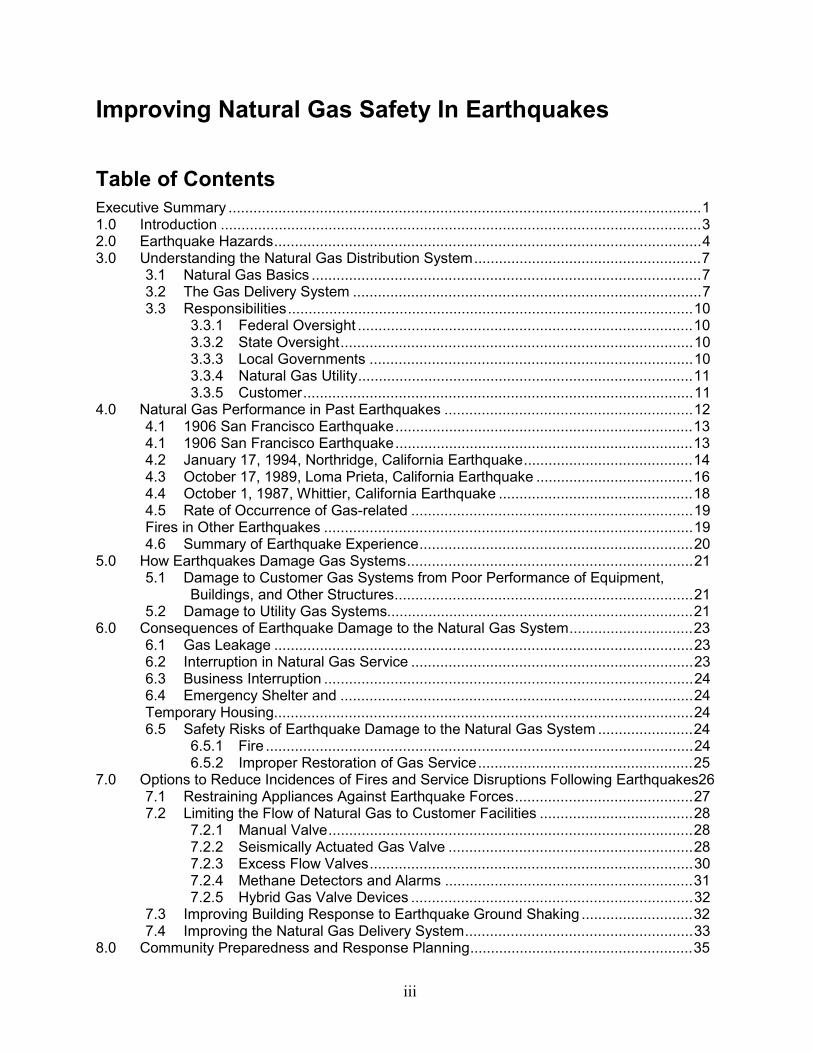
Table of Contents Executive Summary ..................................................................................................................1 1.0 Introduction ....................................................................................................................3 2.0 Earthquake Hazards.......................................................................................................4 3.0 Understanding the Natural Gas Distribution System.......................................................7
3.1 Natural Gas Basics ..............................................................................................7 3.2 The Gas Delivery System ....................................................................................7 3.3 Responsibilities..................................................................................................10
3.3.1 Federal Oversight .................................................................................10 3.3.2 State Oversight.....................................................................................10 3.3.3 Local Governments ..............................................................................10 3.3.4 Natural Gas Utility.................................................................................11 3.3.5 Customer..............................................................................................11
4.0 Natural Gas Performance in Past Earthquakes ............................................................12 4.1 1906 San Francisco Earthquake........................................................................13 4.1 1906 San Francisco Earthquake........................................................................13 4.2 January 17, 1994, Northridge, California Earthquake.........................................14 4.3 October 17, 1989, Loma Prieta, California Earthquake ......................................16 4.4 October 1, 1987, Whittier, California Earthquake ...............................................18 4.5 Rate of Occurrence of Gas-related ....................................................................19 Fires in Other Earthquakes .........................................................................................19 4.6 Summary of Earthquake Experience..................................................................20
5.0 How Earthquakes Damage Gas Systems.....................................................................21 5.1 Damage to Customer Gas Systems from Poor Performance of Equipment,
Buildings, and Other Structures........................................................................21 5.2 Damage to Utility Gas Systems..........................................................................21
6.0 Consequences of Earthquake Damage to the Natural Gas System..............................23 6.1 Gas Leakage .....................................................................................................23 6.2 Interruption in Natural Gas Service ....................................................................23 6.3 Business Interruption .........................................................................................24 6.4 Emergency Shelter and .....................................................................................24 Temporary Housing.....................................................................................................24 6.5 Safety Risks of Earthquake Damage to the Natural Gas System .......................24
6.5.1 Fire .......................................................................................................24 6.5.2 Improper Restoration of Gas Service....................................................25
7.0 Options to Reduce Incidences of Fires and Service Disruptions Following Earthquakes26 7.1 Restraining Appliances Against Earthquake Forces...........................................27 7.2 Limiting the Flow of Natural Gas to Customer Facilities .....................................28
7.2.1 Manual Valve........................................................................................28 7.2.2 Seismically Actuated Gas Valve ...........................................................28 7.2.3 Excess Flow Valves..............................................................................30 7.2.4 Methane Detectors and Alarms ............................................................31 7.2.5 Hybrid Gas Valve Devices ....................................................................32
7.3 Improving Building Response to Earthquake Ground Shaking ...........................32 7.4 Improving the Natural Gas Delivery System.......................................................33
8.0 Community Preparedness and Response Planning......................................................35

iv
8.1 Community Actions............................................................................................35 9.0 Cost and Benefit Considerations ..................................................................................37
9.1 Individual Perspective ........................................................................................39 9.2 Community Perspective .....................................................................................40
10.0 Conclusions and Recommendations ............................................................................43 11.0 References...................................................................................................................45 12.0 Appendices ..................................................................................................................48
List of Figures Figure 1. Peak Horizontal Ground Acceleration Hazard for the State of California (from Perkins et
al., 1996)...............................................................................................................................6 Figure 2. Natural Gas Delivery System (provided by Pacific Gas & Electric Company) ...............8 Figure 3. Common Meter Assemblies ..........................................................................................9 Figure 4. Water Heater with Restraint Straps .............................................................................27 Figure 5. Typical Installation Locations of Gas Safety Devices in Residential Applications ........29 Figure 6. Number of Fire Ignitions Versus Ground Shaking in Past Earthquakes (“Total Ignitions”
curve from relationship provided in HAZUS, 1999)..............................................................38
List of Tables Table 1. Modified Mercalli Intensity Scale (from FEMA -1997) ................................................... 5 Table 2. Northridge Earthquake Fire Statistics for Structures on January 17, 1994...................15 Table 3. Summary of Fires in the Loma Prieta Earthquake .......................................................16 Table 4. Causes of Fire Ignitions in San Francisco from the Loma Prieta Earthquake...............17 Table 5. Summary of Repairs by Southern California Gas Company Following the Whittier
Narrows Earthquake ..........................................................................................................18 Table 6. Summary of Building Fire Ignitions for Recent Earthquakes ........................................19 Table 7. Service Restoration Times for Three Recent California Earthquakes ..........................23 Table 8. Comparison of Alternatives to Improve Gas Safety in Earthquakes.............................26 Table 9. Valves and Alarm Devices That Assist in Limiting Natural Gas to Customer Facilities.34 Table 10. Summary of Community Actions to Improve Natural Gas Safety ...............................36 Table 11. Approximate Costs for Actions to Limit Natural Gas Flow After Earthquakes.............37
1
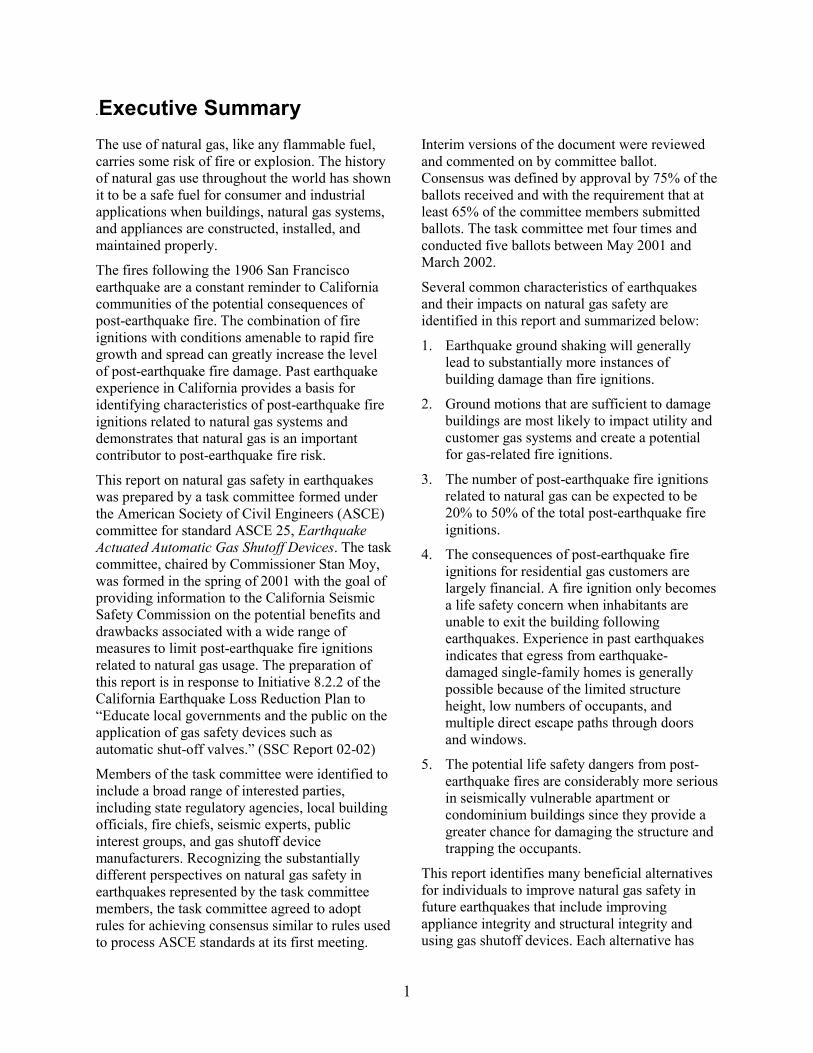
.Executive SummaryThe use of natural gas, like any flammable fuel, carries some risk of fire or explosion. The history of natural gas use throughout the world has shown it to be a safe fuel for consumer and industrial applications when buildings, natural gas systems, and appliances are constructed, installed, and maintained properly.
The fires following the 1906 San Francisco earthquake are a constant reminder to California communities of the potential consequences of post-earthquake fire. The combination of fire ignitions with conditions amenable to rapid fire growth and spread can greatly increase the level of post-earthquake fire damage. Past earthquake experience in California provides a basis for identifying characteristics of post-earthquake fire ignitions related to natural gas systems and demonstrates that natural gas is an important contributor to post-earthquake fire risk.
This report on natural gas safety in earthquakes was prepared by a task committee formed under the American Society of Civil Engineers (ASCE) committee for standard ASCE 25, Earthquake Actuated Automatic Gas Shutoff Devices. The task committee, chaired by Commissioner Stan Moy, was formed in the spring of 2001 with the goal of providing information to the California Seismic Safety Commission on the potential benefits and drawbacks associated with a wide range of measures to limit post-earthquake fire ignitions related to natural gas usage. The preparation of this report is in response to Initiative 8.2.2 of the California Earthquake Loss Reduction Plan to “Educate local governments and the public on the application of gas safety devices such as automatic shut-off valves.” (SSC Report 02-02)
Members of the task committee were identified to include a broad range of interested parties, including state regulatory agencies, local building officials, fire chiefs, seismic experts, public interest groups, and gas shutoff device manufacturers. Recognizing the substantially different perspectives on natural gas safety in earthquakes represented by the task committee members, the task committee agreed to adopt rules for achieving consensus similar to rules used to process ASCE standards at its first meeting.
Interim versions of the document were reviewed and commented on by committee ballot. Consensus was defined by approval by 75% of the ballots received and with the requirement that at least 65% of the committee members submitted ballots. The task committee met four times and conducted five ballots between May 2001 and March 2002.
Several common characteristics of earthquakes and their impacts on natural gas safety are identified in this report and summarized below:
1. Earthquake ground shaking will generally lead to substantially more instances of building damage than fire ignitions.
2. Ground motions that are sufficient to damage buildings are most likely to impact utility and customer gas systems and create a potential for gas-related fire ignitions.
3. The number of post-earthquake fire ignitions related to natural gas can be expected to be 20% to 50% of the total post-earthquake fire ignitions.
4. The consequences of post-earthquake fire ignitions for residential gas customers are largely financial. A fire ignition only becomes a life safety concern when inhabitants are unable to exit the building following earthquakes. Experience in past earthquakes indicates that egress from earthquake-damaged single-family homes is generally possible because of the limited structure height, low numbers of occupants, and multiple direct escape paths through doors and windows.
5. The potential life safety dangers from post-earthquake fires are considerably more serious in seismically vulnerable apartment or condominium buildings since they provide a greater chance for damaging the structure and trapping the occupants.
This report identifies many beneficial alternatives for individuals to improve natural gas safety in future earthquakes that include improving appliance integrity and structural integrity and using gas shutoff devices. Each alternative has
2
advantages and disadvantages related to the costs of implementation, level of safety improvement, and collateral benefits for non-earthquake emergencies. Because every situation is different, deciding which alternative will improve safety is best done on a case-by-case basis.
While this report identifies several community-based actions to improve gas safety in earthquakes, these actions need to be considered as one part of a comprehensive earthquake preparedness strategy. Determining which community actions are appropriate for a specific community requires a specific objective, a clear understanding of earthquake risks relative to other risks faced by the community, and potential drawbacks associated with a particular community action to improve safety. Determining which actions are appropriate for a specific community should be made on a case-by-case basis with a clear understanding of the potential benefits associated with the costs of implementing any measures. The relative rarity of damaging earthquakes and the uncertainty in quantifying the likelihood, location, and severity of earthquake hazards require that earthquake risks be addressed in a balanced fashion considering other potential natural and man-made hazards.
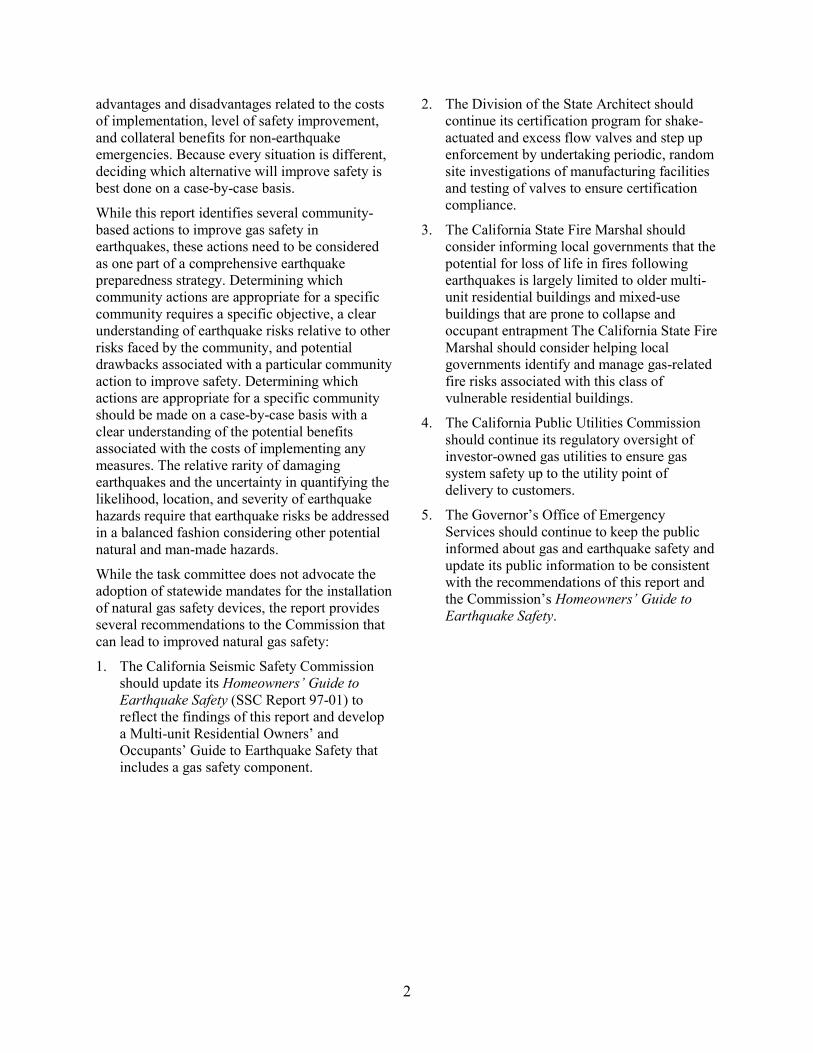
While the task committee does not advocate the adoption of statewide mandates for the installation of natural gas safety devices, the report provides several recommendations to the Commission that can lead to improved natural gas safety:
1. The California Seismic Safety Commission should update its Homeowners’ Guide to Earthquake Safety (SSC Report 97-01) to reflect the findings of this report and develop a Multi-unit Residential Owners’ and Occupants’ Guide to Earthquake Safety that includes a gas safety component.
2. The Division of the State Architect should continue its certification program for shake-actuated and excess flow valves and step up enforcement by undertaking periodic, random site investigations of manufacturing facilities and testing of valves to ensure certification compliance.
3. The California State Fire Marshal should consider informing local governments that the potential for loss of life in fires following earthquakes is largely limited to older multi-unit residential buildings and mixed-use buildings that are prone to collapse and occupant entrapment The California State Fire Marshal should consider helping local governments identify and manage gas-related fire risks associated with this class of vulnerable residential buildings.
4. The California Public Utilities Commission should continue its regulatory oversight of investor-owned gas utilities to ensure gas system safety up to the utility point of delivery to customers.
5. The Governor’s Office of Emergency Services should continue to keep the public informed about gas and earthquake safety and update its public information to be consistent with the recommendations of this report and the Commission’s Homeowners’ Guide to Earthquake Safety.

3
1.0 IntroductionThe use of natural gas, like any flammable fuel, carries some risk of fire or explosion. The history of natural gas use throughout the world has shown it to be a safe fuel for consumer and industrial applications when buildings, natural gas systems, and appliances are constructed, installed, and maintained properly. However, when potentially threatening conditions arise—such as an earthquake capable of damaging the gas system—gas utilities, gas customers, and government agencies should consider steps to maintain a high level of safety.
This report provides basic information to enable individual customers and their communities to make informed decisions on appropriate earthquake natural gas safety measures. This report focuses on natural gas and does not address special issues that may be related to the use of other fuel gases such as propane or liquefied petroleum gases. The audience for this information is gas customers, local governments, emergency response agencies, and others interested in assessing earthquake and other disaster preparedness alternatives and policies.
This report was prepared in response to Initiative 8.22 of the California Earthquake Loss Reduction Plan, which includes a requirement to “Educate local governments and the public on the application of gas safety devices such as automatic shutoff valves.” A companion document has been developed to serve the needs of a non-technical audience.
This report describes the hazards and operational characteristics of a typical gas utility system, along with a summary of recent earthquake experience in urban areas of California. Also addressed are potential types of earthquake damage to gas systems and their potential impact on building owners and surrounding communities. Finally, several alternatives for improving the safety of gas systems are described, along with associated benefits and drawbacks.

4
2.0 Earthquake HazardsEarthquakes can produce ground shaking and permanent ground displacements. The severity of hazards at a particular location depends on the size of the earthquake, distance from the earthquake source, and local soil characteristics.
The size of an earthquake is usually expressed in term of magnitude. Among several different magnitude scales, moment magnitude is the current standard used to measure of the size of an earthquake for engineering and risk management purposes. In this report, magnitude always refers to moment magnitude. The moment magnitude scale is logarithmic: every unit magnitude increase denotes a factor of approximately 32 in earthquake energy released. In California, damage has been associated with earthquakes having magnitudes greater than 5.5 to 6.0. The largest earthquake to strike an urban area in California was the 1906 San Francisco earthquake, estimated to have had a moment magnitude of 7.8.
For engineering and safety analysis purposes, the level of ground shaking is normally expressed in terms of acceleration that a rigid object located on the ground surface would experience. Acceleration is often expressed as a percentage of gravity, g. Conveniently, earthquake force on the rigid object—for example, a brick resting on the ground—can be related to a percentage of the weight of the object. Thus, a peak horizontal acceleration of 0.4 g on an object corresponds to a peak horizontal force of 40% of the weight of the object. The ground shaking produced by earthquakes moves in horizontal and vertical directions. For earthquakes in California and in other parts of the world, the maximum vertical shaking is typically about two-thirds of the maximum horizontal shaking, but may be higher very close to the earthquake’s source.
The severity of ground shaking in bedrock decreases or “attenuates” with increasing distance from the earthquake’s source. Bedrock motions pass into the overlying soils and produce the motions felt at the surface. Depending on the characteristics of the soil, surface ground motions can differ from motions in the bedrock. Thicker soil deposits with low stiffness generally tend to amplify bedrock motions. Attenuation and local
soil modifications make it impossible to describe the severity of ground shaking by referring only to a specific earthquake magnitude.
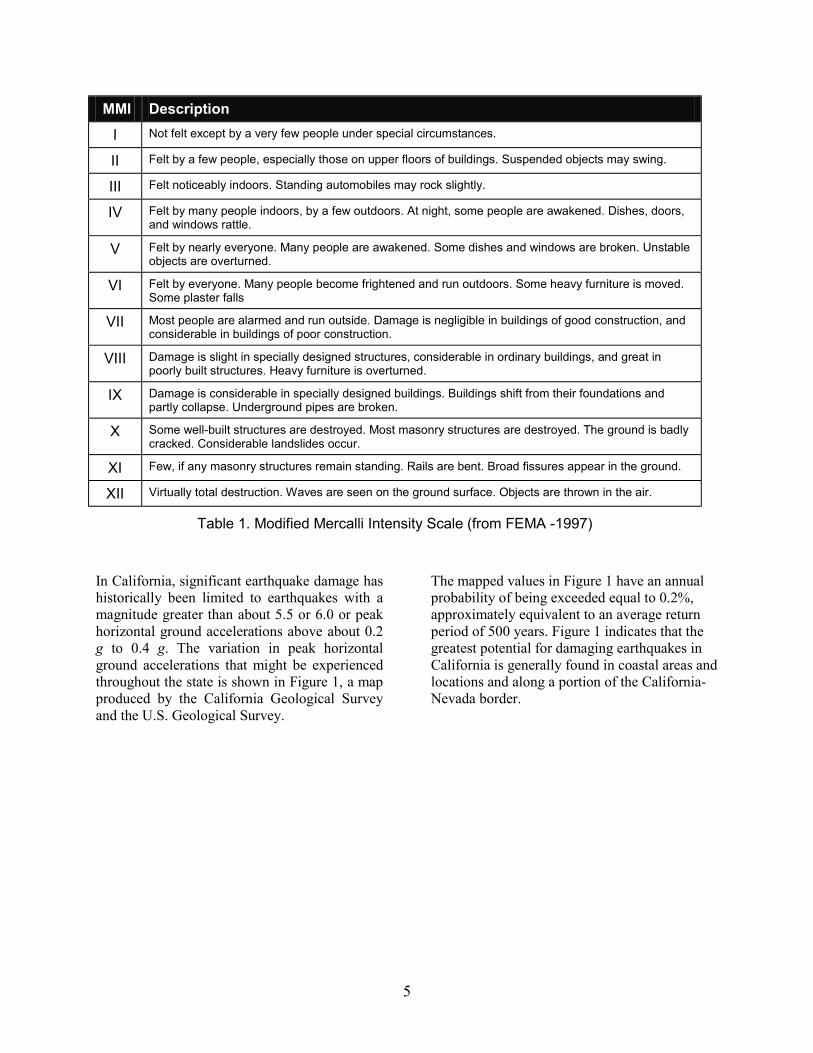
Another qualitative measure of ground shaking used in the United States is the Modified Mercalli Intensity (MMI) scale. The MMI scale was developed before the widespread availability of ground motion recording instruments. As shown in Table 1, it has 12 ranges, normally expressed in Roman numerals from I to XII in order of increasing shaking. The MMI scale generally relies on individual perceptions of the consequences of ground shaking. As with acceleration, the MMI is typically greatest near the fault and attenuates with distance from the epicenter of the earthquake. Significant earthquake damage is generally associated with MMI of VII or higher.
Earthquakes can also cause permanent ground displacement; abrupt surface ground movements along the fault are perhaps the most striking examples. Instability caused by the ground shaking typically causes other types of permanent ground displacement. Ground settlement, downslope movement of large areas of soil (similar to landslides), and sloughing of soil or rock from steep hillsides are other common types of permanent ground displacement. Damage from surface faulting is typically limited to a zone within a few tens of meters from the fault. Other forms of permanent ground displacement, especially those associated with landslide-like movements, can have dimensions of hundreds of meters.
Advances in the fields of seismology, geology, and geotechnical and structural engineering are continually being made. These advances help improve the reliable quantification of earthquake risks and their impacts on structures and the urban environment as a whole. However, experts are still uncertain when assessing the level of earthquake hazard and the associated damage it may produce. When formulating actions to improve individual or public safety, the uncertainty in earthquake risk should be considered along with other non-earthquake risks.
5
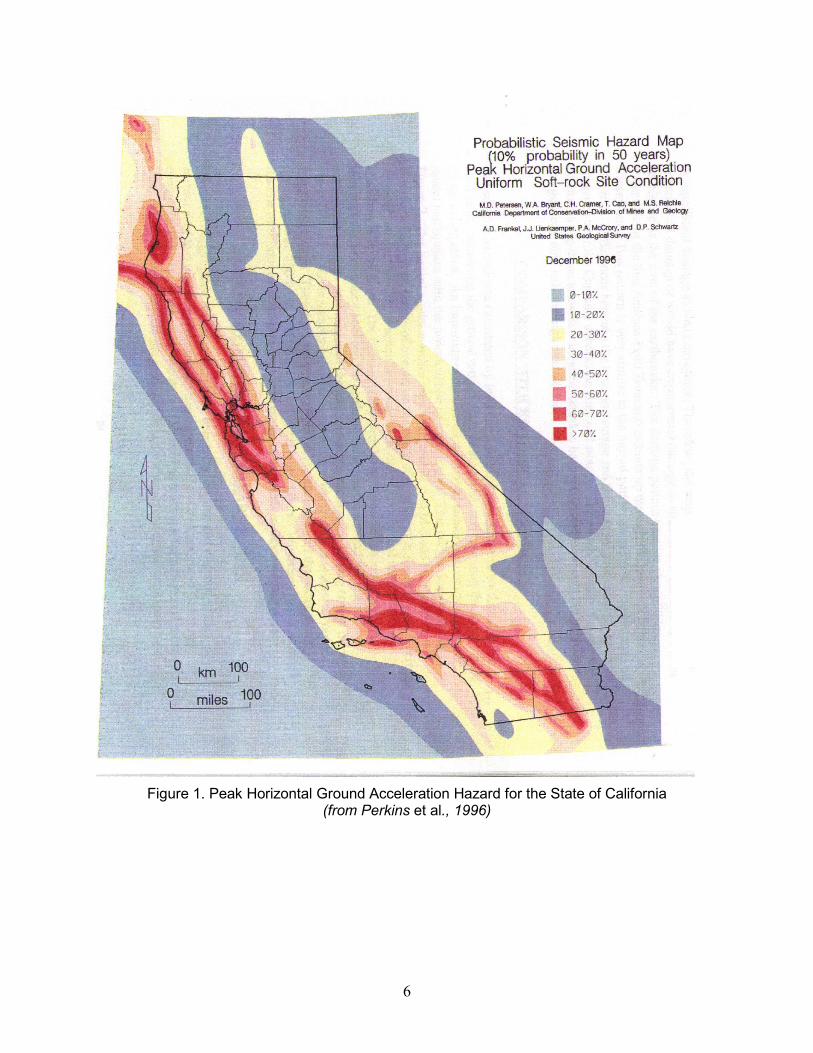
In California, significant earthquake damage has historically been limited to earthquakes with a magnitude greater than about 5.5 or 6.0 or peak horizontal ground accelerations above about 0.2 g to 0.4 g. The variation in peak horizontal ground accelerations that might be experienced throughout the state is shown in Figure 1, a map produced by the California Geological Survey and the U.S. Geological Survey.
The mapped values in Figure 1 have an annual probability of being exceeded equal to 0.2%, approximately equivalent to an average return period of 500 years. Figure 1 indicates that the greatest potential for damaging earthquakes in California is generally found in coastal areas and locations and along a portion of the California-Nevada border.
MMI Description I Not felt except by a very few people under special circumstances.
II Felt by a few people, especially those on upper floors of buildings. Suspended objects may swing.
III Felt noticeably indoors. Standing automobiles may rock slightly.
IV Felt by many people indoors, by a few outdoors. At night, some people are awakened. Dishes, doors, and windows rattle.
V Felt by nearly everyone. Many people are awakened. Some dishes and windows are broken. Unstable objects are overturned.
VI Felt by everyone. Many people become frightened and run outdoors. Some heavy furniture is moved. Some plaster falls
VII Most people are alarmed and run outside. Damage is negligible in buildings of good construction, and considerable in buildings of poor construction.
VIII Damage is slight in specially designed structures, considerable in ordinary buildings, and great in poorly built structures. Heavy furniture is overturned.
IX Damage is considerable in specially designed buildings. Buildings shift from their foundations and partly collapse. Underground pipes are broken.
X Some well-built structures are destroyed. Most masonry structures are destroyed. The ground is badly cracked. Considerable landslides occur.
XI Few, if any masonry structures remain standing. Rails are bent. Broad fissures appear in the ground.
XII Virtually total destruction. Waves are seen on the ground surface. Objects are thrown in the air.
Table 1. Modified Mercalli Intensity Scale (from FEMA -1997)
6
Figure 1. Peak Horizontal Ground Acceleration Hazard for the State of California
(from Perkins et al., 1996)
7
3.0 Understanding the Natural Gas Distribution System
3.1 Natural Gas Basics Natural gas is a fossil fuel extracted from deep underground wells. It is a physical mixture of various gases, typically containing 85 to 95% methane, 7 to 12% ethane and small amounts of propane, butane, nitrogen, and carbon dioxide. The proportions vary from field to field and sometimes from well to well.
Natural gas is odorless and colorless when it comes from the wellhead. As a safety measure, an odorant is added so gas leaks can be detected. Commonly known as mercaptans, the odorant is a blend of organic chemicals containing sulfur. The odor of the mercaptans can be detected long before there is sufficient gas to cause a fire, explosion or asphyxiation.
Unlike propane, natural gas is lighter than air. Natural gas typically has a specific gravity of 0.6, meaning that it weighs about 0.6 times as much as air. The term specific gravity refers to the weight of the gas as compared to the weight of air.
Not all mixtures of gas and air will burn. Some mixtures have too little gas, while others have so much gas there is not enough air left to burn. The two cutoff points between combustible mixtures and non-combustible mixtures are called the Explosive Limits.
• The Lower Explosive Limit (LEL) for natural gas is approximately 5%. At concentrations below the LEL, there is insufficient gas to cause a fire or explosion.
• The Upper Explosive Limit (UEL) for natural gas is approximately 15%. At concentrations above the UEL, there is insufficient air to cause a fire or explosion.
The ideal mixture for combustion of natural gas is approximately 10% and the ignition point is 1208° F.
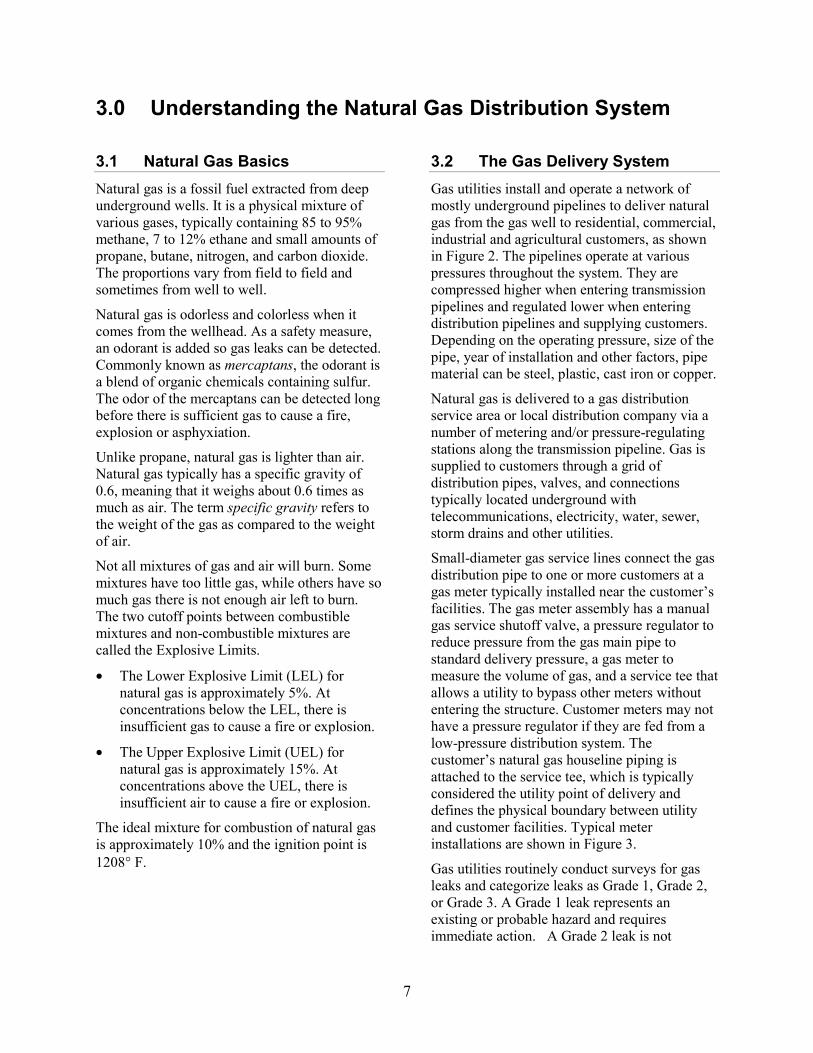
3.2 The Gas Delivery System Gas utilities install and operate a network of mostly underground pipelines to deliver natural gas from the gas well to residential, commercial, industrial and agricultural customers, as shown in Figure 2. The pipelines operate at various pressures throughout the system. They are compressed higher when entering transmission pipelines and regulated lower when entering distribution pipelines and supplying customers. Depending on the operating pressure, size of the pipe, year of installation and other factors, pipe material can be steel, plastic, cast iron or copper.
Natural gas is delivered to a gas distribution service area or local distribution company via a number of metering and/or pressure-regulating stations along the transmission pipeline. Gas is supplied to customers through a grid of distribution pipes, valves, and connections typically located underground with telecommunications, electricity, water, sewer, storm drains and other utilities.
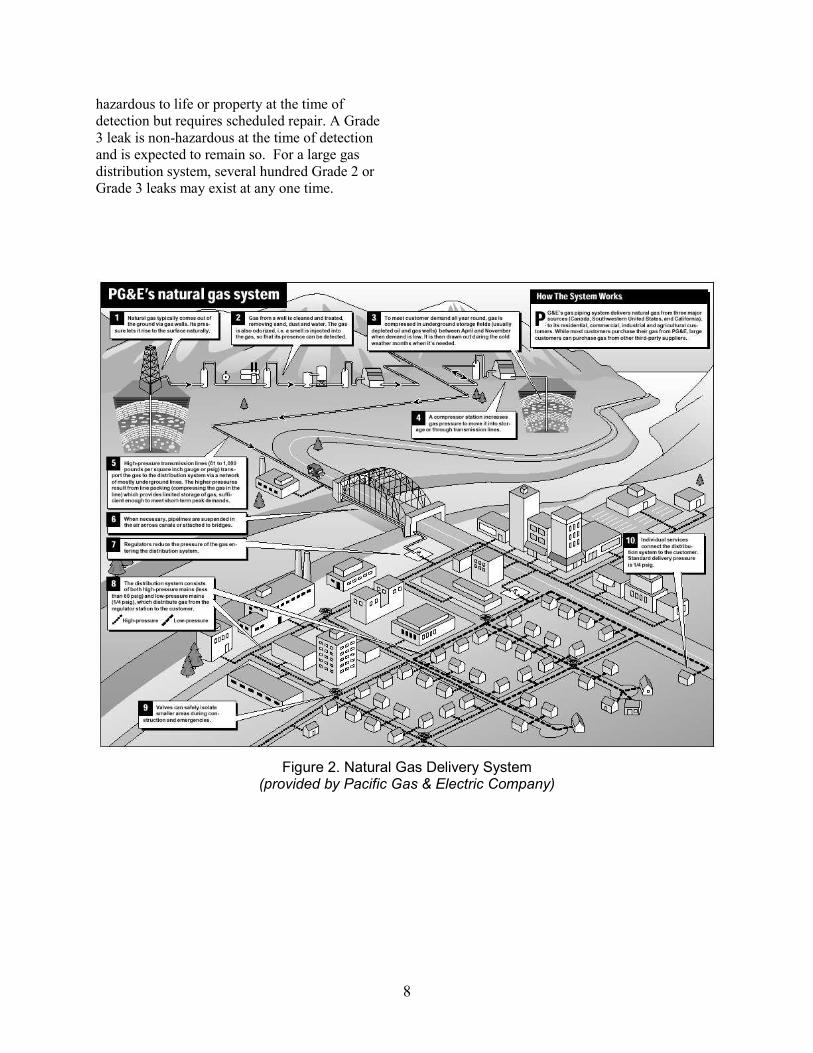
Small-diameter gas service lines connect the gas distribution pipe to one or more customers at a gas meter typically installed near the customer’s facilities. The gas meter assembly has a manual gas service shutoff valve, a pressure regulator to reduce pressure from the gas main pipe to standard delivery pressure, a gas meter to measure the volume of gas, and a service tee that allows a utility to bypass other meters without entering the structure. Customer meters may not have a pressure regulator if they are fed from a low-pressure distribution system. The customer’s natural gas houseline piping is attached to the service tee, which is typically considered the utility point of delivery and defines the physical boundary between utility and customer facilities. Typical meter installations are shown in Figure 3.
Gas utilities routinely conduct surveys for gas leaks and categorize leaks as Grade 1, Grade 2, or Grade 3. A Grade 1 leak represents an existing or probable hazard and requires immediate action. A Grade 2 leak is not
8
hazardous to life or property at the time of detection but requires scheduled repair. A Grade 3 leak is non-hazardous at the time of detection and is expected to remain so. For a large gas distribution system, several hundred Grade 2 or Grade 3 leaks may exist at any one time.
Figure 2. Natural Gas Delivery System
(provided by Pacific Gas & Electric Company)
9
a) Typical Residential Meter with Pressure Regulator
b) Multiple Meters –Typical for Multi-Unit Housing
Figure 3. Common Meter Assemblies
10
3.3 ResponsibilitiesNatural gas systems are subject to various safety requirements imposed by federal, state, and local agencies. Customers are responsible for the safe use of natural gas at their facilities.
3.3.1 Federal Oversight The Department of Transportation’s Research and Special Programs Administration, acting through the Office of Pipeline Safety, administers the national regulatory program to assure the safe transportation of natural gas, petroleum, and other hazardous materials by pipeline. The National Transportation Safety Board makes recommendations to the Office of Pipeline Safety for changes in pipeline safety regulations. The Office of Pipeline Safety develops regulations and other approaches to risk management to assure safety in design, construction, testing, operation, maintenance, and emergency response of pipeline facilities.
3.3.2 State Oversight Gas utility operations and intrastate pipelines are commonly regulated at the state level by a utility commission or similar organization. In California, the California Public Utilities Commission oversees safety standards and procedures for electricity, telecommunications, natural gas, rapid transit systems, light rail transit systems, and common carrier railroads. The California Public Utilities Commission acts in both a judicial and legislative capacity. In setting rates or standards of service and general policy, it may, like a court, take testimony, issue decisions and orders, cite for contempt, and subpoena witnesses and records. The jurisdiction of state utility commissions, like the California Public Utilities Commission, is typically limited to investor-owned utilities and the portion of the natural gas system up to the utility delivery point to the customer. Public
utility commissions in other states have the same general function, although the specific scope and enforcement authority may vary.
Regulation of minimum safety requirements for customers’ portions of the natural gas system occurs through the state adoption of building codes and other regulations governing the installation of gas lines and appliances in customers’ facilities. In addition, states can regulate the certification and performance requirements of devices sold to consumers (e.g., water heater restraints, automatic earthquake shutoff valves, and excess flow valves).
3.3.3 Local Governments City and county governments are typically responsible for ensuring the overall safety of their communities. Local governments assess safety needs, identify potential risks to meeting those needs, and determine alternatives to reduce the risks. Alternatives often include local guidelines and ordinances to assure safe construction and practices. Other equally important alternatives may focus on reducing the impacts of earthquakes or other emergencies through rapid response and recovery measures that are often coordinated with the private sector, industry, and other local, state, and federal government agencies. Local authorities also have a responsibility to consider the impacts of earthquakes in urban planning decisions related to building construction methods and materials, building density, capacity of fire protection services, and traffic management. Finally, local governments are responsible for informing their communities of potential earthquake risks and actions the local population is expected to follow to reduce or manage those risks.
11
3.3.4 Natural Gas Utility The natural gas utility is responsible for designing, constructing, maintaining, and operating the natural gas system safely and efficiently. This includes all the facilities used in the delivery of gas to any customer up to and including the point of delivery to the customers’ gas piping system. Utilities meet this responsibility through compliance with existing regulations, coordinating their emergency planning with local governments, and incorporating earthquake-resistant design considerations into their maintenance activities and new construction.
3.3.5 Customer Customers are responsible for using gas safely on their property and within their buildings and other facilities. Customers meet this responsibility by maintaining their gas appliances in good working condition, assuring that only qualified individuals are engaged to modify or maintain their gas service and facility piping, and knowing what to do before and after earthquakes to maintain the safe operation of their natural gas service.

12
4.0 Natural Gas Performance in Past Earthquakes Natural gas utilities and other researchers now collect information on gas system performance following each major earthquake. Experience from recent earthquakes in California is particularly useful in examining the performance of natural gas systems designed and operated according to typical practices in the United States. The development and implementation of earthquake preparedness plans by local governments and public education can reduce post-earthquake fire damage.
This report addresses the role of natural gas in the total number of fires, the primary causes of gas-related fires, and the required service restoration efforts. Given a good basis of understanding of the relative number of natural gas fires and their associated causes, alternatives can be assessed to improve natural gas safety. However, it is important to distinguish fire ignitions from general fire damage. Any fire has an initial ignition that can come from any source. The size of the fire and the damage it causes is highly variable and depends on a multitude of factors. These factors can lead to a single ignition causing a fire that destroys an entire city block, or a fire that is quickly extinguished without fire department assistance.
Historic earthquakes may not be representative of current types of buildings, appliances, natural gas systems, water delivery systems, transportation systems, population densities, emergency services, social impacts and other factors associated with future earthquakes. Similarly, drawing meaningful conclusions about natural gas safety from earthquakes in other parts of the world is often tenuous; significant differences exist in the pipeline materials, operating pressures, types of gas appliances, and building construction used outside of the United States. Nevertheless, lessons can be inferred from historic and recent foreign earthquakes. These lessons inform our
understanding of the role natural gas can be expected to play in fire ignitions in the future.
Some caution is necessary when extrapolating information from past earthquakes. Nearly every major earthquake in California has demonstrated some seismologic characteristic that was previously unknown or considered insignificant. Similarly, future earthquakes may produce quantities and types of infrastructure damage not previously observed. In particular, the number of fire ignitions experienced in past earthquakes may not be a reliable indicator of future ignitions because of the complex relationship between such variables as ground shaking severity, time of day, and damage sustained by the infrastructure. The following conditions, when combined, pose the greatest risk for severe post-earthquake fire damage:
1. Buildings are unoccupied and individuals are not present to mitigate damage to gas systems or control small fires.
2. High building density or dense, fire-prone vegetation.
3. High wind and low humidity weather conditions.
4. Damage to water systems that severely limits firefighting capabilities.
5. Reduced responsiveness of firefighting resulting from impaired communications, numerous requests for assistance, direct damage to fire stations, restricted access because of traffic congestion and damaged roadways, and delays in mutual aid from neighboring fire districts.
It is unlikely that more than one of these conditions will be present when earthquakes occur.
The following summaries of natural gas performance in past earthquakes are based on published reports (see Section 11.0).
13
4.1 1906 San Francisco Earthquake The 1906 San Francisco earthquake was a pivotal event in highlighting the devastation of post-earthquake fire. However, it is not included in the following discussions of earthquake ignition statistics because of the lack of detailed information on the specific causes of the 1906 fires. Also, the reliance on oil and gas in 1906 is not relevant when estimating potential fire ignition hazards in future earthquakes. Even so, several observations from the 1906 earthquake related to the risk of residential buildings and actions taken to reduce fire risk are comparable to experience in other earthquakes.
The 1906 earthquake occurred on April 18 at 5:13 AM and lasted 65 seconds, rupturing the San Andreas fault over 180 miles and creating a zone of destruction up to 50 miles wide along this length. The magnitude of the earthquake is estimated to have been 7.8. Sixteen fire alarms were reported in widely separated localities within the City of San Francisco. The primary sources of ignition were the upsetting of oil lamps and oil and gas stoves, contact of flames from lamps and gas jets with combustible material, rupturing of chimneys and flues, and upsetting of boilers and furnaces.
Many breaks in the city’s water distribution mains and conduits occurred due to settlement of soft soils caused by shaking. In addition, major pipelines supplying the city from reservoirs to the south were broken at fault crossings and at soft soils and marshes, rendering the water system
inoperable. Fire experts at the time surmised that even if their water supply had not failed, the fire department could not have efficiently handled so many fires at once.
Individuals quickly extinguished many fires that started in residential buildings, but because of the early hour, fires that started in downtown buildings grew to alarming proportions before anyone could reach them. Within three hours, nine fires were in full conflagration. Winds increased over the next three days, spreading the fires westward.
The ensuing fires, and not the direct effects of ground shaking, caused the greatest loss, estimated at 85 to 90% of the $524 million in damage in 1906 dollars (approximately $18 billion in 2002 dollars). Fires covering 2,593 acres (4.05 square miles) comprised 490 city blocks and 32 partial blocks and caused hundreds of casualties. San Francisco’s fire affected more than ten times the area of a fire caused by a magnitude 6.9 earthquake in Hyogo-Ken Nanbu, Japan on January 17, 1995.
San Francisco had a history of previous fire losses that was two to three times greater than that of comparable cities. In 1905, the National Board of Fire Underwriters warned that that the potential for conflagration in San Francisco was “very severe” since it had “excessively large areas, great heights, numerous unprotected openings in buildings, a general absence of fire breaks, and highly combustible buildings.”

14
4.2 January 17, 1994, Northridge, California Earthquake Occurring on January 17, 1994, at 4:31 AM, the Northridge, California, earthquake had a moment magnitude of 6.7. The epicenter was located in the city of Reseda, near the center of the San Fernando Valley. Data on MMI shaking intensity were recorded by local postmasters and processed by the US Geological Survey. The earthquake resulted in the total loss of electric power to the City of Los Angeles and adjacent areas.
The region affected by strong ground motion in the Northridge earthquake encompassed a variety of building types and building ages. Residential buildings comprised approximately 93% of the building stock in Los Angeles County. Post-earthquake damage surveys were able to correlate high concentrations of structural damage and the location of pre-1920 structures built without modern seismic design considerations.
Southern California Gas Company is the gas service provider in the region severely affected by the earthquake. In its gas incident report to the Office of Pipeline Safety one month following the earthquake, Southern California Gas Company noted it had received more than 276,000 disaster-related orders in the days following the earthquake. Damage to the gas piping system included 35 failures on older transmission lines, 123 failures of steel distribution mains, and 117 failures in service lines. An additional 394 corrosion leaks were identified during leak surveys following the earthquake.
The total number of customers left without service immediately after the main shock and subsequent aftershocks exceeded 150,000, with approximately 133,000 of the service interruptions initiated by customers as a precautionary measure. Approximately 15,000 of the interrupted services were found to have leaks of unspecified severity when service was restored.
More than 3,400 employees, 420 provided by other California gas utilities as part of mutual assistance agreements, were mobilized to restore gas service. Service was restored to approximately 120,000 customers within 12 days. Approximately 9,000 customers remained without service one month after the earthquake because of building
damage or an inability to access the customer’s building or facility.
Table 2 summarizes the distribution of earthquake-related fire ignitions and the response by various fire departments within the first 24 hours following the earthquake. The totals in Table 2 are taken from the most recent published report on the Northridge earthquake fire ignitions. The number and distribution of fire ignitions differ slightly among investigators, but the combined total of 110 earthquake-related fire ignitions is representative of the range of 85 to 120 reported by other investigators.
The City of Los Angeles, which includes the San Fernando Valley, sustained 77 of the 110 earthquake-related fire ignitions on the day of the earthquake. Fifty-five of these occurred in residential structures: 35 in one- or two-family residences and 20 in multi-family residences. A total of eight fire ignitions occurred in schools, offices, or commercial properties. Preliminary statistics on fire ignition response by the Los Angeles Fire Department indicate that 13 fire ignitions had a natural gas appliance as the source of heat ignition. The Los Angeles Fire Department conducted a separate investigation within a few months following the Northridge earthquake, and identified 38 incidents where natural gas may have contributed to the fire ignition. Of these, 27 were in single- or multi-family residences and 22 involved gas appliances with water heater damage, accounting for 16 fire ignitions.
The Northridge earthquake is the only earthquake in the United States for which adequate detailed data exists on fire ignitions, building damage, and appliance damage. Information on the performance of appliances in general can be inferred from data available for approximately 75% of the damage claims processed by the Federal Emergency Management Agency. More than 400,000 claims were made for water heater damage and more than 700,000 claims were made for all gas appliance damage (e.g., water heaters, stoves, furnaces, ranges, and dryers). Claims ranged from repairs of minor damage to replacement with no information available on the type of damage.

15
Fire Department Earthquake Fire Ignitions
Gas-Related Earthquake Fire
Ignitions Beverly Hills 0 0 Burbank 0 0 City of Los Angeles 77 38 Costa Mesa 0 0 Covina 1 0 Glendale 0 0 El Monte 1 0 Fillmore 2 1 Glendale 0 0 Inglewood 1 0 Long Beach 1 0 Newport Beach 0 0 Pasadena 1 ? Santa Monica 10 6 Santa Paula 0 0 South Pasadena 0 0 Los Angeles County 15 6 Ventura County 10 3 TOTAL 110 54
Table 2. Northridge Earthquake Fire Statistics for Structures on January 17, 1994
Multiple claims could have been submitted by a single property owner for damage to multiple appliances. Assuming that only 125,000 (25%) of the claims represent damage that could have resulted in a gas-related fire ignition, the rate of occurrence of fire ignition, given damage to the gas appliance in the Northridge earthquake, was less than 1 in 3,000.
Gas-related fire ignition can be compared to building damage by comparing the percentage of damage that occurred within areas experiencing MMI VIII or greater. Based on the description of damage associated with MMI and observations in past earthquakes, an MMI of VIII or greater is considered to be the threshold for significant building damage. Assuming that fire ignitions are restricted to a high MMI overestimates the resulting rate of occurrence of fire ignition compared to building damage. Based on statistics for the Los Angeles Fire Department, the vast majority of gas-related fire ignitions occurred in
wood-frame residential structures. More than 225,000 wood-frame structures were exposed to ground shaking of MMI VIII or greater (OES/EQE, 1995). In loss estimation studies following the earthquake, buildings suffering more than 65% damage from the earthquake were considered near total losses. Buildings with more than 65% damage in areas experiencing MMI VIII or greater leads to a 0.45% chance (1 in 220) that a wood-frame structure would be damaged beyond repair in the Northridge earthquake.
Using the same building population and assuming that 50% to 90% of these structures had natural gas service, the average rate of occurrence of gas-related fire ignition for any individual structure in the Northridge earthquake is estimated to have been 0.024% to 0.044%, or roughly 1 to 2 chances in 4,500. Thus, the rate of occurrence of a gas-related fire ignition was approximately 10% of the rate of occurrence of sustaining significant structural damage.

16
4.3 October 17, 1989, Loma Prieta, California Earthquake The Loma Prieta earthquake occurred on October 17, 1989 at 5:04 PM, approximately 97 kilometers (60 miles) south of San Francisco with a moment magnitude of 7.2. The earthquake severely damaged approximately 900 homes near the source and in the San Francisco Bay area. The damage in the Bay area resulted from amplification of the ground motions at the surface by soft soils and liquefaction of soils associated with land reclamation projects, some dating back to the 1800s.
More than 60 lives were lost, most in the collapse of the upper deck of the I-880 Cypress Street viaduct. Near the epicenter, the communities of Los Gatos, Santa Cruz, Hollister, and Watsonville suffered significant damage. The Marina District of San Francisco and areas near the waterfront in Oakland and Alameda also were damaged. The earthquake caused electric power loss for much of the northern San Francisco Peninsula.
Pacific Gas and Electric Company provides natural gas and electric service to the affected regions. Three service areas were isolated from the rest of the system due to considerable earthquake damage. Soil failure in the Marina District of San Francisco severely damaged the old cast-iron and steel low-pressure gas distribution system. The gas distribution system in the immediate area was isolated, affecting approximately 5,100 Marina District customers. Near the epicenter, the low-pressure gas distribution systems in the cities of Los Gatos and
Watsonville were isolated, affecting 306 customers.
Approximately 160,000 gas customers were without gas service following the earthquake, mostly due to customers shutting off their own service in response to media safety announcements immediately after the earthquake. Over a period of nine days, personnel from Pacific Gas and Electric Company and six neighboring utilities and contract plumbers restored service to more than 156,000 individual customers. From these teams, an average of 1,000 personnel worked during five of the days.
During the two weeks following the earthquake, 1,094 leaks were identified in the utility gas system, and 601 were classified as Grade 1, or potentially hazardous to life or property. Approximately 510 (85%) of the Grade 1 leaks occurred on service piping to buildings. Approximately one-third of these exhibited existing factors (third-party damage, corrosion, material failure, or construction defects) that, combined with the earthquake effects, accelerated the leaks. Not surprisingly, the locations of high concentrations of gas system repairs were found to coincide with locations of high building damage.
Although the earthquake caused fire ignitions near the earthquake source, San Francisco suffered the greatest number of post-earthquake fire ignitions. A summary of the fire statistics for the Loma Prieta earthquake is shown in Table 3.
Area Earthquake Fire Ignitions
San Francisco (Oct. 17-19) 31 Berkeley 1 Santa Cruz County 20 Watsonville 3 Santa Clara County 1 Nisene Marks State Park 1
Table 3. Summary of Fires in the Loma Prieta Earthquake
17
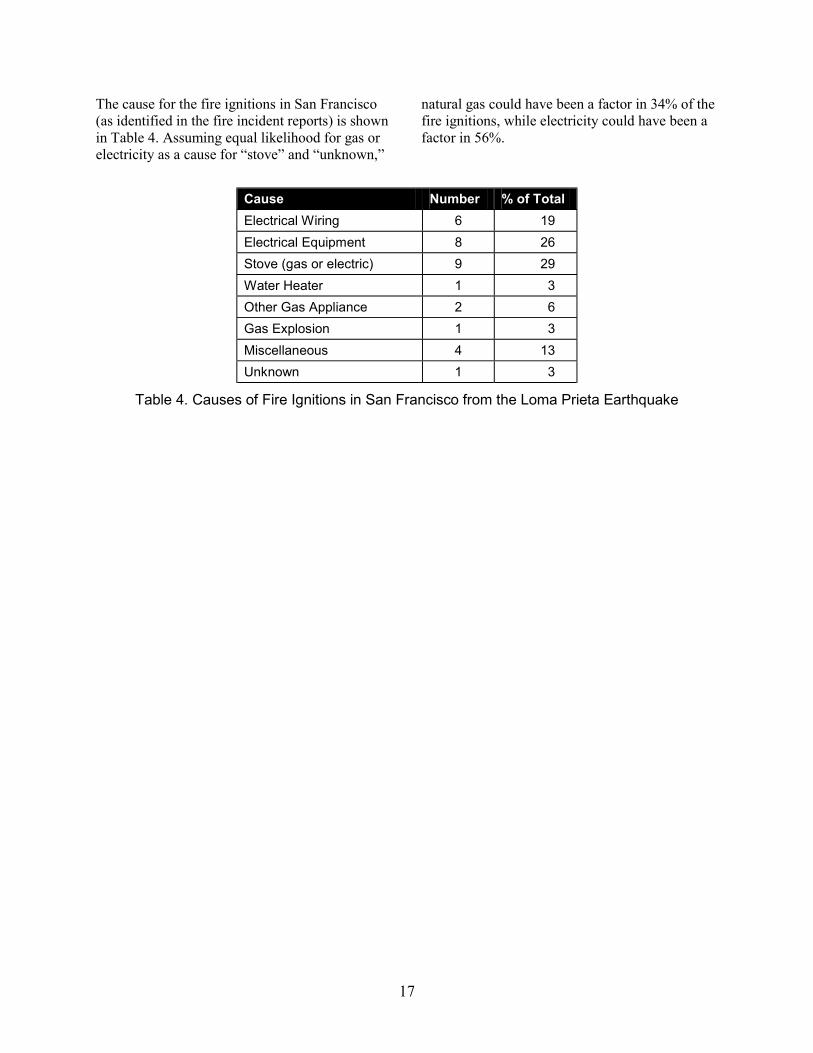
The cause for the fire ignitions in San Francisco (as identified in the fire incident reports) is shown in Table 4. Assuming equal likelihood for gas or electricity as a cause for “stove” and “unknown,”
natural gas could have been a factor in 34% of the fire ignitions, while electricity could have been a factor in 56%.
Cause Number % of Total Electrical Wiring 6 19 Electrical Equipment 8 26 Stove (gas or electric) 9 29 Water Heater 1 3 Other Gas Appliance 2 6 Gas Explosion 1 3 Miscellaneous 4 13 Unknown 1 3
Table 4. Causes of Fire Ignitions in San Francisco from the Loma Prieta Earthquake
18
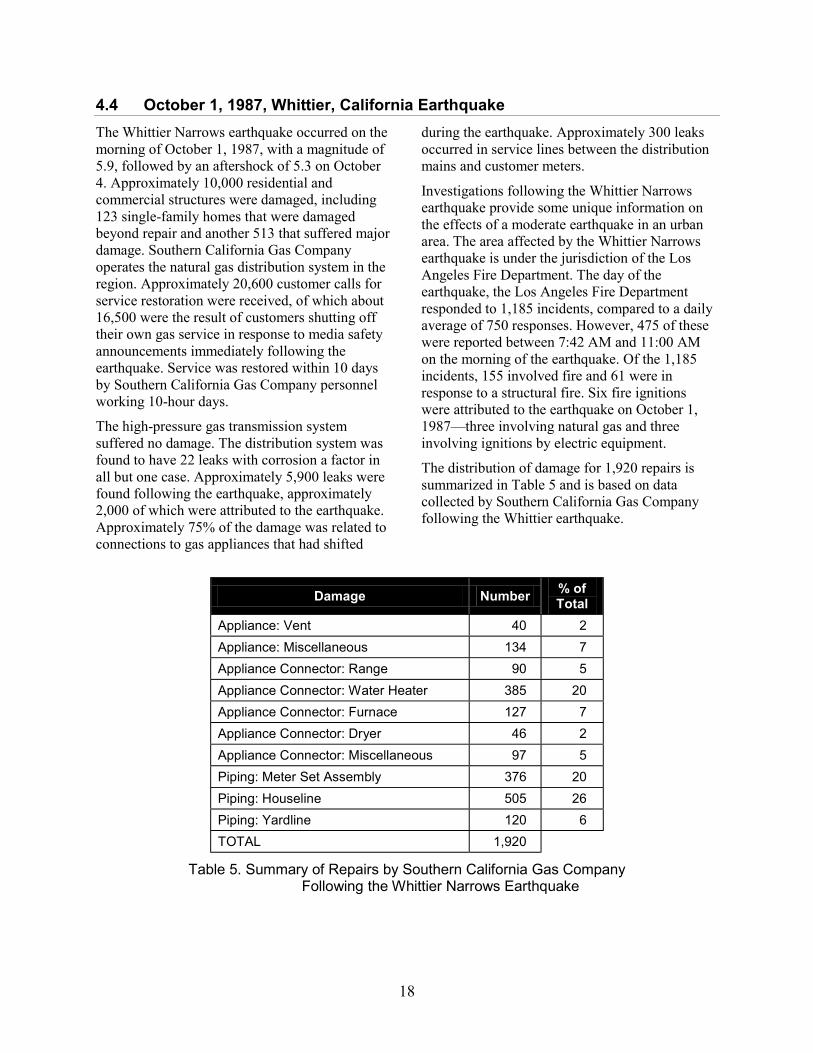
4.4 October 1, 1987, Whittier, California Earthquake The Whittier Narrows earthquake occurred on the morning of October 1, 1987, with a magnitude of 5.9, followed by an aftershock of 5.3 on October 4. Approximately 10,000 residential and commercial structures were damaged, including 123 single-family homes that were damaged beyond repair and another 513 that suffered major damage. Southern California Gas Company operates the natural gas distribution system in the region. Approximately 20,600 customer calls for service restoration were received, of which about 16,500 were the result of customers shutting off their own gas service in response to media safety announcements immediately following the earthquake. Service was restored within 10 days by Southern California Gas Company personnel working 10-hour days.
The high-pressure gas transmission system suffered no damage. The distribution system was found to have 22 leaks with corrosion a factor in all but one case. Approximately 5,900 leaks were found following the earthquake, approximately 2,000 of which were attributed to the earthquake. Approximately 75% of the damage was related to connections to gas appliances that had shifted
during the earthquake. Approximately 300 leaks occurred in service lines between the distribution mains and customer meters.
Investigations following the Whittier Narrows earthquake provide some unique information on the effects of a moderate earthquake in an urban area. The area affected by the Whittier Narrows earthquake is under the jurisdiction of the Los Angeles Fire Department. The day of the earthquake, the Los Angeles Fire Department responded to 1,185 incidents, compared to a daily average of 750 responses. However, 475 of these were reported between 7:42 AM and 11:00 AM on the morning of the earthquake. Of the 1,185 incidents, 155 involved fire and 61 were in response to a structural fire. Six fire ignitions were attributed to the earthquake on October 1, 1987—three involving natural gas and three involving ignitions by electric equipment.
The distribution of damage for 1,920 repairs is summarized in Table 5 and is based on data collected by Southern California Gas Company following the Whittier earthquake.
Damage Number % of Total
Appliance: Vent 40 2 Appliance: Miscellaneous 134 7 Appliance Connector: Range 90 5 Appliance Connector: Water Heater 385 20 Appliance Connector: Furnace 127 7 Appliance Connector: Dryer 46 2 Appliance Connector: Miscellaneous 97 5 Piping: Meter Set Assembly 376 20 Piping: Houseline 505 26 Piping: Yardline 120 6 TOTAL 1,920
Table 5. Summary of Repairs by Southern California Gas Company Following the Whittier Narrows Earthquake
19
4.5 Rate of Occurrence of Gas-related Fires in Other Earthquakes
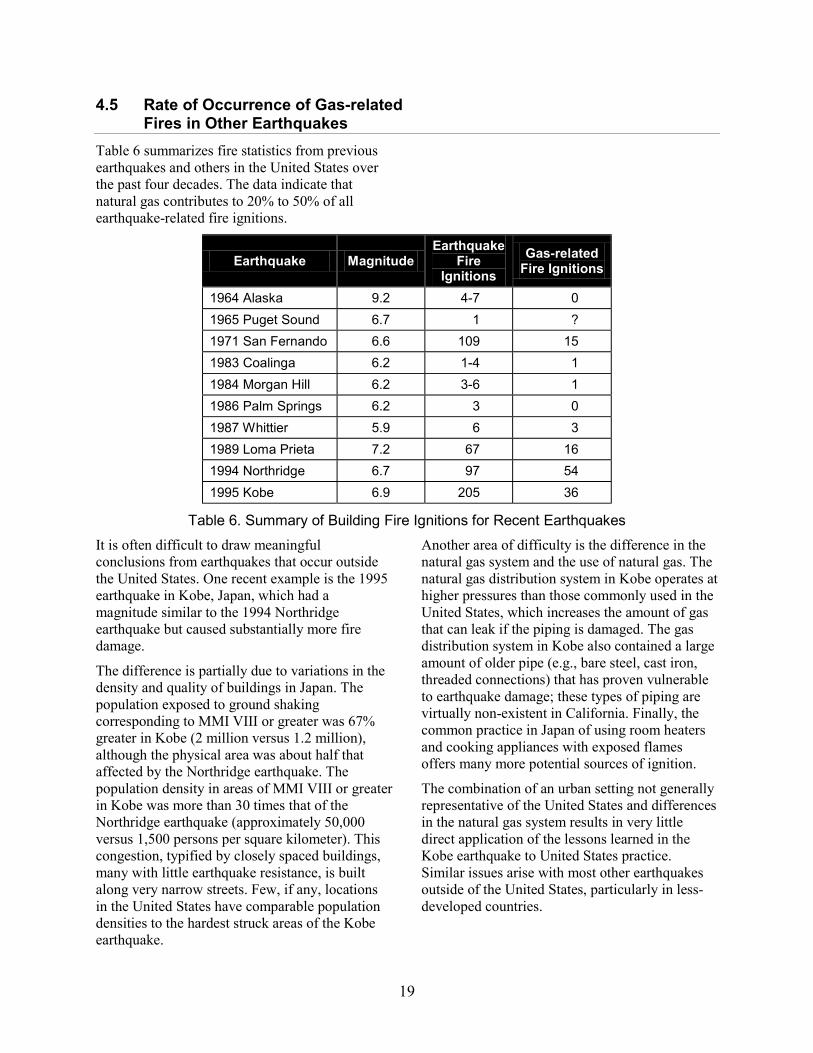
Table 6 summarizes fire statistics from previous earthquakes and others in the United States over the past four decades. The data indicate that natural gas contributes to 20% to 50% of all earthquake-related fire ignitions.
Earthquake Magnitude Earthquake
Fire Ignitions
Gas-related Fire Ignitions
1964 Alaska 9.2 4-7 0 1965 Puget Sound 6.7 1 ? 1971 San Fernando 6.6 109 15 1983 Coalinga 6.2 1-4 1 1984 Morgan Hill 6.2 3-6 1 1986 Palm Springs 6.2 3 0 1987 Whittier 5.9 6 3 1989 Loma Prieta 7.2 67 16 1994 Northridge 6.7 97 54 1995 Kobe 6.9 205 36
Table 6. Summary of Building Fire Ignitions for Recent Earthquakes It is often difficult to draw meaningful conclusions from earthquakes that occur outside the United States. One recent example is the 1995 earthquake in Kobe, Japan, which had a magnitude similar to the 1994 Northridge earthquake but caused substantially more fire damage.
The difference is partially due to variations in the density and quality of buildings in Japan. The population exposed to ground shaking corresponding to MMI VIII or greater was 67% greater in Kobe (2 million versus 1.2 million), although the physical area was about half that affected by the Northridge earthquake. The population density in areas of MMI VIII or greater in Kobe was more than 30 times that of the Northridge earthquake (approximately 50,000 versus 1,500 persons per square kilometer). This congestion, typified by closely spaced buildings, many with little earthquake resistance, is built along very narrow streets. Few, if any, locations in the United States have comparable population densities to the hardest struck areas of the Kobe earthquake.
Another area of difficulty is the difference in the natural gas system and the use of natural gas. The natural gas distribution system in Kobe operates at higher pressures than those commonly used in the United States, which increases the amount of gas that can leak if the piping is damaged. The gas distribution system in Kobe also contained a large amount of older pipe (e.g., bare steel, cast iron, threaded connections) that has proven vulnerable to earthquake damage; these types of piping are virtually non-existent in California. Finally, the common practice in Japan of using room heaters and cooking appliances with exposed flames offers many more potential sources of ignition.
The combination of an urban setting not generally representative of the United States and differences in the natural gas system results in very little direct application of the lessons learned in the Kobe earthquake to United States practice. Similar issues arise with most other earthquakes outside of the United States, particularly in less-developed countries.
20
4.6 Summary of Earthquake Experience The three most recent California earthquakes to strike in or near an urban region serve as examples of what might be expected in future earthquakes in the United States. Ground motions sufficient to damage buildings are most likely to impact utility and customer gas systems and create the potential for gas-related fire ignitions. Although people are advised in an emergency to shut off their gas service only when they observe or suspect gas appliance or structural damage, or can hear or smell leaking gas, most customers shut off their gas as a precaution, which increases service restoration calls. Gas restoration efforts following major earthquakes require massive mobilization of properly trained service personnel.
Natural gas also may be a contributor to the post-earthquake fire risk. The number of fire ignitions caused by earthquakes will be an order of magnitude less than the number of buildings damaged to the point of total loss or near collapse. The total number of fire ignitions in future earthquakes may be larger or smaller than in past earthquakes. However, gas-related fire ignitions can be expected to be 20% to 50% of all post-earthquake fire ignitions. While an earthquake may produce numerous leaks in the customer’s gas system, the potential for fire ignition from natural gas will be low compared to the number of leaks.

21
5.0 How Earthquakes Damage Gas Systems The most common earthquake damage to gas systems results from damage to the buildings in which the gas system is placed and the equipment to which gas lines are connected. Earthquakes can produce ground displacements that can also damage natural gas systems directly. Common modes of damage for both are described below.
5.1 Damage to Customer Gas Systems from Poor Performance of Equipment, Buildings, and Other Structures
The most important factor contributing to earthquake damage to customer gas systems is poor performance of buildings, other structures, and gas-fired equipment. As demonstrated by recent earthquake experience, shifting or toppling of gas appliances such as water heaters, boilers, furnaces, dryers and stoves is the principal cause of most gas-related, post-earthquake fire ignitions (71% in the Northridge earthquake).
In most residential and commercial installations, gas appliances are supplied with natural gas using small- diameter threaded steel pipe (houseline) that attaches directly to the appliance or by a short length of stainless steel flexible tubing. Although the flexible tubing connection can accommodate modest appliance movement, both the connections and the tubing are susceptible to damage during large earthquake movements.
In some cases, building codes require water heaters to be supported above the floor. This support is commonly provided by a wood-frame structure with gypsum board covering the sides and a plywood top. If not designed and constructed properly, these support frames can shift or fail under earthquake loads. Elevated supports are typical in garages or other locations where flammable vapors like gasoline may be present near the floor.
Other typical modes of damage are related to earthquake damage of a structure with natural gas service. The potential for damage to interior gas piping (houseline) arises when there is a partial collapse of interior walls and partitions and large lateral deformation of the structural frame. Many
older residential structures may be inadequately anchored to their foundations or have a cripple wall or other weak structural element between the foundation and the building frame. Sliding of the building or collapse of the cripple wall can damage the gas lines and meters, usually at the location where gas service enters the building. Mobile homes supported on jack stands with no lateral bracing are particularly vulnerable. Several significant fires in the Northridge earthquake occurred when unbraced mobile homes fell off their jack stands onto their gas meters, severing the piping connected to the meter.
Gas meters are also susceptible to indirect earthquake damage caused by debris falling from customer facilities. Potential sources of impact include unreinforced masonry chimneys or facades, falling masonry from damaged walls, falling parapets and other architectural features, and falling blocks used to construct residential fences. These modes of damage are less frequently observed and pose a lesser risk because they lead to release and dispersion of gas to the atmosphere.
5.2 Damage to Utility Gas Systems The utility portion of the natural gas distribution system consists of the buried piping network and limited aboveground facilities for monitoring and controlling gas flow in the network. Primarily, earthquakes damage the utility portion through permanent ground displacements such as surface faulting, landslide-like movements, and soil failure produced by strong ground shaking.
To withstand the effects of permanent ground displacement, buried pipelines must either have the ability to move with the ground or sufficient strength to force the ground to move around the pipe. Older pipelines are much more susceptible to damage from permanent ground displacement because of weaknesses from corrosion, outdated construction methods or less sturdy materials. The response of buried pipelines depends on a number of factors, including pipeline joint strength, wall thickness, diameter, material properties, soil strength, and the amount and variation of ground

22
displacement associated with the earthquake hazard.
Ground shaking is hazardous to aboveground components of the natural gas distribution system, which typically include gas measurement and pressure regulation facilities. Damage to aboveground components of the natural gas system is rare because of the ruggedness typically incorporated into their construction.
Ground shaking has also been associated with some damage to buried pipelines. Although the
precise mechanism of the damage is not well understood, it is generally believed that soil constraints on a buried pipeline force the pipeline to experience the same ground deformations associated with ground shaking. Damage from ground shaking is a concern for older pipelines that may have been weakened by corrosion, prior damage, or mechanical failures, or were constructed using outdated methods or materials. Pipelines most susceptible to damage from ground shaking include cast iron, aging bare steel pipe, and pipe with threaded connections.

23
6.0 Consequences of Earthquake Damage to the Natural Gas System
Damage to natural gas systems has several consequences for individuals and the community at large.
6.1 Gas Leakage Damage to natural gas systems can cause gas leaks within customer facilities. The amount of leakage depends on the severity of damage and the operating pressure of the gas system. In many cases for residential appliances, damage may include partial or complete fracture of threaded pipe connections, flexible tubing, pipe fittings, or damage to vent piping. The displacement of unanchored gas equipment or gas equipment without a strong foundation or footing can be large enough to sever or damage the gas supply line to the equipment or damage the equipment itself. The absence of a flexible connection between the gas supply line and unsecured equipment increases the likelihood of damage from equipment movements.
6.2 Interruption in Natural Gas Service The most common consequence of earthquake damage to the natural gas systems is interruption in service. Despite the fact that public service announcements consistently advise customers to
shut off service only if they smell gas, hear gas escaping, see a broken gas line, or observe structural damage to the building, customers continue to cut off their gas as a precaution.
Other causes are actions taken by the natural gas utility, which can include shutting off gas service to structures that have been severely damaged by an earthquake and shutting in portions of the gas distribution system where significant damage has occurred.
Customer outages and restoration times for three recent California earthquakes are summarized in Table 7. Variation in restoration time is a function of the number of outages, the size of the service area experiencing service interruption, the quantity of personnel and equipment mobilized to restore service, and logistical difficulties caused by other earthquake damage such as road closures. For example, utility personnel restored service following the Whittier earthquake, while personnel from other utilities and private contractors were employed to restore service following the Northridge and Loma Prieta earthquakes. Based on experience from these two earthquakes, the maximum level of service restoration for an earthquake producing 100,000 customer outages or more can vary between 10,000 and 20,000 restorations per day.
Table 7. Service Restoration Times for Three Recent California Earthquakes
Earthquake Number of Customer Outages*
Restoration Time
Northridge 120,000 12 days Loma Prieta 156,355 9 days Whittier 20,600 10 days
*Does not include customers affected by the additional time needed to reconstruct gas distribution facilities or structures

24
6.3 Business Interruption Loss of natural gas service can close businesses or significantly increase the period of interruption to office buildings, restaurants, manufacturing plants and other facilities. This interruption may lead to the closure of some businesses that provide much-needed services or supplies to emergency response teams. Extended interruptions can result in lost jobs and reduced business tax revenue. However, business interruption can be mitigated in buildings where maintenance and operations resources are available. Large commercial and light industrial businesses often have full-time maintenance personnel qualified to inspect customer gas systems and restore gas service.
6.4 Emergency Shelter and Temporary Housing
Following major earthquakes, building damage will likely force people to move into emergency shelters or hotels and apartments outside the area of high earthquake damage. Loss of natural gas service may increase the number of persons requiring temporary shelter because of the lack of fuel for heating and cooking.
6.5 Safety Risks of Earthquake Damage to the Natural Gas System There are two primary risks to public safety from damage to a natural gas system sufficient to cause release of natural gas. If the leakage is sufficient to create a flammable air-gas mixture and an ignition source is present, there is a risk of fire, or, in rare cases, explosion. The life safety risks from a gas-related fire are greatest if a fire is initiated in a damaged or collapsed building that has not been evacuated. Another potential life safety risk can result if gas service is restored improperly in the presence of gas leaks that are not first detected and repaired. Improper service restoration may also fail to correct inadequate venting conditions that might lead to the accumulation of carbon monoxide in a structure.
6.5.1 Fire The risk of a gas-related fire in residential structures following earthquakes is generally very low because of the numerous conditions necessary for gas ignition (see, for example, Williamson and Groner, 2000).
The ignition of leaking gas requires an ignitable mixture of gas and oxygen between the approximate range of lower (5%) and upper (15%) explosive limits and an ignition source. This can occur in the presence of a pilot light or when a light switch is turned on or off. For natural gas that is lighter than air and tends to disperse, the rate of gas leakage capable of igniting is related to the air exchange rate in the area of the leak. The likelihood of ignition is higher in conditions where poor air mixing allows formation of pockets of higher concentrations of gas.
Based on a review of the causes of fire ignitions in recent earthquakes, the following points summarize fire ignition scenarios involving gas or electric service. These scenarios incorporate the necessary presence of a fuel source and an ignition source.
• The earthquake interrupts electrical service to a structure and an electric-powered device is displaced or damaged and comes into contact with a quantity of fuel. When electric power is restored to the building, the device causes the flammable fuel to ignite. Example: A high-intensity light falling onto a polyurethane mattress.
• A hot water heater or other appliance is overturned or moved, rupturing the gas houseline or appliance connector, and the released gas is ignited by a flame or spark.
• A gas pipe in a building is broken due to building damage and the released gas ignites.
• A gas pipe in a building is broken and an electric spark from damaged electrical wiring is present, igniting the released gas.
• Bottles and/or open cans of flammable liquids are thrown to the floor by the earthquake, and an open gas flame or an electric spark ignites the vapors from the spilled liquid.

25
• Cooking oils and other kitchen fuels are spilled during the earthquake, and either electrical or gas-based cooking equipment ignites them.
• An open flame from a candle or Bunsen burner contacts a quantity of fuel.
• Arcing from crossed wires or transformer damage ignites brush near a structure.
• A person ignites a fire by arson or by turning on light switches in the presence of a gaseous fuel.
Life safety consequences from post-earthquake fires depend on the ability of individuals to evacuate buildings following earthquakes. Building layouts differ as to whether occupants must use shared paths of emergency egress or by a direct, unshared route. In multi-unit occupancies (R-1 occupancies), common paths of egress and limited means of escape make it more likely that persons can be trapped after earthquakes. The greater the number of occupants in a building, the greater is the likelihood they will be trapped in an emergency. Damage to exterior doors of apartment and condominium units often prevent occupants from exiting safely. In buildings of more than two or three stories, the escape paths usually include enclosed stairways whose doors can be jammed by the racking deflections of the doorframes caused by the earthquake. Frequently, the elevators in these buildings are also unusable. Some older buildings may have exterior fire escapes, but they may not be well attached after earthquakes. Single-family residential units (R-3 occupancies), on the other hand, cannot, by code, be more than three stories high, and their windows are usually constructed in such a way that they can serve as secondary exits. More and easier pathways exist for escape in R-3 occupancies than in R-1 occupancies. In addition, if the R-3 structure is properly tied to its foundation, it is less likely to lose its means of escape than the larger and more complex R-1 structures.
6.5.2 Improper Restoration of Gas Service Qualified individuals with the necessary knowledge and experience should restore gas service. As defined by ASCE 25-97, a “Qualified Person” is “Any individual, firm, corporation, or company that is experienced in such work and is familiar with all precautions required based on manufacturer’s instructions, local codes, and the authority having jurisdiction.” The process of restoring gas service to customers following earthquakes is the same regardless of whether conditions existed to warrant shutting off the service in the first place. A qualified person should check gas houselines, appliance connectors and appliances for leaks, and inspect gas equipment, vents and flues to identify damage or obstructions that could lead to fires or the accumulation of dangerous carbon monoxide fumes. These inspections by a qualified gas utility service technician or certified plumber require access to the customer’s building or facility.
Post-earthquake restoration of gas service by non-qualified personnel increases the potential risk of injury or death from the accumulation and ignition of unidentified gas leaks and carbon monoxide in damaged gas appliance vents. Lengthy service interruptions may lead to non-qualified personnel re-establishing service without taking the necessary precautions.
26
7.0 Options to Reduce Incidences of Fires and Service Disruptions Following Earthquakes
Many individuals and community leaders perceive the primary risk of post-earthquake fires is related to damage to the natural gas system. As indicated in the previous summary, this perception does not agree with actual experience in recent earthquakes. However, the role of gas in post-earthquake fire is important and does deserve attention. The most devastating damage from an earthquake is conflagrations, or uncontrolled, rapidly spreading fires, particularly in an urban center with high building density. Damage to the natural gas system is only one potential source of post-earthquake fires and is often not the primary contributor. Some of the greatest historical fires in the United States were caused by human actions combined with adverse weather conditions and inadequate firefighting resources. Past experience has led to improvements in modern city firefighting capabilities and fire safety regulations. The low likelihood of the occurrence of a damaging earthquake with concurrent adverse meteorological conditions may also partly explain why post-earthquake fire has not been a significant factor in the United States since the 1906 San Francisco earthquake. Nevertheless, the potential for conflagrations following earthquakes exists if a specific set of adverse conditions are present (see Section 4.0).
Several options are available to improve the earthquake performance of natural gas systems and increase public safety. Individual customers are often more concerned about protecting their property and the safety of those on their property. Government considerations may include protecting the community at large and maintaining a level of commerce necessary to meet the needs of the community while balancing investment in earthquake risk reduction with the other community needs.
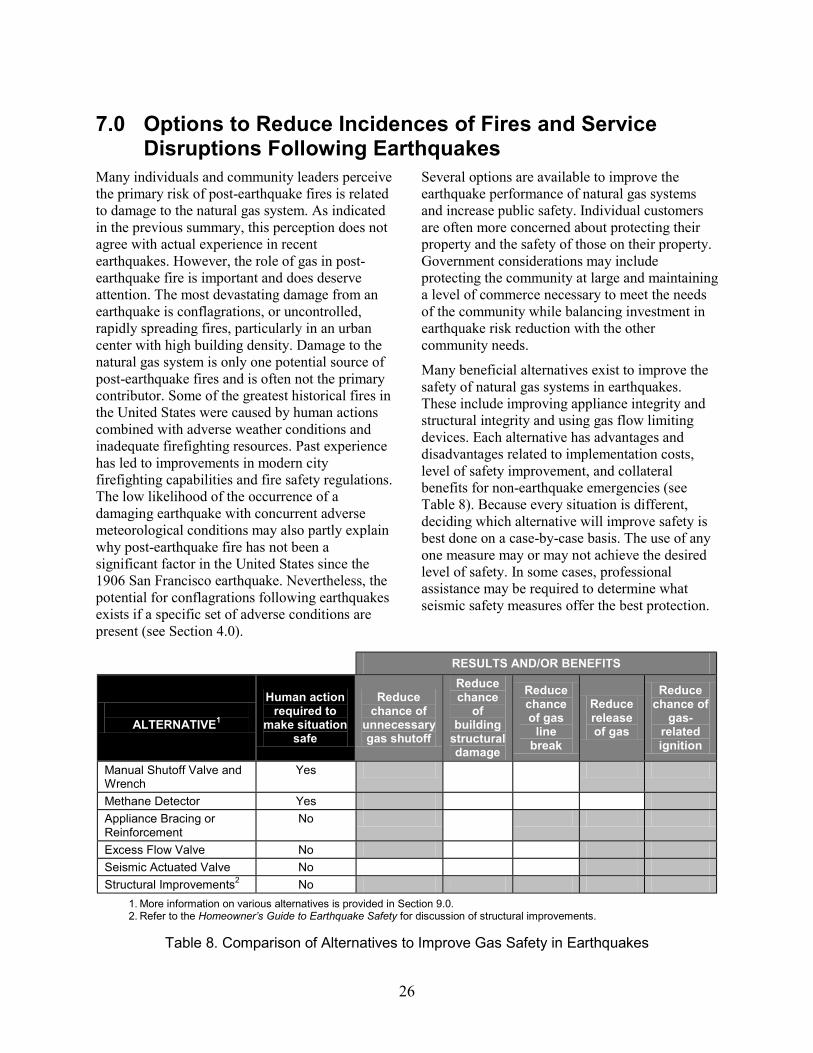
Many beneficial alternatives exist to improve the safety of natural gas systems in earthquakes. These include improving appliance integrity and structural integrity and using gas flow limiting devices. Each alternative has advantages and disadvantages related to implementation costs, level of safety improvement, and collateral benefits for non-earthquake emergencies (see Table 8). Because every situation is different, deciding which alternative will improve safety is best done on a case-by-case basis. The use of any one measure may or may not achieve the desired level of safety. In some cases, professional assistance may be required to determine what seismic safety measures offer the best protection.
RESULTS AND/OR BENEFITS
ALTERNATIVE1
Human action required to
make situation safe
Reduce chance of
unnecessary gas shutoff
Reduce chance
of building
structural damage
Reduce chance of gas
line break
Reduce release of gas
Reduce chance of
gas- related ignition
Manual Shutoff Valve and Wrench
Yes
Methane Detector Yes Appliance Bracing or Reinforcement
No
Excess Flow Valve No Seismic Actuated Valve No Structural Improvements2 No
1. More information on various alternatives is provided in Section 9.0. 2. Refer to the Homeowner’s Guide to Earthquake Safety for discussion of structural improvements.
Table 8. Comparison of Alternatives to Improve Gas Safety in Earthquakes

27
7.1 Restraining Appliances Against Earthquake Forces As recent earthquakes have demonstrated, significant improvements in natural gas safety can be achieved by preventing gas equipment from moving during ground shaking. In residential buildings, the greatest risk of damage is from the movement of appliances and appliance connectors, especially water heaters (see Figure 4). Section 19211 of the California Health and Safety Code requires “all new and replacement water heaters to be braced, anchored, or strapped to resist falling or horizontal displacement due to earthquake motion.” Several commercially available hardware kits provide a reliable means to restrain water heaters. There are also many suggested techniques using materials readily available at most hardware stores (e.g., plumber’s tape, steel conduit, lag screws). Commercially available hardware kits to restrain other natural gas appliances (e.g., stoves, furnaces, clothes dryers) are less common. These appliances often can be restrained using brackets and other common hardware to connect the appliances to the floor or wall. In all cases, flexible gas connections should be used to connect appliances to the natural gas supply to reduce the likelihood of damage if movement should occur.
For large, multi-family residences and commercial or industrial applications, the gas equipment may be large and include boilers and furnaces. The use of seismic restraints and flexible connections to the piping supplying gas to these types of equipment must be suitable for the application, which often requires the assistance of a professional. In addition to restraining the gas equipment, it may be necessary to strengthen equipment supports, particularly in the case of large water heaters supported above the floor.
Restraining natural gas appliances to withstand earthquakes is not a costly improvement for the homeowner. Even for customers using larger gas-fired equipment, the investment in properly restraining the equipment is far less than the cost of replacing it.
Restraining natural gas appliances also prevents damage to the appliances themselves, increasing the likelihood that homeowners will have fuel for heat and cooking following an earthquake. One especially important benefit of securing water heaters is to ensure the availability of 40 to 50 gallons of drinking water retained in the water heater.
For the community at large, improving the seismic performance of natural gas equipment can reduce the post-earthquake demands for firefighting and other emergency services. Reduced equipment damage in commercial and industrial facilities can speed up business recovery following earthquakes.
Figure 4. Water Heater with Restraint Straps
28
7.2 Limiting the Flow of Natural Gas to Customer Facilities The following sections summarize the methods available for limiting the flow of natural gas to buildings or appliances, thereby reducing the likelihood of a gas-fueled fire following earthquakes. These methods do not address elimination of non-gas-related ignition and fuel sources. These methods apply to the customer-owned portion of the natural gas supply system. Many of the actions that can be taken to limit the flow of natural gas require adding hardware components to the customer’s gas piping system. Some require special expertise to assure that installations are performed in compliance with existing codes and regulations, while others can be done by the homeowner or property owner. Note: This section does not address potential safety issues associated with incorrect installation of the devices.
7.2.1 Manual Valve Manually turning off gas service to a building or facility is the most common method used and can be highly effective if someone is present to smell or hear escaping gas. Gas service shutoff valves are installed by the gas utility at all gas meter locations or “curb” locations if the meter is not accessible from the outside. To be most effective, customers should maintain access to the shutoff valve and keep an adjustable pipe or crescent wrench nearby. Special “earthquake” wrenches with fixed openings are marketed as tools for turning off gas service valves, but these may not fit a particular valve because of various sizes of the tang (the bar-shaped part protruding from the valve used to turn the valve open or closed). To shut off the gas, the tang on the valve is rotated a quarter turn in either direction so that the tang is crosswise to the pipe. To minimize the possibility of unauthorized operation of the valve, wrenches should be located near, but not at, the gas meter location. Other considerations for relying on manual valves to control gas flow following earthquakes are provided in Table 9 at the end of this section.
7.2.2 Seismically Actuated Gas Valve A seismically actuated gas valve consists of a sensing mechanism that detects vibratory motion and a valve mechanism that shuts off the flow of gas in response to the motion. Seismically actuated gas valves are not typically sensitive to changes in gas flow or pressure and are normally installed on the customer’s natural gas houseline piping downstream of the utility point of delivery near the gas meter (see Figure 5). Installation of any device downstream of the gas meter requires special expertise and should not done by homeowners. Installation should be done only by a certified plumber, specialty contractor or other qualified person who can correctly size the valve for the particular installation and present and future appliance loads. Similarly, qualified personnel should re-establish gas service following device actuation to ensure that the gas system is safe.
In the past, many earthquake-activated gas valves were activated from vibrations unrelated to earthquakes, such as heavy truck traffic or accidental bumping of the device. Seismically actuated gas valves on the market today that comply with current standards are not prone to this problem.
Gas service may be shut off when the valve senses motions that exceed trigger levels, regardless of whether the gas system is damaged. Seismically actuated gas valves can also reactivate during aftershocks and increase the demand for multiple service restorations.
Since a seismically actuated gas valve is normally installed near the gas meter, extensive structural damage (e.g., a structure falling off its foundation onto the gas meter) may damage the device itself or cause damage upstream of the device.
In California, seismically actuated gas valves marketed for consumer earthquake safety applications require certification by the Division of the State Architect. California has adopted the American Society of Civil Engineers standard ASCE 25-97, Earthquake Actuated Automatic Gas Shutoff Devices, in Title 21, Division 1, Chapter 1, Sub 5 of the CA Code of Regulations as the basis for certification (www.calregs.com).
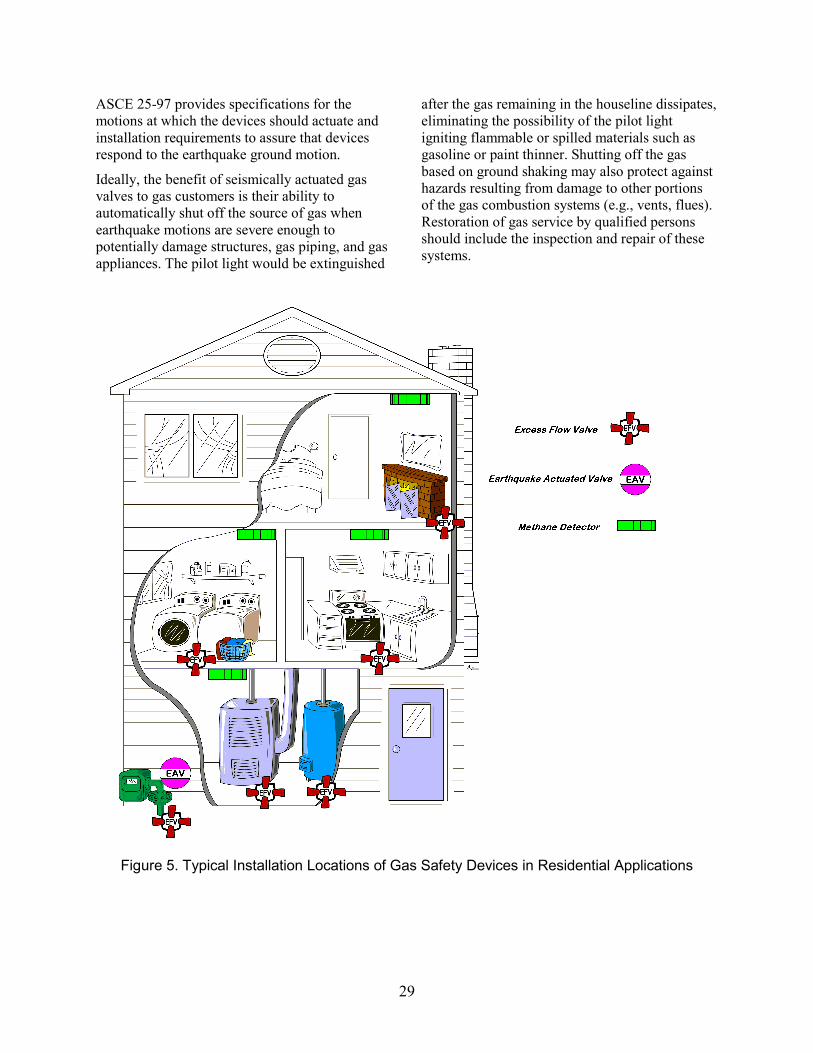
29
ASCE 25-97 provides specifications for the motions at which the devices should actuate and installation requirements to assure that devices respond to the earthquake ground motion.
Ideally, the benefit of seismically actuated gas valves to gas customers is their ability to automatically shut off the source of gas when earthquake motions are severe enough to potentially damage structures, gas piping, and gas appliances. The pilot light would be extinguished
after the gas remaining in the houseline dissipates, eliminating the possibility of the pilot light igniting flammable or spilled materials such as gasoline or paint thinner. Shutting off the gas based on ground shaking may also protect against hazards resulting from damage to other portions of the gas combustion systems (e.g., vents, flues). Restoration of gas service by qualified persons should include the inspection and repair of these systems.
Figure 5. Typical Installation Locations of Gas Safety Devices in Residential Applications

30
Unfortunately, the level of ground shaking associated with such damage cannot presently be estimated accurately because of the large variations in building construction and appliance installation techniques. The inability to reliably predict damage means that current standards for seismically actuated devices are intentionally biased toward actuation at lower levels of ground motion. The potential benefit of these devices should be considered along with the drawbacks of shutting off gas service when no damage has occurred. For residential customers, this drawback could result in delays to re-establish service and the unavailability of fuel for heating and cooking. Prolonged delays in service restoration may prompt some homeowners to attempt to restore service themselves. This has been the experience in some earthquakes in Japan, where large populations of earthquake-actuated shutoff valves were installed (Honegger, 1997). Service restoration by homeowners, if done incorrectly, can lead to additional risks. Shutting off gas to commercial and manufacturing customers when there is no damage may be less significant, as these customers often employ trained maintenance personnel who can restore service safely.
For a community, targeted installations of seismically actuated gas valves can provide a means to shut off gas to buildings and facilities in areas with a potential for rapid fire spread. Characteristics of such areas may include a high density of older buildings constructed of flammable materials, unreliable water pressure for firefighting purposes, congested streets that would impair access by firefighting equipment, or long response times from available fire stations. To be most effective, such installations would include measures to isolate these high-risk areas from electric power as well. Other considerations for relying on earthquake-actuated gas valves to control gas flow following earthquakes are provided in Table 9 at the end of this section.
Potential benefits to the community from such actions need to be weighed against the potential drawbacks associated with delays in service restoration. A large number of seismically actuated gas valve installations that are triggered closed could significantly delay service
restoration, especially since qualified personnel are needed to inspect the installations. Additional risks are a factor if unqualified persons try to re-establish gas service themselves without first ensuring that gas leaks, venting and other related hazards are corrected.
7.2.3 Excess Flow Valves Excess flow valves may be installed in a houseline piping system or at each appliance with an appliance connector (see Figure 5) to automatically shut off the source of gas if a gas piping break or major leak occurs downstream of the device. The excess flow valve is not sensitive to ground motion but is actuated by the pressure differential created when the gas flow exceeds the design limit for the valve. Although several types of excess flow valves are used in natural gas service, the basic principle of operation is the same.
In California, excess flow valves marketed for consumer earthquake safety applications are required to be certified by the State in compliance with the CSA Requirements for Excess Flow Valves Number 3-92. These requirements are adopted in Title 21, Division 1, Chapter 1, Sub 6 of the California Code of Regulations as the basis for certification (www.calregs.com).
All excess flow valves have an internal mechanism that allows gas to flow as long as the pressure difference between the upstream and downstream side of the excess flow valve is below a specific design level. The design pressure difference is directly related to the design flow capacity of the valve. A break in the piping downstream of the excess flow valve produces a pressure drop, which increases the pressure between the upstream and downstream sides of the valve. If the pressure difference is greater than the design level, a device inside the valve closes it. This occurs when a major leak occurs in household piping. Once qualified personnel make repairs to the service line, houseline or appliance connector, a bypass feature in the valve can be set to open automatically and allow the gas system to operate normally once the leak has been repaired. Excess flow valves are also available without a
31
bypass feature, but these must be reset manually by equalizing the pressure on both sides of the valve.
The two types of applications for excess flow valves that can be used on a regulated natural gas system are described below. Considerations for relying on excess flow valves to control gas flow following earthquakes are provided in Table 9 at the end of this section.
On the Customer’s Piping Near the Gas Meter. Excess flow valves installed on the customers’ piping system near the gas meter are intended to shut off gas flow in case of a break or major leak in the customer’s gas piping or equipment. Because each customer can have different gas demands, sizing the valve for the correct appliance load is crucial. Excess flow valves at the meter are installed with a shutoff flow-rate sized normally at a level above the total gas load of all gas appliances connected downstream of the device, to prevent unintentional shutoff when many gas appliances are in use. If a break in the customer piping or equipment results in a leak below the designed shutoff flow-rate, the excess flow valve will not actuate to stop the flow of gas. The design flow-rate needs to be reviewed by a qualified person and the valve may need to be replaced with a properly sized valve when gas appliances are changed, installed or removed.
Installation of any device immediately downstream of the gas meter requires special expertise and should not be performed by a homeowner, but by a certified plumber or specialty contractor who is trained to correctly size the valve for the particular installation in consideration of present and future appliance loads. Similarly, qualified personnel should re-establish gas service following device actuation to ensure the gas system is safe.
Since excess flow valves installed near the gas meter are typically exposed, extensive structural damage (e.g., a structure falling off the foundation onto the gas meter) may render an excess flow valve ineffective from damage to the device itself, or cause damage upstream of the device.
In a complete houseline break, excess flow valves installed downstream of the meter can improve natural gas safety if significant damage occurs. Such damage might be related to building collapse or movement of a structure off its foundation.
On Houseline Connection to Gas Appliances. Excess flow valves with a lower design shutoff flow-rate are installed on a gas houseline as close as possible to the gas source at individual appliances and sized according to the gas load of an individual appliance. The size of the leak that will cause a shutoff is lower compared to the installation of an excess flow valve installed near the gas meter, which must be sized for the total connected load of all gas appliances. Excess flow valves are most effective if they are installed near all gas appliances and located on the customers’ gas piping just upstream of the flexible houseline connection.
Excess flow valves installed on the houseline connection typically have a bypass mechanism that allows the device to automatically reset and the appliance to operate only when the leak has been corrected. The bypass flow-rate is determined by the standards for excess flow valves. A professional or a homeowner can install these types of excess flow valves.
7.2.4 Methane Detectors and Alarms A methane detector has a sensing mechanism that detects the presence of natural gas and initiates an audible alarm when the methane concentration is below the lower explosive limit of natural gas. This warning allows occupants to act before the natural gas concentration reaches a hazardous level. One advantage of these devices is their ability to sense both small and large gas leaks in proximity to the sensor. To be effective, the alarms must be heard and acted upon by someone who can mitigate a potentially hazardous condition. The ability of a methane detector to provide adequate warning depends on the proximity of the detector to the source of the gas leak. For this reason, methane detectors should be installed near the ceiling of every room containing a gas appliance and at other locations as needed to detect houseline leaks (see Figure 5). The locations of detectors also need to be chosen to

32
reduce the likelihood of false alarms. Some devices can produce an alarm if exposed to vapors and gases from aerosol hair sprays, alcohol, perfumes, cleaning agents, lacquer paint, glues and other materials. Methane detectors by themselves only detect a hazardous condition and do not stop gas from leaking.
7.2.5 Hybrid Gas Valve Devices Hybrid gas safety devices are becoming more widely available. They consist of various modular components that can include a main control unit, sensor inputs, and control and alarm outputs. Sensor inputs can include any combination of motion detection, high or unusual gas flow, natural gas detection, equipment tilt detection, carbon monoxide detection, and smoke detection. Sensor outputs can be used to trigger audible or visual alarms and gas shutoff. Many devices also provide a visual and audible warning if one or
more components malfunction. Output functions can include setting off alarms, triggering gas valve closure and initiating a telephone call to an alarm monitoring company. Typically, sensor inputs that feed into the main control unit normally act independently to trigger a designed output (i.e., they do not incorporate “intelligent” processing of the sensor data). The primary advantage of these devices is that their modular design allows users to customize functions for a specific situation.
Depending on the components installed, associated installation and operation considerations apply as with any individually installed components. The system will typically require installation by qualified personnel, particularly for systems that use a gas shutoff valve and alarm monitoring functions. Other considerations for relying on hybrid systems to control gas flow following an earthquake are provided in Table 9 at the end of this section.
7.3 Improving Building Response to Earthquake Ground Shaking Earthquake damage to gas service piping within buildings (not including piping attached to appliances) primarily results from poor structural response. In cases where there is no serious structural damage (near collapse), data from past earthquakes show that natural gas leaks in customer interior houselines are not a significant cause of post-earthquake fires. For the building occupants, improving seismic structural performance has the added benefits of maintaining escape paths, reducing their risk of injury, reducing financial costs associated with post-earthquake repairs, and decreasing the likelihood of having to relocate following an earthquake. From a community perspective, reduced building damage can lessen the demand on emergency services such as search and rescue and temporary shelters, and keeps community businesses open.
Newer construction in compliance with current building codes and construction in compliance with modern (post-1984) building codes are generally the least vulnerable to earthquake effects. Nevertheless, if the potential consequences of earthquake damage are viewed as exceptionally serious, communities may impose additional requirements on new construction that
are more restrictive than those of current building codes. Some examples could include height limitations on structures, supplemental site investigations to better quantify soil conditions, additional gas piping installation requirements (e.g., use of more flexible piping material, special ventilation requirements, minimum separation from electrical wiring), increased foundation anchorage requirements, restricted use of particular structural systems, and special inspections during construction.
Highly vulnerable structures may exhibit damage at levels of ground motion far below any threat to individual gas appliances. Such structures pose a collapse risk and are candidates for structural strengthening due to the potential risk to occupants and the increased likelihood of damage to the gas delivery system.
For one- or two-family residential buildings, structural improvements often involve adequately anchoring the building to the foundation or reinforcing perimeter foundation walls below the first floor. Unreinforced masonry chimneys are also prone to earthquake damage, which results in portions of the chimney falling, injuring people and potentially becoming impact hazards for gas
33
houselines and meters. Improvements that reduce risks from these modes of structural damage can usually be performed with minimal costs compared to the value of the building. Seismic retrofit measures for single-family dwellings that can be performed by homeowners and contractors are available in ICBO’s Guidelines for the Seismic Retrofit of Existing Buildings (ICBO, 2001).
An engineered approach is necessary for structural modifications to older multi-family residential buildings, especially those constructed using
materials and details proven to be highly vulnerable to earthquake damage. Examples include buildings constructed of unreinforced masonry or lightly reinforced concrete frames, buildings with no foundations or unreinforced masonry foundations, and buildings with garages, storefronts, or other large openings on the first floor. The costs to improve the structural response of these types of buildings can be substantial and difficult to justify when compared to the cost of constructing new buildings.
7.4 Improving the Natural Gas Delivery System Damage to the natural gas transmission and supply system generally has little direct impact on safety. One reason is that pipelines are often located beneath city streets, where the potential consequences to the public are low, even if leaking gas were to ignite. Benefits to gas customers and the community from pipeline improvement projects include greater overall reliability of service and reduced interruption in gas service to business and manufacturing sectors of the community following earthquakes.
Most natural gas utilities that operate in regions where major earthquakes are likely recognize the vulnerabilities of the natural gas transmission and distribution system. The most significant risk for earthquake damage exists in older distribution systems not constructed of welded steel or medium- and high-density polyethylene pipeline materials. Pipelines in older distribution systems may have been constructed of bare steel pipe, cast iron, or copper, and their complete replacement is enormously costly. The installation of a large distribution main in a dense urban area using typical construction methods can cost $1 million to $3 million per mile.
Since February 3, 1999, the US Department of Transportation has required gas distribution utilities to notify customers that excess flow valves are available whenever a new service line is installed or an existing service is exposed. This requirement is intended to improve safety when a
gas service line is severed during construction or trenching. Although not specifically designed to reduce earthquake-related risks, excess flow valves installed on service lines can reduce the potential for gas to be released at locations where severe earthquake ground disturbance is possible.
The federal statute requires that utilities install excess flow valves on a voluntary basis, or notify customers about excess flow valve availability and offer to install valves if the customer pays for the installation. Excess flow valves usually have a bypass feature and are installed on a gas service line as close to the gas distribution main as possible. They are installed only on new and reconstructed service lines that operate continuously throughout the year at a pressure not less than 10 psig and serve single-family residential customers with one gas meter. They are not required to be installed where contaminants in the gas stream could cause the excess flow valve to malfunction, or where the excess flow valve would interfere with necessary operation and maintenance activities on the service. Excess flow valves installed on service lines will not actuate from a break in the gas line downstream of a gas pressure regulator. For this reason, customers with services employing a pressure regulator do not reduce their risk of property damage by installing excess flow valves on service lines.
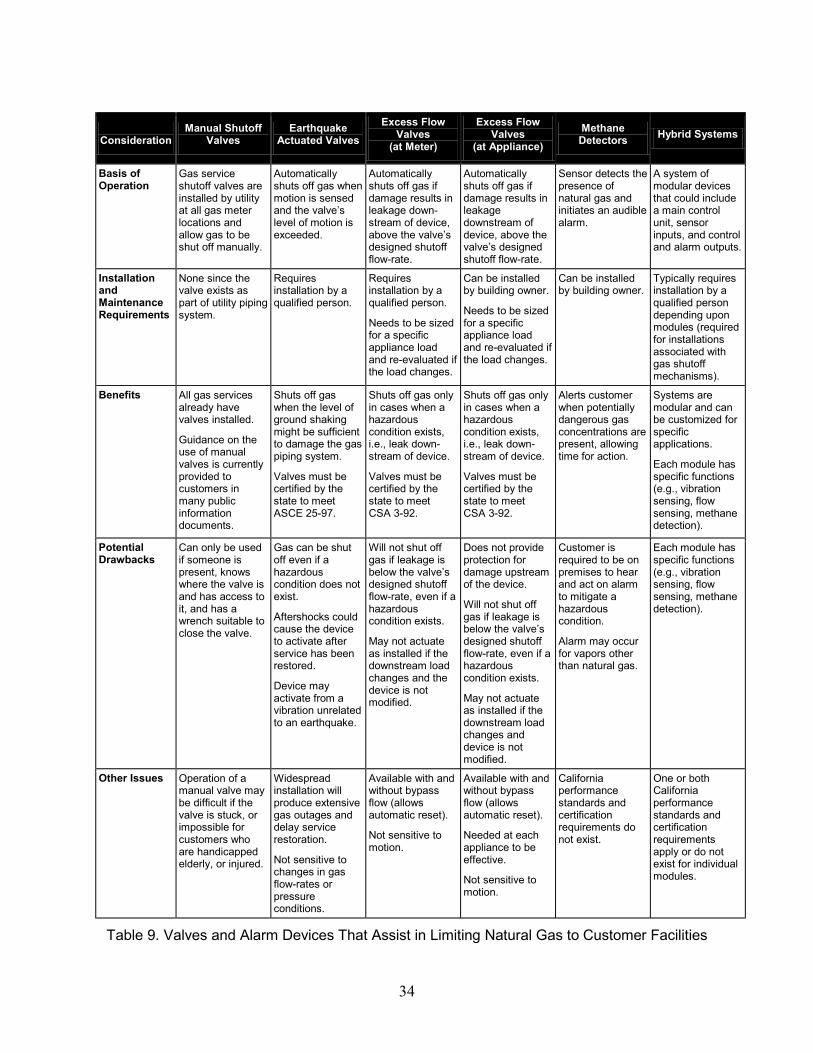
34
Consideration Manual Shutoff
Valves Earthquake
Actuated Valves Excess Flow
Valves (at Meter)
Excess Flow Valves
(at Appliance) Methane Detectors Hybrid Systems
Basis of Operation
Gas service shutoff valves are installed by utility at all gas meter locations and allow gas to be shut off manually.
Automatically shuts off gas when motion is sensed and the valve’s level of motion is exceeded.
Automatically shuts off gas if damage results in leakage down-stream of device, above the valve’s designed shutoff flow-rate.
Automatically shuts off gas if damage results in leakage downstream of device, above the valve’s designed shutoff flow-rate.
Sensor detects the presence of natural gas and initiates an audible alarm.
A system of modular devices that could include a main control unit, sensor inputs, and control and alarm outputs.
Installation and Maintenance Requirements
None since the valve exists as part of utility piping system.
Requires installation by a qualified person.
Requires installation by a qualified person.
Needs to be sized for a specific appliance load and re-evaluated if the load changes.
Can be installed by building owner.
Needs to be sized for a specific appliance load and re-evaluated if the load changes.
Can be installed by building owner.
Typically requires installation by a qualified person depending upon modules (required for installations associated with gas shutoff mechanisms).
Benefits All gas services already have valves installed.
Guidance on the use of manual valves is currently provided to customers in many public information documents.
Shuts off gas when the level of ground shaking might be sufficient to damage the gas piping system.
Valves must be certified by the state to meet ASCE 25-97.
Shuts off gas only in cases when a hazardous condition exists, i.e., leak down- stream of device.
Valves must be certified by the state to meet CSA 3-92.
Shuts off gas only in cases when a hazardous condition exists, i.e., leak down- stream of device.
Valves must be certified by the state to meet CSA 3-92.
Alerts customer when potentially dangerous gas concentrations are present, allowing time for action.
Systems are modular and can be customized for specific applications.
Each module has specific functions (e.g., vibration sensing, flow sensing, methane detection).
Potential Drawbacks
Can only be used if someone is present, knows where the valve is and has access to it, and has a wrench suitable to close the valve.
Gas can be shut off even if a hazardous condition does not exist.
Aftershocks could cause the device to activate after service has been restored.
Device may activate from a vibration unrelated to an earthquake.
Will not shut off gas if leakage is below the valve’s designed shutoff flow-rate, even if a hazardous condition exists.
May not actuate as installed if the downstream load changes and the device is not modified.
Does not provide protection for damage upstream of the device.
Will not shut off gas if leakage is below the valve’s designed shutoff flow-rate, even if a hazardous condition exists.
May not actuate as installed if the downstream load changes and device is not modified.
Customer is required to be on premises to hear and act on alarm to mitigate a hazardous condition.
Alarm may occur for vapors other than natural gas.
Each module has specific functions (e.g., vibration sensing, flow sensing, methane detection).
Other Issues Operation of a manual valve may be difficult if the valve is stuck, or impossible for customers who are handicapped elderly, or injured.
Widespread installation will produce extensive gas outages and delay service restoration.
Not sensitive to changes in gas flow-rates or pressure conditions.
Available with and without bypass flow (allows automatic reset).
Not sensitive to motion.
Available with and without bypass flow (allows automatic reset).
Needed at each appliance to be effective.
Not sensitive to motion.
California performance standards and certification requirements do not exist.
One or both California performance standards and certification requirements apply or do not exist for individual modules.
Table 9. Valves and Alarm Devices That Assist in Limiting Natural Gas to Customer Facilities

35
8.0 Community Preparedness and Response Planning Proper planning plays a crucial role in improving natural gas safety following earthquakes and other catastrophic events. Planning minimizes disruption to individuals and businesses caused by lack of utility and transportation services (e.g., electric power, communication, water, natural gas, sewage, public transit, and passenger and freight rail). The impact of this disruption on a community is manifest in the costs of providing emergency services and the loss of business productivity and revenue.
8.1 Community Actions Improving earthquake safety plans involves a complex process of identifying risks, evaluating safety alternatives under various scenarios, and developing and implementing effective strategies and plans. Several actions that a community can take are summarized in Table 10. Good information is necessary to define the issues, understand their magnitude, identify contributing factors, and consider alternatives. In general, communities should initially consider less expensive and more cost-effective strategies.
Challenges include:
• Balancing the needs of individuals against the needs of the community.
• Assessing potential earthquake risks from natural gas with other earthquake and non-earthquake risks.
• Balancing the costs of specific actions with the likely benefits, while assuring that costs do not impede effective actions and are not unreasonably high by both social and financial measures.
• Balancing strategies that address hazard prevention versus hazard response.
• Balancing potential benefits with the adverse consequences of any alternative.
Recent earthquakes have demonstrated that natural gas is one cause of post-earthquake fires. When focusing on reducing fire risk, other contributors such as electric power also warrant consideration.
The first step is to identify areas of high risk for fire spread, regardless of the cause of the fire. These areas can be selected based on the construction type and age of the structures, the amount of flammable material in either the building stock or the natural environment, the location of firefighting resources, access restrictions, water supplies, and prevalent local wind conditions. In most cases, these areas will be known to the local fire departments. Prioritizing high-risk fire areas is often beneficial in formulating implementation schedules and budgetary requirements.
Many of the actions shown in Table 10 have an additional advantage in that they improve the fire safety of the community for any fire occurrence, not just earthquake fires. The costs of implementing any of the strategies to improve natural gas safety are funded through taxes and fees or are imposed directly on the community by the local government.
Decisions on what actions are appropriate for a particular community involve weighing each alternative’s potential benefits with its expected consequences. For example, the potential benefits of isolating gas and electric service need to be weighed against the extended business interruption and public inconvenience associated with increases in service restoration time. Also, identifying an area as a high-risk fire area can lower property values and is likely to be resisted by homeowners in the affected area.
Community strategies may include imposing regulations on individuals and businesses. In improving earthquake safety, the same considerations that might guide community actions should also guide regulatory actions. That is, highest priority should be given to improving the safety of the most vulnerable areas, structures, and gas system installations.
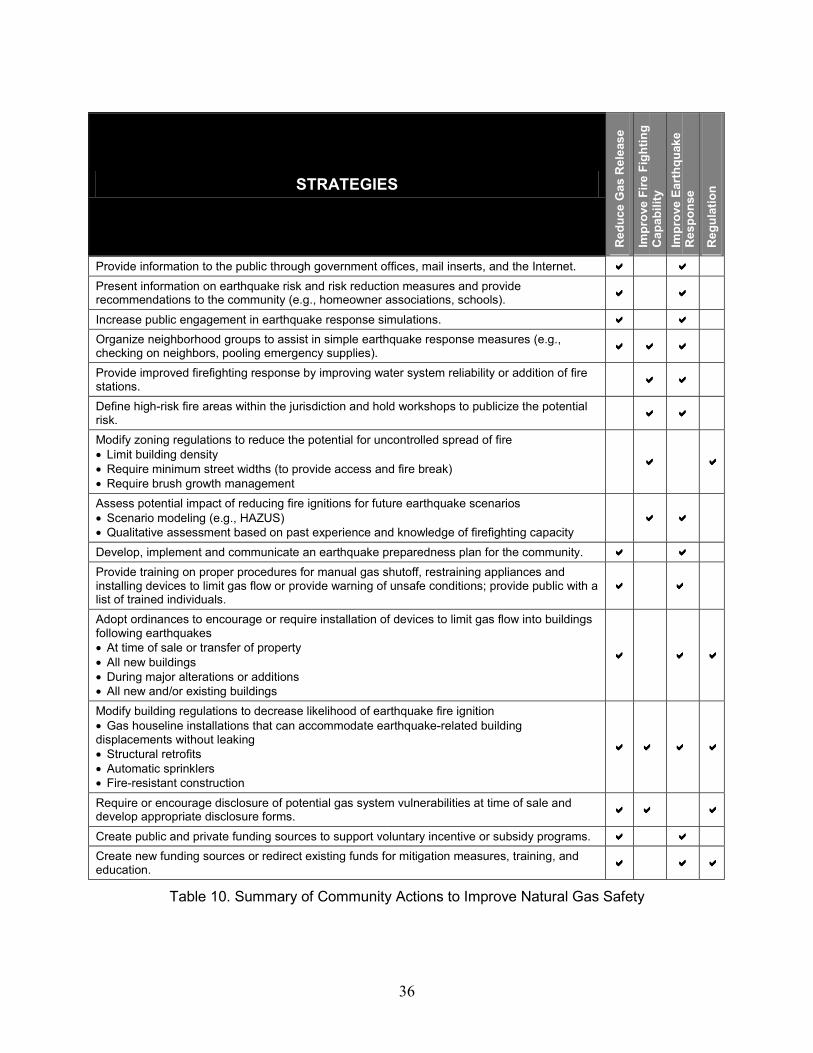
36
STRATEGIES
Red
uce
Gas
Rel
ease
Impr
ove
Fire
Fig
htin
g C
apab
ility
Im
prov
e Ea
rthq
uake
R
espo
nse
Reg
ulat
ion
Provide information to the public through government offices, mail inserts, and the Internet. aaaa aaaa Present information on earthquake risk and risk reduction measures and provide recommendations to the community (e.g., homeowner associations, schools). aaaa aaaa
Increase public engagement in earthquake response simulations. aaaa aaaa Organize neighborhood groups to assist in simple earthquake response measures (e.g., checking on neighbors, pooling emergency supplies). aaaa aaaa aaaa
Provide improved firefighting response by improving water system reliability or addition of fire stations. aaaa aaaa
Define high-risk fire areas within the jurisdiction and hold workshops to publicize the potential risk. aaaa aaaa
Modify zoning regulations to reduce the potential for uncontrolled spread of fire • Limit building density • Require minimum street widths (to provide access and fire break) • Require brush growth management
aaaa aaaa
Assess potential impact of reducing fire ignitions for future earthquake scenarios • Scenario modeling (e.g., HAZUS) • Qualitative assessment based on past experience and knowledge of firefighting capacity
aaaa aaaa
Develop, implement and communicate an earthquake preparedness plan for the community. aaaa aaaa Provide training on proper procedures for manual gas shutoff, restraining appliances and installing devices to limit gas flow or provide warning of unsafe conditions; provide public with a list of trained individuals.
aaaa aaaa
Adopt ordinances to encourage or require installation of devices to limit gas flow into buildings following earthquakes • At time of sale or transfer of property • All new buildings • During major alterations or additions • All new and/or existing buildings
aaaa aaaa aaaa
Modify building regulations to decrease likelihood of earthquake fire ignition • Gas houseline installations that can accommodate earthquake-related building displacements without leaking • Structural retrofits • Automatic sprinklers • Fire-resistant construction
aaaa aaaa aaaa aaaa
Require or encourage disclosure of potential gas system vulnerabilities at time of sale and develop appropriate disclosure forms. aaaa aaaa aaaa
Create public and private funding sources to support voluntary incentive or subsidy programs. aaaa aaaa Create new funding sources or redirect existing funds for mitigation measures, training, and education. aaaa aaaa aaaa
Table 10. Summary of Community Actions to Improve Natural Gas Safety
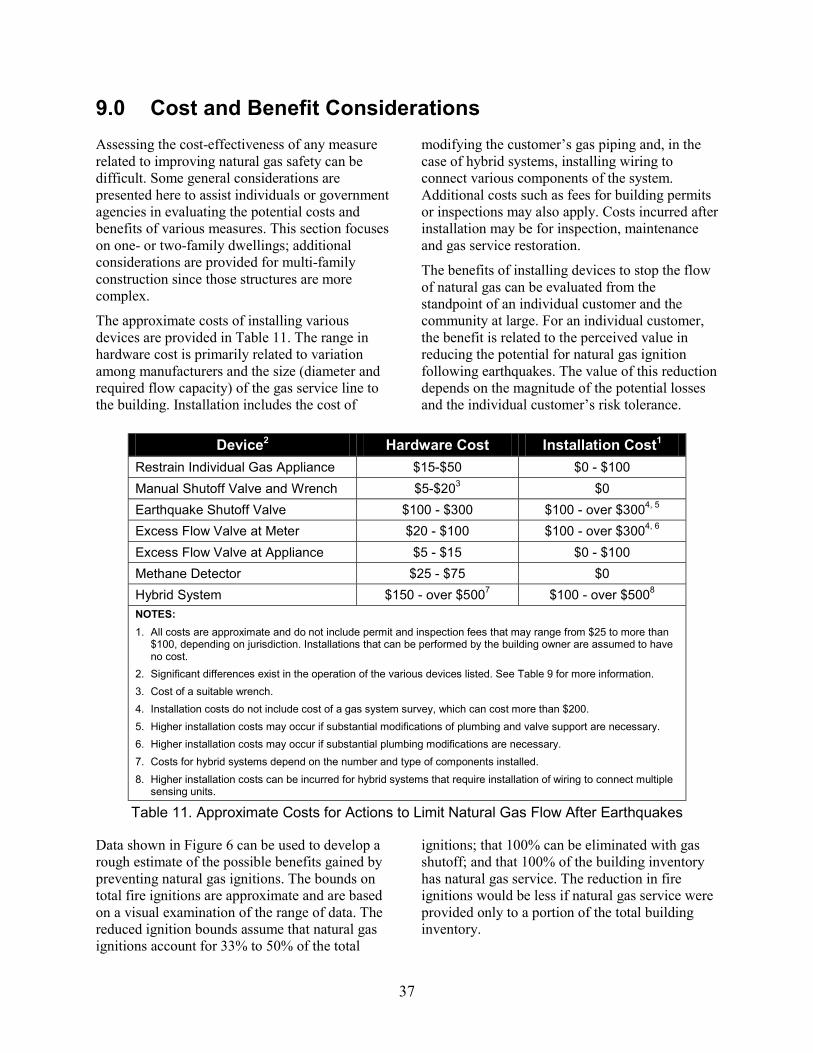
37
9.0 Cost and Benefit Considerations Assessing the cost-effectiveness of any measure related to improving natural gas safety can be difficult. Some general considerations are presented here to assist individuals or government agencies in evaluating the potential costs and benefits of various measures. This section focuses on one- or two-family dwellings; additional considerations are provided for multi-family construction since those structures are more complex.
The approximate costs of installing various devices are provided in Table 11. The range in hardware cost is primarily related to variation among manufacturers and the size (diameter and required flow capacity) of the gas service line to the building. Installation includes the cost of
modifying the customer’s gas piping and, in the case of hybrid systems, installing wiring to connect various components of the system. Additional costs such as fees for building permits or inspections may also apply. Costs incurred after installation may be for inspection, maintenance and gas service restoration.
The benefits of installing devices to stop the flow of natural gas can be evaluated from the standpoint of an individual customer and the community at large. For an individual customer, the benefit is related to the perceived value in reducing the potential for natural gas ignition following earthquakes. The value of this reduction depends on the magnitude of the potential losses and the individual customer’s risk tolerance.
Device2 Hardware Cost Installation Cost1 Restrain Individual Gas Appliance $15-$50 $0 - $100 Manual Shutoff Valve and Wrench $5-$203 $0 Earthquake Shutoff Valve $100 - $300 $100 - over $3004, 5 Excess Flow Valve at Meter $20 - $100 $100 - over $3004, 6 Excess Flow Valve at Appliance $5 - $15 $0 - $100 Methane Detector $25 - $75 $0 Hybrid System $150 - over $5007 $100 - over $5008 NOTES: 1. All costs are approximate and do not include permit and inspection fees that may range from $25 to more than
$100, depending on jurisdiction. Installations that can be performed by the building owner are assumed to have no cost.
2. Significant differences exist in the operation of the various devices listed. See Table 9 for more information. 3. Cost of a suitable wrench. 4. Installation costs do not include cost of a gas system survey, which can cost more than $200. 5. Higher installation costs may occur if substantial modifications of plumbing and valve support are necessary. 6. Higher installation costs may occur if substantial plumbing modifications are necessary. 7. Costs for hybrid systems depend on the number and type of components installed. 8. Higher installation costs can be incurred for hybrid systems that require installation of wiring to connect multiple
sensing units.
Table 11. Approximate Costs for Actions to Limit Natural Gas Flow After Earthquakes
Data shown in Figure 6 can be used to develop a rough estimate of the possible benefits gained by preventing natural gas ignitions. The bounds on total fire ignitions are approximate and are based on a visual examination of the range of data. The reduced ignition bounds assume that natural gas ignitions account for 33% to 50% of the total
ignitions; that 100% can be eliminated with gas shutoff; and that 100% of the building inventory has natural gas service. The reduction in fire ignitions would be less if natural gas service were provided only to a portion of the total building inventory.
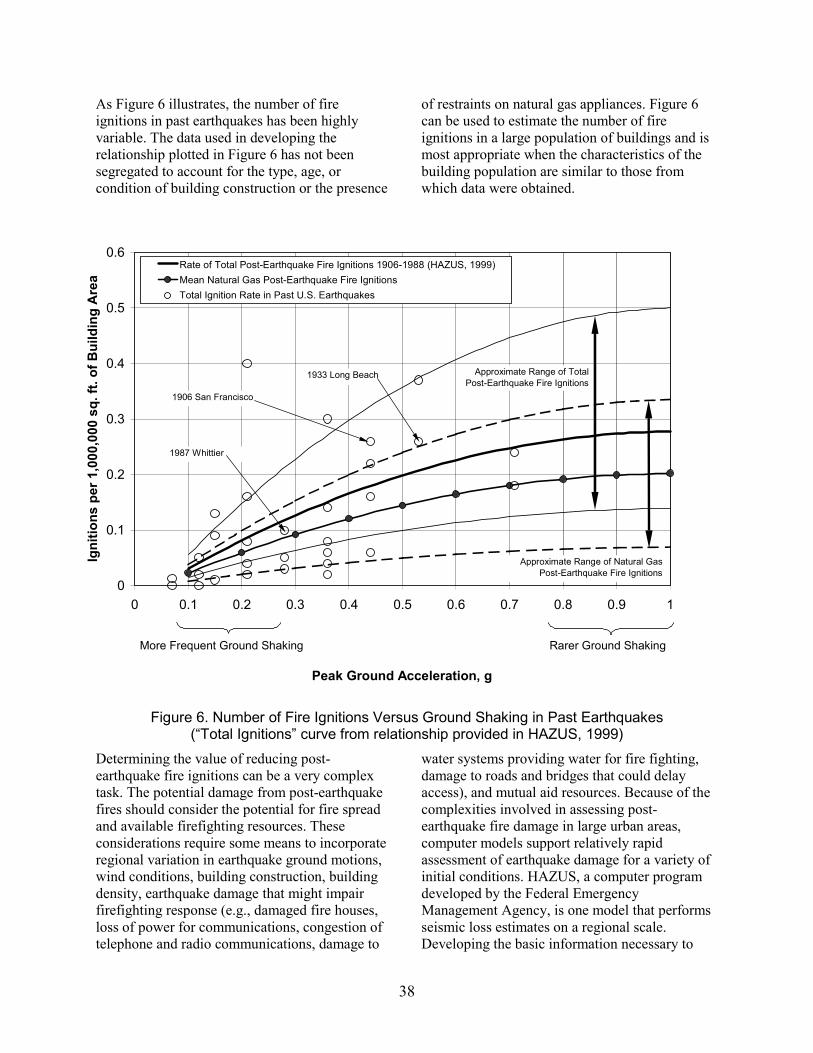
38
As Figure 6 illustrates, the number of fire ignitions in past earthquakes has been highly variable. The data used in developing the relationship plotted in Figure 6 has not been segregated to account for the type, age, or condition of building construction or the presence
of restraints on natural gas appliances. Figure 6 can be used to estimate the number of fire ignitions in a large population of buildings and is most appropriate when the characteristics of the building population are similar to those from which data were obtained.
Figure 6. Number of Fire Ignitions Versus Ground Shaking in Past Earthquakes (“Total Ignitions” curve from relationship provided in HAZUS, 1999)
Determining the value of reducing post-earthquake fire ignitions can be a very complex task. The potential damage from post-earthquake fires should consider the potential for fire spread and available firefighting resources. These considerations require some means to incorporate regional variation in earthquake ground motions, wind conditions, building construction, building density, earthquake damage that might impair firefighting response (e.g., damaged fire houses, loss of power for communications, congestion of telephone and radio communications, damage to
water systems providing water for fire fighting, damage to roads and bridges that could delay access), and mutual aid resources. Because of the complexities involved in assessing post-earthquake fire damage in large urban areas, computer models support relatively rapid assessment of earthquake damage for a variety of initial conditions. HAZUS, a computer program developed by the Federal Emergency Management Agency, is one model that performs seismic loss estimates on a regional scale. Developing the basic information necessary to
0
0.1
0.2
0.3
0.4
0.5
0.6
0 0.1 0.2 0.3 0.4 0.5 0.6 0.7 0.8 0.9 1
Peak Ground Acceleration, g
Igni
tions
per
1,0
00,0
00 s
q. ft
. of B
uild
ing
Are
a
Rate of Total Post-Earthquake Fire Ignitions 1906-1988 (HAZUS, 1999)Mean Natural Gas Post-Earthquake Fire IgnitionsTotal Ignition Rate in Past U.S. Earthquakes
More Frequent Ground Shaking Rarer Ground Shaking
Approximate Range of Total Post-Earthquake Fire Ignitions
Approximate Range of Natural Gas Post-Earthquake Fire Ignitions
1906 San Francisco
1933 Long Beach
1987 Whittier
39
implement computer-based models of post-earthquake fire damage can be a significant effort and is generally only economically feasible for studying large urban areas.
Some caution is warranted when using the results from any computer model used to assess post-earthquake fire damage and the value of reducing ignitions related to natural gas. The underlying assumptions incorporated in the model must be fully understood to properly interpret the output. In particular, substantial uncertainty is associated with every aspect of the modeling process and the cumulative effect of this uncertainty needs to be captured in the resulting cost and benefit estimates. Additional information and modeling assumptions are commonly necessary to account for the number of gas services and the effectiveness of measures taken to reduce gas-related fire ignitions because the sources of fire ignition need to be accounted for in the loss model.
Examples are provided below to illustrate the framework for assessing cost and benefits associated with reducing the number of natural gas fire ignitions in one- or two-family dwellings. These examples do not consider loss of life associated with post-earthquake fires. Loss of life from fires following earthquakes in one- or two-family dwellings has not been observed in recent moderate California earthquakes. The reason for this is the relative ease in evacuating such structures, even when they are heavily damaged. This is not the case for other types of buildings, particularly older high-rise structures prone to significant earthquake damage and not equipped with automatic fire sprinklers. Egress from these structures often relies on interior or exterior stairways that can be damaged or inaccessible because of jammed doors or impassable from fallen debris. A post-earthquake fire in these structures can lead to a significant loss of life, justifying far more investment to prevent earthquake fires than a one- or two-family dwelling.
9.1 Individual Perspective An individual homeowner’s decision to reduce earthquake fire risk depends on the individual’s perception of risk and the affordability of specific actions. Given the level of costs involved, more affluent homeowners who perceive the risk of post-earthquake fire to be high or have a low tolerance for risk may view the costs presented in Table 11 as insignificant. The same is likely not true for lower income homeowners. Other financial factors that may enter into the decision include home equity, intentions to remain in the home for a long period of time, and insurance coverage. Homeowners can also be influenced by their capability to act following an earthquake (i.e., shut off gas or extinguish small fires), how likely they are to be at home at the time, and whether or not they can rely on neighbors to detect leaking gas and shut off gas service while they are away.
Past earthquake fire experience dating back to 1906 can be used to roughly estimate the risk that individuals seek to mitigate by taking actions to reduce natural gas fire ignitions following earthquakes. Obtaining such an estimate requires several assumptions regarding the size of the
building, the likelihood and magnitude of ground shaking, and the rate of occurrence of a natural gas ignition. The following assumptions apply to a high seismic hazard zone in California:
1. Building square footage = 2,000
2. Peak horizontal ground acceleration = 0.7 g
3. Annual probability of exceeding 0.7 g = 0.002 (10% chance of exceedance in 50 years)
4. Rate of gas ignitions to total ignitions = 0.33
With the above assumptions, the annual probability of a post-earthquake natural gas fire is estimated to be 1 x 10⁻⁶ (1 in 1 million). The annual probability of exceedance is variable throughout California, as is the peak ground acceleration that might be reasonably expected to occur for a specific site. The estimate of the annual probability of a natural gas fire may vary by a factor of three or more for site-specific applications. However, the estimate of 1 x 10⁻⁶ is sufficient for comparing the risk of a post-earthquake natural gas fire ignition to other risks.
40
The probability of an earthquake fire ignition can be compared to the probability of non-earthquake fire incidents. The average annual number of fire incidents per capita in the United States, based on 1990 data, is about 0.008 (Fire Protection Handbook, 1996). Based on these average statistics, the annual probability of an individual experiencing a non-earthquake fire incident is about 8,000 times greater than experiencing an earthquake-related natural gas ignition. Viewed another way, a two-person household has about a 60% chance of experiencing a non-earthquake fire incident in 60 years, compared to about a 1 in 14,400 chance of experiencing a post-earthquake natural gas fire ignition in a high-seismic area of California.
The consequences of post-earthquake fires for residential gas customers are largely financial. A fire ignition only becomes a life safety concern when inhabitants are unable to exit the building following an earthquake. Experience in past earthquakes indicates that egress from an earthquake-damaged single-family home (R-3 occupancy in the Uniform Building Code) is generally possible because of the limited structure height, low number of occupants, and multiple direct escape paths via doors and windows. For
these reasons, property protection is the primary concern of a typical homeowner. Fire insurance coverage, generally a requirement for obtaining a building loan, typically covers earthquake-related fire damage and is an important factor in determining actual financial losses.
The potential life safety dangers from post-earthquake fires are considerably more serious in apartment or condominium buildings (R-1 occupancies in the Uniform Building Code) since they provide a greater chance for both damaging the structure and trapping the occupants. Many current R-1 buildings were built to lesser standards than required by current seismic design codes and could experience substantially more damage than R-3 buildings in an earthquake. Williamson and Groner (2000) point out that earthquake damage in R-1 structures could increase the risk of damage to customer gas piping and subsequent gas leaks. R-1 structures have more occupants who must share paths of emergency egress and have limited escape routes via enclosed stairways and exterior fire escapes—conditions that increase the probability of occupants being trapped in a potentially hazardous situation following an earthquake.
9.2 Community Perspective Justifying a community’s investment in natural gas-related fire prevention requires consideration of several factors: the life safety risks of buildings vulnerable to earthquake damage, the overall impact of potential fire damage on a community, and the objectives the community is trying to attain (e.g., reduce all fire damage, reduce earthquake fire damage, improve life safety). Of particular importance is understanding the relationship between post-earthquake fire losses and losses related to ground shaking or other, non-earthquake causes. Some of the considerations that should be assessed are:
1. The likelihood of an earthquake generating ground motions sufficient to cause multiple simultaneous fires in conjunction with conditions that would rapidly spread post-earthquake fires (time of day, high winds, low humidity).
2. Potential reductions in the number of fatalities or injuries achieved by reducing the rate of post-earthquake natural gas ignitions.
3. The ability of the community to respond to multiple simultaneous ignitions following an earthquake, including water supply reliability, delays in response time, quantity of fire fighting resources, availability of mutual aid, and non-directed responses by citizens.
4. Existing codes and ordinances (e.g., water heater restraint requirements, sprinkler systems) that may reduce the number of natural gas ignitions.
5. Costs incurred by the community in reducing natural gas ignitions—the costs to restore service, the costs associated with business interruption, the costs of providing

41
assistance during service restoration, and the costs of enforcing regulations.
6. Potential losses unrelated to post-earthquake fires (e.g., severe storms, flooding, non-earthquake fires).
7. The time value of the monetary investment made by the community and the possibility that the benefits from an action may not be realized for decades, or at all, considering the remaining life of some buildings.
The community assessment should also consider the high level of uncertainty inherent in any assessment of potential earthquake consequences. As illustrated in Figure 6, the rate of ignitions in past earthquakes varies widely. Similar uncertainty exists in estimating building damage from ground shaking, as well as the ability of various mitigation measures to actually prevent post-earthquake ignition of natural gas. For example, substantial building damage may render appliance restraint or shutoff valve installations ineffective. Also, actions to limit natural gas ignition may not prevent a building from being destroyed if a fire unrelated to natural gas spreads to the building.
An assessment of the overall reduction in community earthquake losses from reducing post-earthquake natural gas ignitions generally leads to several alternatives for additional consideration. Examples include:
• Taking no action and focusing on ignitions other than natural gas,
• Taking actions to reduce natural gas ignitions with lower or higher per-building costs,
• Taking actions that also will benefit non-earthquake emergencies (e.g., improving firefighting capabilities, improving the ability of the citizenry to respond to emergencies),
• Providing a funding mechanism for post-earthquake repair and reconstruction, or
• Joint activities with other communities to improve mutual assistance.
Identifying all the factors used in estimating the benefits of natural gas-related fire reductions for
an urban area is beyond the scope of this report. However, a simplified approach to estimating the potential costs is provided as an example of how the information in Figure 6 might be applied. As an example, consider a municipality with 100,000 dwellings with an average floor area of 2,000 sq. ft. with the same exposure as the individual homeowner in the above example (0.25 ignitions per 1 million square feet of building area for 0.7 g peak ground acceleration). The estimated number of post-earthquake fire ignitions for 100,000 buildings is estimated to be 50. Assuming all dwellings have natural gas appliances, the earthquake fire ignitions would be reduced by about 15, assuming measures to prevent gas-related fire ignitions are 100% effective and one-third of the post-earthquake fires are related to natural gas. The significance of these numbers depends on many unknown conditions, some of which include the building density at the location of ignition, the ability to rapidly respond to the number of ignitions, and the weather conditions at the time of the ignitions. These conditions can vary greatly based upon specific locations and municipalities and typically need to be evaluated on a case-by-case basis.
For the purposes of illustration, the cost to achieve the potential benefits identified above can be approximated by relying on several simplifying assumptions. First, it is assumed that mitigation measures are implemented simultaneously on every building. Second, it is assumed an earthquake occurs immediately after the mitigation measures are implemented. Finally, it is assumed that every ignition destroys a single building. Assuming an average cost of $250 per dwelling to install a device to limit gas flow, the installation imposes a $25 million initial cost, which equates to a cost of $1.7 million for each building saved.
It is recognized that the lack of proper firefighting response, coupled with high- density buildings and adverse weather conditions, can rapidly spread fires and destroy many buildings—even from a single ignition. A simple means to gauge the cost effectiveness when multiple buildings are damaged is to simply divide the cost per building, $1.7 million in the above example, by the number of

42
buildings destroyed per ignition. Assuming 20 buildings are damaged beyond repair for every fire ignition reduces the cost per building to $83,300.
The investment costs ($83,300 to $1.7 million in the above example) can be compared to the expected repair or replacement costs, the out-of-pocket expenses incurred by homeowners, or the community costs to mobilize and fight the fires. Equivalent costs for earthquakes at some time in the future would depend on economic factors
such as average lost investment opportunity, property appreciation (or devaluation), and recovery of costs through insurance. Similarly, implementing mitigation measures is likely occur over some timeframe that would impact the effectiveness of the mitigation measures and the accrued costs to implement the mitigation measures for earthquakes occurring at some time in the future.
43
10.0 Conclusions and Recommendations The fires following the 1906 San Francisco earthquake are a constant reminder to California communities of the potential consequences of post-earthquake fire. Recent earthquakes in California clearly demonstrate the characteristics of post-earthquake fire ignition related to natural gas systems and confirm that natural gas is an important contributor to post-earthquake fire risk. Ground motions sufficient to damage buildings are most likely to impact utility and customer gas systems and create the potential for gas-related fire ignitions. While the total number of fire ignitions in future earthquakes may be larger or smaller than those in the past, the number of post-earthquake fire ignitions related to natural gas can be expected to be 20% to 50% of all post-earthquake fire ignitions for earthquakes that cause numerous fires. Earthquake ground shaking generally leads to substantially more instances of building damage than fire ignitions. Gas restoration efforts following major earthquakes require massive mobilization of properly trained personnel.
Individual natural gas customers should become familiar with their natural gas system and assess their need to implement measures to improve natural gas safety in future earthquakes. Many beneficial alternatives include improving appliance integrity and structural integrity and using gas shutoff devices. Each alternative has advantages and disadvantages related to implementation costs, level of safety improvement, and collateral benefits for non-earthquake emergencies (see Table 9). Because every situation is different, the alternatives for safety improvement should be evaluated on a case-by-case basis. The use of any one measure may or may not achieve the desired level of safety, and in some situations, could introduce new safety issues or have undesirable consequences. Actions taken by individual gas customers will be influenced by customer affluence and the desire to avoid perceived earthquake risks.
Post-earthquake fires are significant contributors to the damage and disruption a community suffers. The combination of fire ignitions with
conditions amenable to rapid fire growth and spread can greatly increase post-earthquake fire damage. Community-based actions to improve gas safety in earthquakes should be considered as one part of a comprehensive earthquake preparedness strategy. Determining which actions are appropriate for a specific community requires a clear objective, an understanding of the comparative level of risk, an assessment of the investment appropriate to improve safety, and awareness of potential drawbacks associated with a particular action.
Communities should take steps to understand their post-earthquake fire risk and implement measures to reduce this risk to an acceptable level. Decisions should be made with a clear understanding of the potential benefits associated with the costs of implementing specific measures. The relative rarity of damaging earthquakes and the uncertainty in quantifying the likelihood, location, and severity of earthquake hazards require that earthquake risks be addressed in a balanced fashion considering other potential natural and man-made hazards.
This typically requires using certain measures to improve earthquake safety in concert with measures to reduce fire risks in general and risks from other earthquake hazards (e.g., building collapse) and other potential natural hazards. Communities generally should employ a graduated approach to risk reduction, initially considering and implementing strategies (see Table 10) that are less expensive and more cost effective.
The California Seismic Safety Commission should consider the following statewide recommendations:
1. The California Seismic Safety Commission should update its Homeowners’ Guide to Earthquake Safety to reflect the findings of this report and develop a Multi-unit Residential Owners’ and Occupants’ Guide to Earthquake Safety that includes a gas safety component.
2. The Division of the State Architect should continue its certification program for shake-

44
actuated and excess flow valves and accelerate enforcement by undertaking periodic, random site investigations of manufacturing facilities and testing of valves to ensure certification compliance.
3. The California State Fire Marshal should consider informing local governments that the potential for loss of life in fires following earthquakes is largely limited to older multi-unit residential buildings (R-1 occupancies) and mixed-use buildings that are prone to collapse and occupant entrapment. The California State Fire Marshall should consider helping local governments identify and
manage gas-related fire risks associated with this class of vulnerable residential buildings.
4. The California Public Utilities Commission should continue its regulatory oversight of investor-owned gas utilities to ensure gas system safety up to the utility point of delivery to customers.
5. The Governor’s Office of Emergency Services should continue to keep the public informed about gas and earthquake safety and update its public information to be consistent with the recommendations of this report and the Commission’s Homeowners’ Guide to Earthquake Safety.

45
11.0 References 1. American Society of Civil Engineers (1997). “Earthquake Actuated Automatic Gas Shutoff
Devices,” ASCE Standard 25.
2. Cote A.E. (ed.) (1996). Fire Protection Manual, National Fire Protection Institute, Quincy, Massachusetts.
3. Federal Emergency Management Agency (1997). Multihazard Identification and Risk Assessment: A Cornerstone of the National Mitigation Strategy.
4. Gilbert, Humphrey, Sewell, and Soule (1907). “The San Francisco Earthquake and Fire of April 18, 1906 and Their Effects on Structures and Structural Materials,” US Geological Survey.
5. Honegger, D.G. (1997). Personal communication with Dr. Fumio Yamazaki at 5th United States/Japan Workshop on Urban Earthquake Hazard Reduction.
6. Honegger, D.G. (1991). “Evaluation of Automatic Earthquake Shutoff Valve Performance and Recommendations for Future U.S. Standards,” 3rd U.S. National Conference on Lifeline Earthquake Engineering, August 22-23.
7. Industrial Press (1965). Gas Engineers Handbook, First Edition.
8. Jennings, B.H. (1970). Environmental Engineering: Analysis and Practice, Harper and Row.
9. Scawthorn, C.G. (1985). “Post-Earthquake Fire,” Proceedings of the U.S.-Japan Workshop on Urban Earthquake Hazard Reduction, Publication No. 85-03, EERI, Berkeley, California, pgs. 237-243.
10. Scawthorn, C.G. (1986). “Simulation Modeling of Fire Following Earthquake,” Proceedings of the Third U.S. National Conference on Earthquake Engineering, Vol. III.
11. Scawthorn, C.G. (1987) “Fire Following Earthquake: Estimates of the Conflagration Risk to Insured Property in Greater Los Angeles and San Francisco,” All-Industry Research Advisory Council, Oak Brook, Illinois.
12. California Seismic Safety Commission (1998). The Homeowner’s Guide to Earthquake Safety.
13. California Seismic Safety Commission (1998). The Commercial Property Owner’s Guide to Earthquake Safety.
14. Williamson, R.B. and N. Groner (2000). “Ignition of Fires Following Earthquake Associated with Natural Gas and Electrical Distribution Systems,” Pacific Earthquake Engineering Research Center.
15. International Conference of Building Officials (2001). Guidelines for the Seismic Retrofit of Existing Buildings. www.icbo.org/
References for the January 17, 1994 Northridge, California Earthquake 1. Hall, J.F. (ed.) (1995). “Northridge Earthquake of January 17, 1994 Reconnaissance Report,”
Earthquake Spectra, Supplement C to Volume II, Earthquake Engineering Research Institute.
2. Honegger, D.G. (1995). “Automatic Gas Shutoff Device Actuation Requirements Based on January 17, 1994 Northridge Earthquake Data,” report to the American Society of Civil Engineers.

46
3. Honegger, D.G. (1998). “Translating Earthquake Damage Data into New Performance Requirements for Earthquake Actuated Automatic Gas Shutoff Devices in the United States,” Proceedings of the 7th U.S.-Japan Workshop on Earthquake Disaster Prevention for Lifeline Systems, National Institute of Standards and Technology.
4. Honegger, D.G. (1996). “Performance Testing of Earthquake Actuated Automatic Gas Shutoff Systems,” with J.G. Diehl, presented at the 11th World Conference on Earthquake Engineering, Acapulco, Mexico, June 23-28.
5. Jennings, B.H. (1970). Environmental Engineering: Analysis and Practice, Harper and Row, New York.
6. OES/EQE (1995). “The Northridge Earthquake of January 17, 1994: Preliminary Report on Data Collection and Analysis,” Part A: Damage and Inventory Data, prepared by EQE International and the Geographic Information Systems Group of the Governor’s Office of Emergency Services, available through EQE International, Irvine, California.
7. Schiff, A.J. (1997). “Guide to Post-Earthquake Investigation of Lifelines,” Chapter 15 - Natural Gas Systems, Technical Council on Lifeline Earthquake Engineering, Monograph No. 11, American Society of Civil Engineers.
8. Lambert, G.J. (1994). Letter from Southern California Gas Company submitting forms RSPA F 7100.1 and RSPA F 7100.2 to the Research and Special Programs Administration of the Office of Pipeline Safety, Department of Transportation, February 16.
9. McDonough, P.W. (ed) (1995). “Seismic Design Guide for Natural Gas Distributors,” Monograph No. 9, Technical Council on Lifeline Earthquake Engineering, American Society of Civil Engineers.
10. Scawthorn, C. (1998). “Fire-Related Aspects of the Northridge Earthquake,”NIST-GCR-98-743, National Institute of Standards and Technology, Washington, D.C., March.
11. Strand, C.L. (1995). “Gas Leaks, Gas-Related Fires, and the Performance of Seismic Gas Shutoff Valves During the Northridge Earthquake,” Proceedings of the Fourth U.S. Conference on Lifeline Earthquake Engineering, Monograph No. 6, Technical Council on Lifeline Earthquake Engineering, American Society of Civil Engineers.
References for the October 17, 1989 Loma Prieta, California Earthquake 1. Honegger, D.G. (1998). “Repair Patterns for the Gas Distribution System in San Francisco,”
2. McDonough, P.W. (1998). “Residential Natural-Gas Piping and Appliances,” in The Loma Prieta, California Earthquake of October 17, 1989 - Lifelines, Professional Paper 1552-A, United States Geological Survey.
3. Mohammadi, J., S. Alyasin, and D.N. Bak (1992). “Investigation of Cause and Effects of Fires Following the Loma Prieta Earthquake,” Report IIT-CE-92-01, Illinois Institute of Technology, Chicago, Illinois.
4. Phillips, S.H. and J.K. Virostek (1990). “Natural Gas Disaster Planning and Recovery: The Loma Prieta Earthquake,” presented at the American Gas Association Distribution/Transmission Conference, Los Angeles, California, May 7-9.
5. Scawthorn, C.R. (2001). Personal communication on segregation of ignition causes.
6. Schiff, A.J. (1997). “Guide to Post-Earthquake Investigation of Lifelines,” Chapter 15 - Natural Gas Systems, Technical Council on Lifeline Earthquake Engineering, Monograph No. 11, American Society of Civil Engineers.

47
References for the October 1, 1987 Whittier Narrows, California Earthquake 1. Honegger, D.G. (1991). "Evaluation of Automatic Earthquake Shutoff Valve Performance and
Recommendations for Future U.S. Standards," 3rd U.S. National Conference on Lifeline Earthquake Engineering, August 22-23.
2. Manning, D.O. (1987). “A Report by the Los Angeles City Fire Department on the Whittier Narrows Earthquake of October 17, 1987.”
3. Russell, A.E. and J.W. Taylor (1987). “Southern California Gas Company’s Preliminary Results and Findings on the Whittier Earthquake of October 1, 1987,” presentation to California State Fireman’s Association, Santa Rosa, California.
4. Schiff, A.J. (1997). “Guide to Post-Earthquake Investigation of Lifelines,” Chapter 15 - Natural Gas Systems, Technical Council on Lifeline Earthquake Engineering, Monograph No. 11, American Society of Civil Engineers.
48
12.0 Appendices (Available on Request from the Commission, copying and mailing fees will apply) 1. Minutes of July 11, 2002 CA Seismic Safety Commission meeting, approved September 12,
2002.
2. Draft Comments to “Improving Natural Gas Safety in Earthquakes,” Carl L. Strand, July 10, 2002
3. Letter from James C. McGill to Richard McCarthy re July 11, 2002 Meeting, July 10, 2002.
4. “SB1992: Saving Lives and Property by Preventing Gas Fires and Gas Explosions,” Natural Gas Safety Consortium, July 9, 2002.
5. Memo from Fred Turner to CA Seismic Safety Commission, “Gas Safety Committee Recommendations,” July 2, 2002.
6. Letter from Paul Brooks, Pacific Gas and Electric Company to McCarthy, June 27, 2002.
7. Letter from Carl L. Strand to McCarthy, June 26, 2002.
8. Letter from CA Seismic Safety Commission to participants in the Gas Safety Committee meetings, May 21, 2002.
9. Letter from CA Building Standards Commission to Mr. Les Saffil, April 18, 2002.
10. Letter from CA Seismic Safety Commission to Mr. Carl L. Strand, March 12, 2002.
11. Letter from Mr. Les Saffil to CA Building Standards Commission, March 1, 2002.
12. Letter from Carl L. Strand to Division of the State Architect, February 15, 2002.
13. Minutes of February 14, 2002 CA Seismic Safety Commission meeting.
14. Comments on Ayres’ Report from Doug Honegger, February 11, 2002.
15. “Low Pressure Excess Flow Natural Gas Valves, Uniform Plumbing Code Application Requirements,” J. Marx Ayres, P.E., January 21, 2002.
16. Letter from Carl L. Strand to CA Seismic Safety Commission, January 18, 2002.
17. Minutes of January 10, 2002 CA Seismic Safety Commission meeting.
18. Memo from Fred Turner to CA Seismic Safety Commission, “Improving Natural Gas Safety in Earthquakes,” January 4, 2002.
19. Letter from Carl L. Strand to IAPMO, October 1, 2001.
20. Advanced Seismic Safety Technologies, Inc. report regarding “Excess Flow Valve Certification Standard (12CCR, Part 12, Ch. 12-16-2),” June 21, 2001.
21. Minutes of May 9th and 10th, 2001 CA Seismic Safety Commission meeting.
22. Letter to the CA Seismic Safety Commission from UMAC, May 4, 2001.
23. Memo from Fred Turner to CA Seismic Safety Commission, “Proposed New Committee on Earthquake Safety Issues for Natural Gas Systems,” April 30, 2001.
24. Minutes of October 12, 2000 CA Seismic Safety Commission meeting.
25. Memo from Fred Turner to CA Seismic Safety Commission, “Seismic Gas Shutoff Devices,” October 4, 2000.
49
26. Letter from Senator and Commissioner Richard Alarcon to the CA Seismic Safety Commission, November 15, 1999.
27. Letter from Los Angeles County to Mr. Les Saffil, May 1998.
28. “Catalog of Post-Earthquake Gas Leaks and Related Incidents, with a Review of the Case for Mandating Earthquake Gas Shutoff Valves,” Final Draft, September 1, 1997, Carl L. Strand.
29. “Performance of Seismic Gas Shutoff Valves and the Occurrence of Gas-Related Fires and Gas Leaks During the 1994 Northridge Earthquake, with an update on Legislation and Standards Development,” Carl L. Strand, August 20, 1997 presentation Northridge Earthquake Research Conference, Los Angeles.
30. Workshop on Seismic Safety of Natural Gas Systems, July 26, 1994 minutes.
31. Letter from City of Commerce to Carl L. Strand, October 1993.
32. Pacific Gas & Electric, Letter from Leigh to Lee August 1992, Revised Earthquake Valve Policy January 1990, February 1987, Position Paper on AB 110.
33. Letter from Office of State Architect to Quakemaster, Inc., June 1987.
34. Letter from IAPMO to Quakemaster, Inc. June 1987.
35. Letter from Saltzberg to Office of the State Architect, June 1987.
36. Southern California Gas Company, Position Papers on Earthquake Shutoff Valves, April 1987 and November 1983, undated Position Paper, and undated AB 110 position statement.