improving jury understanding and use of dna …crg.aic.gov.au/reports/05-0708.pdf · gratefully...
TRANSCRIPT
Improving Jury Understanding and Use of DNA Expert Evidence Professor Jane Goodman-Delahunty Dr Lindsay Hewson Report to the Criminology Research Council Grant: CRC 05/07-08 July 2009
1 This is a project supported by a grant from the Criminology Research Council. The views expressed are the responsibility of the author and are not necessarily those of the Council.
Table of Contents
List of Tables .................................................................................................................................. 4
List of Figures ................................................................................................................................. 5
Research Team & Acknowledgments ............................................................................................. 6
EXECUTIVE SUMMARY ................................................................................................................... 7
Juror difficulties with DNA expert evidence ....................................................................................... 7
A cognitively-sequenced DNA tutorial ................................................................................................ 7
Jury-eligible citizens served as virtual jurors ...................................................................................... 8
Key Findings ........................................................................................................................................ 8
DNA evidence increased convictions .............................................................................................. 8
The expert tutorial increased DNA knowledge ............................................................................... 8
Multimedia facilitated comprehension .......................................................................................... 9
Court-appointed vs party experts ................................................................................................... 9
CSI effects ...................................................................................................................................... 10
Jurors lack insight into their decisions .......................................................................................... 10
Recommendations ............................................................................................................................ 10
INTRODUCTION ............................................................................................................................ 11
Juror difficulties with DNA expert evidence ..................................................................................... 11
A cognitively sequenced DNA tutorial .............................................................................................. 12
Multimedia and learning ................................................................................................................... 13
Learning style and presentation mode ............................................................................................. 14
Levels of understanding and structure of the DNA tutorial ............................................................. 14
CSI effects .......................................................................................................................................... 15
Independence and perceived neutrality of expert witnesses .......................................................... 16
Study aims and hypotheses .............................................................................................................. 17
METHOD AND PROCEDURES ......................................................................................................... 18
Study design and materials ............................................................................................................... 18
Variations in the presentation of expert evidence ........................................................................... 18
Materials ........................................................................................................................................... 19
Trial simulation ............................................................................................................................. 19
Expert testimony: oral vs multimedia ........................................................................................... 21
DNA profiling tutorial .................................................................................................................... 22
Random match probability tutorial .............................................................................................. 23
Pre-trial screening questionnaire ................................................................................................. 23
CSI viewing habits ......................................................................................................................... 23
2
Expectations of scientific evidence ............................................................................................... 24
Index of Learning Styles (ILS) ........................................................................................................ 24
Post-trial questionnaire ................................................................................................................ 24
DNA knowledge questions ............................................................................................................ 25
Procedures ........................................................................................................................................ 26
RESULTS ........................................................................................................................................ 27
Demographic characteristics of mock-jurors .................................................................................... 27
CSI viewing habits ............................................................................................................................. 28
Learning preference scores ............................................................................................................... 28
Pre-existing knowledge about DNA evidence ................................................................................... 28
CSI effects on perceptions of evidence, motivation to serve as juror and victim sympathy ............ 28
Exposure to DNA forensic expert reduced trust in DNA evidence ................................................... 29
Perceived neutrality of expert enhanced trust in DNA evidence ..................................................... 30
Post-trial DNA knowledge ................................................................................................................. 30
Transfer of DNA learning .................................................................................................................. 32
Knowledge increase following expert evidence ............................................................................... 32
CSI effects on DNA learning .............................................................................................................. 33
Frequent CSI viewers achieved less learning ................................................................................ 33
Perceived usefulness and comprehensibility of expert testimony and mock-jurors’ learning .... 34
The influence of presentation mode on learning ............................................................................. 34
Multimedia facilitated mock-juror learning .................................................................................. 34
Verdicts ............................................................................................................................................. 35
Expert evidence increased the conviction rate ............................................................................. 35
The influence of DNA knowledge and learning on the conviction rate ........................................ 35
No CSI-effect on verdict ................................................................................................................ 36
The influence of judge-led vs prosecution-led expert evidence on the conviction rate .............. 36
Multimedia reduced perceived culpability of the defendant, convictions, and juror confidence in verdict ........................................................................................................................................... 36
DISCUSSION .................................................................................................................................. 39
Jury-eligible citizens lack knowledge of DNA profiling ..................................................................... 39
Knowledge gain from the presentation of expert forensic evidence ............................................... 39
The influence of mode of presentation of expert evidence: oral vs multimedia ............................. 40
The influence of court-appointed vs party experts .......................................................................... 41
The effect of expert evidence on trust in science ............................................................................. 41
Educational level and jurors’ understanding of scientific evidence ................................................. 41
DNA evidence, knowledge and verdict ............................................................................................. 42
3

CSI effects .......................................................................................................................................... 42
Limitations of the study .................................................................................................................... 43
Recommendations for future research ............................................................................................. 44
References .................................................................................................................................... 45
Appendix 1: Trial transcript .......................................................................................................... 50
Appendix 2: Stage One Screening Questionnaire ........................................................................... 60
Appendix 3: Stage Two Post-trial Questionnaire ........................................................................... 66
Appendix 4: DNA knowledge items by taxonomy level (SOLO) ...................................................... 71
Appendix 5: Supplementary Tables ............................................................................................... 75
Appendix 6: Supplementary Figures .............................................................................................. 79
List of Tables
Table 1: Structure of Observed Learning Outcomes (SOLO) Taxonomy .............................................. 15
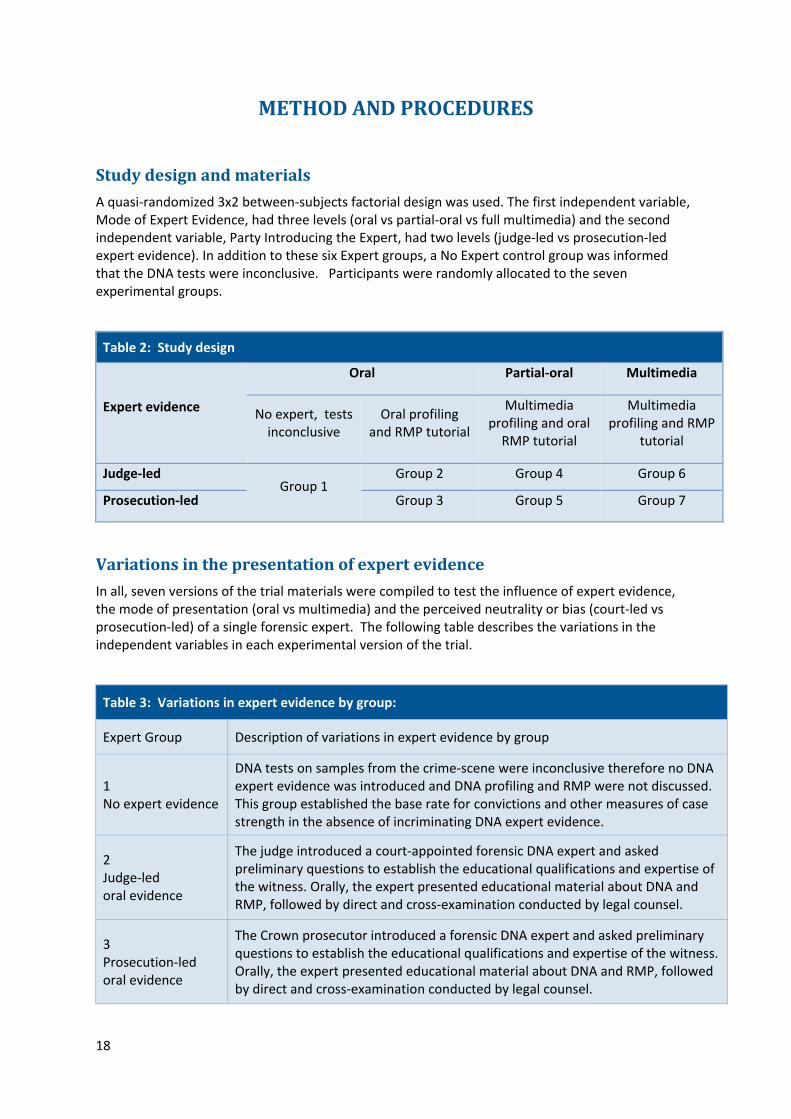
Table 2: Study design ........................................................................................................................... 18
Table 3: Variations in expert evidence by group: ................................................................................ 18
Table 4: Overview of the simulated criminal trial ................................................................................. 20
Table 5: DNA knowledge test items by taxonomy level (SOLO) ........................................................... 25
Table 6: Comparisons to assess the influence of presentation mode of expert evidence ................... 34
Supplementary Tables
Table A: Demographic features of study participants and the Australian population ......................... 75
Table B: Correlations between frequency of CSI-viewing and expectation of evidence ...................... 75
Table C: Correlations between CSI-viewing, pre-trial and post-trial trust in forensic evidence........... 76
Table D: Post-hoc comparison of group means on post-trial DNA knowledge .................................... 76
Table E: Post-hoc comparison of DNA learning by group ..................................................................... 76
Table F: Post-hoc comparison of mean scores on novel items by group ............................................. 77
Table G: Mean gain in post-trial DNA knowledge by SOLO taxonomy in the No Expert Group .......... 77
Table H: Mean gain in post-trial DNA knowledge by SOLO taxonomy in the Expert Groups ............... 77
Table I: Within-group comparison of learning by SOLO taxonomy level by group .............................. 78
Table J: Correlations between DNA knowledge, learning and confidence in verdict ........................... 78
4
List of Figures
Figure 1: The content of the tutorial on forensic DNA profiling ........................................................... 22
Figure 2: The content of the tutorial on random match probability (RMP) ......................................... 23
Figure 3: Subjects studied at high school by mock-jurors (percent, N=470) ........................................ 27
Figure 4: CSI viewing habits of mock-jurors (percent, N=470) ............................................................. 28
Figure 5: Pre-trial DNA knowledge by group (percent correct, confidence interval, N=470) .............. 29
Figure 6: Pre-trial and post-trial trust in DNA evidence by group (mean score, N=470) ...................... 30
Figure 7: Post-trial DNA knowledge by group (percent items correct, N=470) .................................... 31
Figure 8: Pre-trial and post-trial DNA knowledge by group (19-items, percent correct, N=470) ......... 32
Figure 9: DNA knowledge by difficulty level, by group (mean correct items, N=470) .......................... 32
Figure 10: Mean increase in learning by SOLO taxonomy level and group (N=470) ............................ 33
Figure 11: Conviction rate by group (percent, N=470) ......................................................................... 35
Figure 12: Sufficiency of DNA evidence to convict by post-trial DNA knowledge and mode of expert presentation (percent agreement, n=356) ........................................................................................... 37
Figure 13: Conviction rate by mode of expert presentation and post-trial DNA knowledge (N=356) . 37
Supplementary Figures
Figure A: Subjects studied at high school by Stage One participants (percent, N=3614) .................... 79
5

Research Team
Principal Researchers: Professor Jane Goodman-Delahunty Charles Sturt University Australian Graduate School of Police Management and School of Social Sci ces and Liberal Arts en
Dr Lindsay Hewson
School of Medical Sciences, Educational Media Unit
Project Coordinator: Berenike Waubert de Puiseau
Research Assistants: Yat Sang Cheung Rachel Cush Diana Matovic Kate O'Brien Berenike Waubert de Puiseau Dr Rhonda Wheate
Consultants: Legal advice: Judge Richard Cogswell SC, NSW District Court Forensic expertise: Anna Davey, Prof Chris Lennard
Analysis: Prof David Tait, Prof Kevin Bird Market Research: Webmart, Phil Kells
CRC Project Manager Claire Burge
Acknowledgments
This project was accomplished with the assistance and cooperation of numerous participants to whom we are indebted, particularly the members of the research team whose dedication and enthusiasm sustained progress through a complex and demanding project. We particularly wish to thank those members of the legal, scientific, medical and academic communities who gave freely of their time and provided valuable feedback and suggestions throughout the process. The authors gratefully acknowledge the highly-skilled contribution of Berenike Waubert de Puiseau whose energy and efficiency as Project Manager in 2008 was outstanding. We are appreciative of Yat Sang Cheung who worked intensively in May and June 2009 to assist in the completion of this report.
We thank Claire Burge, our Project Manager at the CRC for her ongoing assistance, and Julia Tresidder and Lorana Bartels for their support and helpful advice. We particularly recognise the thoughtful insight and guidance contributed by Prof David Tait during analysis of the extensive data.
This research project was funded by a one-year grant to the principal researchers from the Australian Criminology Research Council CRC05/07-08 through the University of New South Wales. All opinions expressed in this report are those of the authors and do not necessarily reflect the views of the Criminology Research Council.
6
EXECUTIVE SUMMARY
Juror difficulties with DNA expert evidence
The use of DNA evidence in Australian courts has increased exponentially in the last two decades. DNA technology is well-validated and no longer the subject of defence challenges. Juror difficulties in understanding and applying the scientific and statistical information conveyed by forensic experts about a DNA match have been documented in qualitative and quantitative studies. Post-trial interviews of jurors in six criminal trials revealed that jurors who admitted difficulty in understanding DNA expert evidence nonetheless proceeded to convict (Findlay 2008). Perceptions that DNA evidence is irrefutable in identifying a perpetrator are reinforced by its portrayal as rapid, reliable and definitive in popular television programs such as CSI: Crime Scene Investigation. Legal commentators have expressed concern that jurors are “overawed by the scientific garb in which the evidence is presented and attach greater weight to it than it is capable of bearing,” (R v Duke 1979: 48), raising questions as to whether the safety of verdicts in criminal cases is compromised by juror misconceptions about the infallibility of DNA evidence. These concerns are supported by analyses of archival data showing that incriminating DNA evidence significantly increased convictions: juries voted guilty 23 times more in homicide cases and 33 times more in sexual assault cases when DNA evidence was introduced by the prosecution.
To date, strategies to facilitate juror understanding of DNA evidence have met with limited success. For example, post-trial judicial instructions advising caution in evaluating DNA evidence had a negligible impact on mock-jurors’ perceptions of culpability (Dartnall & Goodman-Delahunty 2006). Measures such as allowing jurors to take notes, to submit questions to an expert via the trial judge, to use a checklist requiring answers to questions, and provision of learning aids (copies of slides, a glossary, and a summary) were unsuccessful in eliminating jurors’ difficulties (Dann, Hans & Kaye 2007). One alternative suggestion was to provide jurors with a tutorial about the complex, technical evidence to better prepare them for their duty (Young 2000). This is the first study to test this proposition.
A cognitively-sequenced DNA tutorial
Using a unique pre-trial versus post-trial measure to assess the influence of a DNA expert, the current study investigated whether an 18-minute cognitively sequenced tutorial presenting uncontroverted information on DNA profiling and random match probability could improve juror understanding. The content of the narrative tutorial was developed in consultation with legal counsel, forensic and medical scientists to appropriately reflect core elements of DNA testimony routinely presented in Australian criminal trials. This information was sequenced according to its structural difficulty in conformity with the levels distinguished in the Structure of Observed Learning Outcomes (SOLO) taxonomy. Information that requires only a basic understanding was presented at the outset. The more elementary knowledge served as the foundation on which understanding of more complex information was built. This sequence prevents cognitive overload with concepts yet to be grasped.
The tutorial was presented as expert evidence in a simulated criminal trial created from the transcript of an actual homicide case in which weak circumstantial evidence was supported by a DNA match between samples taken from the crime scene and the defendant. The trial (4920 words in length) was presented online in approximately 35 minutes. Actors played the roles of the judge, prosecutor, defence counsel and expert. A photograph of each active speaker accompanied the narration. The simulation included orienting instructions from the judge, opening statements by legal counsel, and evidence from eight witnesses, including the DNA expert (3019 words) who
7
presented the narrative tutorial (2066 words) followed by oral testimony on direct and cross-examination by legal counsel. Finally, the judge directed jurors on the appropriate law and legal standards to apply in reaching a verdict.
Two other potential influencesOral vs multimedia evidence: Individuals have preferences for the way in which they gather and process information. If learning style and presentation mode do not match, learning may suffer. In this study, the DNA tutorial was presented orally or via multimedia to examine the influence of
style on DNA knowledge.
on jurors’ responses to the expert evidence were examined:
visual aids and juror learning Neutral vs partisan experts: The qualifications of the expert and the content of the testimony were held constant while the party introducing the expert was varied. For one half of the mock-jurors, the expert was court-appointed and introduced by the trial judge; for the other mock-jurors, partisan expert evidence was led by the Crown prosecutor.
Jury-eligible citizens served as virtual jurors
Data were gathered in two stages. An independent market research company emailed invitations to persons residing within 60 kilometres of three major metropolitan areas where most Australian criminal trials take place (Sydney, Melbourne and Brisbane). In all, 3611 jury-eligible citizens (response rate70 %) completed a 15-minute online survey addressing their DNA knowledge, expectations of forensic evidence in criminal trials, trust in science, learning preferences, and television viewing habits. Approximately 7-14 days later, they were invited via email to participate in a one-hour simulated criminal trial as virtual jurors. An administrator who was blind to the experimental design allocated 470 mock-jurors to groups to obtain seven virtual juries that were roughly equivalent in terms of age, education, gender, state of origin, and learning preference. Each group consisted of 63-71 mock-jurors. Participation rates by state were representative of the Australian population. Six jury groups were exposed to DNA forensic expert evidence systematically varying the mode of presentation of the expert evidence and the party leading the expert. In a seventh control group, to obtain a baseline conviction rate and assessment of DNA learning in the absence of forensic expert evidence, mock-jurors were informed that DNA tests were inconclusive.
Pre-existing DNA knowledge and learning gains following the expert tutorial were assessed by means of objective multiple-choice questions. After viewing the trial simulation the mock-jurors rendered a verdict, and responded to a short questionnaire about the evidence.
Key Findings DNA evidence increased convictions • Exposure to incriminating DNA evidence significantly increased the conviction rate, by a
A tests were inconclusive. factor of three, compared to the rate when DNThe expert tutorial increased DNA knowledge • A brief pre-recorded presentation of cognitively sequenced DNA expert evidence was
effective in improving mock-jurors’ understanding of DNA evidence.
Pre-existing DNA knowledge among Australian jury-eligible citizens in all seven groups was low. On average, participants correctly answered only 24 percent of the questions and the guessing rate was high. Exposure to the 18-minute generic DNA tutorial led to significant improvements in their knowledge: the correct response rate rose to an average of 61 percent. On average, mock-jurors answered 37 percent more questions correctly post-trial. In addition, mock jurors were able to apply this knowledge to novel questions.
8
• Knowledge gains were greatest for less complex information • Education level predicted mock jurors’ DNA knowledge and learning
Mock-jurors with less formal education achieved lower DNA knowledge scores and learned less than their more educated counterparts. Although conviction rates did not vary by educational level, educational background influenced their understanding of the scientific evidence. Less knowledgeable mock-jurors were more prone to convict.
• Increased DNA knowledge reduced the force of DNA evidence • The conviction rate was highest in mock-jurors with the least DNA knowledge • Trust in scientific evidence declined as DNA knowledge increased • Trust in DNA evidence declined followMultimedia facilitated comprehension ing the trial
• No evidence of undue persuasion
There was no evidence that the multimedia increased verdicts in line with the party that led the expert or reduced critical appraisals of the expert evidence. The multimedia did not cause jurors to suspend disbelief, and did not exert an unduly persuasive influence.
• Increased scepticism about DNA infallibility
Rather than induce a verdict in line with the prosecution evidence, the multimedia increased scepticism about the expert evidence.
• Reduced convictions by less knowledgeable mock-jurors
When the DNA evidence was presented traditionally by oral examination, without visual aids, mock-jurors with a lower level of DNA knowledge were more prone to convict than their more knowledgeable counterparts. This difference in the propensity to convict disappeared when visual aids augmented the expert presentation and brought their verdicts in line with those of more knowledgeable mock-jurors.
• Benefited learning in jurors with visual and verbal learning styles • Reliance on traditional oral evidence to convey complex scientific and probabilistic
information to jurors is risky and can result in unsafe verdicts • Visual learners learned more than verbal learners • Presenting DNA evidence withCourt-appointed vs party experts
visual aids (multimedia) facilitated learning
Overall, the level of mock-juror DNA knowledge was associated with the propensity to convict. More scientific knowledge reduced the potent inculpatory effect of DNA evidence.
• Trust in expert evidence was higher in response to a judge-led expert • The DNA expert was perceived as more credible when judge-led • DNA evidence was more persuasive with less knowledgeable mock-jurors when it was
prosecution-led • Less knowledgeable mock-jurors were more likely to convict when DNA evidence was
prosecution-led, and were significantly more likely to view DNA evidence as sufficient to convict
• More knowledgeable jurors assessed the weight of the DNA evidence independently of the party who introduced the expert
9

CSI effects Approximately half of the mock-jurors were frequent CSI viewers, watching these shows most weeks. This practice influenced their responses to the trial evidence in a number of ways:
• There was no evidence that CSI viewing influenced conviction rates • CSI viewers who thought the forensic evidence in the television shows was realistic learned
less from the expert tutorial in the simulated trial • Compared to less frequent viewers, frequent CSI viewers reported significantly higher
- expectations that criminal trials will include evidence by experts, forensic scientists, psychologists, CCTV, fingerprints, DNA, and post-mortem reports
- trust in expert evidence - victim sympathy - motivation to serve as jurors - susceptibility to misinterpret the random match probability - threshold to convict - confidence in their verdict Jurors lack insight into their decisions
Mock-jurors perceived the DNA expert evidence as useful and easy to understand. However, their subjective judgments did not match their performance in several respects:
• Usefulness ratings of the tutorials were not positively correlated with the amount learned • Higher ratings of ease of understanding were associated with less learning • Confidence in verdict was unrelated to post-trial DNA knowledge Mock-jurors who voted
guilty rated the DNA evidence as more useful and easier to follow than their counterparts who acquitted
Recommendations
• Prior knowledge and educational background should be considered in regard to a juror’s ability to understand complex forensic evidence and render appropriate verdicts in line with that evidence.
• Jury education programs should be devised to equip jurors with relevant adequate knowledge about forensic evidence, particularly evidence involving complex scientific concepts.
• Courts may wish to provide jurors with pre-recorded tutorials on generic scientific concepts in
cases where the evidence at stake is complex, abstract and central to the issues in controversy in a case. For example, generic tutorials on DNA and other forensic scientific evidence could be presented to jurors via videotape in court or in a jury poolroom.
• The appointment of a single expert by the court or jointly by the parties is conducive to the use
of a generic tutorial to introduce stipulated or agreed expert evidence at trial.
• Courts and legal counsel should increase the use of visual aids in evidence and other legal proceedings to facilitate jury understanding of complex information.
• Courts should avoid reliance on juror self-reports of their confidence, understanding and
usefulness of scientific evidence and other complex information.
10

INTRODUCTION
The use of DNA evidence in Australian courts has increased exponentially since 1989 (Easteal & Easteal 1990; Walsh, Ribaux, Buckleton, Alastrair & Roux 2004). The science of DNA profiling is now well-tested and no longer the focus of defence challenges (Curran Walsh & Buckleton 2008; Haesler 2006; National Research Council 1996; 1992). DNA profiling has become a major tool used by all Australian law enforcement authorities (Australian Law Reform Commission 2003).
DNA profiling relies first on biological science, and second, on an application of mathematical probability. A DNA match between samples gathered from the suspect and offender does not establish with absolute certainty that the two are the same person (R v Pantoja 1996). However, few people understand the difference between a true and a reported match (Koehler 1995). When a match is found, the probability that the target is wrongfully identified because of a coincidental match, known as the “random match probability” (RMP), is reported (Thompson & Cole 2007). This probability usually ranges between 1 and many millions, billions or trillions (Koehler 1997). Although the RMP does not establish whether the suspect or someone else committed the crime in issue, a common lay interpretation is to equate a RMP of 1 in 1 billion to a 99.9 percent chance that the suspect is guilty. In criminal trials in Australia, the practice among forensic experts is to report a DNA match and the RMP. Other error rates that influence the reliability of the expert evidence such as the frequency of technical and human errors that occur in forensic laboratories, are not routinely reported, but may be explored in cross-examination. Cases have been documented in which misinterpretations of DNA tests led to wrongful convictions (Thompson Ford Doom Raymer & Krane 2003).
Juror difficulties with DNA expert evidence
In conjunction with a comprehensive study of the Crimes (Forensic Procedures) Act 2000, legal counsel, judges, and jurors in New South Wales were surveyed at the close of selected criminal trials involving DNA evidence (Findlay 2003). Results of this field study confirmed that jurors exposed to DNA profiling evidence in criminal trials had difficulty understanding DNA profiling evidence and the probabilistic information conveyed by forensic experts (Findlay 2003). Although a strength of this study was that these issues were examined in the context of actual trials with real jurors (Findlay, 2008), because the cases facts and cases complexity varied, and different juries with different experience and pre-trial knowledge were exposed to different types of expert presentations in which the probative value of the DNA expert evidence varied, the precise relationship between these variables could not be determined. Experimental studies which permit control over these variables have demonstrated that mock-jurors overestimate the importance of DNA evidence (Magnusson & Selinger 1990; Holmgren 2005; Wheate 2007). In part this is because they did not know how to interpret the RMP and underestimate the influence of or ignore lab error rates that can lead to a false positive match (Goodman-Delahunty & Newell 2004).
Archival and experimental studies demonstrated that incriminating DNA profiling evidence significantly increased conviction rates: juries convicted 23 times as much in homicide cases and 33 times in sexual assault cases when DNA evidence was introduced (Briody 2004; Lieberman Carrell Miethe & Krauss 2008). Post-trial interviews of jurors in six criminal trials in New South Wales revealed that jurors who admitted difficulties in understanding DNA expert evidence nonetheless proceeded to convict , providing some evidence of juror susceptibility to the “white coat syndrome” (Findlay 2008). They have prompted concern that the safety of verdicts in some criminal cases may be compromised by widespread misconceptions about the infallibility of DNA evidence (Gans & Urbas 2002) and that jurors are “overawed by the scientific garb in which the evidence is presented and attach greater weight to it than it is capable of bearing,” (R v Duke 1979: 48). In light of the powerful inculpatory effect of DNA evidence, commentators recommended that the prosecution should strive to achieve a transparent and accessible presentation of the expert evidence (Findlay &
11

Grix 2003), and to present reports and testimony “that is not cryptic and allusive” (Freckelton & Selby 2005).
The investigation of methods to facilitate juror understanding of the probative value of DNA evidence was highlighted as a crucial area for empirical research (National Research Council 1996). A number of interventions or strategies have been tried with mixed success. Attention first focused on traditional legal safeguards: jury directions and deliberation. The Australian Law Reform Commission recommended that the judiciary “develop model jury directions for use in criminal trials, to help judges and juries to evaluate DNA evidence and the associated statistical calculations offered into evidence by expert witnesses” (Australian Law Reform Commission 2003). One jury simulation study tested the model instruction proposed by the Commission and showed that it was ineffective (Dartnall & Goodman-Delahunty 2006). This finding is in line with a large body of evidence demonstrating the inefficacy of post-trial limiting directions to juries (Ogloff & Rose 2005). Jury deliberation has also proven inadequate. For example, comparisons before and after deliberation did not reveal significant differences in the understanding of mitochondrial DNA evidence among instructionally-aided groups (Dann, Hans & Kaye 2007). Post-trial interviews of actual jurors also indicated that deliberation was inadequate to remedy the comprehension difficulties with DNA expert evidence (Findlay 2003; Wheate 2006). One study of real jurors revealed that a juror’s educational level was a more substantial contributor to comprehension than deliberation (Hans 2007).
Several innovative procedures such as allowing jurors to take notes, to submit questions to an expert via the trial judge, to use a checklist requiring answers to questions, and provision of learning aids (copies of slides, a glossary and a summary) proved ineffective in eliminating juror’s comprehension difficulties with DNA expert evidence (Dann et al. 2007).
Researchers have noted that jurors may fail to comprehend expert evidence because it is often led in a disorderly and piecemeal fashion (Wheate 2006; Young 1999). Recently, the research focus shifted to elements of expert evidence, either at trial or pre-trial, that may enhance jury comprehension (Edmond & Mercer 1999; Findlay 2008) and reduce the misconception that “science does not lie” (Bornstein 2004). Jury simulation researchers have investigated modifications in the verbal form in which the statistical information was presented. In one study, although the DNA expert evidence was clearly and succinctly worded, jurors reported difficulty in understanding it and also made logical errors about its meaning (Dartnall & Goodman–Delahunty 2006). Other studies have revealed illogical changes in the inculpatory weight given by jurors to the DNA evidence in response to linguistic changes in the presentation of the expert evidence. For example, conviction rates were higher in response to the RMP presented as a conditional probability (Thompson & Schumann 1987) or likelihood ratio (Nance & Morris 2002) than when the RMP was presented as a frequency (Hoffrage Lindsey Hertwig & Gigerenzer 2000; Lindsey Hertwig & Gigerenzer 2003).
A cognitively sequenced DNA tutorial
Suggestions for court reform to assist jurors have included simplifying the expert language, providing jurors with a technical advisory body whom they can consult, standardising the verbal format used by experts to convey the RMP, providing jurors with a glossary of technical terms, providing visual aids to enhance learning, and providing jurors with a generic pre-trial tutorial to familiarise them with the technical language and probabilities (Myers Reinstein & Griller 1999).
The suggestion to prepare jurors for duty in criminal cases involving complex and technical evidence by providing them with a prepared tutorial about topics such as DNA profiling evidence (Young 2000) has never been tested. Results of the juror interviews involving six DNA trials in New South Wales showed that high pre-trial familiarity with DNA reduced juror’s doubt about the strength of the prosecution case (Findlay 2008). In five of these trials, a single forensic expert provides critical DNA
12

evidence. In one case, for example, the prosecution and defence concurred on the manner in which the science of DNA sampling was presented to the jury, and submitted a joint exhibit outlining the steps in DNA sampling, along with supplementary visual aids such as a picture of a DNA nucleus, to assist jurors (Findlay 2006). Cooperation between the defence and prosecution in leading forensic evidence by a single expert appeared to facilitate jury comprehension by avoiding the confusion that can arise when opposing partisan experts disagree. This model to present expert evidence is conducive to the use of a generic tutorial on DNA profiling.
The current study extended these recommendations by investigating whether a prepared generic tutorial about DNA profiling improved understanding of scientific expert evidence.
Few studies have assessed jurors’ pre-existing knowledge or their knowledge gain following evidentiary presentations and the introduction of instructional aids. Without these assessments, information to counter or “de-bias” pre-existing misconceptions cannot be appropriately formulated. One controlled experimental study that included take-home multiple-choice objective tests demonstrated that mock-jurors (high-school students and their parents) knew quite a bit about the scientific underpinnings of DNA profiling, but scored poorly on measures of the RMP (Magnusson & Selinger 1990; Wheate 2007). The current study extended this approach by using objective multiple-choice questions to measure mock-jurors’ pre-existing DNA knowledge before presenting an expert tutorial on DNA profiling, and then testing their knowledge again following exposure to the trial materials. The relationship between DNA knowledge and verdict was also examined.
Multimedia and learning
Traditional court procedures are predominantly oral. Information, evidence and instructions are provided orally to the jury in an inflexible, serial and real-time sequence. The oral or auditory mode of expert presentation is regarded by some as possibly the least effective for adult learners, such as jurors. Increased integration of visual aids, such as charts and diagrams, into expert evidence may enhance jury understanding of DNA evidence (Holmgren 2005).
Still photographic images and illustrative aids have been accepted into evidence, however reservations about their emotional and persuasive influence persist (e.g., Bright & Goodman-Delahunty 2004; Douglas Lyon & Ogloff 1997; Feigenson, 2007). Most eligible jurors today grew up with television, if not the Internet, and they are used to receiving information in these richer, more informationally dense modes. These jurors may struggle to maintain concentration and memory in the orally dominated court. Proponents of multimedia learning argue that people learn better and more accurately when information is presented both visually and verbally, as this reduces the cognitive load on each of the processing channels (Mayer 2001; Sweller & Chandler 1994). Therefore, the presentation of complex scientific evidence may be enhanced by effective use of rich media and its facility to appeal to multiple sensory channels.
Various commentators have advocated the use of visual aids to assist juries in understanding technical and legal issues (Young 2000). To date, experimental studies of multimedia visual aids have produced mixed findings: some had the desired facilitative effect on mock-jurors (Brewer Harvey & Semmler 2004; Hewson & Goodman-Delahunty 2008), some made no difference (Feigenson 2006), and others produced a negative “persuasive” effect in that jury verdicts were aligned with the information in the media notwithstanding contradictory facts in evidence (Kassin & Dunn 1997). To investigate the effects of multimedia instructional aids on learning and decision-making, mock-jurors in this study were exposed to either an oral, partially-oral or multimedia version of a generic tutorial on DNA profiling. This research method allowed us to compare the influence on mock-jurors of presentation modes with varying levels of multimedia support.
13

Learning style and presentation mode
Irrespective of the instructional mode, individuals have preferences for the way in which they gather and process information. “The manner in which individuals choose or are inclined to approach a learning situation has an impact on performance and achievement of learning outcomes” (Cassidy 2004, p. 420). These preferences are referred to as learning styles. A number of learning styles have been proposed. Most relevant to this study is the visual-verbal learning style. Visual learners “prefer visual representations of presented materials” and verbal learners “prefer written or spoke explanations” (Litzinger Lee Wise & Felder 2005, p. 1). Most people are visual learners (of 207 students, 87% preferred a visual learning style; Graf Viola, Leo & Kinshuk 2007). In spite of these preferences, everyone benefits when information is presented both visually and verbally.
Individual learning preferences influence the speed and accuracy of information processing (Mayer 2001; Rieber 2000). For this reason, it is important to consider the learning styles of the audience of any instructional programs. Knowledge of jurors’ learning preferences would enable the tailoring of presentations and arguments to better suit their expectations and learning preferences. If learning style and presentation mode do not match, jurors may become “uncomfortable, bored and inattentive” (Felder & Spurlin 2005). Given the verbal nature of the courtroom and the large proportion of visual learners in the community, a mismatch between presentation mode and learning style is likely, and as a consequence, jurors may become inattentive and miss important information. Attention and the capacity to learn from in-court presentations are crucial for jurors to render a fair verdict and deliver justice. If jurors’ individual needs are not met, justice may be compromised.
This study assessed mock-jurors’ learning preferences on the visual/verbal dimension by means of the Index of Learning Styles questionnaire (ILS) (Felder & Soloman 2001). By gathering information about learning preferences, we were able to investigate the interaction effects between presentation mode and learning style on juror learning following exposure to expert evidence on DNA profiling. The current findings explore whether all jurors or only visual learners benefit from a tutorial than includes multimedia.
Levels of understanding and structure of the DNA tutorial
To maximise the effectiveness of the generic tutorial in improving juror comprehension of DNA profiling, a well-tested pedagogical model of adult learning was applied in its construction. The content of the tutorial developed for use in this study was sequenced using the Structure of Observed Learning Outcomes (SOLO) taxonomy (Biggs 1992; Biggs & Collis 1982). The SOLO taxonomy was originally developed to evaluate learning in universities. This model suggests five possible levels of understanding ranging from unfamiliarity with a topic (prestructural) to the ability to generalise the abstract principles of a field and apply them in new settings (extended abstract). As no prestructural information was included in the tutorial, its content fell into four levels of the SOLO taxonomy (see Table 1). To facilitate adult learning, the SOLO taxonomy stipulates that information should be presented in order of structural difficulty, beginning with unstructured knowledge and then presenting more sophisticated knowledge about a topic. This model not only provided a useful structural flow for the content of the tutorial, but also allowed comparisons of learning gains at each level of difficulty. Ultimately, we hope that the generic tutorial can be designed that will facilitate juror learning of ‘relational’ or ‘extended abstract’ concepts. In the context of DNA profiling, this would reflect the ability to recognise the components of DNA structure and forensic processing and to apply this knowledge to an unfamiliar case. However, demonstration of DNA learning at any of the SOLO taxonomy levels comprises an enhancement in knowledge, and hence increased capacity to judge the probative value of DNA evidence.
14

The generic tutorial on DNA expert testimony used in this study was structured in a logical progression in accordance with the SOLO taxonomy. Relevant terms and concepts were defined at the outset, and then their relationships and roles in the interpretation of forensic evidence were explained. The commitment to use multimedia as an instructional technology in this context recognises the potential differences in learning styles of jurors (visual vs verbal learning preferences) as well as the powerful representational benefits of synchronised images, animation and audio. Three-dimensional modelling of DNA structure and clearly labelled graphics, combined with a narrative exposition of mathematical concepts and calculations, provided instruction that supported the structured learning outcomes of the SOLO taxonomy. The scripting and visual design of the materials managed the cognitive load on jurors by first establishing a symbolic representational vocabulary for the components of DNA structure (nucleotides, base pairs) and then using it to build and display more complex models and processes. A similar approach was taken with the mathematical expositions of RMP, using commonly recognised mathematical symbols and processes. The co-ordinated presentation of these multimedia informational units to jurors accompanied by an audio narration embodied the dual processing model of perception.
A tutorial that utilises multiple channels of information processing accommodates the potential for different learning styles in jurors. The danger with multimedia instruction is that its greatest asset--information density--can overload an individual’s cognitive resources and lead to misconceptions or disregard for the content (Fox, Park & Lang 2007; Sweller & Chandler 1994). The limited capacity of working memory (Miller 1956) restricts the complexity of instruction possible, even with dual-channel processing. By developing the content initially as a logical narrative, the tutorial was effectively constructed for presentation in an oral mode as well as use with the supporting visualisation typical of multimedia. This format allows jurors to draw selectively from the audio and/or the visualisations to meet their individual cognitive needs. Ideally, a learner should have control over the exposition to further manage the limits of working memory (Rieber 2000). As courts cannot support the time and technical demands of interactive media, well-structured sequential multimedia is a realistic alternative to the current mode of oral evidence presentation.
Table 1: Structure of Observed Learning Outcomes (SOLO) Taxonomy
Level of understanding Description
Prestructural Unfamiliarity
Unistructural Identify and perform simple procedures
Multistructural Enumerate, describe, list and combine
Relational Compare, contrast, explain, analyse, and relate and apply
Extended Abstract Theorise, generalise and reflect
CSI effects
In 2007, CSI: Crime Scene Investigation (CSI) was the most popular television program with 84 million viewers worldwide (New York Post 2008). The major role of television shows such as CSI is entertainment. For this purpose, commission of the crime, investigation and solving the case must fit within an hour-long episode. Less exciting aspects of police work are omitted and replaced by glamorous depictions of forensic scientists. The speed and accuracy of their analyses as portrayed in these shows are unrealistic, which impedes viewers from appreciating the complexity of real evidence and cases (Mann 2005). A content analysis of the first two seasons of CSI revealed that in each episode at least one forensic test was conducted, with finger- and shoeprints occurring most frequently (Podlas 2006). Blood, fibre/hair and semen were often found at the crime scene. Not only
15
does forensic evidence feature prominently, but it is presented as irrefutable and always leads to convictions. The analyses used for testing are partly nonexistent and deliver a picture of forensic work that is “too sexy, too fast and too clean” (Stephens 2007). In 2007, Court and legal counsel have expressed concern that justice may be compromised if these depictions of forensic science lead to misconceptions of forensic evidence in CSI viewers who serve as jurors.
Empirical findings on viewers exposed to CSI shows include some positive attributes. For example, CSI viewers were better informed about concepts of proof than non-viewers (Podlas 2006). A survey of 1,027 citizens called for jury-duty in Michigan, USA, revealed that CSI viewers expected more scientific evidence for criminal cases (Shelton Kim & Barak 2007). These jurors read simulated trial transcripts that did or did not involve scientific evidence, and rendered individual verdicts. No differences emerged in conviction rates in relation to CSI viewing. Rather, the researchers found what they called a “tech effect” because a significant number of jurors expected proof in criminal cases to include scientific evidence. In another trial simulation in which hair sample analyses were presented, CSI viewers were more sceptical of the forensic evidence and more confident in their verdicts than non-viewers (Schweitzer & Saks 2007). Despite the documentation of some conceptual and perceptual differences in response to forensic evidence, little evidence exists to suggest that exposure to CSI shows has a significant impact on conviction rates (Cole & Dioso-Villa 2009; Tyler 2006).
Most studies of the CSI effect originated in the United States of America. A review of this literature revealed that various types of CSI effects have been posited, including better-informed jurors, jurors who identify with crime investigators, more motivated jurors, and both anti-prosecution and pro-prosecution biases (Goodman-Delahunty & Tait 2006). Many of these theories about the influence of exposure to CSI and similar popular television shows remain untested and their application in Australia is unknown. Judges, lawyers and forensic scientists have expressed concern that Australian juries are susceptible to CSI effects (Wilson 2007) and that they perceive DNA profiling evidence more definitive than it is in reality (Goodman-Delahunty & Tait 2006) or as infallible (Wheate 2006). This study is the first to investigate the influences of CSI viewing on legal decision making in an Australian sample.
Independence and perceived neutrality of expert witnesses
Typically, the forensic DNA profiling evidence introduced in criminal trials is presented by an expert witnesses called to testify on behalf of a litigating party. This partisan association can be problematic to the impartiality of the expert and may impact perceptions of their credibility. Concerns over partisan biases in expert witnesses were voiced over a hundred years ago (e.g., Lord Arbinger v Ashton 1873). More recently, judges in New South Wales expressed concerns over biases in expert witnesses which were described as a significant problem for the quality of fact-finding (Freckelton Reddy & Selby 1999). In response to these concerns recommendations were made by a number of Law Reform Commissions in Australia to increase the use of a single expert, jointly appointed by the parties, or by the court (ALRC 1999; NSWLRC 2005; WALRC 1998). The view advanced by these commissions was that the objectivity of expert evidence and the credibility of the witness would be enhanced by joint or court-appointed expert witnesses.
Few studies have investigated the influence of partisan versus court-appointed experts, or the impact of a single joint expert on the perception and reception of their evidence by jurors. In one series of jury simulation studies, the content of the expert evidence was held constant while potential sources of expert bias were varied. Results indicated that mock-jurors were reluctant to rely on the testimony of an expert who was perceived as too partisan or as a biased “hired gun” (Cooper & Neuhaus 2000). The findings revealed that when the expert evidence was complex, mock-jurors were more likely to rely on peripheral cues to the credibility of the expert rather than
16
evaluate the content of the technical expert evidence. One peripheral cue of this nature is whether an expert is court-appointed or appears on behalf of one of the litigants.
In this study, the forensic expert is introduced either as judge-led court-appointed expert (neutral) or is a prosecution-led expert called by the Crown (partisan). This design allowed us to compare the perceptions of the complex expert evidence and the resulting verdicts in relation to the neutrality of the expert and the understanding of the DNA evidence by mock-jurors.
Study aims and hypotheses
In criminal cases, jurors have to interpret and apply case-specific DNA evidence and random match probabilities that require some pre-existing understanding of aspects of DNA science and the mathematics of probability. The presentation of uncontested information on these topics in the form of a brief tutorial may assist jurors to move from their individual differences in prior knowledge to a shared understanding of DNA and probability prior to rendering a verdict. This study tested the facilitative versus persuasive effects of a cognitively-sequenced tutorial on DNA evidence in the context of a contested criminal case in which circumstantial evidence implicated the defendant.
Based on the literature, we predicted that:
• The introduction of inculpatory DNA evidence would increase conviction rates.
• Exposure to the DNA tutorial would increase mock jurors’ DNA knowledge and understanding of forensic DNA profiling and decrease their trust in DNA evidence
• All mock-jurors would benefit from the visualisations embedded in the multimedia versions of the tutorial and achieve greater learning compared to jurors exposed only to the traditional oral version of the tutorial. This effect was expected to be larger for mock-jurors with a visual learning preference.
• More neutral judge-led DNA expert would appear more trustworthy than partisan prosecution-led DNA expert evidence.
• Frequent CSI exposure would influence perceptions of the forensic evidence but not verdicts.
17
METHOD AND PROCEDURES
Study design and materials
A quasi-randomized 3x2 between-subjects factorial design was used. The first independent variable, Mode of Expert Evidence, had three levels (oral vs partial-oral vs full multimedia) and the second independent variable, Party Introducing the Expert, had two levels (judge-led vs prosecution-led expert evidence). In addition to these six Expert groups, a No Expert control group was informed that the DNA tests were inconclusive. Participants were randomly allocated to the seven experimental groups.
Table 2: Study design
Expert evidence
Oral Partial-oral Multimedia
No expert, tests inconclusive
Oral profiling and RMP tutorial
Multimedia profiling and oral
RMP tutorial
Multimedia profiling and RMP
tutorial
Judge-led Group 1
Group 2 Group 4 Group 6
Prosecution-led Group 3 Group 5 Group 7
Variations in the presentation of expert evidence
In all, seven versions of the trial materials were compiled to test the influence of expert evidence, the mode of presentation (oral vs multimedia) and the perceived neutrality or bias (court-led vs prosecution-led) of a single forensic expert. The following table describes the variations in the independent variables in each experimental version of the trial.
Table 3: Variations in expert evidence by group:
Expert Group Description of variations in expert evidence by group
1 No expert evidence
DNA tests on samples from the crime-scene were inconclusive therefore no DNA expert evidence was introduced and DNA profiling and RMP were not discussed. This group established the base rate for convictions and other measures of case strength in the absence of incriminating DNA expert evidence.
2 Judge-led oral evidence
The judge introduced a court-appointed forensic DNA expert and asked preliminary questions to establish the educational qualifications and expertise of the witness. Orally, the expert presented educational material about DNA and RMP, followed by direct and cross-examination conducted by legal counsel.
3 Prosecution-led oral evidence
The Crown prosecutor introduced a forensic DNA expert and asked preliminary questions to establish the educational qualifications and expertise of the witness. Orally, the expert presented educational material about DNA and RMP, followed by direct and cross-examination conducted by legal counsel.
18
4 Judge-led partial multimedia (DNA) and oral evidence (RMP)
The judge introduced a court-appointed forensic DNA expert and asked preliminary questions to establish the educational qualifications and expertise of the witness. The expert presented multimedia educational material about DNA and oral explanations of RMP, followed by direct and cross-examination conducted by legal counsel.
5 Prosecution-led partial multimedia (DNA) and oral evidence (RMP)
The Crown prosecutor introduced a court-appointed forensic DNA expert and asked preliminary questions to establish the educational qualifications and expertise of the witness. The expert presented multimedia educational material about DNA and oral explanations of RMP, followed by direct and cross-examination conducted by legal counsel.
6 Judge-led multimedia evidence (DNA and RMP)
The judge introduced a court-appointed forensic DNA expert and asked preliminary questions to establish the educational qualifications and expertise of the witness. The expert presented multimedia educational material about DNA and multimedia explanations of RMP, followed by direct and cross-examination conducted by legal counsel.
7 Prosecution led multimedia evidence (DNA and RMP)
The Crown prosecutor introduced a forensic DNA expert, asked preliminary questions to establish the educational qualifications and expertise of the witness. The expert presented multimedia educational material about DNA and multimedia explanations of RMP followed by direct and cross-examination conducted by legal counsel.
Materials Trial simulation A simulated criminal trial, Crown v Young, was developed based on an actual homicide case, and prepared in accordance with NSW laws. The case for conviction was circumstantial and weak without the forensic DNA evidence linking the suspect to the crime scene. The defendant, Ronald Young was accused of murdering Allan Grange, the ex-boyfriend of his wife. In all experimental groups, the same trial transcript was re-enacted via audio files enhanced by photographs of the speaker. The simulation materials were devised to conform to the usual sequence and format in which jurors are exposed to expert evidence in a criminal case. After the judge’s introduction and preliminary instructions to jurors, the prosecution and defence presented opening statements and called their witnesses. Six witnesses provided testimony on behalf of the Crown and two on behalf of the defence. Incriminating DNA evidence was introduced by a single forensic expert. Details of the evidence presented by the respective witnesses are summarized below in the case synopsis. Following the testimony, the judge provided relevant directions to the jury.
The trial transcript was 4860 words in length, of which 60% was devoted to DNA evidence presented by the forensic expert. The trial simulation lasted approximately 35 minutes.
The expert evidence was presented in three segments. First the expert was introduced and qualified on the basis of her education, experience and expertise in DNA forensic science. Next, she presented a narrative tutorial (two-thirds of the expert evidence) lasting approximately 16 minutes. The tutorial addressed two major topics: DNA profiling and random match probability. This was followed by five minutes of case-specific questions and answers on direct and cross-examination.
19

Table 4: Overview of the simulated criminal trial
Crown v Young SYNOPSIS OF CASE MATERIALS
Judge
Murder charge against Ronald Young; he pleads not guilty. Jurors are advised of the burden of proof, threshold for conviction, and to keep an open mind until all evidence is heard.
Crown’s opening statement
On June 13 2005, Ronald Young murdered Allan Grange after Grange threatened his wife and demanded that she move back to Canberra to live with him.
Defence opening statement
Melinda and Ron Young drove to Grange’s apartment in Canberra to pick up her belongings. Grange was not there. Ron waited in the car. She used her keys to enter the apartment and they returned to Sydney.
WITNESSES FOR THE CROWN
Professor Scott Gordon Forensic Pathologist
Victim’s body bore 36 stab wounds. Two severe slash wounds to the throat. A small air rifle pellet was located under the skin at the back of Mr Grange’s head. Estimated time of death was between 5pm Monday June 13 and 6am Tuesday June 14 2005.
Joseph Smithers Victim’s Business Partner
Day-to-day Allan Grange was easy-going, courteous, and hospitable. He also drank heavily and was violent when drunk. After Melinda Young and Grange separated, he accused her of stealing his money and using it to move to Canberra. Allan Grange had many enemies.
John Watkins NSW RTA Technician
Melinda Young’s car was filmed traveling north towards Sydney at 8:45 pm on Monday June 13 by NSW Roads and Traffic Authority Safetycams on the Hume Highway. Melinda Young’s car was filmed traveling south towards Canberra 4 hours later.
Solomon True Telstra Technician
Telephone records for Allan Grange show 27 calls to Melinda Young’s mobile telephone number in the 2 weeks preceding his death. His phone records show two calls to the home of her father in June 2005.
20

Dr Kary Mullis
Expert qualification: educational background and experience. Tutorial on DNA profiling (15 mins, 67% of tutorial) Tutorial on random match probability (5 mins, 33% of tutorial). Direct examination: Saliva sample from Young matched a DNA sample from hands of the victim. Probability of a random match was 1 in one billion; a strong likelihood exists that the samples came from the same source. Cross-examination: A coincidental DNA match is possible; DNA transfer can occur; Ron Young’s DNA could have been transferred to Grange’s house by Melinda Young; DNA profiling includes some risk of human or technical errors.
WITNESSES FOR THE DEFENCE
Ronald Young The Accused
He drove to Allan Grange’s apartment complex on June 13 with his wife. He waited in the car park while she went upstairs. He could not estimate the time that he arrived in the car park or that he and Melinda Young left the car park. He did not recall what property, if any, his wife retrieved from Mr. Grange’s apartment that night.
Melinda Young Wife of the Accused
She had a sexual relationship with Allan Grange and lived with him in his Mascot apartment for several months. She had keys to the apartment and used them to enter the apartment on June 13 2005. Ron Young did not enter the apartment. Allan Grange was not at home. She never told her husband or friends that Allan Grange assaulted her sexually and physically. Al Grange never accused her of stealing his money when she moved to Canberra. She and Ron Young never joked about shooting Al Grange up with heroin and making it look like a suicide.
DIRECTIONS TO THE JURY
Judge
Expert evidence is part of all the evidence to assist jurors in understanding the DNA evidence. Jurors do not have to act upon expert evidence. The accused is presumed innocent. The onus is on the Crown to prove beyond a reasonable doubt that the accused is guilty of murder. The accused does not need to prove he is not guilty. If jurors regard it as a reasonable possibility that someone else murdered Allan Grange, the defendant must be acquitted.
Expert testimony: oral vs multimedia The content of the DNA expert evidence was developed in consultation with forensic scientists, medical scientists and legal counsel to appropriately reflect the common and core elements of DNA evidence that is routinely presented by forensic scientists in criminal trials throughout Australia. The DNA tutorial addressed two topics. The first and more extensive segment (~12 mins) described procedures for DNA sampling and measurement to screen for a match; the second segment explained how the random match probability is calculated based on a DNA profile (~5 mins). Final scripts of the tutorial were proofed and approved by experts in the field.
21
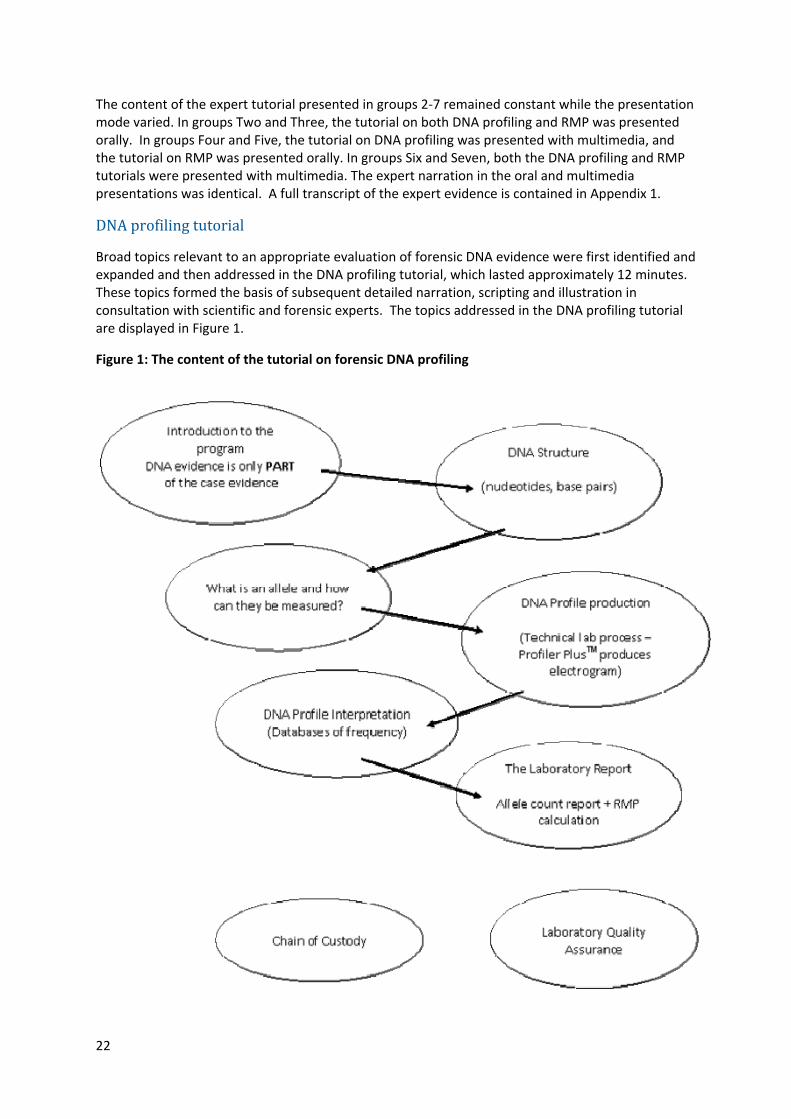
The content of the expert tutorial presented in groups 2-7 remained constant while the presentation mode varied. In groups Two and Three, the tutorial on both DNA profiling and RMP was presented orally. In groups Four and Five, the tutorial on DNA profiling was presented with multimedia, and the tutorial on RMP was presented orally. In groups Six and Seven, both the DNA profiling and RMP tutorials were presented with multimedia. The expert narration in the oral and multimedia
al. A full transcript of the expert evidence is contained in Appendix 1. presentations was identicDNA profiling tutorial Broad topics relevant to an appropriate evaluation of forensic DNA evidence were first identified and expanded and then addressed in the DNA profiling tutorial, which lasted approximately 12 minutes. These topics formed the basis of subsequent detailed narration, scripting and illustration in consultation with scientific and forensic experts. The topics addressed in the DNA profiling tutorial are displayed in Figure 1.
Figure 1: The content of the tutorial on forensic DNA profiling
22

Random match probability tutorial The tutorial on RMP addressed two key topics and lasted approximately 5 minutes. Again, pictures fulfilled an illustrative purpose only and the multimedia presentation was slightly longer than the oral one. The first topic expanded on the information presented in the DNA profiling segment and specifically addressed the significance of a DNA “match”. The second topic was more general and explained general probabilities and applied calculations using concrete real-life examples. See Figure 2.
Figure 2: The content of the tutorial on random match probability (RMP)
The Laboratory Report
What is Probability?
Concrete examples from everyday life
Allele count tables + RMP calculation
Pre-trial screening questionnaire The pre-trial questionnaire served as a screening instrument to identify a representative pool of jury-eligible citizens to participate in the Stage Two mock trial experiment. It contained questions on the following topics:
Demographic characteristics Viewing habits for CSI-type television shows 19 multiple-choice DNA knowledge questions. To minimize guessing, the option “I don’t know” was included. 11 items from the Index of Learning Styles (Felder & Soloman 2001).
All groups completed the same pre-trial questionnaire. A copy of the pre-trial screening questionnaire is attached marked Appendix 2.
CSI viewing habits
CSI exposure was measured by asking participants about the frequency with which they viewed CSI and cognate television shows, namely CSI, CSI Miami, CSI New York, Law & Order, Law & Order Criminal Intent, Law & Order SVU, Criminal Minds, Bones, and NCIS. For each program, responses were scored as follows: 4 = more than once a week; 3 = every week; 2 = most weeks; 1 = not often;
23
and 0 = never. Responses were summed to obtain a total CSI exposure score with a possible range from zero (never watched any of the shows) to 36 (watched all shows more than once a week). In this report, CSI viewing refers to this group of CSI-related televisions shows. In addition, participants rated their interest in and the realism of these shows on a 7-point Likert scale (1=not at all
ted/realistic). interested/realistic, 7=extremely interesExpectations of scientific evidence Participants indicated in how many out of ten cases they expected to encounter eight different types of forensic evidence (eyewitness, expert, forensic scientist, psychologist, CCTV, fingerprints, DNA, post-mortem report), and the trustworthiness of these forms of evidence. Trustworthiness was
ot at all trustworthy; 7=extremely trustworthy). rated on a 7-point Likert scale (1=nIndex of Learning Styles (ILS) The Index of Learning Styles (Felder & Soloman 2001) is a 44-item questionnaire measuring self-reported learning styles on four dimensions: Processing (active vs reflective), Perception (sensing vs intuitive), Input (visual vs verbal), and Understanding (sequential vs global). Each scale consists of 11 forced-choice items with two answer categories. Participants answer all items and, if both answers apply, choose the one that applies more frequently.
Reliability of the ILS was examined by administering the scales over a period of 8 months to 124 engineering students. Results revealed test-retest coefficients of 0.511 for the visual/verbal dimension. The correlation was significant at the 0.01 level (Zywno 2003). In another study, a test-retest coefficient of 0.68 was found following a 7-month interval in a group of 24 engineering students (Livesay Dee Felder Hites Nauman & O’Neal 2002). Internal consistency describes how well a study measures the underlying construct and is described in terms of Cronbach α-values. The internal consistency of the four scales ranged from 0.41 to 0.72 (Livesay et al. 2002; Van Zwangenberg Wilkinson & Anderson 2000; Zywno 2003). The lowest acceptable cut-off score for attitudinal measures, such as learning preferences, has been set at 0.5 (Tuckman 1999). In a sample of 557 engineering students, α-values of 0.61 to 0.63 emerged for the visual/verbal scale (Zywno 2003). In the same study, factor analyses showed that eight of the visual/verbal items loaded on the second factor extracted. Overall, reliability and validity were deemed satisfactory.
In this study, because of time constraints, only the visual-verbal scale of the ILS was administered. Answers indicating a verbal preference were scored as one (1), those indicating a visual preference were scored as zero (0). Answers were summed to produce a total score for each participant, with a
A higher score indicated a stronger verbal preference. possible range from 0 to 11.Post-trial questionnaire The post-trial questionnaire sought information about participants’ DNA knowledge and their view of the case:
• 19 DNA knowledge questions, identical to those used in the pre-trial questionnaire, presented in a different sequence
• 10 novel DNA knowledge questions • Case-specific questions about legal decision making
Participants in all experimental groups answered the same post-trial questionnaire, with the exception of minor changes in wording for Group 1 to account for the lack of expert evidence in that trial version. A full copy of the post-trial questionnaire showing these variations is attached marked Appendix 3.
24

DNA knowledge questions All knowledge questions were tailored to the content of the testimony presented by the forensic expert. The content of most of the 19 questions on the pre-trial questionnaire pertained to the DNA profiling tutorial, three questions pertained to the RMP tutorial. The same questions were presented in a different order in the post-trial questionnaire, along with 10 novel questions, seven of which addressed DNA profiling while three addressed RMP. In all, 23 items tested the participants’ knowledge of DNA profiling and 6 items tested their knowledge of RMP. Responses to the items were scored as zero (false) or one (correct). The maximum possible score for the pre-trial questionnaire was 19, and 29 for the post-trial questionnaire.
All test items were classified using the Structure of Observed Learning Outcomes (SOLO) Taxonomy (Biggs & Collis 1982), which offers an objective method to structure learning outcomes. The SOLO taxonomy arose in response to a need for analysis of learning goals and achievements in higher education. The categories encompass the higher-order cognitive skills required of jurors to understand and apply complex scientific evidence. SOLO distinguishes five levels of learning from the prestructural (relative ignorance) level to the extended abstract level, in which a learner can apply knowledge and concepts to solve new problems in unfamiliar situations. No prestructural items were included in this study, thus four levels of the SOLO taxonomy were distinguished, as shown in Table 5. A copy of the post-trial DNA question items delineating the classification of each item on the SOLO taxonomy is attached as Appendix 4.
Table 5: DNA knowledge test items by taxonomy level (SOLO)
Level Label Pre-trial Post-trial DNA RMP
1 Unistructural 5 10 9 1
2 Multistructural 7 9 9 0
3 Relational 5 8 4 4
4 Extended Abstract 2 2 1 1
Measures of legal decision making
Several measures explored the perceived strength of the evidence and the defendant’s culpability. Threshold for conviction was measured by asking mock-jurors to indicate the certainty (zero - 100%) needed to convict the defendant. After viewing the simulated trial, participants indicated whether the defendant was guilty beyond reasonable doubt, and their confidence in the verdict on a7-point Likert scale (Not at all confident to Extremely confident). To obtain a continuous measure of perceived culpability to supplement the dichotomous verdict mock-jurors indicated how likely it was that the defendant killed the victim (zero-100%).
Other case-specific questions sought information about the perceived sufficiency of the prosecution evidence and DNA evidence, the persuasiveness of prosecution and defence evidence, the credibility of the expert, the usefulness of the tutorials, their ease of understanding, the extent of mock-juror sympathy for the victim, and their motivation to serve as a juror. Mock-jurors recorded their agreement or disagreement with these propositions on a 7-point Likert scale.
Finally, since one common misconception of DNA evidence is to equate the RMP with the probability that the defendant is guilty (Thompson & Schumann 1987), the following multiple-choice question was included: “Assuming the probability of a random match between the DNA found at
25
the crime scene and the sample from the defendant is 1 in 1 billion, choose the best answer: (a) The probability that the defendant killed the victim is 99.99%; (b) The probability that the defendant killed the victim is very high, but other factors have to be considered; (c) Reasonable doubt is created by the fact that at least 20 people other than the defendant have the same DNA profile.”
Procedures
Data were gathered by a market research company in two stages. To obtain a representative jury eligible sample, email invitations to participate in a study of jury decision-making conducted by the University of New South Wales were issued to 23,157 individuals located within a 60-kilometre radius of three major metropolitan Australian criminal courts, namely the greater Sydney, greater Brisbane and greater Melbourne areas. The criterion for participation was jury eligibility, i.e., age over 18 years and Australian citizenship, and participants were given two weeks to complete the online Pre-trial Screening Questionnaire. Approximately 22-28% (N=6637) of the recipients opened the email invitations. The lower numbers are derived from actual recorded clicks; the higher numbers are implied responses based on a formula that takes into account that a certain proportion of the recipients may have opened html files which preclude precise tracking of the response rate. As an incentive, participants were given the option of entering a lottery to win one of five $200 gift vouchers, and 70-78% (N=5185) accessed the link that described the task and presented the informed consent materials. Of this group 70% (N=3611) proceeded to complete the Pre-Trial Screening Survey.
The multiple-choice DNA knowledge questions were presented in a forced-choice format. Unless participants answered all items on a page, they could not advance to the next page. A link was provided at the bottom of the page for participants to send queries to the researchers. Participants were notified that they could terminate their participation at any time. After completing the questionnaire, participants provided demographic information and technical details about their internet connection and software to ensure they had the capacity to view the jury simulation multimedia.
Approximately 7-14 days after participants completed the Stage One screening survey, they were invited via email to participate as mock-jurors in a simulated criminal trial. They were informed that this required a time commitment of approximately one hour within a specified time period (two weeks), for which they would be paid $40. To test the influence of learning preference on mode of presentation, ILS total scores were used to ensure that equivalent proportions of verbal and visual learners were allocated to each of the seven experimental groups at Stage Two. Eligible respondents were sorted into jury pools based on four demographic criteria: learning style (visual vs verbal preference), state of origin (New South Wales, Victoria and South Australia), age (over and under 45 years of age), and gender. A market researcher who was blind to the experimental manipulations randomly allocated participants from each jury pool to one of the seven experimental juries until a minimum of 60 participants were assigned to each experimental jury group, whereupon that jury group was closed.
Each participant received a link to the randomly assigned experimental version of the trial. Participants viewed a brief test video to adjust image settings and volume, then viewed the trial simulation. During the trial, they could not fast forward or rewind, but a stop option was available. Still photographs of the speakers accompanied the oral narration. After viewing the trial, participants completed the post-trial questionnaire, provided details for payment, were thanked and provided debriefing information.
26

RESULTS
Demographic characteristics of mock-jurors
The majority of the mock-jurors were residents of New South Wales in the greater Sydney area. Participation rates by state approximated population proportions of New South Wales, Victoria, and Queensland (NSW = 42%, VIC = 32%, QLD = 26%, Australian Bureau of Statistics 2008) (See Appendix 5, Table A).
The age of the mock-jurors, measured in age-groups, ranged from 18 to 65 years or more. Approximately half of the participants (52%) were over age 45, and the remainder were under 45 years of age. The age-group distribution was similar in Stage One and Stage Two samples. Comparisons of participant age groups with those in the Australian population are displayed in Appendix 5, Table A.
Twice as many women than men completed the Stage One questionnaire and a similar sex ratio was obtained from Stage Two mock-jurors (females = 64.7%, n=304; males = 35.3%, n=166). Most mock-jurors self-described as fluent in English (Stage One = 97.6%; Stage Two = 98.7%).
The educational achievements of the Stage One and Stage Two mock-jurors were similar. A comparison of the educational qualifications of the study sample to the Australian population is presented in Appendix 5, Table A.
Most Stage Two mock-jurors (31%, n=146) had completed Year 12; 27 percent (n=126) had a university degree; a further 20 percent (n=94) had a TAFE diploma. Relatively few had trade certificate (9%, n=43) or a less than Year 12 qualification (13%, n=61). Most Stage One and Stage Two mock-jurors had received instruction in biology, physics, chemistry or mathematics at high school (Appendix 6, Figure A). Two-thirds (67.0%, n=315) of the mock-jurors had studied mathematics; the proportions who studied biology, physics or chemistry were considerably smaller, as is shown in Figure 3. The educational levels of mock-jurors were ranked in the following order: university degree, TAFE diploma, trade certificate, Year 12, less than Year 12.
Figure 3: Subjects studied at high school by mock-jurors (percent, N=470)
36.4%
26.6%32.8%
67.0%
0%
10%
20%
30%
40%
50%
60%
70%
80%
Biology Physics Chemistry Mathematics
Figure 3: Subjects studied at high school by mock-jurors (percent, N=470)
27

CSI viewing habits
Approximately one half of the Stage Two mock-jurors (51.5%) were frequent viewers of CSI shows (“most weeks,” “every week” or “more than once a week”). A further 31.7 percent reported that they did not watch these shows often; and 14.9% per cent reported that they never watched any of the CSI shows. CSI viewing habits of Stage Two mock-jurors are displayed in Figure 4.
Figure 4: CSI viewing habits of mock-jurors (percent, N=470)
Never13.2%
Seldom35.3%
Most weeks31.3%
Every week18.1%
More than once a week2.1%
Figure 4: CSI viewing habits of mock-jurors (percent, N=470)
N = 62
N = 166
N = 147
N = 85
N = 10
Overall, interest in CSI type television shows was high (mean = 5.3; SD=1.3) but the perceived realism was moderate (mean = 4.4; SD=1.3). CSI viewing frequency was unrelated to the viewers’ learning preference. Results on all of these measures for Stage One and Stage Two mock-jurors were similar.
Learning preference scores
Consistent with previous findings on the distribution of learning preferences, more than two-thirds of the Stage One sample (72.5%) had a visual learning preference, reflected in total ILS scores equal to or less than 5 (out of 11). The proportion of verbally-oriented individuals (with a total ILS score of 6 or more) recruited for the Stage Two sample was increased from 27.5 to 53 percent, and mock-jurors with a visual learning preference comprised 47% of the Stage Two sample.
Pre-existing knowledge about DNA evidence
Responses to the 19 pre-trial DNA knowledge questions were aggregated. The overall mean number of correct responses in the Stage One sample was 4.63 items (SD=2.49, min: 0, max: 17), 24 percent correct. A similar level of pre-trial knowledge about DNA evidence (24%) was observed in the Stage Two sample (SD=2.3; range 0 to 13). Pre-existing DNA knowledge in all seven experimental groups was similar, as is shown in Figure 5.
CSI effects on perceptions of evidence, motivation to serve as juror and victim sympathy
We predicted that increased exposure to CSI shows would increase expectations of scientific evidence in a criminal trial. To test this hypothesis, mock-jurors’ trust in and expectancy for several types of forensic evidence, including DNA profiling, were compared in relation to their CSI viewing habits. All mock jurors had relatively high expectations that forensic experts would appear in a criminal trial (72%), particularly to fingerprint evidence (72%) and DNA evidence (72%). Exposure to
28

CSI shows was positively correlated with the expectancy for all forms of forensic evidence, except eyewitness testimony (Table B in Appendix 5 provides details of these analyses). The hypothesis that more frequent CSI viewers anticipated significantly more forensic evidence than did infrequent viewers, was confirmed.
Figure 5: Pre-trial DNA knowledge by group (percent correct, confidence interval, N=470)
22% 24% 26% 25% 22% 23% 24%
0%
10%
20%
30%
40%
50%
60%
70%
80%
90%
100%
Group 1 Group 2 Group 3 Group 4 Group 5 Group 6 Group 7
Figure 5: Pre-trial DNA knowledge by group (percent correct, confidence interval, N=470)
Frequent CSI viewers exhibited more trust in the five types of scientific expert evidence (forensic scientist, psychologist, fingerprints, DNA and post-mortem report; Table C, Appendix 5) than less frequent viewers. The trustworthiness of more conventional evidence, such as that given by lay witnesses, or evidence that did not entail scientific expertise, such as eyewitness testimony and CCTV, was not influenced by CSI viewing. CSI exposure was also related to a common misconception about DNA evidence: mock-jurors who interpreted the RMP as equivalent to a 99.99% chance that the defendant committed the crime had more frequent exposure to CSI shows [12.25 vs 10.56 out of 36; F(1, 468)=4.12, p<.05, ηp2=0.009]
More frequent CSI viewers were also more motivated to serve as jurors than were infrequent viewers (χ²=18.50, df=1, p<.05), and were also more sympathetic to the crime victim than were infrequent viewers (χ²=4.04, df=1, p<.05).
Exposure to DNA forensic expert reduced trust in DNA evidence
We predicted that trust in DNA evidence would decline as mock-jurors became better informed by the expert tutorial on DNA profiling included in the trial simulation. As expected, mock-jurors who were not exposed to DNA expert testimony provided similar ratings of the trustworthiness of DNA evidence before and after the trial. A significant decline in the trustworthiness ratings of DNA evidence was observed among mock-jurors who were exposed to expert DNA testimony [t(398)=-4.70, p<.05], as is shown in Figure 6.
Although exposure to DNA expert testimony reduced trust in DNA evidence, the change in the perceived trustworthiness of DNA profiling evidence (post-trial score minus pre-trial score) was not correlated with amount of DNA learning or post-trial DNA knowledge. In general mock-jurors with a higher level of DNA post-trial knowledge (those who answered 20 or more of the 29-items correctly)
29

had significantly less trust in scientific evidence [82% vs 86% F(1, 354)=13.99, p<.05, ηp²=0.038], and a lower expectation [61% vs 72%; F(1, 354)=25.58, p<.05, ηp²=0.067] that scientific evidence (expert, forensic scientist, psychologist, fingerprints, DNA, post-mortem report) would be introduced at trial than did jurors with less DNA knowledge (post-trial score below 16).
6
6.2
6.4
6.6
6.8
7
Pre-trial Post-trial
No expert group Expert group
Figure 6: Pre-trial and post-trial trust in DNA evidence by group (mean score, N=470)
Figure 6: Pre-trial and post-trial trust in DNA evidence by group (mean score, N=470)
Perceived neutrality of expert enhanced trust in DNA evidence
In three Expert groups, the expert was introduced by the judge as court-appointed; in the remaining three groups, the expert was partisan, introduced and led by the Crown prosecutor. The DNA expert was rated as significantly more credible when introduced by the judge rather than the Crown prosecutor (100% vs 98%; χ²=4.06, df=1, p<.05). More generally, mock-jurors’ trust in evidence by experts (forensic scientist and psychologist) was significantly higher when the DNA expert was led by the judge rather than the prosecutor [81.7% vs 78.5%; F(1, 397)=6.41, p<.05, ηp²=0.016]. Despite the fact that there was no difference in the content of the expert evidence, the association of the expert with the judge rather than the prosecution enhanced the perceived trustworthiness of that expert and of other types of experts who were not called to testify in this case.
Post-trial DNA knowledge
Mock-jurors’ DNA knowledge after the simulated trial was assessed by 29 multiple-choice questions that included 10 novel questions in addition to the 19 questions presented at Stage One. Scores on the post-trial questionnaire ranged from three to 29, with a mean of 17.2 (SD=4.4) amounting to a 59 percent rate of accuracy.
An analysis of variance (ANOVA) produced a significant main effect for expert evidence [F(6, 463)=24.71, p<.05, ηp²=0.24] such that mock-jurors who were exposed to DNA expert evidence had significantly higher levels of DNA knowledge than mock-jurors who were presented with no expert evidence [M=18.14 (63%) vs M=12.06 (42%) correct responses, respectively]. The post-trial DNA knowledge scores achieved are displayed in Figure 7. There were no significant differences in mean post-trial DNA knowledge scores between the six Expert groups (groups 2 to 7) (Table D in Appendix 5).
30

42% 38%48%
63% 61%66%
0%10%20%30%40%50%60%70%80%90%
100%
29 post-trial items 19 post-trial items (repeated)
10 novel items
No expert (group1) Expert (group2-7)
Figure 7: Post-trial DNA knowledge by group (percent items correct, N=470)
Figure 7: Post-trial DNA knowledge by group (percent items correct, N=470)
Repeated measures revealed that on average, the DNA knowledge of mock-jurors in the No Expert group increased following the simulated trial from 22% (M=4.17) percent to 38% (M=7.21) percent even though they did not receive expert information about DNA evidence [t(70)=9.26, p<.05].
Overall, mock jurors exposed to expert evidence answered 50 percent more of the 29 questions correctly at the conclusion of the trial than did their counterparts in the No Expert group. The relative increase in DNA knowledge following the presentation of expert evidence was computed by subtracting the percentage of correct responses to the 29 post-trial questions in the No Expert group (42%) from that in the Expert groups (63%; groups 2-7) and dividing the result by the percentage of correct responses in the No Expert group (42%).
For each participant, a learning score was derived by subtracting the total score on the 19 DNA knowledge items presented before the simulated trial from the total score on these items presented after the trial. The possible range of the learning score was between -19 and +19. Participants’ scores ranged from -6 to 16, with a mean of 6.4 (SD=3.3; N=470). Eight participants [five in the No Expert group (7%) and three in the Expert groups (0.7%)] achieved negative learning scores, ranging from -1 to -6, indicating that their DNA knowledge decreased following the simulated-trial. Fifteen participants [six in the No Expert group (9%) and nine in the Expert groups (2%)] achieved a learning score of zero, meaning that they neither decreased nor increased their knowledge.
As predicted significant learning was observed in mock jurors who were exposed to expert evidence (groups 2 to 7 combined) [t(398)=42.07, p<.05]. To determine whether participants exposed to expert evidence achieved greater learning than participants in the No Expert group, a one-way ANOVA on learning by experimental groups was conducted, which yielded a significant result [F(6,463)=18.92, p<.05, ηp²=0.197]. Follow-up tests confirmed that the amount of learning observed in each of the six Expert groups was significantly greater than that in the No Expert group (Figure 8 and Table E in Appendix 5). These findings indicated that although mock-jurors in all conditions demonstrated a knowledge gain, mock-jurors exposed to DNA expert testimony learned substantially more than mock-jurors in the No Expert group. In other words, DNA knowledge was significantly enhanced by the expert testimony beyond improvements shown by mock-jurors in the control group who were not exposed to the expert testimony.
31
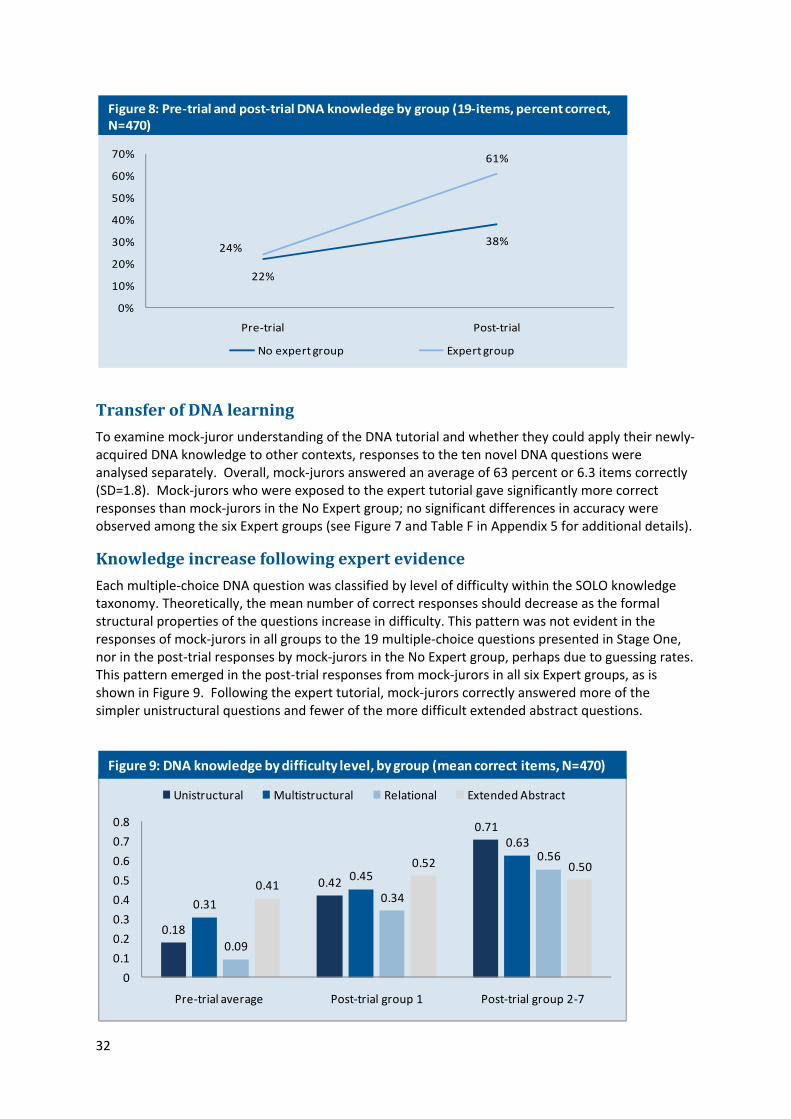
Figure 8: Pre-trial and post-trial DNA knowledge by group (19-items, percent correct, N=470)
22%
38%24%
61%
0%
10%
20%
30%
40%
50%
60%
70%
Pre-trial Post-trial
No expert group Expert group
Figure 8: Pre-trial and post-trial DNA knowledge by group (19-items, percent correct, N=470)
Transfer of DNA learning
To examine mock-juror understanding of the DNA tutorial and whether they could apply their newly-acquired DNA knowledge to other contexts, responses to the ten novel DNA questions were analysed separately. Overall, mock-jurors answered an average of 63 percent or 6.3 items correctly (SD=1.8). Mock-jurors who were exposed to the expert tutorial gave significantly more correct responses than mock-jurors in the No Expert group; no significant differences in accuracy were observed among the six Expert groups (see Figure 7 and Table F in Appendix 5 for additional details).
Knowledge increase following expert evidence
Each multiple-choice DNA question was classified by level of difficulty within the SOLO knowledge taxonomy. Theoretically, the mean number of correct responses should decrease as the formal structural properties of the questions increase in difficulty. This pattern was not evident in the responses of mock-jurors in all groups to the 19 multiple-choice questions presented in Stage One, nor in the post-trial responses by mock-jurors in the No Expert group, perhaps due to guessing rates. This pattern emerged in the post-trial responses from mock-jurors in all six Expert groups, as is shown in Figure 9. Following the expert tutorial, mock-jurors correctly answered more of the simpler unistructural questions and fewer of the more difficult extended abstract questions.
Figure 9: DNA knowledge by difficulty level, by group (mean correct items, N=470)
0.18
0.42
0.71
0.31
0.45
0.63
0.09
0.34
0.56
0.41
0.52 0.50
0
0.1
0.2
0.3
0.4
0.5
0.6
0.7
0.8
Pre-trial average Post-trial group 1 Post-trial group 2-7
Unistructural Multistructural Relational Extended Abstract
Figure 9: DNA knowledge by difficulty level, by group (mean correct items, N=470)
32

Across seven experimental jury groups, repeated measures analysis demonstrated significant knowledge gains for all question types, with the exception of the most difficult level, extended abstract questions, in the No Expert group. Details are presented in Appendix 5, Tables G and H. The most dramatic learning gain was anticipated in response to questions reliant on unistructural knowledge. As expected, the amount of learning gain for the unistructural items significantly exceeded that for more difficult items for each Expert group. These results are displayed in Figure 10. (Additional details are contained in Appendix 5, Table I). Consistent with the findings on overall DNA knowledge, effect sizes showed that the learning gain in the No Expert group for unistructural [F(1,468)=157.41, p<.01, ηp²=0.252], multistructural [F(1,468)=40.51, p<.01, ηp²=0.08], and relational items [F(1,468)=28.40, p<.01, ηp²=0.057] were significantly smaller than in the Expert groups.
While the knowledge gains for unistructural, relational, and extended abstract information were similar across presentation modes, the knowledge gain for multistructural information was marginally greater when the expert evidence was presented via multimedia than orally [F(1,397)=3.33, p=.069, ηp²=0.008].
Figure 10: Mean increase in learning by SOLO taxonomy level and group (N=470)
0.21
0.57
0.12
0.31
0.22
0.39
0.08 0.10
0
0.1
0.2
0.3
0.4
0.5
0.6
Group 1 Group 2-7
Unistructural Multistructural Relational Extended Abstract
Figure 10: Mean increase in learning by SOLO taxonomy level and group (N=470)
CSI effects on DNA learning Frequent CSI viewers achieved less learning While responses to the objective multiple-choice questions revealed no differences in the pre-existing DNA knowledge of more frequent versus less frequent CSI viewers, the former group benefited less from the DNA expert testimony and achieved significantly lower scores on post-trial measures of DNA knowledge (Kendall’s τ=-0.070; N=470, p<.05) and learning (Kendall’s τ=-0.105; N=470, p<.01) compared to less frequent CSI viewers. Differences in education contributed to these results: the educational level of more frequent CSI viewers was lower (Kendall’s τ=-0.145; N=470, p<.01) and fewer CSI viewers reported studying mathematics at senior high school (Kendall’s τ=-0.102; N=470, p<.01). A linear regression confirmed that when education was held constant, frequency of exposure to CSI no longer predicted post-trial DNA knowledge, but remained a significant predictor of DNA learning (Std Beta=-0.11, t=-2.26, p<.05).
33
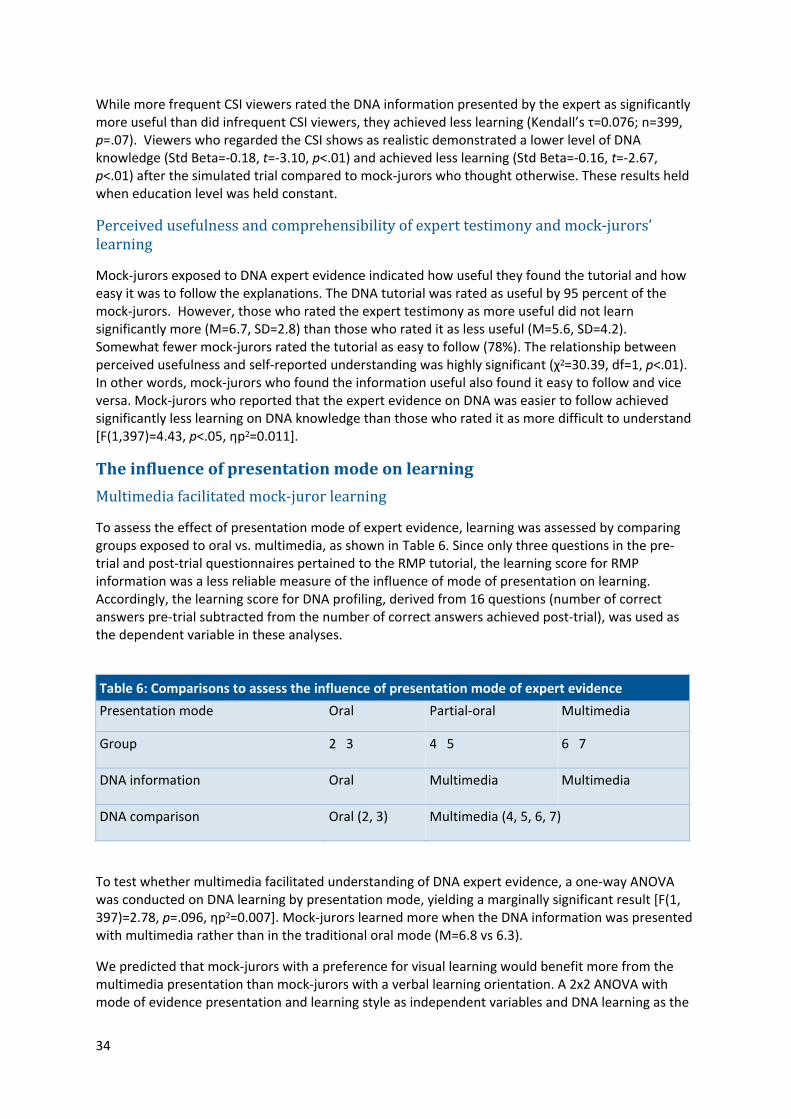
While more frequent CSI viewers rated the DNA information presented by the expert as significantly more useful than did infrequent CSI viewers, they achieved less learning (Kendall’s τ=0.076; n=399, p=.07). Viewers who regarded the CSI shows as realistic demonstrated a lower level of DNA knowledge (Std Beta=-0.18, t=-3.10, p<.01) and achieved less learning (Std Beta=-0.16, t=-2.67, p<.01) after the simulated trial compared to mock-jurors who thought otherwise. These results held when education level was held constant. Perceived usefulness and comprehensibility of expert testimony and mock-jurors’ learning Mock-jurors exposed to DNA expert evidence indicated how useful they found the tutorial and how easy it was to follow the explanations. The DNA tutorial was rated as useful by 95 percent of the mock-jurors. However, those who rated the expert testimony as more useful did not learn significantly more (M=6.7, SD=2.8) than those who rated it as less useful (M=5.6, SD=4.2). Somewhat fewer mock-jurors rated the tutorial as easy to follow (78%). The relationship between perceived usefulness and self-reported understanding was highly significant (χ²=30.39, df=1, p<.01). In other words, mock-jurors who found the information useful also found it easy to follow and vice versa. Mock-jurors who reported that the expert evidence on DNA was easier to follow achieved significantly less learning on DNA knowledge than those who rated it as more difficult to understand [F(1,397)=4.43, p<.05, ηp²=0.011].
The influence of presentation mode oMultimedia facilitated mock-juror learning n learning
To assess the effect of presentation mode of expert evidence, learning was assessed by comparing groups exposed to oral vs. multimedia, as shown in Table 6. Since only three questions in the pre-trial and post-trial questionnaires pertained to the RMP tutorial, the learning score for RMP information was a less reliable measure of the influence of mode of presentation on learning. Accordingly, the learning score for DNA profiling, derived from 16 questions (number of correct answers pre-trial subtracted from the number of correct answers achieved post-trial), was used as the dependent variable in these analyses.
Table 6: Comparisons to assess the influence of presentation mode of expert evidence
Presentation mode Oral Partial-oral Multimedia
Group 2 3 4 5 6 7
DNA information Oral Multimedia Multimedia
DNA comparison Oral (2, 3) Multimedia (4, 5, 6, 7)
To test whether multimedia facilitated understanding of DNA expert evidence, a one-way ANOVA was conducted on DNA learning by presentation mode, yielding a marginally significant result [F(1, 397)=2.78, p=.096, ηp²=0.007]. Mock-jurors learned more when the DNA information was presented with multimedia rather than in the traditional oral mode (M=6.8 vs 6.3).
We predicted that mock-jurors with a preference for visual learning would benefit more from the multimedia presentation than mock-jurors with a verbal learning orientation. A 2x2 ANOVA with mode of evidence presentation and learning style as independent variables and DNA learning as the
34

dependent variable yielded a non-significant result [F(3, 345)=1.56, p=.20]. However, a linear regression analysis showed that mock-jurors with a preference for visual learning achieved greater DNA learning than did verbal learners [F(1, 397)=4.28, p<.05]. In the absence of a significant interaction effect, firm conclusions cannot be drawn as to whether this learning advantage was facilitated by the visual aids in the presentation of the expert evidence.
Verdicts
After viewing the simulated trial, mock-jurors indicated whether the defendant was guilty beyond reasonable doubt based on the evidence presented at trial. Overall, the split between convictions (53.2%) and acquittals was fairly even. Expert evidence increased the conviction rate Logistic regression revealed that the presence of a DNA expert was a significant predictor of verdict (χ²=32.73, df=1, p<.01): the mean conviction rate among mock-jurors who were exposed to DNA expert evidence (58.6%) far exceeded that among mock-jurors who were not exposed to expert evidence (22.5%), as is shown in Figure 11. Among mock jurors exposed to expert evidence, those who found the DNA information easy to follow (χ²=6.20, df=1, p<.05) and who perceived it to be useful (χ²=6.03, df=1, p<.05) were more likely to find the defendant guilty.
Figure 11: Conviction rate by group (percent, N=470)
58.6%
22.5%
0%
10%
20%
30%
40%
50%
60%
70%
80%
90%
100%
Expert present Expert absent
Figure 11: Conviction rate by group (percent, N=470)
The influence of DNA knowledge and learning on the conviction rate To assess the effects on legal decision making of DNA learning following exposure to expert evidence, the control group was excluded from the following analyses. We anticipated that mock-jurors with more DNA knowledge would more appropriately assess the weaknesses of the circumstantial DNA evidence in the simulated trial and be less likely to convict. The results confirmed this hypothesis. Mock-jurors with a higher level of post-trial DNA knowledge (correctly answered 20 or more of the 29 multiple-choice questions) were less likely to rate the prosecution evidence as sufficient to prove the defendant’s guilt (χ²=4.19, df=1, p<.05). The mock-jurors who rendered a guilty verdict had a significantly lower level of post-trial DNA knowledge (correctly answered 16 or fewer of the multiple-choice questions) (17.76 vs 18.68) [F(1,397)=5.46, p<.05, ηp²=0.014] than those who acquitted. Significantly fewer jurors with a high level of post-trial DNA knowledge
35
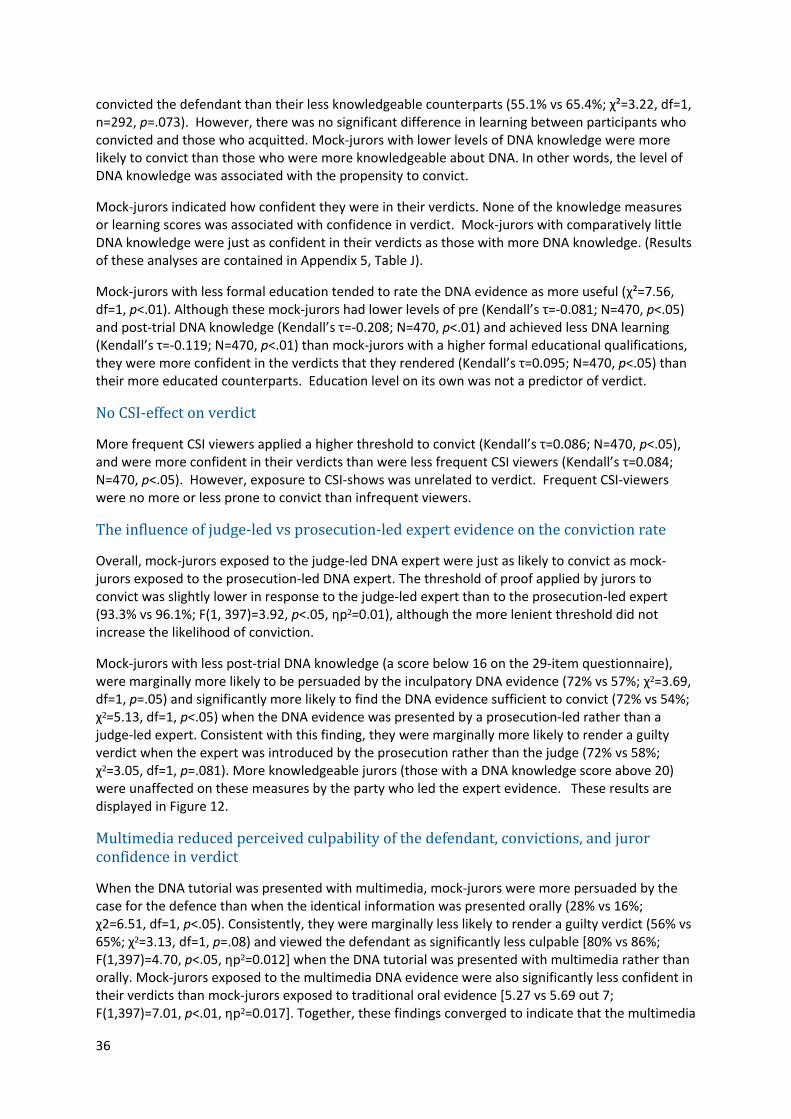
convicted the defendant than their less knowledgeable counterparts (55.1% vs 65.4%; χ²=3.22, df=1, n=292, p=.073). However, there was no significant difference in learning between participants who convicted and those who acquitted. Mock-jurors with lower levels of DNA knowledge were more likely to convict than those who were more knowledgeable about DNA. In other words, the level of DNA knowledge was associated with the propensity to convict.
Mock-jurors indicated how confident they were in their verdicts. None of the knowledge measures or learning scores was associated with confidence in verdict. Mock-jurors with comparatively little DNA knowledge were just as confident in their verdicts as those with more DNA knowledge. (Results of these analyses are contained in Appendix 5, Table J).
Mock-jurors with less formal education tended to rate the DNA evidence as more useful (χ²=7.56, df=1, p<.01). Although these mock-jurors had lower levels of pre (Kendall’s τ=-0.081; N=470, p<.05) and post-trial DNA knowledge (Kendall’s τ=-0.208; N=470, p<.01) and achieved less DNA learning (Kendall’s τ=-0.119; N=470, p<.01) than mock-jurors with a higher formal educational qualifications, they were more confident in the verdicts that they rendered (Kendall’s τ=0.095; N=470, p<.05) than
rparts. Education level on its own was not a predictor of verdict. their more educated counteNo CSI-effect on verdict More frequent CSI viewers applied a higher threshold to convict (Kendall’s τ=0.086; N=470, p<.05), and were more confident in their verdicts than were less frequent CSI viewers (Kendall’s τ=0.084; N=470, p<.05). However, exposure to CSI-shows was unrelated to verdict. Frequent CSI-viewers were no more or less prone to convict than infrequent viewers. The influence of judge-led vs prosecution-led expert evidence on the conviction rate Overall, mock-jurors exposed to the judge-led DNA expert were just as likely to convict as mock-jurors exposed to the prosecution-led DNA expert. The threshold of proof applied by jurors to convict was slightly lower in response to the judge-led expert than to the prosecution-led expert (93.3% vs 96.1%; F(1, 397)=3.92, p<.05, ηp²=0.01), although the more lenient threshold did not increase the likelihood of conviction.
Mock-jurors with less post-trial DNA knowledge (a score below 16 on the 29-item questionnaire), were marginally more likely to be persuaded by the inculpatory DNA evidence (72% vs 57%; χ²=3.69, df=1, p=.05) and significantly more likely to find the DNA evidence sufficient to convict (72% vs 54%; χ²=5.13, df=1, p<.05) when the DNA evidence was presented by a prosecution-led rather than a judge-led expert. Consistent with this finding, they were marginally more likely to render a guilty verdict when the expert was introduced by the prosecution rather than the judge (72% vs 58%; χ²=3.05, df=1, p=.081). More knowledgeable jurors (those with a DNA knowledge score above 20) were unaffected on these measures by the party who led the expert evidence. These results are displayed in Figure 12. Multimedia reduced perceived culpability of the defendant, convictions, and juror confidence in verdict When the DNA tutorial was presented with multimedia, mock-jurors were more persuaded by the case for the defence than when the identical information was presented orally (28% vs 16%; χ2=6.51, df=1, p<.05). Consistently, they were marginally less likely to render a guilty verdict (56% vs 65%; χ²=3.13, df=1, p=.08) and viewed the defendant as significantly less culpable [80% vs 86%; F(1,397)=4.70, p<.05, ηp²=0.012] when the DNA tutorial was presented with multimedia rather than orally. Mock-jurors exposed to the multimedia DNA evidence were also significantly less confident in their verdicts than mock-jurors exposed to traditional oral evidence [5.27 vs 5.69 out 7; F(1,397)=7.01, p<.01, ηp²=0.017]. Together, these findings converged to indicate that the multimedia
36
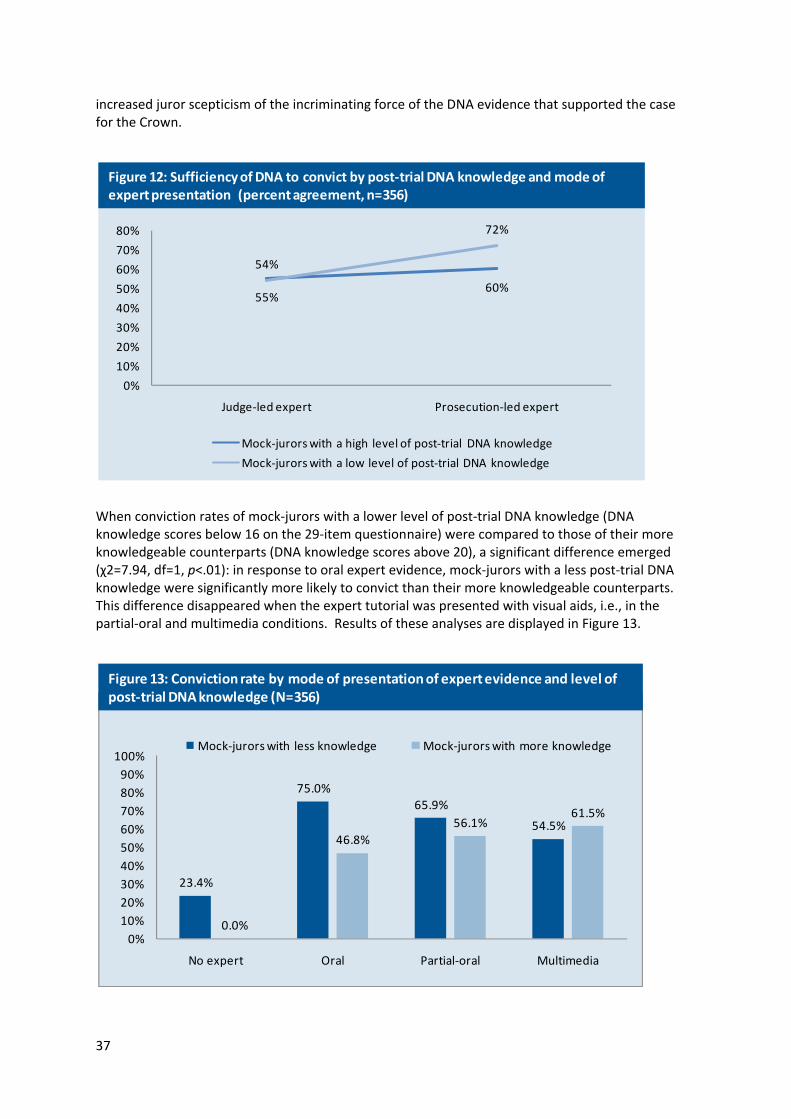
increased juror scepticism of the incriminating force of the DNA evidence that supported the case for the Crown.
55%60%
54%
72%
0%
10%
20%
30%
40%
50%
60%
70%
80%
Judge-led expert Prosecution-led expert
Mock-jurors with a high level of post-trial DNA knowledge
Mock-jurors with a low level of post-trial DNA knowledge
Figure 12: Sufficiency of DNA to convict by post-trial DNA knowledge and mode of expert presentation (percent agreement, n=356)
Figure 12: Sufficiency of DNA evidence to convict by post-trial DNA knowledge and mode of expert presentation (percent agreement, n=356)
When conviction rates of mock-jurors with a lower level of post-trial DNA knowledge (DNA knowledge scores below 16 on the 29-item questionnaire) were compared to those of their more knowledgeable counterparts (DNA knowledge scores above 20), a significant difference emerged (χ2=7.94, df=1, p<.01): in response to oral expert evidence, mock-jurors with a less post-trial DNA knowledge were significantly more likely to convict than their more knowledgeable counterparts. This difference disappeared when the expert tutorial was presented with visual aids, i.e., in the partial-oral and multimedia conditions. Results of these analyses are displayed in Figure 13.
Figure 13: Conviction rate by mode of expert presentation and post-trial DNA knowledge (N=356)
23.4%
75.0%65.9%
54.5%
0.0%
46.8%56.1%
61.5%
0%10%20%30%40%50%60%70%80%90%
100%
No expert Oral Partial-oral Multimedia
Mock-jurors with less knowledge Mock-jurors with more knowledge
Figure 13: Conviction rate by mode of presentation of expert evidence and level of post-trial DNA knowledge (N=356)
37

Mock-jurors with less post-trial DNA knowledge convicted significantly more frequently following exposure to the oral expert evidence than following the multimedia DNA profiling tutorial (χ²=4.23, df=1, p<.05). They also reported that the DNA tutorial was easier to follow when presented via multimedia than orally (χ²=4.61, df=1, p<.05). However, mode of presentation did not influence the conviction rate or perceived comprehensibility of DNA information in mock-jurors with a higher level of post-trial DNA knowledge.
38
DISCUSSION
This study investigated whether the presentation of a cognitively sequenced expert tutorial on DNA evidence could improve jurors’ relevant knowledge and decision making in a criminal case.
Jury-eligible citizens lack knowledge of DNA profiling
Australian jury-eligible citizens who come to court know little about DNA profiling. Objective multiple-choice questions were devised with the help of forensic experts and lawyers to ensure they were representative of the information jurors typically encounter in real criminal trials. Data gathered from a large sample of potential jurors in the three busiest metropolitan areas where criminal trials are conducted established that most citizens’ knowledge of DNA was poor: on average, they correctly answered less than one quarter of the questions (24%). Jurors with limited DNA knowledge may perceive evidence of a DNA match as infallible or irrefutable, which could be detrimental to justice (Wood 2003). As DNA evidence is common in criminal cases (Walsh et al 2004), educating jurors on relevant aspects of DNA profiling is essential (Australian Law Reform Commission 2003).
Knowledge gain from the presentation of expert forensic evidence
Exposure to an 18-minute cognitively sequenced expert tutorial significantly improved mock-jurors’ knowledge of DNA evidence; the average knowledge gain was 37 percent. This knowledge gain indicated that mock-jurors were capable of understanding the critical issues commonly addressed in most DNA cases about DNA profiling and the significance of a random match. Inclusion of 10 novel DNA multiple-choice questions post-trial confirmed that mock-jurors were able to apply the DNA information presented by forensic expert in a different context. The brief pre-recorded tutorial was effective in improving DNA-relevant knowledge in mock-jurors.
Despite the non-interactive nature of the DNA tutorial, most mock-jurors found it useful and easy to follow. Higher ratings of usefulness were not correlated with the amount learned by mock-jurors: those who found the DNA information easier to follow learned less. This outcome demonstrates that subjective judgements by mock-jurors do not always concur with their performance.
Use of the SOLO taxonomy to distinguish the relative difficulty of DNA multiple-choice questions (Biggs & Collis 1982) revealed significant knowledge gains for all four types of knowledge (i.e., unistructural, multistructural, relational and extended abstract). Knowledge gain among mock-jurors exposed to the expert tutorial was most dramatic for unistructural items. Understanding of more straightforward and simple scientific concepts about DNA profiling was readily achieved by exposure to a brief 18-minute tutorial. Comparable gains in learning of more complex concepts might require additional aids and time (Biggs 1992). Knowledge gain for multistructural concepts was enhanced by multimedia presentations, although those gains were only marginally significant. Since only a few questions in each SOLO category were tested the influence of presentation mode on learning of more complex information was not fully explored. For example, only two of the items tested extended abstract knowledge. The multimedia presentation may be differentially beneficial for the learning of different types of knowledge. Since knowledge gains for more difficult topics at the relational and extended abstract levels were similar across presentation modes, it remains uncertain whether question difficulty was the determinant of modal influences on knowledge gain. The successful communication of more complex scientific evidence may require more extensive instruction and methods to achieve comparable knowledge gains. Future research should investigate the levels of knowledge and mode of instruction in more depth.
39

The influence of mode of presentation of expert evidence: oral vs multimedia
We predicted visual aids in the form of multimedia would facilitate learning of the scientific DNA evidence. We found this effect with a marginally significant result. We also hypothesised that mock-jurors with a visual learning preference would benefit more from the multimedia than verbal learners (Chun & Plass 1997; Mayer 2001), but in this study, learning preference did not interact with presentation mode on learning. In general, mock-jurors with a visual learning preference learned more than jurors with a verbal learning preference, irrespective of the mode of presentation.
An important finding was that the technologically sophisticated multimedia presentation did not exert an unduly persuasive or biasing influence on jurors’ decisions. Thus, concern that jurors suspend disbelief in the face of visual evidence does not appear warranted. An intriguing finding was the influence of mode of presentation of the expert tutorial on verdicts of mock-jurors who were less knowledgeable about DNA. When those jurors were exposed to traditional oral expert evidence, they were more likely to convict the defendant than their more knowledgeable counterparts. This difference disappeared when visual aids were added to the expert presentation (i.e., in the partial-oral and multimedia groups). Instead of being overly persuasive, multimedia appeared to reduce the inculpatory power of the forensic evidence.
The inclusion of visual aids decreased the likelihood that mock-jurors with less accurate DNA knowledge would convict, but more knowledgeable mock-jurors were unaffected. This finding implies that the multimedia increased the accessibility of the DNA information among less knowledgeable mock-jurors and brought their legal decision making in line with that of their more knowledgeable counterparts, whose propensity to convict was unaffected by the mode of presentation of the expert evidence. This finding demonstrated that far from exerting an unduly persuasive influence favourable to the prosecution, the multimedia presentation reduced the inflated conviction rate among less knowledgeable mock-jurors who otherwise were prone to convict on the basis of quite slender circumstantial evidence.
Overall, the multimedia tutorial was effective in facilitating an appropriate understanding of DNA evidence and was perceived by mock-jurors who were less knowledgeable as more comprehensible than traditional oral expert evidence. More importantly, the multimedia effectively reduced the propensity of less knowledgeable mock-jurors to convict and brought their decisions in line with those of mock-jurors whose understanding of the DNA evidence was more accurate. These findings indicated that multimedia increased mock-juror sensitivity to the fallibility of DNA evidence and lowered the conviction rate. However the current findings did not establish that increased learning alone led to more acquittals. Future studies should examine the extent to which multimedia differentially influences jurors with different educational backgrounds and knowledge. The multimedia was effective in reducing susceptibility to the “white coat syndrome” among less knowledgeable jurors (Briody 2004; Bornstein 2004).
40
The influence of court-appointed vs party experts
The party (judge vs prosecution) introducing the expert evidence had some influence on mock-juror’s perceptions of the evidence. Although the manipulation of expert neutrality was very minor, effected by varying whether the judge or the prosecutor introduced the expert and asked several questions about her education and experience to qualify her as an expert on DNA evidence, this subtle variation produced some significant effects. The effects were apparent in ratings by mock jurors of the credibility of the expert, their trust in expert evidence, and the threshold of proof required for a conviction.
Overall, the expert was rated as extremely credible by all mock-jurors, regardless of the party who led her evidence. However, a small but significantly higher credibility rating of the expert emerged when she was introduced by the judge rather than the Crown prosecutor. The effect was also apparent in mock-jurors’ trust in evidence by experts (forensic scientist and psychologist), which was rated significantly higher when the DNA expert was led by the judge rather than the prosecutor--again a small but significant increase when the expert appeared to be court-appointed. Interestingly, when the expert was judge-led and thus appeared more neutral, mock jurors reported a significantly lower threshold of proof was needed to convict the defendant (93.3% vs 96.1%).
Some differences in the use of the expert evidence were associated with apparent expert neutrality or bias, but these emerged only among mock-jurors who had less DNA knowledge. The results revealed that mock-jurors with a lower level of post-trial DNA knowledge were marginally more likely to be persuaded by the inculpatory DNA evidence (72% vs 57%) and significantly more likely to find the DNA evidence sufficient to convict (72% vs 54%) when the incriminating forensic evidence was prosecution-led rather than a judge-led. The same trend emerged with respect to their verdicts: mock jurors with less DNA knowledge were marginally more likely to render a guilty verdict when the expert was introduced by the Crown prosecutor than by the judge (72% vs 58%). The mock-jurors who were most knowledgeable about DNA rendered their decisions on the strength and sufficiency of the DNA evidence, and their verdicts, independently of the apparent neutrality or bias of the expert.
The effect of expert evidence on trust in science
Exposure to expert forensic evidence in the context of a criminal case had a number of impacts on mock-jurors. Overall, the perceived trustworthiness of DNA evidence was very high. However, repeated measures revealed a slight but significant drop in trust following exposure to the tutorial. This change was unrelated to the amount that mock-jurors learned about DNA from the expert evidence. Trust in DNA evidence before and after the trial was unchanged in mock-jurors who were not exposed to a forensic expert. These findings suggest that far from being seduced by the “white coat syndrome” and deferring to experts (Vidmar 2005), jurors may increase their scepticism in response to expert testimony. Moreover, jurors with higher objective post-trial DNA knowledge scores rated the scientific evidence as substantially less trustworthy, and expected less of this evidence to be introduced in criminal cases than did jurors with lower post-trial DNA knowledge scores. Lower levels of DNA knowledge were associated with the highest expectations of and trust in forensic expert evidence. Mock jurors with higher post-trial DNA knowledge expressed the most scepticism regarding forensic experts and technology.
Educational level and jurors’ understanding of scientific evidence
Consistent with some previous findings (Hans 2007), a juror’s educational background was a significant predictor of understanding of the scientific evidence. Jurors with fewer educational qualifications made more errors on the objective tests of relevant DNA knowledge and learned less from the expert tutorials than more educated jurors. In a case in which scientific evidence is presented, as in the current simulated trial, jurors with less scientific knowledge may be prone to
41

convict on the basis of inculpatory forensic evidence that they do not fully understand. Although in this study, knowledge, and not educational background, was a predictor of convictions, the relationship between knowledge and educational background may be an important variable to consider in regard to a juror’s ability to understand complex forensic evidence and to render appropriate verdicts in line with the evidence.
DNA evidence, knowledge and verdict
As predicted, exposure to the inculpatory DNA evidence significantly increased conviction rates. The conviction rate among mock jurors exposed to forensic expert DNA evidence was almost triple that among mock-jurors who were informed that the DNA evidence was inconclusive. This finding replicated those in previous studies in which the presence of DNA evidence in a weak, circumstantial criminal case significantly increased the conviction rate (Dartnall & Goodman–Delahunty 2006).
Curiously, mock-jurors who found the defendant guilty also rated the DNA evidence more useful and easier to follow even though objective tests of their DNA knowledge revealed that there was no relationship between perceived ease of understanding and accuracy of DNA knowledge.
The accuracy of a mock-juror’s DNA knowledge was associated with the likelihood to acquit. Mock-jurors with a less accurate grasp of DNA information following the trial convicted more frequently than their more knowledgeable counterparts. This outcome demonstrated that knowledge about the scientific evidence in issue in a criminal case is important in reducing juror susceptibility to the “white coat syndrome” (Briody 2004).
The level of expressed confidence in verdict was unrelated to the accuracy of DNA knowledge: mock-jurors with relatively little understanding of the DNA evidence were just as confident in their verdicts as their more knowledgeable counterparts. This outcome, together with the finding that jurors who perceived the evidence as easier to follow actually learned less, demonstrated that mock-jurors lacked insight into the limitations of their knowledge, as their subjective judgments were at odds with their performance. These results are consistent with those reported in previous research conducted with real jurors who typically expressed confidence in their ability to understand and follow judicial instructions (Jackson 1992), when both their ability to comprehend and follow directions were often inadequate (Rose Chopra & Ogloff 2001). Accordingly, courts and legal counsel are advised to exercise caution in relying on self-reports by jurors when screening for prejudice, knowledge, and understanding. Jury researchers should incorporate self-reports as well as objective performance measures in their studies.
CSI effects
Over half of our jury-eligible participants were frequent viewers of CSI-type television shows and watched these shows regularly on a weekly basis. However, most viewers rated these shows as only moderately realistic, suggesting that they were somewhat critical of the dramatic portrayals of forensic science on television. Given widespread concern over the influence of exposure to CSI shows on jury decision-making (Podlas 2006, Tyler 2006), we examined the influence of frequent CSI viewing on responses to the trial information. Results revealed that more frequent viewers expected more forensic evidence in criminal trials, such as by CCTV, fingerprints, DNA, post-mortem reports, scientific and psychological experts. They also placed more trust in scientific evidence than did infrequent viewers. In addition, more frequent viewers were more sympathetic to the crime victim and more eager to serve as jurors. These findings were consistent with the content of most CSI television shows in which forensic evidence is used to convict culpable offenders and the content is sympathetic to crime victims (Tyler 2006).
Although CSI viewing did not correlate significantly with the level of pre-existing DNA knowledge, on average, more frequent viewers had less education and were less likely to have studied mathematics
42

in high school. When these educational variables were held constant, more frequent CSI viewers benefited less from the expert testimony and learned less relevant DNA knowledge than did the infrequent CSI viewers, even though they reported finding the DNA information more useful.
Mock-jurors who regarded the portrayals of forensic science in CSI shows as realistic learned less from the expert tutorial and had lower DNA knowledge scores following the expert DNA evidence than viewers who rated these shows as less realistic. The correlational nature of these findings does not permit firm causal conclusions about the interference of exposure to CSI-shows on receptivity to DNA expert evidence. Although more frequent CSI viewers reported that they applied a slightly more stringent threshold to convict the defendant and were more confident in their verdicts, no evidence that CSI-viewing influenced verdicts was obtained in this sample. These findings replicated outcomes in previous studies of the CSI effect where no influence of CSI viewing on conviction rates emerged (Podlas 2006; Schweitzer & Saks 2007; Shelton et al. 2007).
Limitations of the study
The trial simulation method applied in this study offered the opportunity to compare mock-jurors’ self-reports with legally relevant decisions and behaviours, and to discern the real (rather than self-reported) relationship between the understanding of scientific evidence and verdict. These findings are nonetheless subject to a number of limitations. Participants were jury-eligible community members residing with the jury catchment area approximately 60 kilometres from major metropolitan criminal courts in three Australian states, and represented a wide spectrum of educational backgrounds, and age groups. Although data on the gender composition of Australian jurors are not available, the over-representation of females in the current sample is more typical of civil than criminal jury panels (Rudi personal communication).
Juror motivation in a simulated trial may differ from that in a real criminal case. Whether this will result in more or less learning, or more or less susceptibility to the “white coat syndrome” is unknown. However, other research on jury responses to DNA evidence in actual criminal cases revealed similar findings in that jurors with inaccurate or little DNA knowledge nonetheless relied on the scientific evidence to convict a defendant (Findlay 2006). These parallel outcomes tend to indicate that jury performance in a real case is similar to that observed in this simulation.
In this study, the influence of DNA knowledge on verdict was tested in the context of a single set of case facts. To determine whether the results generalize more broadly, replication in a variety of other case contexts is advised.
The content of the relatively brief DNA tutorial presented in this study emphasized the structure of DNA and DNA profiling procedures. Comparatively little time was expended on the concept of random match probability. Results indicated that comprehension and learning for this aspect of the expert evidence was lower than that for DNA profiling. Previous studies have also demonstrated that jurors perform poorly with regard to their understanding and use of the RMP (Wheate 2007). Additional research is needed to develop this aspect of the materials to further test the effectiveness of this approach to enhance jury abilities on that topic.
In this preliminary study of an intervention such as a prepared tutorial, the focus was in the performance of individual mock-jurors, to track their individual understanding and knowledge gains. Accordingly, the effect of deliberation on jury understanding was untested. Previous studies have shown that deliberation was inadequate to not cure the difficulties and erroneous assumptions by less knowledgeable jurors (Hans 2007). Mock jury studies in which jurors were presented with scientific evidence (not on DNA evidence) and allowed to deliberate revealed that very little time was devoted to the a discussion of the quality of the scientific evidence (Kovera McAuliff & Hebert 1999).
43

Recommendations for future research
A number of recommendations for further research follow from these findings:
• Replication among citizens who report for jury service, or with a sample of actual jurors, is necessary to confirm the extent to which the current findings generalize to a jury sample.
• Further testing of expert tutorials on scientific evidence presented to jurors via videotape in a jury poolroom is advisable, to determine whether the same benefits of instruction outside the context of a criminal case can be achieved.
• Future research should investigate the relationship between the taxonomy of knowledge (e.g. SOLO) and the mode of instruction in more depth.
• Future studies should present cases in which the impact of the DNA evidence is exculpatory rather than inculpatory.
• Future studies are needed in which the use of multimedia tutorials to enhance jury understanding of the random match probability is more extensively tested.
• Future studies should examine the extent to which multimedia differentially influence jurors with different educational backgrounds and pre-existing knowledge.
• Future studies should examine the influence of multimedia tutorials in cases that involve more controverted expert evidence and those in which the magnitude of the probability of a random match is smaller.
• Future studies should explore the influence of court-appointed and partisan experts who present complex scientific evidence
• Future studies should further explore the relationship between learning style and the
presentation of expert evidence, with other measures of visual and verbal learning preferences in addition to the Index of Learning Styles.
44
References
Australian Bureau of Statistics 2009. Population by age and sex, Australian states and territories. ABS cat. no. 3201.0. Canberra: Author
Australian Law Reform Commission 2003. Essentially yours: The protection of human genetic information. Briefing note: Law enforcement (Vol 2, Part J). Sydney: Author
Australian Law Reform Commission, 1999. Experts (Review of the Adversarial System, Background Paper 6. Sydney: Author
Biggs JB 1992. A qualitative approach to grading students. HERDSA News 14: 3-6
Biggs JB & Collis KF 1982. Evaluating the quality of learning: The SOLO taxonomy. New York: Academic Press
Bornstein BH, 2004. The impact of different types of expert scientific testimony on mock jurors’ liability verdicts, Psychology, Crime & Law 10: 429-446
Brewer N, Harvey S & Semmler C. 2004. Improving comprehension of jury instructions with audio-visual presentation. Applied Cognitive Psychology 18: 765-776
Bright DA & Goodman-Delahunty J (2004). The influence of gruesome verbal evidence on mock juror verdicts, Psychiatry, Psychology, and Law11: 154-166
Briody M 2004. The effects of DNA evidence on homicide cases in court, The Australian and New Zealand Journal of Criminology 37: 231-252
Cassidy S 2004. Learning styles: an overview of theories, models and measures, Educational Psychology 24(4): 419–444
Chun D & Plass J 1997. Research on text comprehension in multimedia environments, Language Learning & Technology 1: 60-81
Cole SA & Dioso-Villa R 2009. Investigating the 'CSI Effect' Effect: Media and litigation crisis in criminal law. Stanford Law Review 61: 1335-1373
Cooper, J & Neuhaus IM 2000. The “hired gun” effect: Assessing the effect of pay, frequency of testifying, and credentials on the perceptions of expert testimony. Law and Human Behaviour, 24: 149-171
Curran JW, Walsh SJ & Buckleton JS 2008. Empirical support for the reliability of DNA evidence interpretation in Australia and New Zealand. Australian Journal of Forensic Sciences, 40: 99-108
Dann BM, Hans VP & Kaye DH 2007. Can jury trial innovations improve jury understanding of DNA evidence? Judicature 90: 152-156
Dartnall S & Goodman-Delahunty J 2006. Enhancing juror understanding of probabilistic DNA evidence. Australian Journal of Forensic Sciences 38(2): 85-96
Douglas KS, Lyon DR & Ogloff JRP 1997. The impact of graphic photographic evidence on mock jurors’ decisions in a homicide trial: Probative or prejudicial? Law and Human Behavior 21: 485-501
Edmond G & Mercer D 1999. Creating (public) science in the Noah's Ark case, Public Understanding of Science 8(4): 317–343
45
Easteal PW & Easteal S 1990. The forensic use of DNA profiling. Trends and Issues in Crime and Criminal Justice 26: 1-8
Feigenson N 2006. Too real? The future of virtual reality evidence. Law & Policy, 28(2):271-293
Feigenson N 2007. Effects of Powerpoint on juror decision making. Paper presented at the Annual Meeting of The Law and Society Association, Berlin, Germany
Felder RM & Soloman BA 2001. Index of Learning Styles Questionnaire. [accessed 30 June 2009] http://www.engr.ncsu.edu/learningstyles/ilsweb.html
Felder RM & Spurlin J 2005. Applications, reliability and validity of the Index of Learning Styles. International Journal of Engineering Education 21: 103-112
Findlay M 2008. Juror comprehension and the hard case: Making forensic evidence simpler. International Journal of Law, Crime and Justice 36: 15-53
Findlay M 2003. Independent review of the Crimes (Forensic Procedures) Act 2000, Sydney: Criminal Law Review Division. [accessed 30 June 2009] http://www.lawlink.nsw.gov.au/lawlink/clrd/llclrd.nsf/pages/CLRD forensics_report
Findlay M & Grix J 2003. Challenging forensic evidence? Observations on the use of DNA in certain criminal trials. Current Issues in Criminal Justice 14: 283-298
Freckelton I, Reddy P & Selby H 1999. Australian judiciary on expert evidence: An empirical study. Melbourne: Australian Institute of Judicial Administration
Freckelton I & Selby H 2005. Expert evidence: Law practice procedure & advocacy (3rd Ed). Lawbook Co: Pyrmont, NSW
Fox J, Park B & Lang A 2007. When available resources become negative resources: the effects of cognitive overload on memory sensitivity and criterion bias. Communication Research 34: 277–296
Gans J & Urbas G 2002. DNA identification in the criminal justice system. Trends and Issues in Crime and Criminal Justice 226: 1-6
Goodman-Delahunty J & Newell BR 2004. One in how many trillion? Australasian Science 25: 14-17
Goodman-Delahunty J & Tait D 2006. DNA and the changing face of justice. Australian Journal of Forensic Sciences, 38:97-106.
Graf S, Viola S, Leo T & Kinshuk 2007. In-depth analysis of the Felder-Silverman learning style dimensions. Journal of Research on Technology in Education 40(1): 79-93
Haesler A 2006. Dealing with DNA in court: its use and misuse. Judicial Review 8(1): 121-144.
Hans V 2007. Judges, juries, and scientific evidence. Journal of Law and Policy 16: 19-46
Hewson L & Goodman-Delahunty J 2008. Using multimedia to support jury understanding of DNA profiling evidence. Australian Journal of Forensic Sciences 40(1): 55-64
Hoffrage U, Lindsey S, Hertwig R & Gigerenzer G 2000. Communicating statistical information, Science 290: 2261-2262
Holmgren JA 2005. DNA evidence and jury comprehension. The Canadian Society of Forensic Science Journal, 38(3): 123-142
46

Jackson J 1992. Juror decision-making and the trial process. In G Davis & S Lloyd-Bostock (eds.), Psychology law, and criminal justice: International developments in research and practice. De Gruyter, Oxford, UK: 327-336
Kassin SM & Dunn MA 1997. Computer-animated displays and the jury: Facilitative and prejudicial effects. Law and Human Behavior 21: 269-281
Koehler JJ 1995. Discussion: Inference in forensic identification. Journal of the Royal Statistical Society, Series A 158: 47
Koehler JJ 1997. One in millions, billions and trillions: Lessons from People v. Collins (1968) for People v. Simpson (1995). Journal of Legal Education 47: 214-223
Kovera MB, McAuliff BD & Hebert KS 1999. Reasoning about scientific evidence: Effects of juror gender and evidence quality on juror decisions in a hostile work environment case. Journal of Applied Psychology, 84: 362-375
Law Reform Commission of Western Australia, 1998. Expert evidence in Civil Proceedings (Review of the Civil and Criminal Justice System, Project 92. Perth, WA: Author
Lieberman J, Carrell C, Miethe T & Krauss D 2008. Gold vs. platinum: Do jurors recognize the superiority and limitations of DNA evidence compared to other types of forensic evidence? Psychology, Public Policy, & Law 14: 27-62
Lindsey S, Hertwig R & Gigerenzer G 2003. Communicating statistical DNA evidence, Jurimetrics 43: 147-163
Litzinger TA, Lee SH, Wise JC & Felder RM 2005. A study of the reliability and validity of the Felder-Soloman Index of Learning Styles. Paper presented at the American Society for Engineering Education Annual Conference, Portland, Oregon
Livesay G, Dee K, Felder R, Hites L, Nauman E & O'Neal E 2002. Statistical evaluation of the Index of Learning Styles. Paper presented at ASEE Annual Conference and Exposition, Montreal, Canada
Lord Arbinger v Ashton (1873) 17 LR Eq 358, 374
Magnusson E & Selinger B 1990. Jury comprehension of complex scientific evidence: The Inference Chart concept. Criminal Law Journal 14(6): 389-400
Mann M 2006. The “CSI Effect”: Better jurors through television and science? Buffalo Public Interest Law Journal 24: 211-238
Mayer RE 2001. Multimedia learning. New York: Cambridge University Press
Miller GA 1956. The magical number seven, plus or minus two: Some limits on our capacity for processing information. Psychology Review 63: 81-97
Myers RD, Reinstein RS & Griller GM 1999. Complex scientific evidence and the jury. Judicature, 83: 150-156
Nance DA & Morris SB 2005. Jury understanding of DNA evidence: An empirical assessment of presentation formats for trace evidence with relatively small probability. The Journal of Legal Studies, 34: 395-444.
National Research Council 1992. DNA technology in forensic science. Washington, DC: National Academy Press
47

National Research Council 1996. The evaluation of forensic DNA evidence. Washington, DC: National Academy Press
New South Wales Law Reform Commission, 2005. Expert witnesses, Report 109. Sydney, NSW: Author
New York Post 2008. “CSI” earth's no. 1 show. [accessed June 17 2008] http://www.nypost.com/seven/06172008/tv/csiearthsno1show115835.htm
Ogloff JRP & Rose VG 2005. The comprehension of judicial instructions in N Brewer & K Williams (eds), Psychology and law: An empirical perspective. New York: Guilford: 407-444
Podlas K 2006. “The CSI Effect”: Exposing the media myth. Fordham Intellectual Property Media and Entertainment Law Journal 16: 429-465
R v Duke (1979) 22 SASR 46
R v Pantoja (1996). 88A Crim R 554 at 560 per Hunt CJ at CL and Hidden J
Rieber LP 2000. Computers, graphics and learning, 2nd edition. Retrieved 10th September 2001 from http://www.nowhereroad.com/cgl/index.html
Rose VG, Chopra SR & Ogloff JRP 2001: Evaluating the comprehensibility of jury instructions: A method and an example. Law and Human Behavior, 25: 409-431
Stephens SL 2007. The CSI effect on real crime labs. New England Law Review 41: 591-608
Schweitzer NJ & Saks MJ 2007. The CSI effect: Popular fiction about forensic science affects the public’s expectations about real forensic science. Jurimetrics 47: 357-364
Shelton D, Kim Y & Barak G 2007. A study of juror expectations and demands concerning scientific evidence: Does the “CSI effect” exist? Vanderbilt Journal of Entertainment & Technology Law 9(2): 331-368
Sweller J & Chandler P 1994. Why some material is hard to learn. Cognition & Instruction 12: 185-233
Thompson WC, Ford S, Doom T, Raymer M & Krane D 2003. Evaluating forensic DNA evidence: Elements of a competent defense review. The Champion 27: 16–25
Thompson WC & ColeSA 2007. Psychological aspects of forensic identification evidence, in M Costanzo, D Krauss & K Pezdek (eds), Expert psychological testimony for the courts. Mahwah, NJ: Lawrence Erlbaum Associates: 31-68
Thompson WC & Schumann EL 1987. Interpretation of statistical evidence in criminal trials: The prosecutors' fallacy and the defense attorney's fallacy. Law & Human Behavior 11: 167-187
Tuckman BW 1999. A tripartite model of motivation for achievement: Attitude/Drive/Strategy. Paper to the Symposium on Motivational Factors Affecting Student Achievement-Current Perspectives, Annual Meeting of the American Psychological Association, Boston, MA
Tyler T 2006. Viewing CSI and the threshold of guilt: Managing truth and justice in reality and fiction. Yale Law Journal 115: 1050-1085
van Zwanenberg N, Wilkinson LJ & Anderson A 2000. Felder and Soloman's Index of Learning Styles and Honey and Mumford's Learning Styles Questionnaire: How do they compare and do they predict academic performance? Educational Psychology 20(3): 365-380
48
Vidmar N 2005. Expert evidence, the adversary system, and the jury. American Journal of Public Health 95: S137–S143
Walsh SJ, Ribaux O, Buckleton, JS, Alastrair R & Roux C 2004. DNA profiling and criminal justice: A contribution to a changing debate. Australian Journal of Forensic Sciences 36: 34-43
Wheate R 2006. Australian juries and scientific evidence. Australian Journal of Forensic Sciences 38: 75-84
Wheate R 2007. Jury comprehension of scientific evidence. Canberra (ACT):University of New South Wales, ADFA [accessed June 30 2009] http://www.library.unsw.edu.au/~thesis/adt-DFA/public/adt-ADFA20070801.133638/index.html
Wheate R 2008. Australian forensic scientists: A view from the witness box. Australian Journal of Forensic Sciences, 40: 123-146
Wilson, J 2007, Aug. DNA technology transforming police work. Paper to the UNSW Crime and Justice Research Network Seminar, University of New South Wales School of Law, Sydney, Australia
Wood J 2003. Forensic sciences from the judicial perspective: The expert witness in the age of technology, Australian Journal of Forensic Sciences 35: 115-132
Young W 1999. Juries in criminal trials. Wellington: New Zealand Law Commission
Young W 2000. Possible changes to jury trial practice. Paper presented at the Australian Institute of Judicial Administration Criminal Trial Reform Conference, Melbourne, Victoria. [accessed 30 June 2009] http://www.aija.org.au/ctr/YOUNG.RTF
Zywno MS 2003. A contribution to validation of score meaning for Felder-Soloman’s Index of Learning Styles. Proceedings of the 2003 American Society for Engineering Annual Conference and Exposition. [accessed June 26 2009] http://www4.ncsu.edu/unity/lockers/users/f/felder/public/ILSdir/Zywno_Validation_Study.pdf
49
Appendix 1: Trial transcript
Crown v Young
JUDGE: Ronald Phillip Young, you are charged that on the 13th day of June 2005, at Mascot in the state of New South Wales, you attacked Allan Robert Grange, causing his death, and acting with reckless indifference to human life, or with the intent to kill or inflict grievous bodily harm, contrary to section 18 of the Crimes Act.
Ronald Phillip Young, how do you plead?
ACCUSED: Not guilty, your Honour.
JUDGE: Members of the jury, Ronald Young has been charged with murder. The prosecution will begin the trial by outlining their case against Mr Young and summarising the evidence of their witnesses. The defence will also outline their case in an opening statement.
The standard of proof in a criminal trial is "beyond reasonable doubt". Therefore, it is the Crown who carries the burden of proof and the responsibility for proving the charge against the accused. If, by the end of the evidence, you decide that the Crown has not discharged this burden, you must find the accused not guilty. If you are convinced that the Crown has discharged this burden, you must find the accused guilty as charged.
In this trial you may not ask questions and the evidence cannot be replayed for you. You may take notes during the trial, however, you are not required to do so and your notes must not take the place of the evidence. The evidence is what you hear from the witnesses, not necessarily what you have recorded in your notes. Please do not make any decisions until you have heard all of the evidence in this case. At the end of the trial you will be asked to deliberate. You must draw conclusions that are based on the facts alone.
We will now hear an opening statement from the Crown.
PROSECUTOR: The Crown alleges that on the 13th of June 2005, between the hours of 9pm and midnight, Ron Young entered the home of Mr Allan Grange, with intent to recklessly or deliberately inflict grievous bodily harm, or to kill him.
Al Grange used to have a relationship with Melinda Young, who is now married to the accused. Mr Grange and Melinda Young lived together and had a sexual relationship. After Melinda Young moved away from Mascot, down to Canberra, she became engaged to the accused and then married him. Mr Grange remained in Sydney and carried on his life as a successful businessman.
We allege that Melinda Young had told the accused that Mr Grange was a violent man, a heavy drinker, that even after Melinda Young and the accused were married, Mr Grange had threatened her and constantly made threatening and abusive phone calls to her as he tried to convince her to come back to Sydney. We allege that the accused was determined to “teach Al Grange a lesson”.
We say that on the 13th of June, the accused and Melinda Young arrived at Mr Grange’s home in Mascot. Melinda Young announced herself on the security intercom, causing Al Grange to open the security door to her. At this point, Melissa Young also let the accused into Mr Grange’s block of units. Melissa Young went to Al Grange’s unit, opened the unlocked front door and let herself in. After several moments of arguing, Melissa Young ran out the front door of the unit and the accused went in. It is alleged that the accused then maliciously attacked Mr Grange with a knife and an air rifle, while Melissa Young waited outside by her car. On the morning of the 14th of June, Mr Grange’s housekeeper arrived to find him dead on the kitchen floor. There were found to be 36 stab wounds
50

of varying severity on the body, and two severe slash wounds to the throat. A small air rifle pellet was also found under the skin at the back of Mr Grange’s head.
Mr Allan Grange was murdered, and Ronald Young, the accused, had the opportunity and motive to commit this crime.
JUDGE: We will now hear an opening statement from the defence.
DEFENCE: Good evening. As you have just heard, the Crown has charged Ron Young with murder. It is true that Ron Young’s wife, Melinda, used to know Al Grange and she did have a brief relationship with him. She lived with him and some of her possessions were still at Mr Grange’s flat at Mascot, even after Melinda married Ronald Young. It is true that Mr Grange was not happy about Melinda moving out and marrying Ron Young; Al Grange constantly called Melinda on her home phone and mobile, asking her to leave her husband and return to Sydney. This does not, however, make Ronald Young a murderer.
In fact, on the night in question, Ron Young did not even go to Mr Grange’s home. Melinda Young did. She knew that Al Grange always went out to the local club on Monday nights, and so on the 13th
June she drove to Sydney, let herself into his flat and took the remainder of her possessions. The round trip from Canberra to Sydney takes about 6 hours, so naturally Melinda Young drove up to Sydney with her husband Ronald Young, to help share the driving. At no time, however, did my client, Ronald Young, go into Mr Grange’s home. He waited in the car and simply drove his wife home to Canberra after she had collected her things.
JUDGE: Although you will not hear from some witnesses directly, here is a summary of some of the evidence in this case:
Prosecution Witness #1: Professor Scott Cordon, forensic pathologist, testified that “there were 36 stab wounds of varying severity on the body of the victim, and two severe slash wounds to the throat. A small air rifle pellet was also found under the skin at the back of Mr Grange’s head. The time of death is estimated at somewhere between 5pm on Monday 13th of June and 6am on Tuesday 14th of June 2005.”
Control condition:
It should be noted by the jury that although DNA evidence was collected and processed in this case, the results were inconclusive.
Prosecution Witness #2: Joseph Smithers, Allan Grange’s Business Partner testified that “Allan Grange was a heavy drinker who tended to be violent when he was drunk. He was, however, also hospitable, courteous and easy-going in his day to day life. When they separated, Al Grange had accused Melinda Young of stealing money from him and using it to move to Canberra.” Under cross-examination Mr Smithers admitted that Mr Grange had many enemies.
Prosecution Witness #3: John Watkins, NSW Roads & Traffic Authority Technician testified that “NSW Roads and Traffic Authority Safetycams on the Hume Highway filmed Melinda Young’s car traveling towards Sydney at 8:45 pm on Monday June 13th and south towards Canberra 4 ••• hours later.”
Prosecution Witness #4: Solomon True, Telstra Technician, testified that “Allan Grange’s telephone records show that he made 27 calls to Melinda Young’s mobile telephone number in the 2 weeks preceding his death, and two calls to the home of her father, in June 2005.”
51
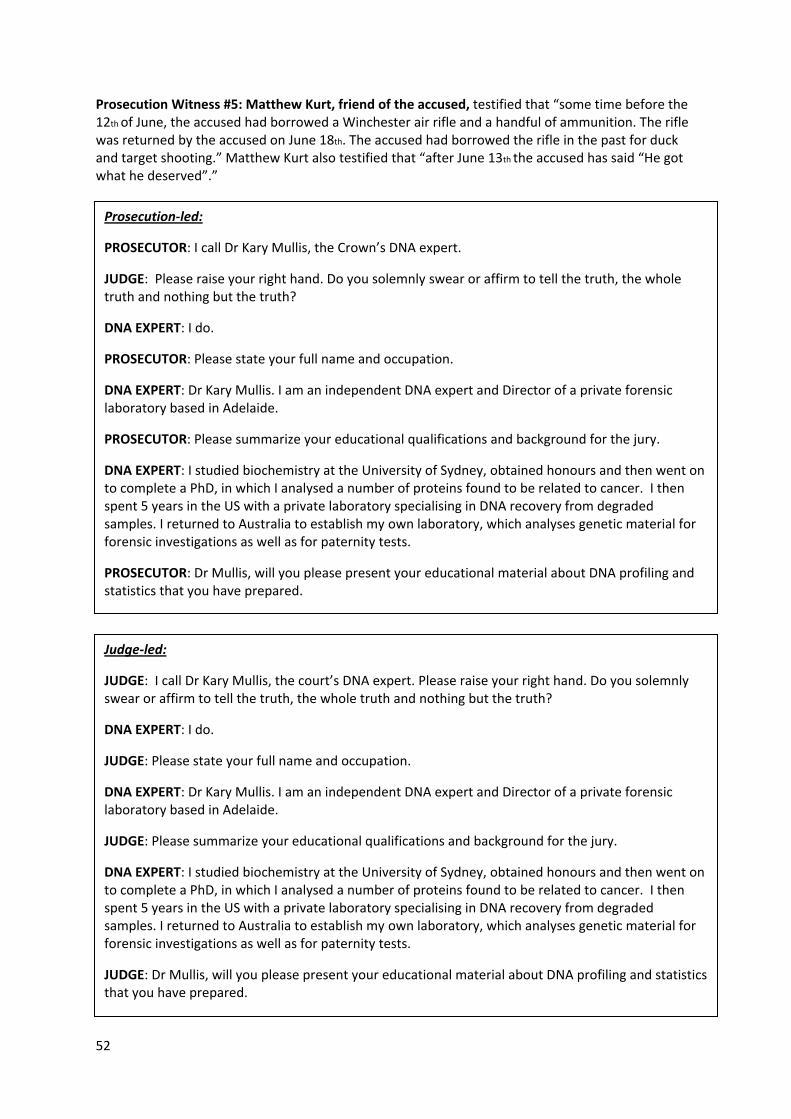
Prosecution Witness #5: Matthew Kurt, friend of the accused, testified that “some time before the 12th of June, the accused had borrowed a Winchester air rifle and a handful of ammunition. The rifle was returned by the accused on June 18th. The accused had borrowed the rifle in the past for duck and target shooting.” Matthew Kurt also testified that “after June 13th the accused has said “He got what he deserved”.”
PROSECUTOR: Please state your full name and occupation.
DNA EXPERT: Dr Kary Mullis. I am an independent DNA expert and Director of a private forensic laboratory based in Adelaide.
PROSECUTOR: Please summarize your educational qualifications and background for the jury.
DNA EXPERT: I studied biochemistry at the University of Sydney, obtained honours and then went on to complete a PhD, in which I analysed a number of proteins found to be related to cancer. I then spent 5 years in the US with a private laboratory specialising in DNA recovery from degraded samples. I returned to Australia to establish my own laboratory, which analyses genetic material for forensic investigations as well as for paternity tests.
PROSECUTOR: Dr Mullis, will you please present your educational material about DNA profiling and statistics that you have prepared.
Judge-led:
JUDGE: I call Dr Kary Mullis, the court’s DNA expert. Please raise your right hand. Do you solemnly swear or affirm to tell the truth, the whole truth and nothing but the truth?
DNA EXPERT: I do.
JUDGE: Please state your full name and occupation.
DNA EXPERT: Dr Kary Mullis. I am an independent DNA expert and Director of a private forensic laboratory based in Adelaide.
JUDGE: Please summarize your educational qualifications and background for the jury.
DNA EXPERT: I studied biochemistry at the University of Sydney, obtained honours and then went on to complete a PhD, in which I analysed a number of proteins found to be related to cancer. I then spent 5 years in the US with a private laboratory specialising in DNA recovery from degraded samples. I returned to Australia to establish my own laboratory, which analyses genetic material for forensic investigations as well as for paternity tests.
JUDGE: Dr Mullis, will you please present your educational material about DNA profiling and statistics that you have prepared.
PROSECUTOR: I call Dr Kary Mullis, the Crown’s DNA expert.
JUDGE: Please raise your right hand. Do you solemnly swear or affirm to tell the truth, the whole truth and nothing but the truth?
DNA EXPERT: I do.
Prosecution-led:
52

MEDIA
DNA PROFILING TUTORIAL
DNA Explained
The purpose of this video is to provide you with some background information about human DNA and how it can be used as evidence in legal proceedings. Firstly, you will be told about how DNA is structured and then how scientists can use samples of DNA as evidence in a case. You will also be introduced to some of the language used by scientists when discussing DNA evidence in court
DNA technology offers a useful tool for identifying people when biological evidence is left at the scene of a crime. This evidence might be in the form of saliva, blood, tissue, hair or semen.
After DNA evidence is presented in court, there may be some disagreement about its meaning. DNA evidence should be taken as only one part of all the evidence presented.
The average human body is made up of trillions of cells. All human cells - except for red blood cells - contain genetic material known as deoxyribonucleic acid - what we call DNA. DNA carries the genetic code for how our body looks and how it functions.
If we travel down into human tissue anywhere on the body - we find cells – and within the nucleus of each cell there are chromosomes. These chromosomes are small packages of DNA that contain specific genes. The genes, in turn, occur along a very long strand of DNA, made up of over 3 billion pieces of code called nucleotides or bases.
These bases are like letters that make up words and these words make up sentences – which are the specific genes along the strand of DNA. So, genes occur at specific locations on the DNA strand, which translate into specific physical features such as blue eyes or brown hair.
Individuals inherit DNA from both their parents - 23 chromosomes inherited from the mother, and 23 chromosomes from the father. Body materials such as blood, semen, muscle, bone marrow, hairs and skin cells from any one person will all contain the same DNA. Therefore, DNA is like a genetic code. It is often called a “genetic fingerprint” and may be left at a crime scene, even if it cannot be seen.
Scientists have been able to map most of this genetic code to find out where specific genes are located. The area of DNA mostly used for forensic analysis is the non-coding or non-gene parts of our DNA. These areas of the DNA strand vary from person to person; so forensic biologists target these areas to distinguish between different people.
There are actually two types of DNA – nuclear and mitochondrial. Only a single copy of nuclear DNA is found inside the nucleus of each cell however, multiple copies of mitochondrial DNA are found in the outer covering or cytoplasm of each cell. Importantly, while nuclear DNA comes from both parents, mitochondrial DNA is only inherited from the mother.
Both nuclear DNA and mitochondrial DNA (mtDNA) can be used for forensic DNA testing but nuclear DNA is better for identifying people. In badly degraded or old biological samples where the nuclear DNA has been destroyed, it is still possible to find sufficient mitochondrial DNA for a limited DNA profile analysis.
53
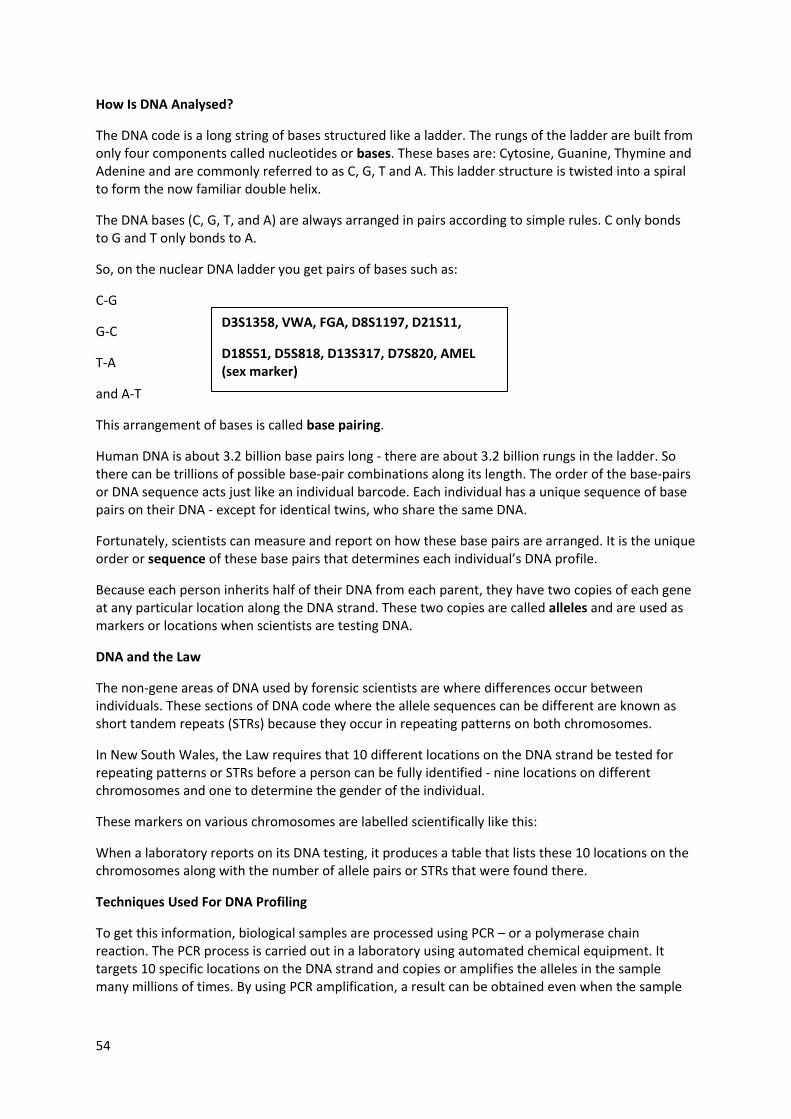
How Is DNA Analysed?
The DNA code is a long string of bases structured like a ladder. The rungs of the ladder are built from only four components called nucleotides or bases. These bases are: Cytosine, Guanine, Thymine and Adenine and are commonly referred to as C, G, T and A. This ladder structure is twisted into a spiral to form the now familiar double helix.
The DNA bases (C, G, T, and A) are always arranged in pairs according to simple rules. C only bonds to G and T only bonds to A.
So, on the nuclear DNA ladder you get pairs of bases such as:
C-G
D3S1358, VWA, FGA, D8S1197, D21S11,
D18S51, D5S818, D13S317, D7S820, AMEL (sex marker)
G-C
T-A
and A-T
This arrangement of bases is called base pairing.
Human DNA is about 3.2 billion base pairs long - there are about 3.2 billion rungs in the ladder. So there can be trillions of possible base-pair combinations along its length. The order of the base-pairs or DNA sequence acts just like an individual barcode. Each individual has a unique sequence of base pairs on their DNA - except for identical twins, who share the same DNA.
Fortunately, scientists can measure and report on how these base pairs are arranged. It is the unique order or sequence of these base pairs that determines each individual’s DNA profile.
Because each person inherits half of their DNA from each parent, they have two copies of each gene at any particular location along the DNA strand. These two copies are called alleles and are used as markers or locations when scientists are testing DNA.
DNA and the Law
The non-gene areas of DNA used by forensic scientists are where differences occur between individuals. These sections of DNA code where the allele sequences can be different are known as short tandem repeats (STRs) because they occur in repeating patterns on both chromosomes.
In New South Wales, the Law requires that 10 different locations on the DNA strand be tested for repeating patterns or STRs before a person can be fully identified - nine locations on different chromosomes and one to determine the gender of the individual.
These markers on various chromosomes are labelled scientifically like this:
When a laboratory reports on its DNA testing, it produces a table that lists these 10 locations on the chromosomes along with the number of allele pairs or STRs that were found there.
Techniques Used For DNA Profiling
To get this information, biological samples are processed using PCR – or a polymerase chain reaction. The PCR process is carried out in a laboratory using automated chemical equipment. It targets 10 specific locations on the DNA strand and copies or amplifies the alleles in the sample many millions of times. By using PCR amplification, a result can be obtained even when the sample
54

material is very small or degraded. The forensic use of PCR for DNA analysis is well known and accepted as a reliable technique worldwide.
When a biological sample is tested in PCR, the 4 genetic bases from the DNA strand (C, G, T, and A) are graphed in different colours, and appear as peaks or spikes in the graph.
These graphs are called electropherograms and show which alleles are present and in what quantities. The 10 different locations being tested appear across the horizontal axis and the height of each peak indicates the number of Short-tandem Repeats detected in the sample.
The number of repeats found at each location is then recorded as a pair of numbers for that location. For example, 11,14 at D21S11. A match is determined if two samples have the same number of alleles repeated at each of the 10 known genetic locations.
Processing of DNA samples
DNA evidence from a crime scene or from a person is handled very carefully during testing and follows 4 main phases:
Extraction Quantitation Amplification Separation
DNA extraction is the process of separating DNA from other cellular material contained in the biological evidence recovered. This requires careful handling of biological material to prevent sample contamination.
DNA Quantitation determines the quantity of DNA obtained. Too much DNA can hinder determining the number of people involved or cover up other DNA profiles. Too little DNA may only provide a partial profile.
Amplification uses the polymerase chain reaction (PCR) process to create copies of alleles from specific DNA locations in the original sample.
DNA Separation occurs so that alleles can be individually identified and graphed. Computer software uses the allele count to create an electropherogram.
Problems with DNA Testing
Two main problems can arise during DNA processing that may influence the accuracy of the testing.
Cross contamination, and Laboratory error
Cross contamination can occur if biological samples are not handled correctly and accounted for throughout their processing. DNA from other individuals, police or laboratory staff can contaminate the samples and produce incorrect allele counts.
Laboratories can also make errors in the way that they maintain their equipment, process the samples or calculate the results. Often, a laboratory error rate (or LE) is included with the profiling results to indicate the accuracy of the processing.
To minimize these threats to the DNA evidence, forensic investigators and scientists maintain an accurate record of the chain of custody of any evidence and laboratories undergo regular and rigorous quality assurance procedures to reduce the chance of error.
55

RANDOM MATCH PROBABILITY TUTORIAL
In any given criminal case, if two samples that have been processed in a laboratory differ in their DNA profile, then they are considered to be from different individuals. This is called an EXCLUSION or NON-MATCH.
However, if the samples match, there are two possible explanations:
• The samples are from the same individual, or
• The samples come from different individuals but they match by chance.
Where a match is found between two samples, an estimate can be made of the likelihood of a chance match. This is called a Random Match Probability or RMP and is included on the laboratory report along with the method used to calculate it.
The term "probability" refers to the chance of a particular event occurring.
For example, over many repetitions, the probability of getting a head when a coin is tossed would be one out of two, or one-half.
Again, the chance over many repetitions of picking the ace of spades from a full pack of cards, would be 1/52. These are familiar odds that we can all imagine.
However, much larger numbers and smaller probabilities are much more difficult to imagine. For instance the chance of picking 6 numbers out of 45 (as in Lotto) is 1 in 8.145 million.
= 8,145,060
We are choosing 6 numbers out of 45..
= 45 x 44 x 43 x 42 x 41 x 40 / ( 6 x 5 x 4 x 3 x 2 x 1 )
To help you picture this probability, this is the equivalent of giving every man, woman and child in Sydney, Melbourne and Brisbane one free lotto ticket, ….. but only one person would be expected to win. We know this probability because we know how many people there are at each location.
In calculating the RMP in a forensic lab report, scientists use allele frequency tables. These tables list how often particular pairs of alleles occur at the 10 known locations on the DNA strand in certain groups of people. Allele frequency tables are available for most known ethnic and racial groups.
For example, in the Caucasian population, a (14,17) allele pair occurs at location D3 about 11% of the time … This has a probability of about 1/9.
However, as NSW law requires 10 locations for a complete DNA profile, the chance of the allele pairs occurring at each of the 10 locations must be considered to get the probability of a “match”.
To do this, the forensic analyst multiplies the probabilities from the allele tables together from each of the 10 locations.
56

So, in this example, there is about a 1 in 9 chance of matching the first location … there is about a 1 in 13 chance of matching at the second and so forth … the chance of matching at all 10 locations is calculated by multiplying of all these probabilities together.
ding …ding… ding … ding … ding …
Product Rule This is often referred to as ‘the product rule’
The product rule is used to estimate the chance of finding a specific DNA profile within a known population.
On a forensic laboratory report, the number of allele repeats found at each of the specified marker locations on the DNA sequence are shown in a table.
In addition, the report shows the calculation that led to the RMP.
“The donor of the blood sample in the bag labelled ‘PERSON A’ could not be excluded as the source of the biological material in the blood found at the crime scene. This DNA match is 1 in 1 million (1,000,000) times more likely to have arisen if the scene sample came from ‘PERSON A’ than if it came from a random member of the Caucasian population.”
So this forensic report is saying that the chance of the crime scene sample coming from someone other than ‘PERSON A’ is 1 in 1,000,000. This does not mean that PERSON A is the only possible source of the DNA … it means, out of a random sample of 1,000,000 people, PERSON A is most likely to be the source.
Once a person’s 10-location DNA profile is calculated, it is statistically improbable that anybody else in the world will have the same profile, unless that person has an identical twin. Identical twins – that is, twins derived from a single fertilised egg - have identical DNA profiles.
Judge-led:
JUDGE: The parties may now examine the witness. The Crown may proceed.
PROSECUTOR: Dr Mullis, can you tell me what DNA profiling revealed in this case?
DNA EXPERT: In this case, I analysed a saliva sample from the accused and prepared a DNA profile from it. Mr Young’s DNA profile was then compared to the DNA profile found at the crime scene on the hands of the victim. The DNA profile from Mr Young matched the DNA profile recovered from the hands of the victim, and therefore, I cannot rule out Mr Young as a possible source of the recovered crime scene sample.
PROSECUTOR: Can you positively identify the accused, Ronald Young, as the source of the DNA recovered from the hands of the victim?
DNA EXPERT: No. DNA analysis is not capable of positively identifying anyone as the source of genetic material. There is always a possibility that two different individuals have matching profiles by coincidence. The probability that a randomly selected individual will match a particular DNA profile is known as the Random Match Probability or RMP.
PROSECUTOR: Please state for the jury, the random match probability in this case?
57
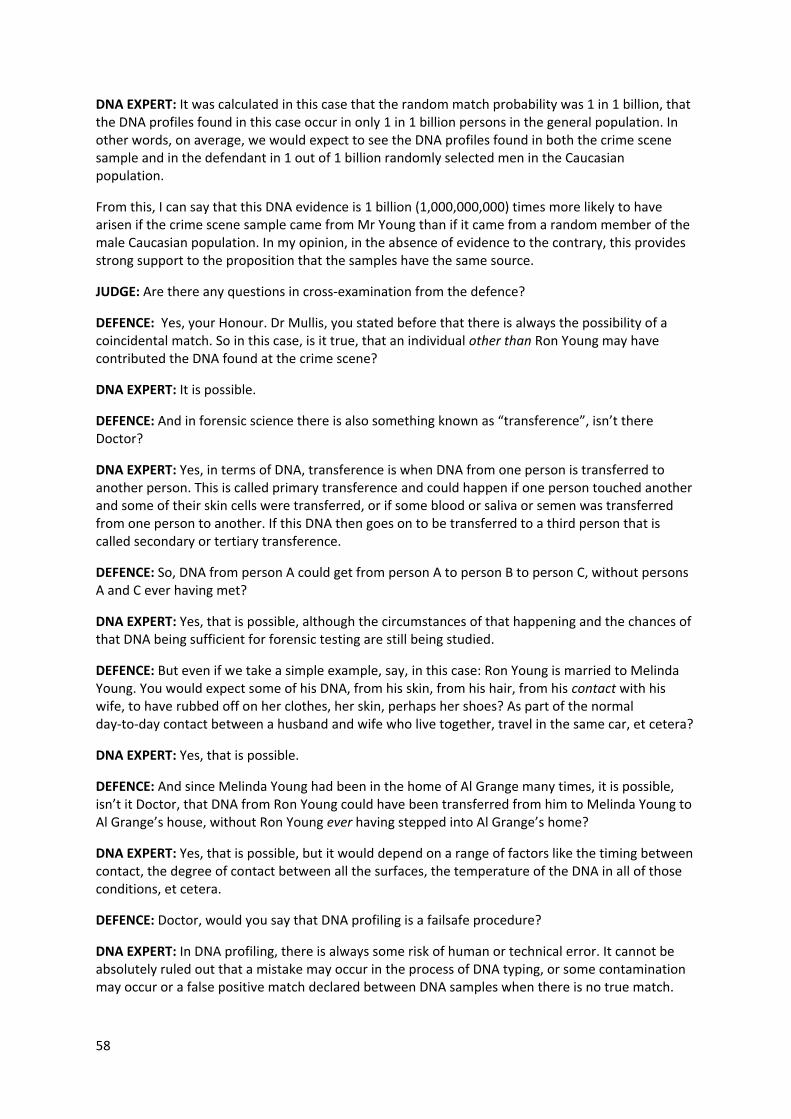
DNA EXPERT: It was calculated in this case that the random match probability was 1 in 1 billion, that the DNA profiles found in this case occur in only 1 in 1 billion persons in the general population. In other words, on average, we would expect to see the DNA profiles found in both the crime scene sample and in the defendant in 1 out of 1 billion randomly selected men in the Caucasian population.
From this, I can say that this DNA evidence is 1 billion (1,000,000,000) times more likely to have arisen if the crime scene sample came from Mr Young than if it came from a random member of the male Caucasian population. In my opinion, in the absence of evidence to the contrary, this provides strong support to the proposition that the samples have the same source.
JUDGE: Are there any questions in cross-examination from the defence?
DEFENCE: Yes, your Honour. Dr Mullis, you stated before that there is always the possibility of a coincidental match. So in this case, is it true, that an individual other than Ron Young may have contributed the DNA found at the crime scene?
DNA EXPERT: It is possible.
DEFENCE: And in forensic science there is also something known as “transference”, isn’t there Doctor?
DNA EXPERT: Yes, in terms of DNA, transference is when DNA from one person is transferred to another person. This is called primary transference and could happen if one person touched another and some of their skin cells were transferred, or if some blood or saliva or semen was transferred from one person to another. If this DNA then goes on to be transferred to a third person that is called secondary or tertiary transference.
DEFENCE: So, DNA from person A could get from person A to person B to person C, without persons A and C ever having met?
DNA EXPERT: Yes, that is possible, although the circumstances of that happening and the chances of that DNA being sufficient for forensic testing are still being studied.
DEFENCE: But even if we take a simple example, say, in this case: Ron Young is married to Melinda Young. You would expect some of his DNA, from his skin, from his hair, from his contact with his wife, to have rubbed off on her clothes, her skin, perhaps her shoes? As part of the normal day-to-day contact between a husband and wife who live together, travel in the same car, et cetera?
DNA EXPERT: Yes, that is possible.
DEFENCE: And since Melinda Young had been in the home of Al Grange many times, it is possible, isn’t it Doctor, that DNA from Ron Young could have been transferred from him to Melinda Young to Al Grange’s house, without Ron Young ever having stepped into Al Grange’s home?
DNA EXPERT: Yes, that is possible, but it would depend on a range of factors like the timing between contact, the degree of contact between all the surfaces, the temperature of the DNA in all of those conditions, et cetera.
DEFENCE: Doctor, would you say that DNA profiling is a failsafe procedure?
DNA EXPERT: In DNA profiling, there is always some risk of human or technical error. It cannot be absolutely ruled out that a mistake may occur in the process of DNA typing, or some contamination may occur or a false positive match declared between DNA samples when there is no true match.
58

However, forensic laboratories are accredited and all of the scientists are trained to ensure that the chance of that happening is minimized.
DEFENCE: Yes, thank you Dr Mullis.
JUDGE: Although you will not hear from them tonight, other witnesses in the case gave the following evidence:
Defence Witness #1: Ronald Young, the accused, testified that he “went to Allan Grange’s apartment complex in Sydney on June 13th and remained in the carpark while his wife went upstairs into the unit.” Under cross-examination Mr Young “could not estimate the time that he arrived in the carpark or the time when he and Melinda Young left the premises. Nor could he recall what property, if any, his wife retrieved from Mr Grange’s apartment that night.”
Defence Witness #2: Melinda Young, wife of the accused, testified that she “had had a sexual relationship with the victim and had lived with him in his Mascot apartment for several months. She admitted having keys to the apartment at the time of the alleged murder.” Melinda testified that on the night of the 13thof June, she used these keys to let herself into Al Grange’s apartment. She stated that Al Grange was not at home at the time and that Ron Young did not enter the apartment with her. During cross-examination she “denied telling her husband or friends that Allan Grange had sexually and physically assaulted her during the course of their relationship and denied that Al Grange had accused her of stealing money from him when she moved to Canberra. She also denied that she and the accused had joked with a friend about “shooting [Al Grange] up with heroin and making it look like a suicide”.”
JUDGE: Members of the jury, you have now heard all the relevant and material facts in this case. Now it is my obligation to instruct you on the law, after which you will deliberate and arrive at a verdict. The defendant has been charged with one count of murder.
In this case, Dr Kary Mullis was called as an expert witness. The expert evidence is before you as part of all the evidence to assist you in understanding the DNA evidence presented. You should bear in mind that if, having given the matter careful consideration, you do not accept the evidence of the expert, you do not have to act upon it.
Bear in mind that in the Australian legal system a defendant is presumed innocent and that the burden is on the prosecution to convince you beyond a reasonable doubt that the defendant, Ronald Phillip Young, committed the crime. The onus is on the Crown to prove that the accused is guilty of murder, and that burden never leaves it. It never becomes the responsibility of the accused to prove that he is not guilty or, in this case, to prove that someone else committed the murder. Before you convict you must be satisfied beyond a reasonable doubt. If there is a reasonable doubt as to the accused's guilt, then the accused is entitled to the benefit of that doubt. That does not mean that you must be satisfied beyond any doubt whatever, if, indeed you can ever be satisfied of anything to that extent. The accused is not entitled to the benefit of any whimsical, fanciful, or far-fetched doubt which an agile mind might conjure up. Being satisfied beyond reasonable doubt means this - if you regard it as a reasonable possibility that someone else murdered Allan Grange, then the accused must be acquitted. If you consider this possibility so insubstantial and so remote that no reasonable person would take it into account for a moment, then you are satisfied beyond reasonable doubt and the accused must be found guilty.
You must now decide whether or not the defendant, Ronald Phillip Young, is guilty as charged.
59

Appendix 2: Stage One Screening Questionnaire
No. Question
1
Are you an Australian Citizen over the age of 18? Yes No
2 How old are you? 18-24 25-34 35-44 45-54 55-64 65+
3
What state do you live in NSW VIC QLD (Show others but screen out)
4 Please select your gender: Male Female
5 What is your postcode? _______________
6 Did you study any of the following subjects at senior high school? (select all that apply) Biology Physics Chemistry Mathematics I didn’t study any of these (exclusive)
7 Which language do you speak most fluently? English Other
8 What is your highest educational qualification? University degree TAFE diploma Trade certificate Year 12 high school Less than high school
9 What is your occupation? Professional Trades Admin/ Clerical Labourers & Related Self-Employed
60

Student Retired/ Pensioner Home Duties Unemployed Other
10 Do you have a Foxtel/Subscription TV at home? Yes No
11 How often do you watch the following programs/channels Choices – More than once a week, Every week, Most weeks, Not often, Never CSI CSI:New York CSI:Miami Law & Order Law & Order : Criminal Intent Law & Order : SVU Criminal Minds Bones NCIS Crime & Investigation Network
12 How interested are you in the following programs: CSI episodes? (7-point, Not at all, moderately, extremely) Law & Order episodes? (7-point, Not at all, moderately, extremely) Other crime/ law related programs? (7-point, Not at all, moderately, extremely)
13 In your opinion, how realistic are the following programs: CSI episodes? (7-point, Not at all, moderately, extremely) Law & Order episodes? (7-point, Not at all, moderately, extremely) Other crime/ law related programs? (7-point, Not at all, moderately, extremely)
14 How trustworthy do you find the following types of evidence? [1 (not at all trustworthy) and 7 (extremely trustworthy)] Eyewitness Expert Forensic scientist Psychologist CCTV (closed circuit TV), photograph Fingerprints DNA Post mortem report
15 Out of 10 criminal cases, in how many do you expect each of the following? Eyewitness Expert Forensic scientist Psychologist CCTV (closed circuit TV)
61

Fingerprints DNA Post-mortem report
The next are 20 multiple-choice questions that measure how much Australians know about DNA and DNA evidence. Please take your time to read the questions thoroughly and consider your answers.
It’s important to us that you provide honest answers. If you don’t know the answer, please check the ‘I don’t know’ option.
No. Question
1 A crime scene sample of DNA can contain traces of more than one individual.
True False I don’t know
2 Errors in DNA testing can occur as a result of
a. cross contamination if biological samples are not handled correctly and accounted for throughout their processing.
b. laboratories make errors in the way they maintain their equipment, process samples or calculate results.
c. both, cross contamination and errors made in laboratories.
d. errors in DNA testing do not occur.
e. I don’t know.
3 If I just tossed a coin four times and got four heads, the probability of getting a tail when the coin is tossed for the fifth time is:
a. ½
b. greater than 1/2 as tails is far more likely this time.
c. less than 1/2, as I'm obviously on a lucky run.
d. 1/5, as it is the 5th toss.
e. I don’t know.
4 When two DNA samples have the same genetic markers at the locations measured, this means that they definitely come from the same person.
True False I don’t know
5 "The donor of the blood sample labelled person A could not be excluded as the source of the biological material in the blood found at the crime scene. This DNA is 1 in 100,000 times more likely to have arisen if the scene sample came from person A than if it came from a random member of the Caucasian population."
This means
a. the chance of the crime scene sample coming from someone other than person A is 1/100,000.
b. person A is the only possible source of the DNA.
c. out of a random sample of 100,000 people, person A is most likely to be the source.
d. both, the chance of the crime scene sample coming from someone other than person A is 1/100,000 and out of a random sample of 100,000 people, person A is most likely to be the source.
e. I don’t know.
62
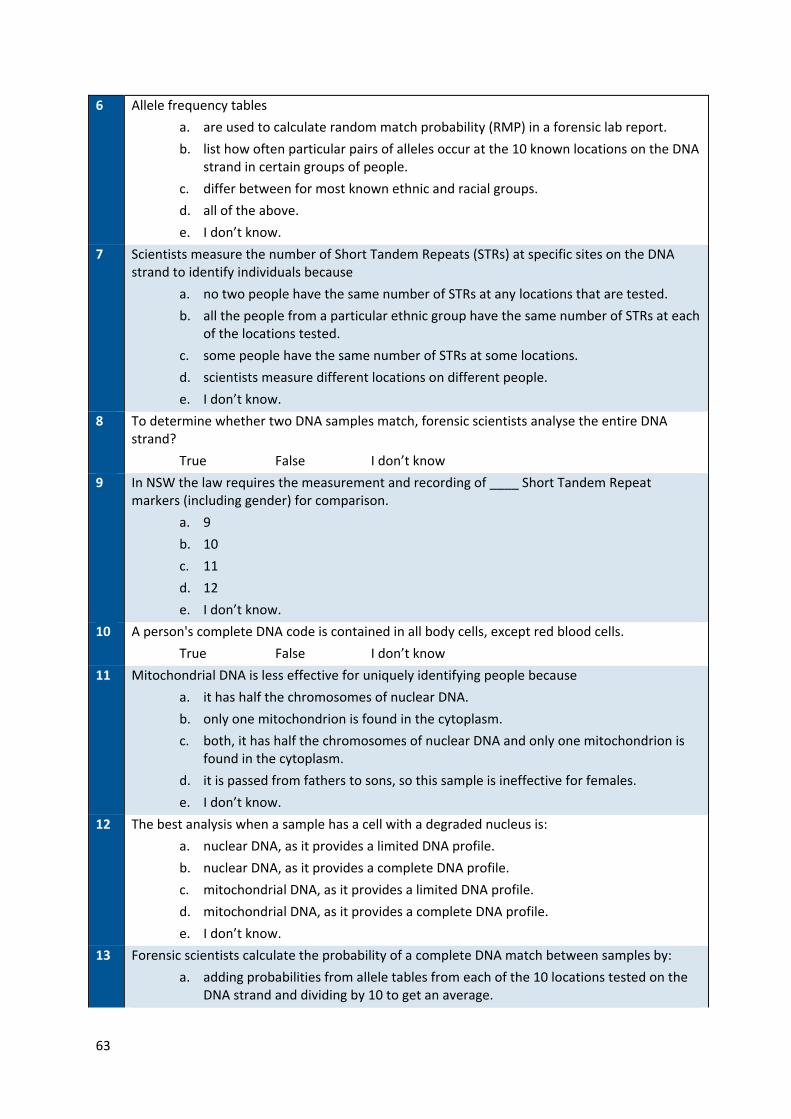
6 Allele frequency tables
a. are used to calculate random match probability (RMP) in a forensic lab report.
b. list how often particular pairs of alleles occur at the 10 known locations on the DNA strand in certain groups of people.
c. differ between for most known ethnic and racial groups.
d. all of the above.
e. I don’t know.
7 Scientists measure the number of Short Tandem Repeats (STRs) at specific sites on the DNA strand to identify individuals because
a. no two people have the same number of STRs at any locations that are tested.
b. all the people from a particular ethnic group have the same number of STRs at each of the locations tested.
c. some people have the same number of STRs at some locations.
d. scientists measure different locations on different people.
e. I don’t know.
8 To determine whether two DNA samples match, forensic scientists analyse the entire DNA strand?
True False I don’t know
9 In NSW the law requires the measurement and recording of ____ Short Tandem Repeat markers (including gender) for comparison.
a. 9
b. 10
c. 11
d. 12
e. I don’t know.
10 A person's complete DNA code is contained in all body cells, except red blood cells.
True False I don’t know
11 Mitochondrial DNA is less effective for uniquely identifying people because
a. it has half the chromosomes of nuclear DNA.
b. only one mitochondrion is found in the cytoplasm.
c. both, it has half the chromosomes of nuclear DNA and only one mitochondrion is found in the cytoplasm.
d. it is passed from fathers to sons, so this sample is ineffective for females.
e. I don’t know.
12 The best analysis when a sample has a cell with a degraded nucleus is:
a. nuclear DNA, as it provides a limited DNA profile.
b. nuclear DNA, as it provides a complete DNA profile.
c. mitochondrial DNA, as it provides a limited DNA profile.
d. mitochondrial DNA, as it provides a complete DNA profile.
e. I don’t know.
13 Forensic scientists calculate the probability of a complete DNA match between samples by:
a. adding probabilities from allele tables from each of the 10 locations tested on the DNA strand and dividing by 10 to get an average.
63

b. adding probabilities from allele tables from each of the 10 locations tested on the DNA strand and multiplying by 100.
c. multiplying probabilities from allele tables from each of the 10 locations tested on the DNA strand.
d. dividing probabilities from allele tables from each of the 10 locations tested on the DNA strand.
e. I don’t know.
14 Fragments of DNA are multiplied during the __________ stage of forensic testing.
a. STR amplification
b. DNA quantitation
c. DNA extraction
d. DNA separation
e. I don’t know.
15 The nucleus of a cell contains
a. cytoplasm
b. mitochondria and DNA
c. chromosomes
d. the three, mitochondria, DNA and chromosomes.
e. I don’t know.
16 DNA samples that come from different individuals may match by chance.
True False I don’t know
17 Judge the following assumption: An alleged suspect who has undergone a bone marrow transplant may leave behind the donor's DNA and not their own.
a. True. If some of the patient's original bone marrow is retained (vs. ALL of their bone marrow being destroyed), then their blood can contain a mixed DNA profile and they could just leave behind the donor's DNA.
b. False. It may be true that a bone marrow transplant can cause a mixed DNA profile but the DNA is mixed now, so the suspect would have to leave both DNA samples behind.
c. False, as red blood cells are not used in DNA testing.
d. False. They may leave behind just the donor's DNA in their blood but they would definitely leave behind other DNA that's not mixed if they were there, in the form of hair, skin cells and so on, and this would allow for correct identification of the perpetrator.
e. I don’t know.
18 Which parts of DNA are used for forensic analysis?
coding parts
non-gene or non-coding parts
both, coding and non-gene/ non-coding parts.
Any known genes
I don’t know.
19 Short Tandem Repeats (STR) are the sections of code where base pair sequences are most likely to differ between individuals.
True False I don’t know
64

20 Human characteristics, such as hair colour, are encoded in genes found on the DNA strand.
True False I don’t know
In the next section, choose only one option for each question. If both seem to apply to you, choose the one that applies more frequently.
No. Question
1 When I think about what I did yesterday, I am most likely to get
a picture. words.
2 I prefer to get new information in
pictures, diagrams, graphs, or maps. written directions or verbal information.
3 In a book with lots of pictures and charts, I am likely to
look over the pictures and charts carefully. focus on the written text.
4 I like teachers
who put a lot of diagrams on the board. who spend a lot of time explaining.
5 I remember best
what I see. what I hear.
6 When I get directions to a new place, I prefer
a map. written instructions.
7 When I see a diagram or sketch in class, I am most likely to remember
the picture. what the instructor said about it.
8 When someone is showing me data, I prefer
charts or graphs. text summarizing the results.
9 When I meet people at a party, I am more likely to remember what they looked like. what they said about themselves.
10 For entertainment, I would rather
watch television. read a book.
11 I tend to place picture places I have been
easily and fairly accurately. with difficulty and without much detail.
65
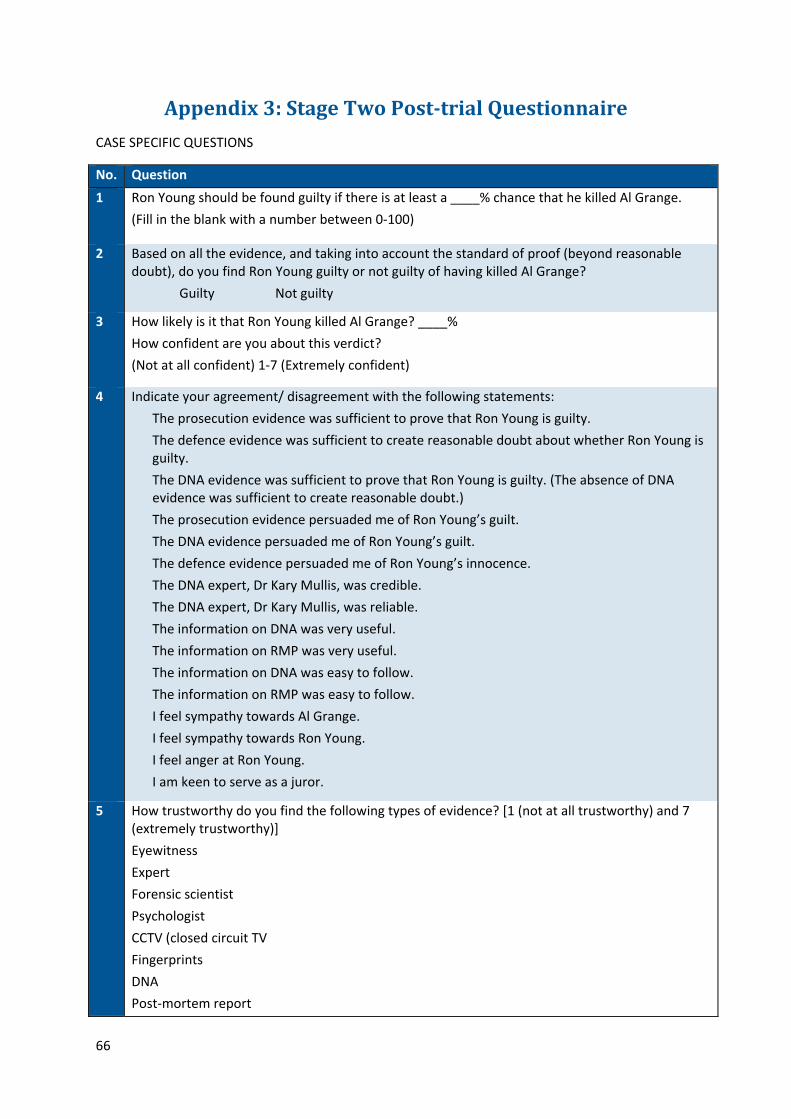
Appendix 3: Stage Two Post-trial Questionnaire
CASE SPECIFIC QUESTIONS
No. Question
1 Ron Young should be found guilty if there is at least a ____% chance that he killed Al Grange.
(Fill in the blank with a number between 0-100)
2 Based on all the evidence, and taking into account the standard of proof (beyond reasonable doubt), do you find Ron Young guilty or not guilty of having killed Al Grange?
Guilty Not guilty
3 How likely is it that Ron Young killed Al Grange? ____%
How confident are you about this verdict?
(Not at all confident) 1-7 (Extremely confident)
4 Indicate your agreement/ disagreement with the following statements:
The prosecution evidence was sufficient to prove that Ron Young is guilty.
The defence evidence was sufficient to create reasonable doubt about whether Ron Young is guilty.
The DNA evidence was sufficient to prove that Ron Young is guilty. (The absence of DNA evidence was sufficient to create reasonable doubt.)
The prosecution evidence persuaded me of Ron Young’s guilt.
The DNA evidence persuaded me of Ron Young’s guilt.
The defence evidence persuaded me of Ron Young’s innocence.
The DNA expert, Dr Kary Mullis, was credible.
The DNA expert, Dr Kary Mullis, was reliable.
The information on DNA was very useful.
The information on RMP was very useful.
The information on DNA was easy to follow.
The information on RMP was easy to follow.
I feel sympathy towards Al Grange.
I feel sympathy towards Ron Young.
I feel anger at Ron Young.
I am keen to serve as a juror.
5 How trustworthy do you find the following types of evidence? [1 (not at all trustworthy) and 7 (extremely trustworthy)]
Eyewitness
Expert
Forensic scientist
Psychologist
CCTV (closed circuit TV
Fingerprints
DNA
Post-mortem report
66

6 Assign 100 points among the following facts. Award the most points to the most important facts (0 = not important at all, 100 = extremely important). The points must sum up to 100.
The defendant's DNA matched the crime scene DNA. (The DNA sample found was inconclusive)
The DNA profile was expected to occur in 1 in 1 billion persons (No random match probability could be calculated from the DNA sample found.)
Ron Young borrowed an air rifle before the date of the murder.
Coincidental DNA matches are possible.
Melinda and the defendant drove to Grange's apartment on the night of the murder.
DNA may have been transferred from Ron Young to the crime scene via Melinda.
DNA QUESTIONS
No. Question
1 Assuming the probability of a random match between the DNA found at the crime scene and the sample from Ron Young is 1 in 1 billion, choose the best answer:
a. The probability that Ron Young killed Al Grange is 99.99%
b. The probability that Ron Young killed Al Grange is very high, but other factors have to be considered.
c. Reasonable doubt is created by the fact that at least 20 people other than Ron Young have the same DNA profile.
1 A crime scene sample of DNA can contain traces of more than one individual.
True False
2 Errors in DNA testing can occur as a result of
a. cross contamination if biological samples are not handled correctly and accounted for throughout their processing.
b. laboratories make errors in the way they maintain their equipment, process samples or calculate results.
c. (a) and (b)
d. errors in DNA testing do not occur.
3 If I just tossed a coin four times and got four heads, the probability of getting a tail when the coin is tossed for the fifth time is:
a. ½
b. greater than 1/2 as tails is far more likely this time.
c. less than 1/2, as I'm obviously on a lucky run.
d. 1/5, as it is the 5th toss.
4 When two DNA samples have the same genetic markers at the locations measured, this means that they definitely come from the same person.
True False
5 Short Tandem Repeats (STR) are the sections of code where base pair sequences are most likely to differ between individuals.
True False
6 "The donor of the blood sample labelled person A could not be excluded as the source of the biological material in the blood found at the crime scene. This DNA is 1 in 100,000 times more likely to have arisen if the scene sample came from person A than if it came from a random
67
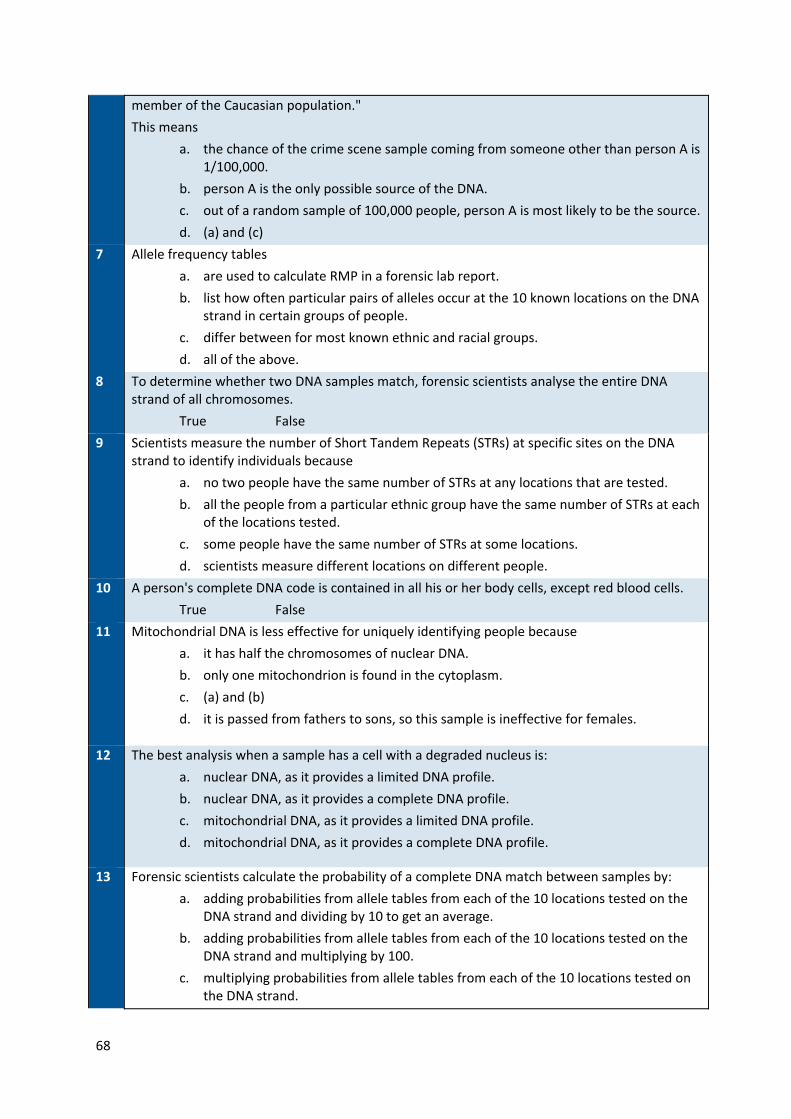
member of the Caucasian population."
This means
a. the chance of the crime scene sample coming from someone other than person A is 1/100,000.
b. person A is the only possible source of the DNA.
c. out of a random sample of 100,000 people, person A is most likely to be the source.
d. (a) and (c)
7 Allele frequency tables
a. are used to calculate RMP in a forensic lab report.
b. list how often particular pairs of alleles occur at the 10 known locations on the DNA strand in certain groups of people.
c. differ between for most known ethnic and racial groups.
d. all of the above.
8 To determine whether two DNA samples match, forensic scientists analyse the entire DNA strand of all chromosomes.
True False
9 Scientists measure the number of Short Tandem Repeats (STRs) at specific sites on the DNA strand to identify individuals because
a. no two people have the same number of STRs at any locations that are tested.
b. all the people from a particular ethnic group have the same number of STRs at each of the locations tested.
c. some people have the same number of STRs at some locations.
d. scientists measure different locations on different people.
10 A person's complete DNA code is contained in all his or her body cells, except red blood cells.
True False
11 Mitochondrial DNA is less effective for uniquely identifying people because
a. it has half the chromosomes of nuclear DNA.
b. only one mitochondrion is found in the cytoplasm.
c. (a) and (b)
d. it is passed from fathers to sons, so this sample is ineffective for females.
12 The best analysis when a sample has a cell with a degraded nucleus is:
a. nuclear DNA, as it provides a limited DNA profile.
b. nuclear DNA, as it provides a complete DNA profile.
c. mitochondrial DNA, as it provides a limited DNA profile.
d. mitochondrial DNA, as it provides a complete DNA profile.
13 Forensic scientists calculate the probability of a complete DNA match between samples by:
a. adding probabilities from allele tables from each of the 10 locations tested on the DNA strand and dividing by 10 to get an average.
b. adding probabilities from allele tables from each of the 10 locations tested on the DNA strand and multiplying by 100.
c. multiplying probabilities from allele tables from each of the 10 locations tested on the DNA strand.
68

d. dividing probabilities from allele tables from each of the 10 locations tested on the DNA strand.
14 Fragments of DNA are multiplied during the __________ stage of forensic testing.
a. STR amplification
b. DNA quantitation
c. DNA extraction
d. DNA separation
15 The nucleus of a cell contains
a. cytoplasm
b. mitochondria and DNA
c. chromosomes
d. (b) and (c)
16 DNA samples that come from different individuals may match by chance.
True False
17 Judge the following assumption: An alleged suspect who has undergone a bone marrow transplant may leave behind the donor's DNA and not their own.
a. True. If some of the patient's original bone marrow is retained (vs. ALL of their bone marrow being destroyed), then their blood can contain a mixed DNA profile and they could just leave behind the donor's DNA.
b. False. It may be true that a bone marrow transplant can cause a mixed DNA profile but the DNA is mixed now, so the suspect would have to leave both DNA samples behind.
c. False, as red blood cells are not used in DNA testing.
d. False. They may leave behind just the donor's DNA in their blood but they would definitely leave behind other DNA that's not mixed if they were there, in the form of hair, skin cells and so on, and this would allow for correct identification of the perpetrator.
18 Which parts of DNA are used for forensic analysis?
a. Coding parts
b. Non-gene or non-coding parts
c. Both (a) and (b)
d. Any known genes
19 Chromosomes are
a. found in all human cells.
b. small packages of DNA.
c. (a) and (b)
d. are only found in brain cells.
20 It's always best to test as much DNA as possible.
True False
21 An estimate of the likelihood of a chance match between DNA found at the crime scene and the DNA profile of a randomly selected person in the population is called:
a. random match probability
b. the exclusion or non-match quotient
69

c. (a) and (b) are used interchangeably
d. random selection
22 Forensic scientists can tell the gender of an individual from a DNA sample.
True False
23 DNA can be compromised by
a. incorrect handling of biological samples.
b. samples not being accounted for throughout their processing.
c. drugs or alcohol consumed by the donor immediately before the DNA was left.
d. (a) and (b)
24 Individuals have two copies of each gene at particular locations along the DNA strand. These copies, called ______, are used as markers or locations when scientists are testing DNA.
a. chromosomes
b. alleles
c. base pairs
d. vesicles
25 Which of the following base pair sequences could be found in a DNA sample?
a. A-T, T-A, G-C, G-C, C-G, A-T
b. C-C, G-G, T-T, T-T, A-A, C-C
c. T-A, T-G, G-C, C-C, A-T, C-G
d. A-G, G-C, C-T, T-A, G-C, C-G
26 DNA consists of four types of nucleotides that differ depending on the base they contain. Which of the following is not one of the four bases?
a. cytosine
b. dranine
c. thymine
d. adenine
27 Let's say an allele pair occurs at location D3 about 5% of the time in the relevant comparison population. This has a probability of 1/20.
True False
28 If the RMP of a DNA profile in a criminal case is 1 in 100,000 this means the probability that
a. the defendant is guilty in equal to 1 in 100,000.
b. the defendant is innocent is 1 to 100,000.
c. the defendant is not the source is equal to 1 in 100,000.
d. any random person would match this profile is equal to 1 in 100,000.
29 In NSW the law requires the measurement and recording of ____ Short Tandem Repeat markers (including gender) for comparison.
a. 9
b. 10
c. 11
d. 12
30 Human characteristics, such as hair colour, are encoded in genes found on the DNA strand.
True False
70
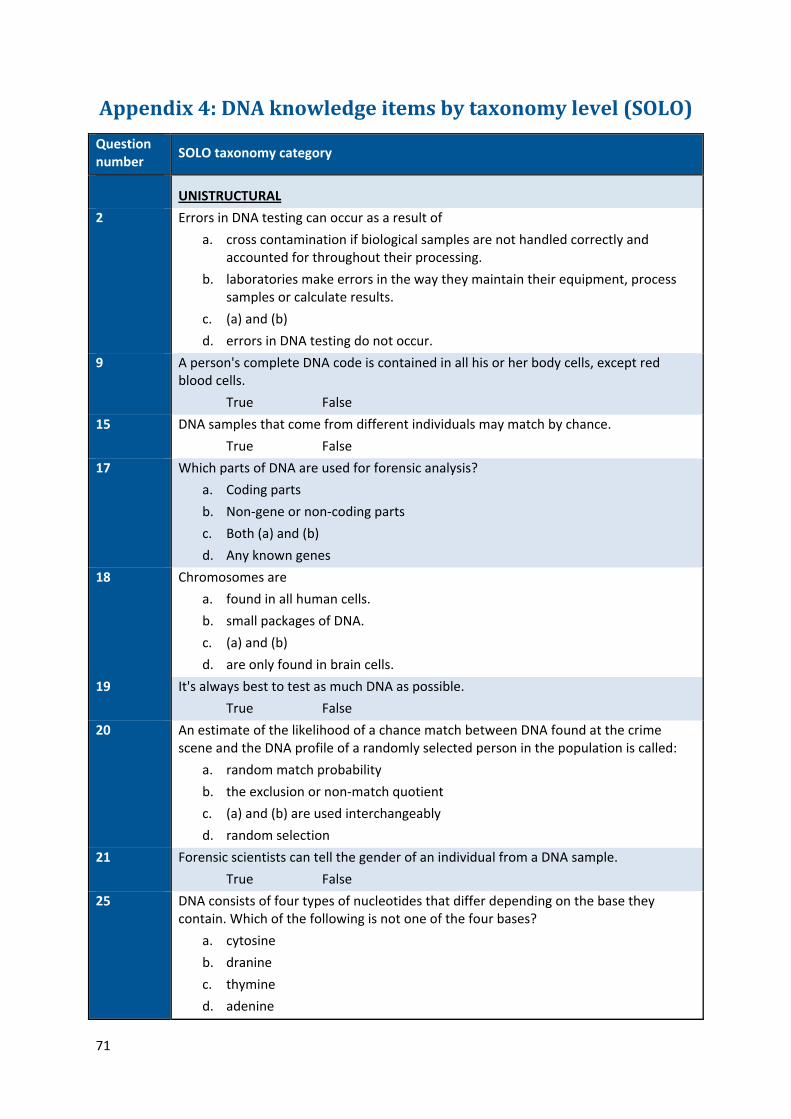
Appendix 4: DNA knowledge items by taxonomy level (SOLO)
Question number
SOLO taxonomy category
UNISTRUCTURAL
2 Errors in DNA testing can occur as a result of
a. cross contamination if biological samples are not handled correctly and accounted for throughout their processing.
b. laboratories make errors in the way they maintain their equipment, process samples or calculate results.
c. (a) and (b)
d. errors in DNA testing do not occur.
9 A person's complete DNA code is contained in all his or her body cells, except red blood cells.
True False
15 DNA samples that come from different individuals may match by chance.
True False
17 Which parts of DNA are used for forensic analysis?
a. Coding parts
b. Non-gene or non-coding parts
c. Both (a) and (b)
d. Any known genes
18 Chromosomes are
a. found in all human cells.
b. small packages of DNA.
c. (a) and (b)
d. are only found in brain cells.
19 It's always best to test as much DNA as possible.
True False
20 An estimate of the likelihood of a chance match between DNA found at the crime scene and the DNA profile of a randomly selected person in the population is called:
a. random match probability
b. the exclusion or non-match quotient
c. (a) and (b) are used interchangeably
d. random selection
21 Forensic scientists can tell the gender of an individual from a DNA sample.
True False
25 DNA consists of four types of nucleotides that differ depending on the base they contain. Which of the following is not one of the four bases?
a. cytosine
b. dranine
c. thymine
d. adenine
71

28 In NSW the law requires the measurement and recording of ____ Short Tandem Repeat markers (including gender) for comparison.
a. 9
b. 10
c. 11
d. 12
MULTISTRUCTURAL
1 A crime scene sample of DNA can contain traces of more than one individual.
True False
4 When two DNA samples have the same genetic markers at the locations measured, this means that they definitely come from the same person.
True False
7 To determine whether two DNA samples match, forensic scientists analyse the entire DNA strand of all chromosomes.
True False
11 The best analysis when a sample has a cell with a degraded nucleus is:
a. nuclear DNA, as it provides a limited DNA profile.
b. nuclear DNA, as it provides a complete DNA profile.
c. mitochondrial DNA, as it provides a limited DNA profile.
d. mitochondrial DNA, as it provides a complete DNA profile.
13 Fragments of DNA are multiplied during the __________ stage of forensic testing.
a. STR amplification
b. DNA quantitation
c. DNA extraction
d. DNA separation
14 The nucleus of a cell contains
a. cytoplasm
b. mitochondria and DNA
c. chromosomes
d. (b) and (c)
22 DNA can be compromised by
a. incorrect handling of biological samples.
b. samples not being accounted for throughout their processing.
c. drugs or alcohol consumed by the donor immediately before the DNA was left.
d. (a) and (b)
23 Individuals have two copies of each gene at particular locations along the DNA strand. These copies, called ______, are used as markers or locations when scientists are testing DNA.
a. chromosomes
b. alleles
c. base pairs
d. vesicles
72

29 Human characteristics, such as hair colour, are encoded in genes found on the DNA strand.
True False
RELATIONAL
5 "The donor of the blood sample labelled person A could not be excluded as the source of the biological material in the blood found at the crime scene. This DNA is 1 in 100,000 times more likely to have arisen if the scene sample came from person A than if it came from a random member of the Caucasian population."
This means
a. the chance of the crime scene sample coming from someone other than person A is 1/100,000.
b. person A is the only possible source of the DNA.
c. out of a random sample of 100,000 people, person A is most likely to be the source.
d. (a) and (c)
6 Allele frequency tables
a. are used to calculate RMP in a forensic lab report.
b. list how often particular pairs of alleles occur at the 10 known locations on the DNA strand in certain groups of people.
c. differ between for most known ethnic and racial groups.
d. all of the above.
8 Scientists measure the number of Short Tandem Repeats (STRs) at specific sites on the DNA strand to identify individuals because
a. no two people have the same number of STRs at any locations that are tested.
b. all the people from a particular ethnic group have the same number of STRs at each of the locations tested.
c. some people have the same number of STRs at some locations.
d. scientists measure different locations on different people.
10 Mitochondrial DNA is less effective for uniquely identifying people because
a. it has half the chromosomes of nuclear DNA.
b. only one mitochondrion is found in the cytoplasm.
c. (a) and (b)
d. it is passed from fathers to sons, so this sample is ineffective for females.
12 Forensic scientists calculate the probability of a complete DNA match between samples by:
a. adding probabilities from allele tables from each of the 10 locations tested on the DNA strand and dividing by 10 to get an average.
b. adding probabilities from allele tables from each of the 10 locations tested on the DNA strand and multiplying by 100.
c. multiplying probabilities from allele tables from each of the 10 locations tested on the DNA strand.
d. dividing probabilities from allele tables from each of the 10 locations tested on the DNA strand.
24 Which of the following base pair sequences could be found in a DNA sample?
73

a. A-T, T-A, G-C, G-C, C-G, A-T
b. C-C, G-G, T-T, T-T, A-A, C-C
c. T-A, T-G, G-C, C-C, A-T, C-G
d. A-G, G-C, C-T, T-A, G-C, C-G
26 Let's say an allele pair occurs at location D3 about 5% of the time in the relevant comparison population. This has a probability of 1/20.
True False
27 If the RMP of a DNA profile in a criminal case is 1 in 100,000 this means the probability that
a. the defendant is guilty in equal to 1 in 100,000.
b. the defendant is innocent is 1 to 100,000.
c. the defendant is not the source is equal to 1 in 100,000.
d. any random person would match this profile is equal to 1 in 100,000.
EXTENDED ABSTRACT
3 If I just tossed a coin four times and got four heads, the probability of getting a tail when the coin is tossed for the fifth time is:
a. ½
b. greater than 1/2 as tails is far more likely this time.
c. less than 1/2, as I'm obviously on a lucky run.
d. 1/5, as it is the 5th toss.
16 Judge the following assumption: An alleged suspect who has undergone a bone marrow transplant may leave behind the donor's DNA and not their own.
a. True. If some of the patient's original bone marrow is retained (vs. ALL of their bone marrow being destroyed), then their blood can contain a mixed DNA profile and they could just leave behind the donor's DNA.
b. False. It may be true that a bone marrow transplant can cause a mixed DNA profile but the DNA is mixed now, so the suspect would have to leave both DNA samples behind.
c. False, as red blood cells are not used in DNA testing.
d. False. They may leave behind just the donor's DNA in their blood but they would definitely leave behind other DNA that's not mixed if they were there, in the form of hair, skin cells and so on, and this would allow for correct identification of the perpetrator.
74
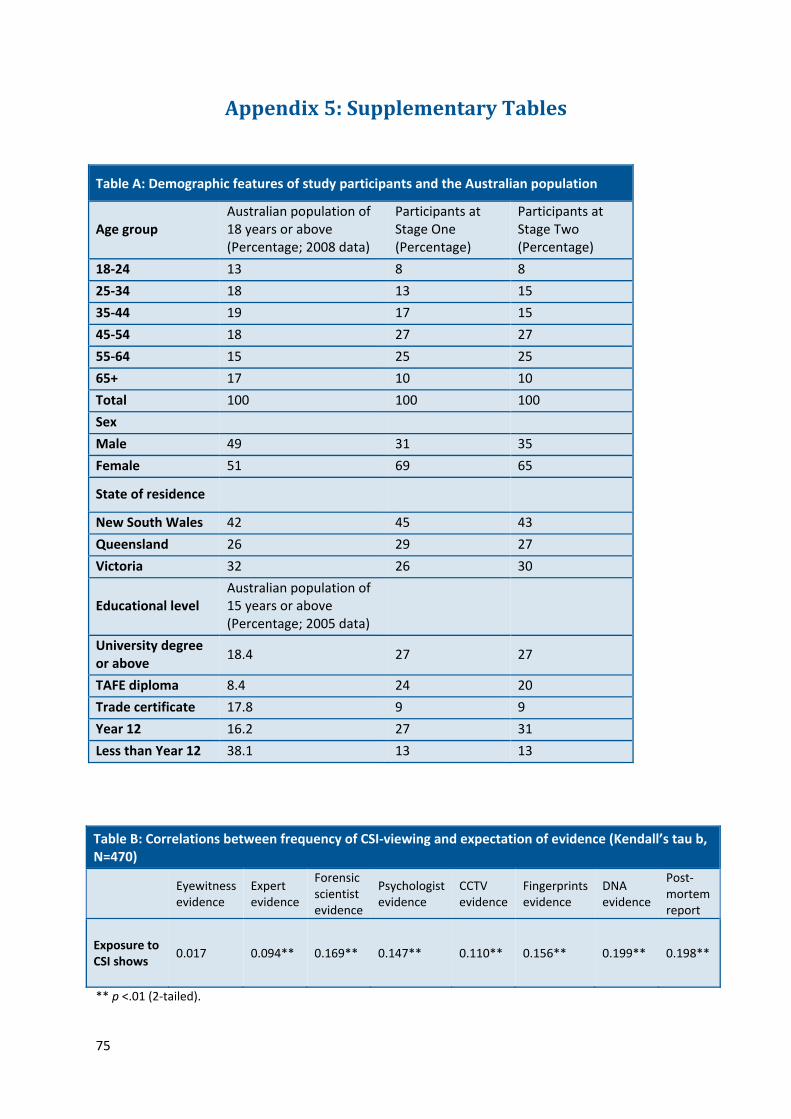
Appendix 5: Supplementary Tables
Table A: Demographic features of study participants and the Australian population
Age group Australian population of 18 years or above (Percentage; 2008 data)
Participants at Stage One (Percentage)
Participants at Stage Two (Percentage)
18-24 13 8 8
25-34 18 13 15
35-44 19 17 15
45-54 18 27 27
55-64 15 25 25
65+ 17 10 10
Total 100 100 100
Sex
Male 49 31 35
Female 51 69 65
State of residence
New South Wales 42 45 43
Queensland 26 29 27
Victoria 32 26 30
Educational level Australian population of 15 years or above (Percentage; 2005 data)
University degree or above
18.4 27 27
TAFE diploma 8.4 24 20
Trade certificate 17.8 9 9
Year 12 16.2 27 31
Less than Year 12 38.1 13 13
Table B: Correlations between frequency of CSI-viewing and expectation of evidence (Kendall’s tau b, N=470)
Eyewitness evidence
Expert evidence
Forensic scientist evidence
Psychologist evidence
CCTV evidence
Fingerprints evidence
DNA evidence
Post-mortem report
Exposure to CSI shows
0.017 0.094** 0.169** 0.147** 0.110** 0.156** 0.199** 0.198**
** p <.01 (2-tailed).
75

Table C: Correlations between CSI-viewing, pre-trial and post-trial trust in forensic evidence (Kendall's tau, N=470)
Forensic scientist
Psychologist Fingerprints DNA Post-mortem report
Pre-trial ratings
0.09 0.11 0.08 0.09 0.10
Post-trial ratings
0.08 0.16 0.07 0.07 0.09
All correlations significant at .05 level (2-tailed) except for post-trial DNA evidence p= .054.
Table D: Post-hoc comparison of group means on post-trial DNA knowledge (N=470)
Group
Mean Difference
SD p-value 95% Confidence Interval
Lower Bound
Upper Bound
1 vs 2 -6.0907(*) .66004 .000 -8.4437 -3.7377
3 -5.8484(*) .67328 .000 -8.2487 -3.4482
4 -6.1321(*) .65759 .000 -8.4763 -3.7878
5 -6.4206(*) .66777 .000 -8.8012 -4.0400
6 -6.0072(*) .67328 .000 -8.4074 -3.6069
7 -6.0000(*) .65288 .000 -8.3275 -3.6725
Table E: Post-hoc comparison of DNA learning by group (N=470)
Group
Mean Difference
SD p-value 95% Confidence Interval
Lower Bound
Upper Bound
1 vs 2 -3.7960(*) .50281 .000 -5.5885 -2.0035
3 -3.4974(*) .51290 .000 -5.3259 -1.6689
4 -3.5375(*) .50095 .000 -5.3233 -1.7516
5 -4.7116(*) .50871 .000 -6.5251 -2.8981
6 -4.0530(*) .51290 .000 -5.8815 -2.2245
7 -4.0141(*) .49736 .000 -5.7871 -2.2410
76
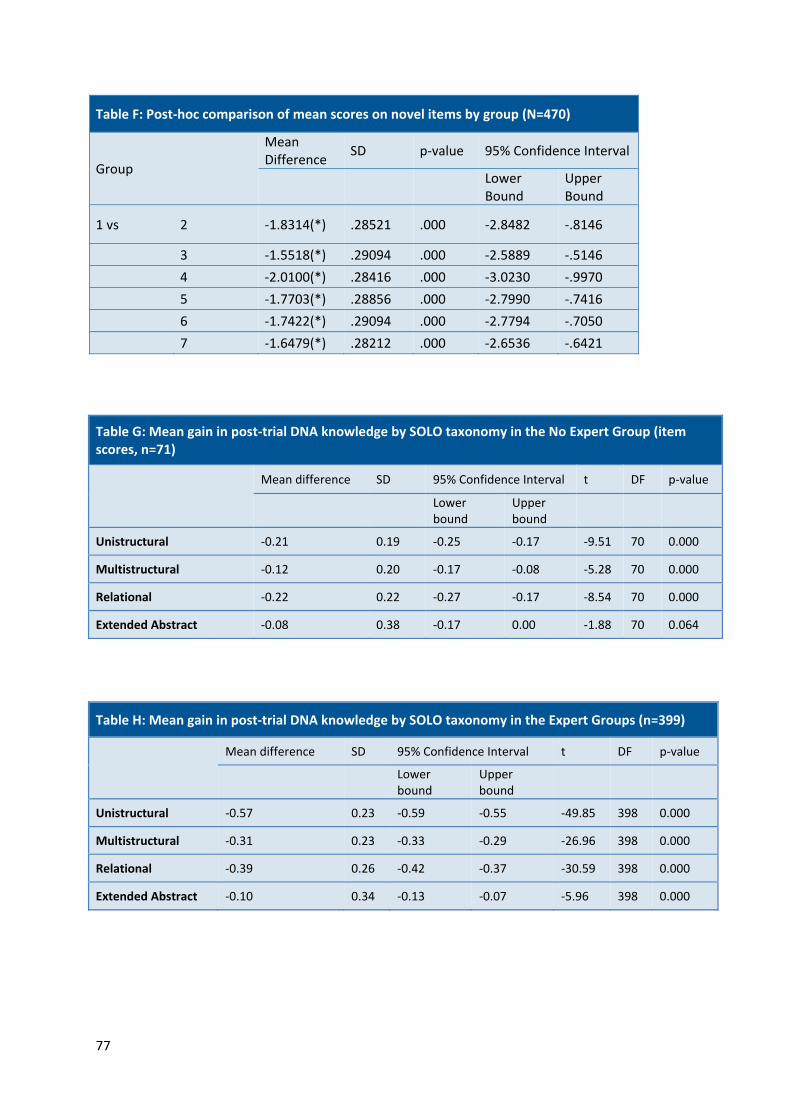
Table F: Post-hoc comparison of mean scores on novel items by group (N=470)
Group
Mean Difference
SD p-value 95% Confidence Interval
Lower Bound
Upper Bound
1 vs 2 -1.8314(*) .28521 .000 -2.8482 -.8146
3 -1.5518(*) .29094 .000 -2.5889 -.5146
4 -2.0100(*) .28416 .000 -3.0230 -.9970
5 -1.7703(*) .28856 .000 -2.7990 -.7416
6 -1.7422(*) .29094 .000 -2.7794 -.7050
7 -1.6479(*) .28212 .000 -2.6536 -.6421
Table G: Mean gain in post-trial DNA knowledge by SOLO taxonomy in the No Expert Group (item scores, n=71)
Mean difference SD 95% Confidence Interval t DF p-value
Lower bound
Upper bound
Unistructural -0.21 0.19 -0.25 -0.17 -9.51 70 0.000
Multistructural -0.12 0.20 -0.17 -0.08 -5.28 70 0.000
Relational -0.22 0.22 -0.27 -0.17 -8.54 70 0.000
Extended Abstract -0.08 0.38 -0.17 0.00 -1.88 70 0.064
Table H: Mean gain in post-trial DNA knowledge by SOLO taxonomy in the Expert Groups (n=399)
Mean difference SD 95% Confidence Interval t DF p-value
Lower bound
Upper bound
Unistructural -0.57 0.23 -0.59 -0.55 -49.85 398 0.000
Multistructural -0.31 0.23 -0.33 -0.29 -26.96 398 0.000
Relational -0.39 0.26 -0.42 -0.37 -30.59 398 0.000
Extended Abstract -0.10 0.34 -0.13 -0.07 -5.96 398 0.000
77

Table I: Within-group comparison of learning by SOLO taxonomy level by group
Group Unistructural Vs
df1 df2 F Sig.
1
Multistructural 1 70 7.47 .008
Relational 1 70 0.11 .747
Extended Abstract 1 70 7.17 .009
2
Multistructural 1 67 60.0 .000
Relational 1 67 15.28 .000
Extended Abstract 1 67 81.65 .000
3
Multistructural 1 62 62.80 .000
Relational 1 62 18.13 .000
Extended Abstract 1 62 92.64 .000
4
Multistructural 1 68 66.77 .000
Relational 1 68 20.70 .000
Extended Abstract 1 68 64.42 .000
5
Multistructural 1 64 77.16 .000
Relational 1 64 30.35 .000
Extended Abstract 1 64 74.52 .000
6
Multistructural 1 62 59.28 .000
Relational 1 62 12.91 .001
Extended Abstract 1 62 113.84 .000
7
Multistructural 1 70 65.07 .000
Relational 1 70 52.42 .000
Extended Abstract 1 70 100.87 .000
Table J: Correlations between DNA knowledge, learning and confidence in verdict (Kendall’s tau b, n=399)
Pre-existing DNA knowledge
Post-trial DNA knowledge
Learning
Confidence in verdict -0.004 -0.029 -0.005
All correlations not significant at .05 level (2-tailed)
78

Appendix 6: Supplementary Figures
Figure A: Subjects studied at high school by Stage One participants (percent, N=3614)
35.4%
22.9%30.2%
67.6%
0%
10%
20%
30%
40%
50%
60%
70%
80%
Biology Physics Chemistry Mathematics
Figure A: Subjects studied at high school by Stage One participants (percent, N=3614)
79