improving hydroelectric system forecasting and …
TRANSCRIPT
Improving Hydroelectric System Forecasting and Management in a Changing ClimateKevin Richards1 • Matthew Meadows1 • Steven Glaser2 • Peter Hartsough3 • Roger Bales4 • Martha Conklin4
1Pacific Gas and Electric Company, Water Management • 2University of California, Berkeley 3University of California, Davis • 4Sierra Nevada Research Institute, University of California, Merced
About the projectClimate change forecasts for the Sierra Nevada show the potential for significant reductions in snowpack, as well as altered precipitation and runoff patterns. These impacts will affect hydroelectric power generation, an important part of California’s low-carbon energy mix. PG&E’s hydroelectric system has a total generating capacity of nearly 4,000 MW and relies on nearly 100 reservoirs and seasonal snowpack storage.
As part of PG&E’s climate resilience initiative, the company is working with the University of California and the California Department of Water Resources on a multi-year research project to help PG&E better understand how to continue to optimize hydroelectric generation as precipitation patterns are altered by climate change.
Using California Energy Commission funds, the research team is installing a next-generation hydrologic observatory near PG&E’s North Fork Feather River facilities that integrates satellite remote sensing data with a ground-based measurement network. The research will capture data on the variability of snowpack, climate, soil moisture and other factors, which will improve PG&E’s monitoring and predictive tools, reduce uncertainty in runoff forecasts and increase resilience to climate change. The project will also assess the costs and benefits of using the intelligent water information system with physically based forecasting, as compared to current empirically derived forecast models.
Enhanced planning and operation of PG&E’s hydroelectric system is increasingly important as the company expands supplies of variable renewable energy sources, such as wind and solar. Hydroelectric power is a flexible resource that can help integrate these variable renewable energy sources into the system. Doing so will require a better understanding of hydrologic conditions for more precise control of available water supplies for hydroelectric generation.
Using a physically based model for mountain hydrologyDeveloped by the U.S. Geological Survey, the Precipitation-Runoff Modeling System (PRMS) is a distributed-parameter, physical process-based modeling system designed to evaluate the response of various combinations of climate and land use on streamflow and general watershed hydrology.
The California Department of Water Resources Snow Surveys section and PG&E Water Management are using the Feather River Basin PRMS to complement empirically derived methods for seasonal runoff forecasting and daily storm hydrograph forecasting.
Sensor design and layoutThe project team is deploying groups of sensors at each site (a sensor node) to form a network to capture variability of landscape features.
Visualizing the dataThe Feather River Basin PRMS employs a distributed input scheme for areal extrapolation of point observations (shown as black columns) across mountainous terrain―accounting for rain shadows, orographic enhancement, and other important features influencing the hydrologic cycle.
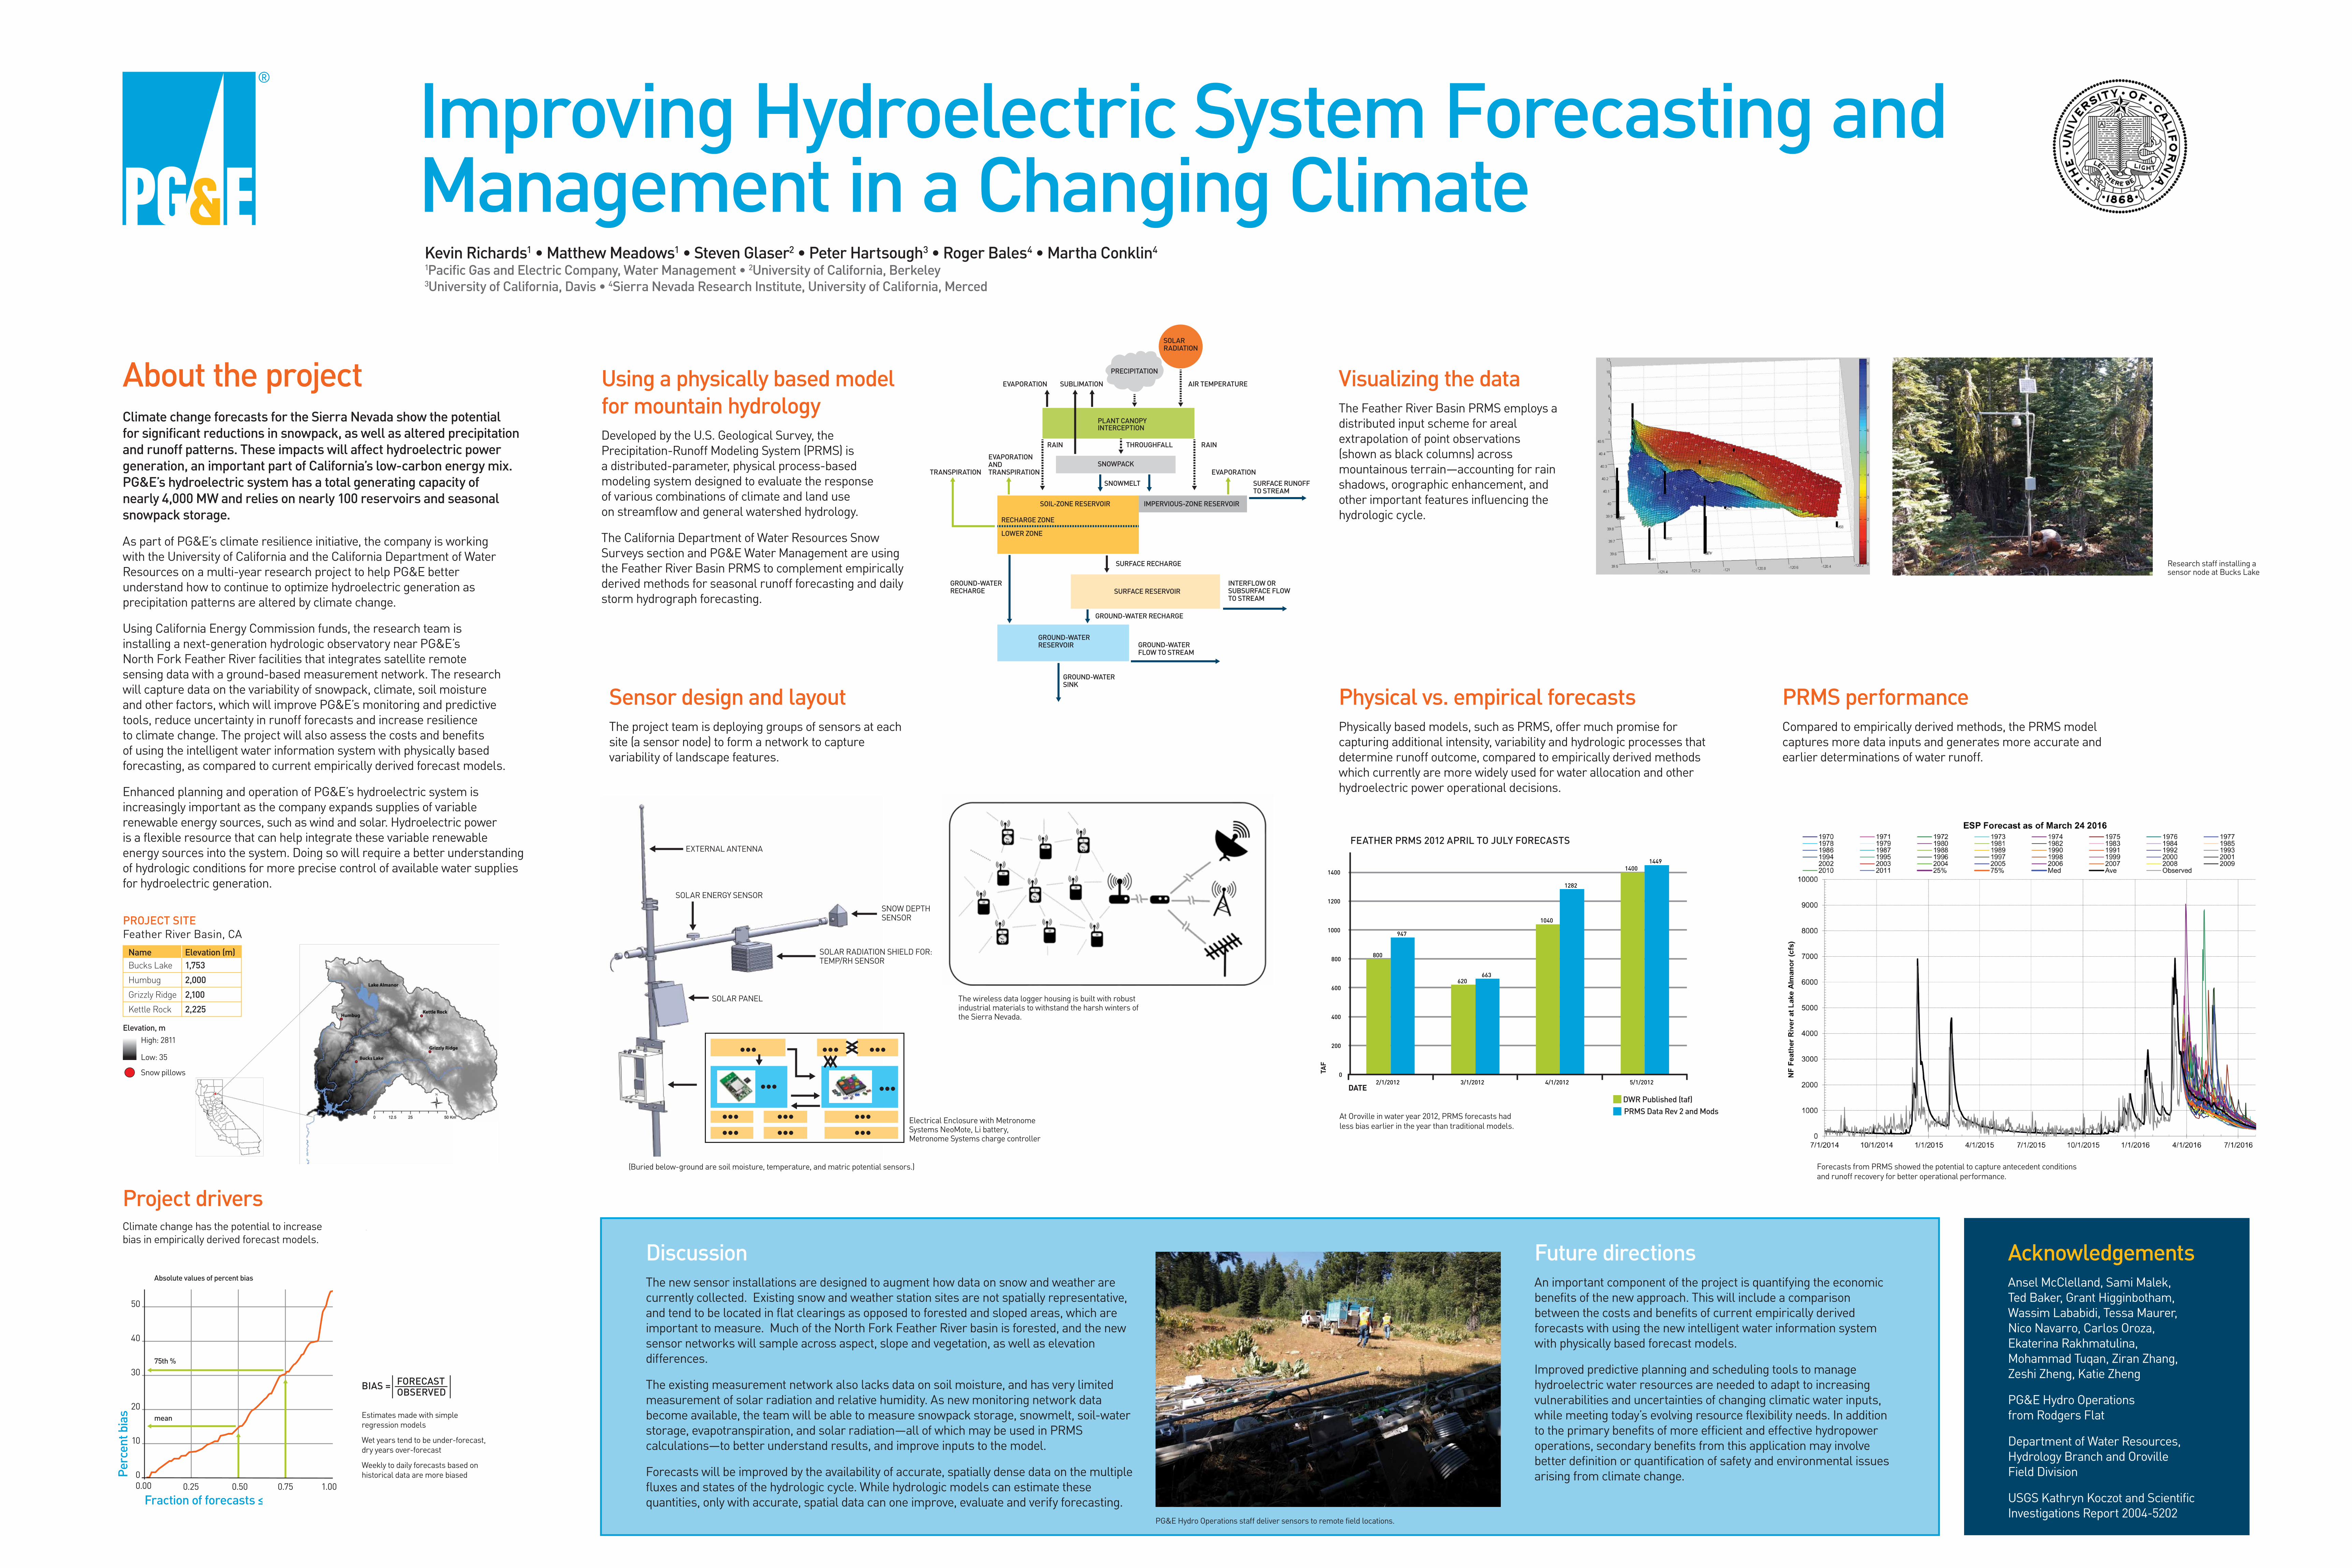
Physical vs. empirical forecastsPhysically based models, such as PRMS, offer much promise for capturing additional intensity, variability and hydrologic processes that determine runoff outcome, compared to empirically derived methods which currently are more widely used for water allocation and other hydroelectric power operational decisions.
PRMS performanceCompared to empirically derived methods, the PRMS model captures more data inputs and generates more accurate and earlier determinations of water runoff.
Project driversClimate change has the potential to increase bias in empirically derived forecast models.
Estimates made with simple regression models
Wet years tend to be under-forecast, dry years over-forecast
Weekly to daily forecasts based on historical data are more biased
PG&E Hydro Operations staff deliver sensors to remote field locations.
BIAS = FORECASTOBSERVED
DiscussionThe new sensor installations are designed to augment how data on snow and weather are currently collected. Existing snow and weather station sites are not spatially representative, and tend to be located in flat clearings as opposed to forested and sloped areas, which are important to measure. Much of the North Fork Feather River basin is forested, and the new sensor networks will sample across aspect, slope and vegetation, as well as elevation differences.
The existing measurement network also lacks data on soil moisture, and has very limited measurement of solar radiation and relative humidity. As new monitoring network data become available, the team will be able to measure snowpack storage, snowmelt, soil-water storage, evapotranspiration, and solar radiation―all of which may be used in PRMS calculations―to better understand results, and improve inputs to the model.
Forecasts will be improved by the availability of accurate, spatially dense data on the multiple fluxes and states of the hydrologic cycle. While hydrologic models can estimate these quantities, only with accurate, spatial data can one improve, evaluate and verify forecasting.
Future directionsAn important component of the project is quantifying the economic benefits of the new approach. This will include a comparison between the costs and benefits of current empirically derived forecasts with using the new intelligent water information system with physically based forecast models.
Improved predictive planning and scheduling tools to manage hydroelectric water resources are needed to adapt to increasing vulnerabilities and uncertainties of changing climatic water inputs, while meeting today’s evolving resource flexibility needs. In addition to the primary benefits of more efficient and effective hydropower operations, secondary benefits from this application may involve better definition or quantification of safety and environmental issues arising from climate change.
AcknowledgementsAnsel McClelland, Sami Malek, Ted Baker, Grant Higginbotham, Wassim Lababidi, Tessa Maurer, Nico Navarro, Carlos Oroza, Ekaterina Rakhmatulina, Mohammad Tuqan, Ziran Zhang, Zeshi Zheng, Katie Zheng
PG&E Hydro Operations from Rodgers Flat
Department of Water Resources, Hydrology Branch and Oroville Field Division
USGS Kathryn Koczot and Scientific Investigations Report 2004-5202
PROJECT SITEFeather River Basin, CA
Name Elevation (m)Bucks Lake 1,753Humbug 2,000Grizzly Ridge 2,100Kettle Rock 2,225
Elevation, mHigh: 2811
Low: 35
Snow pillows
Perc
ent b
ias
Fraction of forecasts 0.00
50
40
30
20
10
00.25 0.50 0.75 1.00
Absolute values of percent bias
75th %
mean
EVAPORATION
EVAPORATIONSURFACE RUNOFFTO STREAM
SURFACE RECHARGE
SURFACE RESERVOIRINTERFLOW OR SUBSURFACE FLOWTO STREAM
GROUND-WATERRECHARGE
GROUND-WATERRESERVOIR
GROUND-WATER RECHARGE
GROUND-WATER SINK
GROUND-WATER FLOW TO STREAM
SUBLIMATION
PRECIPITATION
PLANT CANOPYINTERCEPTION
SOLARRADIATION
RAIN RAINTHROUGHFALL
SNOWMELT
SNOWPACK
SOIL-ZONE RESERVOIR IMPERVIOUS-ZONE RESERVOIR
LOWER ZONE
RECHARGE ZONE
AIR TEMPERATURE
EVAPORATIONANDTRANSPIRATIONTRANSPIRATION
Research staff installing a sensor node at Bucks Lake
EXTERNAL ANTENNA
SOLAR ENERGY SENSOR
SOLAR PANEL
SNOW DEPTH SENSOR
SOLAR RADIATION SHIELD FOR:TEMP/RH SENSOR
Electrical Enclosure with Metronome Systems NeoMote, Li battery, Metronome Systems charge controller
(Buried below-ground are soil moisture, temperature, and matric potential sensors.)
The wireless data logger housing is built with robust industrial materials to withstand the harsh winters of the Sierra Nevada.
Forecasts from PRMS showed the potential to capture antecedent conditions and runoff recovery for better operational performance.
At Oroville in water year 2012, PRMS forecasts had less bias earlier in the year than traditional models.
DWR Published (taf) PRMS Data Rev 2 and Mods
800
620
1040
1400
947
663
1282
1449
0
200
400
600
800
1000
1200
1400
2/1/2012 3/1/2012 4/1/2012 5/1/2012 DATE
TAF
FEATHER PRMS 2012 APRIL TO JULY FORECASTS