improving hospital bed utilisation through simulation and
TRANSCRIPT

BPJ 420
Improving hospital bed utilisationthrough simulation and optimisation in
South African Public Hospitals
Connie Bloem11026082
University of PretoriaDepartment Industrial engineering 2014

Abstract
South African public hospitals have a shortage of hospital beds and struggle toallocate patients to beds and keep track thereof. This contributes to inefficientutilisation of limited hospital capacity. In literature, this problem is called the bedmanagement problem with specific focus on bed allocation.
Different techniques have been studied in literature in an attempt to solve thisproblem. Various models have been created to solve this problem using exactsolution modelling. These attempts have failed because the problem is to complexto solve with currently available exact solvers within an acceptable operationstime. A heuristic and simulation models have also been developed to solve thisproblem with success. A comparison between these techniques show that agentbased simulation modelling is the best suited for this specific problem.
This report addresses this problem by creating a bed management model, us-ing agent-based simulation, that will better match patients to beds and thereforemaximise the capacity utilisation of a South African Public Hospital.
Agent based simulation allows each patient’s characteristics and needs to betaken into account and match it to a bed that will fulfil the patients needs. Thissimulation method lends the required flexibility to the model to be able to testindividual as well as combined allocation rules.
In order to match a patient and to a bed, certain bed allocation rules should beadhered to. These allocation rules are studied by using conceptual models. Sevenindividual allocation rules are tested. These rules include allocation accordingto patient characteristics, reservation of beds for elective patients, and allocatingmore than one patient to a bed.
In order to be able to compare the results obtain from the conceptual modelsa basic first come, first served model is created. All the rules are a variationof this rule. Two reservation techniques are tested. Reservations according toelective patient schedule outperforms reservation of a fixed number of beds for theexclusive use by elective patients.
Allocation according to age and gender perform the same as the the first come,first served rule. These rules should, however, not be judged solely on performance.Adult patients should be separated gender for protection as well as to ensure thatthe patient’s stay is comfortable. Children are not as sensitive to this rule. Butit is imperative that children and adults be separated for the protection of thechildren.
Allocation according to patient criticality and allocating more than one patientto a bed also perform better than the first come, first served model. These rules

are not the most important to implement and can be used if the hospital’s policiesallow for it.
Combinations of the rules are further tested in a case study done at MamelodiHospital. Three rule sets were created. The results show that all three rulessets perform better than the current system that Mamelodi Hospital uses. Thisis partially due to the models tracking which beds are available and which areoccupied.
Of the three rule sets, Rule set 3 provides the most satisfactory results. Thismodel takes into consideration all of the most important rules and creates focussedunits within the hospital. Male and female adult patients are allocated to wardsaccording to their needs and children and babies are also assigned to the correctwards to receive specialised care. This rule set also gives preference to emergencypatients and beds can be reserved for elective patients. Rooms can be used forisolation purposes to protect other patients from infections or diseases. This modelalso allows patients to be transferred between wards.
Different allocations rules are applicable to different patients. Implementingthe right combinations of rules, similar to those used in Rule set three, will improvebed utilisation. Better tracking of beds will also improve bed utilisation and thepatients hospital experience.
2

Contents
1 Introduction 71.1 Background . . . . . . . . . . . . . . . . . . . . . . . . . . . . . . . 7
1.1.1 Structure of the Public Health sector . . . . . . . . . . . . . 71.1.2 Admission of patients . . . . . . . . . . . . . . . . . . . . . . 81.1.3 Units and wards . . . . . . . . . . . . . . . . . . . . . . . . . 91.1.4 Length of Stay (LoS) . . . . . . . . . . . . . . . . . . . . . . 101.1.5 Bed utilisation . . . . . . . . . . . . . . . . . . . . . . . . . 11
1.2 Research design . . . . . . . . . . . . . . . . . . . . . . . . . . . . . 141.3 Document structure . . . . . . . . . . . . . . . . . . . . . . . . . . . 14
2 Literature Review 152.1 Mathematical programming . . . . . . . . . . . . . . . . . . . . . . 15
2.1.1 Integer model . . . . . . . . . . . . . . . . . . . . . . . . . . 162.2 Heuristics . . . . . . . . . . . . . . . . . . . . . . . . . . . . . . . . 242.3 Simulation modelling . . . . . . . . . . . . . . . . . . . . . . . . . . 262.4 Agent based simulation modelling . . . . . . . . . . . . . . . . . . . 29
3 Studying Rule-Based Components 313.1 Basic model . . . . . . . . . . . . . . . . . . . . . . . . . . . . . . . 31
3.1.1 Agents . . . . . . . . . . . . . . . . . . . . . . . . . . . . . . 313.2 Conceptual models . . . . . . . . . . . . . . . . . . . . . . . . . . . 34
3.2.1 First come, first served . . . . . . . . . . . . . . . . . . . . . 343.2.2 Reservation of some beds for elective patients . . . . . . . . 363.2.3 Reservation of beds as elective patients are scheduled . . . . 393.2.4 Allocation according to patient characteristics: Age . . . . . 423.2.5 Allocation according to patient characteristics: Patient crit-
icality . . . . . . . . . . . . . . . . . . . . . . . . . . . . . . 463.2.6 Allocation according to patient characteristics: Gender . . . 473.2.7 Allocation of more than one patient to a bed . . . . . . . . . 50
3.3 Verification and validation . . . . . . . . . . . . . . . . . . . . . . . 523.4 Results . . . . . . . . . . . . . . . . . . . . . . . . . . . . . . . . . . 53
1

3.5 Discussion and conclusion . . . . . . . . . . . . . . . . . . . . . . . 55
4 Case Study at Mamelodi Hospital 574.1 Introduction to Mamelodi Hospital . . . . . . . . . . . . . . . . . . 574.2 Three rule sets . . . . . . . . . . . . . . . . . . . . . . . . . . . . . 604.3 Input data and basic model . . . . . . . . . . . . . . . . . . . . . . 60
4.3.1 Input data . . . . . . . . . . . . . . . . . . . . . . . . . . . . 604.3.2 Agents . . . . . . . . . . . . . . . . . . . . . . . . . . . . . . 614.3.3 The experiments . . . . . . . . . . . . . . . . . . . . . . . . 63
4.4 Testing of rules . . . . . . . . . . . . . . . . . . . . . . . . . . . . . 634.4.1 Rule set 1: First come, First served . . . . . . . . . . . . . . 634.4.2 Rule set 2 . . . . . . . . . . . . . . . . . . . . . . . . . . . . 654.4.3 Rule set 3 . . . . . . . . . . . . . . . . . . . . . . . . . . . . 68
4.5 Verification and validation . . . . . . . . . . . . . . . . . . . . . . . 704.6 Results and Discussion . . . . . . . . . . . . . . . . . . . . . . . . . 704.7 Conclusion . . . . . . . . . . . . . . . . . . . . . . . . . . . . . . . . 71
5 Conclusion and Recommendations 735.1 Conclusion and recommendation . . . . . . . . . . . . . . . . . . . . 735.2 Suggestions for future projects . . . . . . . . . . . . . . . . . . . . . 74
Appendices 78
A Project sponsor form 79
2

List of Tables
1.1 Average length of stay in public hospitals in the City of Tshwane(Statistics South Africa, 2004) . . . . . . . . . . . . . . . . . . . . . 11
3.1 Results obtained from twenty simulation runs for first come, firstserved rule using fixed seed . . . . . . . . . . . . . . . . . . . . . . . 35
3.2 Results obtained from twenty iterations of first come, first servedrule with a random seed . . . . . . . . . . . . . . . . . . . . . . . . 35
3.3 Results obtained from twenty simulation runs for model consideringreservation of beds for elective patients using random seed . . . . . 38
3.4 Bed utilisation for reservation of some beds for elective patientsusing random seed . . . . . . . . . . . . . . . . . . . . . . . . . . . 38
3.5 Results obtained from twenty simulation runs for reservation ofsome beds for the exclusive use of elective patients using fixed seed 39
3.6 Results obtained from twenty simulation runs for the model consid-ering reservation of beds using fixed seed . . . . . . . . . . . . . . . 41
3.7 Results obtained from twenty simulation runs for model consideringreservation of beds using random seed . . . . . . . . . . . . . . . . . 41
3.8 Results obtained from twenty simulation runs for model consideringage as a rule using random seed . . . . . . . . . . . . . . . . . . . . 44
3.9 Bed utilisation for age based allocations using random seed . . . . . 453.10 Results obtained from twenty simulation runs for model considering
age as rule using fixed seed . . . . . . . . . . . . . . . . . . . . . . . 453.11 Results obtained from twenty simulation runs for the model consid-
ering patient criticality using fixed seed . . . . . . . . . . . . . . . . 463.12 Results obtained from twenty simulation runs for model considering
patient criticality as allocation rule using random seed . . . . . . . 473.13 Results obtained from twenty simulation runs for the model consid-
ering patient gender using fixed seed . . . . . . . . . . . . . . . . . 493.14 Results obtained from twenty simulation runs for model considering
gender as allocation rule using random seed . . . . . . . . . . . . . 493.15 Bed utilisation for gender based allocations using random seed . . . 49
3

3.16 Results obtained from twenty simulation runs for allocations wheretwo patients per bed is allowed using fixed seed . . . . . . . . . . . 52
3.17 Results obtained from twenty simulation runs for allocations wheretwo patients per bed is allowed using random seed . . . . . . . . . . 52
3.18 Results of fixed seed models . . . . . . . . . . . . . . . . . . . . . . 53
4.1 Surgery wards in Mamelodi Hospital . . . . . . . . . . . . . . . . . 594.2 Data of four wards obtained from Mamelodi Hospital . . . . . . . . 614.3 Results obtained from twenty simulation runs for Rule set 1 . . . . 644.4 Results obtained from twenty simulation runs for Rule set 1 using
a random seed . . . . . . . . . . . . . . . . . . . . . . . . . . . . . . 654.5 Results obtained from twenty simulation runs for Rule set 2 . . . . 664.6 Results obtained from twenty simulation runs for Rule set 2 using
a random seed . . . . . . . . . . . . . . . . . . . . . . . . . . . . . . 674.7 Results obtained from twenty simulation runs for Rule set 3 . . . . 694.8 Results obtained from twenty simulation runs for Rule set 3 using
a random seed . . . . . . . . . . . . . . . . . . . . . . . . . . . . . . 694.9 Stability of results obtained from each Rule set . . . . . . . . . . . 704.10 Comparison of results with data obtained from Mamelodi Hospital . 71
4

List of Figures
1.1 Hierarchical referral structure of public hospitals . . . . . . . . . . . 71.2 Simplified illustration of the patients journey (Proudlove et al., 2003) 8
2.1 General model of an ICU (Seung-Chul et al., 2000) . . . . . . . . . 262.2 General process for deciding whether to admit a patient to the ICU
(Seung-Chul et al., 2000) . . . . . . . . . . . . . . . . . . . . . . . . 27
3.1 Main agent forming the principle view of the model . . . . . . . . . 313.2 Main agent initiating variables and parameters . . . . . . . . . . . . 313.3 State chart and parameters of the bed agent . . . . . . . . . . . . . 323.4 Bed animation showing occupied and unoccupied beds . . . . . . . 323.5 Patient agent characteristics . . . . . . . . . . . . . . . . . . . . . . 323.6 Basic patient flow . . . . . . . . . . . . . . . . . . . . . . . . . . . . 333.7 Typical patient statistics during a single simulation run . . . . . . . 343.8 Results obtained from twenty simulation runs for first come, first
served rule using random seed . . . . . . . . . . . . . . . . . . . . . 353.9 Results obtained from twenty simulation runs for model considering
reservation of beds for elective patients using random seed . . . . . 383.10 Results obtained from all experiments for the model considering
reservation of beds for elective patients using random seed . . . . . 393.11 Results obtained from twenty simulation runs for model considering
reservation of beds using random seed . . . . . . . . . . . . . . . . . 413.12 Results obtained from twenty simulation runs for model considering
age as a rule using random seed . . . . . . . . . . . . . . . . . . . . 453.13 Results obtained from all experiments for the model considering age
as allocation rule using random seed . . . . . . . . . . . . . . . . . 453.14 Results obtained from twenty simulation runs for model considering
patient criticality as allocation rule using random seed . . . . . . . 473.15 Results obtained from twenty simulation runs for model considering
gender as allocation rule using random seed . . . . . . . . . . . . . 503.16 Results obtained from twenty simulation runs for model where more
than one patient can be allocated to one bed using random seed . . 52
5

3.17 Bed utilisation percentage obtained from all results . . . . . . . . . 54
4.1 Peaditric inflow and outflow . . . . . . . . . . . . . . . . . . . . . . 584.2 Neonatal ICU inflow and outflow . . . . . . . . . . . . . . . . . . . 584.3 Labour ward inflow and outflow . . . . . . . . . . . . . . . . . . . . 594.4 Post Natal ward inflow and outflow . . . . . . . . . . . . . . . . . . 594.5 Surgical ward inflow and outflow . . . . . . . . . . . . . . . . . . . 594.6 Main view of case study model . . . . . . . . . . . . . . . . . . . . . 614.7 Bed agent set-up in case study . . . . . . . . . . . . . . . . . . . . . 624.8 Patient agent set-up in case study . . . . . . . . . . . . . . . . . . . 624.9 Results obtained from twenty simulation runs for Rule set 1 using
a random seed . . . . . . . . . . . . . . . . . . . . . . . . . . . . . . 654.10 Results obtained from twenty simulation runs for Rule set 2 using
a random seed . . . . . . . . . . . . . . . . . . . . . . . . . . . . . . 674.11 Layout of wards in rule set 3 . . . . . . . . . . . . . . . . . . . . . . 684.12 Results obtained from twenty simulation runs for Rule set 3 using
a random seed . . . . . . . . . . . . . . . . . . . . . . . . . . . . . . 694.13 Results of all Rule sets . . . . . . . . . . . . . . . . . . . . . . . . . 71
6

Chapter 1
Introduction
1.1 Background
An estimated 82.4% of the South African population make use of public healthservices (Health Systems Trust, 2012), while the remaining 17.6% make use ofprivate health care. The public health sector is under immense pressure due toan increase in the number of people with HIV/Aids from 4 million in 2002 to 5.28million in 2013 (Statistics South Africa, 2013), an increase in general populationand a shortage of resources, such as beds, telemetry, funds and staff (Meyer, 2010,p. 9). It is estimated that a further 60 000 beds are required country wide in anattempt to improve the standard of public health services and relieve the pressureon the hospitals.
1.1.1 Structure of the Public Health sector
The South African Public Health sector has a hierarchical referral structure be-tween the hospitals and clinics (Mojaki et al., 2011), as shown in figure 1.1.
Figure 1.1: Hierarchical referral structure of public hospitals
7

All patients must first receive primary care at a clinic or health centre whereinitial diagnosis and treatments are conducted (Cullinan, 2006). If required, pa-tients are then referred to a district hospital to be admitted. If the patient requiresmore specialised care, they will be transferred to a tertiary or regional hospital.The district, tertiary and regional hospitals all have an Emergency Departmentthrough which patients can also be admitted.
1.1.2 Admission of patients
An outpatient is a patient who visits a medical facility for treatment but is nothospitalised for an over-night stay. Inpatients are admitted to the hospital andstay for one or more nights before being discharged.
In South Africa, inpatients can be admitted to a hospital in one of three ways:
1. elective patient being admitted for a surgery that has been scheduled inadvance;
2. emergency patient being admitted from the Emergency Department for ur-gent medical treatment;
3. urgent referral from General Practitioners (GP), Community Health Centres(CHC) or Primary Health Care (PHC) clinics.
Figure 1.2 is a simplified illustration of a patient’s journey:
Figure 1.2: Simplified illustration of the patients journey (Proudlove et al., 2003)
8

Schmidt et al. (2013) suggested that between 30% and 80% of patients areelective, depending on the medical department that they are assigned to. Theseadmissions can be planned in advance. Demeester et al. (2010) defines inpatientadmissions scheduling as a facility allocation decision and that the maximisationof the hospital’s capacity depends on two main sources of variability:
• Emergency admissions cannot be planned and slack capacity must be avail-able to admit these patients.
• A patient’s Length of Stay (LoS) is inherently uncertain and can thereforeonly be estimated.
Elective patients are tentatively allocated to a bed in a ward by a bed managerbefore arriving, but emergency patients and emergency referrals have precedenceover elective patients (Schmidt et al., 2013). Hospitals have a fixed number of bedsand if there is a shortage, elective surgeries are rescheduled.
1.1.3 Units and wards
Hospitals consist of independent units which are visited by patients according tothe level of specialised care required and their individual pathology (Paulussenet al., 2006). Patients usually stay in wards and go to ancillary wards for varioustreatments or procedures. The type of units in a hospital depends on the typeand size of the hospital, therefore not all hospitals will have all of the units orwards. Not all units have beds for patients to stay in but rather are units wheretreatments are done.
According to Roger (2011) the following is a list of units where patients canpossibly be allocated to a bed:
CardiologyThe Cardiology Unit provides care for patients with any heart or circula-tion related diseases and also acts as an intermediate care unit for patientstransferred from the ICU after receiving cardiac treatments and who haverecovered sufficiently (UW Health, 2014).
Intensive Care (Adult, Paediatric and Neonatal)This unit cares for the most critically ill patients. It has a limited numberof beds and the patients receive specialised care from specialist doctors andnurses.
The Neonatal ICU takes care of babies between the ages of 1 to 30 daysbut usually these wards only admit newborn babies who have not yet beendischarged after birth. The Paediatric Unit cares for children between the
9

ages of 30 days and 12 years and the Adult Unit cares for patients older than12 years.
GastroenterologyThis discipline specialises in the treatment of bowel-related diseases. Thesepatients cannot be allocated to wards where other patients have open woundsbecause of the high risk of infection for the other patients.
General SurgeryThe General Surgery ward caters for patients who have received a wide rangeof minor surgeries. This unit tends to have a high turnover of patients whoonly stay for a few hours or overnight.
GynaecologyThe Gynaecology Department treats problems of the female urinary tractand reproductive organs.
Obstetrics, Maternity and Neonatal DepartmentThe Obstetric Unit care for women and prenatal foetuses. The MaternityDepartment cares for women during childbirth and provides postnatal care.The Neonatal Department is attached to the Maternity Wards and has anumber of cots to which the newborn babies can be allocated. The mosthospitals have the policy that the mothers and babies should be kept to-gether, where possible.
Nephrology and UrologyThis department deals with kidney related problems. The patients in thesedepartments can either be hospitalised for a short period, such as three days,when receiving minor treatments or for longer periods of time if the patientis on dialysis and waiting for a transplant.
OncologyOncology cares for patients who have been diagnosed with cancer. These pa-tients receive radiotherapy and chemotherapy. They require specialised carefrom nurses and doctors and are closely linked to the Surgical Departments.Patients can be admitted for a single day treatment or for longer periods,depending on how critical the patient is.
OrthopaedicsOrthopaedics treats ailments of the muscles, joints, bones, ligaments, ten-dons, and nerves.
10

PaediatricsThis unit cares for children between the ages of 30 days and 12 years withall kinds of pathologies.
1.1.4 Length of Stay (LoS)
When a patient is admitted to hospital, not all the necessary medical treatmentsare always known at the start of the patient’s stay (Paulussen et al., 2006). Newfindings during the patient’s treatment might change the priority group of thepatient, giving rise to more treatments or complications. This causes variabilityto occur in the Length of Stay of the patient.
Marazzi et al. (1998) did extensive research on three widely used distribu-tions to assist bed managers to better predict their patient’s LoS and make moreinformed decisions. The Weibull, log normal and gamma distributions were ex-amined within each Diagnosis Related Group (DRG). DRG is a system that wasdeveloped in 1975 by YALE University to accurately describe all patient care typesin an acute care hospital. Hospital cases are divided into 467 groups to help thehealthcare industry to better understand the needs of their patients with regard toproducts and assigning a basic cost to each group. Marazzi et al. (1998) concludedthat the log normal distribution fitted the most of the data because LoS is a shortperiod for most of the patients.
Statistics South Africa (2004) indicated that patients’ stay in special hospitalsis longer than in district or regional hospitals because they have special needs.Table 1.1 is an extract of the study that shows the average and variation in thelength of stay of patients in public hospitals in the City of Tshwane following aWeibull distribution.
Hospital Averagelength of stay
George Mukhari 7.9Pretoria Academic 5.7Kalafong 6.5Mamelodi 2.1Pretoria West 2.7Total 6.0
Table 1.1: Average length of stay in public hospitals in the City of Tshwane(Statistics South Africa, 2004)
11

1.1.5 Bed utilisation
Bed capacity is a limited resource in all hospitals (Schmidt et al., 2013). Asreported in The Herald, Durban’s Addington Hospital has 135 beds that are fullyoccupied at all times (Cullinan, 2006). Chris Hani Baragwanath Hospital in Sowetohas only eighteen intensive care beds to serve a community of more than twomillion. This over population results in patients being discharged before theyhave fully recovered in order to make beds available for more critical patients.The standard of healthcare at Chris Hani Baragwanath Hospital ranges betweenworld-class and life-threatening because there is a shortage of trained staff andavailable beds.
The shortage of beds causes the allocation of patients to beds to become prob-lematic. Cases have been reported where patients share beds, are allocated tomattresses in hallways, or simply can not be admitted (Viljoen, 2005). Halata(2013) reported that a shortage of beds at Kimberley Hospital causes patients tobe left on ambulance stretchers, patient trolleys or in wheelchairs because patientscannot be allocated to beds. Chris Hani Hospital also had cases where newbornbabies were allocated to boxes in the Maternity Wards due to a shortage of cribscaused by budget cuts (Musgrave, 2007). On the other hand, there are instanceswhere beds are left unoccupied because utilisation of beds is not monitored ef-fectively (Mashaba, 2007). It is in many cases the responsibility of doctors andnurses to allocate a patient to an appropriate bed and to keep track of beds thathave been filled or are possibly available.
Through interviews it became clear that in most public hospitals there is nocentral computer system that tracks beds or supports bed managers when doingallocation. When patients are admitted, the relevant ward is telephoned. Thehead nurse or an available doctor searches the wards for an open bed or movespatients around in an attempt to find a bed that will fulfil the patient’s needs. Ifthe patient cannot be admitted to a ward, the patient is either referred to anotherhospital or it is attempted to admit the patient to another ward.
Allocation is mainly based on certain characteristics of a patient, such as age,gender, pathology, and what type of medical treatment is required (Bachouchet al., 2012). In some hospitals patient preference in terms of room requirementsis also taken into account (Schmidt et al., 2013).
According to hospital management and doctors interviewed, hospitals are de-signed to accommodate a fixed number of beds. Each bed must have the rightresources, such as oxygen access, communication to the nursing station and teleme-try. To compensate for the shortage of beds in public hospitals, extra beds areplaced in the wards and in departments such as Paediatrics or Neonatal ICU. Insome cases, up to three patients can be placed into one bed or crib if the demandfor beds exceeds the actual supply. Therefore, not all the beds have the required
12

resources to serve each patient’s needs. When allocating patients to beds, theseneeds should be taken into consideration and the patient must be allocated to abed which can fulfil these needs.
Patients are allocated to wards where beds are available, even if it is not thecorrect unit under which the patient should receive treatment. These patientsmust be transferred to the appropriate ward when beds become available.
Statistics South Africa (2004) showed in the Provincial Profile Report that, onaverage, the hospitals in Gauteng had a bed occupancy rate of 73%. Of all thehospitals, Mamelodi Hospital had the highest occupancy of 105% on average. Thishigh rate can be attributed to patients sharing beds or admitting more patientsthan the number of available beds. The high occupancy rates cause difficulties inthe optimisation of capacity utilisation when manual allocations of beds are made.
South African public hospitals have a shortage of hospital beds and struggleto allocate patients to beds and keep track thereof. This contributes to inefficientutilisation of limited hospital capacity. In literature, this problem is called the bedmanagement problem with specific focus on bed allocation. This problem strives tooptimally allocate patients to a hospital’s scarce resources (Paulussen et al., 2006).
Different techniques have been studied in literature in an attempt to solvethis problem. Bachouch et al. (2012), Demeester et al. (2010) and Schmidt et al.(2013) use mathematical programming to form a supporting tool that can be usedby nurses when bed allocations are made. These models fall short because whenthe experiments are made larger to resemble a real life hospital the model takestoo long to reach a feasible solution. Demeester et al. (2010) also attempt touse a heuristic model to shorten the solution time. This model is successful inassigning patients in a short amount of time. Schmidt et al. (2013), Seung-Chulet al. (2000) and Paulussen et al. (2006) found simulation modelling to be moreflexible than the other techniques. Length of Stay, patients’ possible demise andrecovery, movement between wards and more allocation rules can be taken intoaccount. Agent-based simulation modelling, as used by Paulussen et al. (2006),gives the most accurate depiction of reality. A patient’s Length of Stay variesas new information about their health becomes available. The discharge timescan therefore be updated and decisions can be made based on when the bed willbecome available. The agent based model can also solve the problem in a shorttime irrespective of the size of the experiment.
13

1.2 Research design
The aim of this report is to create a generic bed management model that willbetter match patients to beds and therefore maximise the capacity utilisation of aSouth African public hospital.
The model will take into account the needs, personal preferences and priorityof each patient and allocate the patient to a bed that will best match their specificneeds. Length of Stay (LoS) will be assigned to a probability distribution thatcorrectly depicts the inherent variation. The uncertainty with respect to the pa-tients’ recovery will also be taken into account. Attention will be given to patientflow within the hospital.
Agent-based simulation will firstly be used for smaller experiments to establishwhat the reaction of the model will be if different characteristics of the inputsare changed. These smaller experiments will also be used to duplicate previousresearch to establish whether the similar results are obtained. Secondly, using ex-perimental data a larger agent based simulation will be used to test three differentcollections of rules. The reaction of the model will be observed, as well as whichgroup will maximise capacity utilisation.
Actual historical data from Mamelodi District Hospital will be used as a casestudy to show that the findings of this project are applicable to South Africanstate hospitals.
1.3 Document structure
To start addressing the problem, the next chapter provides a literature review. Therole of bed management, how admission and scheduling of patients take place, andhow patients are currently allocated are investigated first. To provide a basisfor determining which solution method should be used to solve the patient bedallocation problem, an overview of various allocation methods is given.
Chapter 3 contains conceptual models to test the influence of all the basicmodels. Each model is tested and a conclusion is reached based on the results. Theresults of each conceptual model is compared to the results of the other models toestablish which rule is the most effective and has the largest impact on the system.
Three rule sets are compiled and tested in Chapter 4 based on the results fromChapter 3 in an attempt to solve the bed allocation problem. The results of therules are compared and a conclusion is reached on which rule set performs thebest. Reasoning in favour of some rules are also taken into consideration.
Chapter 5 concludes the document by summarising the research conductedand providing the proposed solution. Finally, suggestions for further research arediscussed.
14

Chapter 2
Literature Review
Bed allocation and admission scheduling are well documented in literature. It iscalled the bed management problem with specific focus on bed allocation. Hospitalsare continuously pressured to use all resources more efficiently to reduce cost forthe hospitals and patients.
According to Proudlove et al. (2003) the responsibilities of bed managementinclude allocating patients to beds, tracking empty beds, calculating when bedswill become available and overseeing transfers of patients to another departmentor hospital. Therefore, it is reasonable to assume that bed management influencesthe capacity utilisation of the hospital and should strive to optimally allocate beds.Schmidt et al. (2013) state that operations management and strategic planning isan important task in a hospital and that bed management is a subtask of this.
Manual bed management techniques are the most widely used technique inpublic hospitals. Patient assignment to beds is based on business rules, how criticalthe treatment is and the patient’s room preferences (Schmidt et al., 2013). Thistechnique has also been used in an attempt to improve the hospital’s capacityutilisation. A shortfall of this technique is that it is based on the assumption of afixed Length of Stay for all the patients, without considering the variability thatexists in the Length of Stay or the possible demise of the patient.
2.1 Mathematical programming
Mathematical programming is one of the best known branches of operations re-search, the scientific approach to decision making concerned with optimally al-locating limited resources to different competitive activities whilst adhering to aset of constraints (Winston and Venkataramanan, 2003). Mathematical program-ming uses mathematical models to assist in making decisions or to understand asituation better.
15

2.1.1 Integer model
An integer linear program is a linear program in which some or all of the variablesare non-negative integers (Winston and Venkataramanan, 2003).
A generic model for allocating acute and elective patients is based on integerlinear planning, taking into account that the allocation rules and constraints havebeen developed by Bachouch et al. (2012). Their model aims to improve capacityutilisation at an operational level and was conducted at Saint Joseph’s Hospital,which has 350 beds and some specialised wards. The following rules are consideredin this model:
• Patients will not be transferred between wards.
• Length of Stay is deterministic and known.
• A window in which each patient has to be admitted is defined. The startand end times of a acute patient’s window are the same in order to expressurgency.
• Patients of different gender cannot share a room.
• Rooms are double or single rooms.
• Due consideration is given to compatibility of pathology when assigning pa-tients to double rooms. Contagious patients are assigned to a room alone.
The model is formulated as follows:
Set of patients i ∈ PPP = 1, .., N
Set of days t ∈DDD = 1, .., T
Set of beds l ∈ BBB = 1, .., L
debuti earliest hospitilisation window of patient i;
tardi latest hospitilisation window of patient i;
Sexi gender of patient i;
Pi pathology of patienti;
Ci contagiousness of patient i;
LoSi Length of stay of patient i;
T2Ai rates of activity of patient i;
16

H cost of each day a patient is late being admitted;
HV very high value;
Ji beginning of hospitalisation period for patient i;
fini end of stay period for patient i such as fini = Ji + LoSi − 1;
Bed availability
Blt =
−2 if bed l is assigned to a man during period t;1 if bed l is available during period t;2 if bed l is assigned to a woman during period t
Bed location
Bll′ =
1 if bed l and l′ are in the same double room or if bed l is located
in a single room (l = l′);0 otherwise
If a bed is available within a certain pathology
PBlt =
Pi if bed l has previously been assigned to patient
i who has pathology Pi during period t;0 if bed l is available during period t
Allocation of a patient to a bed for a time frame
Xilt =
{1 if patient i is assigned to bed l during period t;0 otherwise
Patient assignment to bed
Ail =
{1 if patient i is assigned to bed l;0 otherwise
Transfer variable
REFUSi =
{0 if patient i is assigned to a bed;LoSi otherwise
17

The objective function aims to minimise costs incurred when a patient is ad-mitted late and the cost when a patient cannot be admitted.
Minz =∑i∈P
(Ji − debuti)×H +∑i∈P
(REFUSi/LoSi)× T2Ai (2.1)
Subject to: Constraints (2) and (3) ensure that the patient is assigned to onlyone period over entire Length of Stay.
∑i∈B
Xilt ≤ 1 ∀i ∈ P, ∀t ∈ D (2.2)
∑i∈P
Xilt ≤ 1 ∀l ∈ B, ∀t ∈ D (2.3)
Equations (4) and (5) ensure that a patient is allocated to a bed that is available.
∑l∈B
T∑t∈debuti
Xilt + REFUSi = LoSi ∀i ∈ P (2.4)
∑l∈B
T∑t∈debuti
(Xilt × (Blt − 2)× (Blt + 2))/(−3) = LoSi × Ait ∀i ∈ P (2.5)
The start and end times of Length of Stay is calculated by constraints (6) and (7).Equation (8) calculates the actual Length of Stay.∑
t∈B
t×Xilt + (1−Xilt)×HV ≥ Ji ∀i ∈ P∀t ∈ D (2.6)
∑t∈B
t×Xilt ≥ fini ∀i ∈ P∀t ∈ D (2.7)
Constraints (9) and (10) enforce that the starting of the patient’s stay is withinthe window in which he or she must be admitted. Emergency patients must beadmitted immediately.
fini = Ji + LoSi − 1 ∀i ∈ P (2.8)
Ji ≥ debuti ∀i ∈ P (2.9)
Ji ≥ tardi ∀i ∈ P (2.10)
18

Equations (11), (12), (13) and (14) ensure that patients can share a room withpatients of the same gender.∑
i∈PCi=2
(Xilt×Si−Xil′t×Si) ≥ −1 ∀l, l′ ∈ B, l 6= l′, ∀t ∈ D, ∀Mll′ = 1 (2.11)
∑i∈PCi=2
(Xil′t × Si)×Blt ≤ 2 ∀l, l′ ∈ B, l 6= l′,∀t ∈ D,∀Mll′ = 1 (2.12)
∑i∈PCi=2
(Xil′t × Si)×Blt ≥ −1 ∀l, l′ ∈ B, l 6= l′, ∀t ∈ D, ∀Mll′ = 1 (2.13)
∑i∈PCi=2
(Xilt × Pi −Xil′t× Pi) ≤ 1 +(1−
∑i∈PCi=2
Xil′t
)×HV (2.14)
∀l, l′ ∈ B, l 6= l′,∀t ∈ D,∀Mll′ = 1
Equations (15), (16), (17) and (18) ensure compatibility of pathologies.∑i∈PCi=2
(Xilt × Pi −Xil′t× Pi) ≥ −1−(1−
∑i∈PCi=2
Xilt
)×HV (2.15)
∀l, l′ ∈ B, l 6= l′,∀t ∈ D,∀Mll′ = 1
PBlt −∑
i∈PCi=2
Xil′t × Pi ≤ 1 +(1−
∑i∈PCi=2
Xil′t
)×HV (2.16)
∀l, l′ ∈ B, l 6= l′,∀t ∈ D,∀Mll′ = 1
PBlt −∑
i∈PCi=2
Xil′t × Pi ≥ −1−(1−
∑i∈PCi=2
Xil′t
)×HV (2.17)
∀l, l′ ∈ B, l 6= l′,∀t ∈ D,∀Mll′ = 1
Bl′t ×( ∑i∈PCi=1
Xilt +∑i∈P
Xil′t
)≤ 1 (2.18)
∀l, l′ ∈ B, l 6= l′,∀t ∈ D,∀Mll′ = 1
19
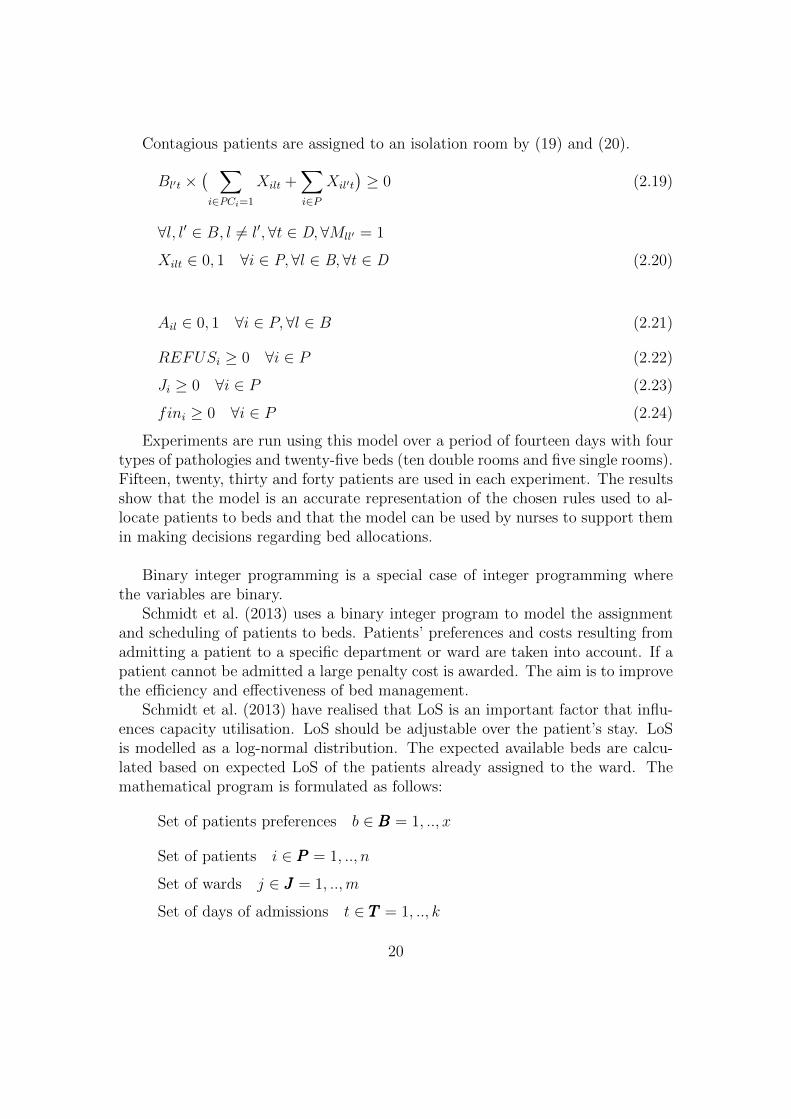
Contagious patients are assigned to an isolation room by (19) and (20).
Bl′t ×( ∑i∈PCi=1
Xilt +∑i∈P
Xil′t
)≥ 0 (2.19)
∀l, l′ ∈ B, l 6= l′,∀t ∈ D,∀Mll′ = 1
Xilt ∈ 0, 1 ∀i ∈ P,∀l ∈ B,∀t ∈ D (2.20)
Ail ∈ 0, 1 ∀i ∈ P, ∀l ∈ B (2.21)
REFUSi ≥ 0 ∀i ∈ P (2.22)
Ji ≥ 0 ∀i ∈ P (2.23)
fini ≥ 0 ∀i ∈ P (2.24)
Experiments are run using this model over a period of fourteen days with fourtypes of pathologies and twenty-five beds (ten double rooms and five single rooms).Fifteen, twenty, thirty and forty patients are used in each experiment. The resultsshow that the model is an accurate representation of the chosen rules used to al-locate patients to beds and that the model can be used by nurses to support themin making decisions regarding bed allocations.
Binary integer programming is a special case of integer programming wherethe variables are binary.
Schmidt et al. (2013) uses a binary integer program to model the assignmentand scheduling of patients to beds. Patients’ preferences and costs resulting fromadmitting a patient to a specific department or ward are taken into account. If apatient cannot be admitted a large penalty cost is awarded. The aim is to improvethe efficiency and effectiveness of bed management.
Schmidt et al. (2013) have realised that LoS is an important factor that influ-ences capacity utilisation. LoS should be adjustable over the patient’s stay. LoSis modelled as a log-normal distribution. The expected available beds are calcu-lated based on expected LoS of the patients already assigned to the ward. Themathematical program is formulated as follows:
Set of patients preferences b ∈ BBB = 1, .., x
Set of patients i ∈ PPP = 1, .., n
Set of wards j ∈ JJJ = 1, ..,m
Set of days of admissions t ∈ TTT = 1, .., k
20

Ujtb number of beds used in ward j, fulfilling patients prefernce b at date t;
Vi Length of stay of patient i;
E(Ujtb) Expected number of used beds in ward j, fulfilling patients prefernce b at date t ;
E(Vi) Expected length of stay of patient i;
Kjb Bed capacity of ward j, fulfilling patient prefernce b;
cjtb =E(U(jtb)
K(jb)Cost of assignment to ward j, fulfilling patients prefernce b at date t;
Ci Treating clinic of patient i;
mα affinity weight factor;
mβ ward usage weight factor;
mγ ward usage change weight factor;
mδ admission delay weight factor;
xijt =
{1 if patient i is admitted to ward j at time t)o otherwise
Mappings:
AFF : S ×K → [0, 1] Mapping of the affinities between wards and clinics;
Cons : P×B → P Mapping of the patients who demand the preference b ∈ B;
Cons : S×B → S Mapping of the wards satisfying patient preference b ∈ B;
Lmax : P → T ] Mapping of maximal LoS of a patient within the set P;
Prio : P → [0, 1, 2, 3] Mapping of patients to their treatment priority;
21

min z =∑b∈B
∑i∈Cons(P,b)
∑j∈Cons(s,b)
∑t∈T
xijt × (mα × AFF (Ci, j) (2.25)
(mα × AFF (Ci, j) (2.26)
+mβ × (∑m=t
[E(Vi)]cj,m,b) (2.27)
+mγ × (∑m=t
[E(Vi)] | cj,m+1,b − cj,m,b |) (2.28)
+mδ ×1
1 + Prio(i)× (1− 1
1 +√t)) (2.29)
The objective function aims to minimise assignment costs. These costs includes thecost when a patient cannot be assigned to the correct ward, the cost of the patientbeing allocated to the ward, the cost of changing wards and the cost incurred fordelay in admittance. Some of the constraints are:∑
i∈Cons(P,b)
∑j∈S
∑t∈T
xijt =| Cons(P, b) ∀b ∈ B (2.30)
Constraint (2.30) ensures that an admission date and ward will be assigned to eachpatient.∑
j∈S
∑t∈T
xjit ≤ 1 ∀b ∈ B ∀i ∈ Cons(p, b) (2.31)
Constraint (2.31) no more than one admission date and one ward can be assignedto each patient.∑i∈Cons(P,b)
∑t1=max(0,t−Lmax
xijt1 ≤ Kjb−E(Ujtb) ∀b ∈ B ∀j ∈ Cons(S, b) ∀t ∈ T
(2.32)
Equation (3.31) ensures that the capacity of the ward will never be exceeded.Schmidt et al. (2013) concludes that there exists a great need for decision-
support tools when bed allocations are made. The exact solution is feasible but itmay take a long time to solve the problem.
Demeester et al. (2010) examine two methods that assist bed managers inallocating a patient to the appropriate bed and satisfying as much of the patient’sneeds as possible. The first is an integer linear program applied to a generated setof data and the second method is a heuristic approach. The heuristic approach isdiscussed later in this literature review.
22

Length of Stay depends on the sub-specialism a patient is assigned to and isgenerated randomly based on a normal distribution. The patient’s needs, such asroom preference, oxygen requirements and telemetry, are taken into considerationwhen allocation is done. The allocation rules that are taken into consideration by(Demeester et al., 2010) are divided into soft and hard constraints.
Hard constraints are rules that have to be adhered to in order to find a feasiblesolution.
• The room must be available for the duration of the patients stay.
• Length of Stay is a fixed period that can only be amended by the responsibledoctor.
• Different patients cannot be assigned to the same bed for the same time slot.
• Male and female patients may not share the same room.
• Patients are assigned to departments depending on their age.
• Medical treatment requires that the patient is assigned to a room with specialequipment.
• Quarantine of patients is allowed.
Soft constraints do not have to be satisfied when allocation is done, but thequality of the solution will improve when as many as possible are satisfied.
• Patients have the choice of a single room, twin room or ward.
• Patients are allocated to the correct department.
• Unplanned transfers to other wards should be kept to a minimum.
The model uses a generated set of data. The model has six departments whichcan accommodate patients from one major specialism and two minor specialisms.Every department has between twenty and thirty rooms. In each department thereare at most five single rooms, five to ten double rooms, and the remaining roomshave four beds.
The patients are randomly assigned to a specialism and room preference.Length of Stay is generated based on a normal distribution with a mean of fiveand standard deviation of three. Sixty new patients are generated for each newday of the planning period.
Unfortunately, the full model is not included in the published article. The ob-jective function aims to minimise the penalty incurred when patients are assignedto the wrong room and for each transfer.
23

The integer linear program did not find a feasible solution within a satisfactoryamount of time. The bed assignment application should take very little time incomputing a solution. For this reason, this method is not a feasible solution andtherefore the heuristic method is considered in an attempt to find a better solution.
2.2 Heuristics
A heuristic is a problem-solving technique which gives a solution that is not guar-anteed to be optimal (Winston and Venkataramanan, 2003). This technique isused when classic methods fail to find an exact solution, exhaustive searches areimpractical or a satisfactory answer is required in a short frame of time.
The second method Demeester et al. (2010) used is a tabu search algorithmhybridised with a token-ring approach. Tabu search is a meta-heuristic developedby Glover in 1986 (Winston and Venkataramanan, 2003). This heuristic useslong-term and short-term memory to avoid entrainment in cycles by forbiddingcertain moves. The next iteration will be moved away from points previously used.The short-term memory lets the heuristic move away from local optimum, whilstthe long-term memory allows searches to be conducted in the most promisingneighbourhood (Demeester et al., 2010). The memory is created by recordingprevious moves in a tabu list. Initially this algorithm makes a course examinationof the solution space. This step is called diversification. Candidate locations arethen identified and more focused searches are started to produce local solutions.This step is called intensification. If a better solution is found, the list is shortened.On the other hand, if a better solution is not found the list is lengthened to escapelocal optimum.
The token ring algorithm creates a logical ring in which each neighbourhood isassigned a position in the ring (New Mexico State University, 2014). Each neigh-bourhood knows which neighbourhood is next in line. The ring is initialised bygiving neighbourhood 0 a token. This token is then circulated. When a neighbour-hood receives a token, it checks whether the process can go into a critical region,in this case, whether the solution is approaching a better solution than previouslyrecorded in the tabu list. If so, it enters the region and iterates until no moreimproving moves can be made. The token then exits the neighbourhood. No otherneighbourhood can use the same token to enter a critical region (Demeester et al.,2010). When the final neighbourhood cannot be improved, the algorithm iteratesthrough the first neighbourhood again.
The solution to this approach is given in a two-dimensional matrix. Each rowrepresents a bed in a department and each column represents a night. If a patientis placed within the matrix it is shown as a 1. The number of nights is the numberof nights the patient will be staying in the hospital. Each matrix is a department
24

and the collection of matrices represents the hospital (Demeester et al., 2010). Asmall hospital of three departments is experimentally created.
A patient is modelled as a set of objects called a ”patient stay part”. Eachobject is a night’s stay. Patients are assigned to beds according to the hard andsoft constraints mentioned previously.
Demeester et al. (2010) describe the neighbourhoods moves that are consideredin this study as follows:
1. Swap-beds neighbourhood: In this neighbourhood, only patient stay partscan be moved or exchanged in the same department. Patients can onlybe moved to different rows (beds) and not different columns (nights). Thealgorithm searches for any empty matrix element in the same column andplaces the patient stay part into it. the matrix contains only 1/0 values.
2. Move-patient-to-another-department neighbourhood: Different departmentscan serve the same specialism. A patient can be moved to another depart-ment with the same specialism if the current department is full. At the startof an iteration, the algorithm selects a department with the most patientsand moves one of the patients to another department. Yet again, only thebed can be influenced by the move, while the nights cannot be influenced.
3. Move-patient-to-same-department neighbourhood: In this neighbourhood allthe patient stay parts are moved to empty beds in the same department.
4. Move-best-patient-to-another-department neighbourhood: As in the secondneighbourhood, a patient is selected and moved to another department. Butit chooses the best patient to move from a list, rather than selecting thepatient randomly.
Various experiments are run using this method, comparing the results with theresults found using a tabu search algorithm hybridised with a variable neighbour-hood decent. The two algorithms work on the same principles, except the timewhen the algorithm moves to another neighbourhood differs. The variable neigh-bourhood algorithm goes to a new neighbourhood when one non-improving move ismade. The token ring approach changes when a certain number of non-improvingmoves are made.
The tabu search algorithm hybridised with a token ring continuously producedbetter results. Demeester et al. (2010) finds that the algorithm produces fast andsatisfactory results. It can successfully be used to assist bed managers, balancepatients across the different departments and improve the hospital’s performancein terms of patients’ waiting list and bed utilisation. A shortcoming of this studyis that emergency patient admissions and ICU Departments are not considered.
25

The existing model’s neighbourhoods should also be improved to allow patients tobe moved in a time dimension to simulate rescheduling of elective patients.
2.3 Simulation modelling
Simulation modelling is the reproduction of a dynamic real world process to cre-ate a model that can be experimented with to depict how the system will reactto changes. Different software tools have been created to assist in creating thesemodels, such as ARENA, SIMIO, Siemens Tecnomatix Plantsimulation and Any-Logic. Each of these software packages has been developed for a certain goal. Themost common goal is the improvement of production systems. Simulation can beused to depict any system and to study the influence of certain decisions on thissystem. Different simulation methods exist. Two popular methods are discreteevent simulation and agent based simulation.
Simulation modelling is used to show that reserving some beds in an ICU Wardfor exclusive use of elective surgeries will minimise the number of surgeries thathave to be cancelled because of emergency admissions (Seung-Chul et al., 2000).This model serves as a decision support model for bed managers. Two reservationtechniques are tested with the simulation model to generate data for evaluation ofperformance by criteria based on ICU and other patients’ requirements. The twomethods that are tested is a dependency unit attached to the surgery departmentand reserving some beds in the ICU for the exclusive use of elective patients.Using simulation modelling, this model is given the flexibility to be able to transferpatients from an ICU to another ward when a patient requires allocation that isa higher medical priority, given that the patient being transferred is medicallystable.
Seung-Chul et al. (2000) found that in a typical public hospital in Hong Kongpatient flow into the adult ICU comes from four sources, as depicted in the follow-ing figure 2.1.
26

Figure 2.1: General model of an ICU (Seung-Chul et al., 2000)
When an ICU patient is discharged from the ICU, he is rarely immediately alsodischarged from the hospital but rather transferred to a High Care Unit. Fromthe High Care Unit a patient moves to a ward, from where he or she is usuallydischarged.
Seung-Chul et al. (2000) uses the following process in the decision to admit apatient from surgery elective patients to the ICU:
Figure 2.2: General process for deciding whether to admit a patient to the ICU(Seung-Chul et al., 2000)
27

Four reservation strategies are tested using the flexible bed allocation method(Seung-Chul et al., 2000). The first strategy represents the current system asa control for the outputs of the other strategies. Strategy 2 experiments withreserving of different number of beds for exclusive use by elective surgery patients.The other strategies aim to exploit the fact that elective surgeries are seldomscheduled for weekends. This allows patients who do not qualify for use of thereserved beds to be allocated to these beds over weekends when unreserved bedsare not available.
Data collected over six months are used in the model (Seung-Chul et al., 2000).Some of the variables obtained from the data include arrival rate, survival rate,admission rates and length of stay. Distributions are assigned to each variable.
To validate the model, the simulation is run for an experimental period oftwenty years. The data obtained from the model correspond with the actual data(Seung-Chul et al., 2000). The system performance is measured by seven outputs.These outputs are bed utilisation, average number and average time of patientswaiting in system and queue, number of surgeries cancelled and number of patientsadmitted.
The results of the simulation model shows that the dedicated ICU does notoutperform the current system. The dedicated ICU only reduces the number ofcancelled surgeries but causes other services to perform worse (Seung-Chul et al.,2000).
An experiment is created to test the impact of the flexible bed allocation tech-nique. The strategies are tested by increasing the number of reserved beds fromone to five in increments of one (Seung-Chul et al., 2000). It is found that threereserved beds significantly decrease the number of cancelled elective surgeries withlittle impact on the queue length. The three-bed reservation technique is used tocompare the results of the four strategies. Bed utilisation for the four strategiesis slightly higher than the current system and the number of cancelled surgeries ismarkedly lower. None of the strategies is markedly better than the other strategies.
Seung-Chul et al. (2000) concludes that none of the tested techniques is adominant solution to the problem. This study identifies some positive aspects forusing simulation modelling in the attempt to solve the bed allocation problem:
• Different experiments can easily be created and compared.
• No hospital ward will be empty at the start of an experiment. The simulationmodel allows a warm-up period for the system, where some beds and wardsare filled to be able to obtain realistic results.
• The simulation model can be run for a longer simulation time.
• The required flexibility is lent to the model in terms of Length of Stay, arrivalrates and possible demise of patients.
28

2.4 Agent based simulation modelling
Agent based simulation modelling is a ”decentralised, individual-centric” approachto modelling (AnyLogic, 2014). Other simulation modelling techniques are systemfocused. An agent can be people, products, vehicles or anything that performsactivities and has certain behaviours. These agents are placed in an environmentand are connected to other agents. The simulation will then depict the individualbehaviour and interactions between the agents.
Paulussen et al. (2006) uses an agent-based approach to lend the requiredflexibility to patient scheduling in ancillary units. An ancillary unit is a supportunit where patients can go for treatments or tests. Patient’s Length of Stay inhospitals vary with the type of disease, duration of treatments and as complicationsarise. An agent-based approach allows each object to be represented by a singleagent with its own goal and the agents can react with the needed flexibility tochanges. The objects in this study are the resources in ancillary units and thepatients. The changes that can occur are due to new information that is availableon the patient’s health whether it is a speedy improvement or a decline in health.The goal of the patients is to minimize their length of stay and the resources aimto minimize their idle time.
The patients and resources are modelled as autonomous agents (Paulussenet al., 2006). This means that the patients and resources have the freedom to actindependently. In this model the economic concept of mutual selection is used toassign patients to resource time slots. Mutual selection occurs if the patient tries toobtain the required resources and the resources attempt to provide services to themost deserving patient, based on certain criteria. An auction-based coordinationmechanism is created to evaluate which patients’ bid is the highest for a time slot.A utility function is used by the patient agents to measure what the value of atime slot is and to generate a bid.
A utility function is a mathematical function that ranks alternatives accordingto the patient’s preferences (Paulussen et al., 2006). The preferences are formed tominimise the patient’s Length of Stay or to improve their health. The more criticalthe patient’s health becomes, the longer the patient will stay in the hospital orthe higher their priority class will become. Therefore the patient’s bid will becomehigher. The resource must then give the time slot to the highest bid (sickestpatient). This is the basic principle for an auction-based coordination mechanism.
Paulussen et al. (2006) use various experiments to evaluate and benchmark theperformance of the multi-agent system. The hospital size, durations of treatmentsand probability for an emergency case are varied to test the reaction of the modeland are compared to the results obtained from a model using the priority rulestrategy currently used in hospitals. The multi-agent model improves the currentpatient schedule practice in hospitals and provides the required flexibility.
29

Agent based simulation has all the positive aspects of simulation modellingbut is focused on the individual instead of the system. Hospitals must serve eachpatient as an individual and not as a system. Agent based simulation will betterallocate patients to beds because each patient’s needs and characteristics can betaken into account as well as the characteristics of each bed. Agent based simula-tion also lends the model the required flexibility. Each patient’s Length of Stay candiffer and can react as new information on the person’s health becomes available.The model can also react in a proactive manner to disturbances, such as an influxin emergency patients. When creating an agent based simulation model, cautionmust be given when the bed agent is created. The bed cannot make decisions andthe model must depict reality as closely as possible.
Agent based simulation will be used in the next section to demonstrate whatthe influence of allocation rules will be on the system, because each patient canbe modelled as an autonomous object with the ability to react to its environment.This method of simulation will also make it easier to collect and compare datafrom multiple simulation iterations.
30

Chapter 3
Studying Rule-Based Components
In this section, basic allocation rules are tested on a small scale model with sixbeds to establish what the influence of the individual rule is on the system withoutadded noise or influence of other rules. The basic models are created in Anylogicusing agent based simulation.
3.1 Basic model
3.1.1 Agents
In the basic model there exist four types of agents: main, patients, beds, andreception. Each of these agents has their own characteristics and behaviours.
Main
Main, as seen in figure 3.1, is the principle view of the model where the layout ofthe beds and movement of patients can be observed.
Figure 3.1: Main agent forming the principle view of the model
31

Figure 3.2: Main agent initiating variables and parameters
Figure 3.2 shows the initiating variables and parameters of the model. Col-lection 1 creates beds at the start of the simulation run and places them in thelocations specified in the function. All conceptual models will have six beds. Col-lection 2 is an event that adds patients throughout the model to simulate patientsarriving at the hospital. For the conceptual models it is assumed that patients’inter arrival time is exponentially distributed with a mean of 8 hours. Patientsarrive at the entrance and are then sent to different locations. The flow of patientswill be explained in the patient agent. Collection 3 includes variables that collectsdata on patients according to their assignment status. These variables will be usedto compare the outputs of the different conceptual models.
Beds
Figure 3.3 illustrates the bed agent’s logic. The bed can either be occupied orunoccupied. When a patient is allocated to the bed, the patient identificationnumber is stored in patientId variable. The bed also has parameters such asgender and pathology. These parameters will be used if the gender or pathology ofthe patient is used to allocate a patient to a bed with similar gender or pathology.
32

Figure 3.3: State chart and parameters of the bed agent
Figure 3.4 shows the animation of the beds. When a patient is assigned to abed, the status of the bed changes from unoccupied to occupied. The colour ofthe circle above the bed changes from green for unoccupied to red for occupied.Similarly, the colour changes from red for occupied to green for unoccupied whenthe patient is discharged.
Figure 3.4: Bed animation showing occupied and unoccupied beds
33

Patients
The patient agents have the characteristics shown in figure 3.5. These parametersare used to allocate patients to the appropriate beds.
Figure 3.5: Patient agent characteristics
Figure 3.6 illustrates the patient’s journey through the hospital. Patients arriveat the reception with an exponential inter arrival time with a mean of 8 hours. Thepatients queue for reception. When the patient is first in line, reception searchesthrough the available beds to find a bed matching the patient’s criteria. If there isa bed available the patient is admitted and sent to the bed. If no bed is available,the patient is shown away. In the conceptual models, the patients cannot wait fora bed to become available.
Once admitted, the patient stays in the hospital for a time period known asthe LoS. The LoS is modelled as a Weibull distribution (gamma = 2.5, beta =2, minimum = 0). Using these parameters for the Weibull distribution ensuresthat on average the patients are in the hospital for 2.5 days. The patient caneither recover fully or can die due to complications. The probability that a patientwill die is 10%. If the patient’s stay at the hospital is complete, the patient isdischarged and the bed becomes available again.
34

Figure 3.6: Basic patient flow
When the patient reaches the reception desk the model searches through allthe beds to find an available bed that matches the patient’s criteria. The basicsearch function is as follows:
Result: Patient assigned to bedfor beds 1 to 6 do
integer i = number of beds;if bed is unoccupied and patient is not assigned to bed then
bed is now occupied;patient is assigned;record which bed is assigned to patient in variable bedId;record which patient is assigned to bed in variable patientId;
send a message to patient state chart to change state;send a message to bed state chart to change state from unoccupiedto occupied;break function;
endif All beds are occupied and patient is still not assigned then
send a message to patient state chart that there are no bedsavailable;
end
endAlgorithm 1: Basic find bed function
35

Data collection and model comparison
The conceptual models will be compared on the basis of the number of patientsthat were allocated to beds during the simulation run. To ensure that the resultscan be compared, the following standards will be maintained:
• Number of beds: 6
• Run time: 500 units of time
• To be able to compare results the of the rules a fixed seed of 2 will be usedin each experiment. Rhis will ensure that any difference in the results aredue to the influence of the rules and not the influence of randomness on themodel. As a further experiment each rule will also be run using a randomseed value to test how the rule set will react with fluctuation of arrivals anddifferent Lengths of Stay.
• Length of Stay distribution will be the same for all models
• Patients will arrive with an inter arrival time exponentially distributed witha mean of 8 hours
• Probability of demise will be 10% for all models
• Only one conceptual rule will be tested per model
• Number of iterations: 20
3.2 Conceptual models
3.2.1 First come, first served
This model will be based on the basic conceptual model as described above. Noregard is given to the criticality of patients, pathology, age, or gender. The patientwho arrives first is helped first. If a bed is available the patient is allocated to thebed, otherwise the patient cannot be admitted and is shown away.
Results
Figure 3.7 shows the typical results obtained during a simulation run from Any-Logic. From the figure it can be seen that data are collected on number of patientsallocated, number of deaths, and number of patients shown away. This data, aswell as total number of patients created, are used to analyse how well the rulefunctions. From the figure 3.7 it can be seen that on average there are between
36

one and two patients assigned to the hospital at any given time. It rarely occursthat there is a shortage of beds and patients have to be shown away.
Figure 3.7: Typical patient statistics during a single simulation run
Table 3.1 show the results obtained from the fixed seed model and table 3.2shows the average and standard deviations of the results obtained from the firstcome, first served rule using random seed. Figure 3.8 indicates all data collectedon a histogram for all twenty runs using random seed.
Number of patients ResultArrived at Hospital 71Admitted 36Number referred to anotherhospital
35
Table 3.1: Results obtained from twenty simulation runs for first come, first servedrule using fixed seed
Variable Average Standard de-viation
Number arrived at hospital 63.7 7.07Number admitted 41.60 2.50Number of deaths 3.75 2.02Number referred to anotherhospital
22.10 5.74
Table 3.2: Results obtained from twenty iterations of first come, first served rulewith a random seed
On average, 65% of patients are assigned to beds and 35% are shown away. Ifon average 41.6 patients are assigned to 6 beds, it means that each bed has an
37
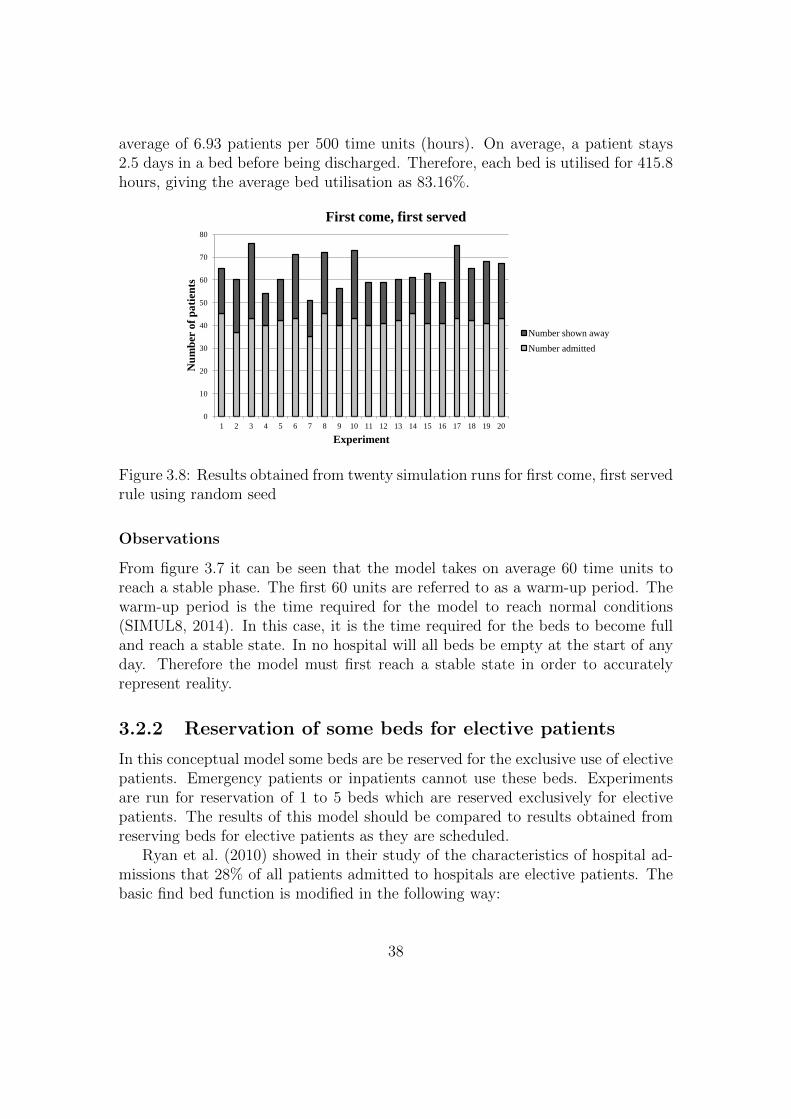
average of 6.93 patients per 500 time units (hours). On average, a patient stays2.5 days in a bed before being discharged. Therefore, each bed is utilised for 415.8hours, giving the average bed utilisation as 83.16%.
0
10
20
30
40
50
60
70
80
1 2 3 4 5 6 7 8 9 10 11 12 13 14 15 16 17 18 19 20
Nu
mb
er o
f p
ati
ents
Experiment
First come, first served
Number shown away
Number admitted
Figure 3.8: Results obtained from twenty simulation runs for first come, first servedrule using random seed
Observations
From figure 3.7 it can be seen that the model takes on average 60 time units toreach a stable phase. The first 60 units are referred to as a warm-up period. Thewarm-up period is the time required for the model to reach normal conditions(SIMUL8, 2014). In this case, it is the time required for the beds to become fulland reach a stable state. In no hospital will all beds be empty at the start of anyday. Therefore the model must first reach a stable state in order to accuratelyrepresent reality.
3.2.2 Reservation of some beds for elective patients
In this conceptual model some beds are be reserved for the exclusive use of electivepatients. Emergency patients or inpatients cannot use these beds. Experimentsare run for reservation of 1 to 5 beds which are reserved exclusively for electivepatients. The results of this model should be compared to results obtained fromreserving beds for elective patients as they are scheduled.
Ryan et al. (2010) showed in their study of the characteristics of hospital ad-missions that 28% of all patients admitted to hospitals are elective patients. Thebasic find bed function is modified in the following way:
38

Result: Patient assigned to bedif Patient is elective then
for beds 1 to number of elective beds doif bed is unoccupied and patient is not assigned to a bed then
bed is now occupied by patient;patient is assigned to bed;record which bed is assigned to patient in variable bedId;record which patient is assigned to bed in variable patientId;
send a message to patient state chart to change state;send a message to bed state chart to change state fromunoccupied to occupied;break function;
endif All elective beds are occupied and patient is still not assigned then
send a message to patient state chart that there are no bedsavailable;
end
end
endif Patient is not elective then
for beds al non-elective beds doif bed is unoccupied and patient is not assigned to a bed then
bed is now occupied;patient is assigned;record which bed is assigned to patient in variable bedId;record which patient is assigned to bed in variable patientId;
send a message to patient state chart to change state;send a message to bed state chart to change state fromunoccupied to occupied;break function;
endif All non-elective beds are occupied and patient is still not assignedthen
send a message to patient state chart that there are no bedsavailable;
end
end
endAlgorithm 2: Basic find bed function modified to allocate patients accordingto whether patient is an elective patient
39

Example of the results obtained from the experiments
Table 3.3 shows the average and standard deviations of the results obtained fromthe model considering reservation of a fixed amount of beds for elective patientswhen allocations are done. In this model two beds are reserved for exclusive useby elective patients. Figure 3.9 indicates all data collected on a histogram for thisexperiment’s twenty runs. This is a representation of the type of data collected.The results for all the experiments are shown in 3.10
Variable Average Standard de-viation
Number arrived 63.80 8.22Number admitted 36.60 3.08Number of deaths 3.10 2.03Number referred to anotherhospital
27.20 7.14
Table 3.3: Results obtained from twenty simulation runs for model consideringreservation of beds for elective patients using random seed
On average, 57.37% of patients are assigned to beds and 42.63% are shownaway. Of the 36.60 patients assigned to beds, on average 10.50 are elective patientsand 26.10 are non-elective patients. Table 3.4 indicates the average bed occupancyfor the 500 hours and the bed utilisation for reservation of elective beds allocationsrule.
Patient No. of beds Bedoccupancy forrun
Bedutilisation(hours)
Bedutilisation(%)
Elective 2 5.25 315 63Non-elective 4 6.53 391.5 78.3
Table 3.4: Bed utilisation for reservation of some beds for elective patients usingrandom seed
40

0.00
10.00
20.00
30.00
40.00
1 reserve
Nu
mb
er
of
pat
ien
ts
0
10
20
30
40
50
60
70
80
90
1 2 3 4 5 6 7 8 9 10 11 12 13 14 15 16 17 18 19 20
Nu
mb
er o
f p
ati
ents
Experiment
Reservation of some beds for exclusive use by elective
patients
Number shown away
Number admitted
Figure 3.9: Results obtained from twenty simulation runs for model consideringreservation of beds for elective patients using random seed
Results from all experiments
0.00
10.00
20.00
30.00
40.00
50.00
60.00
70.00
1 reserve 2 reserve 3 reserve 4 reserve 5 reserve
Nu
mb
er o
f p
ati
ents
Number of beds reserved
Results of elective reservation rule
Number arrived
Number shown away
Number admitted
Linear (Number admitted)
Figure 3.10: Results obtained from all experiments for the model considering reser-vation of beds for elective patients using random seed
41

Number of patients Reserve 1 Reserve 2 Reserve 3 Reserve 4 Reserve 5Arrived at Hospital 71 71 71 71 71Admitted 28 25 19 16 10Number referred toanother hospital
22 25 32 39 43
Table 3.5: Results obtained from twenty simulation runs for reservation of somebeds for the exclusive use of elective patients using fixed seed
Discussing and conclusion
The results of the experiments, as can be seen in figure 3.10, seem to be very close.Reservation of one or two beds gives the best results. Reservation of one bed showsaway the least number of patients, whilst reservation of two beds assigns the mostpatients.
On closer inspection of all the results reservation of one bed allocates 5.70elective patients on average and 29.85 non-elective patients of the 35.55 patientsadmitted. Reservation of two beds assigns 10.5 elective patients and 26.10 non-elective patients of the 36.60 patients admitted.
The results from all experiments with a fixed seed shown in table 3.5 indicatethat the number of patients that can be admitted to the hospital declines as thenumber of reserved beds inclines. The best reservation techniques are to reserveone bed for the exclusive use of elective patients.
A hospital’s objectives have to be considered when choosing whether to reserve16.67% or 33.33% of its beds for elective patients. If the hospital receives moreemergency patients, management may choose to reserve fewer beds to ensure morebeds are available for emergency patients and fewer surgeries are cancelled. Thehospital will also consider the type of ward when selecting this technique. It maybe more applicable to a surgical ward.
3.2.3 Reservation of beds as elective patients are scheduled
This model will reserve beds for scheduled arrival of elective patients. It willtake into consideration when a bed will become available and when a patient isscheduled to be admitted. If the release time of the bed is before the arrival timeof the patient, the bed is reserved for the patients arrival and no patient can beallocated to this bed.
This occurrence is modelled in AnyLogic by creating two types of patients:elective and non-elective. The elective patients are created with an add patientevent as in the base case model but is not admitted or shown away when thepatient arrives. On creation, an elective patient requests reservation of a bed for
42

his or her scheduled arrival. The modified find bed function searches through allthe beds to find a bed that will be available for the scheduled arrival date. If abed is available it is reserved for the arrival of the patient. If no bed is availablefor the scheduled arrival, the patient is shown away.
A bed may be occupied when it is reserved, but once reserved, no patient canbe allocated to it. The patient must therefore be scheduled to arrive within a dayof creation, otherwise all beds will be reserved and no patients can be admitted.As in the fixed reservation technique, elective patients will be 28% of all patients.
The modified find bed algorithm for elective patients:Result: Patient assigned to bedif Patient is elective then
for beds 1 to 6 doif bed is unoccupied at scheduled arrival time and patient is notassigned to bed then
bed is reserved;patient is assigned to bed;record which bed is assigned to patient in variable bedId;record patient ID in resevationID variable;
send a message to patient state chart to change state fromwaiting for a bed to scheduled arrival;send a message to bed state chart to change state to reserved;break function;
endif All beds are occupied at scheduled arrival time and patient is stillnot assigned then
send a message to patient state chart that there are no bedsavailable;
end
end
endAlgorithm 3: Modified find bed function to search for a bed that is availableat scheduled arrival time of elective patient
43

Results from all experiments
Table 3.6 shows the results for the model considering reservations of beds accordingto patient schedule using a fixed seed. Table 3.7 shows the average and standarddeviations of the results obtained from the model using a random seed. Figure3.11 indicates all data collected on a histogram for this experiment’s twenty runs.
Number of patients ResultArrived at Hospital 71Admitted 41Number referred to anotherhospital
19
Table 3.6: Results obtained from twenty simulation runs for the model consideringreservation of beds using fixed seed
Variable Average Standard de-viation
Number arrived 61.50 7.78Number admitted 47.05 4.88Number of deaths 3.20 2.07Number referred to anotherhospital
13.15 6.48
Table 3.7: Results obtained from twenty simulation runs for model consideringreservation of beds using random seed
On average, 76.5% of patients are assigned to beds and 23.5% are shown away.Of the 56.15 patients assigned to beds, on average 6.00 are elective and 41.05 arenon-elective. During the experiment, each bed had an average of 7.84 patients. Ifeach patient stays for 2.5 days the beds are utilised for 470,5 hours or 94.1% ofthe time.
44

0
10
20
30
40
50
60
70
80
90
1 2 3 4 5 6 7 8 9 10 11 12 13 14 15 16 17 18 19 20
Nu
mb
er o
f p
ati
ents
Simulation run
Allocations considering bed reservations
Number shown away
Number admitted
Figure 3.11: Results obtained from twenty simulation runs for model consideringreservation of beds using random seed
Discussion and conclusion
The results of this model indicate that bed utilisation is very high, with each bedbeing occupied 94.1% of the time. The number of patients assigned is also high.From 3.11 it can be seen that the number of patients assigned and shown awayas a percentage of all the patients created remains relatively constant for eachexperiment.
3.2.4 Allocation according to patient characteristics: Age
This model will take into consideration the age of the patient when allocations aredone. Patient age is calculated with a gamma distribution with shape parameterof 11 and scale parameter of 2 (Statistics South Africa, 2013). Adults are patientswho are older than thirteen years. Patients dedicated to the children’s beds areyounger than thirteen years. The basic find bed algorithm is modified in diefollowing manner:
45

Result: Patient assigned to bedif Patient is older than 13 years then
for beds 1 to 4 doif bed is unoccupied and patient is not assigned to bed then
bed is now occupied;patient is assigned;record which bed is assigned to patient in variable bedId;record which patient is assigned to bed in variable patientId;
send a message to patient state chart to change state;send a message to bed state chart to change state fromunoccupied to occupied;break function;
endif All adult beds are occupied and patient is still not assigned then
send a message to patient state chart that there are no bedsavailable;
end
end
endif Patient is younger than 13 years then
for beds 5 doif bed is unoccupied and patient is not assigned to bed then
bed is now occupied;patient is assigned;record which bed is assigned to patient in variable bedId;record which patient is assigned to bed in variable patientId;
send a message to patient state chart to change state;send a message to bed state chart to change state fromunoccupied to occupied;break function;
endif All paediatric beds are occupied and patient is still not assignedthen
send a message to patient state chart that there are no bedsavailable;
end
end
endAlgorithm 4: Basic find bed function modified to allocate patients accordingto age
46

The number of beds dedicated to each age group will be varied to estimatewhat number of beds allocated to each group will give the best answers. Theexperiments are run as follows:
• Adults: 6 beds. Children: 0 bed
• Adults: 5 beds. Children: 1 bed
• Adults: 4 beds. Children: 2 beds
• Adults: 3 beds. Children: 3 beds
• Adults: 2 beds. Children: 4 beds
• Adults: 1 beds. Children: 5 beds
• Adults: 0 beds. Children: 1 beds
Example of the results gathered from the simulation model
Table 3.8 shows the average and standard deviations of the results obtained fromthe model, considering age when allocations of patients are done. In this model,adults have 5 beds and children have 1 bed. Figure ?? indicates all data collectedon a histogram for this experiment’s twenty runs. This is a representation of thetype of data collected. The results for all the experiments are shown in 3.12.
Variable Average Standard de-viation
Number arrived 60.55 6.72Number admitted 37.85 2.83Number of deaths 3.85 2.03Number referred to anotherhospital
22.70 5.81
Table 3.8: Results obtained from twenty simulation runs for model considering ageas a rule using random seed
On average, 54% of patients are assigned to beds and 46% are shown away.Of the 33.5 patients assigned to beds, on average 28.70 are adults and 4.80 arechildren. Table 3.9 indicates the average bed occupancy for the 500 hours and thebed utilisation for age based allocations.
47

Patient No. of beds Bedoccupancy forrun
Bedutilisation(hours)
Bedutilisation(%)
Adult 4 7.18 430.8 86.16Children 2 2.4 144 28.8
Table 3.9: Bed utilisation for age based allocations using random seed
0
10
20
30
40
50
60
70
80
1 2 3 4 5 6 7 8 9 10 11 12 13 14 15 16 17 18 19 20
Nu
mb
er o
f p
ati
ents
Simulation run
Allocations considering age
Number shown away
Number assigned
Figure 3.12: Results obtained from twenty simulation runs for model consideringage as a rule using random seed
Results from all experiments
Number ofpatients
6 Adult,0 Child
5 Adult,1 Child
4 Adult,2 Child
3 Adult,3 Child
2 Adult,4 Child
1 Adult,5 Child
0 Adult,6 Child
Arrived atHospital
71 71 71 71 71 71 71
Admitted 38 34 32 25 19 12 5Numberreferred
33 37 39 46 52 59 66
Table 3.10: Results obtained from twenty simulation runs for model consideringage as rule using fixed seed
48

0.00
10.00
20.00
30.00
40.00
50.00
60.00
70.00
6A,0C 5A,1C 4A,2C 3A,3C 2A.4C 1A,5C 0A,6C
Nu
mb
er o
f p
ati
ents
Experiment
Results of allocation based on age
Number arrived
Number admitted
Number Shown away
Linear (Number
admitted)
Figure 3.13: Results obtained from all experiments for the model considering ageas allocation rule using random seed
Discussion and conclusion
From figure 3.13 and table 3.10 it can be seen that the number of patients assignedto a bed decreases as the number of children’s beds increases. The highest amountof allocation occurs when there are no children’s beds. This result may seem logicalbecause children are a small amount of the total population and therefore hospitalswill have more adult patients.
Having no children’s beds is not a practical solution, seeing that hospitals mustbe able to accommodate children in the paediatric wards. The best result is tohave five adult beds and one children’s bed.
3.2.5 Allocation according to patient characteristics: Pa-tient criticality
This model will take into consideration the criticality of the patient when alloca-tions are done. A criticality of 1 means that a patient has to be admitted to thehospital within the next 4 to 6 hours. The patient is kept in a stable condition inthe Emergency Department until a bed can be found. A criticality of 2 means thepatient must be admitted within the next 7 to 24 hours and a criticality of 3 canbe admitted after 24 hours.
When the patients arrive at the hospital, they are placed in a queue to waitfor an open bed. Patients with a criticality of 1 go to the front of the queue.Patients with a criticality of 2 are placed behind criticality 1 patients in the row,
49

and criticality 3 patients can be allocated only if there are no criticality 1s and 2swaiting for a bed.
In AnyLogic the find bed basic function is moved to the reception agent and alinked list collection is created to simulate a queue. When a patient arrives, theyare placed in the queue as described above.
Results
Table 3.11 show the results for the model using fixed seed and table 3.12 shows theaverage and standard deviations of the results obtained from the model consid-ering patient criticality when allocations of patients have been done. Figure 3.14indicates all data collected on a histogram for all twenty runs.
Number of patients ResultArrived at Hospital 71Admitted 36Number referred to anotherhospital
35
Table 3.11: Results obtained from twenty simulation runs for the model consideringpatient criticality using fixed seed
Variable Average Standard de-viation
Number arrived 63.30 7.92Number admitted 40.50 3.75Number of deaths 3.75 2.00Number shown away 22.80 7.13
Table 3.12: Results obtained from twenty simulation runs for model consideringpatient criticality as allocation rule using random seed
On average, 63.98% of patients are assigned to beds and 36.02% are shownaway. Of the 40.50 patients assigned to beds, on average 7.90 have a criticalityof 1. Bed occupancy for this rule is 6.75 and the beds are utilised for 405 hours(81%).
50

0
10
20
30
40
50
60
70
80
1 2 3 4 5 6 7 8 9 10 11 12 13 14 15 16 17 18 19 20
Nu
mb
er o
f p
ati
ents
Simulation run
Allocations considering criticality
Number shown away
Number admitted
Figure 3.14: Results obtained from twenty simulation runs for model consideringpatient criticality as allocation rule using random seed
Observations
This rule is used very widely in hospitals. It is imperative that the most criticalpatients receive priority above all other patients because they require specialistcare to ensure that they survive. The negative side of implementing this rule isthat a non-critical patient can receive a status of 1 or 2 as a result of favouritism.If this rule is implemented, strong control mechanisms should be put in place toensure that patients are classified correctly.
3.2.6 Allocation according to patient characteristics: Gen-der
This model will take into consideration the gender of the patient when allocationsare done. It is estimated that 50% of the patients are male and 50% are female.Three of the six beds will be allocated to males and three to females. The basicfind bed algorithm is modified in die following manner:
51

Result: Patient assigned to bedif Patient is male then
for beds 1 to 3 doif bed is unoccupied and patient is not assigned to bed then
bed is now occupied;patient is assigned;record which bed is assigned to patient in variable bedId;record which patient is assigned to bed in variable patientId;
send a message to patient state chart to change state;send a message to bed state chart to change state fromunoccupied to occupied;break function;
endif All male beds are occupied and patient is still not assigned then
send a message to patient state chart that there are no bedsavailable;
end
end
endif Patient is female then
for beds 4 to 6 doif bed is unoccupied and patient is not assigned to bed then
bed is now occupied;patient is assigned;record which bed is assigned to patient in variable bedId;record which patient is assigned to bed in variable patientId;
send a message to patient state chart to change state;send a message to bed state chart to change state fromunoccupied to occupied;break function;
endif All female beds are occupied and patient is still not assigned then
send a message to patient state chart that there are no bedsavailable;
end
end
endAlgorithm 5: Basic find bed function modified to allocate patients accordingto gender
52

Results
Table 3.13 shows the results of the model using a fixed seed and table 3.14 showsthe average and standard deviations of the results obtained from the model con-sidering gender when allocations of patients are done. Figure 3.15 indicates alldata collected on a histogram for all twenty runs.
Number of patients ResultArrived at Hospital 71Admitted 38Number referred to anotherhospital
33
Table 3.13: Results obtained from twenty simulation runs for the model consideringpatient gender using fixed seed
Variable Average Standard de-viation
Number arrived 63.10 7.1Number admitted 36.9 3.19Number of deaths 4.15 2.06Number referred to anotherhospital
26.2 5.43
Table 3.14: Results obtained from twenty simulation runs for model consideringgender as allocation rule using random seed
On average, 58.5% of patients are assigned to beds and 41.5% are shown away.Of the 36.9 patients assigned to beds, on average 18.70 are male and 18.20 arefemale. Table 3.15 indicates the average bed occupancy for the 500 hours and thebed utilisation for gender-based allocations.
Patient No. of beds Bedoccupancy forrun
Bedutilisation(hours)
Bedutilisation(%)
Male 3 6.23 373.8 75Female 3 6.07 364.2 73
Table 3.15: Bed utilisation for gender based allocations using random seed
53

0
10
20
30
40
50
60
70
80
1 2 3 4 5 6 7 8 9 10 11 12 13 14 15 16 17 18 19 20
Nu
mb
er o
f p
ati
ents
Simulation runs
Allocations considering gender
Number shown away
Number admitted
Figure 3.15: Results obtained from twenty simulation runs for model consideringgender as allocation rule using random seed
Observations
The results show that the number of male patients is the same as the number offemale patients assigned. Consequently, it is unnecessary to experiment with thenumber of beds assigned to women and men respectively. This rule is regardedas a business rule, seeing as it protects the patients and makes them feel morecomfortable during their stay in the hospital.
3.2.7 Allocation of more than one patient to a bed
This model addresses the issue that occurs when all beds are occupied but thepatient has to be admitted. More than one patient can then be placed in a singlebed. This model considers the capacity of each bed as two. Two patients willonly be allocated to a single bed if all others are occupied first. The basic fin bedalgorithm has been modified as follows:
54

Result: Patient assigned to bedfor beds 1 to 6 do
if bed is unoccupied and patient is not assigned to bed then
bed is now occupied;patient is assigned;record which bed is assigned to patient in variable bedId;record which patient is assigned to bed in variable patientIdFirst;
send a message to patient state chart to change state;send a message to bed state chart to change state from unoccupiedto occupied;break function;
end
endfor beds 1 to 6 do
if bed has one patient assigned to it and patient is not assigned to bedthen
bed is now occupied by two patients;patient is assigned;record which bed is assigned to patient in variable bedId;record which patient is assigned to bed in variable patientIdSecond;
send a message to patient state chart to change state;send a message to bed state chart to change state from occupied byone to occupied by two;break function;
endif All beds are occupied by two patients and patient is still not assignedthen
send a message to patient state chart that there are no bedsavailable;
end
endAlgorithm 6: Basic find bed function modified to allocate more than one patientto the bed
Results
Table 3.16 shows the results obtained from the model using a fixed seed and 3.17shows the average and standard deviations of the results obtained from the modelwhere more than one patient can be assigned to a bed. Figure 3.16 indicates alldata collected on a histogram for all twenty runs.
55

Number of patients ResultArrived at Hospital 71Admitted 48Number referred to anotherhospital
23
Table 3.16: Results obtained from twenty simulation runs for allocations wheretwo patients per bed is allowed using fixed seed
Variable Average Standard de-viation
Number arrived 63.75 7.55Number admitted 52.90 5.84Number of deaths 4.55 2.04Number referred to anotherhospital
10.85 9.33
Table 3.17: Results obtained from twenty simulation runs for allocations wheretwo patients per bed is allowed using random seed
On average, 82.98% of patients are assigned to beds and 17.02% are shownaway. During the experiment each bed had an average of 8.82 patients. If eachpatient stays for 2.5 days, the beds are utilised for 529 hours or 105.8% of thetime.
0
10
20
30
40
50
60
70
80
90
1 2 3 4 5 6 7 8 9 10 11 12 13 14 15 16 17 18 19 20
Nu
mb
er o
f p
ati
ents
Simulation Run
Allocation where two patients per bed is allowed
Number shown away
Number admitted
Figure 3.16: Results obtained from twenty simulation runs for model where morethan one patient can be allocated to one bed using random seed
56

Observations
At 105.8% the results show that the bed utilisation is very high. This occursbecause more than one patient can be assigned to a bed. This rule will not befeasible in adult wards because adults are too big to be able to comfortably sharebeds. This occurs mostly in the paediatric and neonatal units.
3.3 Verification and validation
Verification and validation of a simulation model is done throughout the develop-ment of the model to ensure that reality is depicted accurately. The results of themodel must be accurate to ensure that the correct decisions can be made.
The conceptual models have been verified throughout the process of creationto ensure that the models are error free and that the models match specificationsand assumptions. Each conceptual model tests one individual rule to deduce whatthe impact of the rule will be on the larger system without any added noise anddistractions. The same basic model is used for all conceptual models to ensurethat the results of the models can be compared because the same assumptions andinput parameters are used.
Validation checks the accuracy of the model’s result to ensure that the modeldepicts reality correctly. Assumptions made for the patients’ Length of Stay, ca-sualty rates and arrival rates at the hospital are based on data collected fromMamelodi Hospital, as well as from research gathered. Patient flow through thehospital has also been studied through interviews with doctors and nurses, as wellas information gathered in the literature review.
All results obtained from the models are based on twenty iterations of eachexperiment of the respective rule.
3.4 Results
The following results are a comparison of the results obtained from the modelsusing a fixed seed of 2 during the experiments. Table 3.18 shows all the resultsof the fixed seed models. In each model 71 patients arrived at the hospital. Thefixed seed eliminates the effect of randomness on the result.
57

Rule Numberarrived
NumberAdmitted
NumberReferredto anotherhospital
Fire come, first served 71 36 35Reservation of some beds for the exclusiveuse by elective patients (2 elective, 4 non-elective beds)
71 25 25
Reservation as elective patients are scheduled 71 41 19Age based rule ( 5 Adult beds, 1 child bed) 71 34 37Patient criticality 71 36 35Gender based rule 71 38 33More than One 71 48 23
Table 3.18: Results of fixed seed models
0
10
20
30
40
50
60
70
80
First come, first
served
Reservation for
exclusive use by
elective patients
Reservation as
elective patients
are scheduled
Age based rule Patient
Criticality
Gender based
Rule
More than one
Nu
mb
er o
f p
ati
ents
Rule
Results of all fixed seed rules
Waiting for allocation
Number shown away
Number admitted
Figure 3.17: Bed utilisation percentage obtained from all results
58

3.5 Discussion and conclusion
Of the two reservation rules, the reservation of beds according to the patientschedule admits the most patients to beds and refers the least patients to anotherhospital.Reserving beds according to elective patient schedule allows all beds tobe used by all patients.
The first come, first served allocation tends to be a good basis for the compar-ison of results. Reservation of beds according to a schedule performs better thanthe first come, first served rule. This is due to the patients not being shown awaywhen a bed is not available for a scheduled patient, but rather that the patientcan wait a day before being admitted.
Allocation according to age and gender delivers close results. These rulesshould, however, not be judged solely on performance. The gender-based rulesare usually more applicable to adult patients. Adult patients should be sepa-rated for protection as well as to ensure that the patient’s stay is comfortable. Inthe wards, different rooms exist and each room is allocated to a specific gender.This helps in allocating the patients based on gender. According to doctors atMamelodi Hospital, children are not as sensitive to this rule. But it is imperativethat children and adults be separated for the protection of the children.
The rule of allocating patients according to their criticality delivers the sameresults as the first come, first served rule. This is a very good result and it providescare for the patients that need it the most at the time. This rule will functionvery well if it is combined with the rule of reserving beds as patients are scheduled.This will allow patients with a criticality of 2 or 3 to wait until a bed becomesavailable.
Allocating more than one patient to a bed delivers the best results by admitting48 patients and only referring 23 to another hospital. More patients can stay in thehospital, which increases the bed utilisation. This rule is set up in such a mannerthat two patients are not assigned to a single bed if there is a bed available. Thisrule is dangerous to implement because it increases the risk of infection betweenpatients. This rule is mostly implemented in the neonatal wards where twinscommonly recover faster and better when they are placed together.
It would be suggested that the above mentioned rule should be applied in thefollowing manner in the case study of Mamelodi Hospital:
• A distinction between patients must be made according to age.
• Adults should be allocated by gender, this rule does not apply to children.
All rules, expect age and gender, must be subordinate to the rule based onpatient criticality. This rule will influence the bed utilisation because critical
59

patients tend to have a longer Length of Stay compared to non-critical patients,and elective patients will therefore have to be rescheduled.
Only neonatal patients must be allowed to share beds. Sharing of beds willincrease the risk of infection in the hospital above acceptable levels.
In Chapter 4 the above rules are combined into three distinct rule sets to seewhat the impact of these rules are on the larger system. The rules are tested andthe results are compared to evaluate which rule set performs the best. The resultsare discussed and suggestions are made on the importance of implementing specificrules and a combination of rules.
60

Chapter 4
Case Study at Mamelodi Hospital
4.1 Introduction to Mamelodi Hospital
Mamelodi Hospital is a district public hospital which is situated in the east ofPretoria. This hospital admits patients from the surrounding areas includingMamelodi, Eersterust, Watloo and Nellmapius. Patients are referred to the hospi-tal from the clinics and can be admitted from the Outpatient Department, Emer-gency Department or through Inpatient Admissions.
The hospital has 315 beds and 15 wards with different specialities. The hos-pital admits between 2000 and 3000 patients per month and had an average bedoccupancy rate of 66% in the months between March and May of 2014. Somewards had an occupancy of more than 85% with an average Length of Stay ofabove 7 days.
The basic patient flow is similar to that shown in figure 3.6 in Chapter 3. Minorchanges occur for each ward depending on where patients are admitted from andwhether they are sent to another ward during their stay in the hospital.
Patients entering the Emergency Department are seen by a casualty officer andare either medical patients or trauma patients. The patient is either referred to afirm (speciality) or treated and sent home. When a firm decides to admit a patientthe wards are called to enquire whether there are open beds or to reserve a bedfor the patient. If open beds are available the patient is admitted. If no beds areavailable a bed is reserved and the patient waits to be admitted or the patient istransferred to Steve Biko Academic hospital. Trauma patients currently wait anaverage of 2 days before being admitted and medical patients wait between 2 to 3days.
Patients can also be admitted from the Outpatient Department, although thisdoes not occur often (average of 20 patient admitted per month from this depart-ment). If a bed is available in the wards the patient is sent to the ward. Otherwise
61

the patient is sent to the Emergency Department to wait for an available bed.Patients can also be admitted by Inpatient Admissions for scheduled surgeries.
Usually when an inpatient is scheduled a bed is reserved in the particular wardfor the day that the patient is scheduled to arrive. A patient will only knowwhether their surgery will take place once they are admitted. The surgery can berescheduled and the patient must either stay in the hospital until the surgery cantake place or the patient is discharged and the surgery is rescheduled.
Some of the common patient flows are shown in the figures below. Each figuredepicts a certain ward or collection of wards with common processes.
ALOS: Average Length of Stay (days).BOR: Bed Occupancy Rate (%).
Figure 4.1: Peaditric inflow and outflow
The Paediatrics Department has 26 beds of which 22 are cots, 5 are standardbeds and 3 are incubators. The beds are divided into 6 rooms with 4 beds each.One room is an isolation room. Children between the age of 0 to 13 years areadmitted to the ward, but babies that are admitted are either not born in thehospital or must be admitted from outside of the hospital.
Figure 4.2: Neonatal ICU inflow and outflow
62

The neonatal ICU falls under the care of the Paediatric Department. Thisward is designed for 16 beds, but currently there are 19 incubators in the ward. Alot of shortages occur in this unit because almost all the patients require oxygenand telemetry and only 16 oxygen ports and 16 telemetry machines are available.In this ward more than one patient is placed in a single incubator. The norm isto have two babies per bed and sometimes up to three babies can be placed ina single incubator. Allocations in this ward is done according to the availabilityof oxygen ports. The patients can be either discharged to home when the babyreaches 1.5 kg or to the Kangaroo Mother Care Unit for further observations.
Expecting mothers enter the Maternity Ward through the Maternity Entranceof the hospital. This unit has 62 beds with an ALOS of 1 day. The mothers aremoved from this unit to the Labour Ward as it becomes necessary or to Surgeryfor a C-section.
Figure 4.3: Labour ward inflow and outflow
The babies born in the Labour Ward can either be moved with the mother tothe Post Natal Ward or to the Neonatal ICU depending on whether complicationshave arose during birth. On average each mother has only one baby.
63

Figure 4.4: Post Natal ward inflow and outflow
In the Postnatal Unit the mothers are allocated to beds and the babies areplaced in a crib next to the mother. One of the rooms are occupied by KangarooMother Care patients who stay in the hospital in order to feed their babies either inNeonatal ICU or because the babies are transferred from the Neonatal ICU to thestay with their mothers in this room. Patients are discharged from the hospital.
Mamelodi Hospital has an ICU with 4 activated ICU beds. This unit wascreated to relieve the pressure from the wards and emergency department whencritical patients arrive. The patients that are allocated to this ward have a crit-icality of 1. Mamelodi hospital does not use the criticality measurement systemas described in Chapter 2 and 3. The ALOS is 9.5 days and the ICU treats onaverage 17 patients per month with a death rate of 1 patient per month.
Figure 4.5: Surgical ward inflow and outflow
Mamelodi Hospital has four Surgical Wards as shown in the table 4.1. TheGynaecology Department has only women but the rest of the wards are equallydivided between men and women. No sharing of beds are allowed and thereforeno shortages of oxygen occur.
64

Department Nr of beds ALOS BOR admissions(permonth)
deaths(permonth)
Gynaecology 32 1.59 42.64 227.33 0.33Orthopaedics 26 5.61 76.96 104.67 1.00Surgical 1 32 2.28 47.63 178.33 10.00Surgical 2 32 6.32 64.74 124.00 26.67
Table 4.1: Surgery wards in Mamelodi Hospital
Mamelodi Hospital also has a Medical Ward where patients who have diseasessuch as TB, epilepsy and pneumonia are treated. This ward has 42 beds. Thebeds are divided to 4 per cubicle and 2 side cubicles with to beds each. One ofthe side cubicles are used as an isolation room. Men and women are allocatedto different rooms. Patients are admitted from the Outpatient Department andEmergency Department. If no beds are available patients stay in the EmergencyDepartment until a bed becomes available. The patients are discharged from thehospital or transferred to Step Down ward.
The Step Down Ward is a ward where minimal patient care takes place. Thisunit has 12 beds, an ALOS of 3.67 days and admits 70 patients per month.
4.2 Three rule sets
The three rule sets that will be tested in this chapter are:
• Rule set 1: First come, first served. The basic find bed function will be usedin this model.
• Rule set 2: This rule will consider age, gender, criticality and type of patient(elective, emergency and inpatient). Beds can be reserved for scheduledsurgeries. Reservations can be cancelled and the patient must be rescheduled.
• Rule set 3: Will take into consideration all the rules of Rule set 2 but patientswill be admitted according to pathology and whether the patient must beisolated. Four types of wards will be considered (Paediatrics, Neonatal ICU,Surgical Ward (2) and Step Down Ward) each with a LoS as determined bythe data collected from Mamelodi Hospital. Patients can also be transferredbetween wards and neonatal patients in the Neonatal ICU can share bedswith one other patient.
65

4.3 Input data and basic model
4.3.1 Input data
Each of the three models will be based on the data received from Mamelodi Hos-pital on the following four wards, as shown in table 4.2.
Ward Nr of beds ALOS(days)
Admissions(per day)
Admissions(%)
Probabilityof death(%)
Paediatrics 27 4.70 4.46 34.10 3.54Neonatal 19 5.32 2.14 16.40 15.98Surgical (2) 32 6.32 4.13 31.60 4.74Step down 12 3.54 2.30 17.90 0.53
Table 4.2: Data of four wards obtained from Mamelodi Hospital
Each of the wards LoS will be simulated using a Weibull distribution(gamma =ALOS, beta = 2, minimum = 0). Each ward will have the number of beds specifiedin the above tables. The beds in the Paediatrics Ward and Surgical Ward will bedivided into rooms.
These wards where chosen for the case study because these are the areas thatexperience the most overcrowding or the most rules have to be applied when alloca-tions are made. By including the Step Down Ward the choice between transferringa patient and sending them home is also tested.
4.3.2 Agents
In the case study model six types of agents are used. These agents are main, beds,patients, reception, labour ward, and exit. Each performs certain functions andhave their own characteristics and behaviours.
Main
Main, as seen in figure 4.6, is the principle view of the model where the layout ofthe beds and the movement of patients can be observed.
66

Figure 4.6: Main view of case study model
The Neonatal ICU is not divided into rooms and patients enter the ward fromthe labour ward. Neonatal patients can only be admitted if they are born in thehospital or are born in the last hour at one of the clinics. If the baby comes fromhome he or she must be admitted into the Paediatric Unit.
The Paediatric Unit is divided into six rooms with four beds each and the sixthroom with six beds in. Room 5 will be an isolation room. Surgery Ward is dividedinto nine rooms with room 4, room 8, and room 9 acting as isolation rooms.
The Step Down Ward is not divided into rooms as this does not play a role inallocations within this ward.
All patients, expect neonatal, are admitted through the reception. If no bed isavailable the patient exits the hospital through the exit.
Beds
Figure 4.7 below shows how the bed agent is set-up for the case study. Each bedis located in a ward and in a specific room if applicable. The gender of the bedand whether the bed is an isolation bed can be set. The allocation variables areactivated according to the allocation rule that is applied.
67

Figure 4.7: Bed agent set-up in case study
As with the bed agents in Chapter 3 the circle above the beds will changecolour if the bed is occupied or not. The colour will change to red if the bed isoccupied and will turn green if the bed is unoccupied. The colour will change toyellow if the bed is occupied by two patients.
Patients
Each patient has the parameters and variables as shown in figure 4.8. Patientcriticality is not currently acknowledged in Mamelodi Hospital. Patient criticalityis only divided into two categories: emergency patient (criticality of 1) or non-emergency patient. This causes patient type to be emergency, elective and non-elective patients. The patient must be isolated with a probability of 5% and deathprobability is dependent on the ward the patient is allocated to.
68
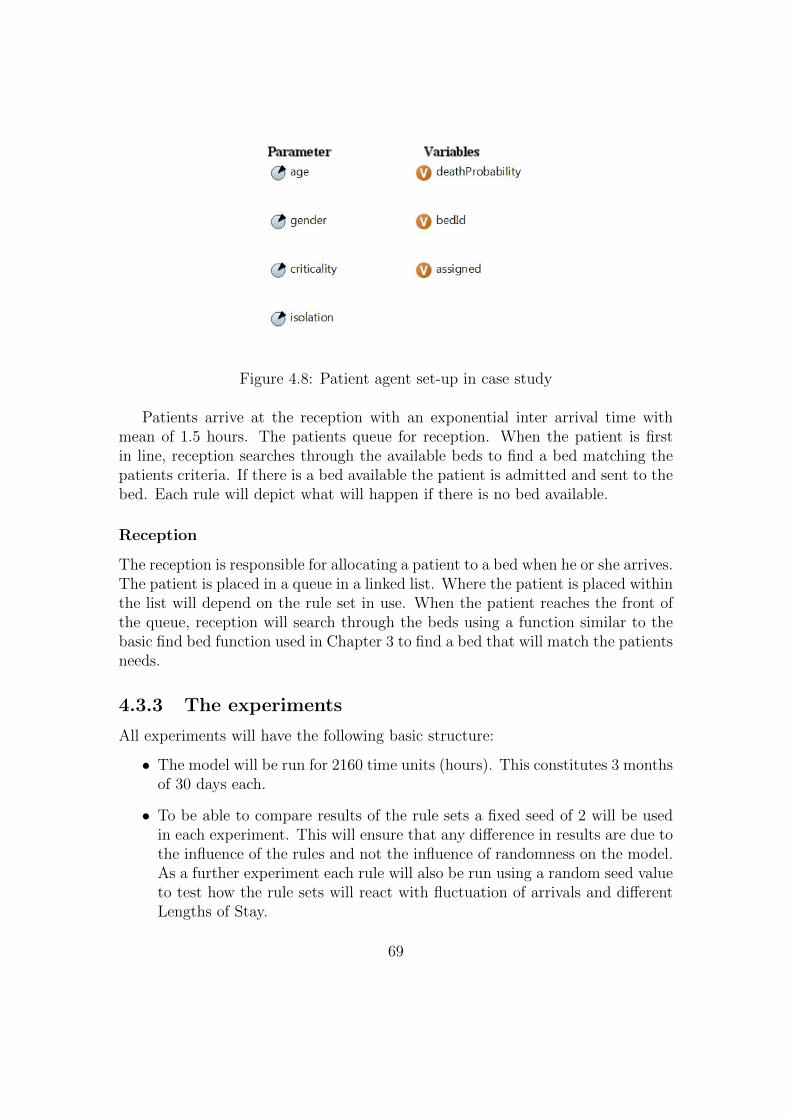
Figure 4.8: Patient agent set-up in case study
Patients arrive at the reception with an exponential inter arrival time withmean of 1.5 hours. The patients queue for reception. When the patient is firstin line, reception searches through the available beds to find a bed matching thepatients criteria. If there is a bed available the patient is admitted and sent to thebed. Each rule will depict what will happen if there is no bed available.
Reception
The reception is responsible for allocating a patient to a bed when he or she arrives.The patient is placed in a queue in a linked list. Where the patient is placed withinthe list will depend on the rule set in use. When the patient reaches the front ofthe queue, reception will search through the beds using a function similar to thebasic find bed function used in Chapter 3 to find a bed that will match the patientsneeds.
4.3.3 The experiments
All experiments will have the following basic structure:
• The model will be run for 2160 time units (hours). This constitutes 3 monthsof 30 days each.
• To be able to compare results of the rule sets a fixed seed of 2 will be usedin each experiment. This will ensure that any difference in results are due tothe influence of the rules and not the influence of randomness on the model.As a further experiment each rule will also be run using a random seed valueto test how the rule sets will react with fluctuation of arrivals and differentLengths of Stay.
69

• Each experiment will be run for 25 iterations.
• Number of beds: 88.
• Length of Stay distribution will be based on the data collected from MamelodiHospital as shown in table 4.2 for each group.
• Patients will arrive with an inter arrival time exponentially distributed withmean of 0.6667 hours.
• Probability of demise will be based on the group of patient as shown in table4.2.
4.4 Testing of rules
4.4.1 Rule set 1: First come, First served
This model uses the basic find bed function as described below and which is usedin Chapter 3. No other rules such as criticality, pathology, age, or gender areconsidered in this model. The patient that arrives first is allocated to the firstavailable bed. If no bed is available the patient cannot be admitted.
Result: Patient assigned to bedfor beds 1 to 6 do
integer i = number of beds;if bed is unoccupied and patient is not assigned to bed then
bed is now occupied;patient is assigned;record which bed is assigned to patient in variable bedId;record which patient is assigned to bed in variable patientId;
send a message to patient state chart to change state;send a message to bed state chart to change state from unoccupiedto occupied;break function;
endif All beds are occupied and patient is still not assigned then
send a message to patient state chart that there are no bedsavailable;
end
endAlgorithm 7: Basic find bed function
70

Results
The results obtained from the experiments using a seed value of two are shown intable 4.3
Number of patients ResultArrived at Hospital 1418Admitted 1418Deaths 72Number referred to anotherhospital
0
Table 4.3: Results obtained from twenty simulation runs for Rule set 1
On average, 100% of patients are assigned to beds and none are shown away.If on average 1418 patients are assigned to 88 beds, it means that each bed has anaverage of 16.11 patients during the 3 month period.
The results obtained from twenty simulation runs using a random seed valueis shown in following table 4.4 and figure 4.9.
Patients Averagenumber ofpatients
Standarddeviation
Arrived at Hospital 1433.65 30.33Admitted 1433.65 30.33Deaths 75.65 7.43Number referred to anotherhospital
0 0
Table 4.4: Results obtained from twenty simulation runs for Rule set 1 using arandom seed
The results obtained from the experiments using a random seed value also showthat a 100% of patients can be admitted at all times. If on average 1433.65 patientsare assigned to 88 beds during the 3 month period, each bed accommodates anaverage of 16.29 patients.
71

1300
1320
1340
1360
1380
1400
1420
1440
1460
1480
1500
1520
1 2 3 4 5 6 7 8 9 10 11 12 13 14 15 16 17 18 19 20
Nu
mb
er o
f p
ati
ents
Experiment
Rule set 1
Number shown away
Number admitted
Figure 4.9: Results obtained from twenty simulation runs for Rule set 1 using arandom seed
4.4.2 Rule set 2
Rule set 2 model will base allocation of a patient on the age, gender, criticalityand type of patient (elective, emergency, and inpatient). The rules are appliedby the model using an adapted version of the basic find bed function. The ruleapplied in this model are explained and listed below:
Number of beds and age:In Mamelodi Hospital a distinction is made between three age groups: neona-tal(new born babies until 30 days), paediatric (30 days old to 13 years), andadults (any person older than 13 years). In this model the Neonatal Unit has19 beds, Paediatric Unit has 26 beds and the Adult Unit has 44 beds. Thenumber of beds have been determined in accordance to the data collectedfrom Mamelodi Hospital.
GenderThe gender based rule is only applicable to the adult patients. Of the 44adult beds 22 are female and 22 are male.
Criticality and type of patientAs discussed above in the patient section of Chapter 4 a patient can eitherbe emergency, elective or non-elective. Twenty percent of the patients thatare admitted to the hospital are emergency patients. Emergency patients
72

must be admitted into the hospital within the next four hours and will begiven preference when a bed becomes available. Twenty-eight percent of thepatients are elective patients and are scheduled to be admitted at a certaintime, usually two days from the first arrival at the hospital. Beds can be re-served for elective patients for their scheduled arrival. These reservations canbe cancelled and rescheduled if an emergency patient requires the bed. Fifty-two percent of patients are non-elective and are admitted as beds becomeavailable. In Mamelodi Hospital non-elective patients and some elective pa-tients usually wait in the Casualty Department until a bed becomes available.
The neonatal allocations will only consider emergency patients during ad-missions because neonatal patients cannot be scheduled for admission beforethey are born. Adult patients will consider all three types of patients.
Results
Data collected from the experiment using a seed value of two is shown in table 4.5.
Number of patients ResultArrived at hospital 1414Admitted 1403Deaths 83Referred to another hospital 11Number of elective patientrescheduled
7
Table 4.5: Results obtained from twenty simulation runs for Rule set 2
On average, 99% of patients could be admitted to the hospital and 1% arereferred to another hospital.
The results obtained from twenty simulation runs using a random seed valueis shown in following table 4.6 and figure 4.10.
73

Patients Averagenumber ofpatients
Standarddeviation
Arrived at Hospital 1428.85 42.23Admitted 1407.45 42.41Deaths 74.65 10.02Number referred to anotherhospital
21.40 12.22
Table 4.6: Results obtained from twenty simulation runs for Rule set 2 using arandom seed
The results obtained from the experiments using a random seed value showthat 98.5% of patients can be admitted and 1.5% are referred to other hospitals.If on average 1407.45 patients are assigned to 88 beds during the 3 month period,each bed accommodates an average of 15.99 patients.
1200
1250
1300
1350
1400
1450
1500
1550
1600
1 2 3 4 5 6 7 8 9 10 11 12 13 14 15 16 17 18 19 20
Nu
mb
er o
f p
ati
ents
Experiment
Rule set 2
Number shown away
Number admitted
Figure 4.10: Results obtained from twenty simulation runs for Rule set 2 using arandom seed
74

4.4.3 Rule set 3
This rule set will consider all the rules applied in Rule set 2 but will also considerthe following additional rules:
Allocation by wardPatients can be admitted to one of four wards depending on age and pathol-ogy. New born babies will be admitted to the Neonatal Ward and childrenbetween the ages of 30 days to 13 years are admitted to the Paediatric Ward.The adult patients can either be admitted for the Surgical Ward or the StepDown Ward.
Layout of modelThe number of beds in each ward will be based on the data received fromMamelodi Hospital as shown in table 4.2 with a total of 88 beds in the model.
Figure 4.11 show how beds are divided into wards and rooms for this ruleset. Room 5 in the Paediatric Ward and room 4, 8, and 9 in the SurgicalWard are isolation rooms. If a patient requires isolation he or she will beallocated to this room. In this model 5% of patients will require isolationin the Surgical and Paediatric Wards. If no isolation patients are occupyingthe room other patients can be allocated to it.
Figure 4.11: Layout of wards in rule set 3
75

Allocation according to gender will not be considered in the Paediatric andNeonatal Units. In the two adult wards, Surgical (2) and Step Down, patientswill be allocated according to gender. Room 1 to 4 in the Surgical Ward aremale rooms and rooms 5 to 9 are female rooms. The Step Down Ward hassix male and six female beds.
Transfer of patients between wardsPatients can be transferred from the Surgical Department to the Step DownDepartment if further care is required.
Sharing of bedsDue to the high demand for the neonatal beds and the fact that twin babiesrecover faster when they are placed in the same bed neonatal patients will beallowed to share beds. This is not an ideal because it increase the hospitalsrisk for infections. This rule will only be applied if all available beds havebeen filled.
Results
Data collected from the experiment using a seed value of two is shown in table 4.7.
Number of patients ResultArrived at hospital 1383Admitted 1265Deaths 70Referred to another hospital 128Number of elective patientrescheduled
4
Number of surgical patientstransferred to Step DownWard
10
Table 4.7: Results obtained from twenty simulation runs for Rule set 3
On average, 91.5% of patients could be admitted to the hospital and 8.5% arereferred to another hospital.
The results obtained from twenty simulation runs using a random seed valueis shown in table 4.8 and figure 4.12.
76

Patients Averagenumber ofpatients
Standarddeviation
Arrived at Hospital 1443.6 35.39Admitted 1327.00 29.39Deaths 73.40 9.96Number referred to anotherhospital
133.10 12.74
Table 4.8: Results obtained from twenty simulation runs for Rule set 3 using arandom seed
The results obtained from the experiments using a random seed value showthat 91.9% of patients can be admitted and 8.1% are referred to other hospitals.If on average 1327 patients are assigned to 88 beds during the 3 month period,each bed accommodates an average of 15.08 patients.
0
200
400
600
800
1000
1200
1400
1600
1800
1 2 3 4 5 6 7 8 9 10 11 12 13 14 15 16 17 18 19 20
Nu
mb
er o
f p
ati
ents
Experiment
Rule set 3
Number shown away
Number admitted
Figure 4.12: Results obtained from twenty simulation runs for Rule set 3 using arandom seed
77

4.5 Verification and validation
Verification and validation of a simulation model is done throughout the develop-ment of the models to ensure that they perform as expected. The results of themodel must be accurate to ensure that the correct decisions can be made.
The Rule set models have been verified throughout the process of developmentto ensure that the models are error free and that the rules are applied by the modelas expected. Each of the Rule sets are first tested using a constant seed of twoto ensure that the results obtained are not a result of the influence of randomnesson the models. The Rule sets are tested with a random seed to indicate what theinfluence of randomness and fluctuation in patient arrivals and Length of Stay willbe on the results.
Validation checks the accuracy of the model’s result to ensure that the modeldepicts reality correctly. Assumptions made for the patients’ Length of Stay, ca-sualty rates and arrival rates at the hospital are based on data collected fromMamelodi Hospital. Patient flow through the hospital has also been studiedthrough interviews with doctors and nurses, as well as information gathered inthe literature review. Not all rules used in the Rule Sets are currently used inMamelodi Hospital. The goal of this Chapter is to determine what the influenceof the rules are and whether better results can be obtained than what the currentsystem currently delivers.
4.6 Results and Discussion
The results of the various Rule sets are very stable. The amount of patient ad-mitted using a constant seed is very close to the number admitted using a randomseed as shown in table 4.9.
Rule set Percentageadmittedfixed seed
Percentageshownaway fixedseed
Percentageadmittedrandomseed
Percentageshownaway fixedseed
Rule set 1 100 0 100 0Rule set 2 99 1 98.5 1.5Rule set 3 91.5 8.5 91.9 8.1
Table 4.9: Stability of results obtained from each Rule set
Figure 4.13 shows the results from all the Rule sets. Rule set 1 performs thebest by assigning all patients to beds. Rule set 3 performs the worst by only beingable to admit a small amount of people.
78

1150
1200
1250
1300
1350
1400
1450
1500
Rule set 1:
Fixed
Rule set 1:
Random
Rule set 2:
Fixed
Rule set 2:
Random
Rule set 3:
Fixed
Rule set 3:
Random
Nu
mb
er o
f p
ati
ents
Results from all Rule sets
Number shown away
Number admitted to hospital
Figure 4.13: Results of all Rule sets
The following table 4.10 compares the results obtained from the fixed seedexperiments as well as the random seed experiments with the data collected fromMamelodi Hospital.
Source Number ofadmissions
Number ofdeaths
Bed Occu-pancy rate%
ALOS Numbershownaway
Mamelodi Hospital 1176 76 68.02 4.97 Data notavailable
Rule set 1: Fixed 1418 72 88.98 5.59 0Rule set 1: Random 1433.65 75.65 89.97 5.52 0Rule set 2: Fixed 1403 83 88.04 5.65 7Rule set 2: Random 1428.85 74.65 88.32 5.63 21.4Rule set 3: Fixed 1265 70 79.38 6.26 128Rule set 3: Random 1327 73.4 83.27 5.97 133.1
Table 4.10: Comparison of results with data obtained from Mamelodi Hospital
All Rule sets perform better than the current system. The models are builtusing data obtained from Mamelodi Hospital with regards to the number of arrivalsof patients, LoS in the wards and probability of deaths in order to be able toaccurately compare the results.
79

4.7 Conclusion
The results in table 4.9 indicates that the results are not influenced by randomnessto a large extent. The closeness between the results of the fixed seed and randomseed in table 4.10 affirms this.
Table 4.10 shows that all the Rule sets perform better than the current systemthat is used within Mamelodi Hospital. This is partially due to the models trackingwhich beds are open and which are occupied. Currently, open beds are not alwaystracked in the units and wards of the hospital. The models can find an open bedfaster than the current system.
Figure 4.13 and table 4.10 show that Rule set 1 performs the best of all thesets by admitting all the patients that arrive at the hospital for both the fixed seedand random seed models. Regardless of the performance of the first come, firstserved model it will not be practical to implement this Rule set in the hospital.This model assumes that a patient can occupy any bed which is not true. Differenttypes of beds exist and an adult can not occupy a crib or incubator. Further itwill endanger and unsettle patients if no rules are followed when allocations aremade. Children cannot share rooms with adults, unless it is a baby who is placedin the same room as the mother. Female and male patients cannot share rooms.Pathology of patient and infectiousness must be considered in order to lower thehospitals risk of spreading disease and infections.
Rule set 2 performs very well in comparison to Rule set 3. This Rule set 2 isplausible to implement but allocating adults by pathology or needs should still beconsidered to reduce the risk of infections. It will place unnecessary strain on thedoctors because the patients are allocated across the whole hospital and not inone focussed ward. It can also occur that a patient does not obtain the specialisedcare that is required.
Rule set 3 performs the worst of the three Rule sets, but still outperforms thecurrent system. This model takes into consideration the most important rulesand creates focussed units within the hospital. Male and female adult patientsare allocated to wards according to their needs. Children and babies are assignedto the correct wards to receive specialised care. This rule set gives preference toemergency patients and beds can be reserved for elective patients. Rooms can beused for isolation purposes to protect other patients from infections or diseases.This model allows patients to be transferred between wards.
Of all the rule sets, Rule set 3 takes into consideration the most importantrules. Rule set 3 is therefore the best rule set.
80
Chapter 5
Conclusion andRecommendations
5.1 Conclusion and recommendation
South African public hospitals have a shortage of hospital beds and struggle toallocate patients to beds and keep track thereof. This contributes to the inefficientutilisation of limited hospital capacity. In literature, this problem is called the bedmanagement problem with specific focus on bed allocation.
This report addresses this problem by creating a generic bed managementmodel that will better match patients to beds and therefore maximise the capacityutilisation of a South African Public Hospital.
Different techniques have been studied in literature in an attempt to solve thisproblem. A comparison between these techniques show that agent based simulationmodelling is the best suited for this specific problem.
Agent based simulation allows each patients characteristics and needs to betaken into account and match it to a bed that will fulfil the patients needs. Thissimulation method lends the required flexibility to the model to be able to testindividual as well as combined allocation rules.
In order to match a patient with specific characteristics and needs to a bedwhich can fulfil these needs, certain bed allocation rules should be adhered to.These allocation rules are studied by using conceptual models. In Chapter 3test seven individual allocation rules are tested. These rules include allocationaccording to patient characteristics, reservation of beds for elective patients, andallocating more than one patient to a bed.
The conceptual models found that the decision between allocations rules cannotsolely be based on the impact on bed utilisation but that the patient’s comfortand protection also plays a critical role. Patients should be allocated to beds
81

according to age and gender. The gender-based rules are usually more applicableto adult patients. In the wards, different rooms exist and each room is allocated toa specific gender. This helps in allocating the patients based on gender. Childrenare not as sensitive to this rule. But it is imperative that children and adults beseparated for the protection of the children. In order to provide the best care forthe patients that need it the most all allocation rules should be subordinate to thepatient criticality.
Combinations of the rules tested in Chapter 3 were further tested in Chapter4 in a case study done at Mamelodi Hospital. Three rule sets were created. Theresults show that all three rules sets perform better than the current system thatMamelodi Hospital uses. This is partially due to the models tracking which bedsare open and which are occupied. Currently open beds are not always tracked inthe units and wards of the hospital. The models can find an open bed faster thanthe current system.
Of the three rule sets tested in Chapter 4, Rule set 3 provides the most satisfac-tory results. This model takes into consideration all of the most important rulesand creates focussed units within the hospital. Male and female adult patientsare allocated to wards according to their needs and children and babies are alsoassigned to the correct wards to receive specialised care. This rule set also givespreference to emergency patients and beds can be reserved for elective patients.Rooms can be used for isolation purposes to protect other patients from infectionsor diseases. This model also allows patients to be transferred between wards.
In conclusion different allocations rules are applicable to different patients.Implementing the right combinations of rules, similar to those used in Rule setthree, will improve bed utilisation whilst still adhering to all allocation rules.Better tracking of beds and when beds will become available will also improvebed utilisation and the patients hospital experience.
5.2 Suggestions for future projects
The work done in this project creates the opportunity for the following futureprojects.
1. Study of how the backlog in the Emergency Department can further be re-duced through improvements of the Emergency Department processes andpatient flow in conjunction with the findings of this project. CurrentlyMamelodi Hospital sends all patients waiting to be admitted to the Hos-pital to the Emergency Department to wait for an open bed. This createsa major back log of patients waiting to be admitted. In some cases patientwait for up to 5 days before a bed becomes available.
82

2. This project can be expanded by using Diagnosis Related Groups (DRG) tocreate a data base of treatments that each group commonly require, ALOSper group and cost related to the patients care. This data base can be used tomore accurately forecast when beds will become available. This forecast canbe used to improve reservations of elective patients and reduce the numberof cancelled admissions.
The data base will also assist in improving the accuracy of the cost of apatient’s stay and the resources that the patient uses. This knowledge can becombined with historical data of commonly occurring DRG in the particularHospital in order to improve the amount of funds as well as the resource thata hospital requires.
83

Bibliography
AnyLogic (2014). Agent based modeling AnyLogic simulation software.
Bachouch, R., Guinet, A., and Hajri-Gabouj, S. (2012). An integer linear modelfor hospital bed planning. International Journal of Production Economics,140(2):833–843.
Cullinan, K. (2006). SA’s public hospitals in crisis. The Herald.
Demeester, P., Souffriau, W., De Causmaecker, P., and Vanden Berghe, G. (2010).A hybrid tabu search algorithm for automatically assigning patients to beds.Artificial Intelligence in Medicine, 48(1):61–70.
Halata, C. (2013). Stretchers for hospital beds. Diamond Fields Advertiser.
Health Systems Trust (2012). The national health care facilities baseline audit:National summary report | health systems trust.
Marazzi, A., Paccaud, F., Ruffieux, C., and Beguin, C. (1998). Fitting the distri-butions of length of stay by parametric models. Medical care, 36(6):915–927.
Mashaba, S. (2007). No beds for patients at baragwanath. The Sowetan.
Meyer, E. D. (2010). Access to health care in South Africa: an ethical and humanrights obligation. Thesis, University of Wiwatersrand. MSc (Med), (Bioethicsand Health Law), Faculty of Health Sciences, University of the Witwatersrand.
Mojaki, M. E., Basu, D., Letshokgohla, M. E., and Govender, M. (2011). Referralsteps in district health system are side-stepped. South African Medical Journal,101(2):109.
Musgrave, A. (2007). Mushwana starts bara baiebies-in-boxes probe. The BusinessDay.
New Mexico State University (2014). Token ring algorithm.
84

Paulussen, T. O., Zller, A., Rothlauf, F., Heinzl, A., Braubach, L., Pokahr, A., andLamersdorf, W. (2006). Agent-based patient scheduling in hospitals. In Kirn,P. D. S., Herzog, P. D. O., Lockemann, P. D. P., and Spaniol, P. D. O., edi-tors, Multiagent Engineering, International Handbooks on Information Systems,pages 255–275. Springer Berlin Heidelberg.
Proudlove, N., Gordon, K., and Boaden, R. (2003). Can good bed managementsolve the overcrowding in accident and emergency departments? EmergencyMedicine Journal : EMJ, 20(2):149–155.
Roger, H. (2011). A to z of hospital departments.
Ryan, K., Levit, K., and Davis, H. P. (2010). Characteristics of weekdays andweekend hospital admissions. Statistical Brief 87, Healthcare Cost and Utiliza-tion Project.
Schmidt, R., Geisler, S., and Spreckelsen, C. (2013). Decision support for hospi-tal bed management using adaptable individual length of stay estimations andshared resources. BMC Medical Informatics and Decision Making, 13:3.
Seung-Chul, K., Ira, H., Karl K, Y., and Thomas A, B. (2000). Flexible bedallocation and performance in the intensive care unit. Journal of OperationsManagement, 18(4):427–443.
SIMUL8 (2014). Warm up period.
Statistics South Africa (2004). Statistics south africa provincial profile 2004 gaut-eng.
Statistics South Africa (2013). Mid-year population estimates.
UW Health (2014). Cardiology and cardiology intensive care unit, heart andvascular care.
Viljoen, B. (2005). Serious bed shortage in nelspruit hospital. Citizen.
Winston, W. L. and Venkataramanan, M. (2003). Introduction to MathematicalProgramming. Brooks/Cole, Cengage Learning, 4th editition edition.
85

Appendices
86

87

Appendix A
Project sponsor form
88