improving health care quality and reducing costs through payment and delivery system reform harold...
TRANSCRIPT

Improving Health Care Qualityand Reducing Costs
through Payment and Delivery System Reform
Harold D. MillerExecutive Director
Center for Healthcare Quality and Payment Reformand
President and CEO Network for Regional Healthcare Improvement

2© 2009-2011 Center for Healthcare Quality and Payment Reform, Network for Regional Healthcare Improvement
Health Care Costs are the Coreof the National Budget Problem
“Our health-care problem is our deficit problem.
Nothing else even comes close.”
President ObamaSeptember 2010

3© 2009-2011 Center for Healthcare Quality and Payment Reform, Network for Regional Healthcare Improvement
But Federal Healthcare Costs AreJust The Tip of a Bigger Iceberg…

4© 2009-2011 Center for Healthcare Quality and Payment Reform, Network for Regional Healthcare Improvement
What Makes Our % of GDP High is Private Expenditures on Health
Source: Organisation for Economic Co-operation and Development (2010), "OECD Health Data", OECD Health Statistics (database)Notes: Data from Australia and Japan are 2007 data. Figures for Canada, Norway and Switzerland, are OECD estimates. Numbers are PPP
adjusted.

5© 2009-2011 Center for Healthcare Quality and Payment Reform, Network for Regional Healthcare Improvement
Large Size and Growth in Costs for Both Employers & Workers
$318 $899 $1,543
$3,997$1,878
$4,150$4,247
$9,773
$0
$2,000
$4,000
$6,000
$8,000
$10,000
$12,000
$14,000
Single Coverage1999
Single Coverage2010
Family Coverage1999
Family Coverage2010
Average Annual Contributions to Health Insurance Premiums1999-2010
Employer Contribution
Worker Contribution
11 Years

6© 2009-2011 Center for Healthcare Quality and Payment Reform, Network for Regional Healthcare Improvement
Insurance Cost Growth Quadruplethe Rate of Wages and Inflation
Source: Kaiser/HRET Survey of Employer-Sponsored Health Benefits, 1999-2010. Bureau of Labor Statistics, Consumer
Price Index, U.S. City Average of Annual Inflation (April to April), 1999-2010; Bureau of Labor Statistics, Seasonally Adjusted Data from the Current Employment Statistics Survey, 1999-
2010 (April to April).
Cumulative Changes in Health Insurance Premiums,Inflation, and Workers’ Earnings, 1999-2010

7© 2009-2011 Center for Healthcare Quality and Payment Reform, Network for Regional Healthcare Improvement
Health Care Costs Have Wiped Out Real Income Gains
$0
$1,000
$2,000
$3,000
$4,000
$5,000
$6,000
$7,000
$8,000
$9,000
1999 2009
Monthly Income for Typical U.S. Family of Four
Inflation on Non-Health Care GoodsHealth Care Taxes, Premiums, ExpensesNet Available Income
Source: "A Decade of Heallth Care Cost Growth Has Wiped Out Real Income Gains For an Average US Family," Health Affairs, September 20011
$ 95 for spending
$ 945 for health care
$ 870 for inflation
$1910 more income

8© 2009-2011 Center for Healthcare Quality and Payment Reform, Network for Regional Healthcare Improvement
From a Manufacturing Economyto Dependence on Healthcare
0
2,000
4,000
6,000
8,000
10,000
12,000
14,000
16,000
18,000
20,000
1990
1991
1992
1993
1994
1995
1996
1997
1998
1999
2000
2001
2002
2003
2004
2005
2006
2007
2008
2009
2010
Jobs
in T
hous
ands
U.S. Jobs in Manufacturing and Health Care, 1990-2010
Manufacturing
Health Care
9© 2009-2011 Center for Healthcare Quality and Payment Reform, Network for Regional Healthcare Improvement
Challenge: Can We Reduce Costs Without Rationing?

10© 2009-2011 Center for Healthcare Quality and Payment Reform, Network for Regional Healthcare Improvement
Reducing Costs Without Rationing:Prevention and Wellness
HealthCondition
ContinuedHealth
HealthyConsumer

11© 2009-2011 Center for Healthcare Quality and Payment Reform, Network for Regional Healthcare Improvement
Reducing Costs Without Rationing:Avoiding Hospitalizations
HealthCondition
ContinuedHealth
HealthyConsumer
NoHospitalization
Acute Care Episode

12© 2009-2011 Center for Healthcare Quality and Payment Reform, Network for Regional Healthcare Improvement
Reducing Costs Without Rationing:Efficient, Successful Treatment
HealthCondition
ContinuedHealth
HealthyConsumer
NoHospitalization
Acute Care Episode
Efficient Successful Outcome
Complications,Infections,
Readmissions
High-CostSuccessfulOutcome

13© 2009-2011 Center for Healthcare Quality and Payment Reform, Network for Regional Healthcare Improvement
Reducing Costs Without Rationing:Is Also Quality Improvement!
HealthCondition
ContinuedHealth
HealthyConsumer
NoHospitalization
Acute Care Episode
Efficient Successful Outcome
Complications,Infections,
Readmissions
High-CostSuccessfulOutcome
Better Outcomes/Higher Quality

14© 2009-2011 Center for Healthcare Quality and Payment Reform, Network for Regional Healthcare Improvement
How is Cleveland Doing?
HealthCondition
ContinuedHealth
HealthyConsumer
NoHospitalization
Acute Care Episode
Efficient Successful Outcome
Complications,Infections,
Readmissions
High-CostSuccessfulOutcome

15© 2009-2011 Center for Healthcare Quality and Payment Reform, Network for Regional Healthcare Improvement
Cleveland Has 6th HighestHospital Spending Per Person
$0
$1,000
$2,000
$3,000
$4,000
$5,000
$6,000
Port
land
Seatt
leSa
cram
ento
San
Jose
San
Fran
cisc
oM
inne
apol
isCh
arlo
tte
San
Die
goAt
lant
aD
enve
rW
ashi
ngto
nPh
oeni
xPr
ovid
ence
Nor
folk
San
Anto
nio
Austi
nKa
nsas
City
Balti
mor
eM
ilwau
kee
Orla
ndo
Cinc
inna
tiIn
dian
apol
isN
ew O
rlean
sM
anha
ttan
Bost
onTa
mpa
Colu
mbu
sPh
ilade
lphi
aSt
. Lou
isD
alla
sD
etro
itN
ashv
ille
Mia
mi
Clev
elan
dLo
s Ang
eles
Hou
ston
Las V
egas
Chic
ago
Pitt
sbur
gh
Medicare Hospital Spending Per Beneficiary, 2008(Price, Age, Sex, & Race-Adjusted for Top 40 Metros)
Cleveland

16© 2009-2011 Center for Healthcare Quality and Payment Reform, Network for Regional Healthcare Improvement
Cleveland is Below U.S. Averagein Physician Spending Per Person
$0
$500
$1,000
$1,500
$2,000
$2,500
$3,000
$3,500
$4,000
Port
land
Min
neap
olis
San
Fran
cisc
oSe
attle
Sacr
amen
toM
ilwau
kee
New
Orle
ans
Bost
onCo
lum
bus
Kans
as C
ityIn
dian
apol
isSa
n Jo
seD
enve
rSt
. Lou
isCh
arlo
tte
Prov
iden
ceCh
icag
oCl
evel
and
Cinc
inna
tiN
ashv
ille
Pitt
sbur
ghAt
lant
aW
ashi
ngto
nN
orfo
lkBa
ltim
ore
San
Die
goPh
oeni
xSa
n An
toni
oAu
stin
Hou
ston
Dal
las
Phila
delp
hia
Det
roit
Tam
paLa
s Veg
asO
rland
oLo
s Ang
eles
Man
hatt
anM
iam
i
Medicare Physician Spending Per Beneficiary, 2008(Price, Age, Sex, & Race-Adjusted for Top 40 Metros)

17© 2009-2011 Center for Healthcare Quality and Payment Reform, Network for Regional Healthcare Improvement
0
20
40
60
80
100
120
140
CA-S
an F
ranc
isco
CA-S
an Jo
seCA
-Sac
ram
ento
OR-
Port
land
RI-P
rovi
denc
eLA
-New
Orle
ans
CA-S
an D
iego
WA-
Seatt
leCA
-Los
Ang
eles
MA-
Bost
onD
C-W
ashi
ngto
nFL
-Mia
mi
CO-D
enve
rG
A-At
lant
aN
V-La
s Ve
gas
NY-
Man
hatt
anTX
-San
Ant
onio
NC-
Char
lott
eTX
-Aus
tinVA
-Nor
folk
IL-C
hica
goIN
-Indi
anap
olis
TN-N
ashv
ille
TX-D
alla
sPA
-Phi
lade
lphi
aM
O-K
ansa
s Ci
tyM
N-M
inne
apol
isO
H-C
leve
land
OH
-Cin
cinn
atiTX
-Hou
ston
FL-T
ampa
MI-G
rand
Rap
ids
AZ-P
hoen
ixFL
-Orla
ndo
WI-M
ilwau
kee
MD
-Bal
timor
ePA
-Pitt
sbur
ghM
O-S
t. Lo
uis
OH
-Col
umbu
sM
I-Det
roit
All Surgical Discharges per 1,000 Medicare Enrollees (2007)
Cleveland Residents Get More Surgeries Than Other Regions
Cleveland

18© 2009-2011 Center for Healthcare Quality and Payment Reform, Network for Regional Healthcare Improvement
Worse Hips and Hearts, Better Backs and Prostates in Cleveland?
-40% -30% -20% -10% 0% 10% 20% 30%
Radical Prostatectomy
Back Surgery
Knee Replacement
Coronary Artery Bypass Grafting (CABG)
Valve Replacement
Coronary Angiography
Percutaneous Coronary Interventions
Hip Replacement
All Surgical Discharges
Surgeries Per 1000 Medicare Beneficiaries% By Which Cleveland Exceeds U.S. Rate, 2007

19© 2009-2011 Center for Healthcare Quality and Payment Reform, Network for Regional Healthcare Improvement
0
20
40
60
80
100
120
WA-
Seatt
leCA
-San
Jose
CA-S
an F
ranc
isco
OR-
Port
land
CA-S
acra
men
toCA
-San
Die
goAZ
-Pho
enix
CO-D
enve
rM
N-M
inne
apol
isVA
-Nor
folk
MI-G
rand
Rap
ids
DC-
Was
hing
ton
NV-
Las
Vega
sW
I-Milw
auke
eG
A-At
lant
aN
C-Ch
arlo
tte
TX-A
ustin
FL-T
ampa
FL-O
rland
oCA
-Los
Ang
eles
TX-S
an A
nton
ioO
H-C
inci
nnati
LA-N
ew O
rlean
sIN
-Indi
anap
olis
RI-P
rovi
denc
eN
Y-M
anha
ttan
MA-
Bost
onM
D-B
altim
ore
MO
-Kan
sas
City
TX-D
alla
sPA
-Phi
lade
lphi
aTX
-Hou
ston
OH
-Cle
vela
ndM
O-S
t. Lo
uis
MI-D
etro
itFL
-Mia
mi
OH
-Col
umbu
sIL
-Chi
cago
PA-P
ittsb
urgh
TN-N
ashv
ille
Discharges for Ambulatory Care Sensitive Conditions per 1,000 Medicare Enrollees (2007)
Cleveland Has 8th Highest Rate of Preventable Hospitalizations
Cleveland
20© 2009-2011 Center for Healthcare Quality and Payment Reform, Network for Regional Healthcare Improvement
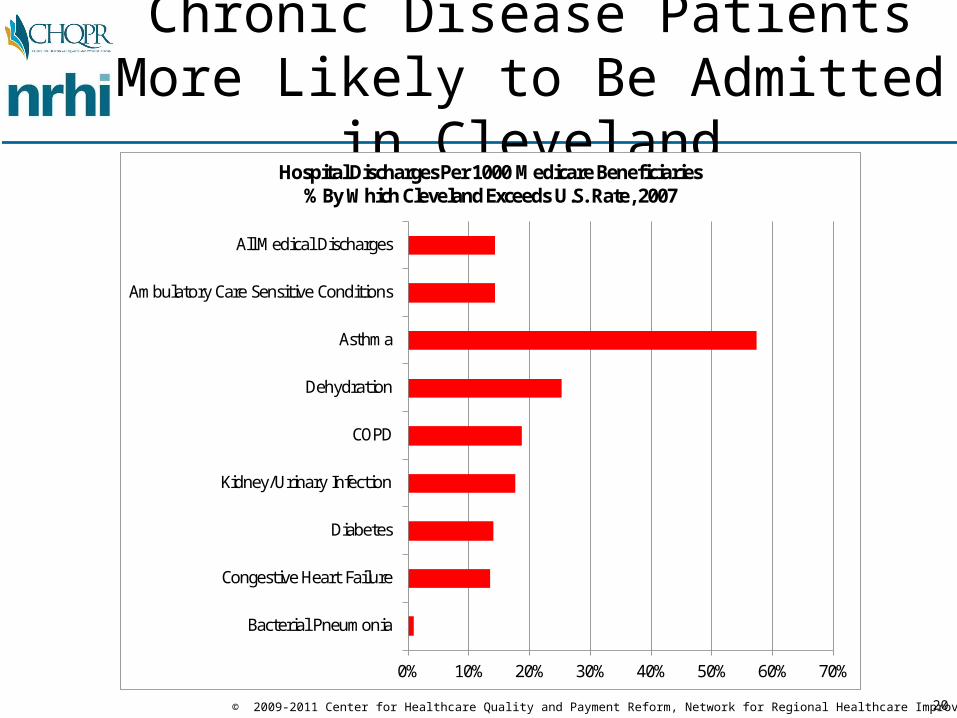
Chronic Disease Patients More Likely to Be Admitted in Cleveland
0% 10% 20% 30% 40% 50% 60% 70%
Bacterial Pneumonia
Congestive Heart Failure
Diabetes
Kidney/Urinary Infection
COPD
Dehydration
Asthma
Ambulatory Care Sensitive Conditions
All Medical Discharges
Hospital Discharges Per 1000 Medicare Beneficiaries% By Which Cleveland Exceeds U.S. Rate, 2007

21© 2009-2011 Center for Healthcare Quality and Payment Reform, Network for Regional Healthcare Improvement
1 Out of 4 Hospitalized Patients is Readmitted Within 30 Days
0% 5% 10% 15% 20% 25% 30% 35%
ST JOHN MEDICAL CENTER
FAIRVIEW HOSPITAL
EUCLID HOSPITAL
HILLCREST HOSPITAL
ST VINCENT CHARITY MEDICAL CENTER
PARMA COMMUNITY GENERAL HOSPITAL
LUTHERAN HOSPITAL
MARYMOUNT HOSPITAL
METRO HEALTH MEDICAL CENTER
UNIVERSITY HOSPITALS OF CLEVELAND
SOUTH POINTE HOSPITAL
UHHS RICHMOND HEIGHTS HOSPITAL
LAKEWOOD HOSPITAL
SOUTHWEST GENERAL HEALTH CENTER
HURON HOSPITAL
CLEVELAND CLINIC
UHHS BEDFORD MEDICAL CENTER
30 Day Readmission Rate for Heart Failure Patients

22© 2009-2011 Center for Healthcare Quality and Payment Reform, Network for Regional Healthcare Improvement
Are There Similar Issues WithCommercial/Medicaid Patients?

23© 2009-2011 Center for Healthcare Quality and Payment Reform, Network for Regional Healthcare Improvement
Are There Similar Issues WithCommercial/Medicaid Patients?
• The only way to know is to get data on all patients in Cleveland/NEO and analyze it
• Data from Electronic Medical Records/HIE– provides most comprehensive, accurate information on the
care a patient received from an individual provider and characteristics of the patient
– but only covers services from providers on EHRs and who are linked to an HIE
• Data from Health Insurance Claims– provides most complete information on all services a patient
received from all providers + cost of services– but does not provide clinical data on nature of services or
characteristics of patients
• Both Are Needed, Particularly in the Short Run

24© 2009-2011 Center for Healthcare Quality and Payment Reform, Network for Regional Healthcare Improvement
What You Can Learn from Claims:Prometheus Analysis of PACs
www.HCI3.org
Significant Spending on Potentially Avoidable Complications
for Chronic Disease Patients

25© 2009-2011 Center for Healthcare Quality and Payment Reform, Network for Regional Healthcare Improvement
Current Payment Systems Reward Bad Outcomes, Not Better Health
HealthCondition
ContinuedHealth
HealthyConsumer
NoHospitalization
Acute Care Episode
Efficient Successful Outcome
Complications,Infections,
Readmissions
High-CostSuccessfulOutcome$

26© 2009-2011 Center for Healthcare Quality and Payment Reform, Network for Regional Healthcare Improvement
Are There Better Ways to Pay for Health Care?
PreventableCondition
ContinuedHealth
HealthyConsumer
NoHospitalization
Acute Care Episode
Efficient Successful Outcome
Complications,Infections,
Readmissions
High-CostSuccessfulOutcome$ ?

27© 2009-2011 Center for Healthcare Quality and Payment Reform, Network for Regional Healthcare Improvement
“Episode Payments” to Reward Value Within Episodes
HealthCondition
ContinuedHealth
HealthyConsumer
NoHospitalization
Acute Care Episode
Efficient Successful Outcome
Complications,Infections,
Readmissions
High-CostSuccessfulOutcomeEpisode
Payment$A Single Payment
For All Care Needed From All Providers in
the Episode, With a Warranty For
Complications
28© 2009-2011 Center for Healthcare Quality and Payment Reform, Network for Regional Healthcare Improvement
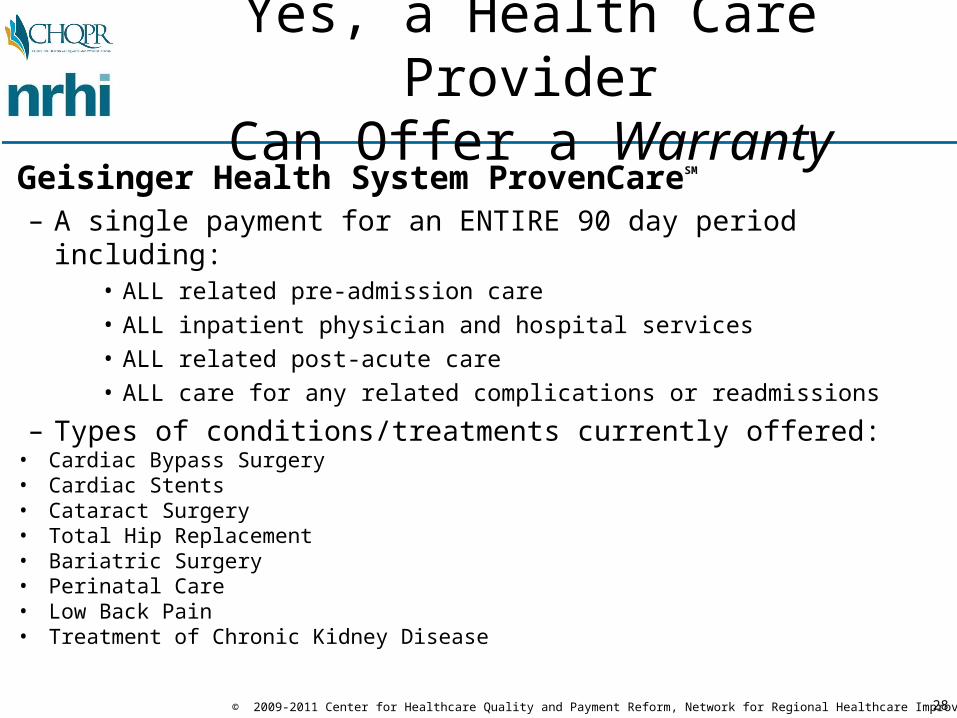
Yes, a Health Care ProviderCan Offer a Warranty
Geisinger Health System ProvenCareSM
– A single payment for an ENTIRE 90 day period including:• ALL related pre-admission care
• ALL inpatient physician and hospital services
• ALL related post-acute care
• ALL care for any related complications or readmissions
– Types of conditions/treatments currently offered:• Cardiac Bypass Surgery• Cardiac Stents• Cataract Surgery• Total Hip Replacement• Bariatric Surgery• Perinatal Care• Low Back Pain• Treatment of Chronic Kidney Disease

29© 2009-2011 Center for Healthcare Quality and Payment Reform, Network for Regional Healthcare Improvement
Payment + Process Improvement = Better Outcomes, Lower Costs

30© 2009-2011 Center for Healthcare Quality and Payment Reform, Network for Regional Healthcare Improvement

31© 2009-2011 Center for Healthcare Quality and Payment Reform, Network for Regional Healthcare Improvement
What a Single Physician and Hospital Can Do
• In 1987, an orthopedic surgeon in Lansing, MI and the local hospital, Ingham Medical Center, offered:– a fixed total price for surgical services for shoulder and knee problems– a warranty for any subsequent services needed for a two-year period,
including repeat visits, imaging, rehospitalization and additional surgery.
• Results:– Surgeon received over 80% more in payment than otherwise – Hospital received 13% more than otherwise, despite fewer
rehospitalizations– Health insurer paid 40% less than otherwise
• Method: – Reducing unnecessary auxiliary services such as radiography and
physical therapy– Reducing the length of stay in the hospital– Reducing complications and readmissions.

32© 2009-2011 Center for Healthcare Quality and Payment Reform, Network for Regional Healthcare Improvement
The Weakness of Episode Payment
HealthCondition
ContinuedHealth
HealthyConsumer
NoHospitalization
Acute Care Episode
Efficient Successful Outcome
Complications,Infections,
Readmissions
High-CostSuccessfulOutcomeEpisode
Payment
How do you preventunnecessary episodes
of care?(e.g., preventable hospitalizations
for chronic disease, overuse of cardiac
surgery,back surgery, etc.)

33© 2009-2011 Center for Healthcare Quality and Payment Reform, Network for Regional Healthcare Improvement
Comprehensive Care PaymentsTo Avoid Episodes
HealthCondition
ContinuedHealth
HealthyConsumer
NoHospitalization
Acute Care Episode
Efficient Successful Outcome
Complications,Infections,
Readmissions
High-CostSuccessfulOutcome
A Single Payment
For All CareNeeded ForA Condition
$ ComprehensiveCare
Paymentor
“Global”Payment

34© 2009-2011 Center for Healthcare Quality and Payment Reform, Network for Regional Healthcare Improvement
Payment Levels Adjusted Based on Patient Conditions
Providers Lose Money On Unusually
Expensive Cases
Limits on Total RiskProviders Accept forUnpredictable Events
Providers Are Paid Regardless of the
Quality of Care
Bonuses/PenaltiesBased on Quality
Measurement
Provider Makes More Money If
Patients Stay Well
Provider Makes More Money If
Patients Stay Well
Flexibility to DeliverHighest-Value
Services
Flexibility to DeliverHighest-Value
Services
No Additional Revenuefor Taking Sicker
Patients
CAPITATION (WORST VERSIONS)
COMPREHENSIVE CARE PAYMENT
Isn’t This Capitation?No – It’s Different

35© 2009-2011 Center for Healthcare Quality and Payment Reform, Network for Regional Healthcare Improvement
Example: BCBS MassachusettsAlternative Quality Contract
• Single payment for all costs of care for a population of patients– Adjusted up/down annually based on severity of patient conditions– Initial payment set based on past expenditures, not arbitrary estimates– Provides flexibility to pay for new/different services– Bonus paid for high quality care
• Five-year contract – Savings for payer achieved by controlling increases in costs– Allows provider to reap returns on investment in preventive care,
infrastructure
• Broad participation– 14 physician groups/health systems participating with over 400,000
patients, including one primary care IPA with 72 physicians
• Positive first-year results– Higher ambulatory care quality than non-AQC practices, better patient
outcomes, lower readmission rates and ER utilizationhttp://www.bluecrossma.com/visitor/about-us/making-quality-health-care-affordable.html

36© 2009-2011 Center for Healthcare Quality and Payment Reform, Network for Regional Healthcare Improvement
Comprehensive Care & Episode Payment Can Be Complementary
HealthCondition
ContinuedHealth
HealthyConsumer
NoHospitalization
Acute Care Episode
Efficient Successful Outcome
Complications,Infections,
Readmissions
High-CostSuccessfulOutcome
$ Comp.Care/
Global Payment
EpisodePayment
E.g., annual pmtto manage an individual’s chronic disease, includinghospitalizations
E.g., the payment madewhen the individualhas an exacerbationrequiring hospitalization

37© 2009-2011 Center for Healthcare Quality and Payment Reform, Network for Regional Healthcare Improvement
Payment Reform Allows Pursuing a Different “Triple Aim”
• Better Care for Patients (Win)• Lower Costs for Purchasers/Payers (Win)• Equal or Better Margins for Providers (Win)

38© 2009-2011 Center for Healthcare Quality and Payment Reform, Network for Regional Healthcare Improvement
Example: $10,000 Procedure
Cost of Procedure
$10,000
39© 2009-2011 Center for Healthcare Quality and Payment Reform, Network for Regional Healthcare Improvement
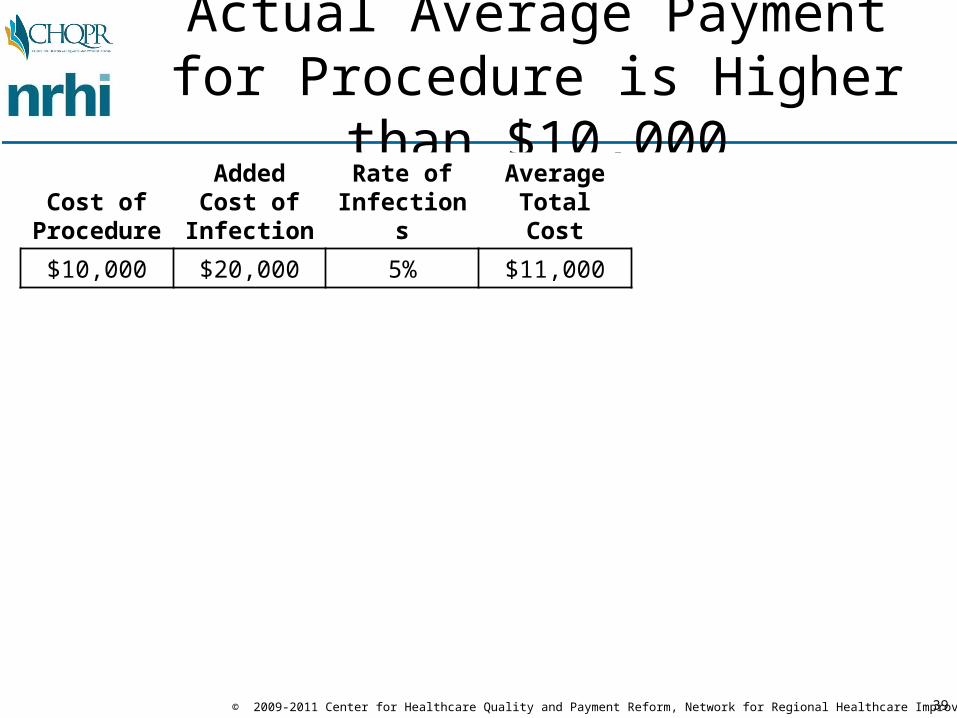
Actual Average Payment for Procedure is Higher than $10,000
Cost of Procedure
AddedCost of
InfectionRate of
InfectionsAverage
Total Cost
$10,000 $20,000 5% $11,000

40© 2009-2011 Center for Healthcare Quality and Payment Reform, Network for Regional Healthcare Improvement
Starting Point for Warranty Price:Actual Current Average Payment
Cost of Procedure
AddedCost of
InfectionRate of
InfectionsAverage
Total CostPrice
Charged
Change in Net
Revenue
$10,000 $20,000 5% $11,000 $11,000 $0

41© 2009-2011 Center for Healthcare Quality and Payment Reform, Network for Regional Healthcare Improvement
Limited Warranty Gives Financial Incentive to Improve Quality
Cost of Procedure
AddedCost of
InfectionRate of
InfectionsAverage
Total CostPrice
Charged
Change in Net
Revenue
$10,000 $20,000 5% $11,000 $11,000 $0
$10,000 $20,000 4% $10,800 $11,000 $200
ReducingAdverseEvents…
…ImprovesThe Bottom
Line
...ReducesCosts...
42© 2009-2011 Center for Healthcare Quality and Payment Reform, Network for Regional Healthcare Improvement
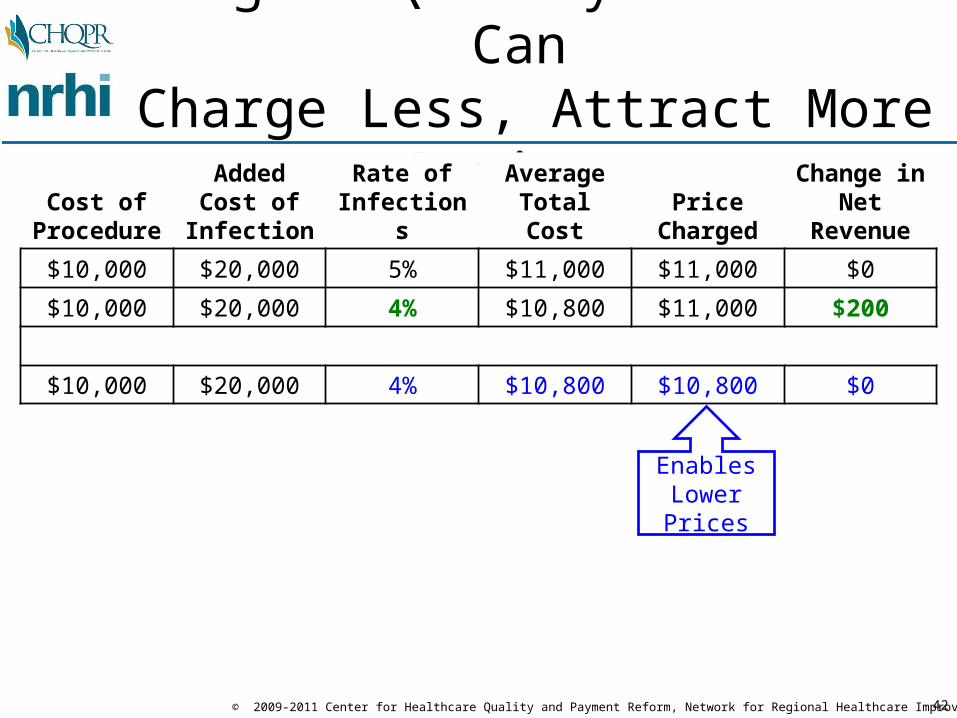
Higher-Quality Provider Can Charge Less, Attract More Patients
Cost of Procedure
AddedCost of
InfectionRate of
InfectionsAverage
Total CostPrice
Charged
Change in Net
Revenue
$10,000 $20,000 5% $11,000 $11,000 $0
$10,000 $20,000 4% $10,800 $11,000 $200
$10,000 $20,000 4% $10,800 $10,800 $0
EnablesLowerPrices

43© 2009-2011 Center for Healthcare Quality and Payment Reform, Network for Regional Healthcare Improvement
A Virtuous Cycle of QualityImprovement & Cost Reduction
Cost of Procedure
AddedCost of
InfectionRate of
InfectionsAverage
Total CostPrice
Charged
Change in Net
Revenue
$10,000 $20,000 5% $11,000 $11,000 $0
$10,000 $20,000 4% $10,800 $11,000 $200
$10,000 $20,000 4% $10,800 $10,800 $0
$10,000 $20,000 3% $10,600 $10,800 $200
ReducingAdverseEvents…
…ImprovesThe Bottom
Line
...ReducesCosts...

44© 2009-2011 Center for Healthcare Quality and Payment Reform, Network for Regional Healthcare Improvement
Win-Win-Win for Patients, Payers, and Providers
Cost of Procedure
AddedCost of
InfectionRate of
InfectionsAverage
Total CostPrice
Charged
Change in Net
Revenue
$10,000 $20,000 5% $11,000 $11,000 $0
$10,000 $20,000 4% $10,800 $11,000 $200
$10,000 $20,000 4% $10,800 $10,800 $0
$10,000 $20,000 3% $10,600 $10,800 $200
$10,000 $20,000 3% $10,600 $10,600 $0
$10,000 $20,000 0% $10,000 $10,600 $600
Quality is Better......Cost is Lower...
...Providers More Profitable

45© 2009-2011 Center for Healthcare Quality and Payment Reform, Network for Regional Healthcare Improvement
In Contrast, Non-Payment Alone Creates Financial Losses
Cost of Procedure
AddedCost of
InfectionRate of
InfectionsAverage
Total CostAmount
Paid
Change in Net
Revenue
$10,000 $20,000 5% $11,000 $11,000 $0
$10,000 $20,000 5% $11,000 $10,000 -$1,000
$10,000 $20,000 3% $10,600 $10,000 -$600
$10,000 $20,000 0% $10,000 $10,000 $0
Non-Payment
forInfections
Causes Losses While
Improving

46© 2009-2011 Center for Healthcare Quality and Payment Reform, Network for Regional Healthcare Improvement
Not Just Better Acute Care,But Reducing the Need for It
HealthCondition
ContinuedHealth
HealthyConsumer
NoHospitalization
Acute Care Episode
Efficient Successful Outcome
Complications,Infections,
Readmissions
High-CostSuccessfulOutcome

47© 2009-2011 Center for Healthcare Quality and Payment Reform, Network for Regional Healthcare Improvement
Significant Reduction in Rate of Hospitalizations Possible
Examples:• 40% reduction in hospital admissions, 41% reduction in ER visits for
exacerbations of COPD using in-home & phone patient education by nurses or respiratory therapists
J. Bourbeau, M. Julien, et al, “Reduction of Hospital Utilization in Patients with Chronic Obstructive Pulmonary Disease: A Disease-Specific Self-Management Intervention,” Archives of Internal Medicine 163(5), 2003
• 66% reduction in hospitalizations for CHF patients using home-based telemonitoring
M.E. Cordisco, A. Benjaminovitz, et al, “Use of Telemonitoring to Decrease the Rate of Hospitalization in Patients With Severe Congestive Heart Failure,” American Journal of Cardiology 84(7), 1999
• 27% reduction in hospital admissions, 21% reduction in ER visits through self-management education
M.A. Gadoury, K. Schwartzman, et al, “Self-Management Reduces Both Short- and Long-Term Hospitalisation in COPD,” European Respiratory Journal 26(5), 2005

48© 2009-2011 Center for Healthcare Quality and Payment Reform, Network for Regional Healthcare Improvement
ERVisits
Lab Work/Imaging
HospitalStay
Health Insurance Plan
PhysicianPractice
$ $
We Don’t Pay for the Things That Will Prevent OverutilizationCURRENT PAYMENT SYSTEMS
Avoidable
Avoidable
Avoidable
OfficeVisits
NurseCare Mgr
PhoneCalls
$
No payment for
services that can prevent utilization...
...No penalty or reward for
high utilizationelsewhere

49© 2009-2011 Center for Healthcare Quality and Payment Reform, Network for Regional Healthcare Improvement
ERVisits
Lab Work/Imaging
HospitalStay
Health Insurance Plan
PhysicianPractice
$ $
Option 1: Add New Fee Codes for Unreimbursed PCP Services
MEDICAL HOME PROGRAM
Avoidable
Avoidable
Avoidable
OfficeVisits
NurseCare Mgr
PhoneCalls
$Higher payment for primary care
$

50© 2009-2011 Center for Healthcare Quality and Payment Reform, Network for Regional Healthcare Improvement
ERVisits
Lab Work/Imaging
HospitalStay
Health Insurance Plan
PhysicianPractice
$ $
Option 2: Pay for Monthly “Care Mgt” to Cover Missing Services
MEDICAL HOME PROGRAM
Avoidable
Avoidable
Avoidable
$Higher payment for primary care
OfficeVisits
RN Care Mgr
PhoneCalls
MonthlyCare MgtPayment
$

51© 2009-2011 Center for Healthcare Quality and Payment Reform, Network for Regional Healthcare Improvement
ERVisits
Lab Work/Imaging
HospitalStay
Health Insurance Plan
PhysicianPractice
$ $
More $ for PCPs, But Any Savings Elsewhere?
MEDICAL HOME PROGRAM
Avoidable
Avoidable
Avoidable
$Higher payment for primary care
...But no commitment
to reduceutilizationelsewhere
OfficeVisits
RN Care Mgr
PhoneCalls
MonthlyCare MgtPayment
$
52© 2009-2011 Center for Healthcare Quality and Payment Reform, Network for Regional Healthcare Improvement
SpecialtyConsults
Lab Work/Imaging
HospitalStay
Health Insurance Plan
PhysicianPractice
$ $
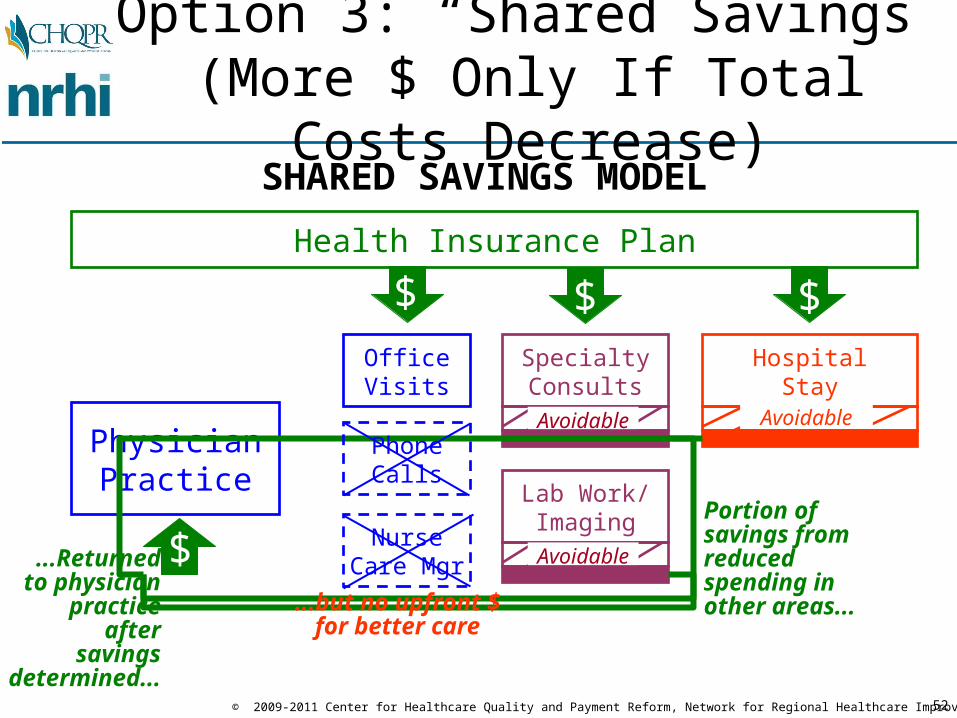
Option 3: “Shared Savings” (More $ Only If Total Costs Decrease)
SHARED SAVINGS MODEL
Avoidable Avoidable
Avoidable$Portion of savings from reducedspending in other areas...
...Returnedto physician
practice aftersavings
determined...
...but no upfront $for better care
OfficeVisits
NurseCare Mgr
PhoneCalls
$

53© 2009-2011 Center for Healthcare Quality and Payment Reform, Network for Regional Healthcare Improvement
Weaknesses of “Shared Savings”
• Provides no upfront money to enable physician practices to hire nurse care managers, install IT, etc.; additional funds, if any, come years after the care changes are made
• The underlying fee for service incentives continue; losing less (via shared savings) is still losing compared to FFS
• Requires TOTAL costs to go down in order for the physician practice to receive ANY increase in payment, even if the practice can’t control all costs
• Gives more rewards to the poor performers who improve than the providers who’ve done well all along
• I.e., it’s not really true payment reform

54© 2009-2011 Center for Healthcare Quality and Payment Reform, Network for Regional Healthcare Improvement
Health Insurance Plan
PhysicianPractice
$ $ $
Option 4: Resources + Accountability
CARE MGT PAYMENT + UTILIZATION P4P
ERVisits
Lab Work/Imaging
HospitalStay
Avoidable Avoidable
Avoidable
P4P Bonus/PenaltyBased on Utilization
$OfficeVisits
$
$ $
$
RN Care Mgr
PhoneCalls
MonthlyCare MgtPayment
More $for PCP
Targets forReduction
In Utilization
$

55© 2009-2011 Center for Healthcare Quality and Payment Reform, Network for Regional Healthcare Improvement
Example: Washington State Medical Home Pilot Program
• Payers will pay the Primary Care Practice an upfront PMPM Care Management Payment for all patients ($2.50 first year, $2.00 future years)
• Practice agrees to reduce rate of non-urgent ER visits and ambulatory care-sensitive hospital admissions by amounts which will generate savings for payers at least equal to the Care Management Payment (targets are practice specific)
• If a practice reduces ER visits and hospitalizations by more than the target amount, the payer shares 50% of the net savings (gross savings minus the PMPM) with the practice
• If a practice fails to meet its ER/hospitalization targets, thepractice pays a penalty equivalent to up to 50% of Care Management Payment
56© 2009-2011 Center for Healthcare Quality and Payment Reform, Network for Regional Healthcare Improvement
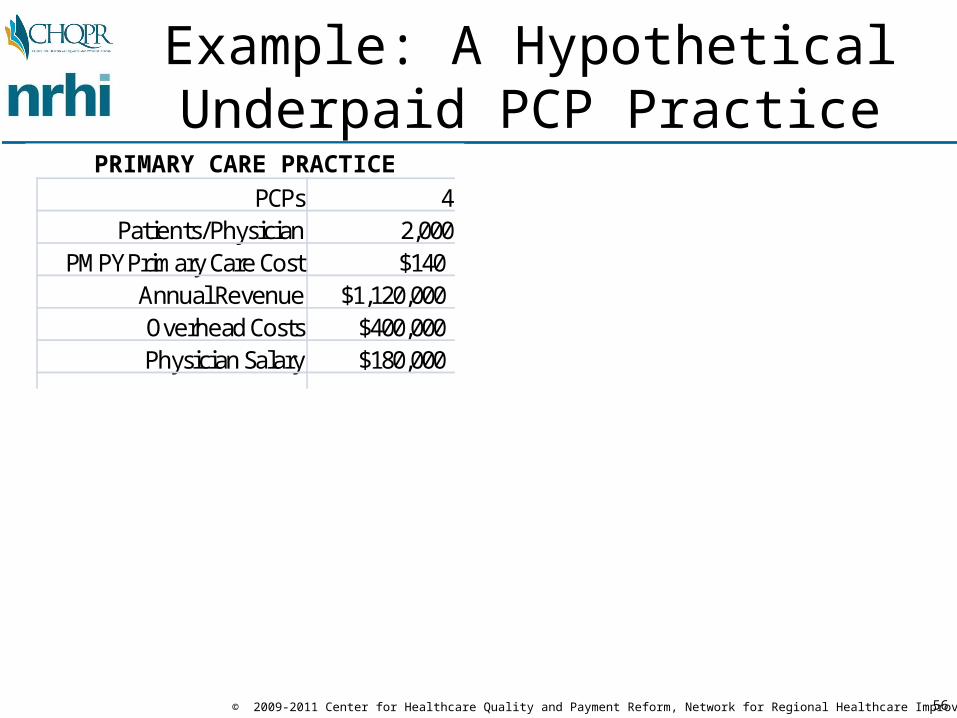
PRIMARY CARE PRACTICEPCPs 4 ER Visits/1000 200
Patients/Physician 2,000 % Preventable 40%PMPY Primary Care Cost $140 Per ER Visit $1,000
Annual Revenue $1,120,000 ER Visit Cost to Payer $640,000Overhead Costs $400,000Physician Salary $180,000
Cost of Nurse Practitioner $80,000 Reduction in Prev. ER Visits 40%Other Costs $10,000 Savings $256,000Total Costs $90,000
Upfront Payment $90,000 Payment to Practice $90,000Net Savings to Payer $166,000
Share of Savings $83,000 Share to Practice 50%New Physician Salary $200,750 Net Savings to Payer $83,000
Increase in Phys. Salary 12% % Savings to Payer 13%
Example: A Hypothetical Underpaid PCP Practice

57© 2009-2011 Center for Healthcare Quality and Payment Reform, Network for Regional Healthcare Improvement
PRIMARY CARE PRACTICE HEALTH PLAN ER EXPENSESPCPs 4 ER Visits/1000 200
Patients/Physician 2,000 % Preventable 40%PMPY Primary Care Cost $140 Per ER Visit $1,000
Annual Revenue $1,120,000 ER Visit Cost to Payer $640,000Overhead Costs $400,000Physician Salary $180,000
Cost of Nurse Practitioner $80,000 Reduction in Prev. ER Visits 40%Other Costs $10,000 Savings $256,000Total Costs $90,000
Upfront Payment $90,000 Payment to Practice $90,000Net Savings to Payer $166,000
Share of Savings $83,000 Share to Practice 50%New Physician Salary $200,750 Net Savings to Payer $83,000
Increase in Phys. Salary 12% % Savings to Payer 13%
Many Patients Are Going to ER Due to Difficulty Seeing PCPs

58© 2009-2011 Center for Healthcare Quality and Payment Reform, Network for Regional Healthcare Improvement
PRIMARY CARE PRACTICE HEALTH PLAN ER EXPENSESPCPs 4 ER Visits/1000 200
Patients/Physician 2,000 % Preventable 40%PMPY Primary Care Cost $140 Per ER Visit $1,000
Annual Revenue $1,120,000 ER Visit Cost to Payer $640,000Overhead Costs $400,000Physician Salary $180,000
Cost of Nurse Practitioner $80,000 Reduction in Prev. ER Visits 40%Other Costs $10,000 Savings $256,000Total Costs $90,000
Upfront Payment $90,000 Payment to Practice $90,000Net Savings to Payer $166,000
Share of Savings $83,000 Share to Practice 50%New Physician Salary $200,750 Net Savings to Payer $83,000
Increase in Phys. Salary 12% % Savings to Payer 13%
PCPs Could Reduce ER Expenses With Right Resources

59© 2009-2011 Center for Healthcare Quality and Payment Reform, Network for Regional Healthcare Improvement
Upfront Money Could Enable PCPs to Change, If Willing
PRIMARY CARE PRACTICE HEALTH PLAN ER EXPENSESPCPs 4 ER Visits/1000 200
Patients/Physician 2,000 % Preventable 40%PMPY Primary Care Cost $140 Per ER Visit $1,000
Annual Revenue $1,120,000 ER Visit Cost to Payer $640,000Overhead Costs $400,000Physician Salary $180,000
Cost of Nurse Practitioner $80,000 Reduction in Prev. ER Visits 40%Other Costs $10,000 Savings $256,000Total Costs $90,000
Upfront Payment $90,000 Payment to Practice $90,000Net Savings to Payer $166,000
Share of Savings $83,000 Share to Practice 50%New Physician Salary $200,750 Net Savings to Payer $83,000
Increase in Phys. Salary 12% % Savings to Payer 13%
60© 2009-2011 Center for Healthcare Quality and Payment Reform, Network for Regional Healthcare Improvement
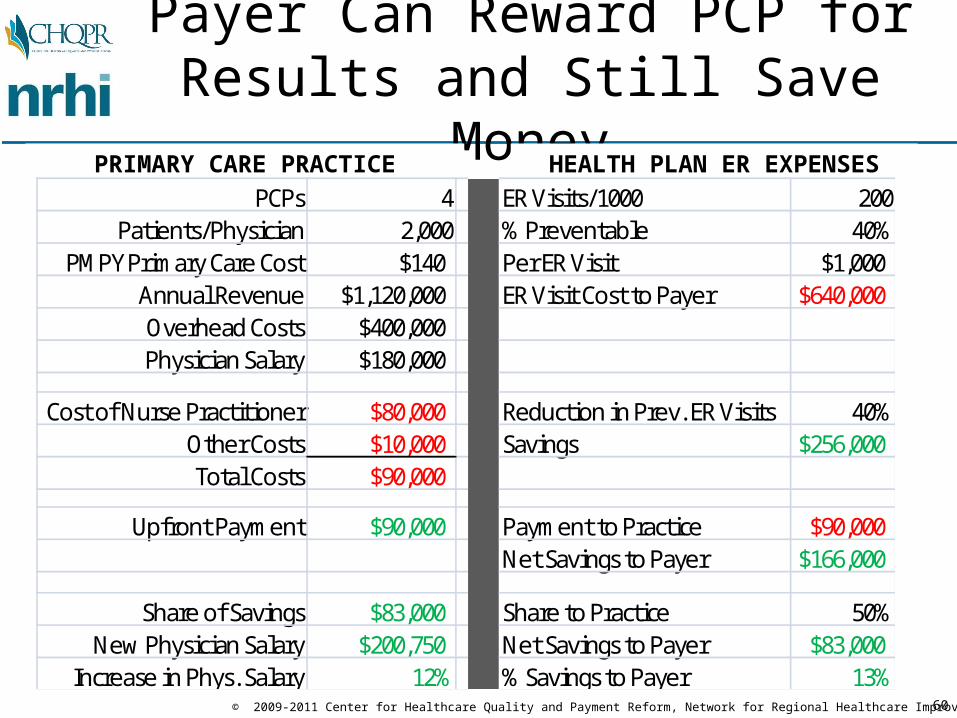
Payer Can Reward PCP for Results and Still Save Money
PRIMARY CARE PRACTICE HEALTH PLAN ER EXPENSESPCPs 4 ER Visits/1000 200
Patients/Physician 2,000 % Preventable 40%PMPY Primary Care Cost $140 Per ER Visit $1,000
Annual Revenue $1,120,000 ER Visit Cost to Payer $640,000Overhead Costs $400,000Physician Salary $180,000
Cost of Nurse Practitioner $80,000 Reduction in Prev. ER Visits 40%Other Costs $10,000 Savings $256,000Total Costs $90,000
Upfront Payment $90,000 Payment to Practice $90,000Net Savings to Payer $166,000
Share of Savings $83,000 Share to Practice 50%New Physician Salary $200,750 Net Savings to Payer $83,000
Increase in Phys. Salary 12% % Savings to Payer 13%

61© 2009-2011 Center for Healthcare Quality and Payment Reform, Network for Regional Healthcare Improvement
Win-Win-Win forPCPs, Patients, & Premiums
PRIMARY CARE PRACTICE HEALTH PLAN ER EXPENSESPCPs 4 ER Visits/1000 200
Patients/Physician 2,000 % Preventable 40%PMPY Primary Care Cost $140 Per ER Visit $1,000
Annual Revenue $1,120,000 ER Visit Cost to Payer $640,000Overhead Costs $400,000Physician Salary $180,000
Cost of Nurse Practitioner $80,000 Reduction in Prev. ER Visits 40%Other Costs $10,000 Savings $256,000Total Costs $90,000
Upfront Payment $90,000 Payment to Practice $90,000Net Savings to Payer $166,000
Share of Savings $83,000 Share to Practice 50%New Physician Salary $200,750 Net Savings to Payer $83,000
Increase in Phys. Salary 12% % Savings to Payer 13%

62© 2009-2011 Center for Healthcare Quality and Payment Reform, Network for Regional Healthcare Improvement
But Upfront Payment Reform is Needed So Care Can Be Changed
PRIMARY CARE PRACTICE HEALTH PLAN ER EXPENSESPCPs 4 ER Visits/1000 200
Patients/Physician 2,000 % Preventable 40%PMPY Primary Care Cost $140 Per ER Visit $1,000
Annual Revenue $1,120,000 ER Visit Cost to Payer $640,000Overhead Costs $400,000Physician Salary $180,000
Cost of Nurse Practitioner $80,000 Reduction in Prev. ER Visits 40%Other Costs $10,000 Savings $256,000Total Costs $90,000
Upfront Payment $90,000 Payment to Practice $90,000Net Savings to Payer $166,000
Share of Savings $83,000 Share to Practice 50%New Physician Salary $200,750 Net Savings to Payer $83,000
Increase in Phys. Salary 12% % Savings to Payer 13%

63© 2009-2011 Center for Healthcare Quality and Payment Reform, Network for Regional Healthcare Improvement
And Outcome Targets Need to Be Things Physicians Can Influence
PRIMARY CARE PRACTICE HEALTH PLAN ER EXPENSESPCPs 4 ER Visits/1000 200
Patients/Physician 2,000 % Preventable 40%PMPY Primary Care Cost $140 Per ER Visit $1,000
Annual Revenue $1,120,000 ER Visit Cost to Payer $640,000Overhead Costs $400,000Physician Salary $180,000
Cost of Nurse Practitioner $80,000 Reduction in Prev. ER Visits 40%Other Costs $10,000 Savings $256,000Total Costs $90,000
Upfront Payment $90,000 Payment to Practice $90,000Net Savings to Payer $166,000
Share of Savings $83,000 Share to Practice 50%New Physician Salary $200,750 Net Savings to Payer $83,000
Increase in Phys. Salary 12% % Savings to Payer 13%

64© 2009-2011 Center for Healthcare Quality and Payment Reform, Network for Regional Healthcare Improvement
Option 4a: CMS Comprehensive Primary Care Initiative
• Demonstration project for 7 practices in 5-7 markets• Upfront Care Management Payment for PCPs
– Monthly care management payment for each Medicare beneficiary and Medicaid recipient
– Payment ranges from $8-40 based on severity of patients’ conditions
– Average of $20 in Years 1-2; reduced to $15 in Years 3-4
• Shared Savings Payment for PCPs– If total cost of care for Medicare patients decreases for ALL
practices in the market in Years 2-4, PCPs receive a share of those savings
– Quality/patient experience performance required in order for savings to be shared

65© 2009-2011 Center for Healthcare Quality and Payment Reform, Network for Regional Healthcare Improvement
Not Just PCPs, But The Medical Neighborhood, Too
Primary CareMedical Home
(Non-Primary Care)
Specialists
PATIENT
FFS Payment Based on Volume,
Procedures, & Office Visits
Resources &Incentives for
More CoordinatedCare

66© 2009-2011 Center for Healthcare Quality and Payment Reform, Network for Regional Healthcare Improvement
Pay Both PCPs & Specialists for Outcomes & Coordination
Primary CareMedical Home
(Non-Primary Care)
Specialists
PATIENT
Resources &Incentives for
More CoordinatedCare
Payment for Consultation w/ PCP;
Outcomes-BasedPayment

67© 2009-2011 Center for Healthcare Quality and Payment Reform, Network for Regional Healthcare Improvement
Minnesota’s DIAMOND Initiative
• Goal: improve outcomes for patients with depression• Convened all payers in Minnesota (except for
Medicare) to agree on common payment changes for PCPs & specialists
• Payment changes:– Support for a care manager in the primary care practice– Psychiatrists paid to consult with PCP on how to manage
patient’s care comprehensively, rather than patient having to see psychiatrist separately
• Result: Dramatic improvement in remission ratehttp://www.icsi.org/health_care_redesign_/diamond_35953/

68© 2009-2011 Center for Healthcare Quality and Payment Reform, Network for Regional Healthcare Improvement
Health Insurance Plan
PhysicianPractice
$ $
Option 5: Partial Comprehensive Care Payment
PARTIAL GLOBAL PMT (Professional Svcs)
ERVisits
Lab Work/Imaging
HospitalStay
Avoidable Avoidable
Avoidable
$
$
Condition-Adjusted
Per PersonPayment
Flexibility and accountabilityfor a condition-adjusted budget
covering all professional services
OfficeVisits
NurseCare Mgr
PhoneCalls
$ $P4P Bonus/PenaltyBased on Utilization

69© 2009-2011 Center for Healthcare Quality and Payment Reform, Network for Regional Healthcare Improvement
ERVisits
Lab Work/Imaging
HospitalStay
Health Insurance Plan
PhysicianPractice/
ACO
Option 6: Risk-Adjusted Full Comprehensive Care Payment
COMPREHENSIVE CARE/YEAR-LONG EPISODE
Avoidable Avoidable
Avoidable
$
$Condition-
AdjustedPer PersonPayment Office
Visits
NurseCare Mgr
PhoneCalls
$ $
P4P Bonus/PenaltyBased on Quality

70© 2009-2011 Center for Healthcare Quality and Payment Reform, Network for Regional Healthcare Improvement
Transitioning to Accountable Care Payment
Health Insurance Plan
PhysicianPractice
$ $ $
CARE MGT PAYMENT + UTILIZATION P4P
ERVisits
Lab Work/Imaging
HospitalStay
Avoidable Avoidable
Avoidable
P4P Bonus/PenaltyBased on Utilization
$
$
OfficeVisits
$ $
$
RN Care Mgr
PhoneCalls
MonthlyCare MgtPayment
More $for PCP
Targets forReduction
In Utilization
$
Health Insurance Plan
PhysicianPractice
$ $
PARTIAL GLOBAL PMT (Professional Svcs)
ERVisits
Lab Work/Imaging
HospitalStay
Avoidable Avoidable
Avoidable
$
$
Condition-Adjusted
Per PersonPayment
Flexibility and accountabilityfor a condition-adjusted budget
covering all professional services
OfficeVisits
NurseCare Mgr
PhoneCalls
$
$ $P4P Bonus/PenaltyBased on Utilization
ERVisits
Lab Work/Imaging
HospitalStay
Health Insurance Plan
PhysicianPractice/
ACO
FULL COMP. CARE/GLOBAL PMT + QUALITY P4P
Avoidable Avoidable
Avoidable
$
$Condition-
AdjustedPer PersonPayment Office
Visits
NurseCare Mgr
PhoneCalls
P4P Bonus/PenaltyBased on Quality
$ $

71© 2009-2011 Center for Healthcare Quality and Payment Reform, Network for Regional Healthcare Improvement
A Critical Element isShared, Trusted Data for Pricing
• Provider needs to know what its current utilization rates, preventable complication rates, etc. are to know whether an episode or global payment amount will cover its costs of delivering care
• Purchaser needs to know what its current utilization rates, preventable complication rates, etc. are to know whether an episode or global payment amount is a better deal than they have today
• Both sets of data have to match in order for both providers and payers to agree!

72© 2009-2011 Center for Healthcare Quality and Payment Reform, Network for Regional Healthcare Improvement
Short-Term Payments Focus on Short-Term Costs/Outcomes
HealthCondition
Hospitalization Episode
Readmission
No HospitalizationHealthy
Consumer
ContinuedHealth
PreventionServices
Episode PaymentMedical Home/Year-Long Episode

73© 2009-2011 Center for Healthcare Quality and Payment Reform, Network for Regional Healthcare Improvement
Where is the Incentive for Prevention?
HealthCondition
Hospitalization Episode
Readmission
No HospitalizationHealthy
Consumer
ContinuedHealth
PreventionServices
Episode PaymentMedical Home/Year-Long Episode

74© 2009-2011 Center for Healthcare Quality and Payment Reform, Network for Regional Healthcare Improvement
Global Payment Can Help, But Only If It’s a Multi-Year Contract
HealthCondition
Hospitalization Episode
Readmission
No HospitalizationHealthy
Consumer
5+ Years
ContinuedHealth
PreventionServices

75© 2009-2011 Center for Healthcare Quality and Payment Reform, Network for Regional Healthcare Improvement
What Skills Do Physicians Need to Take Accountability?
PhysicianPractice ? Patient
UnneededTesting
InpatientEpisodes

76© 2009-2011 Center for Healthcare Quality and Payment Reform, Network for Regional Healthcare Improvement
Resources/Capabilities Neededfor MDs to Take Accountability
Patient
UnneededTesting
InpatientEpisodes
MD w/ time for diagnosis,treatment planning, and followup
Resources for patient educ. & self-mgt support (e.g., RN care mgr)
Method for targeting high-riskpatients (e.g., predictive modeling)
Capability for tracking patient care and ensuring followup (e.g., registry)
Coordinated relationships with other specialists and hospitals
Data and analytics to measure and monitor utilization and quality
PhysicianPractice

77© 2009-2011 Center for Healthcare Quality and Payment Reform, Network for Regional Healthcare Improvement
Capabilities Exist Today, But Don’t Coordinate w/ Physicians
Physician w/ time for diagnosis,treatment planning, and followup
Resources for patient educ. & self-mgt support (e.g., RN care mgr)
Coordinated relationships withother specialists and hospitals
Data and analytics to measure and monitor utilization and quality
PhysicianPractice
HealthPlanorDiseaseMgtVendor
Method for targeting high-riskpatients (e.g., predictive modeling)
Capability for tracking patient care and ensuring followup (e.g., registry)
Patient
UnneededTesting
InpatientEpisodes

78© 2009-2011 Center for Healthcare Quality and Payment Reform, Network for Regional Healthcare Improvement
Medical Home Initiatives Expand MD Capacity, But Not Enough
MD w/ time for diagnosis,treatment planning, and followup
Resources for patient educ. & self-mgt support (e.g., RN care mgr)
Coordinated relationships withother specialists and hospitals
Data and analytics to measure and monitor utilization and quality
Patient-CenteredMedicalHome
HealthPlan
Method for targeting high-riskpatients (e.g., predictive modeling)
Capability for tracking patient care and ensuring followup (e.g., registry)
Patient
UnneededTesting
InpatientEpisodes

79© 2009-2011 Center for Healthcare Quality and Payment Reform, Network for Regional Healthcare Improvement
Global/Episode Payment RequiresROI Analysis & Targeting
• Return on Investment (ROI; Cost-Effectiveness)– Cost of intervention
vs.– Savings from reduced utilization
• Timeframe for Return– Short-term: readmission, ER reduction, complex patients– Long-term: prevention, early-stage chronic disease patients
• Targeting Services/Patient Segmentation– Focusing additional services on high-utilization patients
vs.– Providing services to all patients as a general “benefit”

80© 2009-2011 Center for Healthcare Quality and Payment Reform, Network for Regional Healthcare Improvement
Goal: Give MDs the Capacityto Deliver “Accountable Care”
MD w/ time for diagnosis,treatment planning, and followup
Resources for patient educ. & self-mgt support (e.g., RN care mgr)
Method for targeting high-riskpatients (e.g., predictive modeling)
Capability for tracking patient care and ensuring followup (e.g., registry)
Coordinated relationships withother specialists and hospitals
Data and analytics to measure and monitor utilization and quality
PhysicianPractice+Partners=ACO
Patient
UnneededTesting
InpatientEpisodes

81© 2009-2011 Center for Healthcare Quality and Payment Reform, Network for Regional Healthcare Improvement
Should We Just Focus Changeson the Highest Cost Patients?

82© 2009-2011 Center for Healthcare Quality and Payment Reform, Network for Regional Healthcare Improvement
Some Savings Will Just BeRegression to the Mean

83© 2009-2011 Center for Healthcare Quality and Payment Reform, Network for Regional Healthcare Improvement
Patients With Chronic Disease Will Be the Future “High-Cost” Patients
High Cost in 1997
Hospital Admission
in 1997
Multiple Chronic
Conditions in 1997
Random Sample of
Beneficiaries
Average Spending in 1997 $22,990 $24,890 $16,940 $6,180
Average Spending Over Next 4 Years $12,038 $11,545 $11,855 $6,870
% Change -48% -54% -30% 11%
Share of Total Medicare Spending
Over Next 4 Years 29% 28% 28%
Source: "High-Cost Medicare Beneficiaries," Congressional Budget Office, May 2005

84© 2009-2011 Center for Healthcare Quality and Payment Reform, Network for Regional Healthcare Improvement
Benefit Design Changes AreAlso Critical to Success
ProviderPatient
Payment System
Benefit Design
Ability and Incentives to:
•Keep patients well•Avoid unneeded services•Deliver services efficiently•Coordinate services with other providers
Ability andIncentives to:
•Improve health•Take prescribed medications•Allow a provider to coordinate care•Choose the highest-value providers and services
85© 2009-2011 Center for Healthcare Quality and Payment Reform, Network for Regional Healthcare Improvement
Lack of Effective Incentives for Value-Based Choice by Patients
• Copays, Co-insurance, and High Deductibles can discourage patients from getting preventive treatments they need

86© 2009-2011 Center for Healthcare Quality and Payment Reform, Network for Regional Healthcare Improvement
Example: Important to Coordinate Pharmacy & Medical Benefits
Hospital Costs
PhysicianCosts
OtherServices
Medical Benefits
DrugCosts
Pharmacy Benefits
Single-minded focus onreducing costs here...
...could result in higherspending on hospitalizations
• High copays for brand-nameswhen no generic exists
• Doughnut holes & deductibles
Principal treatment for mostchronic diseases involves regular use
of maintenance medication

87© 2009-2011 Center for Healthcare Quality and Payment Reform, Network for Regional Healthcare Improvement
Lack of Effective Incentives for Value-Based Choice by Patients
• Copays, Co-insurance, and High Deductibles can discourage patients from getting preventive treatments they need
• Copays, Co-insurance, and High Deductibles do little to encourage patients to be cost-conscious in choosing among high-cost providers and services

88© 2009-2011 Center for Healthcare Quality and Payment Reform, Network for Regional Healthcare Improvement
Where Will You Get Your Knee Replaced?
Consumer Shareof Surgery Cost
Price #1$23,000
Price #2$28,000
Price #3$33,000
Knee JointReplacement

89© 2009-2011 Center for Healthcare Quality and Payment Reform, Network for Regional Healthcare Improvement
Copayment? Use High Price Provider
Consumer Shareof Surgery Cost
Price #1$23,000
Price #2$28,000
Price #3$33,000
$1,000 Copayment: $1,000 $1,000 $1,000
Knee JointReplacement

90© 2009-2011 Center for Healthcare Quality and Payment Reform, Network for Regional Healthcare Improvement
Coinsurance?Use High Price Provider
Consumer Shareof Surgery Cost
Price #1$23,000
Price #2$28,000
Price #3$33,000
$1,000 Copayment: $1,000 $1,000 $1,000
10% Coinsurancew/$2,000 OOP Max:
$2,000 $2,000 $2,000
Knee JointReplacement
91© 2009-2011 Center for Healthcare Quality and Payment Reform, Network for Regional Healthcare Improvement
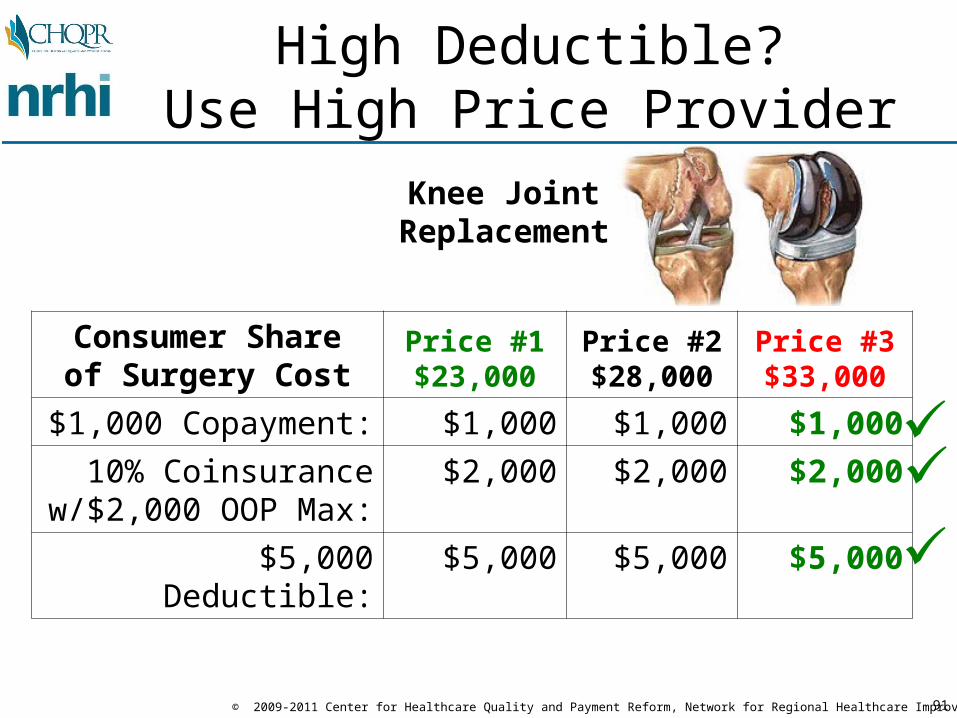
High Deductible?Use High Price Provider
Consumer Shareof Surgery Cost
Price #1$23,000
Price #2$28,000
Price #3$33,000
$1,000 Copayment: $1,000 $1,000 $1,000
10% Coinsurancew/$2,000 OOP Max:
$2,000 $2,000 $2,000
$5,000 Deductible: $5,000 $5,000 $5,000
Knee JointReplacement

92© 2009-2011 Center for Healthcare Quality and Payment Reform, Network for Regional Healthcare Improvement
Pay the Difference in Price?Use the High-Value Provider
Consumer Shareof Surgery Cost
Price #1$23,000
Price #2$28,000
Price #3$33,000
$1,000 Copayment: $1,000 $1,000 $1,000
10% Coinsurancew/$2,000 OOP Max:
$2,000 $2,000 $2,000
$5,000 Deductible: $5,000 $5,000 $5,000
Highest-Value: $0 $5,000 $10,000
Knee JointReplacement

93© 2009-2011 Center for Healthcare Quality and Payment Reform, Network for Regional Healthcare Improvement
Blue Cross/Blue Shield of MAHospital Choice Cost-Share
BenefitLow-CostHospitals
High-CostHospitals
PCP $20 $20SPC $35 $35Inpatient Hospital $500 $1500*Outpatient Hospital Day Surgery $250 $1250High Tech Radiology $50 $500Laboratory $0 $35X-Rays/Other Imaging Tests $0 $100PT/OT/ST $35 $70
*LOWER INPATIENT COPAY APPLIES IF EMERGENCY ADMISSION

94© 2009-2011 Center for Healthcare Quality and Payment Reform, Network for Regional Healthcare Improvement
What Would Happen If Consumers Chose Health Systems on Value?
• Minnesota Patient Choice– started by the Buyers Health Care Action Group (BHCAG)
in the 1990s– “care systems” bid on risk-adjusted (total) cost of patient
care (i.e., risk-adjusted global payment)– care systems are divided into cost/quality tiers based on
their relative bids– consumers pay the difference in the bid price to select a
care system in a higher cost tier
• Results– Many consumers switched to lower cost providers– High cost providers reduced their costs to retain/attract
patients

95© 2009-2011 Center for Healthcare Quality and Payment Reform, Network for Regional Healthcare Improvement
How to Encourage Patients to Use a Medical Home?
CONSUMERS/PATIENTS CAN
CHANGE OR USE MULTIPLE
PROVIDERSAT WILL
CONSUMERS/PATIENTS ARE
“LOCKED IN”TO A SINGLEGATEKEEPER
PROVIDER
ROCK HARD PLACE

96© 2009-2011 Center for Healthcare Quality and Payment Reform, Network for Regional Healthcare Improvement
How to Encourage Patients to Use a Medical Home?
CONSUMERS/PATIENTS CAN
CHANGE OR USE MULTIPLE
PROVIDERSAT WILL
CONSUMERS/PATIENTS ARE
“LOCKED IN”TO A SINGLEGATEKEEPER
PROVIDER
CONSUMERS/PATIENTS AREENCOURAGEDTO CHOOSE &
USE AN ACO ORMEDICAL HOME
MIDDLE GROUNDROCK HARD PLACE

97© 2009-2011 Center for Healthcare Quality and Payment Reform, Network for Regional Healthcare Improvement
How to Encourage Patients to Use a Medical Home?
CONSUMERS/PATIENTS CAN
CHANGE OR USE MULTIPLE
PROVIDERSAT WILL
CONSUMERS/PATIENTS ARE
“LOCKED IN”TO A SINGLEGATEKEEPER
PROVIDER
CONSUMERS/PATIENTS AREENCOURAGEDTO CHOOSE &
USE AN ACO ORMEDICAL HOME
MIDDLE GROUNDROCK HARD PLACE
OPTION 1: Charge patients more for using providers outside the ACO or medical home (requires changing benefits)

98© 2009-2011 Center for Healthcare Quality and Payment Reform, Network for Regional Healthcare Improvement
How to Encourage Patients to Use a Medical Home?
CONSUMERS/PATIENTS CAN
CHANGE OR USE MULTIPLE
PROVIDERSAT WILL
CONSUMERS/PATIENTS ARE
“LOCKED IN”TO A SINGLEGATEKEEPER
PROVIDER
CONSUMERS/PATIENTS AREENCOURAGEDTO CHOOSE &
USE AN ACO ORMEDICAL HOME
MIDDLE GROUNDROCK HARD PLACE
OPTION 1: Charge patients more for using providers outside the ACO or medical home (requires changing benefits)
OPTION 2: Give patients high quality, coordinated care by using the providers inside the ACO or medical home (requires payment change)

99© 2009-2011 Center for Healthcare Quality and Payment Reform, Network for Regional Healthcare Improvement
Developing The Right Quality Measures at the Community Level
• Concern: Giving healthcare providers more accountability for costs reduces the incentives for overuse, but raises concerns about whether patients will get too little care
• Solution: Measure healthcare quality and include incentives for providers to maintain/improve quality as well as reduce costs
• Ideal: Develop quality measures with participationof physicians andhospitals, as agrowing number of regions do
Massachusetts Health Quality Partners
Wisconsin Collaborative for Healthcare Quality
Better Health Greater Cleveland

100© 2009-2011 Center for Healthcare Quality and Payment Reform, Network for Regional Healthcare Improvement
Both Payment & Benefits Are Controlled by the Payer
ProviderPatient
Payment System
Benefit Design
PAYER
Ability andIncentives to:
•Keep patients well•Avoid unneeded services•Deliver services efficiently•Coordinate services with other providers
Ability andIncentives to:
•Improve health•Take prescribed medications•Allow a provider to coordinate care•Choose the highest-value providers and services

101© 2009-2011 Center for Healthcare Quality and Payment Reform, Network for Regional Healthcare Improvement
But Purchaser Support is Needed Particularly for Benefit Changes
ProviderPatient
Payment System
Benefit Design
PAYER
Purchaser Purchaser Purchaser
Ability andIncentives to:
•Keep patients well•Avoid unneeded services•Deliver services efficiently•Coordinate services with other providers
Ability andIncentives to:
•Improve health•Take prescribed medications•Allow a provider to coordinate care•Choose the highest-value providers and services

102© 2009-2011 Center for Healthcare Quality and Payment Reform, Network for Regional Healthcare Improvement
Challenge: Gaining Support from a Critical Mass of Payers
Payer
Provider
Payer Payer
Patient Patient Patient
Provider is only compensated for changed practices for the subset of patients covered by participating payers
Better Payment
System
CurrentPaymentSystem Current
PaymentSystem
103© 2009-2011 Center for Healthcare Quality and Payment Reform, Network for Regional Healthcare Improvement
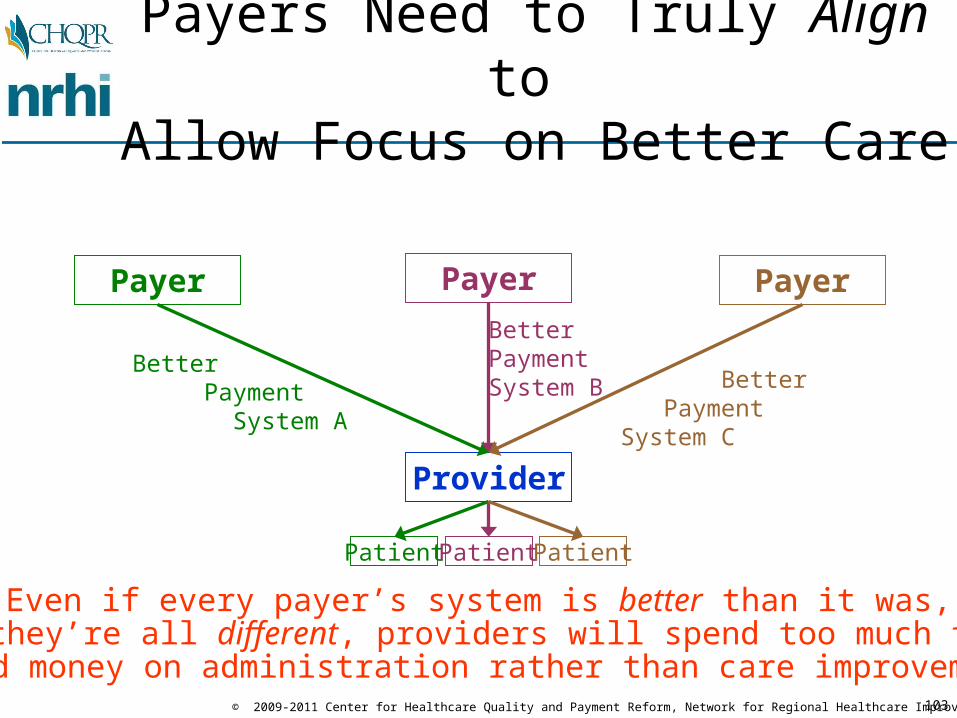
Payers Need to Truly Align to Allow Focus on Better Care
Payer
Provider
Payer Payer
Patient Patient Patient
Better Payment System A
BetterPaymentSystem B Better
PaymentSystem C
Even if every payer’s system is better than it was, if they’re all different, providers will spend too much time
and money on administration rather than care improvement

104© 2009-2011 Center for Healthcare Quality and Payment Reform, Network for Regional Healthcare Improvement
Purchasers Must SupportMulti-Payer Payment Reforms
Payer
Provider
Payer Payer
Patient Patient Patient
Better Payment
System
BetterPaymentSystem Better
PaymentSystem
Purchaser Purchaser Purchaser Purchaser

105© 2009-2011 Center for Healthcare Quality and Payment Reform, Network for Regional Healthcare Improvement
Payer Coordination Is Beginningto Occur Around the Country
• Examples of Multi-Payer Payment Reforms:– Colorado, Maine, Michigan, Minnesota, New York, North Carolina,
Oregon, Pennsylvania, Rhode Island ,Vermont, and Washington all have multi-payer medical home initiatives
• A Facilitator of Coordination is Needed– State Government (provides anti-trust exemption)– Non-profit Regional Health Improvement Collaboratives
• Medicare Needs to Participate in Local Projects as Well as Define its Own Demonstrations– Center for Medicare and Medicaid Innovation (CMMI) created under
PPACA provides the opportunity for this– Medicare is now participating in eight of the state-led multi-payer
medical home initiatives

106© 2009-2011 Center for Healthcare Quality and Payment Reform, Network for Regional Healthcare Improvement
Opportunity for Northeast Ohio to Pursue Multi-Payer Reform
• CMS Comprehensive Primary Care Initiative– $20 PMPM + Shared Savings for PCPs– 75 PCP practices selected in each market (must use EHR/registry)– Potential for ~$40 million in Medicare/Medicaid for PCPs in Cleveland
• REQUIRES Participation of Private Payers– 2 markets with highest penetration by aligned plans in HHS Region 5
(Ohio + IN, IL, MI, MN, WI) will be selected for further discussion– 5-7 markets nationally selected from top 2 in each of 10 HHS Regions
based in part on (1) meaningful use of EHRs, (2) state participation, (3) 50% of practices in rural areas
• IMMEDIATE Action Required– Health plans must submit letter of intent (LOI) by November 15 and an
application by January 17 describing market area, payment support they’ll provide to PCPs
– LOI and application are not binding, but Cleveland region cannot compete if LOIs are not submitted by deadline

107© 2009-2011 Center for Healthcare Quality and Payment Reform, Network for Regional Healthcare Improvement
Many Different Activities Needed for Success
Value-DrivenPayment & Benefits
Quality/Cost/ Experience Analysis& Reporting
PublicReporting
Business Case
Analysis
Value-DrivenDeliverySystems
TechnicalAssistanceto Providers
Design &Delivery of
Care
PatientEducation/Engagement
Value-BasedChoice
EducationMaterials
Engagementof
Purchasers
Alignment ofMultiplePayers
PaymentSystemDesign
BenefitDesign
ProviderOrganization/Coordination
Claims, Clinical &
Patient Data
Wellness &Adherence
ReducingCosts
WithoutRationing

108© 2009-2011 Center for Healthcare Quality and Payment Reform, Network for Regional Healthcare Improvement
How Can These Functions Be Delivered in a Coordinated Way?
PublicReporting
Business Case
Analysis
Design &Delivery of
Care
Value-BasedChoice
Engagementof
Purchasers
Alignment ofMultiplePayers
PaymentSystemDesign
BenefitDesign
ProviderOrganization/Coordination
Claims, Clinical &
Patient Data
Wellness &Adherence
TechnicalAssistanceto Providers
EducationMaterials
?

109© 2009-2011 Center for Healthcare Quality and Payment Reform, Network for Regional Healthcare Improvement
Role of Regional Health Improvement Collaboratives
PublicReporting
Business Case
Analysis
Design &Delivery of
Care
Value-BasedChoice
Engagementof
Purchasers
Alignment ofMultiplePayers
PaymentSystemDesign
BenefitDesign
ProviderOrganization/Coordination
Claims, Clinical &
Patient Data
Wellness &Adherence
BetterHealthGreater
Cleveland
TechnicalAssistanceto Providers
EducationMaterials

110© 2009-2011 Center for Healthcare Quality and Payment Reform, Network for Regional Healthcare Improvement
...With Active Involvement of All Healthcare Stakeholders
RegionalHealth
Improve-ment
Collab.
HealthcareProviders
HealthcarePayers
HealthcareConsumers
HealthcarePurchasers

111© 2009-2011 Center for Healthcare Quality and Payment Reform, Network for Regional Healthcare Improvement
For More Information on Payment and Delivery Reforms
www.PaymentReform.org

For More Information:
Harold D. MillerExecutive Director, Center for Healthcare Quality and Payment Reform
andPresident & CEO, Network for Regional Healthcare Improvement
(412) 803-3650
www.CHQPR.org
www.NRHI.org
www.PaymentReform.org

113© 2009-2011 Center for Healthcare Quality and Payment Reform, Network for Regional Healthcare Improvement
Healthcare Redesign in Cleveland:Today’s Work Session Topics
1. Improving Outcomes and Reducing Costs for Patients With Chronic DiseaseA. What should payment/delivery/benefits look like in Cleveland in 5 years? B. How should Cleveland transition to the desired stucture?
2. Improving Outcomes and Reducing Costs for High-Cost PatientsA. What should payment/delivery/benefits look like in Cleveland in 5 years?
B. How should Cleveland transition to the desired stucture?
3. Improving Outcomes and Reducing Costs for “Well” Patients (Without Chronic Conditions)A. What should payment/delivery/benefits look like in Cleveland in 5 years?
B. How should Cleveland transition to the desired stucture?

114© 2009-2011 Center for Healthcare Quality and Payment Reform, Network for Regional Healthcare Improvement
Guidelines for Work Sessions
• Goal A: Design payment systems for ~5 years in the future– It won’t be possible to make significant broad-based changes within a year
or two– The need for change is too urgent to wait 10-20 years
• Goal B: How should the transition be made• You’ll get a list of options as a starting point, but you’re free to
modify them or add new ones• There is no “right answer” -- a compromise that everyone
supports is better than an ideal approach that nobody is willing to implement
• Don’t just rehash the problems or recommend more studies – work to forge agreement on solutions
• There are win-win solutions, but everyone will have to change to achieve them; preserving the status quo is impossible
• Be nice to your facilitator – they’re a volunteer and this is a challenging assignment!