improving energy efficiency in waste water...
TRANSCRIPT

February 18, 2009 Energy efficiency in WWTP 1
Water Week 2009
Dr. Mark Husmann, Pöyry Environment GmbH,
Germany
Improving energy efficiency in waste water treatment: What emerging countries can learn from experience
gained in the developed world

February 18, 2009 Energy efficiency in WWTP 2
Development of energy prices and demand
• Enduser petroleum product prices & average crude oil import costs
Source: www.iea.org
2005 2006 2007 2008
• Worldwide primary energy demand by region (scenario)
Source: International Energy Agency, 2006
Mega To
ns of O
il Eq
uivalent

February 18, 2009 Energy efficiency in WWTP 3
The Significance of Energy in Waste Water Treatment
Distribution of Full Costs Germany
Distribution of Full Costs – China
percentage of energy costs
is comparable
Others 12%
Discharge fee 4%
Sludge disposal 4%
Personnel 15 %
Energy 14%
Depreciation 27%
Interest 24%
Cost of Capital 53%
Energy 16%
Personnel 3%
Chemical 12%
Disposal 10%
Maintenance 6%
0
5
10
15
20
25
30
35
40
Maintenance Disposal Chemical Personnel Energy
Percentag
e of Ope
x

February 18, 2009 Energy efficiency in WWTP 4
Energy consumption of wastewater treatment plants in Germany
• Electricity consumption of all 10.200 WWTP in Germany ca. 4.4 TWh/a
≈ 35 kWh/(PE design ∙a) or 0.4 kWh/m³
≈ 0.7 % of the total electricity consumption in Germany
≈ 3 Mio. t CO 2 equivalents
• WWTP are the biggest single energy consumers of municipalities with a share of 20% of the total energy consumption. (source: German Federal Environmental Agency, 2008)
In developing and middle developed countries the share can be expected considerably higher

February 18, 2009 Energy efficiency in WWTP 5
Projects we have worked on recently
20 *) detailed 5.0 2,750,000 Colombia 1 WWTP
40 basic 0,9 650,000 China 1 WWTP
Ongoing detailed 0.4 200,000 France 1 WWTP
25 (Ø) basic 12.5 9,000,000 Brazil 2 WWTP
76 **) (Ø) basic 1.3 1,140,000 Tunisia 5 WWTP
44 (Ø) detailed 6.2 4,460,000 Germany 42 WWTP
[%] [m³/s]
18,200,000
P.E.
42 (Ø) 26.3 52 WWTP
Possible reduction of
energy demand
Basic or detailed analysis
Influent Country Amount
*) Executed during the design phase **) Achieved by conversion of the process from aerobic to anaerobic sludge stabilization with energy recovery

February 18, 2009 Energy efficiency in WWTP 6
What are the targets?
• Main targets – Reduction of energy consumption – Increase of energy production (selfsupply)
• Side targets – Improvement of effluent quality – Improvement of process stability

February 18, 2009 Energy efficiency in WWTP 7
Criteria for further decisions on a general basis
• Target values: Determined in several surveys of representative WWTP
• Ideal values: Developed at a model of an ideal WWTP (technical and electrotechnical equipment of best available technology, high efficient process technology, …)
Energy evidence (example) Status Quo Target value Ideal value
Total specific energy consumption per p.e. 51 kWh/p.e. a 36 kWh/p.e. a 28 kWh/p.e. a
Specific energy consumption aerated basin per p.e. 33 kWh/p.e. a 23 kWh/p.e. a 18 kWh/p.e. a
Degree of gas reuse 56 % 98 % 99 %
Degree of gas conversion to power / electricity 0 % 30 % 31 %
Specific gas production per kg oSS intake 370 l/kg oSS 450 l/kg oSS 475 l/kg oSS
Degree of independent supply Heat 97 % 97 % 98 % Electricity 0 % 49 % 65 %
Δ target value
15 kWh/p.e. a
10 kWh/p.e. a
+ 42 %
+ 30 %
+ 80 l/kg oSS
0 % + 49 %

February 18, 2009 Energy efficiency in WWTP 8
General results
• Reduction of energy consumption – Improvement of efficiency of individual units/aggregates – Adjustment of the process – Optimization of operating methods – Adapted measurement and control technology
• Improvement of the degree of selfsupply in energy
Measures:
0
10
20
30
40
50
60
70
< 10.000 10.000 50.000 50.000 100.000 > 100.000
nominal capacity [PE]
specific el. con
sumption
[kWh/(PE*a)]
asis state WWTP reference value ideal value
Average results of all executed studies
0 10 20 30 40 50 60 70 80 90 100
< 10.000 10.000 50.000 50.000 100.000 > 100.000
Nominal capacity [PE]
Degree of self sup
ply [%
]
electricity asis electricity opt. Heat asis Heat opt.
Average results of all executed studies

February 18, 2009 Energy efficiency in WWTP 9
ca. 2 m
efficiency: 40 % 4,5 Wh/(m³*m) at 3 m³/s
→ saving potential: 340 MWh/a
→ approx. 40 TUSD/a
Recommended Measures – Reduction of hydraulic losses
February 18, 2009 Energy efficiency in WWTP 10
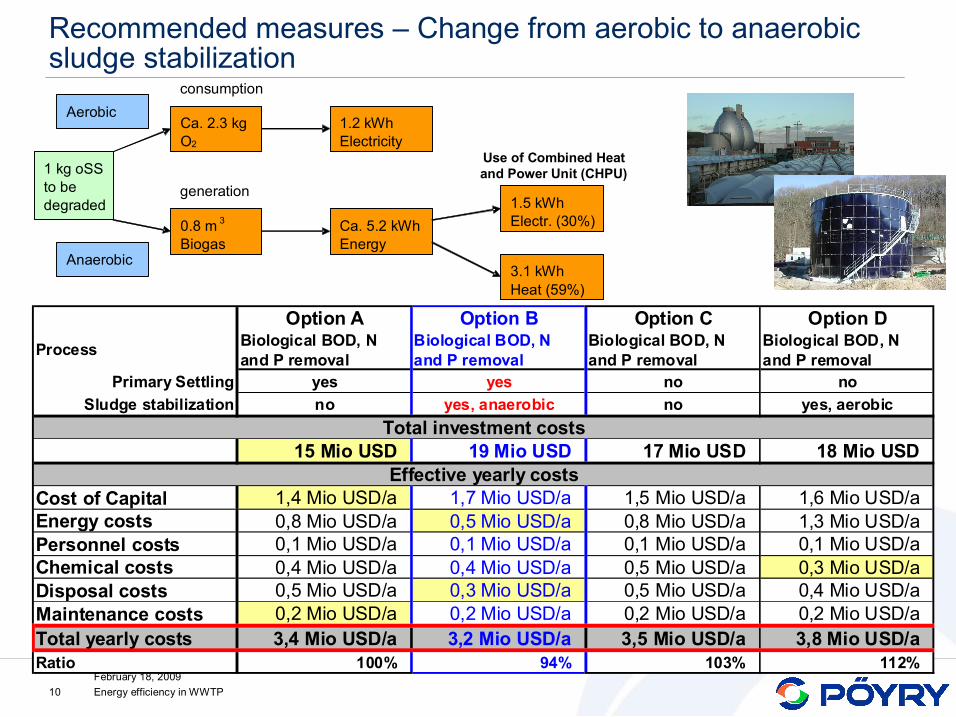
Recommended measures – Change from aerobic to anaerobic sludge stabilization
1 kg oSS to be degraded
Aerobic
Anaerobic
Ca. 2.3 kg O2
1.2 kWh Electricity
consumption
Use of Combined Heat and Power Unit (CHPU)
0.8 m 3
Biogas Ca. 5.2 kWh Energy
1.5 kWh Electr. (30%)
3.1 kWh Heat (59%)
generation
Option A Option B Option C Option D Process Biological BOD, N
and P removal Biological BOD, N and P removal
Biological BOD, N and P removal
Biological BOD, N and P removal
Primary Settling yes yes no no Sludge stabilization no yes, anaerobic no yes, aerobic
15 Mio USD 19 Mio USD 17 Mio USD 18 Mio USD
Cost of Capital 1,4 Mio USD/a 1,7 Mio USD/a 1,5 Mio USD/a 1,6 Mio USD/a Energy costs 0,8 Mio USD/a 0,5 Mio USD/a 0,8 Mio USD/a 1,3 Mio USD/a Personnel costs 0,1 Mio USD/a 0,1 Mio USD/a 0,1 Mio USD/a 0,1 Mio USD/a Chemical costs 0,4 Mio USD/a 0,4 Mio USD/a 0,5 Mio USD/a 0,3 Mio USD/a Disposal costs 0,5 Mio USD/a 0,3 Mio USD/a 0,5 Mio USD/a 0,4 Mio USD/a Maintenance costs 0,2 Mio USD/a 0,2 Mio USD/a 0,2 Mio USD/a 0,2 Mio USD/a Total yearly costs 3,4 Mio USD/a 3,2 Mio USD/a 3,5 Mio USD/a 3,8 Mio USD/a Ratio 100% 94% 103% 112%
Total investment costs
Effective yearly costs

February 18, 2009 Energy efficiency in WWTP 11
Recommended measures – Optimization of Aeration
• Reduction of necessary aeration energy
• Exchange of destroyed aerators
WWTP with 115,000 PE (design 190,000 PE), change to intermittent aeration of the aerobic basin
Demand to date: aerators: 1,854,000 kWh/a recirculation pumps: 164,948 kWh/a TOTAL: 2,018,948 kWh/a
à 175,850 USD/a Demand optimized: Saving potential: 15 – 20 %
302,842 kWh/a à 26,380 USD/a
Required Investment: Analyzers, installation: 45,500 USD
February 18, 2009 Energy efficiency in WWTP 12
Lessons learned
• Problem: – Acquisition of these type of projects in developing or middle developed countries is quite tough, as: • In many projects the focus is just on investment costs and not on total yearly costs (incl. operational costs)
• Once the plant is in operation, there is no more money available for further optimization. • Even a possible optimization is obvious, clients are hesitating to invest further money
• Solution: – Germany launched an energy efficiency program, where studies have been funded by the Government (70% of the consulting costs). As a result more than 80% of potential beneficiaries executed these studies.
– Something similar was financed by KfW for first studies in Tunisia
• Precondition: – Studies must be executed by external, not previously involved and experienced consultants

February 18, 2009 Energy efficiency in WWTP 13
Lessons learned
• Costs: – Costs for the studies without traveling costs and accommodation:
• Basic analysis: 5 TUSD – 10 TUSD à just first hints (not recommended) • Detailed analysis: depending on size and technology
• Further investments: – All suggestions for optimization need a cost/benefit (C/B) calculation, considering the savings in operation costs and the investment costs including amortization
– Only measures with a cost/benefit ratio < 1 shall be carried out • Immediate measures C/B << 1 with low investments < 20 TUSD • Intermediate measures C/B < 1 with investments of approx. 20 – 150 TUSD • Long term measures C/B ≤ 1 with investments > 150 TUSD
0
20.000
40.000
60.000
80.000
100.000
120.000
140.000
160.000
180.000
200.000
0 200.000 400.000 600.000 800.000 1.000.000 1.200.000 1.400.000 1.600.000 1.800.000 2.000.000
Size of WWTP [PE]
Cos
ts [U
SD]

February 18, 2009 Energy efficiency in WWTP 14
Thank you for your attention