improving detection of malicious programs - …phdthesis.uaic.ro/phdthesis/benchea, mihai-razvan,...
TRANSCRIPT
University Alexandru IoanCuza
Doctoral Thesis
Improving Detection OfMalicious Programs
Author:
Mihai - Razvan
Benchea
Supervisor:
Prof. Dr. Henri
Luchian

Introduction
Starting with the year 2007 malware started to increase
exponentially. More malware was produced in 2007 than
in all years before that put together. The sudden growth
was mainly influenced by the idea that malware could be
used to earn money. Almost all possible ways of earning
money through malicious code were exploited. From the
most obvious ones, like stealing access to bank account
or asking for a ransom to give access to some encrypted
files, to less obvious ones like simulating user behavior for
certain websites in order to increase traffic and with it
money income for that web-site.
Trying to detect these samples has created an arm race be-
tween antivirus products and malware. As antiviruses and
operating systems are getting more and more complex and
include more technology in order to protect computers, the
malware adapts and brings new methods for evading de-
tection. These methods can be grouped in defensive mech-
anisms (packers, protectors: anti-debugging techniques,
polymorphism, server side polymorphism, metamorphism)
1

and offensive mechanisms (detect antivirus product, ter-
minate antivirus product, disable updates, disable firewall,
change dns settings, change permissions for files, avoid
writing to disk, install a rootkit).
A machine learning algorithm can be used to filter what
malware researchers analyze or it can even be used as a
primary detection method. However, this detection mech-
anism must also undergo some restrictions for it to be used
in practice.
1. The training speed must be fast enough to allow the
algorithm to finish in a decent amount of time when
run on very large datasets.
2. Testing speed is also very important. If we want the
method to be included in an antivirus product, it
must provide as little overhead as possible.
3. The model produced by the classification algorithm
must fit in a very small amount of memory.
4. No false positives, or as close to 0 as possible
2

Improving Malware Detection By
Feature Extraction
Malware detection through the use of machine learning is
not new; it has been used by other researchers and is cur-
rently used in many av-products. However, the results ob-
tained can be better either in terms of lower false positives
or by increasing the detection rate. The way I choose to
solve this problem is not by modifying the new algorithms,
but rather by extracting new features from existing ones
such that the accuracy of the original algorithm will in-
crease. I choose this method because I consider there is
an already good algorithm, named One Side Class Percep-
tron (OSCP) which was tested for malware detection with
low false positive rate and achieved good results.
The One Side Class Perceptron (OCSP) works by creating
a hyper-plane that is able to separate the two classes of
samples (malware and benign) such that no samples from
one class will be detected. It is very well suited for our
problem and by the way it is constructed it guarantees
that, on training phase, there will be no false positives.
3

Even though this algorithm solves the problem of false
positives, it also dramatically reduces the detection rate.
2.1 Feature Creationg Using Genetic
Programming
The dataset on which the algorithms will be tested con-
sists of 358.144 records of which 42.940 are malicious and
315.204 are benign. The proportion of malicious and be-
nign files is close to the one found in the wild. The files
from the dataset are all PE-files, mainly executable and
dll files, which were gathered over a period of two months
(april and may 2014). The files were statically and dy-
namically processed and a total of 300 boolean features
were extracted.
Mapping seems to provide good results. It increases the
detection rate while the number of false positive stay low
enough to permit the algorithm to be used in practical
applications. However, a big disadvantage of this method
is the number of features which it needs to create.
In the following paragraphs I will provide a method, based
on genetic programming, that will allow us to increase the
4

detection rate of the algorithm. To validate the results,
they will be compared to the ones obtained when training
with the best features obtained through mapping.In order
to not reduce diversity and have records belonging to a
different class but with the same set of features, the OSCP
algorithm will use 600 features instead of 300: the best 300
features after mapping plus the 300 original ones.
From the results obtained by comparing three boolean op-
eration used for mapping (XOR, AND, OR), the AND
operator achieves the best results: 65.35% detection rate,
15 false positives and 95.85% accuracy. For this reasons,
these will be used as a threshold to test the features ob-
tained through genetic programming.
We start by defining the chromosome. A chromosome is
a set of features (1 to 300) each one connected to other
through a boolean operator. Since the order in which the
expression is evaluated changes the result, a priority is also
given to each boolean operator. The structure can be seen
in Figure 2.1.
Notice that in Figure 2.1 each Fi, where i = 1, 300 refers
to one of the original features, each OPi refers to one of the
5

Figure 2.1: Chromosome
boolean operations {and,xor,or} and each Pi is a number
that reflects the priority of the boolean operation among
the expression. The chromosomes could have also been
implemented using binary trees; however I consider this
method to be more practical since it allows mutation on
every part of the chromosome (priority, operator and fea-
ture)
The first generation is constructed by generating 300 chro-
mosomes, of length 1. Each chromosome has one of the
original features, each operation is randomly chosen among
the set of boolean operators {and,or,xor} and each prior-
ity is initialized to 0.
The crossover operation is implemented in the following
way: 1000 new chromosomes are generated by randomly
selecting two parents and performing crossover on a ran-
domly selected point. The mutation operation can be per-
formed on any part of the chromosome. A probability of
6

mutation of 3% is considered. From the new generated
set of 1000 chromosomes, three sets of 30 chromosomes
are chosen. For the elements in the first set, a feature will
be randomly selected and negation will be performed. For
the elements in the second set, one of the operators will be
switched to a randomly chosen one from the boolean set
{and,or,xor}. Finally, for each chromosomes in the final
set, a priority will be chosen, and based on a randomly
generated number it will be incremented or decremented.
Based on the F-score, the best 300 chromosomes will be
selected. The parents are also included in the selection
process in order not to lose the best chromosomes found
so far. Doing so, a 71% in detection rate and 17 false
positives were obtained
To further improve the results, the current problem is ap-
proached as a multi modal optimization problem. A func-
tion is defined that gives a very low fitness score (nega-
tive) for the individuals that get activated more on the
clean records than on the malicious ones and for the oth-
ers will normalize the difference between the number of
7

malicious and clean records where the feature is being ac-
tivated based on how important is that feature for all the
malicious records. Using this function the detection rate
increases to 73.23% while the number of false positives in-
creases with just 2 units, reaching to 19 false positives.
The graphic in Fig 2.2 presents how the detection rate
modifies with each generation. The yellow line represents
the minimum number of features that are activated on ev-
ery record on each generation, while the vertical bars rep-
resent the standard deviation of the number of features
activated on every record on each generation.
(a) (b)
Figure 2.2: Evolution on each generation. DetectionRate (a). Nr. of features activated on each record(b).
As it can be seen the detection rate increases as more
features are being set on the records with a low number
of activated features.
8

2.2 Feature Creation Using Restricted
Boltzmann Machine
The idea of creating features using a mathematical op-
erator can be extended. First of all, the mathematical
operator only brings a limited kind of relation between
features. Secondly, features could be created from the
combination of more than two initial features. In this way
the new created features may contain more information
and could prove more important in separating the records.
To address these ideas the mathematical operator should
be replaced with a function that has as arguments all the
existing features and the result of this function is a new
feature. Since the newly created features will be used as
input for a linear classifier it is important that the function
used to create them should be a non-linear one. Finding
a function that is optimized for this task may seem difi-
cult, however these restrictions are very similar to the ones
imposed by a restricted Boltzmann machine.
A restricted Boltzmann machine is a stochastic neural net-
work composed of two layers: one made up of visible units
(the data ) and another one made up of hidden units (the
9

new created features). Every unit from one hidden layer
has a symmetrical connection with every unit from the vis-
ible layer, however there are no connection between units
from the same layer. Each neuron from the network has
a binary state: 0 or 1. Figure 2.3 is an example of re-
stricted Boltzmann machine composed of 4 visible units
and 3 hidden units and their corresponding biases.
Figure 2.3: A Restricted Boltzmann Machine
The value of each unit is generated according to a proba-
bility function computed in regards to the elements from
the other layer and the weighs of the connections.
The idea of using a restricted Boltzmann machine and a
linear classifier (one side perceptron in this case) is de-
picted in Figure 2.4. As it can be seen in the figure, the
hidden layer will be the new set of features that the per-
ceptron will be trained on.
10

Figure 2.4: Restricted Boltzmann machine and Lin-ear Classifier
Besides creating features in a non linear way, this ensem-
ble also has another advantage. Since the restricted Boltz-
mann machine is a stochastic neural network it means that
the units are based on probabilities. After the network has
been trained, instead of sampling a binary value for a hid-
den unit, the probability can be used instead. This means
that a continuous value will be used instead of a binary
one, thus giving more information to the linear classifier.
Training of this ensemble has to be done in two steps:
First train the RBM in an unsupervised manner and then
train the OSCP classifier using the features outputted by
11

the RBM.
In order to test how this ensemble performs, a collection
of malicious and benign samples was gathered during the
months of January and February 2014, containing 3087200
files. This was further processed and only the best 300 fea-
tures were kept. The results are compared with the OSCP
algorithm and its mapped version (OSCP-MAP). The re-
sults are displayed in Table 2.1 As it can bee seen, the
Algorithm Detection False Positive Accuracy
OSCP 73.11% 20 (0.00162%) 99.32 %OSCP-RBM 88.83% 3 (0.00024%) 99.72 %OSCP-MAP 90.18% 87(0.00707%) 99.72 %
Table 2.1: The results of the 3-fold cross-validationfor OSCP, OSCP-MAP, OSCP-RBM algorithms
ensemble (noted with OSCP-RBM in Table 2.1) achieved
an increase in detection of 15.72 % compared to the one
side class perceptron (OSCP). There is also a decrease in
the number of false positives, the ensemble obtaining 6
times less false alarms than the OSCP algorithm. How-
ever, when comparing the ensemble to the mapped version
of the perceptron the detection rate is smaller with 1.35 %.
12

I consider the small decrease of the detection rate is well
compensated by the big difference in the number of false
positives obtained by the two algorithms, the OSCP-MAP
obtaining 29 times more false positives.
Clustering and Classification of Script
based Malware
In contrast to standard documents, where the only ac-
tions available are reading and modifying it, there also
exists documents that can interact with the user or as-
sist him by doing some automatic actions. This kind of
interaction can be very complex and could include send-
ing automatic e-mail, auto-completion of some fields de-
pending of what choices have been previously selected or
just automatic parsing of the answers a users may have
given to a form. Since the possibilities are unlimited, the
only way to implement this kind of feature is to add code
to the document that is responsible for the user interac-
tion and add support for the programming language to
the software that renders the documents. Some examples
of this is the use of JavaScript language for the portable
document format (pdf) in the Adobe Reader software, or
13
the use of Javascript for HTML pages. This feature also
opened the door for malware creators that can make use
of the programming language feature to execute their ma-
licious code. Most of the code is obfuscated in order to
avoid detection.
3.1 Clustering Document Based Malware
Clustering is very important in malware industry since it
reduces the work a malware analyst needs to do. Also, by
having many similar files grouped together, generic signa-
tures can be added which in turn, increases productivity
and proactivity.
Two methods for clustering are provided: Hierarchical
bootom-up clustering (based the distance between every
two items) and Hash-Based clustering (based on comput-
ing a hash function over every item and clustering together
the files for which the function outputs the same value)
3.1.1 Hierarchical Bottom-up Clustering
In order to compute the distance between every malicious
document, the files need to be mapped to a coordinate
system. To do this, the file needs to be processed, features
14
extracted and stored in an abstract manner. The obtained
result will be called PDF fingerprint. In order to create
the PDF fingerprint, the following steps must be carried
on:
1. Extract the JavaScript code from the PDF file.
2. Tokenize the JavaScript files obtained, by using the
grammar from the ECMA scripts [? ] and for every
token extract as tuple its value and its class.
3. Remove unnecessary tokens
4. Emulate simple string operations
5. For each class, count how many times it appears and
generate a new set of tuples, that consists of the id
of the class and its frequency. The PDF Fingerprint
will be the set of tuples generated on this step.
Having the PDF Fingerprint as an abstract representation
for the file, it will be used to map the file to a Cartesian
coordinate system. For each available token class there
will be a coordinate axis, and the frequency present in tu-
ple will serve as the coordinate on that axis. By doing so
for every PDF fingerprint, similar files will end up close
15
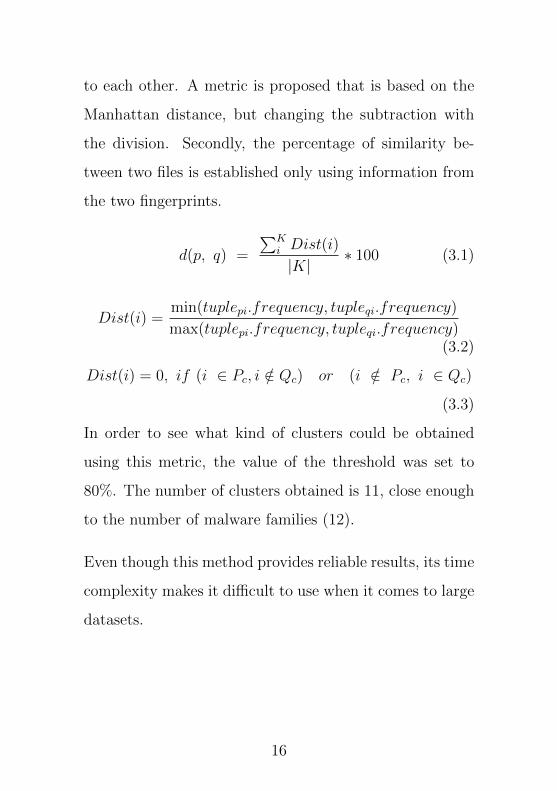
to each other. A metric is proposed that is based on the
Manhattan distance, but changing the subtraction with
the division. Secondly, the percentage of similarity be-
tween two files is established only using information from
the two fingerprints.
d(p, q) =
∑Ki Dist(i)
|K|∗ 100 (3.1)
Dist(i) =min(tuplepi.frequency, tupleqi.frequency)
max(tuplepi.frequency, tupleqi.frequency)(3.2)
Dist(i) = 0, if (i ∈ Pc, i /∈ Qc) or (i /∈ Pc, i ∈ Qc)
(3.3)
In order to see what kind of clusters could be obtained
using this metric, the value of the threshold was set to
80%. The number of clusters obtained is 11, close enough
to the number of malware families (12).
Even though this method provides reliable results, its time
complexity makes it difficult to use when it comes to large
datasets.
16

3.1.2 Hash Based Clustering
The hash based clustering method tries to address the
main problem of the Hierarchical Bottom-up Clustering
method, its O(n2) time complexity. It does this by pro-
cessing each file only once and applying a hash function
(MD5 or SHA256) and clustering together files with the
same hash. The algorithm starts with the PDF finger-
print previously described when the Hierarchical Bottom-
up Clustering method was introduced. The steps are de-
scribed bellow:
1. Sort the tuples according to the frequency member.
In case of two tuples that have the same frequency,
the one which has a higher class-id will come first.
2. Normalize tuples frequency: This means that the
frequency member of every tuple will be divided by
a factor.
3. Apply a Hash Function:(ie. MD5, SHA256)
For testing both of the clustering methods, a larger database
was constructed consisting of 2311035 PDF-files. This
dataset consists of 1333420 benign files gathered from the
17

different sources for a period of 12 months and 977615
files gathered from honeypots, spam messages and public
sources.
The first comparison between the two clustering meth-
ods (Hierarchical Bottom-up Clustering and Hash-Based
Clustering) is related to their speed in order too see which
one can be used in practical situations. For this reason,
a subset of 10000 files from the original dataset was cre-
ated. The Hash Table clustering finished in 1 second, while
the hierarchical bottom-up clustering finished in 1 day 21
hours and 33 minutes. The results clearly state that the
Hash Based Clustering method is much time faster than
the Hierarchical Bottom-up Clustering.
Going from hash-based clustering method to a way of
providing detection for document based malware is very
straight forward. The hash outputted by the clustering
method will be used as a detection marker.
3.1.3 Classification Of Script Based Malware
In order to achieve good classification results, the scripts
will undergo several transformations in order to eliminate
18

as much as possible from the obfuscation techniques. Fol-
lowing this, two classification methods will be used, one
relying on the One Side Class Perceptron and the other
on Hidden Markov Models.
In order to create the dataset that is suitable for training
and testing the algorithms, several steps were taken. First,
in order to find benign script samples, the top 1 million
websites from Alexa ranking were visited and scripts that
were used in their index page were extracted. The mali-
cious samples were collected during a period of one year
from different sources. In doing so, a dataset that con-
tains 1296962 benign samples and 25357 malicious scripts
was created. The ratio between malicious and clean files
is similar to the one we would find in the wild.
The first approach for classifying JavaScript files was to
use the One Side Class Perceptron (OSCP) algorithm.
Two variations were tested. The first one (OSCP-simple)
uses boolean features (the presence of a javascript token)
and achieved only 57.5% detection rate). The second one
(OSCP-frequency), that uses the frequency of the tokens
in each script achieved 65.59% detection rate.
19

Finally, a hybrid approach is used. The records are first
split using a binary decision tree. For each of the resulted
cluster, an OSCP algorithm is used in order to classify the
samples. This method will be called BT-OSCP-xxx where
xxx defines the depth of the decision tree.The method of
grouping the samples is straight forward. It chooses a
feature that best separates the dataset and puts all the
elements containing the feature in one branch of the tree
and the rest in the other branch. Choosing the feature
is done according to a score function which promotes the
feature that is present in a number of records close to the
half of the dataset size.
The final approach was to use a Hidden Markov Model
(HMM). In order to train it, several notations must first
be established. Since, HMM works with observation and
states, the tokens from each tokenized JavaScript file will
be considered as a list of observations and the states in
which each file can be malicious or clean: S = Sclean, Sinfected
where Sclean defines the state in which the file performs a
genuine action while Sinfected represent the state where a
malicious action is being performed.
20
To train the model, two HMM were constructed: one for
malicious files(Mclean) and one for infected files (Minfected).
Each time a script must be classified it is first compared
to each of the models and it will be assigned to the group
that resembles the most:
• P (X|Mclean) =∑Z
P (X|Z,Mclean)P (Z|Mclean) - the
probability that the observation sequence was gen-
erated by Mclean
• P (X|Minfected) =∑Z
P (X|Z,Minfected)P (Z|Minfected)
- the probability that the observation sequence was
generated by Minfected
• S(X) = max(P (X|Mclean), P (X|Minfected))
The training of each HMM was done using the Baum-
Welch algorithm which is based on the forward-backward
algorithm and works in an unsupervised manner.
For the BT-OSCP-xxx two configurations were used, one
where the depth of the decision tree was set to 4, BT-
OSCP-4, thus 16 clusters resulted and one where the depth
was set to 5, BT-OSCP-5, thus 32 clusters resulted. The
results can be seen in Table 3.1.
21

Algorithm Detection Rate False Positive rateOSCP 57.51% 0.02%OSCP-frequency 65.59% 0.01%BT-OSCP-4 81.65% 0.22%BT-OSCP-5 89.75% 0.31%HMM 76.23% 2.29%
Table 3.1: 3-fold cross validation results for OSCP,OSCP-frequency BT-OSCP-xxx and HMM
The BT-OSCP-5 provides the best detection rate but with
a higher rate of false positives. It also takes more time to
train due to the need of building the decision tree and
training of 32 OSCP algorithms. As for the HMM, its
detection rate is in the middle and has the highest number
of false positives. It also took the most time to train.
Mobile Privacy Issues
Due to security restrictions imposed by mobile operating
systems, malware almost disapeared from official applica-
tion markets. However, this doesn’t mean a user is risk
free when using his smartphone. Nowadays, most of the
smartphones include many sensors and features (GPS lo-
cation) and are created with the scope of easing ones life.
22

However, this also may come with privacy risks. For ex-
ample, the GPS, can be used by an application to get the
user location that will be further used in delivering tar-
geted ads. Even if the GPS is turned off, the device could
be geolocated by its ip address.
The risk that a user downloads such an application are
higher when advertising SDKs are also being taken into
consideration. In order to make a profit from their ap-
plication but still make it available for everyone, many
programmers use advertising SDKs. These are bundled
in the application and at different moments when the ap-
plication is being run, they contact a server in order to
display some marketing ads to the user. However, these
sdks come with their set of permissions and they usually
collect information that the programmer nor the user is
aware of.
Since more than 80% of the applications from the Google
Play and more than two thirds of the applications in Ap-
ple store are free, the ad-monetization method is domi-
nant. Many of the advertising frameworks collect private
information from the user and send them to their servers.
23

Adware specific behavior Percent of Apps
Sends location 9.80%Sends the e-mail address 5.73%
Sends the device ID 14.58%Sends the phone number 8.82%
Generate spam in notification bar 8.48 %Greates spam icons on home screen 9.17 %
Table 4.1: Actions Performed by TOP5 3rd PartySDKs
There are even situations where the private data is be-
ing sent unencrypted, thus an attacker could intercept the
traffic. There are even sdks that allow receiving and exe-
cution of JavaScript code from an external server without
verifying the server’s identity. This allows an attacker to
execute code on the device.
In order to highlight the data that is most often being
sent by third party sdks, 314.000 application from Google
Play were collected and the top 5 third party advertising
frameworks were analyzed. The results can be seen in
Table 4.1
24

Since the number of application on Google Play and Ap-
ple Store increased by more than 200.000 only in 2014,
the only way to analyze their privacy risks is to use an
automatic system.
In order to give a verdict for an applications, two stages
are needed. In the first one, the features are extracted and
stored in a parsable format while in the second one the
features will be processed and a verdict will be given. The
two stages must be performed separately since verdicts can
change from time to time as heuristics are added while
the extraction phase changes rarely. Feature extraction
is also done in two steps: First there is a static method
that parses the code and all meta information contained in
the file and then there is a dynamic method that tries to
execute the file and collect behavior features. As execution
take time, it is easy to understand why feature extraction
needs to be separated.
The static extraction method parses the Android executable
file (Dalvik Executable ), the iOS executable code found in
application packages (IPA) and as well as other files that
can be found in the application container (i.e. Manifest
25

File for the Android and the info.plist for the iOS). Fea-
tures that may be extracted are URL, Classes, Method
Names, service names, strings, etc. Using this informa-
tion, it is easy to detect if the application uses a known
adware sdk.
The Dynamic extraction method is the best solution against
obfuscation methods. This involves running the applica-
tion in a controlled environment and observing its behav-
ior as well as the data transmitted over the network. Using
Cycript for the iOS platform and Robotium for the An-
droid OS, real user scenarios are simulated.
After analysing over 310,000 applications from Google Pay,
the following privacy issues were discovered: 1.13% of the
application send the precise location of the device (GPS
coordinated), 0.64% send the e-mail address and 12.66%
send the device ID, using an unencrypted connection. Be-
sides that, 0.51% of the applications send the username
and password required in login or registration forms in
plain text.
A simillar study was carried on 207,000 application from
the Apple Market. 14.43% send the device ID and 0.56%
26
send the credentials required in login or registration forms
in plain text.
Conclusion and Future Work
This paper analyzed three main problems and solutions re-
garding security and privacy that people using computers
or mobile devices are currently facing.
The first one, which is the oldest, refers to detection of
malicious executables that run on the Windows operating
system. Here, the accuracy obtained by using the OSCP
algorithm was improved by extracting new features from
the original ones through the use of a neural network (Re-
stricted Boltzmann Machine) or through the use of Ge-
netic Programming.
The second problem addressed, which is mainly used in
targeted attacks, is detection of scripts found in document
files. To achieve a good detection rate a Hidden Markov
Model was tested as well as hybrid method consisting of
a decision tree and the OSCP algorithm.
The final problem presented in this paper is also the newest
one present among users. It reefers to the privacy of the
27

user’s personal data that is used by applications in mo-
bile devices. An analysis of privacy risks associated with
each well known application market was done. The cur-
rent work also focused on how a framework can be created
that is able to analyze these applications both statically
and dynamically and provides feedback to the users re-
garding to the danger they are exposing themselves.
Since using these methods good practical results were achieved,
in the near future more attention will be attributed to im-
proving them. Mainly, I am interested on how features
can be created using many stacked hidden layers in a neu-
ral network and how genetically evolved features can be
created using non-linear functions.
28