improving course evaluations to improve instruction …...improving course evaluations to improve...
TRANSCRIPT

RESEARCH ARTICLE
Improving course evaluations to improve instructionand complex learning in higher education
Theodore W. Frick Æ Rajat Chadha Æ Carol Watson Æ Emilija Zlatkovska
Published online: 7 July 2009� Association for Educational Communications and Technology 2009
Abstract Recent research has touted the benefits of learner-centered instruction, prob-
lem-based learning, and a focus on complex learning. Instructors often struggle to put these
goals into practice as well as to measure the effectiveness of these new teaching strategies
in terms of mastery of course objectives. Enter the course evaluation, often a standardized
tool that yields little practical information for an instructor, but is nonetheless utilized in
making high-level career decisions, such as tenure and monetary awards to faculty. The
present researchers have developed a new instrument to measure teaching and learning
quality (TALQ). In the current study of 464 students in 12 courses, if students agreed that
their instructors used First Principles of Instruction and also agreed that they experienced
academic learning time (ALT), then students were about 5 times more likely to achieve
high levels of mastery of course objectives and 26 times less likely to achieve low levels of
mastery, according to independent instructor assessments. TALQ can measure improve-
ments in use of First Principles in teaching and course design. The feedback from this
instrument can assist teachers who wish to implement the recommendation made by Kuh
et al. (2007) that universities and colleges should focus their assessment efforts on factors
that influence student success.
Keywords Course evaluation � Teaching quality � First principles of instruction �Academic learning time � Complex learning � Higher education � Authentic problems
Introduction
Complex learning has been defined as involving ‘‘the integration of knowledge, skills and
attitudes, the coordination of qualitatively different constituent skills and the transfer of
what is learned in school or training to daily life and work settings’’ (van Merrienboer and
Kirschner 2007, p. 4). Van Merrienboer et al. (2002) note that there is a need for students to
be able to transfer complex cognitive skills to ‘‘an increasingly varied set of real-world
T. W. Frick (&) � R. Chadha � C. Watson � E. ZlatkovskaSchool of Education, Indiana University Bloomington, Bloomington, USAe-mail: [email protected]
123
Education Tech Research Dev (2010) 58:115–136DOI 10.1007/s11423-009-9131-z

contexts and settings.’’ They suggest that ‘‘inadequate [instructional] design may cause
learning problems’’ (p. 39). But how is a teacher to know if his or her instructional design
is inadequate or how a course could be improved?
Course evaluations traditionally used in higher education have few items that are
empirically related to student learning achievement. In meta-analyses of studies that have
examined this relationship, global items such as ‘‘This was an outstanding course’’ or ‘‘The
instructor of this course was outstanding’’ correlate moderately with student achievement
(average correlations of 0.47 and 0.43, respectively—cf., Cohen 1981; Feldman 1989;
Kulik 2001). While these global items do predict increased student achievement, they do
not indicate how to improve teaching. The reader is referred to our earlier reviews of extant
research about the relationship between student ratings of instructors and measures of
student achievement (Frick et al. 2008a, b).
Frick et al. (2008a) developed a new course evaluation instrument for assessing
Teaching and Learning Quality (TALQ). While the initial TALQ instrument has been
slightly modified based on reliability analyses from the first two studies, what is note-
worthy about the TALQ is that a priori scales have been constructed according to
instructional theories and other important variables which have been empirically associated
with student learning achievement. In particular, new scales were developed for student
ratings of First Principles of Instruction (Merrill 2002) and for student rating of his or her
own Academic Learning Time (ALT) (cf. Rangel and Berliner 2007). In addition, TALQ
rating scales are included that are consistent with Cohen’s (1981) meta-analysis that
pertain to global course/instructor quality and student learning progress, both empirically
demonstrated in numerous studies to be positively correlated with student achievement at
the college level.
First Principles of Instruction are relevant to complex learning of authentic, real-world,
whole tasks. Based on a synthesis of instructional design theories, Merrill (2002) claimed
that student learning will be promoted when: (1) instruction is problem- or task-centered,
(2) student learning is activated by connecting what they already know or can do with what
is to be newly learned, (3) students are exposed to demonstrations of what they are to learn,
(4) they have opportunities to try out what they have learned with instructor coaching and
feedback, and (5) they integrate what they have learned into their personal lives. If one or
more of these First Principles are missing during instruction, Merrill argues that learning
will be negatively impacted.
In a previous study of 140 students in 89 unique courses from a wide range of disci-
plines, Frick et al. (2008a) found highly significant positive correlations among TALQ
scales (study I). Based on course ratings, if students agreed or strongly agreed that
instructors used First Principles of Instruction and those students also agreed or strongly
agreed that they were engaged successfully in course activities (ALT), then they were
much more likely to: (1) report mastery of course objectives, (2) agree that they learned a
lot (made learning progress), (3) agree that they were satisfied, and (4) agree that the course
and instructor were outstanding.
In a second, somewhat larger study of 190 students in 111 different courses, Frick et al.(2008b) found similar patterns among TALQ scales derived from student ratings (study II).
Results from the studies I and II by Frick et al. (2008a, b) are consistent with Merrill’s
claims, according to student ratings and self-reports. Moreover, it would appear that
instructors could improve their courses by implementing First Principles of Instruction.
While First Principles were drawn from apparently successful instructional theories, few
empirical studies have been conducted to verify Merrill’s (2002) claim that First Principles
promote student learning.
116 T. W. Frick et al.
123

Problem
The current study (III) addresses two limitations of the Frick et al. (2008a, b) studies (I and
II):
1. In studies I and II only one or a few students from each course completed the TALQ
course evaluation. Therefore, the scores on TALQ items may not be representative of
the entire classes in these cases. The present study sought participation from wholeclasses to address this concern.
2. In studies I and II, the level of mastery of course objectives was self-reported by each
participating student. In the present study, the course instructor independently assessedthe level of each student’s mastery of course objectives. This measure was obtained
about 1 month after the course ended and was based on the instructor’s records of
grades on that student’s performance in class, assignments, projects, exams, papers
written, etc. This instructor rating of student mastery is not part of the TALQ
instrument itself. The TALQ is used by students to rate the instructor and course.
Research questions addressed in the present study (III) are:
1. What are the relationships among student ratings of First Principles of Instruction,
student academic learning time (ALT), satisfaction with the course, student learning
progress, global ratings of instructor and course quality and instructor ratings of
student mastery of course objectives?
2. When students agree that First Principles of Instruction occurred, what are the odds
that they also agree that ALT occurred, compared with students who did not agree that
First Principles of Instruction occurred?
3. When students agree that they experienced frequent success in course activities (ALT)
compared with not agreeing that ALT had occurred, what are the odds that students are
rated as high masters of course objectives by their instructors?
Method
Instrument
The first page of the current version of the TALQ instrument includes items on gender,
expected grade, student status (freshman, sophomore, junior, senior, graduate student,
other), and self-reported mastery of course objectives. The next three pages of the
instrument include 40 items that attempt to measure the following scales via student
ratings:
• use of five-First Principles of Instruction in the course taken by the student (Merrill
2002, 2008; Merrill et al. 2008): authentic problems, activation, demonstration,
application, and integration
• student’s own academic learning time in the course (ALT) (Berliner 1990; Fisher et al.1978; Kuh et al. 2007; Rangel and Berliner 2007)
• student’s own learning progress during the course (Cohen 1981)
• student’s own satisfaction with the course and instructor (Kirkpatrick 1994)
• global rating of course and instructor quality (Cohen 1981)
Improving course evaluations to improve instruction 117
123
The directions in the TALQ instrument informed students that ‘‘authentic problems or
authentic tasks are meaningful learning activities that are clearly relevant to you at this
time, and which may be useful to you in the future (e.g., in your chosen profession or field
of work, in your life, etc.)’’ (TALQ instrument, p. 2). These directions were included to
help respondents understand the meaning of the terms ‘authentic problems’ or ‘authentic
tasks’ when completing the TALQ.
The 40 items on the TALQ were randomly ordered so that students did not know which
items belonged to which scale. Some items were negatively worded for the purpose of
detecting whether or not students were reading TALQ items carefully. Those items were
later reverse-coded when constructing scores for scales described above, for reliability
analyses described below, and for data analyses to answer our research questions.
Participant selection
In collaboration with staff from a teaching center at a large Midwestern university, a
recruitment e-mail was sent to university faculty that sought volunteers who were willing
to have the TALQ instrument used in their classes, in addition to their normal course
evaluations. Prior to any data collection, the researchers met individually with each par-
ticipating faculty member to explain the purpose of the study, show him or her the TALQ
instrument, obtain his or her consent to participate in the study, and to arrange a specific
class day and time when researchers could administer the TALQ.
Procedures
During the last 3 weeks of the fall 2007 semester, a paper version of the TALQ evaluation
was administered by researchers a week or two before the standard course evaluation was
given to that class. The TALQ instrument was administered at the beginning of a regular
class period. Each evaluation form had a unique code number on the cover sheet that was
repeated on the evaluation form itself. Participating students wrote their names on the top
halves of the cover sheets, which were detached and given to the instructor, who then left
the classroom. Students completed the TALQ course evaluation anonymously; their
individual ratings were collected by the researchers and never shown to instructors.
About 1 month after completion of the course, instructors rated each participating
student’s mastery of course objectives using a 10-point scale. The bottom halves of the
cover sheets with instructor ratings and unique code numbers were returned to the
researchers. Thus, student anonymity was maintained, while researchers could pair
instructor ratings of student mastery with student ratings of the course by matching the
unique code numbers.
None of the courses in this study was taught by any of the researchers. Instructors were
provided with summary reports of TALQ scales after they had submitted their ratings of
student mastery of course objectives, except for one instructor who needed the TALQ
ratings of her classes for her annual report and these were the sole course evaluations she
used.
Respondents
Data were collected from 464 students in 12 different courses taught by eight instructors in
business, philosophy, history, kinesiology, social work, informatics, nursing, and health,
118 T. W. Frick et al.
123

physical education and recreation. The number of student respondents who completed the
TALQ ranged from 16 to 104 in the 12 classes, though in ten of the 12 classes the range
was from 22 to 53. Response rates were very high among those students present at the
beginnings of these classes, although a few students declined to participate. Approximately
56% of the respondents were female and 44% male—very similar to gender proportions on
the university campus overall. Unlike the previous two studies of the TALQ, nearly all of
the student respondents were undergraduates (52 freshmen, 104 sophomores, 115 juniors
and 185 seniors). In the prior studies (I and II) about one-third of the respondents were
graduate students. A larger percentage of juniors and seniors participated in the present
study (III), compared with freshmen and sophomores. This was not unexpected as uni-
versity faculty members are likely to teach more advanced courses, rather than introduc-
tory classes that are often taught by associate instructors. Only one of the courses was at
the freshman level, while the remaining classes were at the sophomore through senior
levels.
Data preparation
Data from TALQ items completed by students were manually entered into SPSS, including
unique code numbers to identify students. When instructor ratings of student mastery were
later obtained, these were also entered manually into SPSS by matching the unique code
numbers from the cover sheets that instructors returned to the researchers. Researchers then
worked in pairs to compare all SPSS data entries with raw data from the completed paper
versions. The few data entry errors that were detected were then corrected.
Before data analysis began, negatively worded items were reverse-coded using SPSS
recode. For each student case, scores were then computed via SPSS for the nine TALQ
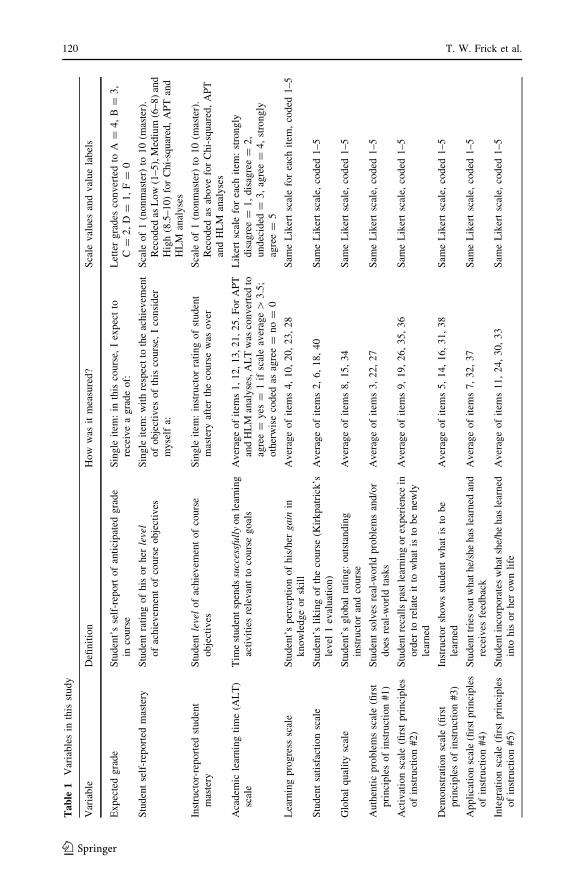
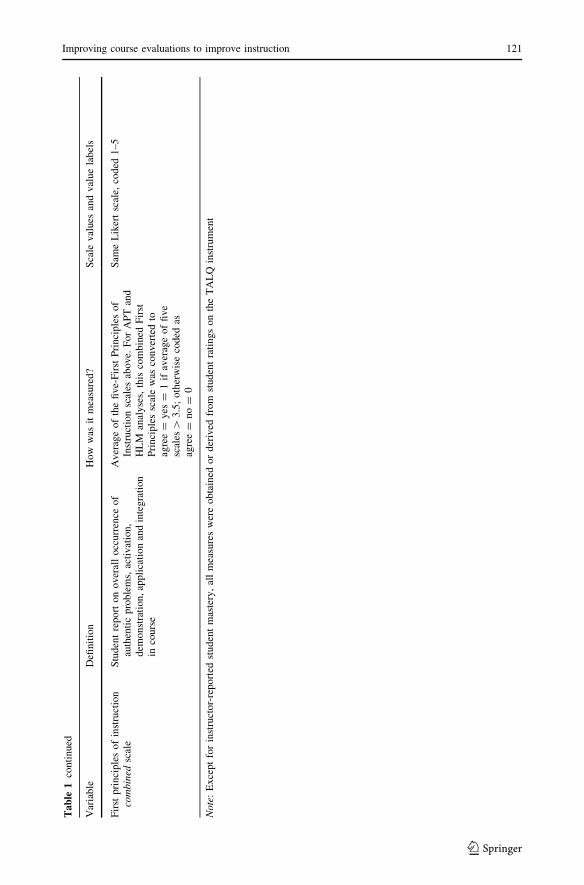
scales. Table 1 lists variables used in this study, their definitions, respective items and
methods for scale derivations, and measurement scale values and value labels.
Data analysis and results
Prior to addressing the research questions, psychometric properties of measures used in this
study are first examined. Analyses to answer the three main research questions are reported
next, using Spearman correlations and Analysis of Patterns in Time (APT). To further
investigate the findings, results from hierarchical loglinear model (HLM) and factor
analyses are also reported below.
Mastery scales and grades expected by students
Instructor ratings of student mastery of course objectives were correlated highly with
student reports of expected grades (Spearman’s q = 0.584, p \ 0.0005), when the 10-point
ordinal scale for mastery level was used. Since our study was completed about 2 weeks
prior to the end of the semester, most students did not know their exact final grades. Due to
privacy issues, researchers were unable to obtain actual student course grades, although
instructors later informed us that they based their ratings on student performance in the
course. The 10-point scale on mastery of course objectives was converted to a 3 point scale
(0–5 was converted to low mastery coded as 0, 6–8 was converted to medium mastery
coded as 1, and 8.5–10 was converted to high mastery coded as 2). If the original 10-point
scale had been used, then the number of observations in each cell in the crosstabulation of
Improving course evaluations to improve instruction 119
123
Tab
le1
Var
iab
les
inth
isst
ud
y
Var
iab
leD
efin
itio
nH
ow
was
itm
easu
red
?S
cale
val
ues
and
val
ue
lab
els
Ex
pec
ted
gra
de
Stu
den
t’s
self
-rep
ort
of
anti
cip
ated
gra
de
inco
urs
eS
ing
leit
em:
inth
isco
urs
e,I
exp
ect
tore
ceiv
ea
gra
de
of:
Let
ter
gra
des
con
ver
ted
toA
=4
,B
=3
,C
=2
,D
=1
,F
=0
Stu
den
tse
lf-r
epo
rted
mas
tery
Stu
den
tra
ting
of
his
or
her
leve
lof
achie
vem
ent
of
cours
eobje
ctiv
esS
ingle
item
:w
ith
resp
ect
toth
eac
hie
vem
ent
of
ob
ject
ives
of
this
cou
rse,
Ico
nsi
der
myse
lfa:
Sca
leo
f1
(no
nm
aste
r)to
10
(mas
ter)
.R
eco
ded
asL
ow
(1–
5),
Med
ium
(6–
8)
and
Hig
h(8
.5–10)
for
Chi-
squar
ed,
AP
Tan
dH
LM
anal
yse
s
Inst
ruct
or-
rep
ort
edst
ud
ent
mas
tery
Stu
den
tle
vel
of
achie
vem
ent
of
cou
rse
ob
ject
ives
Sin
gle
item
:in
stru
cto
rra
tin
go
fst
ud
ent
mas
tery
afte
rth
eco
urs
ew
aso
ver
Sca
leo
f1
(no
nm
aste
r)to
10
(mas
ter)
.R
eco
ded
asab
ov
efo
rC
hi-
squar
ed,
AP
Tan
dH
LM
anal
yse
s
Aca
dem
icle
arnin
gti
me
(AL
T)
scal
eT
ime
stu
den
tsp
ends
succ
essf
ull
yo
nle
arn
ing
acti
vit
ies
rele
van
tto
cou
rse
go
als
Av
erag
eo
fit
ems
1,
12
,1
3,
21
,2
5.
Fo
rA
PT
and
HL
Man
aly
ses,
AL
Tw
asco
nv
erte
dto
agre
e=
yes
=1
ifsc
ale
aver
age[
3.5
;o
ther
wis
eco
ded
asag
ree
=n
o=
0
Lik
ert
scal
efo
rea
chit
em:
stro
ng
lyd
isag
ree
=1
,d
isag
ree
=2
,u
nd
ecid
ed=
3,
agre
e=
4,
stro
ng
lyag
ree
=5
Lea
rnin
gp
rog
ress
scal
eS
tud
ent’
sp
erce
pti
on
of
his
/her
ga
inin
kn
ow
led
ge
or
skil
lA
ver
age
of
item
s4
,1
0,
20
,2
3,
28
Sam
eL
iker
tsc
ale
for
each
item
,co
ded
1–
5
Stu
den
tsa
tisf
acti
on
scal
eS
tud
ent’
sli
kin
go
fth
eco
urs
e(K
irk
pat
rick
’sle
vel
1ev
alu
atio
n)
Av
erag
eo
fit
ems
2,
6,
18
,4
0S
ame
Lik
ert
scal
e,co
ded
1–
5
Glo
bal
qu
alit
ysc
ale
Stu
den
t’s
glo
bal
rati
ng
:o
uts
tand
ing
inst
ruct
or
and
cou
rse
Av
erag
eo
fit
ems
8,
15
,3
4S
ame
Lik
ert
scal
e,co
ded
1–
5
Au
then
tic
pro
ble
ms
scal
e(fi
rst
pri
nci
ple
so
fin
stru
ctio
n#
1)
Stu
den
tso
lves
real
-wo
rld
pro
ble
ms
and
/or
do
esre
al-w
orl
dta
sks
Av
erag
eo
fit
ems
3,
22
,2
7S
ame
Lik
ert
scal
e,co
ded
1–
5
Act
ivat
ion
scal
e(fi
rst
pri
nci
ple
so
fin
stru
ctio
n#
2)
Stu
den
tre
call
sp
ast
lear
nin
go
rex
per
ience
ino
rder
tore
late
itto
wh
atis
tob
en
ewly
lear
ned
Av
erag
eo
fit
ems
9,
19
,2
6,
35
,3
6S
ame
Lik
ert
scal
e,co
ded
1–
5
Dem
on
stra
tio
nsc
ale
(firs
tp
rin
cip
les
of
inst
ruct
ion
#3
)In
stru
cto
rsh
ow
sst
ud
ent
wh
atis
tob
ele
arn
edA
ver
age
of
item
s5
,1
4,
16
,3
1,
38
Sam
eL
iker
tsc
ale,
cod
ed1
–5
Ap
pli
cati
on
scal
e(fi
rst
pri
nci
ple
so
fin
stru
ctio
n#
4)
Stu
den
ttr
ies
ou
tw
hat
he/
she
has
lear
ned
and
rece
ives
feed
bac
kA
ver
age
of
item
s7
,3
2,
37
Sam
eL
iker
tsc
ale,
cod
ed1
–5
Inte
gra
tio
nsc
ale
(firs
tp
rin
cip
les
of
inst
ruct
ion
#5
)S
tud
ent
inco
rpo
rate
sw
hat
she/
he
has
lear
ned
into
his
or
her
ow
nli
feA
ver
age
of
item
s1
1,
24
,3
0,
33
Sam
eL
iker
tsc
ale,
cod
ed1
–5
120 T. W. Frick et al.
123
Tab
le1
con
tin
ued
Var
iab
leD
efin
itio
nH
ow
was
itm
easu
red
?S
cale
val
ues
and
val
ue
lab
els
Fir
stp
rin
cip
les
of
inst
ruct
ion
com
bin
edsc
ale
Stu
den
tre
po
rto
no
ver
all
occ
urr
ence
of
auth
enti
cpro
ble
ms,
acti
vat
ion,
dem
on
stra
tio
n,
app
lica
tio
nan
din
teg
rati
on
inco
urs
e
Av
erag
eo
fth
efi
ve-
Fir
stP
rin
cip
les
of
Inst
ruct
ion
scal
esab
ov
e.F
or
AP
Tan
dH
LM
anal
yse
s,th
isco
mb
ined
Fir
stP
rin
cip
les
scal
ew
asco
nv
erte
dto
agre
e=
yes
=1
ifav
erag
eo
ffi
ve
scal
es[
3.5
;oth
erw
ise
coded
asag
ree
=n
o=
0
Sam
eL
iker
tsc
ale,
cod
ed1
–5
Not
e:E
xce
pt
for
inst
ruct
or-
repo
rted
stu
den
tm
aste
ry,
all
mea
sure
sw
ere
ob
tain
edo
rd
eriv
edfr
om
stud
ent
rati
ng
so
nth
eT
AL
Qin
stru
men
t
Improving course evaluations to improve instruction 121
123

student mastery level and expected grades would have been very low. Estimates of sta-
tistical significance are compromised when there are numerous low frequency cells (e.g.,
for Chi squared, v2).
In Table 2, it can be seen that the association between grades students expected to
receive and instructor ratings of their mastery level (coded as low, medium and high) is
strong (v2 = 163.3, p \ 0.0005). Nonetheless, about 21% of students who expected to
receive A’s were classified at a medium level of mastery by their instructors, and about
6.5% who expected B’s were rated at a high level of mastery by their instructors. Fur-
thermore, about 7% of the students who expected a grade of B were rated as low masters by
their instructors.
Students also self-reported their mastery levels on a 10-point scale. The Spearman
correlation between student and instructor ratings of student mastery on the original 10-
point scales was 0.382 and highly significant (p \ 0.0005). After student self-ratings were
recoded into low, medium and high mastery in the same manner as were instructor ratings,
a crosstabulation was performed. While agreement between student and instructor ratings
was highly significant when corrected for chance (j = 0.17, p \ 0.0005), there are notable
discrepancies. The area of greatest discrepancy was 108 students (23.5%) who considered
themselves to be medium masters, whereas their instructors classified those same students
as high masters of course objectives. A further crosstabulation between student self-
reported mastery (recoded as low, medium and high) and expected grades indicated that
153 students (34%) expected to receive a grade of A, yet considered themselves medium
masters.
In summary, 93 students (21%) were rated by their instructors as medium masters, but
those same students expected to receive a grade of A in the course. Nearly 24 percent of the
students perceived themselves as medium masters while their instructors rated them as highmasters of course objectives. About one-third of the students (153) expected to receive A’s
who also considered themselves as medium masters.
Table 2 Crosstabulation of course grades that students expected to receive and independent instructorratings of student mastery: frequencies of joint occurrences and percentages of total
Instructor rating of student mastery Total
Low (0–5) Medium (6–8) High (8.5–10)
In this course, I expect to receive a grade of:
A Count 1 93 126 220
% of total 0.2% 20.8% 28.1% 49.1%
B Count 32 137 29 198
% of total 7.1% 30.6% 6.5% 44.2%
C Count 16 12 0 28
% of total 3.6% 2.7% 0.0% 6.3%
D Count 1 1 0 2
% of total 0.2% 0.2% 0.0% 0.4%
Total
Count 50 243 155 448
% of total 11.2% 54.2% 34.6% 100.0%
Note: Total N here is 448 due to missing data in the 464 cases on one or both variables
122 T. W. Frick et al.
123

First principles of instruction scale: authentic problems
Student reports of their engagement in authentic problems (Principle #1), was indicated by
three items: (3) ‘‘I performed a series of increasingly complex authentic tasks in this
course’’; (22) ‘‘I solved authentic problems or completed authentic tasks in this course’’;
and (27) ‘‘In this course I solved a variety of authentic problems that were organized from
simple to complex’’. The Cronbach a coefficient (internal consistency) of this scale was
0.690.
Further examination of the way that these items are stated indicates student engagementwith these authentic problems (‘‘I performed…’’, ‘‘I solved…’’). Thus, it is possible that a
course could have provided authentic problems for students to solve, but they did not
engage in doing so. Therefore, they could disagree that they performed authentic tasks or
solved authentic problems, even though they were expected to do so in the course.
Furthermore, when ratings of engagement with authentic problems were examined
within each of the 12 classes, some classes were more divided than others in terms of their
agreement and disagreement on this scale. This would suggest that perceptions of authentic
problems may be further related to the nature of course content and types of students who
are enrolled. For example, authenticity of tasks in an advanced level nursing course would
be less ambiguous to nursing students, when compared with perceptions of authenticity of
tasks in a history course taken as an elective by non-majors.
First principles of instruction scale: activation
Items for Principle #2 were: (9) ‘‘I engaged in experiences that subsequently helped me
learn ideas or skills that were new and unfamiliar to me’’; (19) ‘‘In this course I was able to
recall, describe or apply my past experience so that I could connect it with what I was
expected to learn’’; (26) ‘‘My instructor provided a learning structure that helped me to
mentally organize new knowledge and skills’’; (35) ‘‘In this course I was able to connect
my past experience to new ideas and skills I was learning’’; and (36) ‘‘In this course I was
not able to draw upon my past experience nor relate it to new things I was learning’’
(reverse-coded). The Cronbach a for this Activation scale was 0.812.
First principles of instruction scale: demonstration
Items for Principle #3 were: (5) ‘‘My instructor demonstrated skills I was expected to learn
in this course’’; (14) ‘‘Media used in this course (texts, illustrations, graphics, audio, video,
computers) were helpful in learning’’; (16) ‘‘My instructor gave examples and counter-
examples of concepts that I was expected to learn’’; (31) ‘‘My instructor did not demon-
strate skills I was expected to learn’’ (reverse-coded); and (38) ‘‘My instructor provided
alternative ways of understanding the same ideas or skills’’. The Cronbach a for this
Demonstration scale was 0.830.
First principles of instruction scale: application
Items for Principle #4 included: (7) ‘‘My instructor detected and corrected errors I was
making when solving problems, doing learning tasks, or completing assignments’’; (32) ‘‘I
had opportunities to practice or try out what I learned in this course’’; and (37) ‘‘My course
instructor gave me personal feedback or appropriate coaching on what I was trying to
learn’’. The Cronbach a for this Application scale was 0.758.
Improving course evaluations to improve instruction 123
123

First principles of instruction scale: integration
Items for Principle #5 were: (11) ‘‘I had opportunities in this course to explore how I could
personally use what I learned’’; (24) ‘‘I see how I can apply what I learned in this course to
real life situations’’; (30) ‘‘I was able to publicly demonstrate to others what I learned in
this course’’; and (33) ‘‘In this course, I was able to reflect on, discuss with others, and
defend what I learned’’. The Cronbach a for this Integration scale was 0.780.
First principles of instruction: combined scale
For each student and each First Principle, a scale score was computed by taking the mean
value from responses to that scale by that student. These five scales were further combined
into a combined First Principles scale by taking the mean of the scale means for each
student. Cronbach’s a for this combined First Principles scale was 0.881.
Academic learning time (ALT) scale
Items comprising the ALT scale (successful student engagement) were: (1) ‘‘I did not do
very well on most tasks in this course, according to my instructor’s judgment of the quality
of my work’’ (reverse-coded); (12) ‘‘I frequently did very good work on projects,
assignments, problems and/or activities for this course’’; (13) ‘‘I spent a lot of time doing
tasks, projects and/or assignments, and my instructor judged my work of high quality’’; and
(21) ‘‘I put a great deal of effort and time into this course, and it has paid off—I believe
that I have done very well overall’’. Cronbach’s a for this ALT scale was 0.763.
Student learning progress scale
This scale was comprised of the following items: (4) ‘‘Compared to what I knew before I
took this course, I learned a lot’’; (10) ‘‘I learned a lot in this course’’; (23) ‘‘I learned very
little in this course’’ (reverse-coded); and (28) ‘‘I did not learn much as a result of taking
this course’’ (reverse-coded). The Cronbach a for this Learning Progress scale was 0.935.
Student satisfaction scale
The following items were used on this scale: (2) ‘‘I am very satisfied with how my
instructor taught this class’’; (6) ‘‘I am dissatisfied with this course’’ (reverse-coded); (18)
‘‘This course was a waste of time and money’’ (reverse-coded); and (40) ‘‘I am very
satisfied with this course’’. Cronbach’s a for this Satisfaction scale was 0.926.
Global quality scale
Items on this scale were taken from the university’s course evaluation item pool and were
consistent with those that Cohen (1981) had identified as being moderately correlated with
student learning achievement: (8) ‘‘Overall, I would rate the quality of this course as
outstanding’’; (15) ‘‘Overall, I would rate this instructor as outstanding’’; and (34)
‘‘Overall, I would recommend this instructor to others’’. The Cronbach a for this Global
Quality scale was 0.915.
124 T. W. Frick et al.
123

Relationships among TALQ scales
In order to address the first research question, Spearman rho (q) correlations were com-
puted for the TALQ scales on the 464 students and the instructor ratings of student
mastery, since these are all ordinal level measures. It can be seen from Table 3 that First
Principles of Instruction ratings are positively and very highly correlated with Global
Quality, Student Satisfaction, ALT, and Learning Progress. Similarly, the remaining scales
are highly correlated with each other, except for Instructor Rating of Student Mastery.
The best correlation with this rating of Student Mastery is Academic Learning Time
(Spearman’s q = 0.362, p \ 0.0005).
Pattern analyses
Theoretically, we would expect students to be more motivated when instructors use First
Principles of Instruction, because students are expected to solve authentic or real-world
problems as well as to integrate what they have learned into their personal lives. In other
words, what they learn is expected to be more relevant and meaningful (see Keller 1987). If
students are more highly motivated, then they would be expected to be engaged more often
in learning tasks. Furthermore, if instructors demonstrate what students are expected to
learn and also provide feedback and scaffolding when students themselves try, we would
expect student engagement to be successful more often—i.e., more Academic Learning
Time (ALT). The research on ALT indicates that the more frequently students are engaged
successfully, the higher they tend to score on tests of achievement (assuming that what
students engage in is similar to what they are tested on).
Analysis of Patterns in Time (APT) was used to further investigate these relationships
(Frick 1990). With the exception of the student mastery scale (already coded as low,
medium and high), remaining scales were recoded for ‘agreement’ = ‘Yes’ if the scale
score was greater than 3.5, and ‘agreement’ = ‘No’ if the student’s scale score was less than
or equal to 3.5. The reasoning for this coding system was that on the original Likert scale,
‘agree’ was coded as ‘4’ and ‘strongly agree’ as ‘5’; thus, any mean scale score that was
closer to ‘4’ or ‘5’ was interpreted as agreement with that scale; otherwise it was interpreted
as not in agreement (strongly disagree = ‘1’, disagree = ‘2’, or undecided = ‘3’).
Table 3 Spearman correlations among TALQ scales
Firstprinciples
Globalquality
Studentsatisfaction
ALT Learningprogress
Studentmasterya
First principles 1.000 0.774 0.778 0.583 0.725 0.115b
Global quality 1.000 0.848 0.528 0.664 0.180
Student satisfaction 1.000 0.557 0.746 0.202
ALT 1.000 0.498 0.362
Learning progress 1.000 0.136c
Student mastery 1.000
a 10-point scale used here for instructor ratings of student mastery of course objectives; b p = 0.014;c p = 0.003; all remaining correlations are significant at p \ 0.0005; n = 464. The Type I error rate was setthis low (0.0005), as explained in Frick et al. (2008a) to minimize the chances of reporting statisticalsignificance when the sample size is large and a number of comparisons are made
Improving course evaluations to improve instruction 125
123

As noted above, while significantly and positively correlated, instructors’ ratings of
student mastery and student self-reports of their mastery were in some disagreement.
About one out of four students rated himself or herself at a medium level of mastery, when
the instructor independently rated him or her at a high mastery level. Thus, we believed
that a more reliable determination of student mastery was evident when both the student
and instructor independently agreed on that student’s mastery level (Low/Low, Medium/
Medium, or High/High). For pattern analysis, the 10-point scale of mastery of course
objectives was converted to a 3-point scale as discussed earlier. Since no other metric of
student learning achievement was available (and course grades were less discriminating, as
discussed above), we selected cases in which the instructor and student ratings matched for
each student. This resulted in 256 students, or about 55% of the original sample of 464
cases. The proportions of males and females were almost identical in the reduced sample as
in the original, and proportions in other demographics also appeared to be about the same.
To specifically address the second and third research questions, we conducted further
analyses using APT to see if these patterns occurred in data from our study. For the APT
Query, ‘If agreement on First Principles is Yes, then agreement on ALT is Yes?’, it can be
seen in Table 4 that this query was true in 150 out of 195 (76.9%) cases. On the other hand,
for the APT Query, ‘If agreement on First Principles is Yes, then agreement on ALT is
No?’, this pattern was found in 16 out of 61 (26.2%) cases. Thus, the odds of successful
engagement are 0.769/0.262 or about 2.9 to 1 that a student reported that she or he was
successfully engaged when she or he also agreed that First Principles occurred versus not
having occurred.
In Table 5 it can be seen that for the APT Query, ‘If agreement on ALT is Yes, then
instructor rating of student mastery is high?’, occurred in 39 out of 166 cases (23.5%).
Alternatively, ‘If agreement on ALT is No, then instructor rating of student mastery is
high?’ only occurred in 4 out of 90 cases (4.4%). Thus, the odds are about 0.235/0.044, or
5.3 to 1, for a student to be rated at a high mastery level of course objectives when she or he
agreed versus disagreed about being successfully engaged (ALT). Medium levels of
mastery were about equally likely, regardless of whether or not a student agreed about his
or her ALT. On the other hand, if a student did not agree that ALT occurred, then she or he
was 9.9 times more likely to be rated by his or her instructor at a low mastery level of
course objectives (0.178/0.018).
In Table 6, a slightly more complex APT Query addresses the combination of First
Principles, ALT and student mastery ratings. It can be seen that for the APT Query, ‘If
Table 4 Results for the APT query: if agree that first principles of instruction occurred is ___, then agreethat ALT occurred is ___?
Agree that first principles of instruction occured
No Yes
Count Column N (%) Count Column N (%)
Agree that ALT occurred
No 45 73.8 45 23.1
Yes 16 26.2 150 76.9
Total 61 100.0 195 100.0
Note that the ‘___’ signifies that categories within that classification are free to vary; thus, this is a compactway of expressing all possible queries for this ‘If …, then …?’ pattern
126 T. W. Frick et al.
123

Agreement on First Principles is Yes and Agreement on Successful Engagement (ALT) is
Yes, then Instructor Rating of Student Mastery is High?’ is true in 34 out of 150 cases,
yielding a probability estimate of 0.227. On the other hand, ‘If Agreement on First Prin-
ciples is No and Agreement on Successful Engagement is No, then Instructor Rating of
Student Mastery is High?’ is true in two out of 45 cases, yielding a probability estimate of
0.044. Thus, a student is about 5.2 times as likely to be rated by his or her instructor (and
himself or herself) as a high master of course objectives when that student agreed that First
Principles occurred and also agreed that she or he experienced ALT (successful engage-
ment), compared with not agreeing that First Principles and ALT occurred. The odds of 5.2
to 1 are computed as a ratio of the two probabilities: (0.227/0.044). The odds are about 25.6
to 1 of being a student being rated by his or her instructor as a low master of course
objectives when that student did not agree that First Principles and ALT occurred (0.333/
0.013 = 25.6), compared with being rated as a low master when a student agreed that both
First Principles and ALT did occur.
One can also see in Table 6 that when a student agreed that First Principles occurred but
not ALT, she or he is about 1.5 times more likely to be rated at a medium level of mastery,
compared with agreeing that ALT occurred but not First Principles (0.933/0.625).
Table 5 Results for the APT query: if agree that ALT occurred is ___, then instructor rating of studentmastery is of course objectives is ___?
Agree that ALT occurred
No Yes
Count Column N (%) Count Column N (%)
Instructor rating of student mastery of course objectives
Low (0–5) 16 17.8 3 1.8
Medium (6–8) 70 77.8 124 74.7
High (8.5–10) 4 4.4 39 23.5
Total 90 100.0 166 100.0
Table 6 Results for the APT query: if agree that first principles of instruction occurred is ___ and agree thatALT occurred is ___, then instructor rating of student mastery is of course objectives is ___?
Agree that first principles of instruction occurred
No Yes
Agree that ALT occurred Agree that ALT occurred
No Yes No Yes
Count ColumnN (%)
Count ColumnN (%)
Count ColumnN (%)
Count ColumnN (%)
Instructor rating of student mastery of course objectives
Low (0–5) 15 33.3 1 6.2 1 2.2 2 1.3
Medium (6–8) 28 62.2 10 62.5 42 93.3 114 76.0
High (8.5–10) 2 4.4 5 31.2 2 4.4 34 22.7
Total 45 100.0 16 100.0 45 100.0 150 100.0
Improving course evaluations to improve instruction 127
123
Differences among courses and instructors
Although not one of our original research questions, we wondered: Do courses differ with
respect to student agreement that instructors used First Principles of Instruction, agreement
that students experienced Academic Learning Time, and instructor ratings of student
mastery of course objectives? Chi-square analyses were run to answer these questions. The
association between courses and student agreement that First Principles of Instruction
occurred was highly significant (v2 = 102.6, df = 11, p \ 0.0005). The association
between courses and student agreement that they experienced ALT was also significant
(v2 = 61.1, df = 11, p \ 0.0005). Finally, the association between courses and instructor
ratings of student mastery of course objectives was statistically significant (v2 = 108.7,
df = 11, p \ 0.0005). Due to the present researchers’ agreement to preserve instructor
anonymity in the IRB protocol, we cannot discuss which specific courses were higher or
lower than expected with respect to student agreement on use of First Principles of
Instruction, ALT and student mastery. Nonetheless, courses did differ on these three
variables.
Furthermore, as expected, there is a statistically significant association between student
agreement on instructor use of First Principles and student agreement that they experienced
ALT (v2 = 103.8, df = 1, p \ 0.0005), consistent with results in Table 4. There is also a
significant relationship between agreement that ALT occurred and instructor rating of
student mastery of course objectives (v2 = 41.7, df = 2, p \ 0.0005), likewise consistent
with results in Table 5.
Thus, based on results from this study, it appears that, according to student ratings: (1)
course instructors do differ with respect to use of First Principles of Instruction; (2) courses
differ with respect to student ALT; and (3) courses differ according to instructor ratings of
their students’ mastery of course objectives.
Hierarchical loglinear model analysis
A hierarchical loglinear model (HLM) analysis was conducted to further investigate the
relationships among courses, First Principles of Instruction, Academic Learning Time
(ALT) and instructor ratings of student mastery of course objectives. Courses were
expected to differ with respect to instructor use of First Principles, and in turn First
Principles should predict ALT, which in turn should predict student mastery of course
objectives.
The SPSS hierarchical loglinear model procedure was used with backward elimination.
This HLM analysis was performed on all combinations of Course 9 First Princi-
ples 9 ALT 9 Mastery (12 9 2 9 2 9 3 = 144 cells for 461 cases). In this HLM pro-
cedure, the goal is to find the least complex model to best predict cell frequencies.
According to Tabachnick and Fidell (2001):
The purpose of modeling is to find the incomplete model with the fewest effects that
still closely mimics the observed [cell] frequencies…. Hierarchical (nested) models
include the highest-order reliable association and all its component parts… For
hierarchical models, the optimal model is one that is not significantly worse than the
next most complex one. Therefore, the choice among hierarchical models is made
with reference to statistical criteria. (p. 234)
128 T. W. Frick et al.
123
Results from the backward-elimination HLM analysis indicated that four interaction
factors were the best predictors of observed cell frequencies: (1) Course 9 First Princi-
ples 9 Mastery, (2) Course 9 ALT, (3) First Principles 9 ALT, and (4) ALT 9 Mastery.
Removal of any of these four predictors will result in a statistically significant v2 value
(p \ 0.05), meaning that there is no longer a good fit between the model and the observed
cell frequencies if that predictor is removed. This model resulted in a v2 value of 45.06
(df = 57), p = 0.874 for goodness of fit, meaning that cell frequencies predicted by this
model did not significantly deviate from observed cell frequencies (a desirable result when
determining goodness of fit).
Noteworthy was that, in four of the 12 classes, students were more likely to disagree that
First Principles occurred, compared with students in the remainder of the courses. The
HLM analysis supports this, since course is a component of the first and second interaction
effects. The third effect indicates that when First Principles are or are not present according
to student ratings, students differ in their reports of agreement about their individual
Academic Learning Time (frequent, successful engagement in course tasks). As is evident
in Table 4, students were about 3 times more likely to agree that they experienced ALT if
they also agreed that their instructors used First Principles. The fourth interaction effect
indicates a significant relationship between ALT and instructor ratings of student mastery
of course objectives, which is consistent with Table 5. Students were about 5.3 times as
likely to be independently rated as high masters of course objectives by their instructors
when they also agreed that they experienced frequent, successful engagement in course
tasks (ALT); and they were nearly 10 times as likely to be rated as low masters when they
also did not agree that they experienced ALT.
In summary, this HLM analysis is consistent with the APT analysis reported above. The
HLM analysis indicates the statistical significance of the relationships among factors, while
the APT analysis provides the practical details in terms of conditional probability estimates
of patterns. It does appear to matter who the instructor is in terms of predicting use of First
Principles and resulting levels of student mastery in a course. The use of First Principles
does appear to matter when predicting ALT, and ALT and First Principles together matter
when predicting student mastery of course objectives. The APT results in Table 6 make
this relationship most clear: students are about 5 times more likely to be rated as highmasters of course objectives by their instructors when students agree that both First
Principles and their own ALT occurred (compared with their absence). Moreover, students
are about 26 times more likely to be rated as low masters when neither First Principles or
ALT was reported to occur versus when both were reported to occur by students.
It should be noted that the APT analyses were conducted on cases where students and
their instructors agreed on their mastery level (n = 256), while the HLM analysis was
conducted on the entire sample (n = 461, with three cases missing values on at least one of
the four variables). Nonetheless, these results are consistent in both kinds of analysis. It
should be further noted that in multi-way frequency analyses such as HLM Tabachnick and
Fidell (2001, p. 223) recommend that at least five times as many cases as cells should occur
because this might cause problems in convergence (in the solution). While we had less than
720 cases (144 9 5), we did not experience any problems with convergence in our SPSS
HLM analysis. Tabachnick and Fidell also recommend that, for all two-way associations,
all expected cell frequencies should be greater than one, and no more than 20% of the
expected cell frequencies should be less than five. In our study, all expected cell
frequencies were greater than one, and only seven cells (out of a total of 100 in the six
two-way contingency tables) had expected frequencies less than five (7%).
Improving course evaluations to improve instruction 129
123

Factor analysis: instructional quality
Spearman correlations among the scales related to the quality of the course and instructor
were generally very high, as was shown in Table 3. Are these scales measuring the same
overall construct, perhaps something that might be called ‘Instructional Quality?’ To
investigate this possibility, we conducted a factor analysis of the scales pertaining to
elements of the course and teaching over which instructors have direct control. Thus we
excluded from this factor analysis variables and scales related to student learning progress,
ratings of mastery of course objectives and academic learning time—since these are ele-
ments that are affected by student effort and engagement. A student’s volition is under his
or her own control. Students can choose not to attend class, not participate, and/or not
engage in or complete tasks related to course objectives.
We used the image analysis extraction method, which ‘‘distributes among factors the
variance of an observed variable that is reflected by the other variables—and provides a
mathematically unique solution’’ (Tabachnick and Fidell 2001, p. 612). The net effect of
this approach is to minimize the impact of outliers.
Results of factor analysis are presented in Table 7. A single factor was extracted which
accounted for nearly 61% of the variance. It can be seen that factor loadings ranged from
0.895 to 0.621. These are strong loadings and are consistent with the high correlations
reported in Table 2. What is noteworthy is that all five-First Principles of Instruction scales
load on the same factor that includes student satisfaction with the course and instructor and
student global ratings of the course and instructor quality. Even though we randomly mixed
items pertaining to these scales on the TALQ instrument, and students did not know what
scales we were measuring (such as those related to First Principles of Instruction), those
students nonetheless were consistent in their ratings (according to Cronbach a coefficients
reported above). Moreover, these scales appear to be measuring a single factor that could
be termed ‘Instructional Quality.’ Even though students were presumably uninformed
about Merrill’s First Principles of Instruction, they rated items associated with these First
Principles scales consistently with items pertaining to perceived overall course and
instructor quality and with their reported satisfaction with that course and instructor.
Discussion: implications for teaching and learning
The present study was the first one in which TALQ ratings could be compared with
independent instructor ratings of student mastery of course objectives. The previous two
studies utilized Web-based course evaluations (Frick et al. 2008a, b) which covered a wide
Table 7 Factor matrix and load-ings from factor analysis of stu-dent ratings of instructors andcourses
TALQ scale LoadingFactor 1
Student satisfaction 0.895
Global quality 0.883
Demonstration 0.815
Integration 0.777
Authentic problems 0.740
Activation 0.685
Application 0.621
130 T. W. Frick et al.
123
range of courses in higher education—89 and 111 unique course topics, respectively, at
multiple institutions, with ratings typically from one or two students per course at both the
graduate and undergraduate level. Courses in studies I and II were taught either face to face
or online; and respondents used the URL to access the TALQ course evaluation instrument.
The present study (III) describes data obtained from 12 undergraduate courses taught
face to face at one university, using a paper-based TALQ course evaluation, with ratings
from most students in each course. What is noteworthy is that associations and patterns of
ratings are consistent across these three studies, conducted over a 3 year time span. Given
this consistency, it is less likely that the findings from the present study are unique to the
instructors, courses or the university in which this study (III) was conducted.
It is further important to note that, in the present study, course instructors never saw the
TALQ ratings by individual students in their classes, and students never saw the instructor
ratings of student mastery of course objectives. In other words, these ratings were inde-
pendently obtained from students and their instructors.
Results from Analysis of Patterns in Time in this study are consistent with theoretical
predictions from Merrill (2002) on First Principles of Instruction. These results are also
consistent with well-established empirical evidence that supports the relationship between
Academic Learning Time and student achievement (e.g., Kuh et al. 2007; Rangel and
Berliner 2007).
The results of this study are also consistent with the Theory of Immediate Awareness(Estep 2003; 2006). Estep discusses the ‘‘intelligence of doing’’ as well as findings from
neuroscience that support the necessity for immediate awareness (knowing the unique) for
coming to know how. Immediate awareness is the relation between the learner and suigeneris objects:
Because sui generis objects in the immediate awareness relation are not class objects,
they are not linguistic objects either. As such, they cannot be reduced in any way to
objects of knowledge by description. The immediate awareness knowing of such
objects is knowing the unique…. These objects are very real to subjects [learners];
they are in immediate relations with subjects and have a direct affect upon their
intentional and intelligent behavior. (Estep 2006, p. 209)
Greenspan and Benderly (1997) have arrived at the same conclusion through consid-
erable clinical and neurological evidence. Greenspan’s findings are consistent with Estep
(2006). Their conclusions contradict the long-held notions of separating affect, cognition
and behavior—e.g., as indicated in Bloom, et al.’s well-known Taxonomy of Educational
Objectives (cf. Krathwohl 2002): cognitive, affective and psycho-motor domains.1
Greenspan argues that this Western tradition, based on how ancient Greeks characterized
mind, has literally blinded us to the central role of affect in organizing our experience:
if … information is dual-coded according to its affective and sensory qualities, then
we have a structure or circuitry set up in our minds that enables us to retrieve it
readily …. Affects enable us to identify phenomena and objects and to comprehend
1 Krathwohl (2002) explained that a taxonomy of educational objectives was never produced for thepsycho-motor domain. Perhaps this is a telling point. As Maccia (1987), Frick (1997), Greenspan andBenderly (1997) and Estep (2003; 2006) have argued, the mind-body distinction is fallacious (i.e., cognitivevs. psycho-motor vs. affective). For example, try driving an automobile on a highway without beingcognitively aware of one’s surroundings and making adjustments accordingly. Failing to be immediatelyaware will threaten one’s prospects for survival. This is not a rote motor skill. Driving an automobile is anexample of know how.
Improving course evaluations to improve instruction 131
123

their function and meaning. Over time, they allow us to form abstract notions of
interrelations…. Affect, behavior and thought must be seen as inextricable compo-
nents of intelligence. For action or thought to have meaning, it must be guided by
intent or desire (i.e., affect). Without affect, both behavior and symbols have no
meaning. (Greenspan and Benderly 1997, pp. 30–37)
Research from neuroscience and clinical experience that supports Estep’s Theory ofImmediate Awareness and Greenspan’s conclusions leaves little doubt as to the vital
importance of authentic experience—i.e., through unmediated sensory interaction with the
real world—in human learning and growth of the human mind. These findings are con-
sistent with Merrill’s principles for engaging students in solving real-world problems and
performing authentic tasks (Principle 1) and with integration of what is learned into
student’s own lives (Principle 5). Similarly, van Merrienboer and Kirschner (2007) have
come to the same conclusion in their 4C/ID Model. They likewise discuss the arrangement
of real-world or authentic tasks as being central to the learning process. They recommend
grouping whole tasks into classes, where those task classes are arranged from simple to
complex in terms of what is required for successful performance. Within each task class,
there is not only repetition but also variation of tasks. As whole tasks are repeated with
variation within each task class, teacher scaffolding of student performance (e.g., assis-
tance, feedback, coaching) is gradually withdrawn until learners can successfully perform
whole tasks in that task class on their own. Then this cycle is repeated for the next more-
complex, whole-task class. Learner task performance is supported by information about
non-recurrent aspects of those tasks, by just-in-time information about recurrent aspects of
those tasks, and by part-task practice as needed for developing automaticity (smoothness of
performance).
In stark contrast to this structured series of authentic tasks, when students go to school
in the U.S., they find a curriculum that is mostly devoid of real-world, authentic tasks.
This is well documented, for example, by a survey of 81,499 students in 110 high schools
across 26 states in 2006, where researchers found that two out of three students reported
that they were bored in class every day (Yazzie-Mintz 2007). When asked why they were
bored, the top reasons were that learning materials were uninteresting, irrelevant and not
challenging enough. Yazzie-Mintz (2007, p. 10) cited one student who stated, ‘‘Our
school needs to be more challenging. Students fall asleep because the classes aren’t really
that interesting.’’ Another said, ‘‘School is easy. But too boring. Harder work or more is
not the answer though. More interesting work would be nice.’’ Furthermore, those stu-
dents who consider dropping out of school indicate that the main reasons are dislike of
their school and teachers, and that they do not ‘‘see the value in the work they are asked
to do’’ (p. 5).
When high school students were asked, ‘‘Why go to school?’’ nearly 70% of them said,
‘‘Because I want to get a degree and go to college’’ (Yazzie-Mintz 2007, p. 4). Unfortu-
nately, the learning environment at large universities for undergraduates has become an
atmosphere of ‘‘beer and circus,’’ according to Sperber (2001). In lieu of engaging in
serious academic subjects, students spend disproportionate amounts of their time social-
izing and drinking at parties and watching sporting events. To find out how well college
students are learning, Baer et al. (2006) assessed literacy skills of 1,827 students who were
nearing completion of their degrees at 80 randomly selected 2 and 4 year public univer-
sities and colleges. They used the same standardized assessment instrument as that in the
National Assessment of Adult Literacy. The literacy assessments were supervised by a test
administrator on each campus.
132 T. W. Frick et al.
123

The Baer et al. report provides some sobering findings. They reported percentages of
students from 2-year vs. 4-year institutions, respectively, who were proficient in prose
literacy as 23 and 38%, in document literacy as 23 and 40%, and in quantitative literacy as
18 and 34%. This means that more than 75% of students at 2-year institutions performed
lower than proficiency level, and more than 50% at 4-year institutions likewise scored
lower. For example, these students could not ‘‘perform complex literacy tasks, such as
comparing credit card offers with different interest rates or summarizing the arguments of
newspaper editorials’’ (American Institutes for Research 2006, n.p.). Even worse,
… approximately 30 percent of students in 2-year institutions and nearly 20 percent
of students in 4-year institutions have only Basic quantitative literacy. Basic skills
are those necessary to compare ticket prices or calculate the cost of a sandwich and a
salad from a menu. (American Institutes for Research 2006, n.p., italics added to
emphasize findings on basic quantitative skills as contrasted with more advanced
skills such as comparing credit card offers)
Kuh et al. (2007) have conducted studies of how college students are spending relatively
small proportions of their time engaged in academic work; and it is therefore not surprising
that many students are leaving U.S. colleges poorly prepared in basic literacy skills, as
documented by Baer et al. (2006).
It has been repeatedly demonstrated empirically that successful student engagement in
academic tasks is strongly associated with their academic achievement—Academic
Learning Time (ALT) predicts student achievement. Rangel and Berliner (2007) define
ALT as ‘‘…the amount of time that students spend on rigorous tasks at the appropriate
level of difficulty for them’’ when those students are ‘‘… engaged in tasks relevant to
curriculum expectations and assessments’’ (p. 1). That is, those tasks need to be in a
student’s zone of proximal development (Vygotsky 1978), which means that the tasks
cannot be done by a student alone but can with assistance or guidance, and that those tasks
are sequenced to lead towards curriculum goals, not just repeatedly doing the same tasks
successfully. Numerous studies have found significant positive correlations between ALT
and student achievement (cf. Berliner 1990; Brown and Saks 1986; Kuh et al. 2007).
As a final note, the authors of the present study found that students in university classes
were less consistent in their ratings of occurrence of authentic problems in their courses,
when compared with other rating scales, such as their perceived academic learning time,
satisfaction, and learning progress. In an earlier study (Frick, et al. 2008a), those
researchers found that faculty in their school were also confused about the nature of real-world problems. Due to the prevalence of this confusion, those researchers changed their
terminology to refer to these as authentic problems, which was further defined on the
TALQ instrument itself. One implication of these findings is that students and faculty have
become so accustomed to dealing with curriculum that is largely devoid of authentic tasks,
that they do not understand what such tasks are or could be. This would be analogous to
asking natives of Central America about snow, something that most have never directly
experienced—i.e., they have had no immediate awareness of snow.
Of course, faculty and students are aware of what authentic tasks are, even if they are
unfamiliar with this nomenclature, because they routinely perform authentic tasks outside
of school. The distinction between what happens in school and the so-called ‘‘real world’’
is often made by students and faculty. Data in this study are consistent with this contention.
For example, students were highly consistent in their rating of authentic problems in the
advanced nursing class who participated in this study (where students worked with actual
patients). Students were less consistent in their agreement about authentic problems when
Improving course evaluations to improve instruction 133
123

rating an intermediate-level course on medieval civilization or an introductory course on
computer programming.
Conclusion
Although Merrill et al. (2008) stated that the real value of the First Principles is in the
design of instruction, they also argued that ‘‘learning from a given program will be
facilitated in direct proportion to its implementation of these principles’’ (p. 175). Indeed,
this was born out in our study. While academic learning time (ALT) is under the control of
the student, use of the First Principles of Instruction in a classroom is something that
college instructors can control. Data from this study indicate that when both ALT and First
Principles were reported to occur, the likelihood of a high level of student mastery of
course objectives (according to instructor evaluation of student performance) is about
5 times greater than the likelihood of high mastery when neither First Principles nor ALT
were reported to occur. Possibly even more important is that students were about 26 times
less likely to be rated as low masters of course objectives by their instructors under these
conditions (when students agreed that both First Principles and ALT occurred).
Courses and instructors did differ with respect to student ratings of instructor use of
First Principles. In courses where students were more likely to agree that their instructors
used First Principles of Instruction, students in those courses were also more likely to agree
that they experienced ALT; and their instructors were more likely to independently rate
those students who reported they experienced ALT as high masters of course objectives.
Additionally, a factor analysis of scales on First Principles of Instruction, overall course
quality and student satisfaction resulted in a single factor that could be termed instructionalquality, which is another way of indicating the high degree of the interrelationships among
these scales. One might conclude that if these scales are so highly associated, why bother to
measure use of First Principles of Instruction, when past research has shown that global
indicators of overall course and instructor quality are correlated with student learning
achievement (cf. Cohen 1981; Kulik 2001)? On a typical course evaluation, low scores on
global items or low scores on student satisfaction do not tell instructors anything abouthow to improve their teaching in ways that are likely to also improve student mastery ofcourse objectives. On the other hand, the TALQ scales on the First Principles of Instruction
can be used to identify areas in which teaching and course design can be improved. Future
studies could address the use of TALQ scales as feedback to course instructors. In rede-
signed courses where instructors receive higher ratings according to TALQ scales, student
achievement would be expected to be greater. This is an empirical question for future
research. Positive results would give universities a documented way to improve instruction
and student achievement.
In summary, the findings from the present study are consistent with the 4C/ID model for
instructional design (van Merrienboer and Kirschner 2007), the Theory of ImmediateAwareness (Estep 2003; 2006), and the importance of academic learning time (Kuh et al.2007; Rangel and Berliner 2007). It is further apparent that many students find much of
what they are expected to learn in high school and college to be irrelevant and not
meaningful (cf. Yazzie-Mintz 2007; Sperber 2001; Kuh et al. 2007). It is therefore not
surprising that many students are not motivated to learn and are consequently not engaged
in course-related tasks as much as they could be. It is further alarming that the large
majority of these students are leaving college who lack proficiency in prose literacy,
document literacy and quantitative literacy (Baer et al. 2006).
134 T. W. Frick et al.
123

The implications for changing our curriculum from topic-based strategies to task-based
strategies are clear (cf. Merrill et al. 2008). It appears to be vitally important to provide
more opportunities for students to become engaged in authentic tasks and in solving real-
world problems. Incorporating TALQ scales in course evaluations would enable univer-
sities and colleges to focus their assessments on factors that influence student success.
References
American Institutes for Research. (2006, January 19). New study of the literacy of college students findssome are graduating with only basic skills. Retrieved January 20, 2007, from http://www.air.org/news/documents/Release200601pew.htm.
Baer, J., Cook, A., & Baldi, S. (2006, January). The literacy of America’s college students. AmericanInstitutes for Research. Retrieved January 20, 2007, from http://www.air.org/news/documents/The%20Literacy%20of%20Americas%20College%20Students_final%20report.pdf.
Berliner, D. (1990). What’s all the fuss about instructional time? In M. Ben-Peretz & R. Bromme (Eds.), Thenature of time in schools: Theoretical concepts, practitioner perceptions. New York: Teachers CollegePress.
Brown, B., & Saks, D. (1986). Measuring the effects of instructional time on student learning: Evidencefrom the beginning teacher evaluation study. American Journal of Education, 94(4), 480–500.doi:10.1086/443863.
Cohen, P. (1981). Student ratings of instruction and student achievement. A meta-analysis of multisectionvalidity studies. Review of Educational Research, 51(3), 281–309.
Estep, M. (2003). A theory of immediate awareness: Self-organization and adaptation in natural intelli-gence. Boston: Kluwer Academic Publishers.
Estep, M. (2006). Self-organizing natural intelligence: Issues of knowing, meaning and complexity.Dordrecht, The Netherlands: Springer.
Feldman, K. A. (1989). The association between student ratings of specific instructional dimensions andstudent achievement: Refining and extending the synthesis of data from multisection validity studies.Research in Higher Education, 30, 583–645. doi:10.1007/BF00992392.
Fisher, C., Filby, N., Marliave, R., Cohen, L., Dishaw, M., Moore, J., et al. (1978). Teaching behaviors:Academic learning time and student achievement: Final report of phase III-B, beginning teacherevaluation study. San Francisco: Far West Laboratory for Educational Research and Development.
Frick, T. (1990). Analysis of patterns in time (APT): A method of recording and quantifying temporalrelations in education. American Educational Research Journal, 27(1), 180–204.
Frick, T. (1997). Artificial tutoring systems: What computers can and can’t know. Journal of EducationalComputing Research, 16(2), 107–124. doi:10.2190/4CWM-6JF2-T2DN-QG8L.
Frick, T. W., Chadha, R., Watson, C., Wang, Y., & Green, P. (2008a). College student perceptions ofteaching and learning quality. Educational Technology Research and Development (in press).
Frick, T. W., Chadha, R., Watson, C., Wang, Y., & Green, P. (2008b). Theory-based course evaluation:Implications for improving student success in postsecondary education. Paper presented at theAmerican Educational Research Association conference, New York.
Greenspan, S., & Benderly, B. (1997). The growth of the mind and the endangered origins of intelligence.Reading, MA: Addison-Wesley.
Keller, J. M. (1987). The systematic process of motivational design. Performance & Instruction, 26(9), 1–8.doi:10.1002/pfi.4160260902.
Kirkpatrick, D. (1994). Evaluating training programs: The four levels. San Francisco, CA: Berrett-Koehler.Krathwohl, D. R. (2002). A revision of Bloom’s taxonomy: An overview. Theory into Practice, 41(4), 212–
218. doi:10.1207/s15430421tip4104_2.Kuh, G., Kinzie, J., Buckley, J., Bridges, B., & Hayek, J. (2007). Piecing together the student success
puzzle: Research, propositions, and recommendations. ASHE Higher Education Report, 32(5). SanFrancisco: Jossey-Bass.
Kulik, J. A. (2001). Student ratings: Validity, utility and controversy. New Directions for InstitutionalResearch, 109, 9–25. doi:10.1002/ir.1.
Maccia, G. S. (1987). Genetic epistemology of intelligent natural systems. Systems Research, 4(1), 213–281.Merrill, M. D. (2002). First principles of instruction. Educational Technology Research and Development,
50(3), 43–59. doi:10.1007/BF02505024.
Improving course evaluations to improve instruction 135
123

Merrill, M. D. (2008). What makes e3 (effective, efficient, engaging) instruction? Keynote address at theAECT Research Symposium, Bloomington, IN.
Merrill, M. D., Barclay, M., & van Schaak, A. (2008). Prescriptive principles for instructional design. InJ. M. Spector, M. D. Merrill, J. van Merrienboer, & M. F. Driscoll (Eds.), Handbook of research oneducational communications and technology (3rd ed., pp. 173–184). New York: Lawrence ErlbaumAssociates.
Rangel, E., & Berliner, D. (2007). Essential information for education policy: Time to learn. ResearchPoints: American Educational Research Association, 5(2), 1–4.
Sperber, M. (2001). Beer and circus: How big-time college sports is crippling undergraduate education.New York: Henry Holt & Co.
Tabachnick, B. G., & Fidell, L. S. (2001). Using multivariate statistics (4th ed.). Boston, MA: Allyn andBacon.
van Merrienboer, J. J. G., Clark, R. E., & de Croock, M. B. M. (2002). Blueprints for complex learning: The4C/ID model. Educational Technology Research and Development, 50(2), 39–64. doi:10.1007/BF02504993.
van Merrienboer, J. J. G., & Kirschner, P. A. (2007). Ten steps to complex learning: A systematic approachto four-component instructional design. Hillsdale, NJ: Lawrence Erlbaum Associates.
Vygotsky, L. S. (1978). Mind in society: The development of higher psychological processes. Cambridge,MA: Harvard University Press.
Yazzie-Mintz, E. (2007). Voices of students on engagement: A report on the 2006 high school survey ofstudent engagement. Retrieved January 8, 2008, from http://ceep.indiana.edu/hssse/pdf/HSSSE_2006_Report.pdf.
Theodore W. Frick is an Associate Professor in the Department of Instructional Systems Technology,School of Education, Indiana University Bloomington. His current research interests include improvementof teaching and learning, simulations and games for understanding educational systems, and predictingpatterns in educational systems.
Rajat Chadha is nearing completion of his Ph.D. at Indiana University Bloomington. His areas of spe-cialization include instructional systems technology, educational measurement, and statistics in educationalresearch. He plans to conduct research and teach in India in higher education.
Carol Watson is the Chief Operations Officer and Online Course Development Manager at the EppleyInstitute for Parks and Public Lands at Indiana University Bloomington. She manages the staff and overseesthe writing and production of all online courses. Her interests are in distance learning and course evaluation.
Emilija Zlatkovska is a Ph.D. candidate in the School of Education, Indiana University Bloomington. Herareas of specialization are incorporating technology in language education and instructional systems tech-nology. She plans to teach and conduct research in Macedonia in higher education.
136 T. W. Frick et al.
123