improvement toolkit - baylorhealth.edu improvement toolkit... · improvement toolkit m i s s i o...
TRANSCRIPT
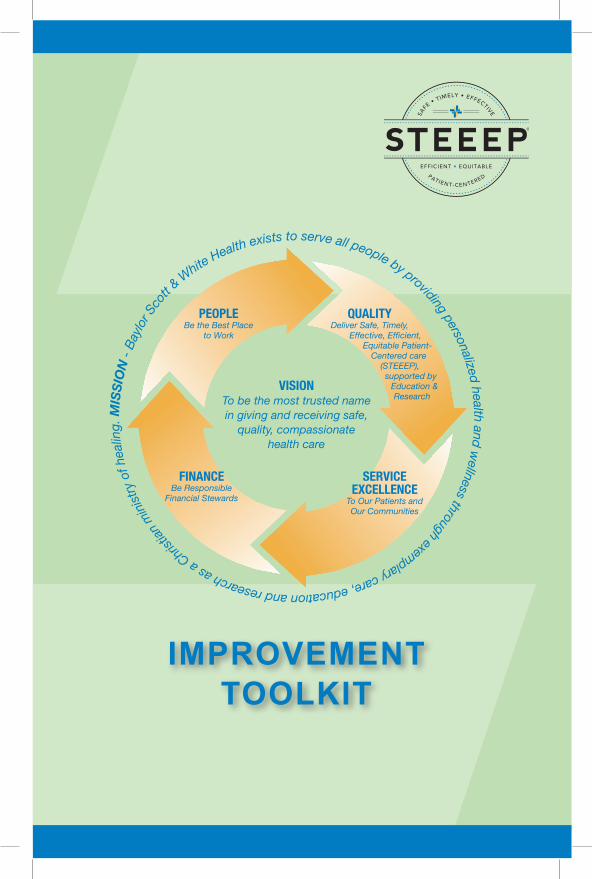
Improvement toolkIt
MISSION
- B
aylo
r Sco
tt & W
hite Health exists to serve all people by providing personalized healt h and wellness through exemplary care, education and research as a
Chr
istian
min
istr
y of
hea
ling.
VISIONTo be the most trusted namein giving and receiving safe,
quality, compassionate health care
PEOPLEBe the Best Place
to Work
FINANCEBe Responsible
Financial Stewards
SERVICE EXCELLENCE
To Our Patients and Our Communities
QUALITYDeliver Safe, Timely,
Effective, Efficient, Equitable Patient-
Centered care (STEEEP),
supported by Education &
Research

Improvement toolkIt
philosophy of Improvement • STEEEPTM
• Framework for Improvement
Introduction to Improvement• Basic Principles• Model of Large Scale Change
model for Improvement• Problem Statement
• Aim • SMART • Team • Membership • Accountability
• Process Modeling
• Identifying Metrics
• Prioritization of Improvement Targets
• Implementation and Data Collection
• Data Analysis • Tips for Creating Useful Graphs
• Sustainability • Spread of Successes and Celebrate Metric
Bill Aston Quality Improvement Summit
Glossary of terms
resources
Improvement toolkIt
Contents of toolkit
1

MissionBaylor Scott & White Health exists to serve all people by providing
personalized health and wellness through exemplary care, education and research as a Christian ministry of healing.
VisionTo be the most trusted name in giving and receiving safe,
quality, compassionate health care.
2
Baylor Scott & White Health is committed to maintaining its status as a preeminent health care provider. Key to this success is the commitment to an error free environment marked by continual improvement. The achievement of this primary goal and purpose is to function within the framework STEEEP® and the rapid cycle Model for Improvement.
The following key characteristics address the organization’s response to customer needs and expectations, and are based on doing the right thing and doing it well. At all levels of the organization, individuals are empowered to make decisions and provide care that is Safe, Timely, Effective, Efficient, Equitable and Patientcentered (STEEEP®).
• Safe Care – avoids injuries to patients from care that is intended to help them.• Timely Care – reduces waits and delays for both those who receive care and those who give care.• Effective Care – based on scientific knowledge, extended to all likely to benefit, while avoiding underuse and overuse. • Efficient Care – avoids waste, including waste of equipment, supplies, ideas and energy.• Equitable Care – provides consistent quality, without regard to personal characteristics such as gender, ethnicity, geographic location and socioeconomic status. • Patient-centered Care – respects and responds to individual patient preferences, needs, and values, ensuring that patient values guide all clinical decisions.
Baylor Scott & White has identified a process to assist in achieving its vision, as noted below. This process is hallmarked by strong leadership, participative management, teamwork, and is supported by values of Integrity, Servanthood, Teamwork, Excellence, Innovation and Stewardship. The improvement process is aligned and cascaded with the Baylor Circle of Care goals. The categories that comprise the Circle of Care are: People, Quality, Service and Finance.
philosophy of Improvement

1. Increase Urgency: Establish a sense of urgency so that people say “let’s go,” making a change effort well positioned for launch.
2. Build the Guiding team: Form a powerful group that has the capability – in membership and method of operating – to guide a very difficult change process.
3. Get the vision right: Create the right vision and strategies to guide action in all of the remaining stages of change.
4. Communicate for Buy-in: Communicate the vision and strate- gies effectively so as to create both understanding and a gut-level buy-in.
5. empower Action: Empower others to act on the vision and deal effec- tively with obstacles that block action, especially lack of information, the wrong performance measurement
and reward systems and lack of self- confidence.
6. Create Short-term Wins: Produce sufficient short-term wins, sufficiently fast, to energize the change helpers, enlighten the pessimists, defuse the cynics and build momentum.
7. Don’t let Up: Continue with wave after wave of change, not stopping until the vision is a reality, despite seemingly intractable problems.
8. make Change Stick: Ensure changes are embedded in the very culture of the enterprise so that the new way of operating will stick.
Introduction to Improvement
There are four basic principles when pursuing continuous or rapid cycle improvements:
1. Develop a strong customer focus (VOC-Voice of the Customer). There is success when the customer’s needs and expectations have been met. 2. Continually improve all processes. 3. Involve employees (people support what they help to create). 4. Mobilize both data and team knowledge to improve decision making.
3
kotter’s eight-Step model of large Scale Change
(Kotter, 2002)
• Aim (SMART)
• Team
• Process Modeling
• Prioritization of Improvement Targets, Metric Selection
• PLAN: Intervention Design
• DO: Implementation and Data Collection
• CHECK: Data Analysis and Lessons Learned
• ACT: Refining Intervention (repeat the PDCA cycle as needed)
• Spread of Successes – Celebrate
4
Refining Intervention
Data Analysis
Intervention Design
Implementation & Data Collection
Spread Success — Celebrate!
Aim
Team
Process Modeling
Prioritization of Improvement Target & Metrics
AC
T
PLAN
DO
CHECK
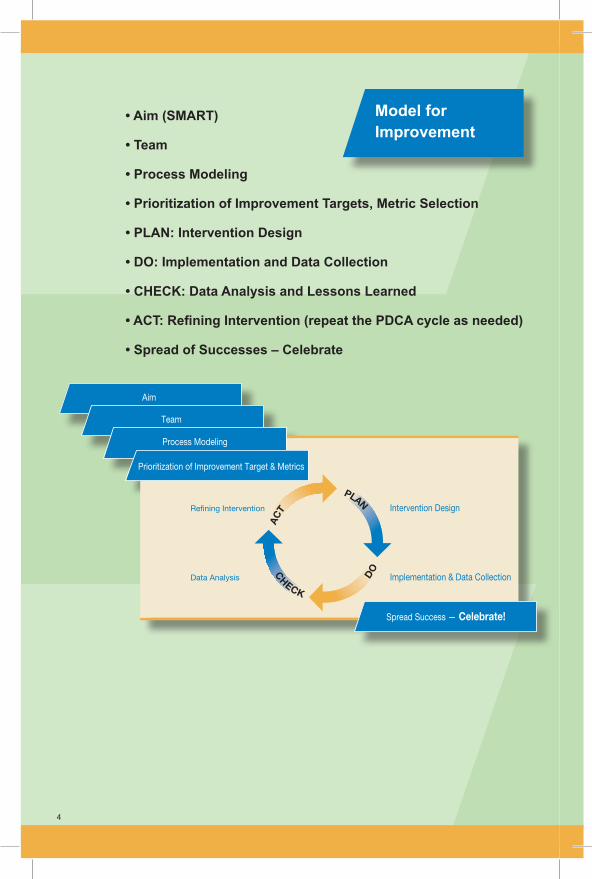
model forImprovement

• Aim (SMART)
• Team
• Process Modeling
• Prioritization of Improvement Targets, Metric Selection
• PLAN: Intervention Design
• DO: Implementation and Data Collection
• CHECK: Data Analysis and Lessons Learned
• ACT: Refining Intervention (repeat the PDCA cycle as needed)
• Spread of Successes – Celebrate
Refining Intervention
Data Analysis
Intervention Design
Implementation & Data Collection
Spread Success — Celebrate!
Aim
Team
Process Modeling
Prioritization of Improvement Target & Metrics
AC
T
PLAN
DO
CHECK
5
Plan, Do, Check, Act (PDCA) cycle is used to test a change or group of changes on a small scale to see if they result in an improvement. planModel the process, plan the intervention, develop plan for collecting data, and make predictions about what will happen and why; develop plan to test the change. Who, what, when, where and how.
• Select the problem/process that will be addressed first (or next) and describe improvement opportunity.
• Describe current process surrounding improvement opportunity.
• Describe all possible causes of the problem and agree on the root cause(s).
• Develop an effective and workable solution and action plan.
• Predict the outcome of the change, including targets for improvement.
DoTest the proposed solution or process change and collect the data.
• Why test?
• Increase belief that change will result in improvement.
• Predict what can be expected from change. Improvement? Testing may uncover unsuccessful interventions.
• Learn how to adapt the change to conditions in local environment.
• Evaluate costs and side effects of change.
• Minimize resistance upon implementation.
• Three principles for testing a change:
• Test on small scale.
• Collect data over short timeframe.
• Build knowledge sequentially with multiple PDCA cycles for each test of change. Include a wide range of conditions in the sequence of tests.
• Document problems and unexpected outcomes.
Plan, Do, Check, Act (PDCA)

6
Check Review and evaluate the results of the change.
• Analyze the data and check or study the results.
• Compare the data (actual outcomes) to your predicted outcomes.
• Summarize and reflect on what was learned.
ActReflect and act on learning - Adopt, Adapt or Abandon
• Learn from each test.
• Determine next PDCA cycle.
• Refine the change through several cycles.
• When successful, spread the change by implementing across the organization.
• Celebrate success.
Plan, Do, Check, Act (PDCA)

7
Aim (SMART): This is a clear statement of the intended improvement work with the following aspects.
• Specific – Outcomes focused, specific target populations, short, succinct, clear
• Measurable – Define measures to quantify achievement
• Actionable – Identify general change strategy
• Realistic – But a stretch
• Time Bound – Set clear timelines
Be prepared to refocus the AIM if necessary.
AIm
A problem statement is a concise description of the issue that need to be addressed by a project team. It builds the business case for why the project should move forward.
A problem statment includes:
• A clear description of the problem
• How long the issue has occured
• The impact of the issue on our customers and the organization
Starting the project –Problem Statement

A Performance Improvement Team is a multidisciplinary group gathered to address a specific opportunity for improvement. Having the right people is critical. A maximum number of 13 individuals can be on a team. Ask yourself if you have all the right people at the table.
Membership/Roles: • Executive Sponsor• Facilitator• Team Leader• Team Members • Process Owners • Subject matter experts • Frontline staff • Customer of the process to give real feedback
Be sure to include individuals that are new to the process to give a fresh perspective. Also, identify stakeholders that may be impacted by a change in the process. Communicate with stakeholders often so they are aware of the project work and can provide input to gain buy-in for change.
Accountability: Keeping a project team on course can be a daunting task.The use of an action plan outlining who is going to do what, by when, can be a benefit and is recommended.
teAm
8

These tools bring clarity to improvement opportunities by identifying process steps, reducing or adding steps, or for identifying reasons why a process is not working as it was designed.
process map: A process map is a graphical representation of the flow of a process. It allows the team to identify the actual flow or sequence of steps or events in a process. A process map can be applied to anything from the travel of an invoice, the flow of materials or the steps in providing evidence-based care. This is the most basic tool for uncovering problems in a process.
A useful way to:
• Examine how various steps in a process relate to each other.
• To define the boundaries of the process.
• To identify customer/supplier relationships.
• To verify or form the appropriate team.
• To create common understanding of the process flow.
• To determine the current “best practice” of performing the process.
• To identify redundancy, unnecessary complexity and inefficiency in a process.
Start/Stop
Decision Step (Yes/No question being asked)
Circle with letter(Shows a break in chart continued elsewhere)
Task or activity
Arrow for direction
Process Map Symbols:
A
Example:
Get out of bed
Go back tobed
Drive towork
Takeshower
No
Yes
Getdressed
Go towork?
process modeling
9

10
process modeling
Affinity Diagram
Remain financially
Develop ability to
Develop a responsive
Develop one stop
Remove barriers Develop electronic
Develop an integrated
Establish uniform Provide expedient
Establish consistent Develop integrated
Encourage reciprocal
Limit paperwork
Provide ethical system
Develop an ethical
Establish programs
Reduce health care
Understand employers
Continuously evaluate
Brainstorming:To establish a common method for a team to creatively and efficiently generate a high volume of ideas on any topic by creating a process that is free of criticism and judgment. Used to create list of reasons or ideas why things are not working. Use sticky notes – one idea per sticky note – do not debate, all ideas are winners.
Structured: a process in which each team member gives ideas in turn.
Unstructured: a process in which team members give ideas as they come to mind.
Either method can be done silently, aloud or on sticky notes.
Affinity Diagram:To arrange the previous list in related groupings. Allows a team to summarize and naturally organize into groupings the ideas/issues creatively generated from brainstorming.1. Describe the issue under discussion.2. Brainstorm at least 20 ideas or issues.3. Without talking, sort ideas into natural groupings (5 – 10 related groups).4. For each grouping, develop a summary or header card using consensus.
Brainstorming
Develop Provide
Continuous Reduce
Limit Establish
Understand Limit
Encourage Provide Understand
Continuous Develop
Establish
Encourage
Remove

process modeling
11
Fishbone (Cause & Effect Diagram): Allows the team to identify, explore and graphically display all the possible causes related to a problem or condition to discover its root causes.
Start with following generic model to be further developed by the team:
Add “bones” with headings. Examples of headings: these can be used to prompt thoughts when the team is “stuck”.
5 P’s – people, provision, policies, procedures, place OR 5 M’s – manpower, material, machines, methods, management
Utilize the 5 whys technique to peel away the layers which helps identify root causes
• Evaluate each issue and continually ask why the issue is occuring until the root cause is identified
Problem Statement
Workload unevenlydistrbuted
Syringes wrong size
Procedures unclear
Environment
Can’t find request forms
Carts need repair
Late medications
Medications out of date
Labels difficult to read
People
Policy
Equipment
Material

12
Why Employees Call In Late for Work?
0
10.75
21.5
32.25
43
53.75
64.5
75.25
86
20%
30%
10%
0%
40%
50%
60%
70%
80%
90%
100%
AlarmFailed
30
1915
105 4 3 2 1 1
Sick
33%
54%
71%
82%
88%92%
96% 98% 99%
CarWon’tStart
ChildSick
ElectricityOut
LostKeys
Death inFamily
Icy Roads
Company RoadFlooded
NUMBERS
C A U S E S
metrics Selection:
1. Outcome Measure – Measures the results (outcome) of the process. The outcome measure is taken directly from the aim statment. (example: mortality, ventilator associated pneumonia, central line infection).
2. Process Measure – An incremental measurement that provides proof that an improvement has occurred in process; reflects the working of the system (examples: aspirin after MI, beta blocker on discharge, timely administration of antibiotic, HOB elevated while patient on ventilator, etc.).
3. Balancing Measure – Unintended consequences as we improve the outcome and process measure. They may be positive or negative. Focus on the negative as they will have the biggest impact on sustainment if those measures turn for the worse. (glycemic control that results in hypoglycemia).
A sample of what we measure for the CMS Core Measures include process and outcome measures for AMI, Heart Failure, Pneumonia and SCIP; Patient Falls, Patient Satisfaction and Medication Variances to name just a few.
Identifing Metrics

13
Possible prioritization tools when data is available:
pareto Diagram:This diagram focuses efforts on the problems that offer the greatest potential for improvement by showing their relative frequency or size in a descending bar graph.
• Pareto diagrams are used to focus within a broad category of many choices. • They are based on factual or opinion-based information. • They can combine factors that contribute to each item’s practical significance.
Impact and Frequency Matrix:A 2x2 matrix in which team members discuss each issue regarding the severity of impact the issue has on the outcome and utilizing data to identify the frequency of occurrence.
Why Employees Call In Late for Work?
0
10.75
21.5
32.25
43
53.75
64.5
75.25
86
20%
30%
10%
0%
40%
50%
60%
70%
80%
90%
100%
AlarmFailed
30
1915
105 4 3 2 1 1
Sick
33%
54%
71%
82%
88%92%
96% 98% 99%
CarWon’tStart
ChildSick
ElectricityOut
LostKeys
Death inFamily
Icy Roads
Company RoadFlooded
NUMBERS
C A U S E S
High
High
Medium
First Focus
Last Focus
Medium
Low
Low
Frequency of Occurrence
Sev
erity
Imp
act
Prioritization ofImprovement targets

14
Gap Analysis:Gap analysis, also known as a SpiderDiagram, is used to identify where gaps inservice are occurring. The group identifieswhere they are compared to where theywant to be in each area. When used in conjunction with the InterrelationshipDigraph, will result in a gross score which helps to prioritize and define breakthrough areas.
1. Placing all issues on circle similar to Interrelationship Digraph, a scale is drawn from each issue to center of circle, with 10 (Ideal) at end points and 0 at the center.
2. The group evaluates the current status of each issue independently and a number is assigned.
3. The space between the assigned number and the ideal is the “gap”.
Gap Analysis
Meet patient expectations
4
5
3
8
7
5
No medication errors
No patient falls
Reduce staff absences
Improve staff morale
Decrease staff turnover
Prioritization ofImprovement targets

15
Interrelationship Digraph
Low patient satisfaction
Out = 0 In = 5
Increased medication errors
Out = 1 In = 3
Increased patient falls
Out = 1 In = 3
High call-in rateShort staffed
Out = 2 In = 2
Low staff morale
Out = 5 In = 0
High staff turnover
Out = 4 In = 1
Possible prioritization tools when you do not have data:
Interrelationship Digraph:Use when data isn’t available. Can be used to reduce large number of issues to manageable size when it is important to identify the “root cause” of problem. Useful when groups need to develop consensus and clarity about how processes are related and where group’s efforts will have greatest impact on other issues.
1. Arrange issues in circle and compare each to all others by asking “does this cause that or does that cause this.”
2. Arrows are drawn from cause issue to effect issue. It’s possible that no arrow will be drawn in cases where there is an equal causal relationship or the two issues are unrelated.
3. Total the “in” arrows and the “out” arrows for each issue.
The issue with largest number of out arrows is usually is the issue which may cause the others to occur.
Prioritization ofImprovement targets

16
How to implement the improvement? Have we covered all the bases?
plan• What is the implementation plan? What accomplishments are expected? What are the steps? What is the timeline?
Organize• What needs to be organized to get the intervention implemented? Are roles and responsibilities defined? Do customers and suppliers know what is expected?
Communicate• What needs to be communicated and to whom? How will communication occur with everyone involved with the product, practice, process or procedure?
educate• How will your participants know what is expected? Who will train them? When? Where?
motivate• How will recognition be provided to encourage people to participate? When will it be done? How often?
measure and review• How will the success of the deployment be tracked? When will the process of the rollout (deployment) be evaluated? What milestones will be inspected?
Implementation plan

17
tally or Check Sheet:Allows team to systematically record and compile data from historical sources, or observations as they happen. This tool can be used to collect data prospectively or retrospectively. Avoid complicated and labor intensive methods.
1. Agree on definition of the events or conditions being observed.
2. Decide who will collect data; over what period of time; and from what sources.
3. Design a Check Sheet form that is clear, complete and easy to use.
4. Collect data consistently and accurately.
Use sheet as follows: (Example – Put a bar when order set is used and a circle when it is not).
Week Number Order set used Order set not used
1
2
3
Collecting Data During the Do phase

18
run Chart:This tool allows the team to study observed data for trends or patterns over a specified period of time.
1. Determine process performance measure.
2. Gather the data.
3. Create a graph with a vertical line (y axis) and a horizontal line (x axis).
4. Plot the data.
5. Interpret the chart.
Displays process variation and can be used to indicate special causes of process variation in the form of trends, shifts or other non-random patterns.
20
30
10
40
50
60
70
80
90
100
SepNov 01
DecFeb 02
MarJun
Jul Sep
OctDec
JanMar 03
AprJun
JulSep
OctDec
Jan Mar 04
Run Chart
Goal
Analyzing the Data
19
Celebrate!
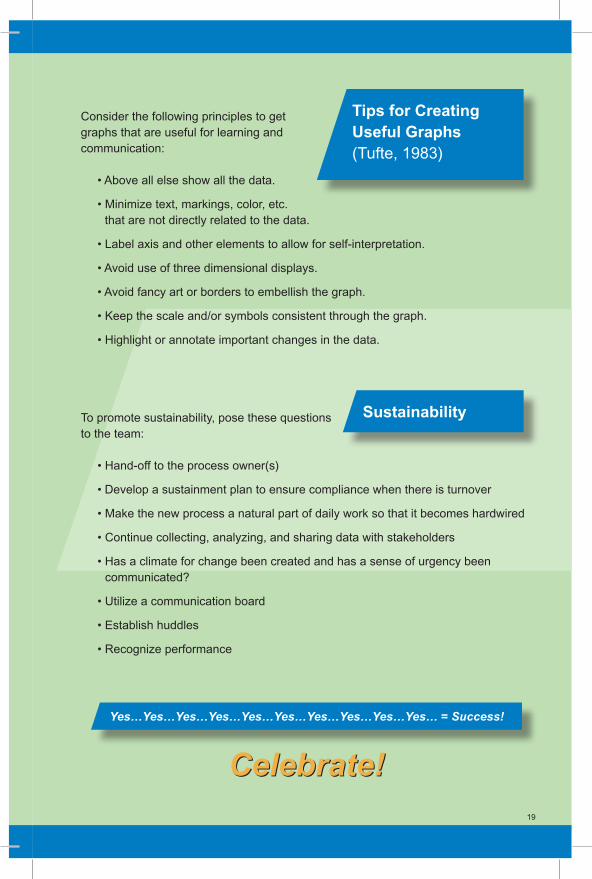
To promote sustainability, pose these questions to the team:
• Hand-off to the process owner(s)
• Develop a sustainment plan to ensure compliance when there is turnover
• Make the new process a natural part of daily work so that it becomes hardwired
• Continue collecting, analyzing, and sharing data with stakeholders
• Has a climate for change been created and has a sense of urgency been communicated?
• Utilize a communication board
• Establish huddles
• Recognize performance
Sustainability
Yes…Yes…Yes…Yes…Yes…Yes…Yes…Yes…Yes…Yes… = Success!
Celebrate!
Consider the following principles to get graphs that are useful for learning and communication:
• Above all else show all the data.
• Minimize text, markings, color, etc. that are not directly related to the data.
• Label axis and other elements to allow for self-interpretation.
• Avoid use of three dimensional displays.
• Avoid fancy art or borders to embellish the graph.
• Keep the scale and/or symbols consistent through the graph.
• Highlight or annotate important changes in the data.
tips for CreatingUseful Graphs(Tufte, 1983)

20
This award will recognize a hospital or entity nominated multi-disciplinary team that best demonstrates a sustainable improvement in a process or outcome that aligns with and supports the System’s goals. The award nominations are open to any existing improvement team currently working or one that has advanced a project to long-term sustainability. Other teams with any history or interest may also apply.
• Team must be nominated by a hospital or entity president. Each president may nominate one team for each category: People, Service, Quality and Finance.
• Team must be multidisciplinary (4-13 members maximum) with employees on the team (non-Baylor employees may be members of the team and are eligible for awards and recognition). Director or above, coaches (with coach or health care improvement in their job description), HCIDs, judges or physicians are not eligible to receive cash prizes, but are encouraged to form and participate on teams.
• Rapid cycle improvement methodology is utilized.
• Demonstrates sustainable improvement that can be spread and aligns with the System’s goals.
• The first, second and third place winning teams may not resubmit their projects in future years.
Bill Aston QualityImprovement Award

21
Action plan – Specific method or process to achieve the results called for by one or more objectives. Includes objective to be completed, by who and when it will be completed.
Affinity diagram – Management tool used to organize information, usually gathered during a brainstorming activity.
Analysis – Examination of facts and data that provides the basis to identify gaps between actual and desired performance.
Brainstorming – Technique that teams use to generate ideas on a particular subject.
Cause – Identified reason for the presence of a defect or problem.
Culture – System of values, beliefs, and behaviors inherent in an organization.
Customer – Someone for whom work or a service is performed.
Data Collection – Gatherings facts on how a process or system works and how a process is working. All data collection is driven by knowledge of the process and guided by reliable methods.
Defect – Product or service’s nonfulfillment of an intended requirement or reasonable expectation for use, including safety considerations.
Effect – What results after an action has been taken (also called an outcome).
Executive Sponsor – Person in a Leadership position in the System that will actively support the project by providing resources and removing barriers.
Facilitator – Specifically trained person who functions as a teacher, coach, and moderator for a group or team.
Failure Mode and Effects Analysis (FMEA) – A tool used to proactively analyze each process step prior to implementation of a new process, determine how that step might fail, and implement solutions to address those potential failures.
Fishbone diagram – A graphical tool used to display the causes of issues within a process that impact the problem (also called a cause and effect diagram).
Five whys – Technique for discovering the root causes of a problem and showing the relationship of causes by repeatedly asking the question, “Why?”.
Flowchart – Graphical representation of the steps in a process. Assists in examining how various steps in a process relate to each other and create a common understanding of the process.
Glossary of terms

22
Gap analysis – Comparison of a current condition to the desired state.
Gemba Walk – Walking the workplace to observe and learn processes firsthand.
Inter-relationship digraph – Management tool that depicts the relationship among issues based on impact.
Kaizen – Japanese term that means gradual unending improvement by doing little things better and setting and achieving increasingly higher standards.
Lean Thinking – Reducing cycle time and eliminating waste from processes to improve efficiency.
Measure – Criteria, metric, or means to which a comparison is made.
Multivoting – Group decision-making tool that enables a group to sort through a long list of ideas to identify priorities.
Performance improvement – Primary result of efforts to improve a situation or process that may be increased output, higher quality, or improved individual learning skills and performance.
Plan-do-check-act (PDCA) cycle – Four-step process for quality improvement. In the first step (plan), a plan to effect improvement is developed. In the second step (do), the plan is carried out, preferably on a small scale. In the third step (check), the effects of the plan are observed. In the last step (act), the results are studied to determine what was learned and what can be predicted.
Pareto chart – Graphical tool for ranking causes from most significant to least significant. It suggests most effects come from relatively few causes; that is, 80% of the effects come from 20% of the possible causes.
Process owner – Person who coordinates the various functions and work activities at all levels of a process, has the authority or ability to make changes in the process as required, and manages the entire process cycle to ensure performance effectiveness. This person is responsible for sustainment after the project goal is met.
Project – Short-term efforts extended to accomplish a goal, usually defined with a start and end date to show duration and completion.
Project Charter – A document that clarifies expectations and helps focus the team by providing the project’s scope, purpose, and goals.
Process – A series of linked steps designed to produce a result.

23
Root cause – The fundamental, underlying driver of an issue that leads to a problem.
Run chart – A graphical display showing a line connecting numerous data points collected from a process running over a period of time. Used to show variation in a process over time.
Scope – Resources, processes, services or customers included to establish boundaries for the project.
Six Sigma – Methodology to improve the capability of processes. This increase in performance and decrease in process variation lead to defect reduction and improvement in quality of product or service.
Stakeholder – Any individual, group, or organization that will be impacted by a change in the process.
Sustainment – To keep up or keep going, as an action or a process. Ensuring that the process and outcome do not revert back to the way they were.
Team Members – Group of individuals organized to work together to accomplish the project goal by identifying root causes, developing solutions, and implementing those solutions. Team members include but are not limited to frontline staff, subject matter experts, and customers.
Team Leader – Person assigned to lead a project; duties include planning, scheduling, and controlling the project through completion.
Value – The customer’s perceived worth of a product or service, process, asset, or function relative to possible alternatives and the cost of each.
• Value added – any activity that positively changes the form, fit, or function of materials, information or services to meet customer requirements
• Non- value added – activities that are detrimental to the customer or do not meet a requirement from the customer’s point of view
• Non- value added but required – activities that add no value to the product/ service from the customer’s point of view but are ‘essential’ from a business perspective to complete of the process (i.e. regulations)
Waste – Any activity that consumes resources but creates no value for the customer. These include rework, motion, waiting, inventory, overproduction, transportation, overprocessing, and people.

24
resources
Committee on Quality of Health Care in America, Crossing the Quality Chasm:
A New Health System for the 21st Century, Institute of Medicine report 2001.
Kotter, John P. and Cohen, Dan S. The Heart of Change. Boston: Harvard Business
School Press. 2002.
Tufte, E.G. The Visual Display of Quantitative Information. Cheshire, Connecticut USA:
Graphics Press. 1983.
Improvement toolkIt

Improvement toolkIt

BHCS 04-2014 SD