improvement science in action (isia) -...
TRANSCRIPT

Improvement Science In Action (ISIA)
Alaska Tribal Health System
April 2017
Rebecca Steinfield
Christina Southey
Introductions

IHI FacultyRebecca Steinfield
Rebecca Steinfield, MA, has been with IHI since
1996. She currently serves as Director of IHI’s Improvement Advisor Professional Development
Program, teaches IHI courses on improvement methods, and mentors “improvers-in-training.”
Rebecca sits on IHI’s Improvement Capability
Focus Area. Past IHI work includes serving as an
Improvement Advisor on IHI’s programming for reducing unnecessary rehospitalizations and
primary care transformation in academic settings.
She is also mother to two teenagers: Jacob, 19, and Susie, 17.
3

IHI Faculty
Christina Southey
Christina Southey, MSc is an Improvement Advisor with IHI and independent consultant. She has supported projects in the primary and community care realm as well as the design and implementation of BTS collaboratives. For the past three years at she has been the provincial collaborative coach in the Child and Youth Mental Health and Substance Use Collaborative in BC, Canada. Christina has also applied her quality improvement expertise in multiple small and large group education session. Christina holds a master’s degree in Community Health and Epidemiology and lives with her family in Toronto, Ontario Canada.

5
Time Day 1 (April 4) Time Day 2 (April 5) Time Day 3 (April 6)
7:15-8:00 Breakfast and Registration 7:15-8:00 Breakfast 7:15-8:00 Breakfast
Intro, Welcome, OverviewWelcome discussion and review
of dayOpener and review questions
Setting the context:
- Your Quality Problems The Third Question (What
changes can we make that will
result in improvement?)
Tools for Looking at Data Over
TimeIntro to Systems Thinking:
the Coin Game
15 min Break 15 min Break 15 min Break
Theory of Profound Knowledge
The Third Question (What
changes can we make that will
result in improvement?)
Other Useful Data Tools
Introduction to the Model for
Improvement Develop or refine change ideas
for your project
Visual Display of Data
6 Essential Skills for ImprovementLinking measurement to
improvement
11:30-12:30 Lunch 11:30-12:30 Lunch 12:00 - 1:00 Lunch
The First Question (What are we
trying to accomplish?)Driver Diagrams
Accelerating ImprovementDraft or refine aims for project Testing Changes
The Second Question (How will we
know a change is an improvement?)
Planning your first PDSA cycles for
your project
15 min Break 15 min Break
Project PlanningDraft or refine measures for your
projectThe 6th skill: Working with People
Clarification of Next Day and
Homework Assignments
Adjourn by
3:15
Clarification Upcoming Calls and
Assignments
Clarification of Next Day and
Homework Assignments
4:30-5:30Optional Office Hours
(Consultations)4:30-5:30
Optional Office Hours
(Consultations)
Agenda-at-a-Glance

Develop a Group Resume6
BackgroundAll our work is a process that involves teams of one sort or another.
Can you think of any activity in the healthcare field, for example, that
can be completed by only one person with no direct or indirect
involvement of other individuals? It is very difficult to come up with a
healthcare related activity that does not involve more than one person.
Successful improvement work requires teams. No one individual is
smart enough to know all facets of an issue, a problem or how to make
the process be more efficient and effective.
Each member of a team has a unique array of talents, skills, and
experiences to offer the group. When working in teams, however, it is
important to understand what each person brings to the group. By
getting to know your fellow team members early in this program, you
will be better able to leverage each of your individual talents, skills, and
experiences as you proceed through the workshop.

Develop a Group Resume7
Purpose of this Exercise
The purpose of this exercise is to provide you with an opportunity to
familiarize yourselves with the other participants at your table and gain an
understanding of the many talents, skills, and experiences each of you
can bring to the group.
Activity Duration
Your team will have ~15 minutes to create your team resume. You will
then be given 2 minutes to present it to the rest of the class.
Guidance
Organize your resume to “sell” your team. Be creative, clever and
imagine that you are making a pitch to have your table hired as a
consulting team.

Develop a Group Resume8
Group Resume Directions
� Select a team recorder who will present the group resume to the entire class
� Use a flipchart page to prepare your summary
� Your team resume should include, but is not limited to, the following:
� Team Name (This should be something that uniquely identifies your team)
� Each team member/s name
� Educational background (schools attended, number of years of formal education,
number of degrees, etc.)
� Professional Skills (public speaking, writing skills, organization, listening, persuasion,
planning, building, creativity, artistic, analytical, etc.)
� Work experiences (years in healthcare, years at your current institution, etc.)
� Major Accomplishments in your particular field
� Publications and Awards
� Volunteer and Community activities
� Hobbies, hidden talents, travel, family

Introduce your table/teams

Improvement Science In Action (ISIA)
The ISIA helps health care organizations and individuals develop the skills and resources needed to carry out and sustain successful improvement projects
10

Overview of ISIA
This course is designed to help you:
– Plan and execute improvement projects using systems principles
– Describe the organizational and human dimensions of change and use this understanding to plan and execute improvement projects
– Define and apply a set of measures to analyze and assess the progress of an improvement project
– Utilize the Model for Improvement to develop tests, decide when to implement changes and to successfully spread and sustain improvements
– Make appropriate management decisions based on an understanding of the variation in your data
11

PreworkWorkshop
9/29-10/1
Webex 1
10/14
Webex 2
11/2AP-1 AP-2
Webex 3
11/30AP-3
Project
PlanningReliability
Sustaining
Gains
March
Workshop April 4-6
Call #3
July
Call #1
May
Call #2
June
PDSA Measurement Holding the Gains
A 4-month learning path

Program Structure
Today – Review Pre-Work
April 4-6, 2017– Face-to-face session– Learn and apply the fundamentals of Improvement Science– Refine your charter and plan your project
Continuing Learning Conference Calls– Thursday, May 11 at 12pm AKST/4pm EST: initial tests of change and
measurement plans– Thursday, June 8 at 12pm AKST/4pm EST: current project data and their
analyses of and learning from process successes and failures.– Thursday, July 6 at 12pm AKST/4pm EST: current project progress and
results with a focus on continuing to pursue project aims
13

Expectations of participation
Attend all 3 days of the face-to-face workshop
Participate in all 3 follow-up WebEx sessions
Develop a charter for your project
Commit to work on the project immediately following the workshop
Willingness to share your work with the rest of the participants
14

15
Time Day 1 (April 4) Time Day 2 (April 5) Time Day 3 (April 6)
7:15-8:00 Breakfast and Registration 7:15-8:00 Breakfast 7:15-8:00 Breakfast
Intro, Welcome, OverviewWelcome discussion and review
of dayOpener and review questions
Setting the context:
- Your Quality Problems The Third Question (What
changes can we make that will
result in improvement?)
Tools for Looking at Data Over
TimeIntro to Systems Thinking:
the Coin Game
15 min Break 15 min Break 15 min Break
Theory of Profound Knowledge
The Third Question (What
changes can we make that will
result in improvement?)
Other Useful Data Tools
Introduction to the Model for
Improvement Develop or refine change ideas
for your project
Visual Display of Data
6 Essential Skills for ImprovementLinking measurement to
improvement
11:30-12:30 Lunch 11:30-12:30 Lunch 12:00 - 1:00 Lunch
The First Question (What are we
trying to accomplish?)Driver Diagrams
Accelerating ImprovementDraft or refine aims for project Testing Changes
The Second Question (How will we
know a change is an improvement?)
Planning your first PDSA cycles for
your project
15 min Break 15 min Break
Project PlanningDraft or refine measures for your
projectThe 6th skill: Working with People
Clarification of Next Day and
Homework Assignments
Adjourn by
3:15
Clarification Upcoming Calls and
Assignments
Clarification of Next Day and
Homework Assignments
4:30-5:30Optional Office Hours
(Consultations)4:30-5:30
Optional Office Hours
(Consultations)
Agenda-at-a-Glance

16
Time Day 1 (April 4)
7:15-8:00 Breakfast and Registration
Intro, Welcome, Overview
Setting the context:
- Your Quality Problems
Intro to Systems Thinking:
the Coin Game
15 min Break
Theory of Profound Knowledge
Introduction to the Model for Improvement
6 Essential Skills for Improvement
11:30-12:30 Lunch
The First Question (What are we trying to accomplish?)
Draft or refine aims for project
The Second Question (How will we know a change is an improvement?)
15 min Break
Draft or refine measures for your project
Clarification of Next Day and Homework Assignments
4:30-5:30Optional Office Hours
(Consultations)
Agenda-at-a-Glance

Evening Consultations
If you want to meet 1:1 with Christina or Rebecca at the end of the day today or tomorrow, sign up on the flip charts. We will try to make time for everyone who wants to meet so will add time slots as necessary.

Context for Improvement: The Alaska Tribal Health System

Objectives
Be able to:
Identify the quality issues at your organization
Begin to recognize the need for fundamental
change and changing systems to improve health
care delivery

How Do YOU improve?

How Do YOU improve?
Build Skills?
Increase Knowledge?
Hard work?
Build Relationships?
Attention to detail?
Write More Policies?
Design a Study?
• Work more hours?
• Pay Attention?
• More Resources?
• Hire More Staff?
• Power & Control?
• Collect Data?
• Hope & Luck?

What quality problems do you have at
your organization?
• Work with the people in your table to identify at least 3 quality problems in your organization
• Use the sticky notes on your table
• Be prepared to report out
22

The problems we identified are:23

Crossing the Quality Chasm
Health care harms patients frequently
Chasm = divide between the current health care and what health care could be like
The health care delivery system is in need for fundamental change.
How can the system be reinvented to foster innovation and improve care delivery?
– Trying harder will not work. Changing systems of care will!

QualityBetter
Old Way(Quality Assurance)
QualityBetter Worse
New Way(Quality Improvement)
Action taken on all
occurrences
Reject defectives
Defining Quality: Old Way, New Way
Source: Robert Lloyd, Ph.D.
Requirement,Specification or
Threshold
No action taken here
Worse

Juran Trilogy

Quality Models & Approaches
Across the Years
• Human Factors (Ancient Greece, early 1900s)
• International Organization for Standardization (ISO) (1926)
• Toyota Production System (1950s)
• Six Sigma (Motorola, 1980s)
• Baldrige Criteria (1987)
• European Foundation for Quality Management (EFQM) (1988)
• Model for Improvement (1996)

Langley, et al, The Improvement Guide, 2009
A Model for Learning and Change
When you combine
the 3 questions with the…
…the Model
for Improvement.
PDSA cycle, you get…

Systems of Care
P31

What is a System?
32

What’s A ‘System’?
Interdependent items, people, or processes
acting with a common purpose.1
Outcomes, defined by Stakeholders’ values.
Physical, social, and functional aspects.2
Dynamic: The ‘thing in motion’.
The system ‘is what it is.’
Improving requires understanding the dynamics
of the system
2 Maccoby, M., C. L. Norman, et al. (2013). Transforming Health Care Leadership: A systems guide to improve patient
care, decrease costs, and improve population health. San Francisco: Jossey Bass.
1 Langley, G. J., K. M. Nolan, et al. (2009). The improvement guide : a practical approach to enhancing organizational
performance. San Francisco: Jossey-Bass.
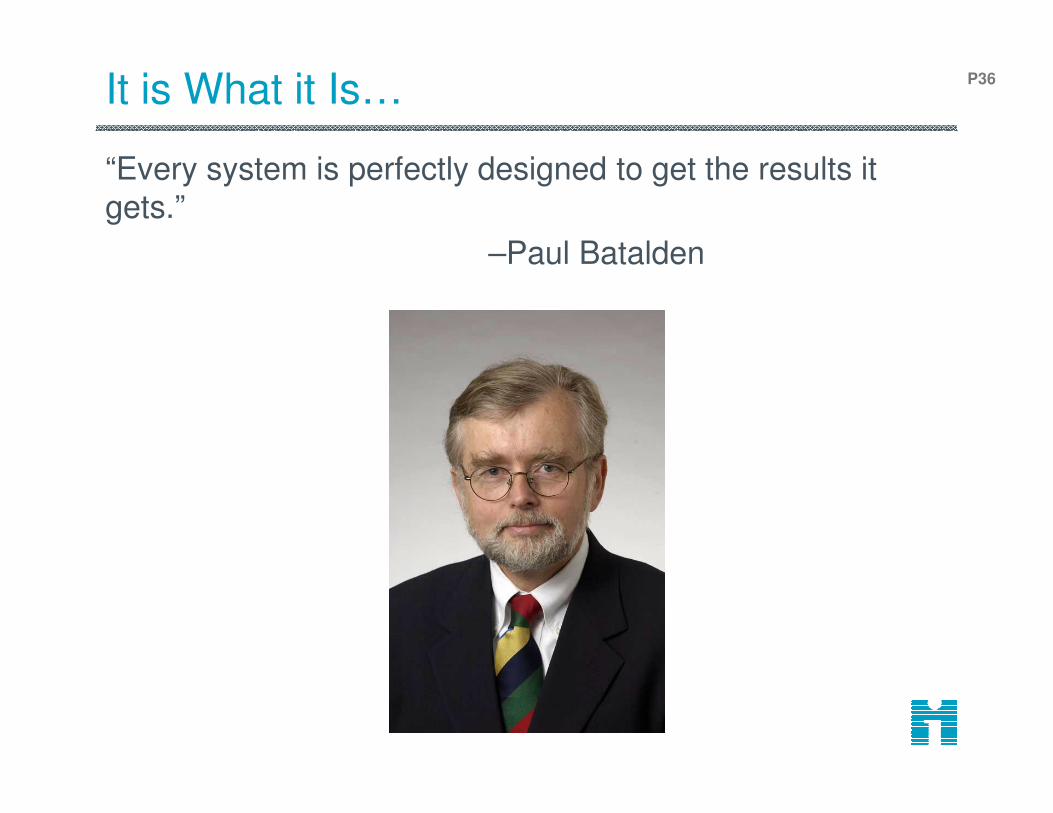
It is What it Is…
“Every system is perfectly designed to get the results it gets.”
–Paul Batalden
P36
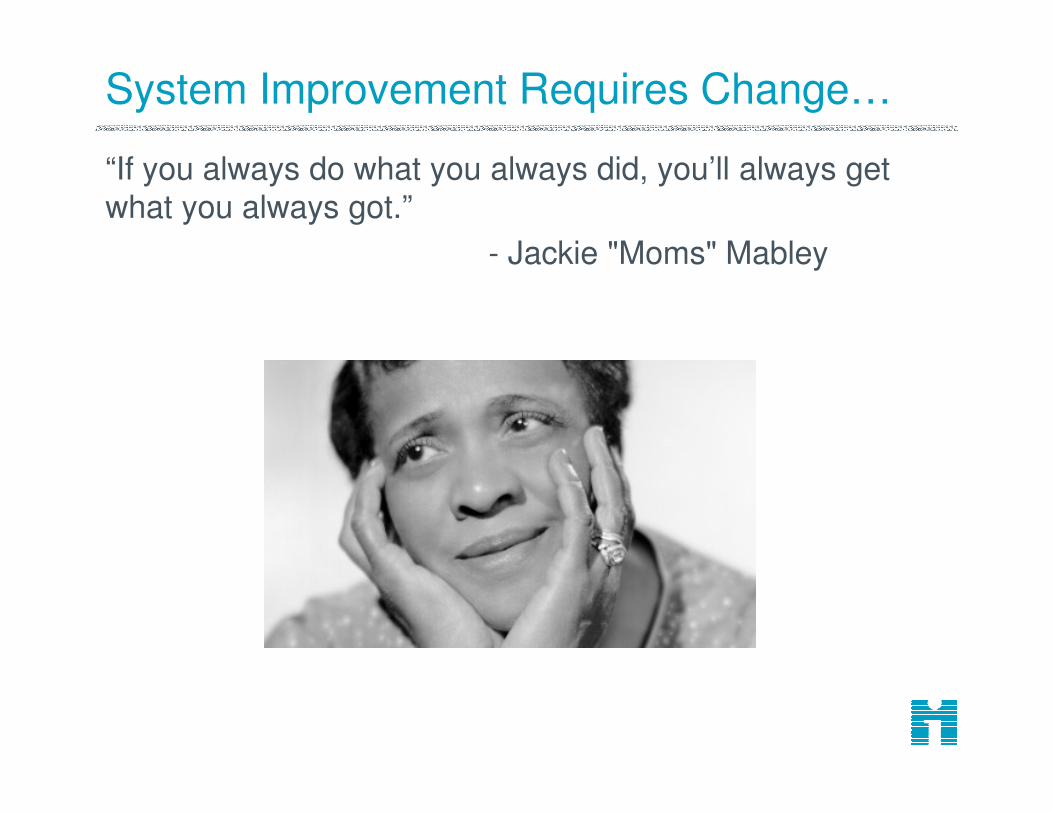
System Improvement Requires Change…
“If you always do what you always did, you’ll always get what you always got.”
- Jackie "Moms" Mabley

Sizing the System
D: The environment (policy,payment, accreditation, etc.)
C: Organizations that supportmicrosystems
B: Microsystems
A: Experience of Patients

Measuring ‘Quality of Care’
• % mortality
• % of patients readmitted in 30 days
• % annual nursing turnover
• % who agree: “I would recommend.”
• % of sepsis patients with antibiotics within
180 minutes
• Average wait time to be seen
• % of ventilator patients with all bundle
elements
• CAUTI infection rate
• Diabetes self management goals established
for Mr. Alvarez
• Hospice plan set for Mrs. Legrande and
family
• Successful surgical outcome for Mr. Jones

Appreciating a System P40

P41
Performance Level: 15
Performance Level: 10-15
Performance Level: < 10

Some Lessons from the Experiment
There was no control in the process
Punishment and praise was rewarding
random variation
We quickly celebrate random success
and scorn failure
Different people respond differently to
unfair circumstances
42

The Science of Improvement
Deming’s System of Profound Knowledge
The Model for Improvement
Levels of Management
Quality Assurance v. Quality Management
Juran’s Trilogy

©Copyright 2013 IHI/R. Lloyd48
Is life this simple?
X Y
(If only it was this simple!)
Patient encounter
with physician
A healthy and
satisfied patient

©Copyright 2013 IHI/R. Lloyd
Life looks more like this…
X3
X2
X1
X5
X4Y
There are numerous direct effects between the independent variables (the Xs) and the dependent variable (Y).
Time 1 Time 3Time 2
Patient Assessment Score
(could be health outcomes,
functional status or satisfaction)
Independent Variables
Current health status
Age
Gender
Communication
Coordination of care

©Copyright 2013 IHI/R. Lloyd51
In this case, there are numerous direct and indirect effects between the independent variables and the dependent variable. For example, X1 and X4
both have direct effects on Y plus there is an indirect effect due to the interaction
of X1 and X4 conjointly on Y.
Y
Actually life looks like this…
X3
X2
X1
X5
X4
Time 1 Time 3Time 2R3
R2
R1
R5
R4
RY
R = residuals or error terms representing the effects of
variables not included in the model.
Coordination of care
Age
Gender
Communication
Patient Assessment Score (could be health
outcomes, functional status or satisfaction)
Current health status

© R. Scoville • 54
Subject Matter Knowledge
Knowledge for Improvement
Subject Matter Knowledge:Knowledge basic to the things we do in life. Professional knowledge.
Profound Knowledge:The interaction of the theories of systems,
variation, knowledge, and psychology.
Profound Knowledge
Profound Knowledge
QI:Combining subject
matter knowledge with
profound knowledge to
develop effective
changes.

Profound Knowledge = Improvement Science
“A system cannot understand itself. [That] requires a view from outside – a lens – that I call a system of profound knowledge.”
System Psychology
Learning Variation

Milestones for the Development of Profound Knowledge
VariationVariationVariationVariation
SystemsSystemsSystemsSystems
PsychologyPsychologyPsychologyPsychology
KnowledgeKnowledgeKnowledgeKnowledge
1900 1920 1940 1950 1960 1970 1980 1990 2000
Shewhart
Control
Chart 1924
Design of
Experiments
Sir Ronald
Fisher, 1925
Sampling
methods
Developed,
H. F. Dodge
Use of statistical
methods to
support the war
effort 1941 - 1945
Enumerative vs Analytic
Studies in Statistics, Deming
Shewhart’s 1931 and 1939
Books on Quality Control*
Principles of Systems
Jay Forrester, 1968
General Systems
Theory
Lugwig von
Bertalanffy, 19495th Discipline
Peter Senge
1990
Theory of Constraints
E. Goldratt, 1990The Goal
1984
F. Taylor, Frank &
Lillian Gilbreth,
Scientific Management
B - f(p,e)
Kurt Lewin
1920
Anthropology
Experts
apply theory
to business
Organization
Development
D. McGregor
Tavistock
institute 1951
Eric Trist
Soclotechnical
System
Open Systems
Fred Emery
Maslow – Hierarchy
of Needs1962
Participatory
Management
Mary Parker
Follett, 1925
Human Side of
Enterprise
D. McGregor,
1960
Motivation
Theory
Herzberg,
1968
Hawthorne
Experiments
Plant, Elton
Mayo, 1927
Mind & The World
Order, C.I. Lewis
1929*
Double Loop
Learning in
Organizations
Chris Argyris,
1977
Lectures at
The USDA,
1938, organized
By Deming*
John Dewey
Realism of
Pragmatism, 1905
How We Think
Dewey, 1933
Motivation
Theory
Kohn
1993
Motivation
Theory
Herzberg,
2003

The Lens of Profound Knowledge
64
Appreciation
of a system
Understanding Variation
Theoryof Knowledge
The human side of
change

Appreciation of a System
What are the boundaries of the system we are working in?
What are the short and long term effects?
Where are our points of leverage?
Where are the constraints?
How is the system producing the current level of quality?
What might be some unintended consequences of our work?

The Human Side of Change
How are the different reactions to change going to impact our work?
What will motivate people to be involved?
• intrinsic and extrinsic motivators?
How might we be attributing results to individuals versus the system?
How can we make our changes attractive? WIIFT?

Understanding Variation
What is the natural variation we see day to day?
What are some of the unexpected variations we see?
How might we be influencing the level of quality based on how we are reacting to variation in the process?
67

Theory of Knowledge
How do we learn about our process?
What theories are driving our process?
What can we predict?
How can we use testing to learn more quickly?
68

Example: Access to Tele-psychiatry (fill this in!!)
Appreciation of a system Human Side of Change
Theory of knowledge Understanding variation

70
Appreciation for a System• What are the Boundaries & Scope
• What are the Short and long term effects• What are some leverage points?
• What are the constraints?• What might be unintended consequences?
Understanding Variation• What is expected versus unexpected variation?
• How should we respond to variation?
Theory of Knowledge• What theories drive the
system?
• Can we predict?
• How can we learn more quickly?
The Human side of change • What different reactions?• What is the Motivation for
change? (extrinsic and
intrinsic)• Are we making Attribution
errors?
• WIIFT?
What What What What questionsquestionsquestionsquestions might be asked through the Lens might be asked through the Lens might be asked through the Lens might be asked through the Lens of Profound Knowledge?of Profound Knowledge?of Profound Knowledge?of Profound Knowledge?

• Apply the lens of profound knowledge to your own project.
• What might each aspect of the lens unveil about your project?
• Spend about 10 minutes working on this exercise.
ExerciseProfound Knowledge

72
Profound Knowledge Worksheet
Appreciation for a System
•
•
•
•
Human Behaviour
•
•
•
Theory of Knowledge
•
•
•
•
Understanding Variation
•
•
•
•

The Model for Improvement
ANTHC ISIAApril 2017

Objectives
Be able to:
• Identify will, ideas and execution as the primary
drivers of organizational improvement
• Describe the Model for Improvement (MFI)
• Identify the components of the MFI
• Understand the different uses of the MFI

Will
Ideas Execution
QI
Having the Will (desire) to change the current state to one that is
better
Developing Ideasthat will contribute to
making processes
and outcomes better
Having the capacity
and capability to
apply CQI theories,
tools and techniques
that enable the
Execution of the
ideas
The Primary Drivers of Organizational
Improvement
Source: Nolan TW. Execution of Strategic Improvement Initiatives to Produce System-Level Results. IHI
Innovation Series white paper. Cambridge, MA: Institute for Healthcare Improvement; 2007.

How prepared are you?(your work group, department, team or facility?)
Key Components*
� Will (to change)
� Ideas
� Execution
Self-Assessment
� Low Medium High
� Low Medium High
� Low Medium High
*All three components MUST be viewed together. Focusing on one or even two of the components will
guarantee suboptimal performance.
Systems thinking lies at the heart of QI!

A Model for Learning and Change
When you combine
the 3 questions with the…
…the Model
for Improvement.
PDSA cycle, you get…
Source: The Improvement Guide, Chapter 1

A Model for Learning and Change
Let’s start with the three
questions
Source: The Improvement Guide, Chapter 1

Question 1: What are we trying to accomplish?
Developing the
team’s
Aim Statement
79
Source: The Improvement Guide, Chapter 1

Question 2: How will we know that a change is an improvement?
Developing a set of
measures for your
project
Source: The Improvement Guide, Chapter 1
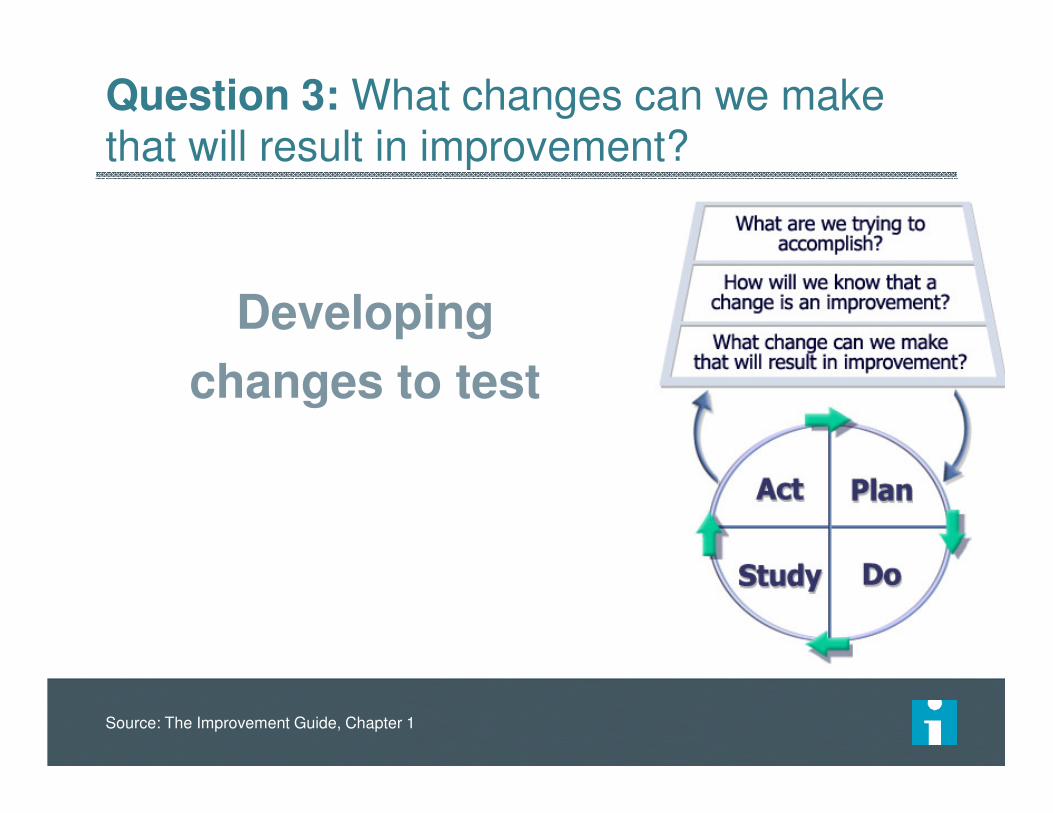
Question 3: What changes can we make that will result in improvement?
Developing
changes to test
Source: The Improvement Guide, Chapter 1

Repeated Use of the PDSA Cycle
Hunches Theories
Ideas
Changes That Result in
Improvement
A PS D
A PS D
What are we trying toaccomplish?
How will we know that achange is an improvement?
What change can we make thatwill result in improvement?
Model for Improvement
Source: Improvement Guide, p 103
82

The PDSA Cycle for Learning and Improvement
What will happen if we try something
different?
Let’s try it!Did it work?
What’s next?
Source: The Improvement Guide, Chapter 5, page 97

84Don’t panic - you do PDSAs every day

The Model for Improvement
• Is applicable to all types of organizations.
• Provides a framework for the application of improvement methods guided by theory.
• Emphasizes and encourages the iterative learning process of deductive and inductivereasoning.
• Allows project plans to adapt as learning occurs.
85
Source: The Improvement Guide, Chapter 1

Sustaining improvements and Spreading changes to other locations
Developing a change
Implementing a change
Testing a change
Theory and Prediction
Test under a variety of conditions
Make part of routine operations
Start Small
The Sequence of Improvement
Source: The Improvement Guide, Chapter 1

http://www.ihi.org/education/IHIOpenSchool/resources/Pages/BobLloydWhiteboard.aspx
87

6 Essential Skills for Improvement

Objectives
Be able to:
Identify the 6 essential skills for improvement
Understand why these 6 skills are essential to
drive improvement

6 Skills for Improvement
Use of data
Developing a change
Testing a Change
Implementing a Change
Spreading a change
Human side of change
Source: The Improvement Guide, Chapter 2

1. Use of data
Observation is important, but not sufficient
– Our minds filter observations: We observe what we want to or expect to observe
– Our present observations are affected by past observations
91
Data: documented observations, including those that result from a measurement process
ObservationsObservations DataData
Source: The Improvement Guide, Chapter 2, p. 28-35
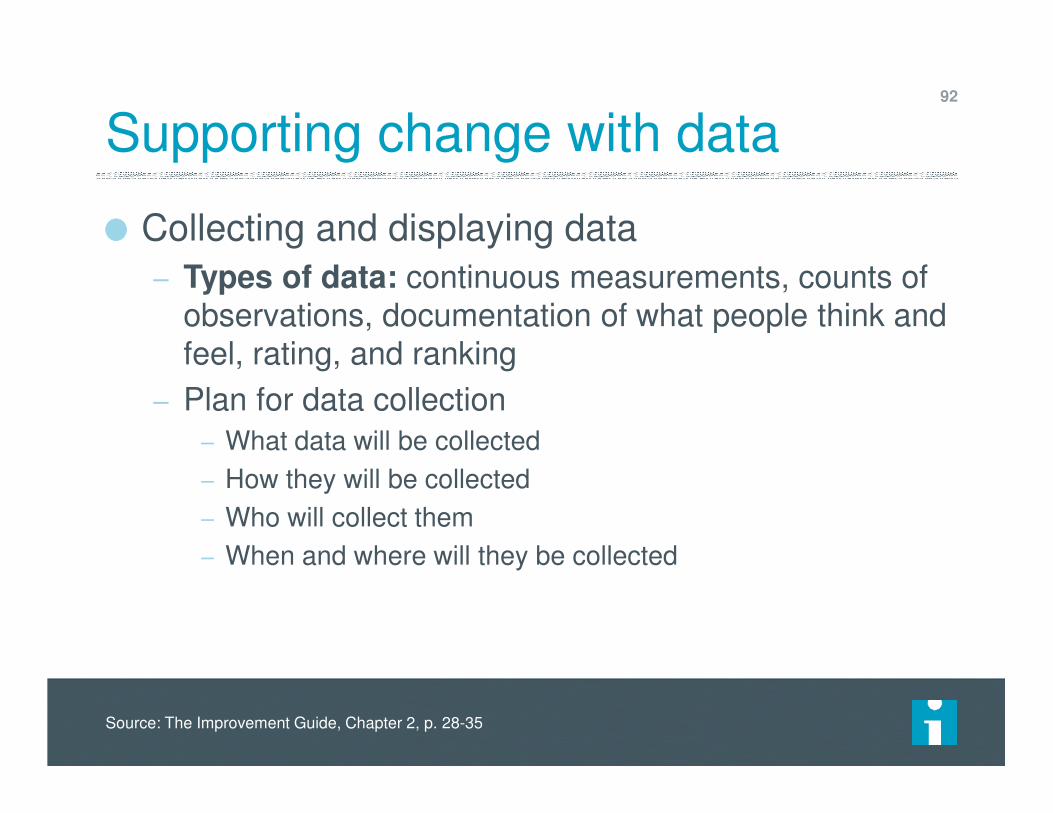
Supporting change with data
Collecting and displaying data
– Types of data: continuous measurements, counts of observations, documentation of what people think and feel, rating, and ranking
– Plan for data collection
– What data will be collected
– How they will be collected
– Who will collect them
– When and where will they be collected
92
Source: The Improvement Guide, Chapter 2, p. 28-35

Supporting change with data
Learning from data– Plotting data over time maximized the learning from
data– Understanding themes and patterns in the data
– Understanding variation
– Common vs. special cause
If you don’t have baseline data, don’t wait to begin a change– Start collecting data when you start testing, and use
the beginning data to understand the current level of performance
93
Source: The Improvement Guide, Chapter 2, p. 28-35

2. Developing a Change
All improvement requires change,but not every change is improvement
94
Source: The Improvement Guide, Chapter 2, p. 35-41

Typical responses to the need for change
More of Same (more money,
more people, more inspection,
more equipment, more rules,
etc.)
Utopia syndrome: Trying to
define the perfect change
– People often become so busy developing the perfect change that nothing gets done
95
Source: The Improvement Guide, Chapter 2, p. 35-41

Developing Better Changes
When developing a change, the focus should be on changes that alter how work or activities get done
Approaches to be effective to develop a change that results in an improvement:
– An understanding of processes and systems of work
– Creative thinking
– Adapting known good ideas
96
Source: The Improvement Guide, Chapter 2, p. 35-41

Developing Better Changes
To develop changes that result in improvement,
we often need to change our normal thought
patterns:
– Challenge the boundaries
– Rearrange the order of steps
– Look for ways to smooth the flow of work
– Evaluate the purpose, and challenge why you are doing something
– Visualize the idea
– Remove the current way of doing things as an option
97
Source: The Improvement Guide, Chapter 2, p. 35-41

3. Testing a Change
Testing is a way of trying the change on a
temporary basis and learning about its
potential impact
However, people tend to want to make a
change part of the day-to-day operations
immediately
98
Source: The Improvement Guide, Chapter 2, p. 41-43

The PDSA Cycle
Tests should be designed so that – as little time, money, and risks as
possible are invested
– enough is learned to move toward full-scale implementation of the change
The PDSA Cycle is a useful framework for planning, carrying out, and learning from a test of change
99
Act Plan
Study Do
Source: The Improvement Guide, Chapter 2, p. 41-43

Some principles for testing a change
1. If possible, keep your tests on a small scale
initially and increase the scale of the test on the
basis of learning
2. As the scale of the test is expanded, include
differing conditions in your test
3. Plan the test, including the collection of data
100
Source: The Improvement Guide, Chapter 2, p. 41-43

4. Implementing a Change
Implementing a change means making it
permanent part of how things are done day-to-
day
101
Source: The Improvement Guide, Chapter 2, p. 43-44

Implementation vs. Testing
Implementation differs from testing in several
ways:
– To implement a change, permanent support structures need to be created
– Only a change you are very sure will result in improvement should be implemented
– Implementing a change will affect more people than the tests of the change
102
Source: The Improvement Guide, Chapter 2, p. 43-44

5. Spreading Improvements
Spreading a change means having the change adopted by a wide audience at multiple locations
To make the decision to adopt a change, people first have to believe the change addresses an existing problem
The foundation of spread is communication
103
Source: The Improvement Guide, Chapter 2, p. 44-45, and Chapter 9

Spreading Improvements
Everett Roger’s* “perceived attributes” of an
idea that facilitate its adoption
– Relative advantage
– Compatibility
– Complexity
– Trialability
– Observability
Original Source:
*Rogers, E.M. (2003). Diffusion of innovations (5th Ed.). New York: Free Press. P. 222
104
Source: The Improvement Guide, Chapter 2, p. 45

6. The Human Side of Change
Change will not happen without the support of
people
Focusing only on the changes themselves and
not on their effect on people will doom
improvement efforts
105
Source: The Improvement Guide, Chapter 2, p. 45-46

The First Question: What Are We Trying to Accomplish?
IG – Chapter 5 – pp. 89-93.

Objectives
Be able to:
Guide the answers to the first question of the
Model for Improvement
Identify the key elements of an Aim Statement
Apply the understanding of the first question of
the Model for Improvement to your project

A Model for Learning and Change109
Langley, et al, The Improvement Guide, 2009
You are here!

From problem to Aim…

113
Constructing an Aim Statement
• The System: The what
• numerical goals for outcomes
• Timeframe (By when?)
• Guidance on sponsor, resources, strategies,
barriers, interim & process goals

What are we trying to accomplish?
A SMART Aim Statement
Specific
Measurable
Actionable
Realistic
Time-bound
“To increase the percentage of preterm infants (birth weight of <1250g) with a normal NICU admission temperature from 43% to 75% by January 2013.”

Example
By September 2017, 90% of youth and parents report being confident in how to stay safe after discharge from emergency department until connection with community MH support. Additionally, 90% of youth are connected to community based mental health support within 48 hours of discharge from Surrey ED.
This work with be done in partnerships with Surrey Child and youth Mental Health teams and align with current protocols for referral.
115

116
• Involve senior leaders
• Focus on issues that are important to your organization
(i.e. how does it align with the strategic plan)
Constructing an Aim Statement

Slide re; voice of the customer in Aim
117

124
Aim Statement Exercise: You Make the Call!

125
In the pilot units, we will reduce the incidence of falls (with and without injury) by 50% within 3 months and to zero within 1 year.
We will ensure that our work contributes to a sustainable QI infrastructure to support future projects and we will gather input on falls assessment and prevention practices from patients and their caregivers.
• System: falls with and without injury in pilot units
• Goal: Reduce falls by 50% then to zero
• Timeframe: 3 months and 1 year
• Guidance: Build QI infrastructure and input from the VOC
Example of an Aim Statement

Aim Statement System of interest?
How good?
By when?
Conclusion?
Nailed it?
1. We aim to reduce harm, improve safety and customer service for all of our patients.
2. By December 2015 we will reduce the incidence of pressure ulcers in the critical care unit by 50%. We hope to make patients and family members involved in this project.
3. Our outpatient testing and therapy patient satisfaction scores are in the bottom 10% of the national comparative database we use. As directed by senior management, we need to get the score above the 50th percentile by the end of the year.
4. We will reduce all types of hospital acquired infections.
5. According to the consultant we hired to evaluate the flow of patients in our outpatient clinic, we need to decrease wait times and improve productivity. The board agrees, so we will work on these issues this year.
6. Our most recent data reveal that on the average we only reconcile the medications for 35% of our discharged inpatients. We intend to increase this average to 50% by 31 Dec 2015 and to 75% by 31 March 2016. We will need to assess the impact of moving the pharmacy department to a new location schedule for October 2015.
You Make the Call!
©2015 Institute for Healthcare Improvement and R. Lloyd. Reproduction of this exercise without written permission from Dr.
Lloyd is prohibited.
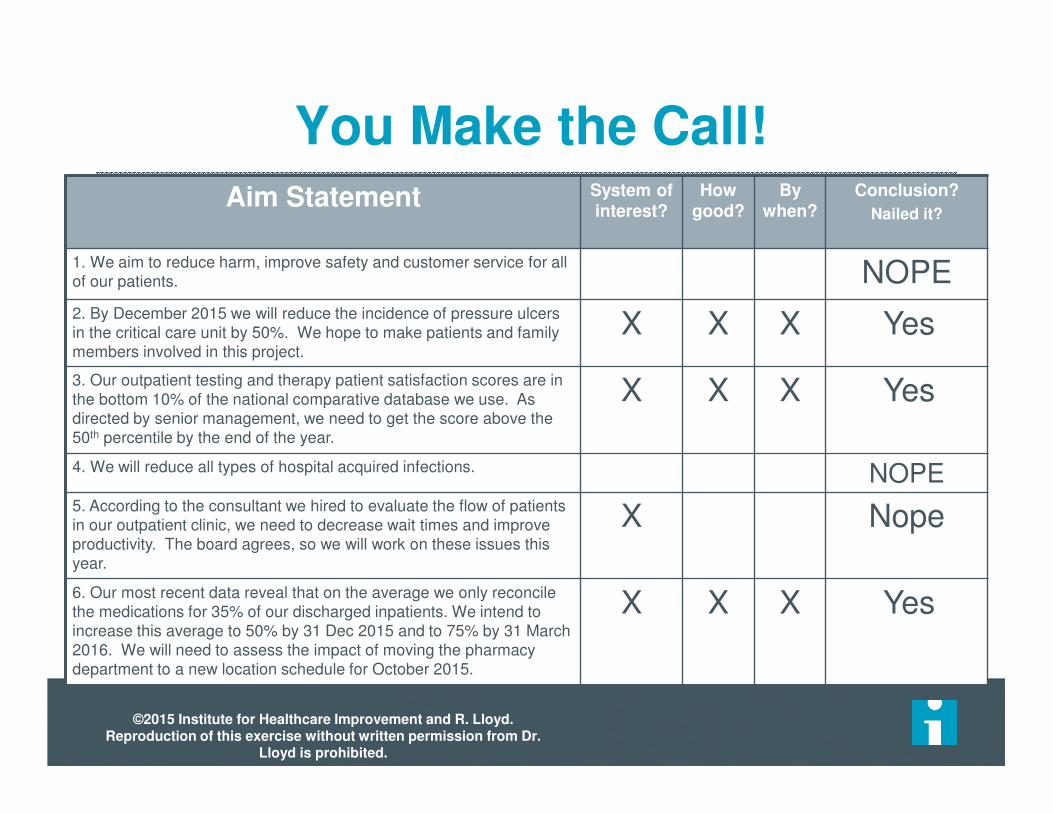
Aim Statement System of interest?
How good?
By when?
Conclusion?
Nailed it?
1. We aim to reduce harm, improve safety and customer service for all of our patients. NOPE2. By December 2015 we will reduce the incidence of pressure ulcers in the critical care unit by 50%. We hope to make patients and family members involved in this project.
X X X Yes
3. Our outpatient testing and therapy patient satisfaction scores are in the bottom 10% of the national comparative database we use. As directed by senior management, we need to get the score above the 50th percentile by the end of the year.
X X X Yes
4. We will reduce all types of hospital acquired infections. NOPE5. According to the consultant we hired to evaluate the flow of patients in our outpatient clinic, we need to decrease wait times and improve productivity. The board agrees, so we will work on these issues this year.
X Nope
6. Our most recent data reveal that on the average we only reconcile the medications for 35% of our discharged inpatients. We intend to increase this average to 50% by 31 Dec 2015 and to 75% by 31 March 2016. We will need to assess the impact of moving the pharmacy department to a new location schedule for October 2015.
X X X Yes
You Make the Call!
©2015 Institute for Healthcare Improvement and R. Lloyd. Reproduction of this exercise without written permission from Dr.
Lloyd is prohibited.

If you already have an Aim Statement, review it for key elements
If you don’t have an Aim Statement, create one for a project you want to start.
Spend about 10 minutes working on this exercise, then compare your Aim Statement with your neighbors.
Use the Aim Statement Worksheet to create or revisit your an Aim Statement.
128
Exercise: Aim Statement

Aim Statement Worksheet129
Team name: ___________________________________
How good? ____________________________________
By when? _____________________________________
Who is the customer? ___________________________
Aim Statement: (What’s the problem? Why is it important? What are we going to do about it?)

IG – Chapter 5 – pp.93-96
How Will We Know that a Change is an Improvement?
Improvement Science in Action

Objectives
Be able to:
Guide the answers to the second question of the
Model for Improvement
Understand the difference between
measurement for improvement and
measurement for compliance or research
Draft a family of measures for your project
131

132
“You can’t fatten a cow by weighing it”- Palestinian Proverb
Improvement is NOT just about measurement!
However, without measurement you will never be able to know the answer to
question #2 in the MFI.
The Role of Measurement

What are we trying toaccomplish?
How will we know that achange is an improvement?
What change can we make thatwill result in improvement?
Model for Improvement
Act Plan
Study Do

Data
“Knowledge begins in data and ends in other data.”
- Walter Shewhart
For our purposes, the following definition of data is
very useful
Data are documented observations for
measurements
Some examples of data include physical measurements, pictures, a listing of a type of defect, answers to questions on a survey, and the locations of customers

Stages of Facing Reality:
Reaction to Data
“The data are wrong”
“The data are right, but it’s not a problem”
“The data are right; it is a problem; but it is not
my problem.”
“I accept the burden of improvement”
135
from Escape Fire, Don Berwick, (2002 Forum Speech), page 287-288

“The Three Faces of Performance Measurement: Improvement, Accountability and Research”
Lief Solberg, Gordon Mosser, and Sharon McDonald
Journal on Quality Improvement vol. 23, no. 3, (March 1997), 135-147.
“We are increasingly realizing not only how critical measurement is to the quality
improvement we seek but also how counterproductive it can be to mix measurement for accountability or
research with measurement for improvement.”

Data for Improvement, Accountability and Research in Health Care
Aspect Improvement Accountability Research
Aim:
Methods:
Bias:
Sample Size:
Flexibility of
Hypothesis:
Testing Strategy:
Determining if a
Change is an
Improvement:
Confidentiality ofthe Data:
Frequency of Use:
Improvement of care (processes, systems, and
outcomes)
Comparison, choice,
reassuranceNew generalizable
knowledge
Test observableNo test, evaluate
current performanceTest blinded or controlled
Accept consistent bias Measure and adjust to
reduce biasDesign to eliminate bias
“Just enough” data,
small sequential samples
Obtain 100% of
available, relevant data“Just in case” data
Hypothesis flexible,
changes as learning
takes place
No hypothesis Fixed hypothesis
Sequential tests No tests One large test
Run charts or Shewhart
control charts
No focus on changeHypothesis, statistical
tests (t-test, F-test, chi
square, p-values)
Data used only by those
involved with
improvement
Data available for
public consumption
and review
Research subjects’
identities protected
Daily, weekly, monthly Quarterly, annually At end of project

A Story…


What we think it says
Green – Good
Yellow– Caution, what’s happening,
– be prepared to do something
Red– OMG, what is happening
– Alert….need to act
What we do with it
Green– Complacency
Yellow– Tampering
Red– Search for someone to blame.
– Act on anything.


“Dashboard” for Judgement143

Displaying Data for Improvement
• Quality “Ticker”
• Days since last adverse event
• Updated daily
• Control Charts for active projects
• Quality and Safety News
• Congratulations
• Thanks
• Upcoming initiatives
• Quality data included in monthly provider and weekly nursing email communication.

Percent of A&E patients Seen by a Physician within 10 min
Did we improve?
What will happen next?
Should we do something?
Source: R. Lloyd

Percent of A&E patients Seen by a Physician within 10 min
50%
55%
60%
65%
70%
75%
80%
85%
90%
95%
100%
10/3
/2007
10/1
7/2
007
10/3
1/2
007
11/1
4/2
007
11/2
8/2
007
12/1
2/2
007
12/2
6/2
007
1/9
/2008
1/2
3/2
008
2/6
/2008
2/2
0/2
008
3/5
/2008
3/1
9/2
008
Change made here
Source: R. Lloyd
Did we improve?
What will happen next?
Should we do something?

Average CABG MortalityBefore and After the Implementation of a New Protocol
Perc
en
t M
ort
ali
ty
Time 1 Time 2
3.8
5.2
5.0%
4.0%
WOW!
A “significant drop”
from 5% to 4%
Conclusion -The protocol was a success! A 20% drop in the average mortality!

Average CABG MortalityBefore and After the Implementation of a New ProtocolA second look at the data
Perc
en
t M
ort
ali
ty
24 Months
1.0
9.0
Now what do you conclude about the impact of the protocol?
5.0
UCL= 6.0
LCL = 2.0
CL = 4.0
Protocol implemented here

Measurement is Central to the Team’s Ability to Improve
• The purpose of measurement in QI work is for learning not judgment!
• All measures have limitations, but the limitations do not negate their value for learning.
• You need a balanced set of measures reported daily, weekly or monthly to determine if the process has improved, stayed the same or become worse.
• These measures should be linked to the team’s Aim.
• Measures should be used to guide improvement and test changes.
• Measures should be integrated into the team’s daily routine.
• Data should be plotted over time on annotate graphs.
• Focus on the Vital Few!

Annotated Time Series(the minimum standard for QI projects)
35.0
40.0
45.0
50.0
55.0
60.0
65.0
70.0
Mar-
11
Apr-
11
May-1
1
Jun-1
1
Jul-11
Aug-1
1
Sep-1
1
Oct-
11
Nov-1
1
Dec-1
1
Jan-1
2
Feb-1
2
Mar-
12
Apr-
12
Min
ute
s
Month
Cycle Time - Toes In to Toes Out
Test Flow for Week
Test Flow Protocol
Test New Exam Room Layout
Implement Flow
Pharm Comes to Exam Room

Some Guidelines for Collecting
Data for Improvement
Be sure to have a few key measures that clarify the aim of the improvement
effort and make it tangible.
– Regularly reported throughout the life of the project (daily, weekly, or monthly,
depending on the length of time for the project).
– A balanced set of 3 to 8 measures will ensure that Question 2 question can be
answered.
Be careful about overdoing process measures.
– A balance of outcome, process, and balancing measures is important.
Plot data visually on the key measures over time.
Make use of existing databases and data already collected for developing
measures.
Whenever feasible, integrate data collection for measurement into the daily work routine.
151

Three Categories of Measures
Outcome Measures: Voice of the customer or patient. How is
the system performing? What is the result?
Process Measures: Voice of the workings of the system. Are
the parts/steps in the system performing as planned?
Balancing Measures: Looking at a system from different
directions/dimensions.
– What happened to the system as we improved the outcome and
process measures?
– (e.g. unanticipated consequences, other factors influencing
outcome)
152
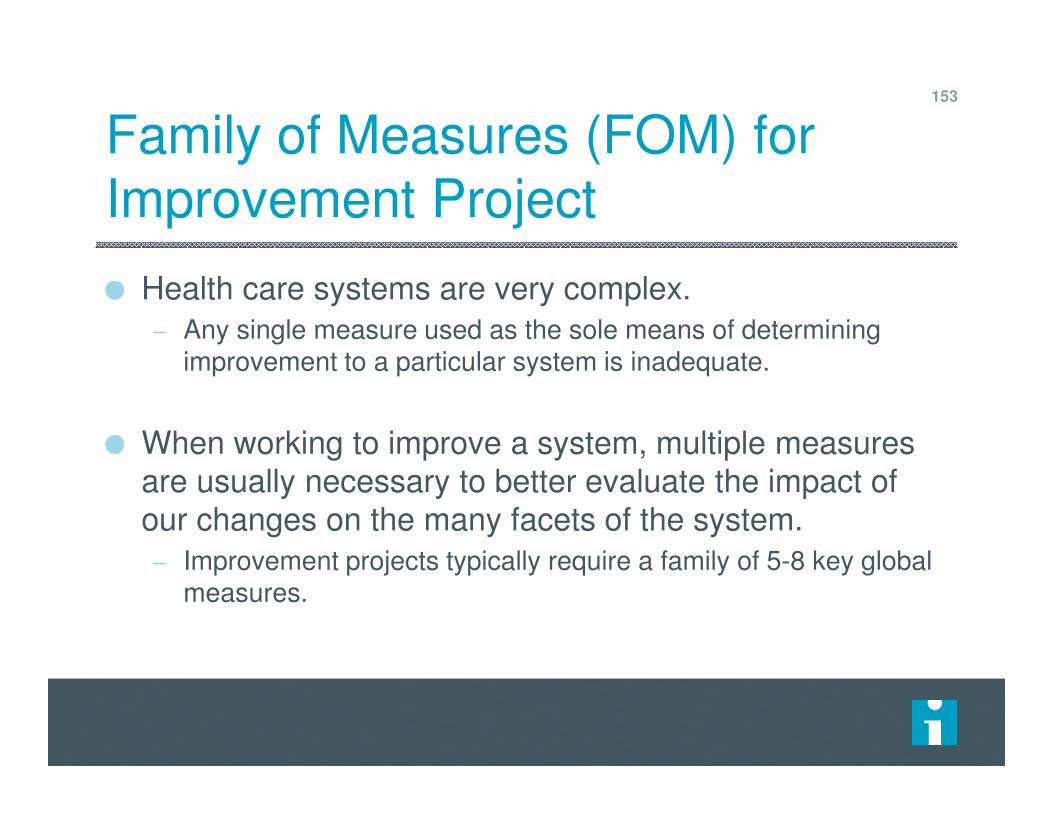
Family of Measures (FOM) for
Improvement Project
Health care systems are very complex.
– Any single measure used as the sole means of determining improvement to a particular system is inadequate.
When working to improve a system, multiple measures are usually necessary to better evaluate the impact of our changes on the many facets of the system.
– Improvement projects typically require a family of 5-8 key global measures.
153

Types of Measures
Description Surgical Site Infection (Family of Measures)
Outcome The voice of the customer or patient. How is the system performing? What is the result?
Surgical Site Infection Rate
Process The voice of the workings of the
process. Are the parts or steps in the system performing as
planned.
Percentage of appropriate prophylactic antibiotic selection.Percentage of on time
administration of prophylactic
antibiotics.
Percentage of a safety climate score great than 4.
Balancing Looking at a system from
different directions or dimensions. What happened to
the system as we improved the
outcome and improvement measures?
Patient satisfaction
Cost per case
Provost, L.P. & Murray, S.K. (2011). The health care data guide: Learning from data for improvement. San
Francisco: Jossey-Bass. P. 63.
154

Family of Measures for Improvement Project
Surgic al Inf ec tion Rate
0.000
0.010
0.020
0.030
0.040
0.050
M ar A M J J A S O N D J
Ra
te
Median 0.026
Patient Satis f ac tion
75
80
85
90
95
100
M ar A M J J A S O N D J
Pe
rcent
Very
Goo
d/E
x
Median 89
A verage Cos t per Cas e
6.4
6.6
6.8
7
7.2
7.4
7.6
7.8
M ar A M J J A S O N D J
Dolla
rs (
k) Median 7.2
Staf f W ith Safety Culture Sc ore >4
0
10
20
30
40
50
60
70
80
90
100
M a r A M J J A S O N D J
Perc
ent
Median 44
Percent On-Time A ntibiotic Us e
40
50
60
70
80
90
100
M ar A M J J A S O N D J
Perc
ent
Perc ent A ppropr iate A ntibiotic Selec tion
40
50
60
70
80
90
100
M a r A M J J A S O N D J
Pe
rcent
Median 86.2Median 89.9
Figure 2.27: Surgical Safety Family of MeasuresHC Data Guide, p 61-64
Process Measure
Process Measure
Process Measure
Balancing Measure
Balancing Measure
Outcome Measure
156
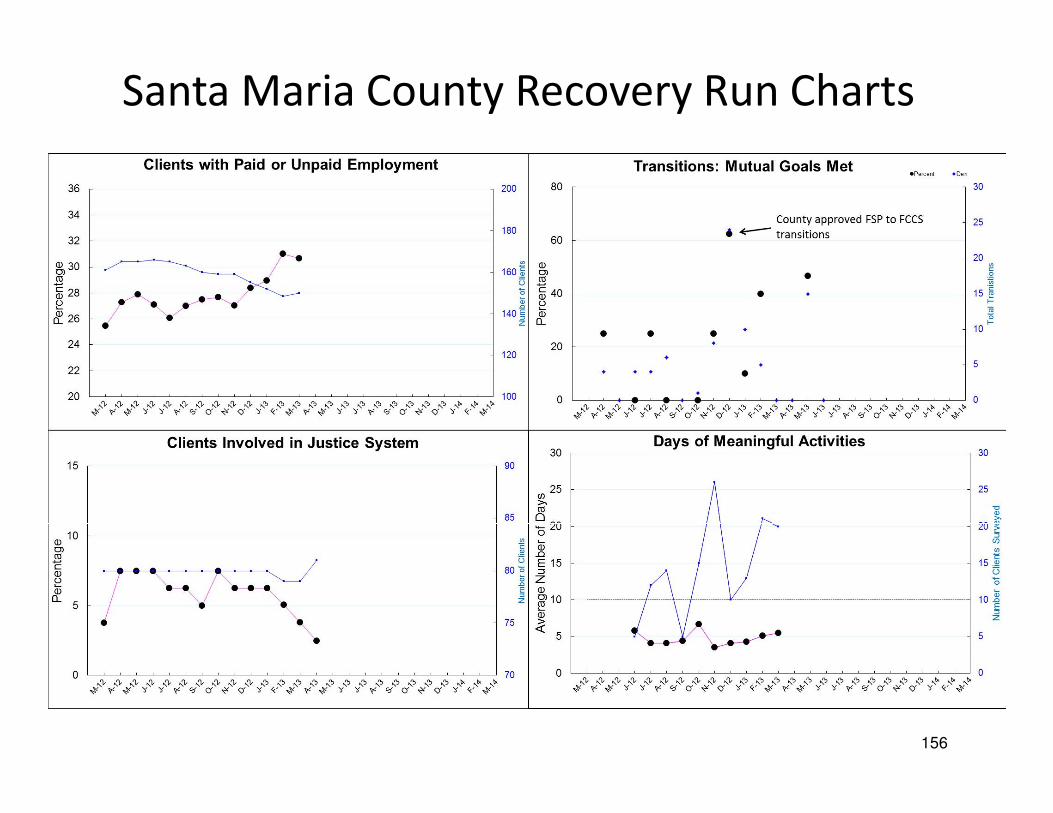
Santa Maria County Recovery Run Charts

Two Levels of Measures with the MFI
Global: focus at the project level and are maintained throughout the life of the improvement project.– Quantitative Data
PDSA-level: Measures are done on an as needed basis for diagnosis and for assessment of the changes tested– Qualitative and/or quantitative
157
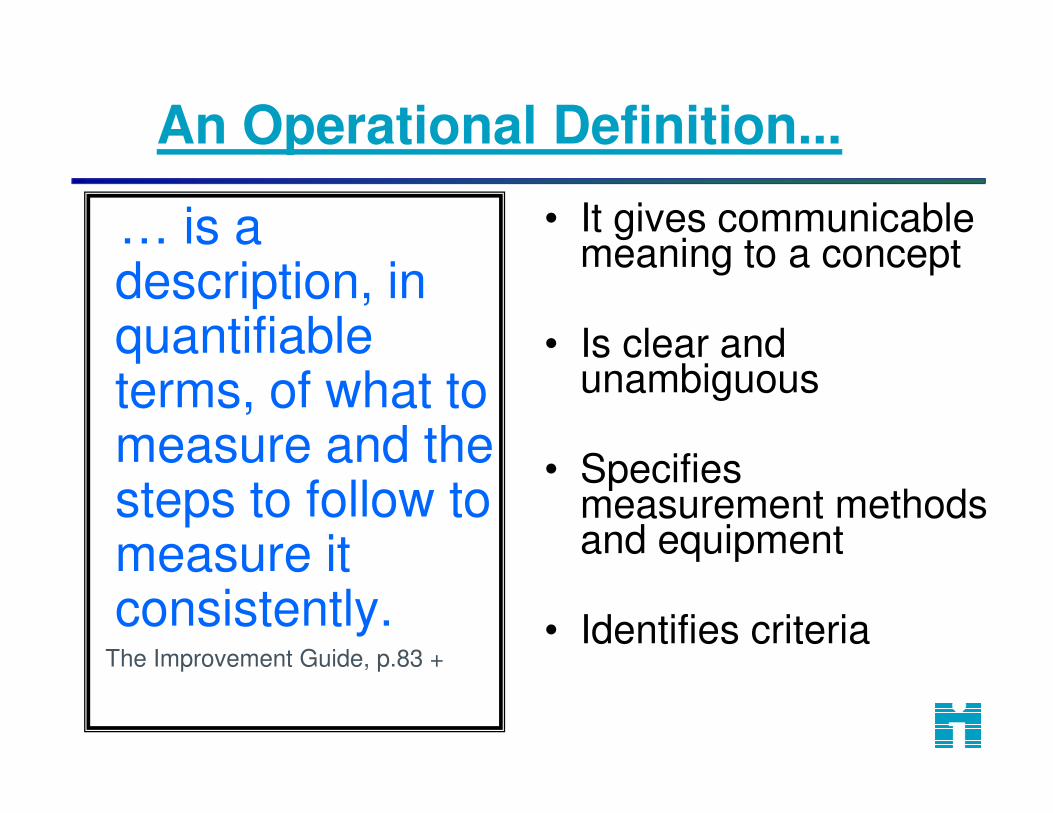
An Operational Definition...
… is a description, in quantifiable terms, of what to measure and the steps to follow to measure it consistently.
• It gives communicable meaning to a concept
• Is clear and unambiguous
• Specifies measurement methods and equipment
• Identifies criteriaThe Improvement Guide, p.83 +

Components of Operational Definition
Developing an operational definition requires
agreement on two things:
1. A method of measurement
– Which device? (clock, wristwatch, stopwatch?)
– To what degree of precision (nearest hour, 5 minutes, minute, second?)
– For time based measurements, what are the start and end points
2. A set of criteria for judgment
– What is “late”, “error”, “a fall”?
– What counts as an adverse event, like a CLABSI?

How do you define these concepts?
A “fair tax” A “tax loophole”
A “good vacation” A “great movie”
Rural, Urban or Suburban
The “rich” The “poor” The “middle class”
“Jump start” the economy
“Global Warming”
Failure to develop a clear Operational Definition often leads to confusion and misunderstanding

161
What does it mean to “go wireless”?

What is a goal?The whole ball or half the ball?
?

165
…the 9 planet
operational definition of
the solar system.
Traditionally we had…

166But, in 2006
the 8 planet operational definition emerged!
NOTE: On February 18, 1930 Mr. Clyde Tombaugh of Streator, Illinois
discovered the planet Pluto. In 2006 the however, the International Astronomical Union reclassified Pluto as a “dwarf planet.”

The Operational Definition of a Planet includes three
criteria:
1. It must orbit the sun, 2. It must be more or less round, 3. It must "clear the neighborhood" around its orbit.
Pluto meets the first two, but falls short of the third,
crossing the orbit of Neptune and those of other objects in
the Kuiper belt where Pluto is located.
167
July 14, 2015New Horizons spacecraft, which has traveled more
than 9 years and 3+ billion miles, took this photo of
Pluto at the moment of its closest approach at 0749
EDT. It is the most detailed image of Pluto ever sent
to Earth.
Percival Lowell and Clyde Tombaugh would be very
proud even though the revised operational definition
demoted Pluto to a dwarf planet.Percival Lowell
Clyde Tombaugh

How do you define the following healthcare concepts?
• Medication error
• Co-morbid conditions
• Teenage pregnancy
• Cancer waiting times
• Health inequalities
• Asthma admissions
• Childhood obesity
• Patient education
• Health and wellbeing
• Adding life to years and years to life
• Children's palliative care
• Safe services
• Smoking cessation
• Urgent care
• Complete history & physical
• Delayed discharges
• End of life care
• Falls (with/without injuries)
• Childhood immunizations
• Complete maternity service
• Patient engagement
• Moving services closer to home
• Successful breastfeeding
• Ambulatory care
• Access to health in deprived areas
• Diagnostics in the community
• Productive community services
• Vascular inequalities
• Breakthrough priorities
• Surgery start time

ExampleMedication Error Operational Definition
Measure Name: Percent of orders with medication errors
Numerator: Number of outpatient medication orders with one or more errors. An error is defined as: wrong med, wrong dose, wrong route or wrong patient.
Denominator: Number of outpatient medication orders received by the family practice clinic pharmacy.
Data Collection:
• This measure applies to all patients seen at the clinic
• The data will be stratified by type of order (new versus refill) and patient age
• The data will be tracked daily and grouped by week
• The data will be pulled from the pharmacy computer and the CPOE systems
• Initially all medication orders will be reviewed. A stratified proportional random sample will be considered once the variation in the process is fully understood and the volume of orders is analyzed.

Exercise: Operational Definitions
1. Create a step-by-step operational definition to capture the concept of “banana size” — Think recipe (step-by-step specific instructions).
2. Measure your banana using the definition, and write down the result and keep it secret!
3. Pass your definition and banana to another table. They will use your definition to measure.
4. Compare results.
© Richard Scoville & I.H.I.

So…
How can we design a set of measures that will
guide our improvement work and show meaningful
results without wasting everyone’s time?

Developing measures for your project
Now that you have developed your aim, identify
a set of measures for your project
Use the template provided
Be ready to report out
172

Potential Set of Measures your Project
TopicOutcome Measures
Process Measures
Balancing Measures

Example: Set of Measures for CLABSIs
Topic
Outcome Measures
Process Measures
Balancing Measures
Reduction in
central line
associated blood
stream infections
CLABSIs per
1000 central line
days by unit
Compliance with
central line
insertion checklist
Hand hygiene rate
Compliance with
hub scrub with
each central line
access
Compliance with
early central line
removal
Need for central
lines to be
replaced
Cost of hand
hygiene supplies
Infiltrates for PIV
usage

Measure Name(Be sure to indicate if it
is a count, percent, rate, days between, etc.)
Operational Definition(Define the measure in very specific terms.
Provide the numerator and the denominator if a percentage or rate. Be as clear and
unambiguous as possible)
Data Collection Plan(How will the data be
collected? Who will do it? Frequency? Duration?
What is to be excluded?)
Measurement Dashboard Worksheet
Name of team:_______________________________ Date: _____________
Source: R. Lloyd. Quality Health Care: A Guide to Developing and Using Indicators. Jones and Bartlett, 2004.
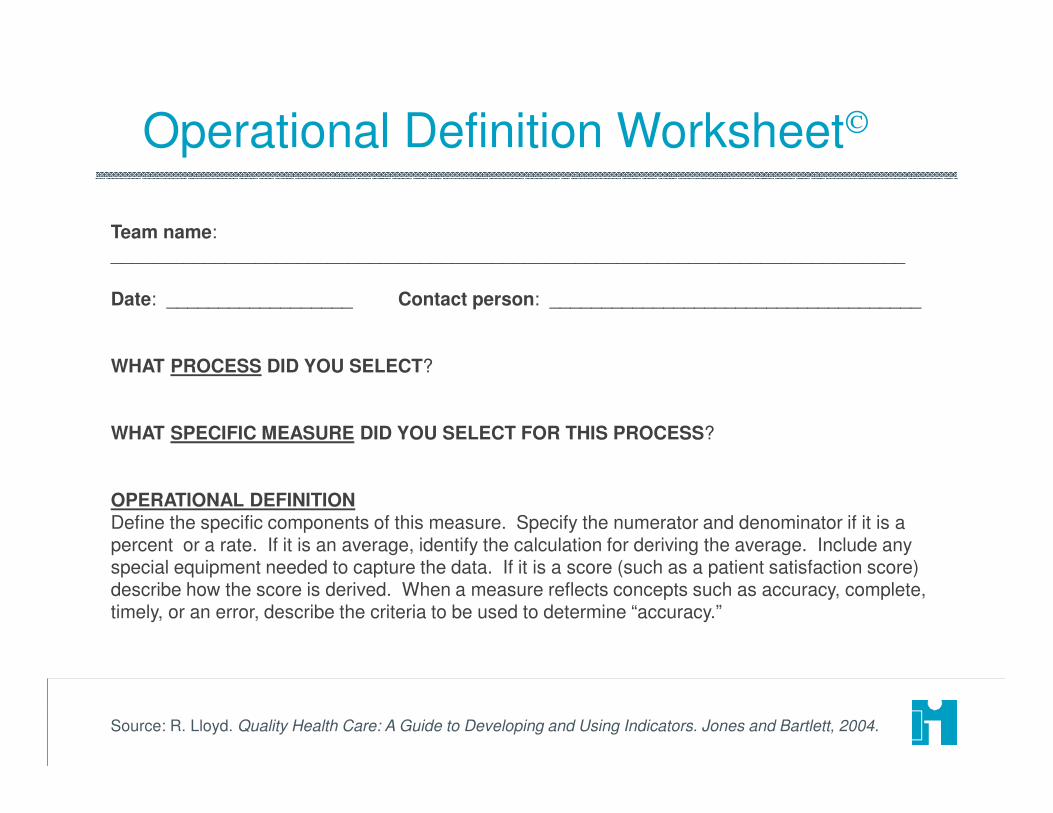
Team name: _____________________________________________________________________________
Date: __________________ Contact person: ____________________________________
WHAT PROCESS DID YOU SELECT?
WHAT SPECIFIC MEASURE DID YOU SELECT FOR THIS PROCESS?
OPERATIONAL DEFINITIONDefine the specific components of this measure. Specify the numerator and denominator if it is a percent or a rate. If it is an average, identify the calculation for deriving the average. Include any special equipment needed to capture the data. If it is a score (such as a patient satisfaction score) describe how the score is derived. When a measure reflects concepts such as accuracy, complete, timely, or an error, describe the criteria to be used to determine “accuracy.”
Operational Definition Worksheet
Source: R. Lloyd. Quality Health Care: A Guide to Developing and Using Indicators. Jones and Bartlett, 2004.

DATA COLLECTION PLANWho is responsible for actually collecting the data?How often will the data be collected? (e.g., hourly, daily, weekly or monthly?)What are the data sources (be specific)?What is to be included or excluded (e.g., only inpatients are to be included in this measure or only stat lab requests should be tracked).How will these data be collected?Manually ______ From a log ______ From an automated system
BASELINE MEASUREMENTWhat is the actual baseline number? ______________________________________________What time period was used to collect the baseline? ___________________________________
TARGET(S) OR GOAL(S) FOR THIS MEASUREDo you have target(s) or goal(s) for this measure?Yes ___ No ___
Specify the External target(s) or Goal(s) (specify the number, rate or volume, etc., as well as the source of the target/goal.)
Specify the Internal target(s) or Goal(s) (specify the number, rate or volume, etc., as well as the source of the target/goal.)
Operational Definition Worksheet (cont’d)
Source: R. Lloyd. Quality Health Care: A Guide to Developing and Using Indicators. Jones and Bartlett, 2004.
Closing Thoughts
ATHSApril 4, 2017

Burning Questions?

Time Day 1 (April 4) Time Day 2 (April 5) Time Day 3 (April 6)
7:15-8:00 Breakfast and Registration 7:15-8:00 Breakfast 7:15-8:00 Breakfast
Intro, Welcome, OverviewWelcome discussion and review
of dayOpener and review questions
Setting the context:
- Your Quality Problems The Third Question (What
changes can we make that will
result in improvement?)
Tools for Looking at Data Over
TimeIntro to Systems Thinking:
the Coin Game
15 min Break 15 min Break 15 min Break
Theory of Profound Knowledge
The Third Question (What
changes can we make that will
result in improvement?)
Other Useful Data Tools
Introduction to the Model for
Improvement Develop or refine change ideas
for your project
Visual Display of Data
6 Essential Skills for ImprovementLinking measurement to
improvement
11:30-12:30 Lunch 11:30-12:30 Lunch 12:00 - 1:00 Lunch
The First Question (What are we
trying to accomplish?)Driver Diagrams
Accelerating ImprovementDraft or refine aims for project Testing Changes
The Second Question (How will we
know a change is an improvement?)
Planning your first PDSA cycles for
your project
15 min Break 15 min Break
Project PlanningDraft or refine measures for your
projectThe 6th skill: Working with People
Clarification of Next Day and
Homework Assignments
Adjourn by
3:15
Clarification Upcoming Calls and
Assignments
Clarification of Next Day and
Homework Assignments
4:30-5:30Optional Office Hours
(Consultations)4:30-5:30
Optional Office Hours
(Consultations)
Today, we covered
material in Chapters 2
and 4 of the Improvement
Guide

Time Day 1 (April 4) Time Day 2 (April 5) Time Day 3 (April 6)
7:15-8:00 Breakfast and Registration 7:15-8:00 Breakfast 7:15-8:00 Breakfast
Intro, Welcome, OverviewWelcome discussion and review
of dayOpener and review questions
Setting the context:
- Your Quality Problems The Third Question (What
changes can we make that will
result in improvement?)
Tools for Looking at Data Over
TimeIntro to Systems Thinking:
the Coin Game
15 min Break 15 min Break 15 min Break
Theory of Profound Knowledge
The Third Question (What
changes can we make that will
result in improvement?)
Other Useful Data Tools
Introduction to the Model for
Improvement Develop or refine change ideas
for your project
Visual Display of Data
6 Essential Skills for ImprovementLinking measurement to
improvement
11:30-12:30 Lunch 11:30-12:30 Lunch 12:00 - 1:00 Lunch
The First Question (What are we
trying to accomplish?)Driver Diagrams
Accelerating ImprovementDraft or refine aims for project Testing Changes
The Second Question (How will we
know a change is an improvement?)
Planning your first PDSA cycles for
your project
15 min Break 15 min Break
Project PlanningDraft or refine measures for your
projectThe 6th skill: Working with People
Clarification of Next Day and
Homework Assignments
Adjourn by
3:15
Clarification Upcoming Calls and
Assignments
Clarification of Next Day and
Homework Assignments
4:30-5:30Optional Office Hours
(Consultations)4:30-5:30
Optional Office Hours
(Consultations)
Tomorrow we
will be
focusing on
Chapters 5, 6,
and 7

Assignments
Please take a few minutes to complete the
“critical incident” questionnaire and leave at your
tables
Start thinking about changes you can make that
will result in an improvement for your project
If you want to read ahead, look at chapters 5, 6
and 7

Thank you!
183