improvement of functional properties of soy protein by al ... · pdf fileindustrially...
TRANSCRIPT
Improvement of Functional Properties of Soy Protein
By
Al-Amari Ali Al-Bakkush
A thesis submitted for the degree of
DOCTOR OF PHILOSOPHY
Heriot-Watt University
School of Life Sciences
Edinburgh
September 2008
This copy of the thesis has been supplied on condition that anyone who consults it is
understood to recognise that the copyright rests with its author and that no quotation
from the thesis and no information derived from it may be published without the
prior written consent of the author or the University (as may be appropriate).

ii
Abstract
The objective of this thesis was to study the effect of heat treatment and glycation on five
industrially important functional properties of soy protein, namely solubility, emulsifying
ability, water holding ability, acid gelation ability in soy yogurts and the heat stability of
soy protein emulsions.
These objectives were achieved completing three tasks:
1) The physicochemical properties were studied of Soycomil K, a commercially available,
insoluble soy protein concentrate. Differential scanning calorimetry (DSC) analysis showed
that it was 28% denatured compared to native, laboratory SPC. Further analysis showed
that the aggregated structure is more hydrophobic and there are more disulfide bonds than
found in commercially available soy protein isolates (SPI). Heat treatment at alkaline pH
and low protein concentration increased its solubility. Heat treatment at 100 °C increased
SoyComil’s solubility significantly compared to heat treatment at 70 °C. Glycation of
SoyComil K with glucose at 70 °C increased solubility compared to the control, whereas
glycation at 100 °C decreased solubility. Heat treatment of Soycomil increased its solubility
more than glycation.
2) A soy yogurt with smooth texture and high water holding capacity (WHC) was
developed with SPI heated in the presence of pectin and glucose, followed by
homogenization with the oil ingredient of the yogurt recipe. The texture matched that of
commercially available yoghurt manufactured with soymilk. A yogurt made with SPI only
showed low WHC. These results provide evidence that combined heat treatment and
glycation of SPI improved its functional properties. A study of the structure of the yogurt
showed that the majority of bonds were hydrophobic bonds, whilst electrostatic and
disulfide bonds played a small part in maintaining the yogurt structure.
3) A study of the rate of aggregation of SPI stabilized emulsions at pH4.5 showed that the
heat stability of SPI emulsions was strongly dependent on protein concentration and
temperature. A second study showed that the presence of polysaccharides either improved
or had little effect on heat stability depending on the concentration of polysaccharide added.
This was attributed to interactions between soy proteins and specific polysaccharides. A
study of the heat stability of mixed whey protein concentrate (WPC) and SPI emulsions
showed that WPC dominated the oil droplet destabilization behaviour, and that low
proportions of WPC were able to slow down the heat-induced breakdown of SPI/WPC-
emulsions containing a high proportion of SPI.
iii
Dedication
To my dear late father, Ali, who was like a burning candle giving me light. He taught me
that a person who has done good science and honourable work in his life will be immortal. I
dedicate my whole work to his gracious soul.

iv
ACKNOWLEDGEMENTS
It is with great pleasure that I write this section of my thesis. In my heart and mind, it is the
most important part of this thesis. I get to say “thank you” to all the wonderful people who
have made it possible for me to go through this program. My deepest gratitude is to Allah
my maker. I am extremely thankful to Allah for blessing me with life, a good health, the
intellect and resources to be able complete this program. In my most difficult moments, the
word of Allah always served to up life my sprit, and give me a sense of purpose.
First and foremost I am deeply indebted to my principal supervisor Dr. Lydia Campbell for
her advice, guidance and inspiration offered throughout the course of this work. She was
readily available to give intelligent and constructive advice on issues all the time, after
hours and on weekends to make me understand and do my work in the right way. I think
her effort was insurmountable. I am particularly grateful for her optimism inspiration and
motivational skills in face of my pessimism and lack of confidence, I could not have asked
for a better supervisor. I believe the research presented in this dissertation would not have
been possible without her. She developed a project of which she can be proud and I feel
privileged to have been part of it.
My thanks go to my second supervisor Dr Stephen R Euston, I am grateful for his patience,
supported and valuable comments and suggestion during this work all the time.
Many thanks are due to my close friend Dr Roder Karim for his help and support
throughout this project.
I must thank my parents Ali and Nagma, brother Abd-Salam and my sisters, nephews and
nieces who all gave me endless encouragement, inspiration, support and advice.
Lastly, I would like to thank all research students of School of Life Sciences for sharing
ideas and best practice as well as keeping me motivated throughout my research. The
technical staff at the School of Life Sciences provided me with much assistance,
particularly Mrs Vicky Goodfellow, Robert Rennie and Jim MacKinlay.
v
ACADEMIC REGISTRY Research Thesis Submission
Name: Al-Amari Ali Al-Bakkush
School/PGI: School of Life Science
Version: (i.e. First, Resubmission, Final)
Final Degree Sought: PhD
Declaration In accordance with the appropriate regulations I hereby submit my thesis and I declare that: 1) the thesis embodies the results of my own work and has been composed by myself 2) where appropriate, I have made acknowledgement of the work of others and have made
reference to work carried out in collaboration with other persons 3) the thesis is the correct version of the thesis for submission and is the same version as any
electronic versions submitted*. 4) my thesis for the award referred to, deposited in the Heriot-Watt University Library, should be
made available for loan or photocopying and be available via the Institutional Repository, subject to such conditions as the Librarian may require
5) I understand that as a student of the University I am required to abide by the Regulations of the University and to conform to its discipline.
* Please note that it is the responsibility of the candidate to ensure that the correct version of
the thesis is submitted.
Signature of Candidate:
Date:
Submission Submitted By (name in capitals): AL-AMARI ALI AL-BAKKUSH
Signature of Individual Submitting:
Date Submitted:
For Completion in Academic Registry Received in the Academic Registry by (name in capitals):
Method of Submission (Handed in to Academic Registry; posted through internal/external mail):
E-thesis Submitted Signature:
Date:

vi
DECLARATION
I, Al-Amari Ali Al-Bakkush, hereby declare that I am the author of this thesis. All the
work described in this thesis is my own except where stated in the text. The work presented
here has not ben accepted in any previous application for a higher degree. All the source of
information have been consulted by myself and are acknowledged by means of refrence.
(Al-amari Al-Bakkush)

vii
Table of Contents
Abstract....................................................................................................... ii_Toc217816397
Dedication ............................................................................................................................ iii
Acknowledgements ..............................................................................................................iv
Submission form ...................................................................................................................v
Declaration ...........................................................................................................................vi
Table of Contents ............................................................................................................... vii
List of Tables ......................................................................................................................xiv
List of Figures......................................................................................................................xv
Abbreviations ....................................................................................................................XX
Chapter One - General Introduction ..................................................................................1
1.1 Introduction...................................................................................................................2
1.2 Soybean structure and composition ..............................................................................3
1.3 Essential amino acid composition of soybean ..............................................................3
1.4 Component of soy protein.............................................................................................4
1.4.1 2S fraction (whey protein) ......................................................................................4
1.4.2 7S fraction (β-conglycinin).....................................................................................4
1.4.3 11S fraction (glycinin) ............................................................................................5
1.4.4 15S fraction.............................................................................................................7
1.5 Commercial soy products .......................................................................................7
1.5.1 Soy flours................................................................................................................7
1.5.2 Soy protein concentrates.........................................................................................8
1.5.3 Soy protein isolates................................................................................................10
1.6 Soy protein denaturation and associated molecular interactions ................................12
1.6.1 Electrostatic bonds................................................................................................12
1.6.2 Ionic bonds............................................................................................................13
1.6.3 Covalent bonds .....................................................................................................13
1.6.4 Hydrophobic bonds...............................................................................................14
1.7 Properties of soy bean proteins in food systems.........................................................14
1.7.1 Soy protein solubility............................................................................................16
1.7.1.1 Effect of heat treatment on soy protein solubility ..........................................16
1.7.1.2 Effect of pH on soy protein solubility ............................................................17

viii
1.7.1.3 Effect of protein concentration on soy protein solubility ...............................18
1.7.1.4 Effect of salt (NaCl) on soy protein solubility ...............................................18
1.7.1.5 Effect of sugars (monosaccharide, oligosaccharides and polysaccharides) on
soy protein solubility ...................................................................................................19
1.7.1.6 Effect of enzymes on soy protein solubility ...................................................21
1.8 Hydrophobicity of soy protein ....................................................................................22
1.9 Water holding capacity ...............................................................................................23
1.10 Emulsifying ability of soy protein ..............................................................................23
1.10.1 Properties of soy protein emulsions....................................................................24
1.10.2 Mechanism of emulsion formation.....................................................................26
1.10.3 Emulsion stability ...............................................................................................27
1.10.4 Factors that affect protein-stabilised emulsion properties ..................................27
1.10.4.1 Effect of heat treatment ................................................................................27
1.10.4.2 Effect of high-pressure homogenization.......................................................28
1.10.4.3 Effect of sugars (monosaccharide, oligosaccharides and polysaccharides in
aqueous phase..............................................................................................................28
1.11 Gelation properties of soy protein ............................................................................29
1.11.1 Factors affecting gel formation...........................................................................30
1.11.1.1 Heat treatment...............................................................................................30
1.11.1.2 Protein concentration....................................................................................31
1.11.1.3 Effect of pH ..................................................................................................31
1.11.1.4 Effect of ionic strength (NaCl) on gelation ..................................................32
1.11.1.5 Effect of sugars (oligosaccharides and polysaccharides) on gelation ..........32
1.11.2. Gelation properties of soy protein .....................................................................33
1.11.3 Texture analysis of protein gels ..........................................................................33
1.12 Effect of glycation of proteins on protein functionality in general...........................34
1.13 Yogurt .......................................................................................................................35
1.14 Aims and objectives of this study .............................................................................36
Chapter Two - Materials and Methods.............................................................................38
2 Materials and Methods...................................................................................................39
2.1 Materials .....................................................................................................................39
2.2 Methods ......................................................................................................................40
2.2.1 Preparation of soy protein concentrates (SPC).....................................................40

ix
2.2.2 Preparation of soy protein isolates (SPI) ..............................................................41
2.2.3 Preparation of emulsions ......................................................................................42
2.2.3.1 SoyComil K emulsions...................................................................................42
2.2.3.2 Soy protein isolates (SPI) emulsions (pH7) ...................................................43
2.2.3.3 Soy protein isolates (SPI) emulsions (pH4.5) ................................................44
2.2.3.4 Whey protein emulsion (pH4.5) .....................................................................44
2.2.4 Preparation of yogurts...........................................................................................44
2.2.5 Determination of physico-chemical properties of soy protein .............................45
2.2.5.1 Differential scanning calorimetry (DSC) .......................................................46
2.2.5.2 Electrophoresis (SDS-PAGE).........................................................................46
2.2.5.3 Solubility ........................................................................................................46
2.2.5.3.1 SoyComil K solubility..............................................................................46
2.2.5.3.1.1 Effect of salt (NaCl) on SoyComil K solubility .................................47
2.2.5.3.1.2 Effect of some sugars on solubility of SoyComil K...........................47
2.2.5.3.1.3 Effect of enzymes on solubility of SoyComil K ................................47
2.2.5.3.2 Solubility of soy protein isolate................................................................47
2.2.5.4 Turbidimetric measurement of soy protein aggregation..............................47
2.2.5.5 Determination of hydrophobicity ................................................................48
2.2.5.6 Determination of glycation degree ..............................................................48
2.2.5.6.1 Glycation degree of Soycomil K ..............................................................48
2.2.5.6.2 Glycation degree of soy protein isolate (SPI) in the presence of different
sugars ....................................................................................................................................49
2.2.6 Identification of intra-molecular bonds ................................................................49
2.2.6.1 SoyComil K dispersions .................................................................................49
2.2.6.1.1 Particle size measurement .....................................................................49
2.2.6.2 SPI dispersions ...............................................................................................50
2.2.6.3 Soy yogurts .....................................................................................................50
2.2.7 Determination of free and total sulfhydryl (SH) groups.......................................50
2.2.7.1 SoyComil K dispersions .................................................................................51
2.2.7.2 Yogurt .............................................................................................................51
2.2.8 Determination of emulsion properties ..................................................................51
2.2.8.1 Emulsifying activity .......................................................................................51
2.2.8.1.1 SoyComil K emulsions.............................................................................52

x
2.2.8.1.2 SPI emulsions ...........................................................................................52
2.2.8.2 Determination of destabilisation of emulsions ...............................................52
2.2.8.2.1 Calculation of emulsion destability ..........................................................52
2.2.9 Properties of yogurts.............................................................................................54
2.2.9.1 Water holding capacity of yogurts..................................................................54
2.2.9.2 Texture analysis of yogurts.............................................................................55
2.2.10 Rheological measurements .............................................................................55
2.2.11 Confocal laser scanning microscopy ..................................................................55
2.2.11.1 SoyComil K emulsions.................................................................................56
2.2.11.2 Yogurts .........................................................................................................56
2.2.12 Statistical analysis...............................................................................................56
Chapter Three - SoyComil K.............................................................................................57
3.1 Introduction.................................................................................................................58
3.2 Materials and Methods................................................................................................59
3.3 Results.........................................................................................................................59
3.3.1 Physicochemical properties of Soycomil K..........................................................59
3.3.1.1 SDS-PAGE electrophoresis ............................................................................59
3.3.1.2 Differential scanning calorimetry (DSC) .......................................................64
3.3.2 Factors influencing Soycomil K solubility ...........................................................65
3.3.2.1 Effect of pH, temperature and protein concentrations on SoyComil K
solubility ......................................................................................................................65
3.3.2.2 Effects of pH, temperature and concentration on turbidity of SoyComil K...66
3.3.2.3 Effect of salt (NaCl) on SoyComil K solubility .............................................67
3.3.2.4 Effect of some sugars on solubility of SoyComil K.......................................68
3.3.2.4.1 Glycation degree of SoyComil K .............................................................70
3.3.2.5 Effect of enzymes on solubility of SoyComil K.............................................71
3.3.2.6 Intramolecular bonds in Soycomil K dispersions...........................................74
3.3.2.6.1 Effect of solubilisation in different buffers on particle size of Soycomil K
..............................................................................................................................................74
3.3.2.6.2 Effect of pH, temperature and protein concentration on SH groups of
SoyComil K ..........................................................................................................................76
3.3.2.7 Relationship between solubility and hydrophobicity in SoyComil K ............77
3.3.3 Properties of SoyComil K emulsions ...................................................................78

xi
3.3.3.1 Effect of different treatments on oil droplet size of SoyComil K emulsions .78
3.3.3.2 Effect of different treatments on emulsion stability of SoyComil K.............79
3.3.3.3 Rheological measurements ............................................................................85
3.3.3.3.1 Effect of different treatments of SoyComil K on emulsion viscosity ...85
3.3.3.4 Confocal laser scanning microscopy of SoyComil K emulsions ...................89
3.4 Discussion...................................................................................................................98
3.4.1 Physicochemical properties of Soycomil K..........................................................98
3.4.1.1 SDS-PAGE electrophoresis ............................................................................98
3.4.1.2 Differential scanning calorimetry (DSC) .......................................................99
3.4.2 Factors influencing Soycomil K solubility .........................................................100
3.4.2.1 Effect of pH, temperature and protein concentrations on SoyComil K
solubility ....................................................................................................................100
3.4.2.2 Effects of pH, temperature and concentration on turbidity of SoyComil K.101
3.4.2.3 Effect of salt (NaCl) on SoyComil K solubility ...........................................101
3.4.2.4 Effect of some sugars on solubility of SoyComil K.....................................102
3.4.2.4.1 Glycation degree of SoyComil K ...........................................................103
3.4.2.5 Effect of enzymes on solubility of SoyComil K...........................................103
3.4.2.6 Intramolecular bonds in Soycomil K dispersions.........................................105
3.4.2.6.1 Effect of solubilisation in different buffers on particle size of Soycomil K
............................................................................................................................................105
3.4.2.6.2 Effect of pH, temperature and protein concentration on SH groups of
SoyComil K ........................................................................................................................105
3.4.2.7 Relationship between solubility and hydrophobicity in SoyComil K ..........106
3.4.3 Properties of SoyComil K emulsions .................................................................107
3.4.3.1 Effect of different treatments on oil droplet size of SoyComil K emulsions107
3.4.3.2 Effect of different treatments on emulsion stability of SoyComil K...........107
3.4.3.3 Rheological measurements ..........................................................................108
3.4.3.3.1 Effect of different treatments of SoyComil K on emulsion viscosity .108
3.4.3.4 Confocal laser scanning microscopy of SoyComil K emulsions .................108
3.5 Conclusions.............................................................................................................110
Chapter four - SPI-Polysaccharides in model yogurts ..................................................113
4.1 Introduction...............................................................................................................114
4.2 Materials and Methods..............................................................................................115

xii
4.3 Results.......................................................................................................................116
4.3.1 Intra-molecular bonds in a commercial soy protein isolate dispersion ..............116
4.3.2 Glycation degree of commercial soy protein isolates.........................................117
4.3.3 Properties of SPI emulsions................................................................................119
4.3.3.1 Effect of heat treatment of SPI on oil droplets size of 3% oil emulsions at pH 7
.........................................................................................................................................119
4.3.3.2 Effect of ultra high-pressure homogenization on oil droplets size of SPI
emulsions...................................................................................................................120
4.3.3.3 Effect of heat treatment of SPI in presence of polysaccharides on oil droplets
size of SPI emulsions.................................................................................................121
4.3.4 Soy yogurts ............................................................................................................123
4.3.4.1 Texture analysis of yogurts..............................................................................124
4.3.4.2 Water holding capacity of yogurts...................................................................128
4.3.4.3 Total and free sulfhydryl group contents in yogurts........................................130
4.3.4.4 Total and free sulfhydryl group contents in yogurts.....................................131
4.3.4.5 Confocal laser scanning microscopy (CLSM) of soy yogurts.......................132
4.4 Discussion.............................................................................................................138
4.4.1 Intra-molecular bonds in a commercial soy protein isolate dispersion ............138
4.4.2 Glycation degree of commercial soy protein isolates.........................................138
4.4.3 Properties of SPI emulsions...................................................................................139
4.4.3.1 Effect of heat treatment of SPI on oil droplets size of 3% oil emulsions at pH
...................................................................................................................................139
4.4.3.2 Effect of ultra high-pressure homogenization on oil droplets size of SPI
emulsions .........................................................................................................................139
4.4.3.3 Effect of heat treatment of SPI in presence of polysaccharides on oil droplets
size of SPI emulsions.................................................................................................140
4.4.4 Soy yogurts ............................................................................................................141
4.5 Conclusions...............................................................................................................144
Chapter five - Destabilization of SPI emulsions.............................................................145
5.1 Introduction...............................................................................................................146
5.2 Materials and Methods..............................................................................................147
5.3 Results.......................................................................................................................148
5.3.1 Destabilization of SPI and WPC emulsions .......................................................148
xiii
5.3.1.1 Kinetic analysis of SPI emulsion heat destabilization..................................148
5.3.1.2 Effect of pH on SPI emulsion heat stability .................................................149
5.3.1.3 Comparison of the concentration dependence of the heat stability of SPI and
WPC emulsions .........................................................................................................149
5.3.1.4 Comparison of the temperature dependence of the heat stability of SPI and
WPC emulsions .........................................................................................................151
5.3.1.5 Mixed SPI and WPC emulsions ...................................................................154
5.3.2 The effect of polysaccharides on SPI emulsion heat stability ............................155
5.4 Discussion.................................................................................................................158
5.4.1 Destabilization of SPI and WPC emulsions .......................................................158
5.4.2 The effect of polysaccharides on SPI emulsion heat stability ............................164
5.5 Conclusions...............................................................................................................165
Chapter six - General Conclusion ...................................................................................167
6.1 Summary of tasks......................................................................................................167
6.2 Summary of results ...................................................................................................168
6.2.1 Functional properties of SoyComil K.................................................................168
6.2.1.1 Heat treatment in the absence of sugars .......................................................168
6.2.1.2 Heat treatment in the presence of sugars ......................................................169
6.2.1.3 Enzymes treatment .......................................................................................169
6.2.1.4 SoyComil K emulsions.................................................................................169
6.2.1.5 Rheological measurements (emulsion viscosity) .........................................170
6.3 Soy protein isolate and polysaccharides in model yogurt.........................................170
6.4 Destabilization of SPI and WPC emulsions ...........................................................171
6.4.1 Destabilization of SPI and WPC emulsions .......................................................172
6.4.2 The effect of polysaccharides (pectin, carrageenan and xanthan)on SPI emulsion
heat stability at different temperatures at pH4.5..............................................................172
6.5 Novel findings...........................................................................................................172
6.6 Future work...............................................................................................................173
References..........................................................................................................................174

xiv
List of Tables
Table 1.1. Functional properties of soybean properties in food systems..............................15
Table 1.2 Definitions of evaluating factor of food texture ...................................................34
Table 3.1 Effect of pH, protein concentration and heat treatment on SoyComil K solubility
and hydrophobicity ...............................................................................................................77
Table 4.1 Textural profile analysis of commercial soy yogurt ...........................................124
Table 4.2 Hardness (Newton unit “N”) of laboratory prepared soy yogurts ......................125
Table 4.3 Cohesion strength (Newton unit “N”) of laboratory prepared soy yogurts ......126
Table 4.4 Adhesiveness strength (micro Joules unit “mJ) of laboratory prepared soy yogurts
............................................................................................................................................127
Table 4.5 water holding capacity (%)of soy yogurts .........................................................129
Table 4.6 Total and free sulfhydryl contents in soy yogurts ..............................................130
Table 4.7 Solubility profile of soy yogurts in various reagents..........................................132
Table 5.1 Activation energy (Ea), free energy of activation (ΔG), enthalpy (ΔH) and
entropy (ΔS) of SPI and WPC at different concentration and temperatures. .....................156

xv
List of Figures
Figure 1.1. Chemical composition of soybean (Kuen , 2004) ................................................3
Figure 1.2. The ribbon diagram of native soy β-conglycinin .................................................5
Figure 1. 3. Schematic drawing of the structure of glycinin...................................................6
Figure 1.4. The ribbon diagram of native soy glycinin ..........................................................7
Figure 1.5. Flow chart for the production of soy protein concentrates...................................9
Figure 1.6 Procedure for producing SoyComil K.................................................................10
Figure 1.7 Flow chart for the production of soy protein isolates (SPI ) ...............................11
Figure 1.8. London dispersion forces-induced dipoles........................................................13
Figure 1.9 Covalent disulfide bonds between two cysteine residues ...................................13
Figure 1.10 Schematic subunit interactions between 7S and 11S globulin on heating ........17
Figure 1.11 Maillard reactions for protein and reducing sugar combinations around pH 7,
modified from .......................................................................................................................20
Figure 1.12 Schematic presentation of the binding mode of a polysaccharide with a protein
through the Maillard reaction (A) and the resulting protein-polysaccharide conjugate (B).21
Figure 1.13 Principle types of emulsions..............................................................................25
Figure 1.14 Surface-coated oil globule.................................................................................26
Figure 1.15 Schematic presentations of flocculation and coalescence .................................27
Figure 1.16 A Schematic diagram of gel network ................................................................30
Figure 1.17 Influence of pH and ionic strength on final whey protein gel properties..........32
Figure 2.1 Laboratory preparation of soy protein concentrates (SPC) .................................40
Figure 2.2 Laboratory preparation of soy protein isolates (SPI) ..........................................41
Figure 2.3 Procedure for preparation of SoyComil K emulsions .........................................42
Figure 2.4 Procedure for preparation of SPI emulsions (pH7) .............................................43
Figure 2.5 Procedure for preparation of yogurts...................................................................45
Figure 3.1 Reducing and non-reducing SDS- PAGE of supernatant and pellet SoyComil K
pH 9.0 treated at different temperatures. ..............................................................................60
Figure 3.2 Non-reducing SDS- PAGE of soy protein concentrates (SoyComil K and soy
Arcon ® SJ) and Soy protein isolates pH 7 at room temperature.........................................62
Figure 3.3 Reducing SDS- PAGE of soy protein concentrates (SoyComil K and soy Arcon
® SJ) and SPI pH 7 at room temperature .............................................................................63
Figure 3.4 DSC thermogram of native laboratory prepared SPC. ........................................64
Figure 3.5 DSC thermogram of SoyComil K .......................................................................65
xvi
Figure 3.6 Effect of pH, protein concentrations and heat treatment on SoyComil K
solubility ...............................................................................................................................66
Figure 3.7 Effect of pH, protein concentration and heat treatment on SoyComil K turbidity
..............................................................................................................................................67
Figure 3.8 Effect of salt (NaCl) on solubility of SoyComil K pH9 at 80°C for10 min........68
Figure 3.9 Effect of different sugars on solubility of 6% SoyComil K pH6.5 at 70°C for
30min ....................................................................................................................................69
Figure 3.10 Effect of different sugars on solubility of 6% SoyComil K pH6.5 at 100°C for
10min ....................................................................................................................................70
Figure 3.11 Availability of free amino groups of SoyComil K 6% pH9 treated at 75ºC for
10min with different sugars ..................................................................................................71
Figure 3.12 Effect of enzymes on solubility of 6% SoyComil K . SoyComil K was mixed
with enzymes at optimum pH, temperature and time for each one, and then adjusted to pH
9 and heated to 80°C for 10 min ..........................................................................................72
Figure 3.13 Effect of mixing time with α-amylase on solubility of 6% SoyComil K.
SoyComil K was mixed with α-amylase at optimum pH and temperature then adjust pH to
9 and heated at different temperature for 1h.........................................................................73
Figure 3.14 Effect of proteinase K on solubility of 6% SoyComil K. SoyComil K was
mixed with proteinase K at optimum pH (7.5) and temperature (37°C) then adjust pH to 9
and heated at different temperature for 1h............................................................................74
Figure 3.15 Particle size profile of heat treated 6% SoyComil K pH 9 dissolved in different
buffers (reduction in particle size that should reflect the molecular forces contributing to
maintenance of protein structure) .........................................................................................75
Figure 3.16 Effect of pH, protein concentration and heat treatment on SH groups of
SoyComil K ..........................................................................................................................76
Figure 3.17 Effect of different treatments of SoyComil K on the average droplet size of
SoyComil K emulsions. ........................................................................................................79
Figure 3.18 Effect of different treatments of SoyComil K on the average droplet size of
SoyComil K emulsions at different times.............................................................................80
Figure 3.19 Effect of heat treatment of SoyComil K on emulsion stability after 30 days ...81
Figure 3.20 Effect of heat treatment of SoyComil K in the presence of glucose on emulsion
stability after 30 days ............................................................................................................82
xvii
Figure 3.21 Effect of α-amylase treatment followed by heat treatment of SoyComil K on
emulsion stability after 30 days ............................................................................................83
Figure 3.22 Effect of protease treatment followed by heat treatment of SoyComil K on
emulsion stability after 30 days ............................................................................................84
Figure 3.23 Effect of heat treatment of SoyComil K on emulsion viscosity.......................86
Figure 3.24 Effect of heat treatment of SoyComil K in the presence and absence of glucose
on emulsion viscosity............................................................................................................87
Figure 3.25 Effect of α-amylase treatment followed by heat treatment of SoyComil K on
emulsion viscosity.................................................................................................................88
Figure 3.26 Effect of proteinase treatment followed by heat treatment of SoyComil K on
emulsion viscosity.................................................................................................................89
Figure 3.27. SoyComil K (6%), pH 7, emulsified with 30% sunflower oil and
homogenized at 500bar at room temperature (22± 3°C). .....................................................90
Figure 3.28 SoyComil K (6%), pH11 heated to 100°C for 10 min, emulsified with 30%
sunflower oil at pH7 and homogenized at 500bar at room temperature (22± 3°C)..............91
Figure 3.29 SoyComil K (6%) mixed with 10% glucose, pH 7, emulsified with 30%
sunflower oil then homogenized at 500bar at room temperature (22± 3°C). .......................92
Figure 3.30 SoyComil K (6%) mixed with 10% glucose (heated to 100°C for10 min pH11)
then adjust pH7 and emulsified with 30% sunflower oil and homogenized at 500 bar at
room temperature (22± 3°C).................................................................................................93
.Figure 3.31 SoyComil K (6%) K treated by α-amylase for 6hs then adjusts pH7 and
emulsified with 30% sunflower oil at room temperature then homogenized at 500 bar at
room temperature (22± 3°C).................................................................................................94
Figure 3.32 SoyComil K (6%) treated by α-amylase for 6hs, followed by adjustment to
pH11 and heated to 100°C for10 min, then re-adjustment of pH7 and emulsified with 30%
sunflower oil then homogenized at 500 bar at room temperature (22± 3°C). ......................95
Figure 3.33 SoyComil K (6%) treated by proteinase for 6hs then adjust pH7 and emulsified
with 30% sunflower oil at room temperature then homogenized at 500 bar at room
temperature (22± 3°C). .........................................................................................................96
Figure 3.34 SoyComil K (6%) treated by proteinase for 6hs, followed by adjustment to
pH11 and heated to 100°C for10 min, then re-adjustment of pH7 and emulsified with 30%
sunflower oil then homogenized at 500 bar at room temperature (22± 3°C). ......................97

xviii
Figure 4.1 Particle size profile of 6% soy protein isolate pH9 dispersion treated with
different reagents ................................................................................................................117
Figure 4.2 Available amino groups of SPI heated (95°C for 30min) in the presence of
glucose or polysaccharides .................................................................................................118
Figure 4.3 Effect of heat treatment of SPI on oil droplets size of 3% oil emulsion pH 7 ..120
Figure 4.4 Effect of ultra high-pressure homogenization on droplets size distribution of soy
protein isolates emulsions...................................................................................................121
Figure 4.5 Oil droplet size of non-homogenised emulsions made from SPI in the presence
of glucose or polysaccharides or glucose combined with polysaccharides ........................122
Figure 4.6 Oil droplet size of homogenised emulsions made from SPI heat treated in the
presence of glucose or polysaccharides or glucose combined with polysaccharides .........123
Figure 4. 7 A. Yogurt of heated SPI (control), homogenised. ............................................133
Figure 4. 7 B. Yogurt from heated SPI pH 7, mixed with 0.5% pectin and 11% glucose,
emulsified with 3% sunflower oil followed by homogenization and acidification ............134
Figure 4.7 C Yogurt from non heated SPI pH 7, mixed with 0.5% pectin and 11% glucose,
emulsified with 3% sunflower oil followed by homogenization and acidification ............135
Figure 4.7 D Yogurt of heated SPI pH 7, mixed with 0.5% carrageenan and 11% glucose,
emulsified with 3% sunflower oil, homogenization and acidified .....................................136
Figure 4.7 E Yogurt of non-heated SPI pH 7, mixed with 0.5% carrageenan and 11%
glucose, emulsified with 3% sunflower oil, homogenization and acidified. ......................137
Figure 4.8 Flow diagrams proposed process for manufacture of a high quality yoghurt ...144
Figure 5.1 – Kinetic plots for soy-protein-stabilised emulsion made at pH 4.5 with varied
concentrations of protein and heated at 100 0C for different time. .....................................148
(a) 0.75 (w/v)% soy protein; (b) 1.5(w/v)% soy protein; (c) 2.25(w/v)% soy protein; (d)
3(w/v)% soy protein............................................................................................................148
Figure 5.2 - Plot of rate constant for the heat-induced changes in soy protein stabilised
emulsions heated at 100 oC for 3min as a function of pH. Protein concentration = 3 (w/v)
%. ........................................................................................................................................149
Figure 5.3 – Plot of apparent reaction rate constant for heat-induced destabilization of SPI
emulsions (pH4.5, 20 (w/v)% sunflower oil) as a function of SPI concentration. The
emulsions were destabilized by heating at various temperatures. ......................................150
xix
Figure 5.4 – Plot of apparent reaction rate constant for heat-induced destabilization of WPC
emulsions (pH4.5, 20 (w/v) % sunflower oil) as a function of WPC concentration. The
emulsions were destabilized by heating at various temperatures. ......................................151
Figure 5.5– Arrhenius plots for SPI emulsions (pH 4.5, 20wt% sunflower oil). ...............152
Figure 5.6 Arrhenius plots for WPC emulsions (pH 4.5, 20 (w/v)% sunflower oil). .........153
Figure 5.7 - Plot of k1.5 for heat-induced destabilization of mixed SPI:WPC emulsions
(pH4.5, 20(w/v)% sunflower oil, total protein content 3 (w/v)% as a function of SPI: WPC
ratio. The emulsions were destabilized by heating at various temperatures.......................154
Figure 5.8 – Arrhenius plot for mixed SPI:WPC emulsions. .............................................155
Figure 5.9 – Effect of polysaccharides on the heat stability of SPC emulsions. ................156
xx
Abbreviations:
ANS: 1-anilino-8-naphtalene sulfonate
AOAC: The Association of Official Analytical Chemists
Bis-Tris: Bis(2-hydroxyethyl) imino-tris (hydroxymethyl) methane-HCl
BSA: Bovine Serum Albumin
CSLM: Confocal scanning laser microscopy
Cys: Cysteine
dH2O: Distilled H2O
DSC: Differential scanning calorimetry
DTNB - 5,5′-dithio-bis(2-nitrobenzoic acid)
EDTA: Ethylenediaminetetraacetic acid
GDL: Glucono-δ-lactone
M: Molarity
MW: Molecular Weight
OPA: O-phthaldiadehyde
O/W: Oil in Water emulsion
PAGE: Polyacrylamide Gel Electrophoresis
pH: Power of Hydrogen
pI: Isoelectric point
α-lac: α-Lactoalbumin
β-lac: β-Lactoglobulin
RI: Refractive Index
RT: Room temperature (22 ± 3°C)
Rpm: Rotations per Minute
SDS: Sodium Dodecyl Sulfate
SH: Sulfhydryl group
SPC: Soy protein concentrates
SPI: Soy protein isolates
TCA: Trichloroacetic Acid
TPA: Texture profile analysis
WHC: Water-holding capacity
WPC – Whey Protein concentrate

1
Chapter One
General introduction

2
General Introduction 1.1 Introduction
The soybeans family Leguminosae is a native crop of eastern Asia. Domestication
of the soybean is believed to have originated in the northern and central regions of China as
long as 5000 years ago, with the first documented use of the plant by a Chinese emperor.
Soybean cultivation spread throughout Japan, Korea, and Southeast Asia, although the
USA and Brazil account today for most of the soybean production of the world. Soybeans
are, primarily, an industrial crop, cultivated for oil and protein (Berk, 1992). As the world
population expands, there will be a greater pressure for the consumption of plant products
(Kinsella, 1979). Today soybeans are one of the most economical and valuable agricultural
commodities because of its unique chemical composition and multiple uses as food, feed
and industrial materials. Soybeans have the highest protein content among cereal and other
legume species, and the second highest oil content among all food legumes. Soy protein
contains most the essential amino acids, most of which are present in amounts that closely
match those required for humans or animals. Furthermore, soybeans also contain many
biological active components, including isoflavones, lecithin, saponins, oligosaccharides,
and phytosterols. Many of these components act as anti-cancer agents and antioxidants
(Liu, 2004). Currently there is considerable and increasing interest in the health benefits of
soy-containing foods, in particular in the role of soy protein in lowering the incidence of
certain cancers. It has been suggested that the high intakes of soy may explain, in part, the
lower incidence of certain cancers in Asian countries, where soy consumption is high, when
compared to Europe or America (Davies et al., 1998). Due to its nutritional value and low
cost, currently, soy protein is the largest commercially available vegetable protein in the
world, and it is an important alternative to existing animal derived proteins. Soy proteins
are also of particular interest because they impart high functionality in food systems, being
used to obtain better quality products. Because of these advantages (economic, nutritive,
dietetics, etc.) it is important to develop new soy protein foods or a range of new food
formulations with new textures (Molina et al., 2002).

3
1.2 Soybean structure and composition.
Soybeans vary from almost spherical to elongated and flat. The colour of the seed
may be yellow, green, and brown or black, comprising of about 8% hull (seed coat), 90%
cotyledon, and 2% hypocotyl (Berk, 1992).
Figure 1.1. Chemical composition of soybean (Kuen , 2004)
1.3 Essential amino acid composition of soybean
The structural units of proteins are amino acids, which are necessary for growing
and maintenance of human body. Soy protein contains all the essential amino acids except
methionine and tryptophan (Russel, 2004). Soy proteins are high in lysine and thus are
useful supplements for cereals, which tend to be low in this amino acid. On the other hand,
methionine is the first limiting amino acid in soy proteins and this limitation must be

4
considered when the proteins are added for nutritional purpose rather than simply for
functionality (Wolf, 1970 and Morita et al 1997).
1.4 Components of soy protein
Soy protein contain a broad range of components that is classified in terms of
Svedburg sedimentation units, S. The smaller the Svedburg number, the smaller the protein
molecular weight (Kuen, 2004). Soy protein may be grouped into four categories as
follows:
1.4.1 2S fraction (whey protein)
This fraction has been reported to contain 15-22% of soy protein with molecular
weight ranging from 8 to 21.5 KDa. It consists of number of enzymes, which are trypsin
inhibitors and cytochromes (Wolf, 1970; Tay et al, 2005). The 2S fraction is a highly
symmetrical protein composed of a number of tight rings. These rings are held together by
7 disulfide bonds (Kuen, 2004). The 2S fraction exhibits good foaming capacity and water
holding ability (Tay et al., 2006).
1.4.2 7S fraction (β-conglycinin)
β-Conglycinin (7S) is one of the dominant storage proteins of soybean seeds,
constituting about 30% of total soy protein. It is a trimeric protein with molecular weight of
180 – 210 KDa (Maruyama et al., 2002; Wolf, 1970). The 7S fraction contains
approximately 85.06-90.17% protein, 1.38-1.96% fat, 4.8-5.91% ash, 1.82-8.81%
carbohydrates and traces of fiber (Khatib et al, 2002). The protein is composed of three
subunits, α (~67 KDa), α' (~71 KDa), and β (~ 50KDa). Several combinations of these
subunits (α' β2, α β2, α α'β, α 2α', α3 and β) are known to exist and provide heterogeneity
(Maruyama et al, 2002; Rickert et al., 2004). The α and α' subunits are composed of
extension regions and core regions and have acidic properties, whereas the ß subunit
consists of only the core region (Maruyama et al, 2002; Rickert et al., 2004). The thermal
solubilities of individual subunits are different indicating that that they exhibit different
physicochemical functions (Maruyama et al, 1999). Β-conglycinin has many properties,
one of it is its ability to form disulfide – linked polymers, which contribute to insolubility
of soy protein. These polymers cause turbidity and increased viscosity of soy protein

5
dispersions. Depolymerization can be achieved by adding of mercaptoethanol. A second
property is sensitivity to ionic environment; it undergoes association- dissociation reactions
with change in ionic strength.
Figure 1.2. The ribbon diagram of native soy β-conglycinin (Barać et al., 2004)
1.4.3 11S fraction (glycinin)
Glycinin is one of the major constituents of soy protein representing ~ 35% of total
protein (Utsumi et al., 1987; Lakemond et al., 2000b and Tay et al., 2005). Native glycinin
is a heterogeneous oligomeric protein, the molecular mass of which varies between 340-
375 kDa. It is made up of six subunits, each consisting of a basic polypeptide (B-
polypeptide, MW 38 KDa) and acidic poly peptide (A- polypeptide, MW 20KDa), which
are connected by a single disulfide (SS) bond forming AB subunits (Utsumi et al.,1987;
Renkema et al.,2000; Petruccelli and Añón,, 1994 and Petruccelli and Añón, 1996). The
AB subunits associate into two hexagonal rings forming a hollow cylinder of 11 x 11 x 7.5
nm (Figure 1.3) (Martin et al., 2002). At ambient temperature and at pH 7.6, glycinin forms
hexameric complexes, whereas at pH 3.8 glycinin is mainly present as trimeric complexes
(Lakemond et al., 2000a). Glycinin contains extensive disulfide bonds, which contributes to

6
its insolubility. It undergoes association- dissociation reactions, with changes with ionic
strength. The quaternary structure of the 11S molecule is disrupted by high and low pH, by
high concentrations of urea, detergents, mercaptoethanol-urea mixtures and by
temperatures above 80°C (Wolf, 1970). The onset denaturation of glycinin is about 80°C at
neutral pH (Renkema and Van Vliet, 2002). Thermal aggregation of glycinin at 80°C is
mainly due to aggregation of the basic subunits after they have been thermally dissociated
from the oligomeric structure. This aggregation is prevented in the presence of the other
soy protein fractions. This is because of certain interactions between conglycinin and the
basic subunits of glycinin, which may lead to formation of soluble complexes (Damodaran
and Kinsella, 1982).
Figure 1. 3. Schematic drawing of the structure of glycinin (Martin et al., 2002)

7
Figure 1.4. The ribbon diagram of native soy glycinin (Adachi , 2003)
1.4.4 15S fraction
The 15 S is a minor component of soy protein (11%), with molecular weight of
506- 600 kDa. 15S either exists as a native protein in the seed or is an artefact formed
during isolation of the proteins (Wolf and Nelsen, 1996; Kuen, 2004). Conversion of 11S to
15S fraction occurs when 11S preparations are frozen and thawed or precipitated by
dialysis against water and freeze-dried (Wolf and Nelsen, 1996).
1.5 Commercial soy products
In industry, three different soy products are used: soy flours, soy concentrates and
soy isolates.
1.5.1 Soy flours
Soy flours are produced from soybean flakes by grinding and screening after or
before extracting the oil, with protein concentration from 40 to 54%. Soy flours vary in fat
content and particle size depending on different degrees of heat treatment and are less
refined than other soy forms used for human and animal consumption,. It can also be
8
obtained as lecithinated or re-fatted forms (Wolf, 1970 and Endres, 2001 and Olaoye et al.,
2006). Soy flours consist approximately of 6-8% moisture, 40-54% protein, 0.5-1% fat, 30-
32% carbohydrate and 5.0-6.0% ash (Endres, 2001). Flour carbohydrates consist of a
soluble fraction: oligosaccharides (sucrose, stachyose and raffinose), and an insoluble
fraction: cellulose, hemicellulose, pectin and trace amount of starch (Wolf, 1970 and Liu,
2004).
1.5.2 Soy protein concentrates
Soy protein concentrate (SPC) contains approximately 5% moisture, > 66%
protein, <1% fat, 23% carbohydrate, and 5% ash (Stauffer, 2002). Traditionally SPC is
obtained from defatted soy flakes or flour. SPC is obtained by removing soluble sugars and
oligosaccharides (short polymers of several monosaccharides joined by glycosidic bonds;
Nelson, 2008) and minor constituents from the defatted flakes using aqueous alcohol or a
dilute acid solution in the pH range of 4.0-4.8 as shown in Figure 1.5 (Wang et al., 2004
and Alibhai et al., 2006). The functional properties such as solubility and water binding
ability of commercial SPC’s vary greatly, and are determined by their individual extraction
procedures. In this study, the properties of a particularly insoluble commercially available
SPC, Soycomil K, were studied. It is manufactured and sold as animal feed by Archer
Daniels Midland Company, Netherlands (ADM). Its manufacturing process is shown in
Figure 1.6.

9
Figure 1.5. Flow chart for the production of soy protein concentrates (SPC)
(Wang et al., 2004)

10
Figure 1.6 Procedure for producing SoyComil K (Archer Daniels Midland
company, Netherlands “ADM” 2007) (ADM company 2006)
1.5.3 Soy protein isolates
Soy protein isolates (SPI) contain approximately 5% moisture, 91% protein, ~ 0%
fat, ~ 0% carbohydrate, and 4% ash (Stauffer, 2002). Traditionally, SPI is obtained from
defatted soy flakes or flour by extracting the soy flakes/flour using a dilute alkali (pH8-9)
with subsequent centrifugation for the removal of the insoluble materials, producing soy
protein, oligosaccharides and minerals. Acidification of the soy dispersion to pH 4.5 using
a food grade acid (sulfuric acid, phosphoric acid or hydrochloric acid) causes the selective

11
recovery of the proteins due to their precipitation and concentration into a curd. Subsequent
washing of the curd for the removal of non-protein solubles, neutralization (pH 7) and
spray drying produces SPI as shown in Figure 1.7 ( Alibhai et al., 2006 and L’hocine et al.,
(2006).
Figure 1.7 Flow chart for the production of soy protein isolates (SPI ) (L’hocine et al.,
2006).
12
1.6 Soy protein denaturation and associated molecular interactions
Soy protein structure can be modified by different treatments to improve specific
functional properties. It has been demonstrated that the functionality depends on the degree
of dissociation, denaturation, and aggregation of glycinin and β-conglycinin fractions
(Sorgentini et al, 1995). The onset denaturation temperature β-conglycinin is 70°C, while
that of glycinin is 80°C at neutral pH (Renkema and Van Vliet, 2002). Protein denaturation
is any change of original native structure without alternation in sequence of amino acids
(Adler-Nissen, 1976). Denaturation occurs because the bonding interactions responsible for
the secondary structure and tertiary structure are disrupted; these include electrostatic,
hydrophobic interactions and hydrogen bonding, covalent bonds and ionic bonds (Cramp,
2007). Protein denaturation can be measured by differential scanning calorimetry (DSC),
which has been widely used to characterize the thermal properties of food proteins,
including heat-induced denaturation (Tang et al., 2006a).
The structure of a protein molecules or entities is determined by the type and strength of
molecular forces that operate within it; such forces can be divided into two broad
categories: intra- and inter-molecular forces. Intra-molecular forces operate within the
fundamental units of a protein molecule (ionic interaction, hydrophobic interaction,
hydrogen bonds, covalent bond, and Van der Waal forces). Inter-molecular forces operate
between, rather than within, the protein molecules (protein- protein interactions)
(Boonyaratanakornkit, 2002 and Kildahl, 2008).
1.6.1 Electrostatic bonds
Electrostatic interactions are known to play a crucial role in protein structure and
function (Roy and Taraphder, 2007). Electrostatic interactions are collectively known as
Van der Waals forces and include dipole-dipole interactions, London dispersion forces, and
hydrogen-bonding. These forces are less than 1/6 as strong as covalent or ionic bonds
(Cramp, 2007). Estimation of electrostatic bonds is the heart of any theoretical modeling of
proteins. The electrostatic interaction between proteins or peptides can be reduced by
addition of 0.3M NaCl; the counter- ions of NaCl interrupt electrostatic interactions leading
to the breakdown of electrostatic bonds (Damianou and Kiosseoglou, 2006; Zhong et al.,
2006).

13
Figure 1.8. London dispersion forces-induced dipoles (Cramp, 2007).
1.6.2 Ionic bonds
Ionic bonds are very strong and occur in proteins when salts are present. These are
created by the attraction between the positive and negative charges on salts (Na+, Cl
-, K
+,
Ca2+
, and so on e.g. Na+ ― Cl-). The charges created by salts can affect on functional
properties of soy protein (Cramp, 2007).
1.6.3 Covalent bonds
Covalent linkages of amino acids in protein are largely limited to the peptide
bonds. The most common exception to this rule is the disulfide bond, a sulfur- sullfur
chemical bond that results from an oxidative process that links nonadjacent (in most cases)
cysteines of a protein (Kadokura et al., 2003). Disulfide bonds are covalent bonds that may
break and form under appropriate thermal conditions, such as the disulfide bonds between
11S acidic and basic subunits in soy protein (Figure 1.9) (Cramp, 2007). Identification of
covalent (disulfide) bonds can be done by dispersing protein samples in solvent containing
reagent of 0.2M 2-Mercaptoethanol, which reduces disulfide bonds to sulfhydryl groups
(Zhong et al., 2006).
Figure 1.9 Covalent disulfide bonds between two cysteine residues (Cramp, 2007).

14
1.6.4 Hydrophobic bonds
Hydrophobicity is defined as the molecular driving force behind many important
biological processes, such as protein folding (Li et al., 2007). Hydrophobic interactions are
due to repulsion of water by hydrophobic molecules (Cramp, 2007). Identification of
hydrophobic bonds can be done by dispersing protein samples in solvent containing 8M
urea. Zou et al., (1998) reported that urea binds to amide groups through hydrogen bonds,
decreasing the hydrophobic effect through dehydration of protein molecules.
1.7 Properties of soy bean proteins in food systems
Thousands of tonnes of soy proteins are used world-wide as a functional ingredient
in the food industry. The main functional properties of soy proteins are hydrating capacity,
solubility, colloidal stability, gelation, emulsification, foaming and adhesion/cohesion. In
addition it is applied as a fat substitute in meat, fish, milk, cereal-based products and infant
formulation (Martins and Netto, 2006). Soy proteins in their various forms have functional
properties that make them useful in food systems (Table 1.1).

15
Table 1.1. Functional properties of soybean properties in food systems (Wolf,
1970)
Functional property Soy form Food system
Emulsification
All forms Cakes, potages, frankfurters, bologna,
sausages and breads
Fat absorption All forms Bologna, frankfurters, sausages, and
meat burgers
Stabilization
All forms Frozen desserts, bologna, sausages,
potages and frankfurters
Water absorption
Flours and
concentrates
Confections, breads, cakes and
macaroni.
Texture
Viscosity
Gelation
All forms
Isolates
Potages, gravies and chilli.
Imitation minced meats.
Chip and chunk formation Flours Imitation meats.
Fiber formation Isolates Imitation meats.
Dough formation All forms Baked goods.
Film formation Isolates Frankfurters and bologna.
Cohesion
Flours and
concentrates
Baked goods, simulated meats and
macaroni.
Adhesion concentrates and
isolates
Rolls, lunch meats, meat patties and
sausages.
Elasticity Isolates Baked goods and simulated meats.
Color control
Bleaching
Browning
Aeration
Flours
Flours
Isolates
Breads
Breads, pancakes and waffles.
Whipped toppings, chiffon mixes and
confections.

16
1.7.1 Soy protein solubility
Soy protein solubility is probably its most important property in foods, not only
because soy ingredients must form stable dispersions when incorporated into beverages and
other food systems, but also because other functionalities, such as gelling, emulsifying and
foaming, are closely associated with solubility (Wang and Johnson, 2001). Solubility is the
amount of a solute that can be dissolved in solvent. Thermodynamically, the protein
solubility is the protein concentration in the solvent in a sample or two-phase system in
balance state. Mathematically, the solubility degree of a protein is the amount of protein
present in liquid phase in relation to the total amount of protein in liquid and solid phases
(Hall, 1996). The protein solubility also can be defined as a certain quantity of the protein
retained in the supernatant after the dispersion has been centrifuged for a certain time
period (Pelegrine and Gasparetto, 2005). In biological samples proteins are present in their
native state. Solubility refers to proteins that are not aggregated or are present in aggregates
too small to sediment upon centrifugation (Renkema et al., 2000). Often proteins in their
native state are not soluble, and should be denaturated to help solubilisation (Berklemn et
al, 2004). Knowing the solubility profile of soy proteins in various environmental
conditions is important to the industry in evaluating other physicochemical and functional
properties in order to screen them for potential applications. Solubilities of soy products are
highly dependent on the physicochemical states of protein molecules, which are either
favourably or adversely affected by heating, drying, and other processing treatments during
their manufacture and storage. This property is therefore one of the most widely used
characteristics of protein products. The solubility characteristics of soy protein products can
be influenced by a wide range of environmental conditions, including pH, ionic strength,
and temperature (Lee et al., 2003).
1.7.1.1 Effect of heat treatment on soy protein solubility
Thermal treatment is the oldest and most frequently used method for modification
soy proteins. The purposes of the thermal modification of soy proteins are different.
Thermal treatments reduce protease inhibitor activity, eliminate lipoxygenase and volatile
compounds that induce undesirable flavours, and improve specific functional properties
(Barac et al., 2004). At higher temperatures some reactions may take place, such as
breakdown of S-S bonds with release of H2S, release of NH3 from amide groups,
dissociation of subunits and /or breakdown of these subunits into compounds of small

17
molecular weights, which may be responsible for the enhanced protein solubility
(Figure1.10) (Shimada and Cheftel, 1988). Heating of soy protein probably causes
dissociation of quaternary structure, releasing smaller peptides and facilitating their
solubilisation (Yamagishi et al., 1983; Rangavajhyala et al., 1997).
Figure 1.10 Schematic subunit interactions between 7S and 11S globulin on
heating (Yamagishi et al., 1983)
1.7.1.2 Effect of pH on soy protein solubility
The pH of the solution affects the nature and the distribution of the protein’s net
charge. Generally, the proteins are more soluble in low (acid) or high (alkaline) pH values
because of the excess of charges of the same sign, producing repulsive forces among the
molecules and, consequently, contributing to its solubility (Pelegrine and Gasparetto,
2005). Protein usually has the least solubility at the isoelectric point (PI), here the
electrostatic repulsive forces are insufficient to prevent extensive aggregation and less
water interacts with the protein molecules (Malhotra and Coupland, 2004; Pelegrine and
18
Gasparetto, 2005). Molecular forces such as hydrophobic and electrostatic interactions can
be manipulated by pH to produce proteins with varying structural conformations and hence
functional properties such as solubility (Aluko and Yada, 1995). Under alkaline conditions,
some hydrogen bonds in protein molecules are broken, causing it to assume a configuration
somewhat more open than its original configuration, causing many buried peptide groups
and side chains to become exposed to solvent (Mirsky and Pauling, 1936).
1.7.1.3 Effect of protein concentration on soy protein solubility
It is often difficult to increase protein concentration up to a high level without
causing precipitation or aggregation (Golovanov et al., 2004). Protein concentration has a
significant effect on solubility, there is greater probability of protein-protein association if
the protein concentration is high (Ranadheera, 2000). As the concentration of protein
increases, its solubility decreases, probably caused by increased protein-protein interaction,
causing an increase in the burial of charged groups (Pace et al., 2004; Wagner et al., 2000;
and Sorgentini et al., 1995). When soy protein is at high concentration it will be
aggregated, while at lower concentrations various types of soluble complexes may form
(Roesch, and Corredig, 2005).
1.7.1.4 Effect of salt (NaCl) on soy protein solubility
Addition of salt to water alters the hydrogen bond length and the chemical
structure of the liquid. Change in salt concentration produce a gradient in hydrogen bond
strength as a function of salt concentration that varies from salt to salt (Ferreira-Machado et
al., 2007). The effect of salt concentration on protein solubility depends on a salting-in
region at low salt concentrations and a salting-out region at high ionic-strength solutions
(Curtis et al., 1998). The increase of salt concentration reduces the solubility (salting out)
resulting from competition between the protein and saline ions for binding to water
molecules. Consequently, the water in the protein neighbourhood will be removed
increasing the protein-protein interaction, thus leading to aggregation of the protein
molecules, followed by precipitation (Ferreira Machado et al., 2007). At low salt
concentration solubility of protein increase, due to salting in phenomenon by which saline
ions interact with groups of opposite protein charges to form a double layer of ionic groups,
thereby reducing the electrostatic interaction among the protein molecules and increasing
their solubilisation (Hall, 1996).
19
1.7.1.5 Effect of sugars (monosaccharide, oligosaccharides and polysaccharides) on
soy protein solubility
The significance of the sugar and protein interaction in food science are of
fundamental importance to the quality of food products through their effect on properties of
both aqueous phase and proteins in particular (Semenova et al., 2002). Sugars influence the
heat induced denaturation of proteins, which can be divided in two categories. Firstly,
sugars can act to stabilize proteins against heat denaturation by increasing the onset
temperature of heat denaturation. The second effect of sugars on protein is covalent
bonding of reducing sugars with available amino groups of amino acids protein through
Maillard reaction (Semenova et al., 2002; Gu et al., 2008), as illustrated in Figures 1. 11
and 1.12. The Maillard reaction was first observed by Louis Maillard in 1912, which results
in formation of dark brown colors, flavors, and aromas. Non-enzymatic browning reactions
are desirable in foods such as cookies and cakes. However, in other food systems there is a
concern with the formation of carcinogens or the loss of the essential amino acid, lysine.
Maillard reactions usually occur during processing and storage of foods (Morales and Van
Boekel, 1998; Cramp, 2007).
The Maillard reaction is regulated by water activity, type of amino acids available,
and type of sugars, oligosaccharides or polysaccharides present (Davies et al, 1998).
Reducing sugars can consist of mono- or disaccharides that contain aldehyde or ketone
reactive groups; Berg et al., 2007). Different sugars exhibit different rates of reactions and
reactivity depending on how fast the ring opens (Cramp, 2007). The Maillard reaction
could also occur with oligosaccharides or polysaccharides that contain reducing groups.
Oligosaccharides are relatively low molecular weight short polymers of several
monosaccharides (<20) joined by glycosidic bonds (Nelson, 2008), on the other hand,
polysaccharides are high molecular weight polymers of monosaccharides (>20), resulting in
branched polymeric structures; Berg et al., 2007). Examples of polysaccharides are starch,
pectin, gums. Some polysaccharides contain one type of monosaccharide, this called
homopolysaccharides (e.g., starch, cellulose and glycogen) and other contain more than one
type of monomer are known as heteropolysaccharides (e.g., pectin, hemicellulose and
gums) (Cui, 2005). Carbohydrates (oilgosaccharides and polysaccharides) can be
hydrolysed into smaller fragments by enzymes (α-amylase, cellulose, hemicellulase,
pectinase). Starch may be hydrolysed by amylase, pectin by pectinase, cellulose by

20
cellulose, and hemicelluose by hemicellulase (Kashyap et al., 2001; Kaya et al., 1996;
Mussatto et al., 2008; and Tester and Sommerville, 2001).
Figure 1.11 Maillard reactions for protein and reducing sugar combinations
around pH 7, modified from Cramp (2007).

21
Figure 1.12 Schematic presentation of the binding mode of a polysaccharide
with a protein through the Maillard reaction (A) and the resulting protein-
polysaccharide conjugate (B) (Kato, 2002).
1.7.1.6 Effect of enzymes on soy protein solubility
The expanded use of enzymes to modify protein functional properties has great
promise for the food industry. The major advantage of using enzymes compared to other
agents include their specificity, their effectiveness at low concentration and, under mild
conditions, their general safety, thus eliminating the necessity for removing them from
22
finished products. In addition, enzymatic hydrolysis of proteins does not reduce their
nutritional value (Bernardi Don et al., 1991). Enzymatic hydrolysis can be responsible for
(1) a decrease in hydrolysate molecular weight (2) increase in ionisable group number, and
(3) exposure of previously concealed hydrophobic groups (Lamsal et al., 2007). Proteinase
can increase solubility of soy protein by reduction of its secondary structure and to
enzymatic release of smaller polypeptide units from protein (Kong et al., 2008). Treatment
of soy protein concentrate with carbohydrate-hydrolysis enzymes (pectinase, cellulase and
hemicellulase, α-amylase) can affect the solubility of soy protein (Abdel-Aziz et al., 1997).
This is not surprising since soy protein concentrate contains approximately 23%
carbohydrates consisting of a soluble (soluble starch and oligosaccharides,
monosaccharides) and an insoluble fraction (pectin, cellulose, hemicellulose and insoluble
starch and oligosaccharides; Blaney et al., 1996; Nakamura et al, 2001; Liu, 2004 and
Peisker, 2001).
1.8 Hydrophobicity of soy protein
Hydrophobicity is usually understood as measuring the relative tendency of a
protein to prefer a non-aqueous to an aqueous environment. It is also defined as a measure
of the tendency of proteins to aggregate in solution. Both measures express some kind of
phobia of the analytes towards the aqueous medium. Hydrophobicity is one the most
important structure-related factors influencing functional properties of proteins and surface
hydrophobicity is significantly correlated with protein gelation properties. The fluoresceient
probe (with 1-anilino 8- naphthalene sulfonate “ANS”) method is widely adopted in
researches to determine the surface hydrophobicity due to simplicity and high sensitivity.
Wanger et al., (2000) observed that the lower the solubility, the lower the surface
hydrophobicity exposed by the proteins. This could be explained in two ways: (a) the
protein species undergoing aggregation are more hydrophobic, so that only the hydrophilic
ones remain soluble; and (b) as the proteins aggregate they hide or occlude the hydrophobic
zones, leaving part of the proteins as soluble aggregates of low surface hydrophobicity.
Hydrophobicity is a major factor that controls soy protein solubility. Nakai, (1983)
observed an increase in the hydrophobicity upon heating of proteins, indicating unfolding
of the molecules.

23
1.9 Water holding capacity
Water holding capacity (WHC) is a quantitative indication of amount of water
retained within a protein mixture under defined conditions (Huang and Kinsella, 1986).
Kneifel et al., (1991) defined it as the ability of a food structure to prevent water from
being released from the three-dimensional structure. Generally the water held in a protein
structure can be divided into two types: 1) the part bound to the molecule that is no longer
available as a solvent and 2) the other part trapped in the protein matrix or a corresponding
co-matrix (polysaccharide, fat). The first type can be regarded as absorbed water and the
second as retained water. In most cases, the water-holding capacity of a protein matrix is
determined by both the amount of absorbed and retained water. The absorbed water, which
is more tightly bound to the protein molecules, will be considered first. This type of water
is largely influenced by the physicochemical parameters that directly affect the proteins and
the surface properties of the protein molecules that interact with the dissolving solution.
This means that the water holding capacity depends not only on pore and capillary size but
also on the charges of the protein molecules (hydrophobic interactions, hydrogen bonds, S-
S bonds, acids, bases) as well as on Van der Waals, forces (Kneifel et al., 1991). Water
holding capacity is influenced by several parameters such as pH, temperature, protein size,
shape, lipid and carbohydrate associated with protein, the hydrophilic-hydrophobic balance
of amino acids and the presence or absence of surfactant (Han and Khan, 1990). Addition
of polysaccharides to protein could increase water holding capacity through gelation by
increasing the gel network, with smaller pores and greater capillary forces (Hua et al.,
2003; Maltais et al., 2005; Yamamoto and Cunha, 2007), and also by their ability to bind
water with their hydroxyl groups (Uresti et al., 2003). Glycation of SPI increased its water
holding capacity, due to increase in net charge via Maillard reaction (Gu et al., 2008). This
could also have been due to higher concentration of high molecular weight polymers taking
part in the gel net work and resulting in better entrapment of water in the glycated protein
gels (Gu et al., 2008).
1.10 Emulsifying ability of soy protein
Commercial preparations of soy protein may cause physical and chemical changes
that in turn affect the proteins functional properties. Consequently, different commercial
soy varies widely in their emulsifying properties reflecting their difference in composition,
conformation, net charge and structure. However, many factors in the surrounding

24
environment such as pH, ionic strength, temperature and presence of other components
affect functional behaviour, making it very difficult to predict soy protein emulsifying
ability in a given system (Elizalde et al., 1996).
1.10.1 Properties of soy protein emulsions
An emulsion is formed from one immiscible phase distributed as small droplets
in the matrix of a second phase by means of an emulsifying agent. The dispersed phase is
the discontinuous phase and the dispersion medium is the continuous phase. Emulsions are
characterized by the presence of at least one polar hydrophilic liquid and at least one
lipophilic liquid (Al-Malah et al., 2000). The two basic types of emulsions are dispersions
of a lipophilic or oil phase in a hydrophilic or watery phase or versa. With oil and water
being the most common liquids for the preparation of food emulsions, these basic types of
emulsions are referred to as oil-in-water (O/W) emulsions and water-in-oil (W/O)
emulsions, respectively. More complex types consist of three or more phases, which can be
achieved by e.g. dispersing a W/O-emulsion into a second watery phase, leading to a water-
in-oil-in-water (W/O/W) (Schubert et al., 2006). The basic types of emulsions are depicted
in Figure 1.13. Emulsions are characterized by having a large interfacial area between the
liquid phases, allowing a faster exchange process or chemical reaction to take place at the
interface. Emulsions form the basic structure of many foods, pharmaceuticals, cosmetics,
laundry and cleaning agents and lubricants (Al-Malah et al., 2000). Emulsions uses can be
classified into two different types. Some emulsions are end products which should remain
stable towards creaming and coalescence during their production and shelf-life such as
mayonnaise and salad dressings. Emulsion can also be used as ingredients, which
participate in the formation of more complex products such as yogurts, gelled systems, and
ice creams. The behaviour of food emulsions is determined by the three phases of the
system: the fat or oil phase, the interfacial phase and the aqueous phase.
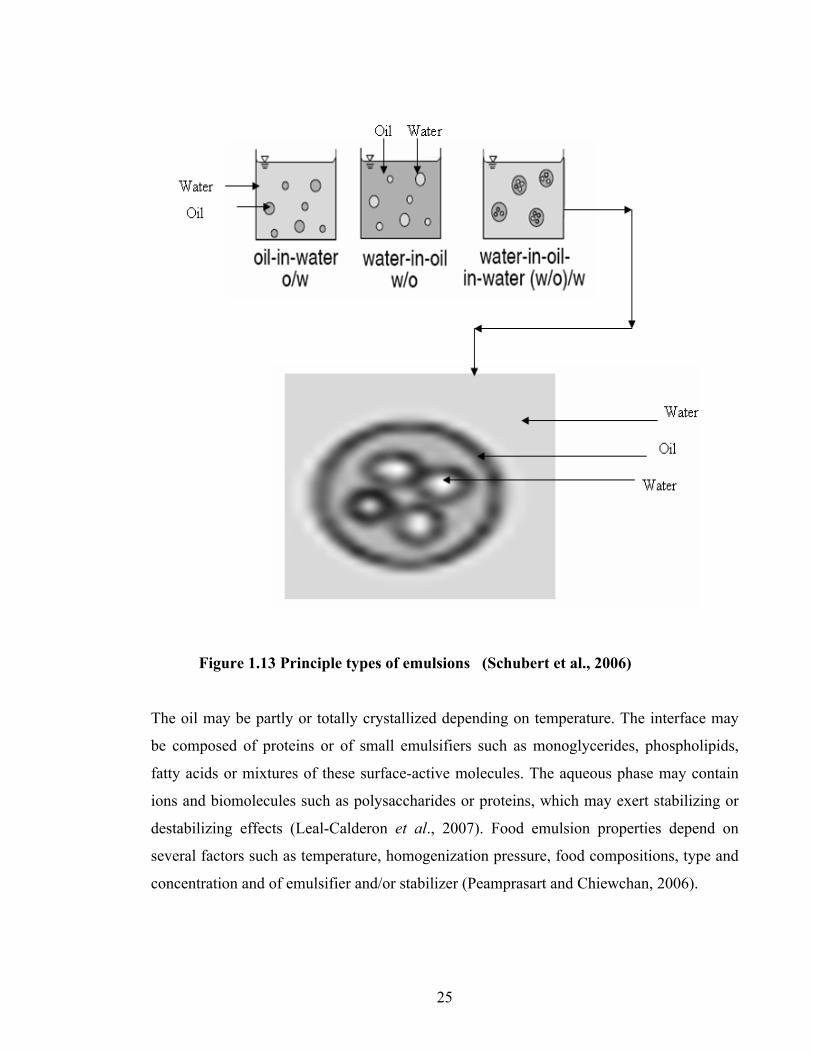
25
Figure 1.13 Principle types of emulsions (Schubert et al., 2006)
The oil may be partly or totally crystallized depending on temperature. The interface may
be composed of proteins or of small emulsifiers such as monoglycerides, phospholipids,
fatty acids or mixtures of these surface-active molecules. The aqueous phase may contain
ions and biomolecules such as polysaccharides or proteins, which may exert stabilizing or
destabilizing effects (Leal-Calderon et al., 2007). Food emulsion properties depend on
several factors such as temperature, homogenization pressure, food compositions, type and
concentration and of emulsifier and/or stabilizer (Peamprasart and Chiewchan, 2006).

26
1.10.2 Mechanism of emulsion formation
Globular proteins such as soy and whey protein are used as emulsifiers in
number of commercial products because of their ability to facilitate emulsion formation and
enhance long-term emulsion stability. Globular proteins rapidly adsorb to an oil-water
interface formed when an aqueous phase and oil phase are homogenized where they unfold
and facilitate droplet disruption because of the decrease in interfacial tension. These
conformational changes promote hydrophobic and electrostatic interactions, which cause
stabilization of viscoelastic protein film around oil droplets.
Figure 1.14 Surface-coated oil globule (Raikos, 2006)
Emulsifying proteins usually contain α-helical or random coiled structures in aqueous
solution and may lose or gain α-helical structure through interfacial adsorption (Annan, et
al., 2006). They also help to prevent droplet coalescence within the homogenizer due to the
formation of a protective coating around the droplets. Adsorbed proteins can also improve
the long-term stability of oil-in-water emulsions by preventing droplet aggregation by
generating repulsive colloidal interactions between the droplets e.g., electrostatic and steric
repulsion (Chanasattru et al., 2007).

27
1.10.3 Emulsion stability
The formation of a food emulsion is dynamic, yet thermodynamically
unfavourable, process due to the increase in interfacial area following emulsification.
Hence, after enough time, any emulsion will collapse as the two phases attempt to minimize
contact area. There are five main mechanisms, which can contribute to emulsion instability:
(1) creaming; (2) flocculation; (3) Ostwald ripening; (4) (partial) coalescence; and (5) phase
inversion. Creaming (or settling) is due to density differences between two phases under the
influence of gravity, which leads to phase separation. Flocculation is best described as the
aggregation of particles due to weak attractive forces between colloids (Figure1. 15).
Ostwald ripening is the growth of larger droplets at the expense of smaller ones and is
related to the solubility gradient found between small and large droplets. Partial
coalescence is two colliding droplets which form single large droplet (Figure 1.15). Phase
inversion is where an oil-in-water (O/W) emulsion becomes water-in-oil (W/O) emulsion,
as during the churning of butter (Rousseau, 2000).
Figure 1.15 Schematic presentations of flocculation and coalescence (Cramp, 2007)
1.10.4 Factors that affect protein-stabilised emulsion properties
1.10.4.1 Effect of heat treatment
Heating an emulsion usually causes a reduction in the interfacial tension between
the oil and water phase, which would be expected to facilitate the production of small
droplets (Floury et al., 2000). In addition, heat treatment affects viscosity. The viscosity of
both oil and aqueous phase is temperature-dependent and decreases with increasing
temperature, which is expected to facilitate the production of small droplet. On the other

28
hand, temperature affects the rearrangement of the fat globules, which certainly would
modify the rheological properties of an emulsion (Peamprasart and Cheiewchan, 2006).
1.10.4.2 Effect of high-pressure homogenization
The most common applications of conventional homogenization are to form
stable fine emulsions and to disperse, mix and process colloidal products. The two major
mechanisms initiated during homogenization are intense turbulence and shear flow fields;
turbulence being the most predominant force in the emulsification process, which disrupts
the dispersed phase into small particles. Smaller fat droplets can be produced by increasing
the turbulence (higher homogenization pressure) and larger fat droplets can be produced by
reducing the turbulence (low homogenization pressure). Reducing the droplets size will
improve the shelf life of the products by reducing the creaming rate and by increasing the
surface area of the emulsifier to improve the coating ability (Gerung, 2005).
1.10.4.3 Effect of sugars (monosaccharide, oligosaccharides and polysaccharides in
aqueous phase
Many food products contain both oligosaccharides, polysaccharides and proteins.
In particular, mixtures of proteins and polysaccharides can be found among the ingredients
of a wide range of colloidal food systems such yogurts, mayonnaise and ice cream
(Neirynck et al., 2007b). A binary mixture of protein and hydrocolloid (polysaccharides) in
aqueous solution can exhibit one of the three different equilibrium situation: (a) miscibility,
(b) thermodynamic incompatibility or (c) complex coacervation (or complexation),
thermodynamic incompatibility implies the separation in to two distinct aqueous phases,
one rich in protein and the other rich in hydrocolloid. An incompatibility may lead to phase
separation and destabilization of emulsions. Thus, protein-polysaccharide interactions
should be well known in order to formulate ingredients in a more accurate way (Ercelebi
and Ibanoglu, 2007). Proteins are present primarily as emulsion forming and stabilizing
agents, whereas polysaccharides are mainly used as thickening and water-holding agents. In
addition, both kinds of biopolymers may contribute to the structural and textural
characteristics of food products through their aggregation and gelling behaviour (Neirynck
et al., 2007a). Polysaccharides can form weak electrostatic complexes with protein. They
can induce depletion flocculation or in some cases, they are weakly adsorbing and can
cause bridging flocculation. Interactions of this type lead to changes in emulsion stability,

29
and this will almost certainly alter the way in which SPI emulsion respond to heat treatment
(Euston, et al., 2000).
Addition of polysaccharides to SPI emulsions enhanced the rate of emulsion droplet
aggregation during heating, due to depletion flocculation, where emulsion droplets become
aggregated by attachment of adsorbing macromolecules to more than one droplet at a time
(Dickinson, 1992; Ye and Singh, 2006). Addition of glucose to soy protein containing
emulsions produced emulsion with small droplet size. This was probably due to hydroxyl
groups present in sugar units, which contribute to protein-sugar interactions in aqueous
solution. These newly formed dipole-dipole interactions could either form a hydrophilic
layer around the protein unit and, therefore increase the dispersibility of protein through
protein hydration and/or alter the intermolecular interactions in such a way that folding and
even dissociation may be formed (Baier and Mcclements, 2005; Ryan and Brewer, 2005).
1.11 Gelation properties of soy protein
Protein gelation is applied in many industrial food applications. In food products, it
lends desirable sensory and textural properties. A gel can be defined as steady state flow of
continuous network of macroscopic dimensions in a liquid medium (Oakenfull et al.,
1997). Protein gel is a continuous network formed by denaturation of protein to a certain
degree (Alting, 2003). There are three characteristics which constitute a gelatinous state.
First, there must be at least two components in the system – a dispersing phase and a
dispersed phase. Secondly, both the dispersion solvent and the dispersed component must
be equally distributed throughout the gel system. Thirdly, the system must display specific
rheological properties typical of a solid (Ranadheera, 2000). Gel forms depend on the
extent of crosslinking of the initial molecules present, and this in turn is influenced by
environmental conditions, concentration, temperature, heating time, and pH (Mcklem,
2002). Gel networks can be divided structurally to fine-stranded and coarse aggregated
networks (Figure 1.16) depending on microscopic observations. A fine stranded network is
characterized by transparent fibers that are a few times larger than protein molecules. A
coarse network is characterized by non-transparent fibers with thickness 100-1000 times
larger than protein molecules. A combination of network types (fine-stranded and coarse)
could exist. The type of network formation depends on the environmental conditions during
gel formation. As the pH approaches the isoelectric point, the network tends to becomes
coarse, as well as when the ionic strength is increased (Renkema, 2001).
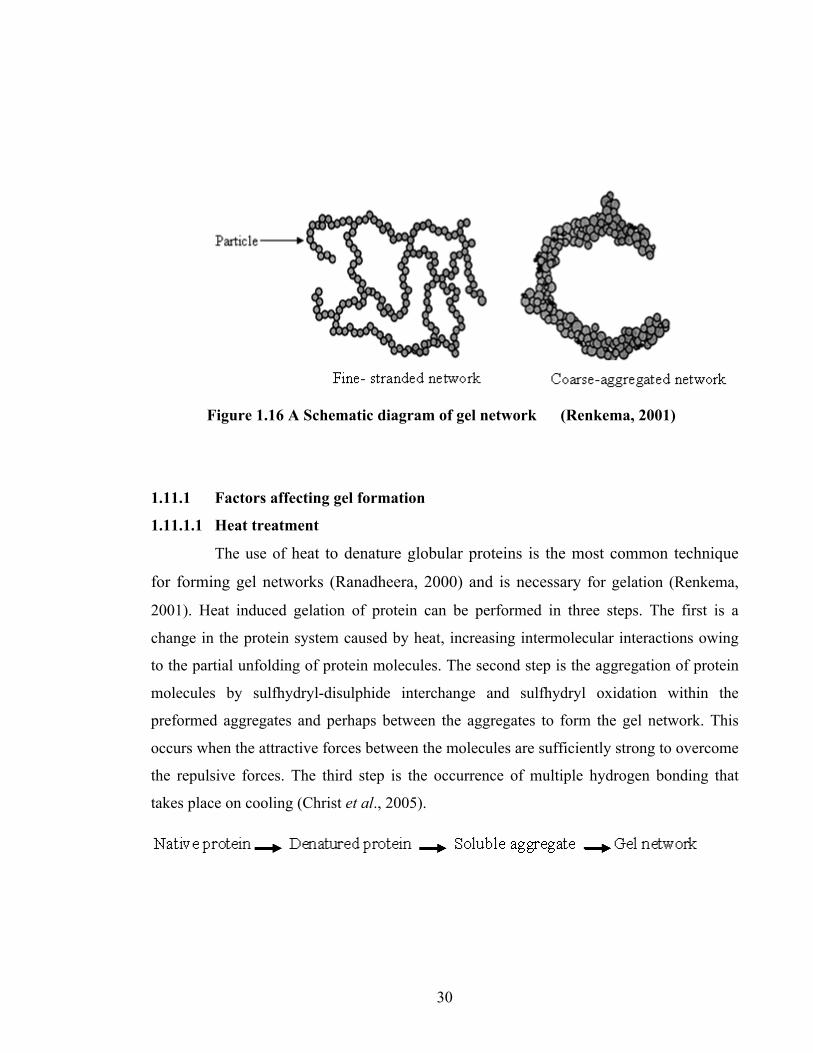
30
Figure 1.16 A Schematic diagram of gel network (Renkema, 2001)
1.11.1 Factors affecting gel formation
1.11.1.1 Heat treatment
The use of heat to denature globular proteins is the most common technique
for forming gel networks (Ranadheera, 2000) and is necessary for gelation (Renkema,
2001). Heat induced gelation of protein can be performed in three steps. The first is a
change in the protein system caused by heat, increasing intermolecular interactions owing
to the partial unfolding of protein molecules. The second step is the aggregation of protein
molecules by sulfhydryl-disulphide interchange and sulfhydryl oxidation within the
preformed aggregates and perhaps between the aggregates to form the gel network. This
occurs when the attractive forces between the molecules are sufficiently strong to overcome
the repulsive forces. The third step is the occurrence of multiple hydrogen bonding that
takes place on cooling (Christ et al., 2005).

31
1.11.1. 2 Protein concentration
Protein concentration plays an important role in formation and characteristics
of a gel. There is certain concentration, which varies depending to protein utilization, below
which gelation will not occur. As protein concentration increases, the strength and texture
of gel increase (Mangino, 1984). The SH groups decrease markedly as soy protein
concentration increase, since the oxidation of SH group to S-S bonds is favored at high
protein concentration due to increased protein-protein interaction(Shimada and Cheftel,
1988 and Sorgentini et al., 1995).
1.11.1.3 Effect of pH
The pH can have a marked effect on structure of soy protein and water holding
capacity of protein and gel properties. The pH affects maintenance of the gel network
through charge repulsion (Mangino, 1984). At pH >6 soy protein gels have low stiffness,
while high stiffness occurs at pH < 6, due to the difference in association/dissociation
behaviour of proteins ( Renkema, 2001). Generally at a pH value far from the isolelectric
pH (PI), the gel becomes transparent with fine-stranded, random aggregates,, while at pH
close to the PI, the gel becomes coarse and thick stranded. (Alting, 2003).

32
Figure 1.17 Influence of pH and ionic strength on final whey protein gel
properties (Alting , 2003)
1.11.1.4 Effect of ionic strength (NaCl) on gelation
Addition of salt can enhance gelation of soy or whey protein, by denaturation
and aggregation. At room temperature (22 ± 3°C) addition of small amounts of salt can
produce a fine-strand transparent gel. However addition of large amounts of salt produce
turbid particulate gel (Alting, 2003).
1.11.1.5 Effect of sugars (oligosaccharides and polysaccharides) on gelation
The addition of sugars increases the hardness of soy or whey protein gel, which
could be attributed to the ability of sugars to form hydrogen bonds, increasing the number
and stabilization of junction zones (Sabadini et al., 2006). They would also interact with the
protein and this interaction would have a synergistic effect on gel strength (Baeza et al.,
2002). This effect would be strongly related to Maillard cross-linking which might increase
the molecular entanglement in the gel structure, preventing the rupture of weak non-
covalent interaction, and thus stabilize gel network (Sun et al., 2006).

33
1.11.2. Gelation properties of soy protein
It has been reported that gelling properties of soy protein depends on glycinin and
conglycinin content, which are affected by such structural factors as subunit composition,
accessibility and/or reactivity of –SH groups and hydrophobicity. It has also been
demonstrated that heat-induced gelation of aqueous dispersion of soy globulins is affected
by protein concentration, and time and temperature of heating (Kang et al., 1991).
These proteins have complex quaternary structures that easily undergo association-
dissociation reaction, depending on environmental conditions (Hermansson, 1986). Heating
of soy proteins above 60°C is necessary to induce dissociation of the quaternary structure
of globulins and to cause unfolding of the protein subunits and a consequential increase in
viscosity. It has been demonstrated that glycinin gels are firmer and more elastic than β-
conglycinin gels.
1.11.3 Texture analysis of protein gels
Texture profile analysis is now the most frequently used imitative test, which
refers to the flow, deformation, and disintegration of sample under force. Texture relates to
soild foods, and viscosity-the tendency to resist flow-related to fluid foods, texture
parameters such as hardness, cohesion strength, and adhesiveness (Tunick, 2000). There
are many factors, which should be considered in evaluating gel texture (Table 1.2). These
are fracturability, hardness, adhesiveness, cohesiveness, springiness, gumminess, chewiness
(Wilcke et al., 1979).

34
Table 1.2 Definitions of evaluating factor of food texture
Mechanical
property
Definition Reference
Fracturability (originally
called brittleness)
Force with which the sample crumbles cracks
or shatters. Not all samples fracture
Raikos, 2006
Hardness The force required to deform a
product to given distance
Mioche and Peyron,
1995
Cohesiveness Determines how much of a gel
structure is destroyed after
compression as related to force
Raikos, 2006
Adhesiveness The work required to overcome the
attractive forces between the food surface
and surface of other material which come
in contact with food such as the plate,
tongue, and teeth
Ju and Kilara, 1998
Springiness How well a product physically springs
back after it has been deformed during
the first compression
Raikos, 2006
Gumminess Energy required to disintegrate a
semi-solid food to a state ready for
swallowing. It only applies to semi-
solid samples
Raikos, 2006
Chewiness Number of chews needed to masticate a
sample to a consistency suitable for
swallowing.
Raikos, 2006
1.12 Effect of glycation of proteins on protein functionality in general
Many efforts have been made to improve the functions of food proteins by
conjugation of polysaccharides through Maillard reaction in the dry state, nevertheless data
on conjugation of protein with polysaccharides via Maillard reaction in liquid state are

35
scare. For example, the conjugation of hen egg lysozyme with dextran, galactomannan, or
xyloglucan in the dry state was effective to improve the emulsifying activity of lysozyme
and it was found that the conjugated lysozyme had new antimicrobial characteristics (Mu et
al., 2006). The Maillard reaction can have a positive impact on the solubility of heat-
denaturated globular proteins, this may be due to the fact that protein molecules become
less hydrophobic after covalent modification with sugar molecules. This means that more
polar groups are present on the surface area of the protein backbone, resulting in enhanced
solubility in aqueous environment (Campbell et al., 2003). The Maillard reaction can also
cause a pH reduction in protein gels due to the production of acidic side products.
Decreased pH can cause changes in the gelation process, thus causing changes in the
rheological properties of gels (Rich and Foegeding, 2000).
1.13 Yogurt
In this study, the modified soy proteins were applied in a yoghurt system. The
section below gives an overview of yogurt manufacture.
Yogurts come in many forms (e.g. liquid, set and stirred curd), with varying fat contents
(e.g. regular fat, low fat and fat-free) and flavours (e.g. natural, fruit, cereal, chocolate), and
can be consumed in different ways (snack or part of a meal, as a sweet or savoury food).
Yogurt’s nutritional profile has a similar composition to the milk from which it is made but
will vary somewhat if fruit, cereal or other components are added. Yogurts can be used as
dietary supplements for infant consumption. Therefore, they cross the line between dietary
supplements and healthy foods (Ganesh, 2006). The average composition of yogurt is 4-6%
protein, 7-10% carbohydrate, 1-3% fat and the rest is moisture (Early, 1998; Yazici and
Akgun, 2004). Traditionally, yogurt is a food produced by culturing milk or reduced fat
milk using a mixed culture of Lactobacillus bulgaricus and Streptococcus thermophilus.
The milk is incubated with culture at 43°C until the pH reaches 4.5, then the yogurt is
stored at 5 °C; however, this can vary from country to country (Guggisberg et al.,
2007). The addition of organic acids (ascorbic, acetic, lactic, citric and phosphoric) or
glucono-δ-lactone (GDL) can result in the formation of coagulum at pH < 4.6.
The main objections to the use of soybean products for yoghurt production are associated
with beany flavour and the phenomenon of flatulence (i.e. production of carbon dioxide,
hydrogen and methane by the intestinal flora during the breakdown and/or metabolism of
the oligosaccharides raffinose and stachyose present in the soybean). It is possible that

36
these problems can, of course, be overcome by various processing techniques such as
removal of unwanted fibers from soy protein (SPC) or SPI. New commercial grades of SPI
are also distinctly neutral in flavour. It was therefore of interest in this study to develop a
yoghurt with SPI, having improved texture and taste than commercially available soy
yoghurt manufactured with soy milk.
1.14 Aims and objectives of this study
The rising cost of food-grade proteins from animal source, and increased food
shortage in the world has increased the pressure on food scientists to develop new protein
products, particular from vegetable proteins. Soy proteins have been used in a variety of
food applications for many years. Some of the reasons for their use include their relatively
low cost and availability compared to other competing food ingredients. The primary
reason for the use of soy proteins, however, is their wide range of functional properties that
help to stabilize food systems as well as provide sensory properties, such as texture, that
consumers demand. The objective of this thesis was to study the effect of heat treatment
and glycation in solution on five industrially important functional properties of soy protein,
namely solubility, emulsifying ability, water holding ability, acid gelation ability in soy
yoghurts and the heat stability of whey/soy protein emulsions. These objectives were
achieved completing three tasks:
Task 1 Functional properties of SoyComil K
SoyComil K is an insoluble commercial SPC sold as animal feed. The present
study aims to improve its functional properties such as solubility and emulsification to
facilitate its use in industrial applications. Physical treatments (temperature, pH, and
concentration), chemical treatments (NaCl and glycation with sugars) and enzymatic
modification (carbohydrate hydrolysis enzymes and proteinase K) were used to effect
changes in the solubility of the SPC.
Task 2 Soy protein isolate and polysaccharides in model yogurt
There is a consumer demand for imitation-dairy products made from non-dairy
ingredients. Soy protein can be used to make dairy subsitutes, but there are a number of
barriers to their use. These include the “beany” taste and difficulties reproducing the
texture of milk protein based dairy products. In this task attempts were made to produce
soy yogurt with high quality (smooth, homogenous texture and high water holding
capacity (WHC)) using SPI. In addition to SPI, the yogurts were also made with different

37
sugars (glucose, pectin, amylopectin, starch, carrageenan, xanthan, guar gum and locust
bean), and by different processing conditions (heat treatment, and homogenization) to
further improve the texture.
Task 3 Destabilization of SPI emulsions
Proteins are valued by the food manufacturer, for their ability to emulsify oil and stabilize it
in fluid emulsions. A barrier to the use of globular proteins such as whey and soy protein as
emulsion stabilisers is their tendency to denature and aggregate when heated, which leads
to coalescence of oil droplets and subsequent oil separation. Understanding the mechanisms
of heat-induced breakdown of SPI emulsions will enable the food manufacturer to make
better use of them in food applications.
In this task, heat-induced destabilization of SPI and Whey protein concentrate (WPC)
emulsions was studied in two parts:
Part 1: A study of the rate of aggregation of SPI and WPC stabilized emulsions at different
SPI concentrations and temperatures at pH 4.5. In addition, studied the heat stability of
mixed WPC and SPI emulsions was done.
Part 2: A study of the effect different polysaccharides (pectin, carrageenan and xanthan)
on heat stability of emulsion made with SPI at pH4.5.
38
Chapter Two
Materials and Methods

39
2 Materials and methods
2.1 Materials
SoyComil K (which is an insoluble kind of soy protein concentrate,72% protein, sold
as animal feed), soy Arcon ® SJ (which is soluble kind of soy protein concentrate , 70%
protein) and soy protein isolates (90% protein) were obtained from ADM (Archer Daniels
Midland company , Netherlands). Whey protein concentrate was obtained from Arla Foods
Ingredients amba Denmark. The commercial enzymes (α-amylase, proteinase K, cellulose,
and hemicellulase), sugars (sucrose, glucose, lactose, ribose), starch, locust bean gum,
carrageenan, guar gum, xanthan gum, amylopectin, and pectin), NaCl, glycine, DNTB,
EDTA, urea, SDS, 2-mercaptoethanol, 1-anilinonaphthalene-8-sulphonate (ANS),
phosphoric acid, glucono-δ-lactone (GDL), Coomassie Brilliant Blue G-250, Tris, acetic
acid and 95% ethanol were obtained from Sigma-Aldrich Company in UK. Electrophoresis
and electrophoresis materials were obtained from Invitrogen Co, UK. Sunflower oil was
purchased from ASDA supermarket in Edinburgh, UK.

40
2.2 Methods
2.2.1 Preparation of soy protein concentrates (SPC) SPC was isolated from defatted soy flour according to Wang et al., (2004), with
some modification (centrifuge speed and freez-dried).
Figure 2.1 Laboratory preparation of soy protein concentrates (SPC)

41
2.2.2 Preparation of soy protein isolates (SPI)
SPI was isolated from defatted soy flour according to L’hocine et al., (2006), with
some modification (centrifuge speed).
Figure 2.2 Laboratory preparation of soy protein isolates (SPI)

42
2.2.3 Preparation of emulsions
2.2.3.1 SoyComil K emulsions
Emulsions were prepared from unheated and heated (100°C for 10 min) SoyComil
K (6% w/v) dipersions prepared as shown in Figure 2.3. The protein concentration was
adjusted by adding the appropriate amount of water. The pH of the suspensions was
adjusted to pH 7, following the treatments and diluted with equal quantities of distilled
water to ensure that all samples contained the same protein content. SoyComil K samples
were emulsified with 30% sunflower oil (v/v) using a Braun kitchen mixer (Kenwood LTD
UK made) at speed 2. The sunflower oil was added at constant rate (1min) using a funnel,
followed by emulsification with a Braun kitchen mixer at maximum speed for 30 sec. The
emulsions were then homogenised using an APV homogeniser (APV Systems, Alberstlund,
Denmark). A pressure of 500 bars was used for homogenisation and the process was carried
out at room temperature (22 ± 3°C).
Figure 2.3 Procedure for preparation of SoyComil K emulsions

43
2.2.3.2 Soy protein isolates (SPI) emulsions (pH7)
Emulsions were prepared with heat-treated (95°C for 30 min) or non-heated SPI
mixed with sugars as Figures 2.4. The protein concentration in emulsion was 4.3% and
adjusted by adding the appropriate amount of water. The pH of the suspensions was
adjusted to pH7 (measured by microprocessor pH meter, Hanna pH210, made in Romania).
SPI samples were emulsified with 3% sunflower oil using a Braun kitchen mixer (Kenwood
LTD UK made) at speed 2. The sunflower oil was added at constant rate, followed by
emulsification at maximum speed for 30 sec. Half of the emulsions was not homogenized
and the rest was homogenized using an APV homogenizer (APV System, Alberstlund,
Denmark) at a pressure of 200-600 bars.
Figure 2.4 Procedure for preparation of SPI emulsions (pH7)

44
2.2.3.3 Soy protein isolates (SPI) emulsions (pH4.5)
Emulsions were made containing 20 % w/w sunflower oil, and 0.75-3% w/w of
protein depending on the experiment. Protein was dissolved in imidazole buffer (0.05M).
Mixed SPI/WPC emulsions were made at a total protein content of 3% w/w with ratios of
SPI:WPC of 1:3, 1:1 and 3:1. SPI (3%) mixed also with different concentration (0.02, 0.04,
0.06, 0.08 and 0.1%) of polysaccharides (pectin, xanthan, carrageenan). The protein
solution and oil were mixed initially using a Braun kitchen mixer (Kenwood LTD UK
made) and then homogenized at 200 bar, room temperature (23 ± 3 °C) using an APV 2000
lab homogenizer. The emulsions were circulated through the homogenizer for 10 minutes
prior to collection. This was to ensure as narrow a particle size distribution. The emulsions
were then adjusted to a pH 4.5 (measured by microprocessor pH meter, Hanna pH210,
made in Romania) using a 40% (w/v) glucono-δ-lactone (GDL) solution. The emulsions
were left for 2 hours for the correct pH to be achieved. The correct volume of GDL
required to achieve a set pH was determined by adding different volumes of GDL to protein
solution and constructing a standard curve.
2.2.3.4 Whey protein emulsion (pH4.5)
Emulsions were prepared from whey protein concentrate (0.75%, 1.5%, 2.25%
and 3% protein). Whey samples dispersed in 0.05M imidizole buffer and emulsified with
20% sunflower oil using a a Braun kitchen mixer (Kenwood LTD UK made) at speed 2.
The sunflower oil was added steadily (1 min), followed by emulsification with a Braun
kitchen mixer at maximum speed for 30sec followed by homogenization using an APV
homogenizer (APV System, Alberstlund, Denmark). A pressure (200 bars) was used for
homogenization, and the emulsion are re-circulated through the homogenizer for 10 min
prior to collection, then adjust pH to 4 by GDL.
.
2.2.4 Preparation of yogurts
Yogurts were prepared from emulsions (prepared as in section 2.2.3.2) by
adjusting the pH to 4.5 (measured by microprocessor pH meter, Hanna pH210, made in
Romania) using a 40% (w/v) glucono-δ-lactone (GDL) solution at room temperature (22 ±
3°C) and leaving them in the fridge at 5°C over night. The yogurts were prepared in plastic
containers of 6mm diameter and 6 mm length as Figure 2.5.
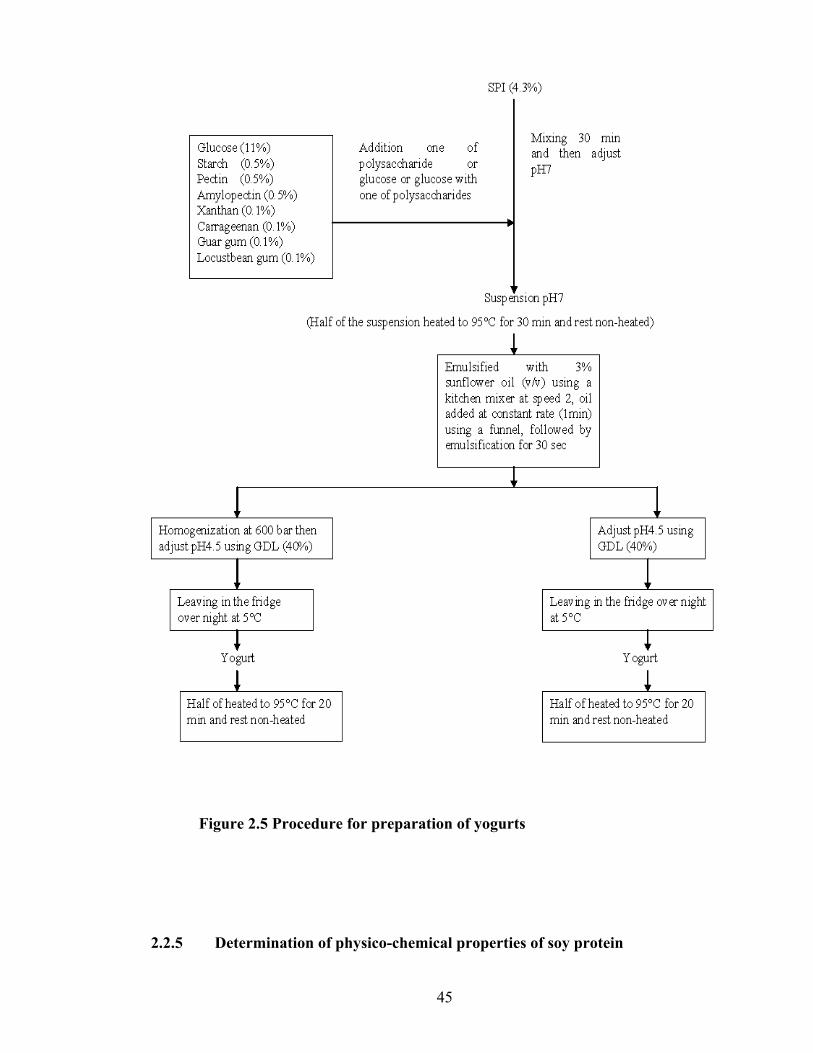
45
Figure 2.5 Procedure for preparation of yogurts
2.2.5 Determination of physico-chemical properties of soy protein

46
2.2.5.1 Differential scanning calorimetry (DSC)
The thermal characteristics of SoyComil K, commercial SPI, native laboratory
prepared SPC and SPI were assessed by differential scanning calorimetry (DSC) using a
DSC 2010 instrument (TA Instruments, New Castle, USA) according to the procedure of
Sorgentini et al. (1995) and Renkema, (2001), with some modifications. Approximately
7mg of samples were placed in DSC hermetic aluminium pans. Analysis was performed at
a temperature gradient of 20-140°C at a rate of 10°C/min. An empty aluminium pan was
used as reference. The DSC data were analysed with universal analysis software (TA
universal analysis, TA instruments).
2.2.5.2 Electrophoresis (SDS-PAGE)
SDS-PAGE (sodium dodecyl sulfate polyacrylamide gel electrophoresis) of Soy
Comil K and commercial SPI was performed according to the method of Laemmili (1970).
Pre-cast native PAGE 10-20% Tris-glycine gradient gels were used in an electrophoresis
unit (XCell Surelock™ Mini Cell, Invitrogen Life Technologies, Paisley, UK) at constant
voltage 125V. Samples were diluted 1/15 (v/v) in distilled water, and were then dispersed
in an equal volume of 2x SDS sample buffer (non-reducing sample buffer composed from
120mM Tris-HCl, pH6.8, 4% SDS, 20% Glycerol and 0.008% Bromophenol blue; while
reduced sample buffer added 10% β-Mercaptoethanol). Running buffer was 10x SDS-
PAGE buffer (1% SDS, 0.25M Tris-HCl and 1.92M Glycine per liter). The molecular
weight markers (Plus2 pre-stained (1x) MW 4-250 KDa) and samples were run under
reducing conditions (2-Mercaptoethanol), and non-reducing conditions.
2.2.5.3 Solubility
2.2.5.3.1 SoyComil K solubility
Soy samples were dissolved in milli-Q water at different protein concentrations
(6, 10 and 18% w/v) with different pH (4.6, 6.5, and 9.0), and mixed by magnetic stirrer for
20 min. It was heated at different temperatures (room temperature, 50 and 80ºC) in a water
bath for 10 min., and then cooled immediately on ice to 15°C. 10 ml of treated samples
were centrifuged for 10 min at 3000 rpm using a centrifuge (Denley BS400, UK) at room
temperature. The protein content of supernatant was determined in triplicate using the
Bradford assay (Bradford, 1976). The total protein concentration was determined by the
micro-Kjeldahl method (AOAC, 1980) using a Kjeldahl factor of 6.25.

47
2.2.5.3.1.1 Effect of salt (NaCl) on SoyComil K solubility
Soycomil (6%) at pH 9 (measured by microprocessor pH meter, Hanna
pH210, made in Romania), was treated with different concentrations of NaCl (0.1, 0.2, 0.3,
0.4, and 0.5M) and heated to 80ºC for 10 min., followed by measurement of solubility.
2.2.5.3.1.2 Effect of some sugars on solubility of SoyComil K
Soycomil 6 %,( pH6.5), was mixed with different concentrations (1, 6, 7%)
of sugars (sucrose, lactose, glucose) and heated to 70°C for 30 min. followed by
measurement of solubility. SoyComil K was also mixed with 1% ribose (pH 9), and heated
at different temperatures (80 and 100°C) for 2h, followed by measurement of solubility.
2.2.5.3.1.3 Effect of enzymes on solubility of SoyComil K
SoyComil K was treated with different carbohydrate hydrolysis enzymes (α-
amylase at pH6.9 and temperature 20°C, hemicellulase at pH5.5 and temperature 37°C,
cellulase at pH5 and temperature 37°C, pectinase K at pH4.5 and temperature 25°C and
proteinase K at pH7.5 and temperature 37°C for different reaction times according to the
manufacturer’s instructions of Sigma campany in UK. Followed by heat treatment at
different pH and temperatures, followed by measurement of solubility .
2.2.5.3.2 Solubility of soy protein isolate
Solubility of SPI (6%, pH7) was measured as described in section 2.2.5.3.1. 2.2.5.4 Turbidimetric measurement of soy protein aggregation
Turbidity of SoyComil K at different protein concentrations (6, 10, and 18%
w/v), different pH (4.6, 6.5 and 9.0), and treated at different temperatures (RT, 50 and
80°C) for 10 min, was measured using a HACH 2100N Turbidity meter (CAMLAB). 200µl
of sample was diluted 83-fold in aqueous solution (1% NaCl, 1% sucrose, 0.2% Tris). The
samples were vortexed for about 5 sec. Blank measurements were recorded using buffer

48
solution only. Turbidity was measured using the single 90-degree detector, which receives
the light scattered by the particles. Three replicate measurements were recorded and the
results presented are the mean of these three replicates. Turbidity is expressed as NTU
(nephelometric turbidity units).
2.2.5.5 Determination of hydrophobicity
The surface hydrophobicity of SoyComil K was determined using 1-
anilinonaphthalene-8-sulphonate (ANS) assay according to the method of Kato and Nakai
(1980), with some modifications (protein concentration and amount of hydrophobicity
buffer). The relative fluorescence intensity of the ANS-protein conjugates was measured at
room temperature (23± 3°C) using a fluorescence spectrometer Model 203, Norwalk,
Connecticut, USA. The wavelengths of excitation and emission were 390 and 470 nm
respectively. Quantification of ANS binding was carried out fluorimetrically by adding
15µl of ANS solution (8mM) to 1ml of diluted Soycomil K ranging in concentration
between (0.3 - 0.5 mg/ ml). Hydrophobicity was expressed as the slope of the plot of
fluorescence intensity values.
2.2.5.6 Determination of glycation degree
The degree of glycation of protein with different sugars was estimated by
measuring the availability of primary amino groups, using ortho-phthaldiadehyde (OPA ),
based on the method of Chevalier et al, (2001) with some modifications (amount of buffers
and protein concentration). The OPA reagent was prepared daily by mixing 80 mg of OPA
(dissolved in 2ml of methanol), 100ml of 0.1M sodium borate buffer, pH9.3, 200mg of N-
dimethyl-2-mercaptoethylammonium chloride (DMMAC), and 2.5 ml of 20% (w/v) SDS
in 1 Litter of water.
2.2.5.6.1 Glycation degree of Soycomil K
100µl of heated ( 75ºC for 10 min ) SoyComil K suspension (SoyComil K, 6%
protein (pH 9.0) mixed with sugars “10% glucose, or 10% lactose, or 10% fructose, or
10% sucrose) was added to 2ml of OPA reagent. The absorbance was read at 340nm using
a UV-VIS spectrophotometer (NovapecII, Amersham manufactured by Biochron Ltd.
Cambridge England UK) after a minimal delay of 5 min. A calibration curve was obtained

49
by using 0.25-2mM Leucine as standard. SoyComil K 6% w/v (pH9) heated at 75ºC/ 10
min was used as control.
2.2.5.6.2 Glycation degree of soy protein isolate (SPI) in the presence of different
sugars SPI (4.3% protein, pH7) was mixed with 11% glucose, 0.5% starch, 0.5% pectin,
0.5% amylopectin, 0.1% xanthan, 0.1% carrageenan, 0.1% locust bean, and 0.1% guar gum
respectively, and heated at 95°C for 30 min. Glycation was measured in the same manner
as for of SoyComil K section 2.2.5.6.1.
2.2.6 Identification of intra-molecular bonds
Dispersing protein dispersions, emulsions or gels in solvents containing NaCl,
2-mercaptoethanol or urea can disrupt selective interactions among peptides. The method of
Zhong et al (2006), Utsumi, and Kinsella (1985) was followed with some modifications
(amount of protein and buffers). 3ml of sample was dispersed in 10 ml of the following
buffers:
• 0.05 M Imidizole (as control).
• 0.3 M NaCl (electrostatic bonds breaking reagent).
• 0.2 M 2-mercaptoethanol (disulfide bonds bond breaking reagent).
• 8 M urea (hydrophobic bonds bond breaking reagent), and homogenized
• Using a Silverson (Model L2 R, made in England UK) for 1 min.
2.2.6.1 SoyComil K dispersions
3 ml of SoyComil K(6%, pH9) was dispersed in 10 ml of the buffers described
above and one half of it was heated at (80°C for 10 min).
2.2.6.1.1 Particle size measurement
The particle size distribution (D3,2, surface weighted mean; D3,2 =
∑nidi3/∑nidi
2,
where ni is the number of droplets of diameter di ; Frey, 2008) of solutions
were measured using a Mastersizer 2000 (Malvern Instruments Ltd, Malvern, U.K.). D3,2
is defined as the diameter of a sphere that has the same volume/surface area ratio as a
particle of interest or the ratio of the third to second moment of the probability density

50
function ( Liu et al., 2007; Pacek et al., 1998; Downs and Sarv, 2003; chapter 2 section
2.2.8.1.1). The refractive index (RI) was set at 1.41, the x-ray absorbance was set at 0.001
and the laser obscuration was adjusted at about 5-10%. Reduction in particle size that
should reflect the molecular forces contributing to maintenance of protein structure (Zhong
et al., 2006). Triplicate measurements were carried out and the results presented are the
mean of these three replicates.
2.2.6.2 SPI dispersions
Identification of bonds in 6% protein SPI dispersions, pH 9 was done as described
above (section 2.2.6.1).
2.2.6.3 Soy yogurts
Yogurt samples (3g) were dispersed in 10 ml of buffers and homogenized using a
Silverson (Model L2 R made in England UK) for 1 min. Solubility in the dispersion was
then measured. The solubility of gel yogurt in the various solvents should reflect the
molecular bonds contributing to maintenance of the gel network structure in yogurts
(Utsumi and Kinsella, 1985). Triplicate measurements were carried out and the results
presented are the mean of these three replicates.
2.2.7 Determination of free and total sulfhydryl (SH) groups
Sulfhydryl content was determined by using 5,5'-dithiobis(2-nitrobenzoic acid),
according to Campbell et al,( 2008).
Free SH:
For determination of free SH groups, 300µl of each sample was solubilised in 5ml of buffer
containing 0.086 M Tris, 0.09 M glycine, 4 mM Na2EDTA buffer, pH 8, followed by
addition of 200µl of 20mM DTNB buffer. The solution was vortexed and allowed to stand
at room temperature (23± 3°C) for 15 min. The absorbance was measured at 412 nm using
a UV-VIS spectrophotometer (NovapecII, Amersham manufactured by Biochron Ltd.
Cambridge England UK). The samples in buffer without DTNB were used as blanks
Total SH:

51
For determination of total SH group ,300µl of each sample was solubilised in 5ml of buffer
containing 0.086 M Tris, 0.09 M glycine, 4 mM Na2EDTA, 6 M urea and 0.5% SDS buffer
pH 8; followed by addition of 200µl of 20mM Na2DTNB buffer. The solution was vortexed
and allowed to stand at room temperature for 15 min and absorbance was measured at 412
nm, the samples in buffer without DTNB were used as blanks.
2.2.7.1 SoyComil K dispersions
Sulfhydryl content of SoyComil K was determined that had been treated as in
SoyComil K solubility (sections 2.5.3.1)
2.2.7.2 Yogurt
The amount of free and total sulfhydryl groups were analysed in yogurts prepared
from:
• SPI
• SPI with glucose
• SPI and pectin
• SPI + pectin and glucose
• SPI and carrageenan
• SPI + carrageenan and glucose
2.2.8 Determination of emulsion properties
2.2.8.1 Emulsifying activity
The average oil droplet size distributions (D3,2 “surface weighted mean”; D3,2
= ∑nidi3/∑nidi
2, where ni is the number of droplets of diameter di ; Frey, 2008) of emulsions
were measured by laser light diffraction using a Mastersizer 2000 (Malvern Instruments
Ltd, Malvern, U.K.). D3,2 is defined as the diameter of a sphere that has the same
volume/surface area ratio as a particle of interest or the ratio of the third to second moment
of the probability density function ( Liu et al., 2007; Pacek et al., 1998; Downs and Sarv,
2003). The refractive index (RI) of particles was set at 1.41, the x-ray absorbance was set at
0.001 and the laser obscuration was adjusted at about 5-10%. Triplicate measurements were
carried out and the results presented are the mean of these three replicates. Surface
weighted mean D3,2 it represents the diameter whose ratio of volume to surface area is the
same as that of the entire droplet sample ( Liu et al., 2007; Downs and Sarv, 2003).
52
2.2.8.1.1 SoyComil K emulsions
The average droplet size distribution D(3,2) of SoyComil K emulsions, which
had been prepared as described in section 2.2.3.1 was measured immediately after emulsion
formation, after 10 days and 31 days .
2.2.8.1.2 SPI emulsions
SPI emulsions which had been prepared as described in section 2.2.3.2 with
different sugars (11% glucose, 0.5% pectin, 0.5% amylopectin, 0.5% starch, 0.1%
carrageenan, 0.1% xanthan, 0.1% guar and 0.1% locust bean). SPI (4.3%) was emulsified
with 3% oil, followed by homogenisation at (200, 400, and 600 bar). Droplet size
distribution (D3,2 and D4,3) of emulsions made was studied, before and after high-pressure
homogenization, emulsions to under stand effect of homogenization on droplets size . In
other hand changes in the average droplets size distribution (surface weighted mean “D3,2”
and volume weighted mean “D4,3”) of emulsions as function of SPI (heated or non-heated) to understand effect of heat treatment on droplet sizes, which reflect on water holding
capacity.
2.2.8.2 Determination of destabilisation of emulsions
Emulsions were prepared from SPI with or without polysaccharides or whey,
which had been treated as described in sections 2.2.3.3 and 2.2.3.4. The emulsions were
pippetted into Eppendorf tubes and heated in water bath to different temperatures in
different times, the tubes were removed at regular time intervals for different a period and
quench cooled immediately by placing in ice as following:
• 60°C, tubes were removed every 5min for 60 min.
• 70°C, tubes were removed every 5min for 60 min.
• 80°C, tubes were removed every 1min for 10 min.
• 90°C, tubes were removed every 30sec for 5 min.
• 100°C, tubes were removed every 20sec for 3 min.
2.2.8.2.1 Calculation of emulsion destability

53
The kinetics of heat-induced breakdown of the emulsions was analysed using
the methodology proposed by Euston et al. (Euston et al. 2000; 2001; 2002; Euston et al.,
2001). In this method, the generalised rate equation (Eqn. 2.1) is assumed to describe the
rate of change of the number of emulsion droplets (N) with time (t),
Where kn is the reaction rate constant and n the order of the reaction. This equation can be
integrated to give a relationship between the number of emulsion droplets at the start of
heating N0 and at any time during the heating process, Nt, i.e.
Where k is an apparent rate constant that depends on the initial number of droplets, i.e.
Before the apparent rate constant for heat-induced destabilization can be determined, the
ratio Nt/N0 and the order of the reaction n must be found. The ratio Nt/N0 is related to the
volume average diameter of the emulsion droplets (determined using the Mastersizer) by
the equation,
For whey protein emulsions has found that the order of the heat-induced destabilization is
n=1.5, suggesting a reaction that is a combination of than one unimolecular steps (Anema
& McKenna, 1996). Diftis and Kiosseoglou, (2006b) have also found that the kinetics of
soy-protein dextran emulsion heat stability is best described by a reaction of order n=1.5.
Assuming n=1.5, a plot of (Nt/N0)-0.5 vs t should be linear with a slope equal to 0.5k. To
correct the values of k determined from kinetic plots, we need to take account of the
dependence on initial droplet number. We are unable to determine a value for N0 directly
from our particle size distributions. However, the relative initial droplet number
(N0(T1,c1)/N0(T2,c2)) can be determined using a modified form of equation 4. For this we
have chose to calculate this ratio relative to N0 at 60oC and 0.75wt% protein. We are then

54
able to calculate a corrected value for k, i.e. k1.5 using the relative initial droplet number in
equation 3.
Analyse the temperature dependence of the reaction by using the Arrhenius equation. The
reaction rate constant is related to the activation energy (Ea) for the reaction by the
Arrhenius equation,
Where T is absolute temperature in degrees Kelvin, R the universal gas constant (8.3145
J/mol k), and A a pre-exponential factor. Plots of ln kn vs 1/T are straight lines with a slope
equal to –Ea. A thermodynamic analysis of the heat destabilization process can been carried
out by calculating the free energy of activation (ΔG) using the Eyring equation,
and the enthalpy (ΔH) and entropy (ΔS) of activation using the thermodynamic
relationships,
In equations (2.6)-(2.8) kb is the Boltzmann,s constant (1.381x 10⁻²³
J.K-1) , h the Plank
constant (6.626x10⁻³⁴ J.S) and the temperature is in K.
2.2.9 Properties of yogurts
2.2.9.1 Water holding capacity of yogurts
Water holding capacity (WHC) was determined according to Unal et al., (2003)
with some modifications. The samples were put into PE (Fisher Scientific TUL-750-036J)
centrifuge tubes, and centrifuged for 20 minutes at 6400g at room temperature (23 ± 3°C).
The supernatant was discarded, and pellet was weighed. WHC determined by using the
following equation:
55
2.2.9.2 Texture analysis of yogurts
Texture parameters (hardness, cohesion strength, and adhesiveness) were
determined by texture profile analysis using a texture analyzer Zwick/Roell (model BDO-
FBO5. TS, Herefordshire, Germany) with a 20 mm diameter cylindrical probe. A force load
of 0.1 N was used to penetrate the yogurt at a length of 40mm and crosshead speed of 10
mm forming.
2.2.10 Rheological measurements
Viscosity of SoyComil K emulsions prepared as described in section 2.2.3.1 was
recorded on a Bohlin Gemini rheometer (Malvern Instruments Limited, Worcestershire,
U.K.), using cone and plane geometry with a cone diameter of 40 mm and a cone angle of
4˚ (C4/40), after emulsion formation (maximum 20 min). The emulsion viscosity was
monitored using controlled shear rate (0.0008 sec-1 – 55 sec-1) and measurements were
performed at room temperature. Viscosity was recorded at a frequency of 1 Hz with a fixed
strain of 0.0008 and measured for 15 min. The sample was brought into the lower plate
using a plastic spatula. The sample was forced to fill up the gap by lowering the upper plate
down to the designated gap (150 mm) and the extra sample around the edge of the plate
was trimmed with soft tissue. Measurements were carried out in triplicate and the mean
values used were the average of the three replicates.
2.2.11 Confocal laser scanning microscopy
Microscopic images were obtained using a Leica DM-IRE2 confocal laser
scanning microscope (Leica Microsystems, Heidelberg, Germany) equipped with an
Ar/He/Ne laser and 10 X objective lens (NPLAN 10 X 0.25 DRY). The fluorescence dye
was excited at 50% of maximum adsorption at 543 nm and the detection bandwidth was set
from 488 nm to 543 nm. Images were recorded at a resolution of 512 x 512 pixels and
analysed by the manufacturer’s software (Leica Software Development Kit, DM SDK,
version 4.2.1), the labelling dye was Fluorescein (Nile blue A oxa zone, C2H18N2O2),
56
traces of the dye were added to the sample and dispersed throughout the samples. Samples
were placed on a circular glass slide for analysis.
2.2.11.1 SoyComil K emulsions
Microscopic images of SoyComil K emulsions (of unheated and heated
SoyComil K treated by enzymes “protease and α-amylase”, or mixed with 10 % glucose)
were studied.
2.2.11.2 Yogurts
. The microstructure of yogurt produced from SPI and pectin with glucose (highest
hardness and WHC) and yogurt produced from SPI and carrageenan (lowest hardness and
WHC) were studied.
2.2.12 Statistical analysis
All experiments were performed at least in triplicate using freshly prepared
samples. Average and standard deviation were calculated from these triplicate
measurements. Statistical differences between samples were calculated using student’s t-
test for independent samples (Microsoft Excel, Microsoft Corporation, designed in
Redmond, Washington, USA).

57
Chapter Three
Functional properties of SoyComil K

58
3.1 Introduction
The rising cost of food-grade protein from animal sources, and growing food
shortage in the world have increased the pressure on food scientists to develop new protein
sources, particularly from vegetable proteins (Achouri et al., 2005). Soy protein ingredients
must possess appropriate functional properties for food application and consumer
acceptability. These are the intrinsic physicochemical characteristics which affect the
behaviour of protein in food systems during processing, manufacturing, storage and
preparation, e.g., solubility, gelation emulsification (Kinsella, 1979). Soy protein
concentrate retains most of the fiber of the original soybean. Soy protein concentrate is
widely used as functional or nutritional ingredient in a wide variety of food products,
mainly in baked foods, breakfast cereals and in some meat products. (Kinsella, 1979). The
solubility of protein is the most important factor determining its physico-chemical
properties (Lakemond et al., 2000b). Protein solubilisation is the process of breaking
interactions involved in protein aggregation, which includes disulfide bonds, hydrogen
bonds, van der Waal forces, ionic interactions, and hydrophobic interactions. If these
interactions are not prevented, proteins can aggregate or precipitate (Berkelman et al.,
2004). Formation of insoluble precipitates of soy protein induced by heat occurs as a
combination of two reactions: Reversible conversion of soluble monomers to aggregates
followed by irreversible conversion into insoluble precipitates. The mechanism of protein
thermo-coagulation is largely dependent on hydrophobic interactions among proteins
(Nakai, 1983). Native soy protein has low solubility, because about 83% of the most non
polar side chains (Ala, Val, Ile, Leu, Met, Phe, Trp, and Cys) and 82% of the peptide
groups (-CO-NH-) are buried in the native state, consequently these are the most important
groups that become exposed to solvent when protein is unfolded (denatured) (Pace et al.,
2004). SoyComil K is a soy protein concentrate containing 72% protein, used as animal
feed. Since this product is highly insoluble, its application is limited. This study has been
undertaken to investigate ways to improve its solubility, as well as to understand the
molecular basis of its insolubility.

59
3.2 Materials and Methods
Material and methods as described in chapter two
3.3 Results
3.3.1 Physicochemical properties of Soycomil K
3.3.1.1 SDS-PAGE electrophoresis
The SDS-PAGE technique was used to analyse the size distribution of the samples
in terms of molecular weight (Romagnolo et al., 1990). Reducing and non-reducing SDS-
PAGE of both supernatant and pellet of SoyComil K dispersions was done to analyse the
soluble and insoluble fractions. Figure 3.1 illustrates the difference in electrophoretic
migration of the soluble (supernatant) and insoluble (pellet) fractions under reducing and
non-reducing conditions of SoyComil K, soy Arcon ® SJ (which is soluble kind of soy
protein concentrate) and soy protein isolate (SPI) at pH7 and room temperature (Figures 3.2
and 3.3). In general, the intensity and numbers of bands decreased as solubility decreased
in supernatants under non-reducing conditions (Figure 3.1 lanes 6, 7, 8, 9 and 10). There
are 10 lanes in Figure 3.1, for lane 10 had eight detectable bands that were located at
approximately 64, 50, 45, 36, 30, 16, 6, and 4 kDa. Some of these could be identified as
the- subunit (64 KDa) and β-subunit (50-40 KDa) of β- conglycinin (Roesch et al, 2005,
and Chove et al., 2007). Acidic and basic polypeptides of glycinin corresponded 34-36
KDa, and 16-22 KDa bands respectively (Abtahi and Aminlari, 1997, and Roesch et al,
2005). Trypsin inhibitor of 2S fraction (whey protein) was located at 6-4KDa (Wolf, 1970),
lane 9 is similar to lane 10, but with lower intensity and numbers of bands. There were
other faint bands corresponding to 45, 35, and 22 KDa. These could be identified as β-
subunit of β- conglycinin at 45 KDa. Lane 8 shows three bands that could be identified as
follows: as α- and β- subunit of β- conglycinin at 64 and 50 KDa respectively, and basic
polypeptides of glycinin at 22 KDa. There are many faint bands between 22-50KDa, which
could be identified as acidic and basic polypeptides of glycinin. Lane 7 has lower intensity
and numbers of bands than both lanes 9 and 10. Lane 6 this pellet has lower intensity and
numbers of bands than the pellet of 1% SoyComil K (lane 8). Lane 5 is represented marker
and lane 4 shows intense bands that could be identified as α- and β- subunit of β-
conglycinin at 64 and 50 KDa respectively, and acidic and basic polypeptides of glycinin at
36, 16 KDa respectively. Lane 3 shows similar bands than lane 4 (supernatant of 1%
SoyComil K) but with lower intensity. Lane 2 was similar to lane 4 in number of bands but

60
with less intensity. Lane 1 shows one band that could be identified as the basic polypeptide
of glycinin at 22 KDa, and the two faint bands could be identified as α- subunit and β-
subunit of β- conglycinin at 64 and 50 KDa respectively.
.
Figure 3.1 Reducing and non-reducing SDS- PAGE of supernatant and pellet
SoyComil K pH 9.0 treated at different temperatures.
Where Lane 1: The pellet of 6% SoyComil K, (pH9) that was heated to 100°C for10 min
under reducing condition.
Lane 2: The 30% soluble supernatant (6% SoyComil K, pH9) that was heated to 100 °C
for10 min under reducing condition.
Lane 3: The pellet of 1% SoyComil K (pH9), heated to 80 °C for10 min under reducing
condition.
Lane 4: The 64.5% soluble supernatant of 1% SoyComil K (pH9) heated to 80 °C for 10
min under reducing condition.
Lane 5: Marker

61
Lane 6: The pellet of 6% Soy Comil K (pH9) that was treated to100 C° for10min under
non-reducing condition.
Lane 7: The 30% soluble supernatant of 6% SoyComil K, (pH9) that was heated to 100 °C
for10min under non-reducing condition.
Lane 8: The pellet of 1% SoyComil K (pH9) that was heated to 80°C for10min under non-
reducing condition.
Lane 9: The 64.5% soluble supernatant of 1% SoyComil K (pH 9) heated at 80°C for10min
under non-reducing condition.
Lane 10: The 100% soluble supernatant of 1% SoyComil K (pH9) that was heated to 100°C
for10min under non-reducing condition.
Non-reducing SDS- PAGE of soy protein concentrates (SoyComil K and soy Arcon ® SJ)
and Soy protein isolates pH 7 at room temperature (Figure 3.2) represented 4 lanes. Lane 4
is marker; lane 3 had one intense band that is located approximately 50 KDa, and three
faint bands that were located at approximately at 64, 22 and 16 KDa. Some of these could
be identified as as α- and β- subunit of β- conglycinin at 64 and 50 KDa respectively. Basic
polypeptidees of glycinin correspond 16-22 KDa. Lane 2 had six detectable bands that were
located at approximately 64, 50, 36, 16, 6, and 4 kDa. Some of these could be identified as
the α- subunit (64 KDa) and β-subunit (50 KDa) of β- conglycinin. Acidic and basic
polypeptides of glycinin corresponded 36 KDa, and 16 KDa bands respectively. Trypsin
inhibitor of 2S fraction (whey protein) was located at 6-4KDa. Lane 1 is similar to lane2 of
Figure 3.2, but more intensity.
Reducing SDS- PAGE of soy protein concentrates (SoyComil K and soy Arcon ® SJ) and
SPI pH 7 at room temperature (Figure 3.3) show 4 lanes. Lane 4 is marker; lane 3 shows
very intense defused integrated bands that could be identified as α- and β- subunit of β-
conglycinin at 64 and 50 KDa respectively, and acidic and basic polypeptides of glycinin at
36, 22 KDa respectively. There were two bands at 6 and 4KDa that could be identified as
trypsin inhibitor of 2S fraction (Wolf, 1970). Lane 1 was similar to lane 3 of Figure 3.3, but
with higher intensity. Lane 1 was similar to lanes 2 and 3 of Figure 3.3, but more intensity.

62
Figure 3.2 Non-reducing SDS- PAGE of soy protein concentrates (SoyComil
K and soy Arcon ® SJ) and Soy protein isolates pH 7 at room temperature.
Where: Lane 1: Soy protein isolates (SPI) 6% (pH7) and solubility 13.8% solubility.
Lane 2: Soy protein concentrates 6% (soy Arcon ® SJ), pH7 with solubility of 7.6%.
Lane 3: SoyComil K 6% (pH7, room temperature) with solubility of 0.9%.
Lane 4: Marker.
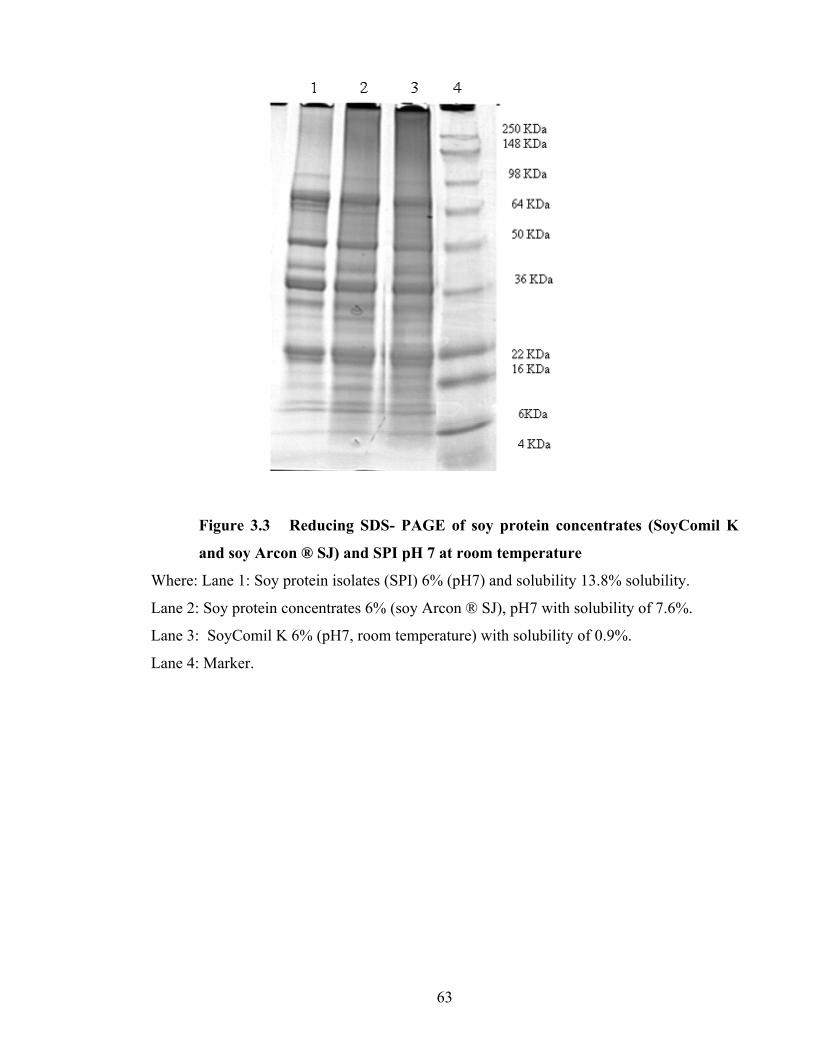
63
Figure 3.3 Reducing SDS- PAGE of soy protein concentrates (SoyComil K
and soy Arcon ® SJ) and SPI pH 7 at room temperature
Where: Lane 1: Soy protein isolates (SPI) 6% (pH7) and solubility 13.8% solubility.
Lane 2: Soy protein concentrates 6% (soy Arcon ® SJ), pH7 with solubility of 7.6%.
Lane 3: SoyComil K 6% (pH7, room temperature) with solubility of 0.9%.
Lane 4: Marker.

64
3.3.1.2 Differential scanning calorimetry (DSC)
The thermal characteristics of SoyComil K and native laboratory prepared SPC
were determined by DSC. The DSC thermogram of native SPC (Figure 3.4) shows two
exothermic transitions peaks at 75.24°C with ΔH 113.6 J/g and 94.55°C with ΔH 2.987 J/g,
which correspond to the thermal denaturation of β- conglycinin and glycinin respectively
(Hua et al., 2005). SoyComil K also exhibited two exothermic transition peaks, but at
74.72°C with ΔH 98.5 J/g and 102.79°C with ΔH 0.8352 J/g (Figure 3.5), which
correspond to the thermal denaturation of β- conglycinin and glycinin respectively.
Glycinin of SoyComil K had a higher denaturation temperature than laboratory prepared
SPC.
Figure 3.4 DSC thermogram of native laboratory prepared SPC.

65
Figure 3.5 DSC thermogram of SoyComil K
3.3.2 Factors influencing Soycomil K solubility
3.3.2.1 Effect of pH, temperature and protein concentrations on SoyComil K
solubility
The results of heating (room temperature “22± 3°C”, 50 °C and 80 °C ) SoyComil
K at different concentrations ( 6, 10 and 18% w/v) and pH (pH4.6, pH6.5 “control” and
pH9.0) at different temperatures for 10 min (Figure 3.6). Show that the highest increase in
solubility was obtained at concentration 6%, 80°C and pH 9.0 was 8.24%, where the lowest
increase in solubility was at pH 4.6, concentration 18% and room temperature was 0.11%.
Heating at 80°C resulted at the highest increase in solubility for all samples compared to
solubility of all samples at room temperature. Under all experimental conditions the highest
solubility was obtained with 6% protein, whereas 18% protein showed the lowest solubility

66
Figure 3.6 Effect of pH, protein concentrations and heat treatment on
SoyComil K solubility
Where A: treatment at room temperature (22± 3°C), B: treatment at 50 °C and C:
treatment at 80 °C.
3.3.2.2 Effects of pH, temperature and concentration on turbidity of SoyComil K
The turbidity intensity was used as a measure of aggregation of proteins; the
higher the turbidity, the more protein aggregation occurred (Ker and Chen, 1998). In this
study the effect of heating SoyComil K at different concentrations (6, 10 and 18% w/v), pH
(4.6, 6.5 “control” and 9) and temperatures (room temperature, 50 and 80°C) for 10
minutes on turbidity was measured. Results in Figure 3.7 show the highest increase in
turbidity was at pH 4.6, concentration (18%) and room temperature was 240.1 NTU,
whereas the lowest increase in turbidity was at concentration (6%), 80°C and pH 9.0 was

67
54.88 NTU. Under all experimental conditions, the highest turbidity was obtained with
18% protein, whereas 6% protein showed the lowest turbidity. Non-heated SoyComil K
had higher turbidity than heat-treated (Figure. 3.7). Thermal treatment of SoyComil K
decreased turbidity.
Figure 3.7 Effect of pH, protein concentration and heat treatment on SoyComil
K turbidity
Where A: treatment at room temperature (22± 3°C), B: treatment at 50 °C and C:
treatment at 80 °C.
3.3.2.3 Effect of salt (NaCl) on SoyComil K solubility
Figure 3.8 shows the solubility of 6% (protein) SoyComil K pH 9.0 containing
different NaCl concentrations (0.1, 0.2, 0.3, 0.4, and 0.5 M) after heat treatment at 80°C
for 10 min. compared to the control containing only Soycomil K. The graph shows that:

68
The highest increase in solubility (9.6%) was with 0.1M NaCl due to salting-in, whereas
the solubility decreased as NaCl increased. At 0.5 M NaCl the solubility decreased (8.19%)
less than control which has solubility 8.42% due to salting-out.
Figure 3.8 Effect of salt (NaCl) on solubility of SoyComil K pH9 at 80°C for10
min
3.3.2.4 Effect of some sugars on solubility of SoyComil K
Solubility of SoyComil K (6% protein pH 6.5) treated with different sugars
(sucrose, glucose, and lactose), at different concentrations (1, 6, and 7%) at different
temperatures (70°C for 30 min and 100°C for 10min) is presented in Figures 3.9 and 3.10.
Heat treatment (70°C for 30 min) of SoyComil K with sugars caused increase solubility.
Figure 3.9 shows that there was a significant difference (confidence level of 95% p<0.05)
between sugars’ effect on solubility of SoyComil K. the highest solubility was obtained
with sucrose in all concentrations. The difference in solubilities caused by sucrose and
lactose was not significant, whereas solubility caused by glucose was significantly lower
than that caused by sucrose and lactose. Heat treatment (100°C for 10min) of SoyComil K
with sugars cause decrease solubility due to Maillard reaction. Fig 3.10 shows the effect of
heat treatment of (6% SoyComil K (pH 6.5) in the presence of 1% (sucrose, lactose, and

69
glucose) at 100°C for 10 min on solubility. Overall the solubility of SPI by heat treatment
at 100°C for10 min decrease solubility due to maillard reaction, while at 70°C increase
solubility due formation of hydrophilic layer around the protein.
Figure 3.9 Effect of different sugars on solubility of 6% SoyComil K pH6.5 at
70°C for 30min

70
Figure 3.10 Effect of different sugars on solubility of 6% SoyComil K pH6.5 at
100°C for 10min
3.3.2.4.1 Glycation degree of SoyComil K
Suspensions of SoyComil K (6%), pH 9 containing different types of sugars
(10% glucose, 10% fructose, 10% lactose and 10% sucrose) were heated 70°C for 30 min.
The control was SoyComil K (6%) without sugar. The effect of heating in the presence of
different sugars on the free amino groups concentration is presented in Figure 3.11. The
free amino acid content of SoyComil K was expressed in terms of L-leucine. The result
shows that there was no significant difference in glycation degree between different sugars.
Figure 3.11 shows decrease in free amino groups caused by all sugars and highest decrease
was obtained by glucose (0.532 µg/ µl), which mean highest glycation, where lowest
glycation obtained with sucrose (0.5886 µg/ µl).
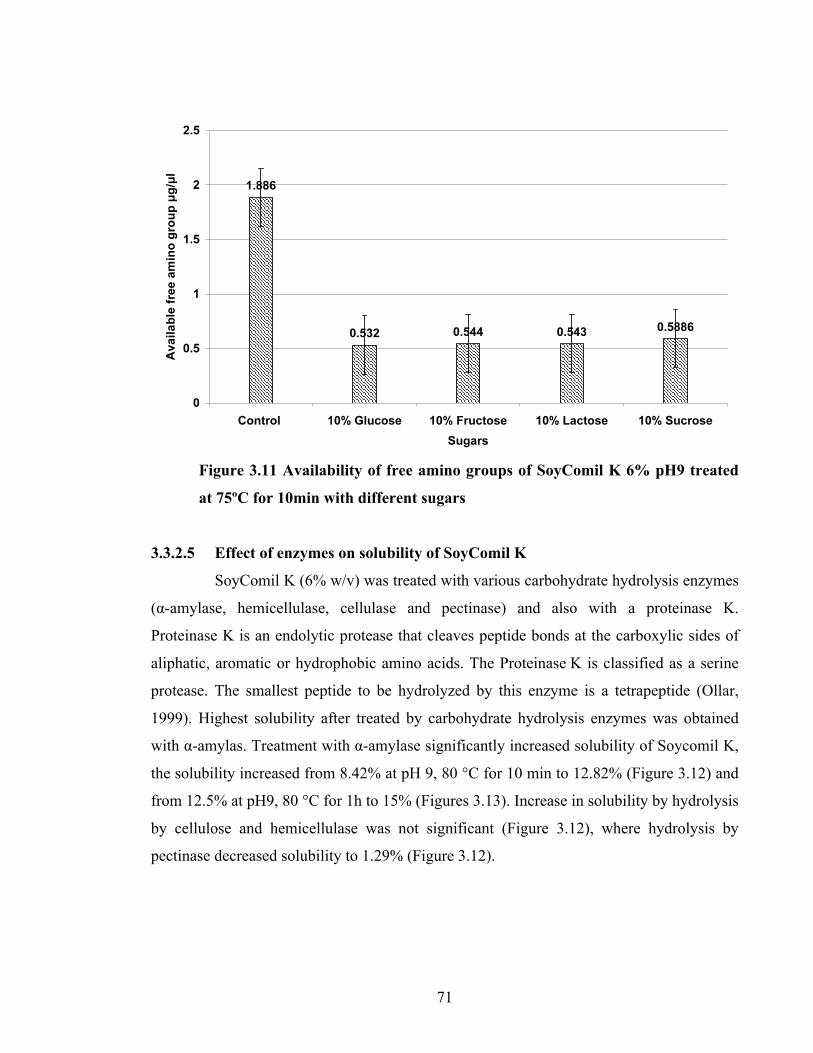
71
Figure 3.11 Availability of free amino groups of SoyComil K 6% pH9 treated
at 75ºC for 10min with different sugars
3.3.2.5 Effect of enzymes on solubility of SoyComil K
SoyComil K (6% w/v) was treated with various carbohydrate hydrolysis enzymes
(α-amylase, hemicellulase, cellulase and pectinase) and also with a proteinase K.
Proteinase K is an endolytic protease that cleaves peptide bonds at the carboxylic sides of
aliphatic, aromatic or hydrophobic amino acids. The Proteinase K is classified as a serine
protease. The smallest peptide to be hydrolyzed by this enzyme is a tetrapeptide (Ollar,
1999). Highest solubility after treated by carbohydrate hydrolysis enzymes was obtained
with α-amylas. Treatment with α-amylase significantly increased solubility of Soycomil K,
the solubility increased from 8.42% at pH 9, 80 °C for 10 min to 12.82% (Figure 3.12) and
from 12.5% at pH9, 80 °C for 1h to 15% (Figures 3.13). Increase in solubility by hydrolysis
by cellulose and hemicellulase was not significant (Figure 3.12), where hydrolysis by
pectinase decreased solubility to 1.29% (Figure 3.12).

72
Figure 3.12 Effect of enzymes on solubility of 6% SoyComil K . SoyComil K
was mixed with enzymes at optimum pH, temperature and time for each one,
and then adjusted to pH 9 and heated to 80°C for 10 min
To further increase solubility, both heating and mixing time of SoyComil K (pH9), 80°C
with α-amylase was increased. Figure 3.13 shows solubility increased with incubation time
(6 hours) from 12.5% to 15% and increasing mixing time to 24 hours cause increased
solubility from 12.5% to 17.1%. however, increasing the temperature to 100°C, after
hydrolysis by α-amylase, showed no effect on solubility with 6hour mixing time, yet
mixing SoyComil K with α-amylase for 24 hours caused solubility to decrease from 30% to
24% (Figure 3.13).

73
Figure 3.13 Effect of mixing time with α-amylase on solubility of 6% SoyComil
K. SoyComil K was mixed with α-amylase at optimum pH and temperature
then adjust pH to 9.0 and heated at different temperature for 1h
Where A: heat treatment at 80°C and B: heat treatment at 100°C
To increase solubility SoyComil K treated by proteinase K followed by heat treatment.
Results show there is increased in solubility of SoyComil K from 15.5% to 20.8% at pH9
and 80°C , but at high temperature (100°C) solubility decreased from 30% to 20.1%
(Figure 3.14).

74
Figure 3.14 Effect of proteinase K on solubility of 6% SoyComil K. SoyComil
K was mixed with proteinase K at optimum pH (7.5) and temperature (37°C)
then adjust pH to 9 and heated at different temperature for 1h
3.3.2.6 Intramolecular bonds in Soycomil K dispersions
3.3.2.6.1 Effect of solubilisation in different buffers on particle size of Soycomil K
Dispersing protein in solvents containing (0.3M NaCl, 0.2M 2-mercaptoethanol,
and 8M urea) can disrupt selective bond among peptides, which could lead to reductions in
particle size or decreases in molecular weight averages (Zhong et al., 2006). A decrease in
average particle size was found with the addition of each of the three reagents (0.3M NaCl,
0.2M 2-mercaptoethanol, and 8M urea) in both unheated and heated samples (Figure 3.15).
In all samples, the smallest particle size was obtained with sample treated by 8 M urea,
which indicates that the majority of bonds were hydrophobic bonds. Larger particle sizes
were obtained with disulfide bond reducing reagent (2-mercaptoethanol) and the largest

75
particle size was obtained with the sample treated by 0.3 M NaCl, which disrupts
electrostatic bonds.
Figure 3.15 Particle size profile of heat treated 6% SoyComil K pH 9 dissolved
in different buffers (reduction in particle size that should reflect the molecular
forces contributing to maintenance of protein structure)
Where A: Treatment at room temperature and B: treatment at 80°C for 10min

76
3.3.2.6.2 Effect of pH, temperature and protein concentration on SH groups of
SoyComil K
The results of heating SoyComil K at different concentrations (6, 10, and 18%
w/v) and different pH (4.6, 6.5 and 9) at different temperatures (room temperature, 50 and
80°C) for 10 min (Figure 3.16) show the highest SH- group concentration was obtained at
SoyComil K concentration 6%, 80°C and pH 9 was 0.68 µ mol/gm. However, the lowest
SH group concentration was at pH 4.6, SoyComil K concentration 18% and room
temperature (0.136 µ mol/gm). Under all experimental conditions, the highest SH group
was obtained at 6% where 18% protein showed the lowest value of SH groups.
Figure 3.16 Effect of pH, protein concentration and heat treatment on SH
groups of SoyComil K

77
3.3.2.7 Relationship between solubility and hydrophobicity in SoyComil K
Different solubilities of SoyComil K (highest and lowest) were chosen at the
same pH and temperature to show the relation between hydrophobicity and solubility.
Hydrophobicity data in Table 3.1 indicate that the highest increase in hydrophobicity
(300.12) was at pH 9, 80°C, solubility 8.42% and concentration 6%, whereas the lowest
increase in hydrophobicity (78.60) was at pH 4.6, room temperature, solubility 0.11% and
concentration 18%. Table 3.1 shows that hydrophobicity of SoyComil K at pH6.5 increased
from 97.64 to 262.1. As the solubility increased, the hydrophobicity increased under all
experimental conditions.
Table 3.1 Effect of pH, protein concentration and heat treatment on SoyComil
K solubility and hydrophobicity
Concentration
6% (w/v) 18% (w/v)
pH Temperature
%Solubility Hydrophobicity %Solubility Hydrophobicity
RT 2.21 220 0.65 116.24
50°C 3.61 255.30 0.90 142.10
pH9.0
80°C 8.42 300.12 1.35 159.30
RT 0.78 188.32 0.36 97.64
50°C 1.73 242.62 0.56 124.30
pH6.5
80°C 2.47 262.10 0.73 149.60
RT 0.31 157.39 0.11 78.60
50°C 0.40 229.01 0.19 109.07
pH4.6
80°C 0.63 246.30 0.29 130.20
Where RT: room temperature (22± 3°C)

78
3.3.3 Properties of SoyComil K emulsions
In many cases the application of soy proteins is limited due to incompatibility
between their solubility and other properties such as emulsifying activity (Wang et al.,
2008). To achieve desirable properties, many physical, chemical and enzymatic
modifications have been applied to soy protein.
3.3.3.1 Effect of different treatments on oil droplet size of SoyComil K
emulsions
The study was undertaken to determine the effect of different treatments
of SoyComil K on its emulsification ability. Due to the poor behaviour of SoyComil K as
emulsifier, which is expressed in the large oil droplet size for untreated SoyComil K
(unheated control) corresponding to D(3,2). D(3,2) is defined as the diameter of a sphere
that has the same volume/surface area ratio as a particle of interest or the ratio of the third
to second moment of the probability density function ( Liu et al., 2007; Pacek et al., 1998;
Downs and Sarv, 2003; chapter 2 section 2.2.8.1.1). SoyComil K (6%), pH7 was pre-
treated by enzymes (proteinase K and α-amylase), or mixed with 10% glucose and heat
treated (100°C for 10 min), as described in Chapter 2, section 2.2.8.1.1. The average
droplet size distribution D(3,2) of SoyComil K emulsions was measured immediately after
emulsion formation. Results of average droplet size D(3,2) are shown smallest drop;et size
was obtained with emulsion contain glucose in unheated and heated emulsions, which are
30.05 µm and 6.21 µm respectively (Figure 3.17). However, the largest droplet size was
obtained with non-heated and heated control (SoyComil K only), which are 39.82 µm and
7.0 µm respectively. Over all highest droplets size obtained with non-heated (SoyComil K
only), and smallest was with heat treated SoyComil K. There is no significant difference in
oil droplet size between emulsion treated by proteinase K and emulsion contain glucose.

79
Figure 3.17 Effect of different treatments of SoyComil K on the average
droplet size of SoyComil K emulsions.
Where A: are emulsions of non-heated 6% SoyComil K
B: are emulsions of 6% SoyComil K heated to 100°C for 10 min. .
3.3.3.2 Effect of different treatments on emulsion stability of SoyComil K
Emulsion stability caused by proteins can be used to define how these proteins
can be added to existing foods and how they can replace more expensive proteins
traditionally used. The stabilizing effect of proteins in emulsions results from the protective
barrier they form around fat droplets, which further prevents their coalescence (Kinsella,
1979). Long –term stability of emulsions depends basically on the thickness and strength of
adsorbed protein films at the oil- water interface (Zayas and Lin, 1989). Heat treatment,
enzyme hydrolysis (proteinase, α-amylase) and heat treatment in the presence of glucose
were applied to improve the emulsification properties of SoyComil K. The results in this
section show that heat treatment of SoyComil K before homogenization resulted in
emulsions with decreased droplet size and enhanced emulsion stability (Figures 3.18, 3.19,
3.20, 3.21 and 3.22). All emulsions of non-heated SoyComil K showed separation on the
first day they were made, even when SoyComil K was treated by enzymes, or mixed with

80
glucose beforehand (Figures 3.19, 3.20, 3.21 and 3.22). heat treatment of SoyComil K
suspensions before homogenization improve emulsion stability and prevent emulsion
separation (Figures 3.19, 3.20, 3.21 and 3.22), and this proved in previous study ( section
3.3.3.1), where heated suspension had small dropletsize.
Figure 3.18 Effect of different treatments of SoyComil K on the average
droplet size of SoyComil K emulsions at different times.
Where: A1, B1 and C1 are emulsions of non-heated 6% SoyComil K
A2, B2 and C2 are emulsions of 6% SoyComil K with Soycomil treated
with enzymes and glucose followed by heating to 100°C for10 min. .

81
Figure 3.19 Effect of heat treatment of SoyComil K on emulsion stability after
30 days
Where A: 6% SoyComil K, pH7, emulsified with 30% sunflower oil and
homogenized at 500 bar at room temperature. (Separation occurred on the 3rd day).
B: 6% SoyComil K, pH11 heated to 100°C for 10 min, emulsified with 30%
sunflower oil at pH7 and homogenized at 500bar at room temperature.

82
Figure 3.20 Effect of heat treatment of SoyComil K in the presence of glucose
on emulsion stability after 30 days
Where A: 6% SoyComil K (pH 7), emulsified with 30% sunflower oil and homogenized at
500bar at room temperature. (Separation occurred on the 3rd day).
B: 6% SoyComil K, pH11 heated to 100°C for 10 min, emulsified with 30%
sunflower oil at pH7 and homogenized at 500bar at room temperature (22± 3°C).
C: 6% SoyComil K mixed with 10% glucose (pH11 heated to 100°C for10 min) then
adjust pH7 and emulsified with 30% sunflower oil and homogenized at 500 bar at room
temperature.
D: 6% SoyComil K mixed with 10% glucose, pH7, emulsified with 30% sunflower
oil then homogenized at 500bar at room temperature and (separation occurred on the 3rd
day).

83
Figure 3.21 Effect of α-amylase treatment followed by heat treatment of
SoyComil K on emulsion stability after 30 days
Where A: 6% SoyComil K, pH 7, emulsified with 30% sunflower oil and homogenized at
500bar at room temperature. (separation occurred on 3rd day).
B: 6% SoyComil K, pH11 heated to 100°C for 10 min, emulsified with 30%
sunflower oil at pH7 and homogenized at 500bar at room temperature.
C: 6% SoyComil K treated by α-amylase for 6h, followed by adjustment to pH11
and heated to 100°C for 10 min, then re-adjustment of pH7 and emulsified with 30%
sunflower oil then homogenized at 500 bar at room temperature.
D: 6% SoyComil K treated by α-amylase for 6h then adjust pH7 and emulsified
with 30% sunflower oil at room temperature then homogenized at 500 bar at room
temperature.

84
Figure 3.22 Effect of protease treatment followed by heat treatment of
SoyComil K on emulsion stability after 30 days
Where A: 6% SoyComil K, pH 7, emulsified with 30% sunflower oil and homogenized at
500bar at room temperature. (separation occurred on 3rd day).
B: 6% SoyComil K (heated to 100°C for 10 min at pH11) then adjust pH7 and
emulsified with 30% sunflower oil then homogenized at 500bar at room temperature.
C: 6% SoyComil K treated by protease for 6h, followed by adjustment to pH11 and
heated to 100°C for 10 min, then re-adjustment of pH 7 and emulsified with 30% sunflower
oil then homogenized at 500 bar at room temperature.
D: 6% SoyComil K treated by protease for 6h then adjust pH7 and emulsified with
30% sunflower oil at room temperature then homogenized at 500 bar at room temperature.

85
3.3.3.3 Rheological measurements
3.3.3.3.1 Effect of different treatments of SoyComil K on emulsion viscosity
Viscosity of SoyComil K emulsions was measured after homogenization at
500bar at room temperature and after ageing for less than 20 min. Figures 3.23, 3.24, 3.25
and 3.26 show typical curves of viscosity as a function of shear rate of emulsions prepared
with SoyComil K, which had undergone different treatments (heat treatment, enzymatic
hydrolysis “ proteinase and α-amylase”, and mixed with 10%glucose). It is clear that the
rheological response of the emulsion was highly dependent on SoyComil K treatment.
Emulsions of heated SoyComil K solution had under all circumstances a higher viscosity
than unheated emulsions. There was a linear relationship between shear rate and viscosity.
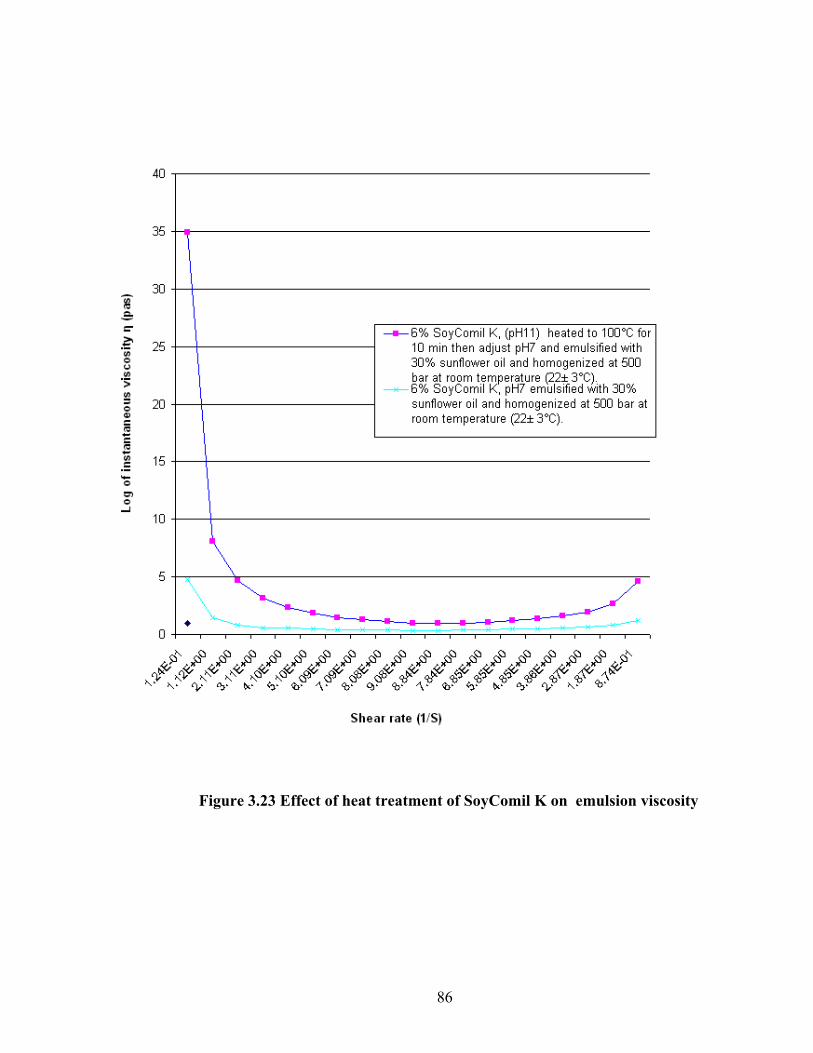
86
Figure 3.23 Effect of heat treatment of SoyComil K on emulsion viscosity

87
Figure 3.24 Effect of heat treatment of SoyComil K in the presence and
absence of glucose on emulsion viscosity

88
Figure 3.25 Effect of α-amylase treatment followed by heat treatment of
SoyComil K on emulsion viscosity

89
Figure 3.26 Effect of proteinase treatment followed by heat treatment of
SoyComil K on emulsion viscosity
3.3.3.4 Confocal laser scanning microscopy of SoyComil K emulsions
The largest benefit of confocal laser scanning microscopy (CLSM) images was to
elucidate the sizes and locations of all the droplets in the image. It was then possible to
examine detailed structural information at a fixed point to determine whether any changes
in microstructure could be detected that might explain the above rheological changes.
Figures 3.27, 3.28, 3.29, 3.30, 3.31, 3.32, 3.33 and 3.34 show the images of emulsions (of
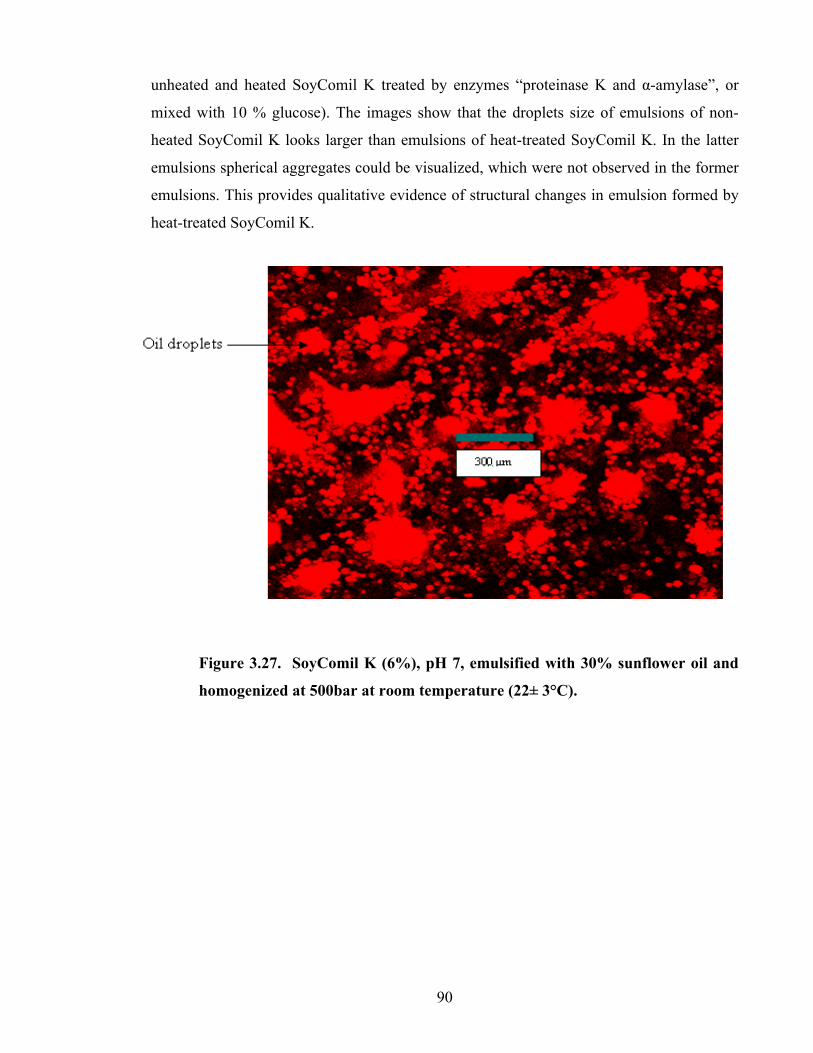
90
unheated and heated SoyComil K treated by enzymes “proteinase K and α-amylase”, or
mixed with 10 % glucose). The images show that the droplets size of emulsions of non-
heated SoyComil K looks larger than emulsions of heat-treated SoyComil K. In the latter
emulsions spherical aggregates could be visualized, which were not observed in the former
emulsions. This provides qualitative evidence of structural changes in emulsion formed by
heat-treated SoyComil K.
Figure 3.27. SoyComil K (6%), pH 7, emulsified with 30% sunflower oil and
homogenized at 500bar at room temperature (22± 3°C).

91
Figure 3.28 SoyComil K (6%), pH11 heated to 100°C for 10 min, emulsified
with 30% sunflower oil at pH7 and homogenized at 500bar at room
temperature (22± 3°C).

92
Figure 3.29 SoyComil K (6%) mixed with 10% glucose, pH 7, emulsified with
30% sunflower oil then homogenized at 500bar at room temperature (22±
3°C).

93
Figure 3.30 SoyComil K (6%) mixed with 10% glucose (heated to 100°C for10
min pH11) then adjust pH7 and emulsified with 30% sunflower oil and
homogenized at 500 bar at room temperature (22± 3°C).
.

94
Figure 3.31 SoyComil K (6%) K treated by α-amylase for 6hs then adjusts pH7
and emulsified with 30% sunflower oil at room temperature then homogenized
at 500 bar at room temperature (22± 3°C).

95
Figure 3.32 SoyComil K (6%) treated by α-amylase for 6hs, followed by
adjustment to pH11 and heated to 100°C for10 min, then re-adjustment of pH7
and emulsified with 30% sunflower oil then homogenized at 500 bar at room
temperature (22± 3°C).

96
Figure 3.33 SoyComil K (6%) treated by proteinase for 6hs then adjust pH7
and emulsified with 30% sunflower oil at room temperature then homogenized
at 500 bar at room temperature (22± 3°C).

97
Figure 3.34 SoyComil K (6%) treated by proteinase for 6hs, followed by
adjustment to pH11 and heated to 100°C for10 min, then re-adjustment of pH7
and emulsified with 30% sunflower oil then homogenized at 500 bar at room
temperature (22± 3°C).

98
3.4 Discussion
3.4.1 Physicochemical properties of Soycomil K
3.4.1.1 SDS-PAGE electrophoresis Reducing and non-reducing SDS-PAGE of supernatants and pellets of
SoyComil K (pH9) was carried out to identify the soluble and insoluble fractions (Figure
3.1). To elucidate the factors that determine solubility of soy protein, SDS-PAGE of
SoyComil K, soy Arcon ® SJ and SPI at pH7 (Figures 3.2 and 3.3) were studied. The major
proteins of soy protein are glycinin (11S) and β- conglycinin(7S). These two proteins
account for 70% of total soy protein (Abtahi and Aminlari, 1997). In this study, the
electrophoretic patterns show 7S and 11S globulin subunits for the all samples. The results
suggest the formation of complexes between the 7S and 11S subunits, which were induced
by heat treatment (Yamagishi et al., 1983). The major constituent bands in all samples were
situated between 6-64 KDa. The intensity of β- conglycinin subunits were more than
glycinin under non-reducing conditions. Because glycinin subunits are associated through,
intermolecular disulfide bridges which are buried in the interior part of the molecules,
(Romagnolo et al., 1990) its dissociation by SDS under non-reducing conditions was very
little compared to β- conglycinin. The lack of high intensity bands in the pellet of
SoyComil K under non-reducing conditions may be due to aggregation of protein at the
origin of lanes, which was not dissociated by SDS (Yamagishi et al., 1983).
The intensity of bands was increased under reducing conditions, because 2-
mercaptoethanol cleaved the disulfide bonds of large protein aggregates. Lanes of 6%
SoyComil K (Figure 3.1 lanes 1, 2, 6 and 7) showed bands with lower intensity than 1% of
SoyComil K (Figure 3.1 lanes 3, 4, 8, 9 and 10). It is possible I hypothesize that when
SoyComil K is present at high enough concentration to form aggregates, it does not enter
the gel, but stay at the origin of lanes, while at lower concentrations various types of
soluble complexes may form (Roesch, and Corredig, 2005). SoyComil K shows less bands
with lower intensity than soy Arcon ® SJ and SPI, which could be due to its poor
solubility.
In summary it can be said that the intensity and number of bands under reducing conditions
are more than those under non- reducing conditions, due to the ability of 2-mercaptoethanol
to cleave disulfide bonds thereby facilitating the solubilisation of large protein aggregates

99
held together by disulfide bridges, which cannot be achieved by SDS (Yamagishi et al.,
1983).
3.4.1.2 Differential scanning calorimetry (DSC)
Differential scanning calorimetry (DSC) can reveal structural and conformational
changes of proteins during heat treatment. The denaturation temperature (peak of
denaturation) indicates the protein’s thermo-stability, while ΔH (denaturation enthalpy) is
an indication of hydrophobic/hydrophilic interactions and compactness of proteins (Hua et
al., 2005). The results show that SoyComil K used in this study had a denaturation degree
of 27.99% compared to native laboratory prepared soy protein concentrate (Figure 3.4 and
3.5). The degree of protein denaturation was calculated by dividing ΔH associated with the
denaturation peak of glycinin of pretreated protein (Soycomil) to that of an untreated SPC
(native) protein (ΔH treated/ ΔH native) (Sorgentini et al., 1995; Renkema, 2001). The
difference between SoyComil K and native soy protein concentrate was due to partial
denaturation of SoyComil K, as a result of its isolation procedure. The appearance of
exothermic peaks of β-conglycinin and glycinin at 74.72 °C and 102.79 °C respectively,
indicates that SoyComil K was not completely denaturated during manufacturing.
The denaturation temperature of glycinin of SoyComil K is higher than native laboratory
prepared soy protein concentrate. This could that be due to the different genetic variants of
glycinin which display different thermostability (Lakemond et al., 2002a). On the other
hand, it could also be due to the formation of a more stable conformation of glycinin during
the isolation procedure of SoyComil K.
The denaturation temperature of glycinin was significantly higher (80 ºC) than that of β-
conglycinin (76ºC) in both native laboratory prepared soy protein and SoyComil K,
confirming the findings of Renkema and Van Vliet, (2002). The data show broad
exothermic transitions in the DSC thermogram. This could be explained by the fact that
both the β- conglycinin and glycinin fractions are composed of several genetic variants,
which have different thermal stabilities (Maruyama et al., 1998).

100
3.4.2 Factors influencing Soycomil K solubility
3.4.2.1 Effect of pH, temperature and protein concentrations on SoyComil K
solubility
Protein structure can be modified by different treatments to improve specific
functional properties, heating being one of the more frequently methods used for that
purpose (Sorgentini et al., 1995). In this study, the effect of heat treatment under different
conditions (temperature, protein concentration, and pH) on functional properties such as
solubility was investigated (figure3.6). Solubility is the amount of a solute that can be
dissolved in solvent. Solubility refers to proteins that are not aggregated or are present in
aggregates too small to sediment upon centrifugation (Renkema et al., 2000). The main
problem of SoyComil K quality is its insolubility and resistance to heat. This thermal
stability behaviour is attributed to its structure. In this study, it was observed that solubility
dramatically increased as the pH increased. The solubility was at its lowest at pH 4.6,
which is the isoelectric point of soy protein, where the electrostatic repulsive forces are
insufficient to prevent extensive aggregation (Malhotra and Coupland, 2004). Solubility
increased progressively the further the pH was from the isoelecric point and solubility was
at its highest at pH 9. This was due to increased electrostatic repulsive forces between
particles, which weakened the hydrophobic associations and resulted in increased solubility
(Mo et al., 2006). Under alkaline conditions, some hydrogen bonds in protein molecules are
broken, causing it to assume a configuration somewhat more open than its original
configuration, causing many buried peptide groups and side chains to become exposed to
solvent (Mirsky and Pauling, 1936). It was observed that the solubility of all samples were
pH dependent. It was also observed that non-heated SoyComil K had lower solubility than
the heated version at all studied pH, the increased solubility corresponding to increased
temperature could be due to dissociation of aggregates (oligomers) into subunits of smaller
molecular weight (Shimad and Cheftel. 1988 and Rangavajhyala et al., 1997) as well as
partial denaturation of monomers. Utsumi et al., (1984) has shown that thermal treatment
of soy protein induces formation of soluble macro complexes between the subunits of 7S
globulin and basic subunit of 11S globulin. As the concentration of SoyComil K increased,
its solubility decreased, probably caused by increased protein-protein interaction, causing
an increase in the burial of charged groups (Pace et al., 2004; Wagner et al., 2000 and
Sorgentini et al., 1995). Lower solubility at higher protein concentration, may also be

101
caused by intermolecular S-S bonds resulting in while at lower concentrations various types
of soluble complexes may form (Roesch, and Corredig, 2005).
3.4.2.2 Effects of pH, temperature and concentration on turbidity of SoyComil K
Turbidity was measured by light scattering, where sample in buffer will cause an
incident light beam to be scattered in directions other than a straight line through a
sample.The highest increase in turbidity was at pH 4.6, whereas the lowest increase in
turbidity was at pH 9 (Figure. 3.7). Under all experimental conditions, the highest turbidity
was obtained with 18% protein, whereas 6% protein showed the lowest turbidity. Non-
heated SoyComil K had higher turbidity than heat-treated (Figure. 3.7).
Thermal treatment of SoyComil K decreased turbidity, probably due to dissociation of
aggregates, leading to increased solubility (Utsumi et al., 1984). Figure 3.7 shows that
turbidity increased as pH decreased and the highest turbidity was obtained at the iso-
electric point, pH 4.6. The decrease in turbidity observed with increase in pH could be due
to increased dissociation of aggregates (Sripad and Rao, 1987), and increase of electrostatic
repulsion (Alting et al., 2002). As the concentration of SoyComil K increased the turbidity
increased, due to increased association of aggregation by protein-protein hydrophobic
interactions (Sorgentini et al., 1995 and Renkema et al., 2002).
3.4.2.3 Effect of salt (NaCl) on SoyComil K solubility
Protein solubility has long been known to be very sensitive to salt (Jenkins,
1998). Salts affect in widely different manners the properties of proteins such as their
stability and solubility (Arakawa and Timasheff, 1984). The cations and /or anions coming
from salts in solution, greatly affects protein solubility (Puppo and Añón, 1998). The effect
of salt concentration on protein solubility depends on a salting-in region at low salt
concentrations and a salting-out region at high ionic-strength solutions. The salting-in
region is a result of favourable electrostatic interactions between the salt ions and the
charged residues of the protein. At higher salt concentrations, most salt ions are excluded
from the protein’s domain due to unfavourable interactions between the salt ions and the
hydrophobic residues of the protein, producing salting-out behaviour (Curtis et al., 1998).
Figure 3.8 shows that SoyComil K solubility increased up to NaCl concentration of 0.4 M
(salting-in), and thereafter started to decrease (salting-out). The increase in NaCl content >
0.4M reduced the solubility (salting out), due to the competition between the protein and

102
saline ions for water molecules. Consequently, the water in the protein neighbourhood was
removed increasing the protein-protein interaction, thus leading to aggregation of the
protein molecules, followed by precipitation (Ferreira Machado et al., 2007). At low salt
concentration solubility of protein increased due to salting in phenomenon by which saline
ions interact with groups of opposite protein charges to form a double layer of ionic groups,
thereby reducing the electrostatic interaction among the protein molecules and increasing
their solvation (Hall, 1996).
3.4.2.4 Effect of some sugars on solubility of SoyComil K
Solubility of SoyComil K with out sugars increased as temperature increased
from 70 °C to 100 °C (figures3.9 and 3.100). At higher temperatures, some reactions may
take place, such as breakdown of S-S bonds with release of H2S, release of NH3 from amide
groups, dissociation of subunits and/ or breakdown of these subunits into compounds of
small molecular weight, which may be responsible for the enhanced protein solubility
(Shimada and Cheftel, 1988). In other hand, the onset denaturation temperature β-
conglycinin is 70°C, while that of glycinin is 80°C at neutral pH (Renkema and Van Vliet,
2002). Increased solubility of SoyComil K caused by sugars could be due to hydroxyl
groups present in sugar units, which react with hydrophilic amino acid side chains, which
contribute to protein-sugar interactions in aqueous solution. These newly formed dipole-
dipole interactions could either form a hydrophilic layer around the protein unit and,
therefore increase the dispersibility of protein through protein hydration and/or alter the
protein intermolecular interactions in such a way that folding and even dissociation may
occur (Baier and Mcclements, 2005; Ryan and Brewer, 2005). Highest solubility at 70 °C
was obtained by sucrose (3.9), which changes the quality of the aqueous solvent from a
thermodynamically-poor to thermodynamically-good one in the presence of sucrose. It is
known that low molecular weight sugars can give rather strong “polyfunctional” hydrogen
bonds with protein molecules in aqueous medium. . The results indicate that protein-sugar
reaction at low temperature (70°C for 30min) is appropriate to increase the solubility of
SoyComil K, whereas at high temperature (100°C for 10min), decreased solubility is found
9figure 3.10). This could be due to the Maillard reaction, which caused a decrease in pH
due to formation of acidic by-products and an increase covalent protein cross-linking,
which would reduce protein solubility (Gu et al., 2008).

103
3.4.2.4.1 Glycation degree of SoyComil K
Glycation of SoyComil K was investigated by measuring the free amino group
availability using the OPA (ortho-phthaldiadehyde) method (Chevalier et al, (2001). Figure
3.11 shows decrease in free amino groups caused by all sugars. Decrease in free amino
groups could be attributed to glycation or structural modifications of SoyComil K such as
protein polymerization, and cross-linking. Sucrose also resulted in glycation although it is
not a reducing sugar. In this case it is assumed that there is isomerisation or breakdown to
glucose and fructose under the experimental conditions that allows reaction with protein to
occur (Jackson and White, 2006). This result seems to be contradictory with Campbell et
al., (2008), who found that no glycation occurred with SPI (soy protein isolates) in
presence of the non-reducing sugar (sucrose). No development of yellow or brown colour
was visually noticeable in any of the samples. It is concluded that these result reflect
glycation in the early stage of Maillard reaction.
3.4.2.5 Effect of enzymes on solubility of SoyComil K
Contamination of SoyComil K by insoluble carbohydrates (cellulose
hemicellulose, pectin, and trace amount of starch) could have resulted in a protective layer
around the soy protein during industrial preparation, which could be reason for its
resistance to heat treatment. Therefore, it was treated by carbohydrate hydrolysis enzymes
(α-amylase, cellulase, hemicellulase, pectinase), and proteinase K before heat treatment.
Enzymatic hydrolysis can be responsible for (1) a decrease in hydrolysate molecular weight
(2) increase in ionisable group number, and (3) exposure of previously concealed
hydrophobic groups (Lamsal et al., 2007). The results show that:
Treatment of SoyComil K by α-amylase prior to heat treatment increased its solubility more
than heat treatment only at the same conditions of pH and concentration up to 80°C
(Figures 3.12 and 3.13). To my knowledge, no work has been reported to date evaluating
the effect of α-amylase on solubility of soy proteins. Oligosaccharide (e.g sucrose and
lactose) and polysaccharides (e.g starch and pectin) contents in soy protein concentrate is
approximately 11.1% (Abdel-Aziz et al., 1997), which may contribute to decreased
solubility of SoyComil K by forming a protective layer around the soy protein causing a
decreased susceptibility to heat treatment. α-amylase might gradually remove the protective
layer of polysaccharides at the surface of protein rendering it more susceptible to heat
treatment. The time of both heating and mixing of SoyComil K (pH9) with α-amylase were

104
increased with the aim to increase solubility even more. Results show a gradual increase in
solubility with incubation time, up 80°C to 24 hours compared to the control (Figure 3.13).
However, increasing heating temperature to 100°C after treatment by α-amylase for
different periods showed no increase in solubility, probably because at 100°C both soy
protein units (glycinin and β-conglycinin) are denatured (Renkema and Van Vliet, 2002).
At this temperature (100°C) the interior of the tertiary structure of soy protein is disrupted
(Elizalde et al., 1996), which results in exposure of hydrophobic regions originally buried
within the protein molecule to the aqueous phase, leading to decreased solubility. Soycomil
in Figures 3.9 and 3.10 was heated at 100 °C for 10min and showed increased solubility.
On the other hand, heat treatment 100 °C for 1h caused a decrease in solubility (Figurs 3.13
and 3.14). The solubility decreased as the heating time was increased, indicating that the
hydrophobic characteristic of protein surface was enhanced as heating time was increased
(Zhu and Damodaran, 1994). On the other hand, enzymatic hydrolysis (α-amylase), might
have gradually remove the protective layer (starch) at the surface of protein rendering it
more susceptible to heating time. Other enzymes were used (cellulase and hemicellulase) to
attempt to hydrolyse the insoluble carbohydrates (cellulose and hemicellulose) present in
SoyComil K, resulting in no significant increase in solubility. The sample treated by
pectinase decreased in solubility (1.29%) compared to control (8.42) as shown on Figure
3.12. This might be because the pH of the sample had to be adjusted to pH 4.5, which is the
optimum pH of pectinase activity ((manufacturer’s instructions of Sigma campany in UK).
Heating of SoyComil K (6%, pH9) to 80°C after treatment by proteinase K was carried out
to attempt to increase solubility even more. Sample solubility increased from 15.5% to
20.8% (Figure 3.14). This could be due to the reduction of its secondary structure due to
cleavage into smaller polypeptide units by the protease (Kong et al., 2008). However, heat
treatment of sample to 100°C after hydrolysis by proteinase K, resulted in decreased
solubility (Figure 3.15), which might have arisen from increase in exposed hydrophobic
residues leading to increased hydrophobic interaction between peptides (Lamsal et al.,
2007).
Overall the treatment of SoyComil K by proteinase K and carbohydrate hydrolysis enzymes
increased the solubility more than heat treatment alone at the same pH and concentrations
up to 80°C. However, treatment at 100°C for 1h decreased the solubility, due to increased
hydrophobic interactions.

105
3.4.2.6 Intramolecular bonds in Soycomil K dispersions
3.4.2.6.1 Effect of solubilisation in different buffers on particle size of Soycomil K
The stabilization of the soy protein structure may involve electrostatic bonding,
hydrophobic bonding, and disulfide linkage (Utsumi and Kinsella, 1985). In this study, we
have attempted to identify only the largest forces that lead to the structural changes of
SoyComil K caused by heat treatment. Dispersing non-heated and heated (80°C/10 min)
SoyComil K in solvent containing reagents (0.3M NaCl, 0.2M 2-mercaptoethanol, and 8M
urea), can disrupt selective interactions among polypeptides and subunits, which could lead
to reduction in particle size that should reflect the molecular forces contributing to
maintenance of protein structure (Zhong et al., 2006). Hydrophobic interactions and
hydrogen bonding can be disrupted by urea (Zou et al., 1998) whereas 2-mercaptoethanol
reduces disulfide bonds to sulfhydryl groups. The electrostatic interaction between proteins
or peptides can be disrupted by addition of NaCl, where the counter-ions of NaCl interrupt
electrostatic interactions leading to the breakdown of electrostatic bonds (Damianou and
Kiosseoglou, 2006). The results displayed in Fig 3.15 indicate that hydrophobic and
disulfide bonds are more important in maintenance of the SoyComil K structure than
electrostatic interaction.
3.4.2.6.2 Effect of pH, temperature and protein concentration on SH groups of
SoyComil K
Sulfhydryl (SH) groups and disulfide (S-S) bonds influence significantly the
functional properties of food proteins and play important roles in the formation of relatively
rigid structures such as protein gels or dough (Shimada and Cheftel, 1988, Opstved et al.,
1984 and Ou et al., 2004). Heat-induced change in SH group and S-S bonds result in
transformation between SH and S-S group, thus the content of SH group and S-S bonds and
their change are often assayed when exploring the properties of protein in foods (Shimada
and Cheftel, 1988 and Ou et al., 2004). In this study, it was observed that as the pH
increased the total SH group increased, because S-S bonds are degraded by alkali treatment,
which involves an SH group intermediate (Shimada and Cheftel, 1988 and Monahan et al.,
1995). On the other hand the increased pH could have caused increase in solubility (Section
3.3.6.2), resulting in more accessibility of SH-groups to DTNB reagent. SoyComil K has
the lowest SH groups at pH4.6 (Figure 3.16), which is close to the isoelectric point of soy
protein, where the electrostatic repulsive charge is at it lowest and proteins aggregate

106
resulting in reduced exposure of SH to DTNB reagent (Malhotra and Coupland, 2004). SH-
groups increased as temperature was increased. Heat treatment causes exposure of hidden
SH groups bonds as protein unfolded, reflecting an increased denaturation degree (Wong
and Kitts, 2003). The compact globular structure of soy protein have the hydrophobic
regions in the interior, which are stabilized by disulfide bonds ( Lamsal et al., 2007) and the
protein can not be fully denatured until the interior tertiary structure is disrupted. Therefore,
it requires more intensive thermal treatment to be fully denatured. The SH groups decreased
markedly as protein concentration increased since the oxidation of SH group to S-S bonds
is favored at high protein concentration due to increased protein-protein interaction
(Shimada and Cheftel, 1988 and Sorgentini et al., 1995). It can be concluded from the data
presented in this study that the SH group increased with increased temperature and pH and
decreased with increased protein concentration and decreased pH.
3.4.2.7 Relationship between solubility and hydrophobicity in SoyComil K
Hydrophobicity is the association of non-polar groups or molecules in an aqueous
environment, which arises from the tendency of water to exclude non-polar molecules
(Kaliszan, 1998). Hydrophobicity of protein is an important structural property since it
makes possible to predict its behaviour at oil/water interfaces (Petruccelli and Añón, 1994)
and is an important factor that controls protein solubility (Nakai, 1983). Measurement of
hydrophobicity might be useful to detect subtle changes in protein structure and
functionality that occurs during processing. The highest and lowest solubility of SoyComil
K was chosen at pH (4.6, 6.5 and 9), at concentrations of 6% and 18%, and at temperatures
(RT, 50, and 80°C) to show the relationship between hydrophobicity and solubility.
Hydrophobicity data in Table 3.1 indicate that hydrophobicity increased as solubility
increased at all pH and temperatures. Decreased hydrophobicity correlated with decreased
solubility, probably due to formation of protein aggregates which buried the hydrophobic
sites (Jung et al., 2005). Decreased hydrophobicity correlating to decreased solubility can
be explained in two ways (a) at low solubility more hydrophobic proteins undergo
aggregation, so that only the hydrophilic ones remain soluble; and (b) as the proteins
aggregate, hydrophobic zones are hidden, leaving soluble aggregates with low surface
hydrophobicity (Wagner et al., 2000).

107
3.4.3 Properties of SoyComil K emulsions
3.4.3.1 Effect of different treatments on oil droplet size of SoyComil K emulsions
Soy proteins aid in the formation of emulsion by decreasing the interfacial tension
between water and oil. However, soy proteins, because of their globular aggregated
structure, do not unfold and adsorb at the interface, but rather form a thick interfacial layer,
which acts as a physical barrier to coalescence (Roesch and corredig, 2003). The average
droplet size distribution (D3,2, surface weighted mean) of SoyComil K emulsions from
heated and non heated suspensions was measured by laser light diffraction using a
Mastersizer 2000 instrument. Results suggest that heating before homogenization improved
the emulsification properties of SoyComil K (Figure 3.17), probably due to dissociation of
aggregates and/or unfolding of globular proteins (Roesch and Corredig, 2003). Emulsions
of nonheated SoyComil K behaved poorly as emulsifiers, which is shown by the high
droplet size corresponding to surface weighted mean (D3,2). High D(3,2) was observed for
non-heated SoyComil K due to lower surface activity or due to the fact that the interfacial
film formed was less resistant to coalescence during homogenization ( Comas et al., 2006).
There was no considerable size difference in oil droplets of emulsions formed by soyComil
K hydrolyzed by enzymes in same heat treatment (Figure 3.17).
3.4.3.2 Effect of different treatments on emulsion stability of SoyComil K
Emulsion stability caused by proteins can be used to define how these proteins
can be added to existing foods and how they can replace more expensive proteins
traditionally used. The stabilizing effect of proteins in emulsions results from the protective
barrier they form around fat droplets, which further prevents their coalescence (Kinsella,
1979). Long –term stability of emulsions depends basically on the thickness and strength of
adsorbed protein films at the oil- water interface (Zayas and Lin, 1989). SoyComil K is a
poor emulsifier, which is expressed in the large droplet size and phase separation for non-
treated SoyComil K (unheated control) corresponding to D(3,2) (Figures 3.17 and 3.18).
Chemical, physical and enzymatic modifications have been applied to SoyComil K to
improve emulsifying properties. Stability of emulsions made with non-heated SoyComil K
at 25°C at different treatments showed separation on the first day and an increase in droplet
size (Figures 3.17, 3.18). Stability of emulsions of heated SoyComil K was improved,
because thermally treated soy protein prevented creaming and coalescence of emulsions
(Comas et al., 2006). This would suggest that either heat treatment made the protein more

108
surface active or more of the protein became associated with the interface as part of
adsorbed protein aggregates.
3.4.3.3 Rheological measurements
3.4.3.3.1 Effect of different treatments of SoyComil K on emulsion viscosity
Viscosity of oil-in-water emulsions is a measure of the emulsion resistance to
flow (Raikos, 2006 and Añón, et al., 2001). Viscosity can be used to evaluate the
thickening ability of soy proteins that are of practical interest in fluid foods. The viscosity
of protein dispersions is mostly influenced by the hydrodynamic properties (molecular
weight, size, hydration, frictional ratio and shape of the molecule) of the component protein
(Zheng et al., 2008). Emulsions prepared with SoyComil K, which had undergone different
treatments (heat treatment, enzymatic hydrolysis “proteinase and α-amylase”, and mixed
with 10%glucose) had studied (Figures 3.23, 3.24, 3.25 and 3.26). Emulsions of heated
SoyComil K solutions had under all circumstances a higher viscosity than non-heated
emulsions. Viscosity increased as a result of water uptake by the system following
hydrogen bond disruption due to heating (Koksel et al., 2008). Increase in viscosity may be
due to different factors such as a variation in viscosity of the aqueous phase itself, a change
in the volume fraction of solute, an increasing droplet concentration and/or variation in the
droplet size (Granger et al., 2003). Increased viscosity could be due to decreased oil droplet
size of emulsions (Figure 3.17) which increased the total surface area of the emulsions
(Granger et al., 2005). The results show viscosity decreased as the shear rate increase,
showing non-Newtonian rheological behaviour, because at high shear rates the polymer
network of emulsion completely breaks up due to shear forces, (Herrera et al, 2008).
3.4.3.4 Confocal laser scanning microscopy of SoyComil K emulsions
Confocal laser scanning microscopy (CLSM) minimizes scattered light from out-
of-focus structures, and permits the identification of several compounds through use of
different fluorescence labels. Therefore, CLSM can be applied as non-destructive
visualization technique for micro-particles. Moreover, CLSM allows visualization and
characterization of structures not only on the surface, but also inside the particles, provided
the material is sufficiently transparent and can be fluorescently labelled. By collecting
several coplanar cross sections, a three-dimensional reconstruction of the inspected objects
is possible (Lamprecht et al., 2000). In the current study, images of emulsions of SoyComil

109
K treated at different conditions (heat treatment, enzymes “proteinase K and α-amylase”
and 10 % glucose) have been produced in order to identify any micro-structural difference.
Therefore, as shown in Figures 3.27, 3.28, 3.29, 3.30, 3.31, 3.32, 3.33 and 3.34 the droplets
size of emulsions from non-heated SoyComil K solution looks larger than of emulsions
from heated protein solutions. This is also a confirmation of average droplet size (D3,2 ) of
non-heated emulsions being larger than heated emulsion (30.05µm, versus 7 µm (Figure
3.17). The much larger apparent droplet size in confocal images as compared with these
measured by Master Sizer 2000, could be a result of emulsion instability.

110
3.5 Conclusions
I- The highest increase in solubility was obtained by heat treatment of 6% SoyComil K,
pH9 at 100 °C for 10 min, the solubility increased from 8.42% to 30%, while at 80°C for
10 min was obtained with 0.1M NaCl (6% SoyComil K) at pH 9, the solubility increased
from 8.42% to 9.6%.
II- Heat treatment in the presence of sugars
The highest increase in solubility was obtained with heat treatment of 6% protein pH 6.5
with sucrose (1%), at 70°C for30 min. The solubility increased from 2.44% to 7%. The
highest degree of glycation was obtain with glucose and lowest was with sucrose. Under
these heating conditions (70°C for 30 min), glycation increased the solubility of Soycomil
(chapter 3 sections 3.3.2.4 and 3.3.2.4.1). At high heating temperature (100°C), glycation caused a decrease in solubility probably
due to increased covalent protein cross-linking via Maillaird reaction.
III- Enzymes treatment
The highest increase in solubility (12.82%) was obtained with α-amylase after heat
treatment (6% soyComil K pH 9) at 80°C for 10 min, this could have been due to removal
of a protective layer of insoluble soy polysaccharides which co-purified with the protein
during the manufacturing process (chapter 1 section 1.5.2) rendering it more susceptible to
heat treatment. However mixing with α-amylase for 24 hours followed by heat treatment at
100°C decreased the solubility (from 30% to 24 % compared to control), due to increased
hydrophobic interactions. Treatment by proteinase K increased solubility (20.8%) of
SoyComil K (6% at pH9) at 80 °C for 1hour. This could be due to the enzymatic release of
smaller polypeptide units. However, treatment by proteinase K followed heat treatment at
100°C decreased the solubility (from 30% to 20.4% compared to control), due to increased
hydrophobic interactions.
IV- SoyComil K emulsions
SoyComil K treated with glucose resulted in emulsions with the smallest average
droplet size (section 3.3.3), indicating improved emulsifying ability. Since Soycomil
treated with glucose had the highest glycation degree, it can be concluded that increased
glycation with glucose correlated with increased emulsifying ability and water holding
capacity.

111
V- Rheological measurements (emulsion viscosity)
Emulsions of heated SoyComil K solution (SoyComil K emulsions as prepared in
section 2.2.3.1) had under all circumstances a higher viscosity than non-heated emulsions.
Over all in the present study, attempts were made to increase solubility of Soycomil
by physical, chemical and enzymatic modifications, and also to improve functional
properties such as emulsification. This study has been undertaken to investigate ways to
improve its solubility, as well as understand the molecular basis of its insolubility to apply
at industry applications. The results show that SoyComil K used in this study had a
denaturation degree 27.99% compared to native laboratory prepared soy protein
concentrate and hydrophobic and disulfide bonds are the main bonds maintaining the
SoyComil K structure. Solubility of SoyComil K was low compared to commercial soy
protein concentrates (Arcon ® SJ) where their highest solubility at pH9 and heat treatment
(80°C for10 min) are 8.42 (SoyComil K) and 28.5% (Arcon ® SJ. This is confirmed by gel
electropherisis, where Soycomil K has lower intensity and number of bands than Arcon ®
SJ and SPI at the same concentration and pH under non-reducing conditions. However the
band intensity looks similar under reducing condition due to breakdown of disulfide bonds,
which is responsible of SoyComil K insolubility. This is also confirmed by total SH
groups-content of nonheated SoyComil K 8% (pH7) which was 0.385 µmol/gm compared
to that of SPI 8% (pH7), which was 14.8 µmol/gm (Campbell et al., 2008). This provides
evidence that SoyComil K has more S-S bonds than SPI which could be responsible for its
insolubility.
The processing methods for laboratory preparation of native soy protein concentrates (SPC)
and SoyComil K is illustrated in chapter 2 and chapter 1 (chapter 2 section 2.2.1 and
chapter 1 section 1.5.2 ). The main difference between the processing of native soy protein
concentrates (SPC) and SoyComil K is the use alcohol (ethanol). Using ethanol during
processing method of SoyComil K reduced its solubility, due to denaturation of protein by
aqueous alcohol (Zheng et al., 2008), which resulted in protein aggregation due to the
removal of water surrounding the protein molecules (Mccurdy, 1990; Hua et al., 1996).
Van der Aar et al., (1982) suggested that the combination of alcohol and water in the
solvent changed the three dimensional structure of the protein, resulting in fewer proteins
soluble in aqueous solutions after treatment.
112
Insolubility of SoyComil K could also be due to its reaction with insoluble fibers during its
processing which could stabilise its tertiary structure and make it more insoluble. Treatment
by carbohydrate hydrolysis enzymes followed by heat treatment increased solubility,
because enzymes might remove the protective layer of polysaccharides at the surface of
protein rendering it more susceptible to heat treatment. Treatment by proteinase K
increased solubility of SoyComil K. This could be due to the reduction of its secondary
structure and to the enzymatic release of smaller polypeptide units.
Glycation of SoyComil K was caused by all sugars and increased solubility at low
temperature (70ºC). No development of yellow or brown colour was visually noticeable in
any of the sample. It is concluded that these results reflect glycation in the early stage of
Maillard reaction. Under different treatments (enzymes, sugars, salt, heat treatment, and
different pH) we increased the solubility from 0.781% to 30% and we have also succeeded
to improve emulsification properties.
The following novel findings in this study:
1) The insolubility of Soycomil was due to increased disulfide bond content
2) The solubility of Soycomil K was increased by heat treatment at certain protein
concentration and pH and by amylase digestion
3) Emulsifying ability of SoyComil K was improved as shown by increased viscosity and
water binding of emulsions

113
Chapter four
Soy Protein Isolate and Polysaccharides in model yogurts

114
4.1 Introduction
Food is complex systems composed by different components, in which proteins and
polysaccharides play an important role due to their functional and textural properties
(Molina Ortiz et al., 2004). With the increasing cost of traditional protein sources, more
food manufactures are investigating and utilizing soy proteins in dairy type products. Soy
protein isolates added as a replacement for the non-fat dry milk in the production of yogurt
increased the viscosity and gel strength (Kolar et al, 1979). Yogurt products have achieved
considerable economic importance worldwide owing to their high nutritional image
(Guggisberg et al., 2007). The average composition of yogurt is 4-6% protein, 7-10%
carbohydrate and fat 1-3% and rest moisture (Early, 1998; 1980; Yazici and Akyun, 2004).
Traditionally, yogurt is a food produced by culturing milk or reduced fat milk using a
mixed culture of lactobacillus bulgaricus and streptococcus thermophilus. The milk is
incubated with culture at 43°C until the pH reaches 4.5, then the yogurt is stored at
5 °C; however, the process can vary from country to country (Guggisberg et al., 2007).
Polysaccharides play important roles as thickening, stabilizing and gelling agents in many
foods (Nakamura et al., 2006). Addition of polysaccharides could increase the water
binding capacity of soy proteins/polysaccharide dispersions, emulsions and gels and
improve textural quality (Hua et al., 2003 and Lindhorst, 2000). The stabilization of soy gel
structures may involve electrostatic bonding, hydrophobic bonding and disulfide linkage
(Utsumi and Kinsella, 1985 and Dickinson and Hong, 1995). Addition of polysaccharide
could increase the water binding capacity of soy proteins and improve textural quality (Hua
et al., 2003). The most important property of polysaccharide polymers is their high
viscosity in solution in a wide range of pH and temperature. Thus it can be used mainly in
the food industry as a thickener, stabilizer and dispersion agent (Aydinli and Tutes, 2000).
Glycation of protein is also an effective method for improving the functional properties of
protein (Wooster and Augustin, 2007, Saeki, 1997). Maillard-type protein-polysaccharide
conjugates have been proposed to be useful as safe functional biopolymers, since the
conjugates can be prepared by binding the free amino groups of proteins to the reducing-
end carbonyl groups of polysaccharides. Most of the reported reactions however, have been
carried out in the dry state of the protein powder and very little scientific literature is
available on glycation in the liquid state, resulting in improved functionality. Furthermore,
very little is known about functionality of globular proteins, denatured and glycated
simultaneously.

115
4.2 Materials and Methods
In this study yoghurts were manufactures with SPI and polysaccharides as described
in Chapter 2 section 2.2.4.
The yoghurts consisted essentially of acidified SPI emulsions.
The sequence of the present study was as follows:
1. SPI dispersions were heat treated in the absence and presence of glucose and/or
different polysaccharides (Chapter 2 section 2.2.3.3)
a. The inter- and intra molecular bonds in these dispersions were studied
(Chapter 2 sections 2.2.6.2 and 2.2.6.3)
2. The SPI dispersions of (a) were then emulsified with oil with the aid of
homogenisation (Chapter 2 section 2.2.3).
b) The effects of the following parameters on emulsifying properties SPI (oil
droplet size of emulsions) at pH 7 were determined (Chapter 2 section 2.2.3.2 and
2.2.8).
• SPI heated with glucose
• SPI heated with different polysaccharides (pectin, amylopectin, starch, xanthan,
carrageenan, guar gum and locustbean gum)
• SPI heated with glucose and polysaccharides (The effect of glucose was studied to
simulate a yoghurt emulsion where glucose would serve as the carbon source for
yoghurt cultures)
• Homogenisation (described in Chapter 2 sections 2.2.3.2 and 2.2.8.1.2)
3. The emulsions were then acidified and the following properties of the resulting
yoghurts were measured (Chapter 2 section 2.2.3.3):
• Gel Hardness
• Water binding capacity
• Types of intermolecular bonds

116
4.3 Results
4.3.1 Intra-molecular bonds in a commercial soy protein isolate dispersion
As mentioned in section 3.2.2.6.1 molecular interaction studies were performed
with 6% SoyComil K at pH9. Identical conditions were used to identify the intermolecular
bonds of SPI dispersion. Intra-molecular forces operate within the molecular or
fundamental units of a substance (ionic interaction, hydrophobic interaction, hydrogen
bonds, covalent bond, and Van der Waal forces) (Chapter 1 section 1.6). Dispersing of
commercial soy protein isolate (6%) pH9 (treated at room temperature and 80°C for 10
min) in imidizole solvents containing one of the reagents (0.3M NaCl, 0.2M 2-
Mercaptoethanol, and 8M urea), could disrupt selective interactions among polypeptides,
which could lead to reduction in particle size. The effect of each of the three reagents on
particle size of protein should reflect the molecular force contributing to maintenance of
protein structure (Zhong et al., 2006). For the non-heated sample, the smallest particle size
was obtained by treatment with NaCl (26µm) indicating non-heated SPI mainly maintained
by electrostatic bonds. The next was found with disulfide bond breaking reagent (0.2M 2-
mercaptoethanol, and then 8M urea, (Figure 4.1). For the heated SPI samples, treatment
with urea and mercaptoethanol resulted in the smallest particle size (19.626 µm and 19.836
µm respectively) indicating heated SPI mainly maintained by hydrophobic and disulfide
bonds.

117
Figure 4.1 Particle size profile of 6% soy protein isolate pH9 dispersion
treated with different reagents
Where A: Treatment at room temperature (22± 3°C) and B: treatment at 80°C
for10min
4.3.2 Glycation degree of commercial soy protein isolates
Glycation degree was measured in suspensions of commercial SPI heat-treated in
the presence of glucose and/or different types of polysaccharides (11% glucose, 0.5%
starch, 0.1% locust bean, 0.1% carrageenan, 0.1% guar gum, 0.1% xanthan, 0.5%
amylopectin, and 0.5% pectin). The effect on reduction of free amino groups concentration
is presented in Figure 4.2. The free amino groups of SPI was expressed in terms of L-
leucine. Decrease in available aminogroups compared to control indicating that glycation
occurred with sugars. The result show the highest available amino groups (1.71µg/µl) was
obtained with SPI heated without glucose or polysaccharides, whereas the lowest available
amino groups were obtained by pectin and amylopectin (1.62 and 1.63 µg/µl respectively).,
were the values for pectin and amylopectin significantly less than glucose at Confidence
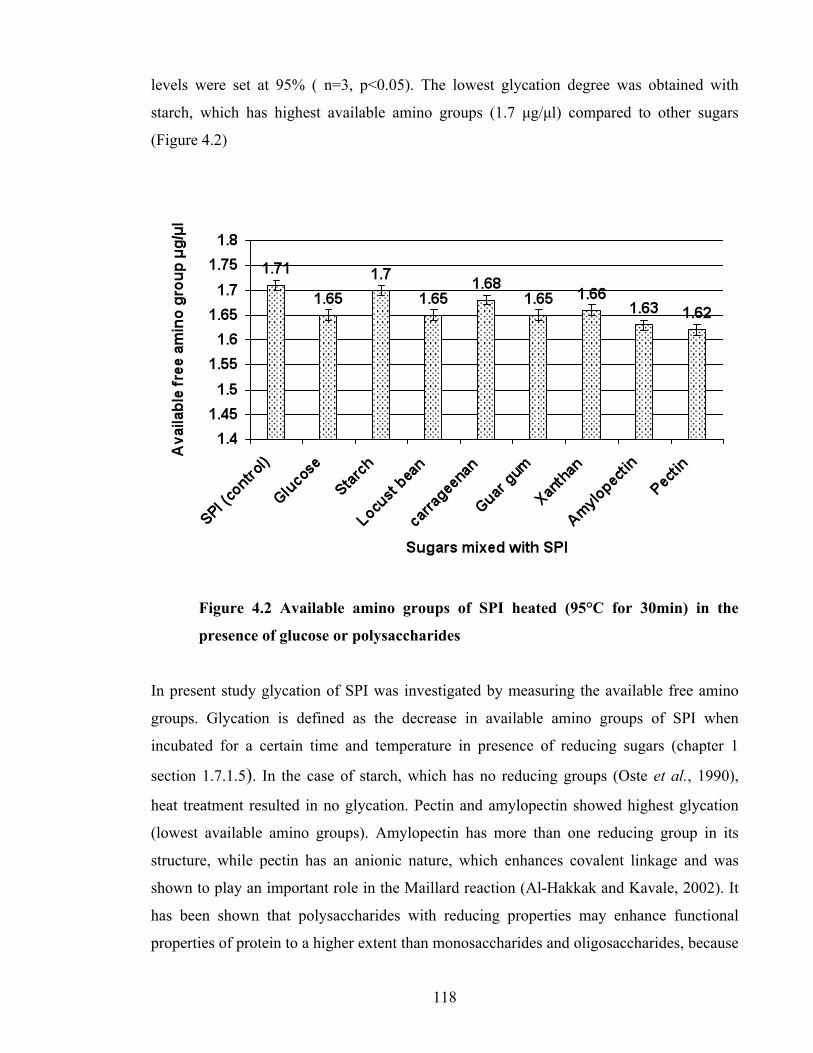
118
levels were set at 95% ( n=3, p<0.05). The lowest glycation degree was obtained with
starch, which has highest available amino groups (1.7 µg/µl) compared to other sugars
(Figure 4.2)
Figure 4.2 Available amino groups of SPI heated (95°C for 30min) in the
presence of glucose or polysaccharides
In present study glycation of SPI was investigated by measuring the available free amino
groups. Glycation is defined as the decrease in available amino groups of SPI when
incubated for a certain time and temperature in presence of reducing sugars (chapter 1
section 1.7.1.5). In the case of starch, which has no reducing groups (Oste et al., 1990),
heat treatment resulted in no glycation. Pectin and amylopectin showed highest glycation
(lowest available amino groups). Amylopectin has more than one reducing group in its
structure, while pectin has an anionic nature, which enhances covalent linkage and was
shown to play an important role in the Maillard reaction (Al-Hakkak and Kavale, 2002). It has been shown that polysaccharides with reducing properties may enhance functional
properties of protein to a higher extent than monosaccharides and oligosaccharides, because

119
their larger size and net charge lead to important structure changes (Jiménez-Castaño et al.,
2005). Polysaccharides may have fewer reducing ends per molecular weight, and so have
less chance to glycate, but the high molecular weight and branching of polysaccharides may
provide the opportunity to increase conjugation to available amino acids. No development
of yellow or brown colour was visually noticeable in any of the sample, therefore it is
concluded that these results reflect glycation in the early stage of Maillard reaction.
4.3.3 Properties of SPI emulsions
In this, section the effect of following factors on oil droplet distribution of SPI
emulsions were studied:
• SPI heated with glucose
• SPI heated with polysaccharides
• SPI heated with glucose and polysaccharides (the effect of glucose was studied to
simulate a yoghurt emulsion where glucose would serve as the carbon source for
yoghurt cultures)
• Homogenisation
4.3.3.1 Effect of heat treatment of SPI on oil droplets size of 3% oil emulsions at pH 7
Changes in the average droplets size distribution (D3,2 “surface weighted mean” )
of emulsions at pH 7 made with heated or non-heated SPI are shown in Figure 4.3. Surface
weighted mean D3,2 is defined as the diameter of a sphere that has the same
volume/surface area ratio as a particle of interest ( Liu et al., 2007; Pacek et al., 1998;
Downs and Sarv, 2003). The mean droplet size distribution (D3, 2) of the emulsion
produced by the heated SPI (45.5µm) was smaller than of the non-heated SPI suspension
(48.7 µm) (significant difference at confidence level of 95% p<0.05).

120
Figure 4.3 Effect of heat treatment of SPI on oil droplets size of 3% oil
emulsion pH 7
Where RT: Room temperature (22± 3 °C)
4.3.3.2 Effect of ultra high-pressure homogenization on oil droplets size of SPI
emulsions
In this study droplet size (D3,2) of emulsions of heated and non-heated SPI (3%
sunflower oil) was studied. Before high-pressure homogenization, emulsion presented large
droplet size, whereas after high-pressure homogenization at 200-600 bar, the droplet sizes
were reduced (Figure 4.4). The results show emulsion from non-heated and non-
homogenized SPI suspension had largest droplets size (48.7 µm), and emulsion from heated
and non-homogenized SPI dispersions had smaller droplets size than non-heated non-
homogenized emulsion (45.5 µm), but significantly larger than homogenized emulsions.
Emulsion from non-heated and homogenized SPI suspension had smaller droplets size than
non-homogenized emulsions, but significantly larger than heated, homogenized emulsions,
whilst emulsion from heated and homogenized SPI dispersions had the smallest droplets
size (Figure 4.4).

121
Figure 4.4 Effect of ultra high-pressure homogenization on droplets size
distribution of soy protein isolates emulsions
4.3.3.3 Effect of heat treatment of SPI in presence of polysaccharides on oil droplets
size of SPI emulsions
Changes in the average droplets size distribution (D3,2;surface weighted mean) of
emulsions as function of SPI (heated or non-heated) with different polysaccharides or
glucose (11% glucose, 0.5% pectin, 0.5% amylopectin, 0.5% starch, 0.1% carrageenan,
0.1% xanthan, 0.1% guar and 0.1% locust bean) were studied. The average droplet size
(D3,2) of all emulsions were measured immediately after emulsion formation. Figure 4.5
difference in droplets size (D3,2) in non-homogenized emulsions contain one sugar
(glucose or polysaccharides) and emulsions contain both sugars (glucose and
polysaccharides) (un heated and heated to 95 °C for 30 min). The largest oil droplets were
obtained with both non-heated and heated SPI and locust bean gum with glucose. The

122
smallest oil droplets was obtained with both non-heated and heated SPI and amylopectin.
In general, heat treatment of SPI in presence of sugars (polysaccharides or glucose) caused
increase in droplets size, compared to control (SPI only). Heat treatment of SPI in presence
sugars increased droplet size. While decrease droplet size of control (SPI only), were
significantly smaller than that of non-heated SPI. Combination of glucose with
polysaccharides increased droplets size more than glucose or polysaccharides alone in all
conditions.
Figure 4.5 Oil droplet size of non-homogenised emulsions made from SPI in the
presence of glucose or polysaccharides or glucose combined with
polysaccharides
For homogenised emulsions Figure 4.6 show difference in droplets size (D3,2) in emulsion
contain one sugar (glucose or polysaccharides) and emulsions contain both sugars (glucose
and polysaccharides) at room temperature and 95 °C for30 min. The largest oil droplets
were obtained with both non-heated and heated SPI and locust bean gum with glucose. The

123
smallest oil droplets were obtained with both non-heated and heated control (SPI only).
Homogenization decreased droplets size significantly compared to non-homogenized
emulsions (Fig. 4.5). Presence of sugars increase the droplets size compared to control for
under both non-heated and heat-treated SPI. Heat treatment decrease droplet size of control
(SPI only), whilst combination of glucose with polysaccharides increased droplets size
more than glucose or polysaccharides alone in all conditions (Figure 4.6).
Figure 4.6 Oil droplet size of homogenised emulsions made from SPI heat
treated in the presence of glucose or polysaccharides or glucose combined with
polysaccharides
4.3.4 Soy yogurts

124
4.3.4.1 Texture analysis of yogurts
The texture of these laboratory made yogurts (section 2.2.4), as well as
commercial soy yogurt (Alpro Soya, bought from Tesco Supermarket UK), was analyzed
by measuring three parameters, hardness (Tables 4.1 and 4.2), cohesion strength (Tables
4.1 and 4.3) and adhesiveness (Tables 4.1 and 4.4). Additionally, laboratory yogurts were
subjected to heat treatment (95°C for 20 min) to study its effect on texture. The results
show highest hardness under all treatments was obtained with yogurt produced from SPI
and pectin (0.28- 0.57 N) and lowest hardness under all treatments was obtained with
yogurt produced from SPI only (control). In general, yogurts from homogenized emulsions
have higher hardness than non-homogenized suspension. Yogurts hardness increased as
degree of glycation increased. For all yogurts tested, texture analysis indicated very low
cohesion strength and adhesiveness that were below or just above the detection limit of the
texture analyzer. No obvious differences in cohesion strength and adhesiveness were
observed.
Table 4.1 Textural profile analysis of commercial soy yogurt (Alpro Soya)
Composition 7.6% hulled soya beans (3.8% protein) + 11.3%
carbohydrates (sugar 10.7%)+ fat 2.2% + 0.7% fiber (pectin
and agar).
pH 4.00
Hardness (N) 0.12
Cohesion strength (N) _
Adhesiveness (mJ) _
(―) Value that was below or just above the detection limit of the texture analyzer.

125
Table 4.2 Hardness (Newton unit “N”) of laboratory prepared soy yogurts
Non-homogenised, non-heated emulsion (pH 7)
Non-homogenised, heated emulsion pH 7
Homogenised, non-heated emulsion pH 7
Homogenised, heated emulsion pH 7
Yogurt composition
Non-heated yogurt
Heated yoghurt Non-heated yogurt
Heated yoghurt Non-heated yogurt
Heated yoghurt
Non-heated yogurt
Heated yoghurt
SPI 0.10 0.18 0.28 0.32 0.32 0.40 0.34 0.42 SPI+ glucose 0.20 0.26 0.33 0.40 0.37 0.44 0.48 0.53 SPI+ pectin 0.11 0.30 0.33 0.38 0.36 0.43 0.38 0.54 SPI+ amylopectin 0.12 0.25 0.34 0.36 0.35 0.47 0.40 0.52 SPI+ starch 0.11 0.22 0.33 0.37 0.35 0.48 0.39 0.52 SPI+ carrageenan 0.11 0.20 0.31 0.43 0.38 0.43 0.40 0.48 SPI+ xanthan 0.13 0.21 0.31 0.39 0.40 0.42 0.45 0.52 SPI+ guar gum 0.12 0.28 0.33 0.38 0.41 0.43 0.47 0.52 SPI+ locust bean 0.13 0.25 0.34 0.40 0.38 0.44 0.41 0.56 SPI+ pectin+ glucose 0.28 0.41 0.44 0.48 0.47 0.52 0.50 0.57 SPI+ amylopectin+ glucose
0.25 0.39 0.42 0.45 0.42 0.49 0.41 0.55
SPI+ starch+ glucose 0.26 0.37 0.40 0.46 0.43 0.48 0.46 0.58 SPI+ carrageenan+ glucose
0.18 0.32 0.35 0.46 0.41 0.46 0.46 0.54
SPI+ xanthan+ glucose 0.18 0.30 0.41 0.46 0.42 0.46 0.45 0.53 SPI+ guar gum+ glucose
0.18 0.31 0.37 0.43 0.42 0.47 0.46 0.51
SPI+ locust bean+ glucose
0.21 0.37 0.40 0.46 0.43 0.50 0.45 0.55

126
Table 4.3 Cohesion strength (Newton unit “N”) of laboratory prepared soy yogurts
Non-homogenised, non-heated suspension (pH7)
Non-homogenised, heated suspension (pH7)
Homogenised, non-heated suspension (pH7)
Homogenised, heated suspension (pH7)
Yogurt composition
Non-heated yogurt
Heated yogurt Non-heated yogurt
Heated yogurt Non-heated yogurt
Heated yogurt Non-heated yogurt
Heated yogurt
SPI - 0.01 0.02 - - 0.01 0.01 - SPI+ glucose - - - - 0.01 - 0.01 - SPI+ pectin 0.01 0.01 - - - 0.01 0.01 0.01 SPI+ amylopectin - - - - - 0.01 0.01 - SPI+ starch - - - - 0.01 - 0.01 - SPI+ carrageenan - - - - - - - - SPI+ xanthan - 0.01 - - - 0.01 0.01 - SPI+ guar gum - 0.01 0.01 - - 0.01 0.01 - SPI+ locust bean - - 0.02 0.01 - 0.02 0.01 - SPI+ pectin+ glucose
- - 0.01 - 0.01 0.01 0.01 0.01
SPI+ amylopectin+ glucose
- 0.02 0.02 - - 0.01 - -
SPI+ starch+ glucose
- 0.01 0.01 - 0.01 0.02 0.01 0.01
SPI+ carrageenan+ glucose
- 0.01 - - 0.02 - - -
SPI+ xanthan+ glucose
- - - - 0.01 - 0.01 -
SPI+ guar gum + glucose
- - - - 0.01 - 0.01 -
SPI+ locust bean+ glucose
- - 0.02 0.01 - 0.02 0.01 -
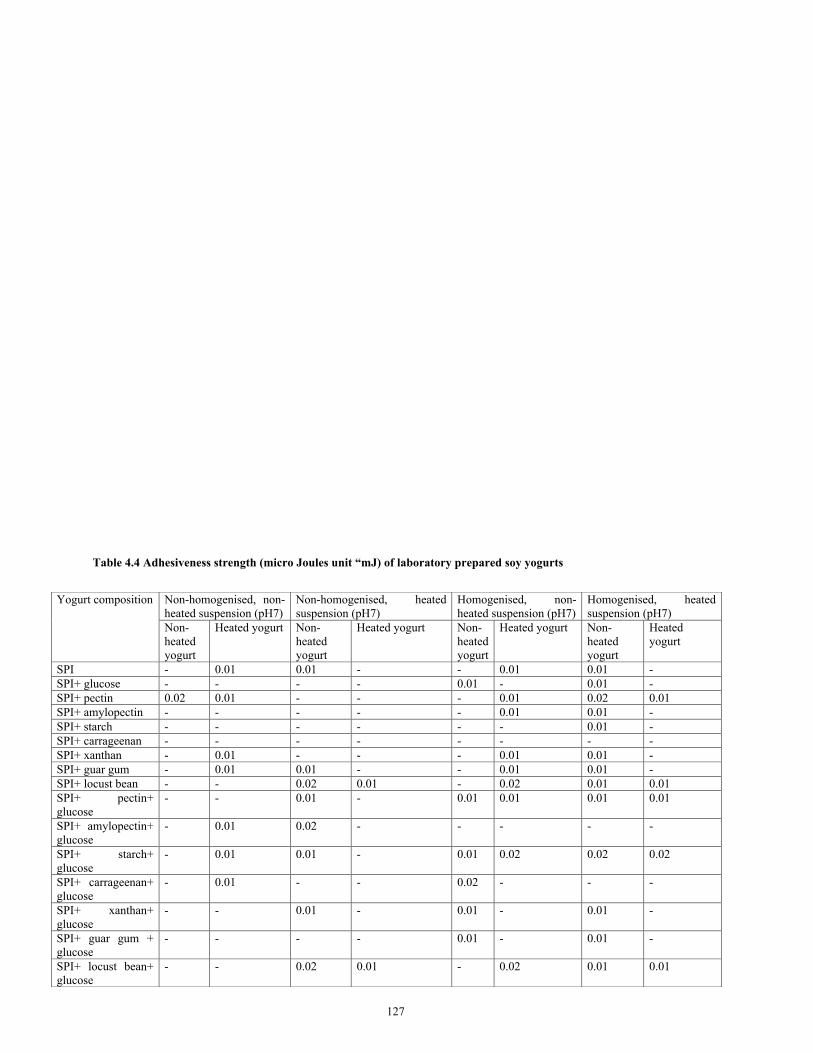
127
Table 4.4 Adhesiveness strength (micro Joules unit “mJ) of laboratory prepared soy yogurts
Non-homogenised, non-heated suspension (pH7)
Non-homogenised, heated suspension (pH7)
Homogenised, non-heated suspension (pH7)
Homogenised, heated suspension (pH7)
Yogurt composition
Non-heated yogurt
Heated yogurt Non-heated yogurt
Heated yogurt Non-heated yogurt
Heated yogurt Non-heated yogurt
Heated yogurt
SPI - 0.01 0.01 - - 0.01 0.01 - SPI+ glucose - - - - 0.01 - 0.01 - SPI+ pectin 0.02 0.01 - - - 0.01 0.02 0.01 SPI+ amylopectin - - - - - 0.01 0.01 - SPI+ starch - - - - - - 0.01 - SPI+ carrageenan - - - - - - - - SPI+ xanthan - 0.01 - - - 0.01 0.01 - SPI+ guar gum - 0.01 0.01 - - 0.01 0.01 - SPI+ locust bean - - 0.02 0.01 - 0.02 0.01 0.01 SPI+ pectin+ glucose
- - 0.01 - 0.01 0.01 0.01 0.01
SPI+ amylopectin+ glucose
- 0.01 0.02 - - - - -
SPI+ starch+ glucose
- 0.01 0.01 - 0.01 0.02 0.02 0.02
SPI+ carrageenan+ glucose
- 0.01 - - 0.02 - - -
SPI+ xanthan+ glucose
- - 0.01 - 0.01 - 0.01 -
SPI+ guar gum + glucose
- - - - 0.01 - 0.01 -
SPI+ locust bean+ glucose
- - 0.02 0.01 - 0.02 0.01 0.01

128
4.3.4.2 Water holding capacity of yogurts
Water holding capacity of laboratory made yogurts (section 2.2.4), was measured,
additionally, laboratory yogurts were subjected to heat treatment (95°C for 20 min) to study
its effect on water holding capacity (Table 4.5). Results show highest water holding
capacity (WHC) under all treatments was obtained with yogurt produced from SPI and
pectin with glucose (70%) and lowest WHC was obtained with yogurt produced from SPI
only (25%). In general, glucose, polysaccharides, heat treatment and homogenizion
increase water holding capacity (Table 4.5).

129
Table 4.5 water holding capacity (%)of soy yogurts
Non-homogenised, non-heated emulsion pH 7
Non-homogenised, heated emulsion pH 7
Homogenised, non-heated emulsion pH 7
Homogenised, heated emulsion pH7
Yogurt composition
Non-heated yogurt
Heated yogurt Non-heated yogurt
Heated yogurt Non-heated yogurt
Heated yogurt Non-heated yogurt
Heated yogurt
SPI 25.0 37.0 35.0 40.0 38.3 42.6 39.7 44.2 SPI+ glucose 31.0 40.2 41.3 43.2 44.5 51.3 47.2 53.0 SPI+ pectin 49.1 53.2 52.0 59.0 55.0 63.0 58.3 65.0 SPI+ amylopectin 38.5 43.5 46.0 50.0 48.3 56.2 51.0 59.0 SPI+ starch 36.0 42.8 45.2 48.1 46.6 55.3 51.0 58.6 SPI+ carrageenan 32.0 41.0 42.2 44.0 45.2 53.8 49.3 54.0 SPI+ xanthan 40.0 45.2 48.0 51.0 49.2 57.0 53.0 60.0 SPI+ guar gum 40.5 44.4 47.0 51.3 49.0 57.9 53.6 59.7 SPI+ locust bean 41.2 44.9 47.7 52.0 50.0 58.6 55.0 60.4 SPI+ pectin+ glucose
55.0 62.0 58.0 66.0 62.2 66.7 67.8 70.0
SPI+ amylopectin+ glucose
43.6 48.4 48.7 53.0 50.1 58.3 53.6 63.0
SPI+ starch+ glucose
40.3 46.0 47.0 52.0 49.0 58.2 53.0 64.0
SPI+ carrageenan+ glucose
40.0 44.6 44.3 50.0 47.2 55.0 52.1 58.3
SPI+ xanthan+ glucose
44.0 49.2 51.0 55.0 51.0 60.1 55.0 66.0
SPI+ guar gum + glucose
44.3 49.1 51.3 56.3 51.6 61.3 56.2 66.4
SPI+ locust bean+ glucose
44.6 50.0 50.9 56.1 52.0 61.0 57.0 67.0

130
4.3.4.3 Total and free sulfhydryl group contents in yogurts
The amount of free and total sulfhydryl groups in yogurt produced from
SPI and pectin (best improved of yogurt and no separation) and yogurt produced from SPI
and carrageenan (least improved) were measured. The results in Table 4.6 show that the
total SH groups of yogurts ranged between 4.0 to 3.83 µmol/gm, and free SH groups ranged
from 3.3 to 3.0 µmol/gm, for both yogurts made from non-heated or heated SPI. There was
no significant difference between in total sulfhydryl and free sulfhydryl contents indicating
no additional formation of disulfide bonds
Table 4.6 Total and free sulfhydryl contents in soy yogurts
Yogurt composition Total SH
groups
(µmol/gm)
Free SH
group
(µmol/gm)
4.3% SPI (RT) 4.00 3.30
4.3% SPI heated to 95°C/30 min 3.93 3.01
4.3% SPI+ 11%glucose. (RT) 3.85 3.00
4.3% SPI+11%glucose heated to 95°C/30 min. 3.97 3.00
4.3% SPI+0.5% pectin (RT) 3.88 3.04
4.3% SPI+0.5% pectin heated to 95°C/30 min 3.85 3.00
4.3% SPI+0.5% pectin +11%glucose (RT) 3.89 3.12
4.3% SPI+0.5% pectin +11%glucose heated to
95°C/30 min.
3.92 3.20
4.3% SPI+0.1% carrageenan (RT) 3.9.00 3.10
4.3% SPI+ 0.1% carrageenan heated to 95°C/30
min.
3.83 3.10
4.3% SPI+0.1% carrageenan +11%glucose (RT). 3.86 3.20
4.3% SPI+0.1% carrageenan +11%glucose
heated to 95°C/30 min.
3.96 3.20
RT: Room temperature (22± 3°C)

131
4.3.4.4 Total and free sulfhydryl group contents in yogurts
Yogurt produced from SPI and pectin (best improved of yogurt with highest
WHC and no separation) and yogurt produced from SPI and carrageenan (least improved
with lowest WHC) were dispersed in imidazole solvents containing reagents (0.3M NaCl,
0.2M 2-mercaptoethanol and 8M Urea) to study the effect on solubilization of yogurt.
Solubility of gel yogurt in the various solvents should reflect the molecular bonds
contributing to maintenance of the gel network structure in yogurts (Utsumi and Kinsella,
1985) (Table 4.7). Results show highest solubility was obtained with yogurts treated by 8M
urea in both yogurts produced from non-heated SPI or heat treated SPI, which indicates that
the majority of bonds were hydrophobic bonds and lowest solubility was obtained with
yogurts treated by 0.3M NaCl or 0.2M 2-Mercaptoethanol. Results indicate that the
majority of bonds were hydrophobic bonds, while electrostatic and disulfide bonds were
low in maintaining the yogurt structure.

132
Table 4.7 Solubility profile of soy yogurts in various reagents
% Solubility
0.05M Imidazole
(control)
0.3M NaCl 0.2M 2-
Mercaptoethanol
8M Urea
Yogurt
composition
RT 95°C/30
min
RT 95°C/30
min
RT 95°C/30
min
RT 95°C/30
min
SPI 0.61 0.72 1.00 1.10 0.75 0.80 10.21 12.52
SPI+
glucose
0.68 0.74 1.00 1.20 0.90 1.00 10.31 12.73
SPI+ pectin 0.70 0.77 1.10 1.40 1.30 1.40 10.43 12.90
SPI+
carrageenan
0.65 0.74 1.00 1.29 1.22 1.42 10.24 12.66
SPI+
pectin+
glucose
0.71 0.83 1.10 1.30 1.46 1.58 10.80 13.00
SPI+
carrageenan
+ glucose
0.69 0.79 0.95 1.23 1.42 1.49 10.63 12.63
RT: Room temperature (22± 3°C)
4.3.4.5 Confocal laser scanning microscopy (CLSM) of soy yogurts
The microstructure of yogurt produced from SPI and pectin with glucose
(highest hardness and WHC) was studied. CSLM pictures (Figures 4.7 A-F) show a
clear difference in network structure as a function of polysaccharide and heat
treatment. Yogurts produced from SPI and sugars (polysaccharides and glucose)
show that the microstructures (droplet size) are fairly homogeneous and more
condensed compared to control (yogurt from SPI only).

133
Figure 4. 7 A. Yogurt of heated SPI (control), homogenised.

134
Figure 4. 7 B. Yogurt from heated SPI pH 7, mixed with 0.5% pectin and 11%
glucose, emulsified with 3% sunflower oil followed by homogenization and
acidification
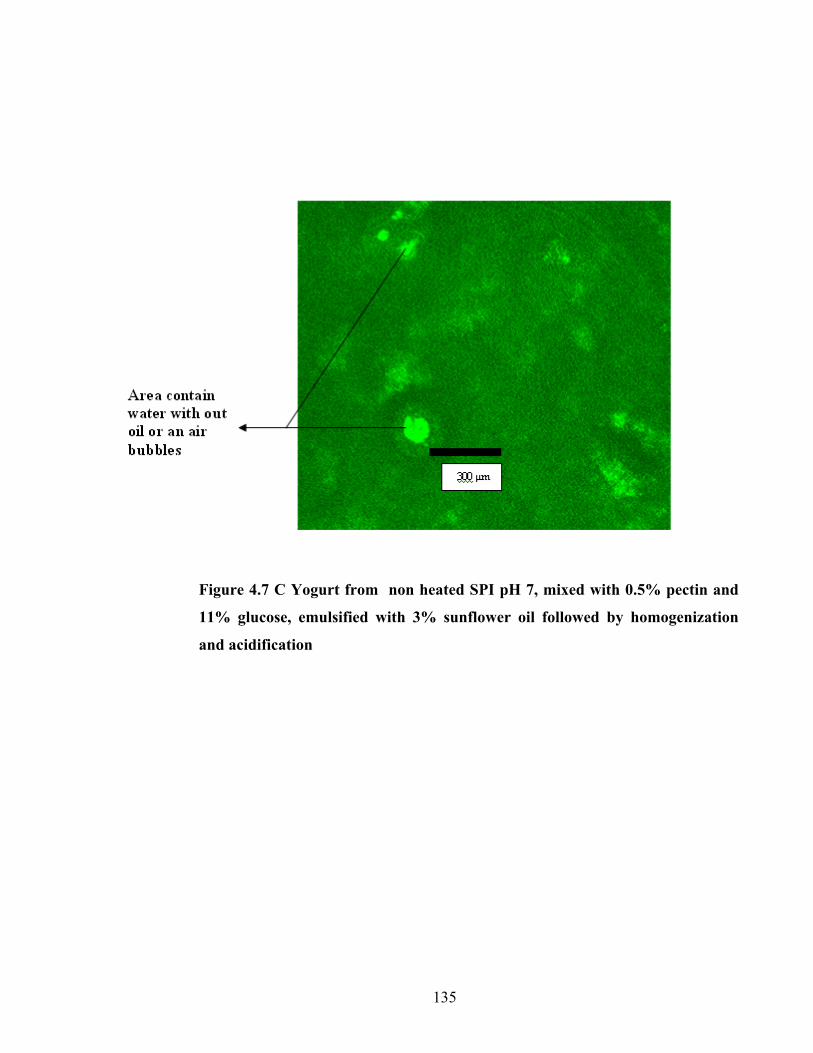
135
Figure 4.7 C Yogurt from non heated SPI pH 7, mixed with 0.5% pectin and
11% glucose, emulsified with 3% sunflower oil followed by homogenization
and acidification

136
Figure 4.7 D Yogurt of heated SPI pH 7, mixed with 0.5% carrageenan and
11% glucose, emulsified with 3% sunflower oil, homogenization and acidified
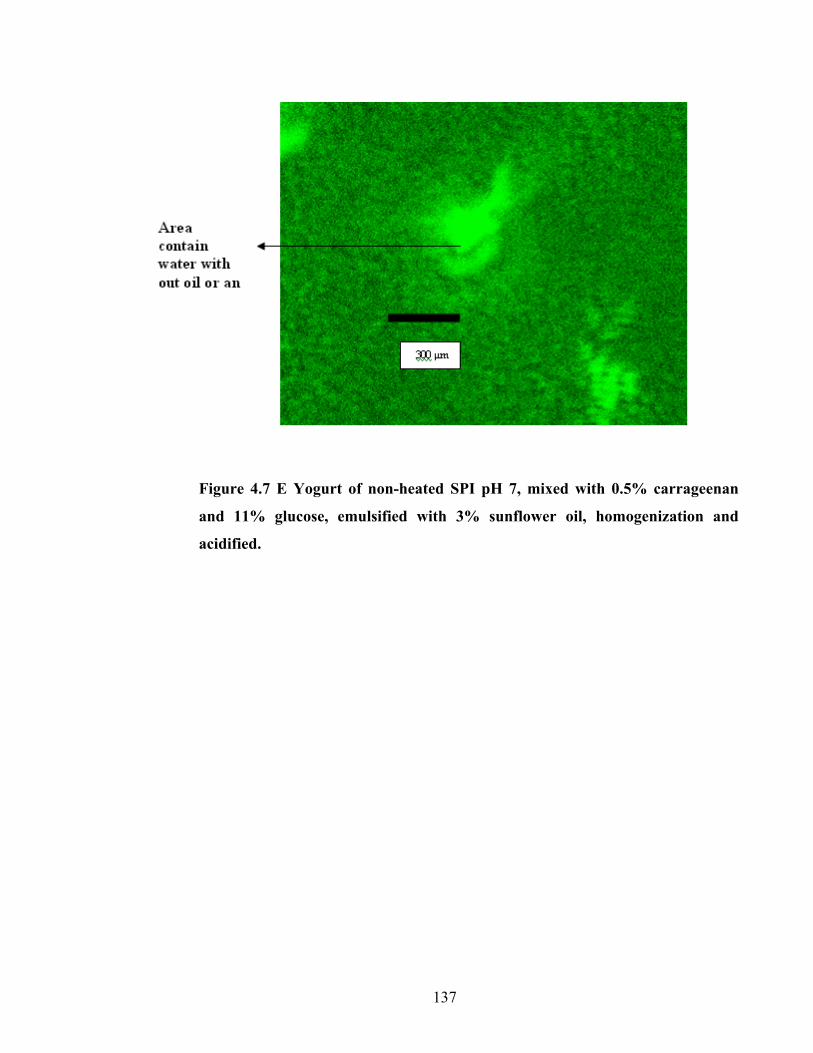
137
Figure 4.7 E Yogurt of non-heated SPI pH 7, mixed with 0.5% carrageenan
and 11% glucose, emulsified with 3% sunflower oil, homogenization and
acidified.

138
4.4 Discussion
4.4.1 Intra-molecular bonds in a commercial soy protein isolate dispersion
Dispersing of commercial soy protein isolate (6%) pH9 (treated at room
temperature and 80°C for 10 min) in imidizole solvents containing one of the reagents
(0.3M NaCl, 0.2M 2-Mercaptoethanol, and 8M urea), could disrupt selective interactions
among polypeptides, which could lead to reduction in particle size. The results show that
particle size of heated SPI in all buffers were significantly smaller than non-heated SPI (Fig
4.1). This indicates that the difference between heated and non-heated soy protein is that
heat treatment resulted in increased electrostatic bonds, sulfhydryl groups and hydrophobic
bonds. Thermal treatment causes dissociation of aggregates (oligomers) in to subunits of
smaller molecular weight (Shimada and Cheftel, 1988 and Rangavajhyala et al., 1997) as
well as partial denaturation of monomers. A decrease in average particle size was found
with the addition of each of the three reagents in both non-heated and heated samples.
For the non-heated sample, the smallest particle size was obtained by treatment with NaCl .
The difference between effects of 0.2M 2-Mercaptoethanol and urea was not significant,
indicating that disulfide and hydrophobic bonds are low in SPI structure. The results
suggest, that non-heated soy protein isolate structure is mainly maintained by electrostatic
bonds. For the heat-treated sample, treatment with urea and mercapto-ethanol resulted in
the smallest particle size; suggesting that hydrophobic and disulfide bonds are important in
maintenance of heated soy protein isolate structure. Puppo and Añón, 1998 showed that
hydrophobic interaction is favoured at high temperature treatments.
4.4.2 Glycation degree of commercial soy protein isolates
In present study, glycation of SPI was investigated by measuring the available free
amino groups (Figure 4.2). Glycation is defined as the decrease in available amino groups
of SPI when incubated for a certain time and temperature in presence of reducing sugars
(chapter 1 section 1.7.1.5). In the case of starch, which has no reducing groups (Oste et al.,
1990), heat treatment resulted in no glycation. Pectin and amylopectin showed highest
glycation (lowest available amino groups; Figure 4.2). Amylopectin has more than one
reducing group in its structure, while pectin has an anionic nature, which enhances covalent
linkage and was shown to play an important role in the Maillard reaction (Al-Hakkak and
Kavale, 2002). It has been shown that polysaccharides with reducing properties may

139
enhance functional properties of protein to a higher extent than monosaccharides and
oligosaccharides, because their larger size and net charge lead to important structure
changes (Jiménez-Castaño et al., 2005). Polysaccharides may have fewer reducing ends per
molecular weight, and so have less chance to glycate, but the high molecular weight and
branching of polysaccharides may provide the opportunity to increase conjugation to
available amino acids. No development of yellow or brown colour was visually noticeable
in any of the sample, therefore it is concluded that these results reflect glycation in the early
stage of Maillard reaction.
4.4.3 Properties of SPI emulsions
4.4.3.1 Effect of heat treatment of SPI on oil droplets size of 3% oil emulsions at pH 7
Change of protein functionality due to thermal denaturation may induce changes
in protein-stabilized emulsions. The droplet size distribution is an important factor, which
strongly influences both the textural stability and sensory characteristics of protein-
stabilised oil-in-water emulsions (Kiokias et al., 2007). The average droplets size
distribution (D3,2) of emulsions made with heated and non-heated SPI are shown in
Figure 4.3. The mean droplet size distribution of heated SPI emulsion was smaller than of
the non-heated version. Denaturation of SPI by heat treatment could have resulted in a
reduced interfacial tension between the oil and water phases, which could result in smaller
droplets (D3,2) (Floury et al., 2000).
4.4.3.2 Effect of ultra high-pressure homogenization on oil droplets size of SPI
emulsions
Chemical, pharmaceutical, specialty foods and biotechnology facilities all use the
high-pressure homogenizer to emulsify, disperse, mix and process their products.
Homogenization pressure is responsible for disruption of fat droplets and the creation of
new interfaces (Boutin et al., 2007). The effect of high-pressure homogenization at 200-600
bars on SPI emulsions produced from heated and non-heated SPI dispersions was studied
(Figure 4.4). High-pressure homogenization reduced droplet size of emulsions of both non-
heated and heated SPI. The combination of heat treatment and high-pressure
homogenization showed a larger reduction in oil droplet size of emulsions when compared

140
with the sample that was homogenized only (Fig. 4.4). High-pressure homogenization
seems to break the non-covalent forces within insoluble protein aggregates, and make it
easier for protein fractions to dissociate and escape from the insoluble protein aggregates to
form soluble protein aggregates (Zheng et al., 2008). High-pressure homogenization
decreases oil droplets size because the oil and water mixture is subjected to intense
turbulent and shear flow fields. Turbulence leads to the break up of the dispersed phase in
to small droplets (Floury et al., 2000), and a partial unfolding of protein occurs during
homogenization. This involves breaking of physical interactions (loss of secondary
structure) so that hydrophobic parts of the molecule are exposed and they facilitate protein
anchoring at the interface, enhancing its emulsifying capacity (Kiokias et al., 2007). Over
all this study shows that homogenization improved the stability of emulsions.
4.4.3.3 Effect of heat treatment of SPI in presence of polysaccharides on oil droplets
size of SPI emulsions
Under all experimental conditions, heat treatment of SPI caused decrease in mean
oil droplet size of emulsions (Figures 4.5 and 4.6). Heat treatment of SPI in the presence of
glucose and or polysaccharides caused increase in oil droplet size. Results that
homogenisation caused a significant decrease in droplets size (Figure 4.6). The presence of
sugars (glucose/polysaccharides) in the aqueous phase of food systems containing SPI can
alter the conformation and interaction of protein by binding to protein surface groups, or
they may indirectly influence these characteristics by altering the physicochemical
properties of water (Gu et al., 2008). This could be because addition of polysaccharide
enhanced the rate of emulsion droplet aggregation during heating, due to depletion
flocculation, where emulsion droplets become aggregated by attachment of adsorbing
macromolecules to more than one droplet at a time (Dickinson, 1992; Ye and Singh, 2006).
The droplet size of emulsions made with SPI heated in the presence of both glucose and
polysaccharides were larger than in presence of glucose or polysaccharides alone (Figures
4.5 and 4.6). This could be due to an increased sugar concentration, resulting in increased
glycation. Gu et al., 2008 showed an increase in degree of glycation of SPI with sugars
almost linear relative to sugar concentration, and reaching a plateau at concentration higher
20 %). Glycation of SPI was indeed demonstrated in Fig. 4.2.

141
The degree of glycation was not related to oil droplet size, since the highest glycation was
obtained with pectin and lowest glycation was obtained with starch (section 4.2.2), while
highest droplet size was obtained with locust bean gum.
4.4.4 Soy yogurts
In the acid gelation of soy protein, which is part of the manufacture of yogurt, the
use of polysaccharides plays an important role in modifying the textural properties of the
protein system (Abd karim et al., 1999). In this study texture profile analysis were used to
assess the influence of glucose and/or polysaccharides on final texture parameters
(hardness, cohesion, and adhesiveness) of soy yogurt. The textural properties of various
compositions of soy yogurt are shown in Tables 4.1- 4.4. The addition of glucose or/and
polysaccharides increased the gel hardness which could be attributed to the ability of sugars
to form bonds with soy protein (Sabadini et al., 2006, Baeza et al., 2002). These bonds
would be strongly related to Maillard cross-linking which might increase the molecular
entanglement in the gel structure, preventing the rupture of weak non-covalent interaction,
and thus stabilize gel net work (sun et al., 2006). This result agrees with Peng et al.,
(2000), and Campbell et al., (2008) who found that Maillard reaction resulted in increased
hardness of soy protein isolate-glucono-δ-lactone at pH 4.5 gels. In the present study the
highest hardness was obtained by yogurts produced from SPI and glucose with pectin or
amylopectin. Pectin and amylopectin showed the highest glycation with SPI (section 4.2.2).
The lowest emulsion hardness with polysaccharides was obtained with starch because it has
no reducing groups (Oste et al., 1990). After heat treatment of yogurt samples followed by
cooling down to room temperature, the hardness increased compared to before heat
treatment. Mcklem, 2002; Campbell et al., (2008) found an increase in intermolecular
disulfide bonds in the gel matrix of that of GDL induced SPI gels. We show increased
disulfide bonds in heated SPI (section 4.3.1), but we do not see this in yoghurts made with
heated SPI, or in heated yoghurts (Tables 4.6 and 4.7). The present results show the
primary bonds maintaining the gel network yogurt are hydrophobic bonds, while
electrostatic and disulfide bonds were low in maintaining the yogurt structure (Table 4.7).
The reason could be that at pH4.5 and in the presence of polysaccharides, sulfhydryl
oxidation is rather limited, which is possibly the result of protein-polysaccharides
formation, which reduces protein segment mobility and flexibility ( Diftis and Kiosseoglou,
2006a). Dickinson and Merino-Matia (2002) reported that the direct contact between

142
protein and water is considered thermodynamically unfavourable in the presence of sugars,
and this can be correlated directly with an enhancement of hydrophobic interaction through
the modification of water structure surrounding the protein. Homogenization also increased
hardness of yogurts (Table 4.2). Smaller oil droplets were produced by homogenization,
which are immediately stabilized by a protein layer. It can be presumed that the smaller
particles provided a better base for firmer protein network/aggregates to be formed
(Atapattu, 1997).
The yogurt with the highest WHC was obtained from homogenized and heated soy protein
isolate combined with glucose and pectin (Table 4.5), which was creamy without water
separation. Pectin and glucose resulted in the highest water holding capacity; pectin being
one of the most commonly used polysaccharides in acidic environments (Roudsari et al.,
2006). This could be because pectin is an acidic polysaccharide and has a high retention of
water at pH4.5 (Roudsari et al., 2006). Carrageenan resulted in the lowest water holding
capacity, probably due to enhanced gelation caused by electrolytic interaction with sulphate
groups, (Molina Ortiz et al., 2004). Water holding capacity (WHC) is a quantitative
indication of amount of water retained within a protein matrix under defined conditions
(Huang and Kinsella, 1986). Since, the difference in glycation caused by carrageenan and
pectin is relatively small 1.68 versus 1.62 µg/µl (Figure, 4.2), and the former resulted in
poor WHC properties, whereas the latter results in excellent WHC. It can be concluded that
the improvement in functionality if SPI-pectin and SPI-amylopectin complexes was not
only due to the Maillard reaction, but also due to positive complex coacervation; and that
phase separation caused by SPI-carrageenan was due to thermodynamic incompatibility as
discussed in Chapter 1, section 1.10.4.3.
The present results show that glycated SPI gels have higher WHC than non-glycated gels,
which could be due to a higher concentration of high molecular weight polymers taking
part in the gel net work and resulting in better entrapment of water in the glycated SPI gels
(Gu et al., 2008). Addition of polysaccharides to soy yogurt could also increase WHC
through gelation by increasing denser network, with smaller pores and greater capillary
forces (Hua et al., 2003; Maltais et al., 2005; Yamamoto and Cunha, 2007) and also by
their ability to bind water with their hydroxyl groups (Uresti et al., 2003). Heat treatment of
yoghurts increased WHC, due to increased dissociation of oligmers and increased unfolding
of protein, which lead to exposure of additional binding sites to water (Suliman et al.,

143
2006). These results agree with Gu et al (2008) who found glycated SPI has higher WHC
than non-glycated SPI.
The second parameter measured with respect to textural analysis of soy yogurt was
cohesion strength. Cohesion determines how much of a gel structure is destroyed after
compression as related to force (Handa et al., 1998). The results show for all yogurts tested,
texture analysis indicated very low cohesion strength (Table 4.3). This could be because at
low pH there is a reduction in stretch and cohesion strength, due to the more compact
protein conformation (Lucey et al., 2003). Adhesiveness, which was the third parameter
measured, is defined as the work required to overcome the attractive forces between the
food surface and surface of other materials which come in contact with food such as the
plate, tongue, and teeth. It was expressed as a function of withdrawal force and time
between two bits (Ju and Kilara, 1998). For all yogurts tested, texture analysis indicated
very low adhesiveness (Table 4.4). This could be because adhesiveness depends on the
balance of electrostatic and Van der Waal interaction and electrostatic interaction may play
major role in adhesiveness (Boonaert and Rouxhet, 2000). At pH 4.5, which is the iso
electric pH of SPI, electrostatic repulsive forces between protein molecules are decreased.
As in this study in yogurt bonds (section 4.7) I have found electrostatic is low in
maintaining the yogurt structure.
These results demonstrate that glycation of SPI with pectin or amylopectin, resulting in
significanlt improved functionality, can be achieved in solution and not only by glycation
in the dry state, as previous literature shows. We also showed increased disulfide bonds in
heated SPI (Fig. 4.1) indicating that glycation occurred with denatured SPI. Very little has
been reported in scientific literature of the effect of simultaneous denaturation and
glycation of soy protein on its functional properties. Here we report for the first time,
significant enhancement of functional properties of SPI, denatured and glycated with pectin
or amylopectin.

144
4.5 Conclusions
To produce a soy yogurt with high quality (smooth, homogenous texture and high
WHC), pre-treatment (heat treatment, addition of sugars and homogenization) is essential.
The best yogurt obtained was with SPI heat-treated in the presence of glucose and pectin,
which was characterized by highest WHC. The flow diagram below depicts the proposed
process for manufacture of a high quality yoghurt (Figure 4.8):
Figure 4.8 Flow diagrams proposed process for manufacture of a high quality
yoghurt
145
Chapter five
Destabilization of SPI emulsions

146
5.1 Introduction
Many food products appear in the form of oil-in-water (o/w) emulsions, where the oil
droplets are usually stabilised by proteins, acting as emulsifiers, along with other
surfactants. Parameters of homogenisation, as well as the composition of the mixture,
determine the physico-chemical properties of the emulsions (Sünder et al., 2001). To
increase the shelf life of foods, products can be preserved with heat treatments to inactivate
the spoilage microorganisms present. These pasteurisation or sterilisation treatments extend
the shelf life but also affect product quality. This also accounts for food products that are
based on emulsions, like infant formula, dressings and spreads. Heat treatment may result
in flocculation of the oil droplets in the emulsions, resulting in phase separation. The effect
of heat treatment on emulsion stability depends on the product composition, including
factors like pH, ionic composition and the intensity of the heat treatment (Van de ven et al.,
2007). Globular proteins (whey and soy proteins) are widely used as emulsifying agents in
emulsion-based products because of their ability to facilitate emulsion formation and to
improve emulsion stability. Globular proteins facilitate droplet disruption by reducing the
amount of energy required to generate small droplets during homogenization. On the other
hand, they improve the long-term stability of emulsions by generating repulsive colloidal
interactions between droplets and by forming an interfacial film around the droplets that is
resistant to rupture (Chanasattru et al., 2008). Emulsions are thermodynamically unstable
because of the energy required to increase the surface area between oil and phase, and so
they tend to separate into their component phases with time (Julian McClements and
Dungan, 1995). Under some circumstances proteins are required components in fluid
emulsions that also need to undergo extensive heat-treatment. An example is in the
formulation of paediatric formulae for feeding to newborn/premature infants. This can lead
to instability of the emulsion (Euston et al., 2001). In this case understanding how the
ingredients in the product (such as sugars) affect heat stability become very important.
Information of this nature could allow for the optimisation of the heat stability of protein-
stabilized emulsion through careful selection ingredients.
Soy proteins material is usually combined with polysaccharides, which increase the
emulsion continuous phase, viscosity and improve the product rheological properties and
texture characteristic. When however protein-stabilized emulsions are subjected to heat
treatment, for pasteurization and sterilization purpose, they tend to aggregate. Change in
heat stability that occur in the presence of different polysaccharides, most likely arise from

147
adsorbed layer composition and structure (Euston et al., 2001). The aim of this work is to a
study of heat stability of emulsion system, containing SPI, whey, SPI plus polysaccharides
(pectin, carrageenan and xanthan), SPI plus whey protein at different concentrations and
temperature with different heating time, this allow manfactures to chose suitable ingredient
to optimise emulsion heat stability. The objectives of this study have been achieved by
completing a number of tasks.
Task 1 (SPI emulsions)
In this task, I have determined the rate of aggregation of SPI stabilized emulsions at
different SPI concentrations and temperatures at pH4.5. The information gained will help
us to understand better the mechanism of instability and aggregate formation in heated SPI
emulsions. In addition, I have study rate of aggregation of whey stabilized emulsions at
different concentrations and temperatures at pH4.5. The objective of this study was was
to determine if interactions occurred between whey protein and SPI in emulsion system to
increase its stability at different concentrations, temperature and different heating time at
pH 4.5.
Task 2 (SPI- polysaccharide emulsions)
In the task I have investigated the effect different polysaccharides (pectin, carrageenan
and xanthan) on heat stability of emulsion made with SPI, I have aimed to understanding
and identifying particular ingredients and ingredient combination that may be used to
optimise the heat stability of SPI stabilized emulsions at pH4.5.
5.2 Materials and Methods
Mechanisms of destabilization of SPI emulsions and whey emulsions, prepared as
described in Chapter 2 section (2.2.3.3 and 2.2.3.4), using the kinetics of aggregation to
describe the destability of emulsions by the equation of relative change in the number of
emulsion droplets (Nt/No) as described in Chapter 2 section (2.2.8.2.1)

148
5.3 Results
5.3.1 Destabilization of SPI and WPC emulsions
5.3.1.1 Kinetic analysis of SPI emulsion heat destabilization
Heating a soy-protein stabilised emulsion will, depending on the pH and
temperature, lead to aggregation of the emulsion droplets. This can be followed using a
kinetic plot of assuming kinetics of order 1.5, as illustrated in Figure 5.1
Figure 5.1 – Kinetic plots for soy-protein-stabilised emulsion made at pH 4.5
with varied concentrations of protein and heated at 100 0C for different time.
(a) 0.75 (w/v)% soy protein; (b) 1.5(w/v)% soy protein; (c) 2.25(w/v)% soy
protein; (d) 3(w/v)% soy protein.
The kinetic plots have been analysed by calculating the reaction rate constant, k, from the
slope of kinetic plots like Figure5.1 using equation 2.2 ( chapter 2; section 2.2.8.2.1). The
rate constant was then corrected for differences in the initial droplet number.

149
5.3.1.2 Effect of pH on SPI emulsion heat stability
In Figure 5.2, I have plotted the value of k for emulsions at different pH and
protein content and heated at different temperatures to 100 oC for 3min. It is immediately
obvious that the heat stability behaviour of the emulsions was strongly dependent on the pH
at which they are made.
Figure 5.2 - Plot of rate constant for the heat-induced changes in soy protein
stabilised emulsions heated at 100 oC for 3min as a function of pH. Protein
concentration = 3 (w/v) %.
Figure 5.2 shows that there is a region between pH 4.5 and pH 6 where the emulsions are
highly unstable. Above or below these pH limits the emulsions are highly stable to heating.
The explanation for this behaviour lies in the solubility behaviour of soy protein as a
function of pH.
5.3.1.3 Comparison of the concentration dependence of the heat stability of SPI and
WPC emulsions
In addition to the pH dependence of SPI emulsion heat stability, I have also
investigated the protein concentration dependence and the temperature dependence. For
these systems, as emulsions are unstable upon heat tratment at a pH close to their pI, a pH

150
of 4.5 was chosen for these system. Figure 5.3 is a plot of the apparent rate constant for SPI
emulsions heated at various temperatures at pH 4.5
Figure 5.3 – Plot of apparent reaction rate constant for heat-induced
destabilization of SPI emulsions (pH4.5, 20 (w/v)% sunflower oil) as a function
of SPI concentration. The emulsions were destabilized by heating at various
temperatures.
● 60 oC; ○ 70 oC; ▼80 oC; ∇ 90 oC; 100 oC.

151
Figure 5.4 – Plot of apparent reaction rate constant for heat-induced
destabilization of WPC emulsions (pH4.5, 20 (w/v) % sunflower oil) as a
function of WPC concentration. The emulsions were destabilized by heating at
various temperatures.
● 60 oC; ○ 70 oC; ▼80 oC; ∇ 90 oC; 100 oC.
At temperatures below 100 oC the destabilization of SPI emulsions was only weakly
dependented on protein concentration. Even at 100 °C saw a large increase in k can be
observed when the protein content reached 3%. The behaviour of SPI emulsions to that of
WPC emulsions heated under the same conditions is compaerd in Figure 5.4. Whey protein
makes emulsions that are more stable to heating than SPI under the same conditions (i.e. k
is lower for WPC emulsions at the same temperature/concentration combination). In
addition, WPC emulsions show stronger concentration dependence.
5.3.1.4 Comparison of the temperature dependence of the heat stability of SPI and
WPC emulsions
The temperature dependence of k for both SPI and WPC emulsions is illustrated
in the Arrhenius plots of Figures 5.5 and 5.6. As expected, k shows a strong dependence on

152
temperature for both SPI and WPC emulsions at all protein concentrations. The Arrhenius
plot shows an interesting difference between SPI and WPC stabilized emulsions.
Figure 5.5– Arrhenius plots for SPI emulsions (pH 4.5, 20wt% sunflower oil).
(a) 0.75 (w/v)% SPI; (b). 1.0 (w/v)% SPI; (c). 1.5 (w/v)% SPI; (d). 2.0 (w/v)%
SPI; (e). 2.25 (w/v)% SPI; (f). 3.0 (w/v)% SPI.
The Arrhenius plots for SPI emulsions are linear (Figure 5.5), whilst those for WPC show
the bilinear (5.6) behaviour typical of that observed for heat denaturation of WPC or β-
lactoglobulin. The activation energy Ea can be calculated from the slope of the data in
Figures 5.5 and 5.6, and compare to typical values calculated for denaturation of whey

153
proteins and soy proteins in solution. Similarly, the free energy, enthalpy and entropy of
activation can also be calculated using equations (2.6-2.8; chapter 2; section 2.2.8.2.1)).
These are shown in Table 5.1 for both SPI and WPC emulsions.
Figure 5.6 Arrhenius plots for WPC emulsions (pH 4.5, 20 (w/v)% sunflower
oil).
(a) 0.75 (w/v)% WPC; (b). 1.5 (w/v)% WPC; (c). 2.25 (w/v)% WPC; (d). 3.0(w/v)%
WPC.

154
5.3.1.5 Mixed SPI and WPC emulsions
The dependence of k1.5 on the ratio of SPI:WPC in the emulsion was shown in
Figure 5.7 for different heating temperatures. At low temperatures k1.5 showed no
significant dependence on SPI:WPC ratio. At higher temperatures, however k1.5 increased
as the proportion of SPI increased from 0% SPI (3% WPC) to 3% SPI (0% WPC). If one
were to drawn a straight line between k1.5 for 0% SPI and 3% SPI, the k1.5 for intermediate
mixed SPI/WPC emulsions, falls below this line. This suggested that the WPC component
of the mixed emulsions is determined the heat stability behaviour of the emulsions. The
temperature dependence of the emulsions with varied SPI:WPC compositions were shown
in the form of Arrhenius plots in Figure 5.8. Somewhat surprisingly, the mixed emulsions
showed a linear Arrhenius plot similar to SPI rather than the bilinear plots of WPC
emulsions.
Figure 5.7 - Plot of k1.5 for heat-induced destabilization of mixed SPI:WPC
emulsions (pH4.5, 20(w/v)% sunflower oil, total protein content 3 (w/v)% as a
function of SPI: WPC ratio. The emulsions were destabilized by heating at
various temperatures.
● 60 oC; ○ 70 oC; ▼80 oC; ∇ 90 oC; 100 oC.

155
Figure 5.8 – Arrhenius plot for mixed SPI:WPC emulsions.
(a). 0% SPI, 3(w/v)% WPC; (b). 0.75(w/v)% SPI, 2.255 (w/v)%WPC; (c).
1.5(w/v)% SPI, 1.5(w/v)% WPC; (d). 2.25(w/v)% SPI, 0.75(w/v)% WPC; (e).
3(w/v)% SPI, 0% WPC.
5.3.2 The effect of polysaccharides on SPI emulsion heat stability
Addition of polysaccharides to SPI stabilized emulsions only appeared to have a
large effect on the heat stability for the emulsions at higher temperatures (Figure 5.9). For
all polysaccharide types, the most pronounced effect was a large decrease in the rate of
destabilization when 0.01wt% of the polysaccharide was added to the emulsion that was
heated at 100 oC.

156
Figure 5.9 – Effect of polysaccharides on the heat stability of SPC emulsions.
(a) pectin; (b). xanthan; (c) carrageenan.
● 60 oC; ○ 80 oC; ▼100 oC.
Table 5.1 Activation energy (Ea), free energy of activation (ΔG), enthalpy (ΔH)
and entropy (ΔS) of SPI and WPC at different concentration and
temperatures.
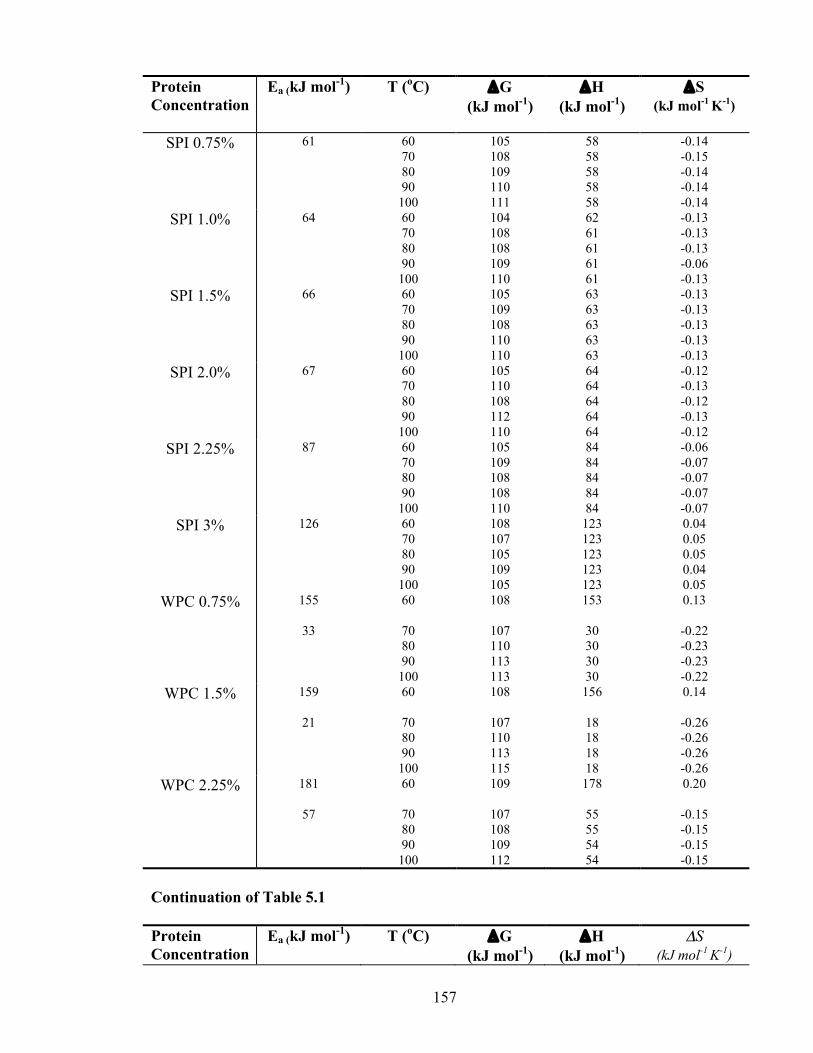
157
Protein Concentration
Ea (kJ mol-1) T (oC) ΔG (kJ mol-1)
ΔH (kJ mol-1)
ΔS (kJ mol-1 K-1)
SPI 0.75% 61 60 70 80 90
100
105 108 109 110 111
58 58 58 58 58
-0.14 -0.15 -0.14 -0.14 -0.14
SPI 1.0% 64 60 70 80 90
100
104 108 108 109 110
62 61 61 61 61
-0.13 -0.13 -0.13 -0.06 -0.13
SPI 1.5% 66 60 70 80 90
100
105 109 108 110 110
63 63 63 63 63
-0.13 -0.13 -0.13 -0.13 -0.13
SPI 2.0% 67 60 70 80 90
100
105 110 108 112 110
64 64 64 64 64
-0.12 -0.13 -0.12 -0.13 -0.12
SPI 2.25% 87
60 70 80 90
100
105 109 108 108 110
84 84 84 84 84
-0.06 -0.07 -0.07 -0.07 -0.07
SPI 3% 126 60 70 80 90
100
108 107 105 109 105
123 123 123 123 123
0.04 0.05 0.05 0.04 0.05
WPC 0.75% 155
33
60
70 80 90
100
108
107 110 113 113
153
30 30 30 30
0.13
-0.22 -0.23 -0.23 -0.22
WPC 1.5% 159
21
60
70 80 90
100
108
107 110 113 115
156
18 18 18 18
0.14
-0.26 -0.26 -0.26 -0.26
WPC 2.25% 181
57
60
70 80 90
100
109
107 108 109 112
178
55 55 54 54
0.20
-0.15 -0.15 -0.15 -0.15
Continuation of Table 5.1 Protein Concentration
Ea (kJ mol-1) T (oC) ΔG (kJ mol-1)
ΔH (kJ mol-1)
ΔS (kJ mol-1 K-1)
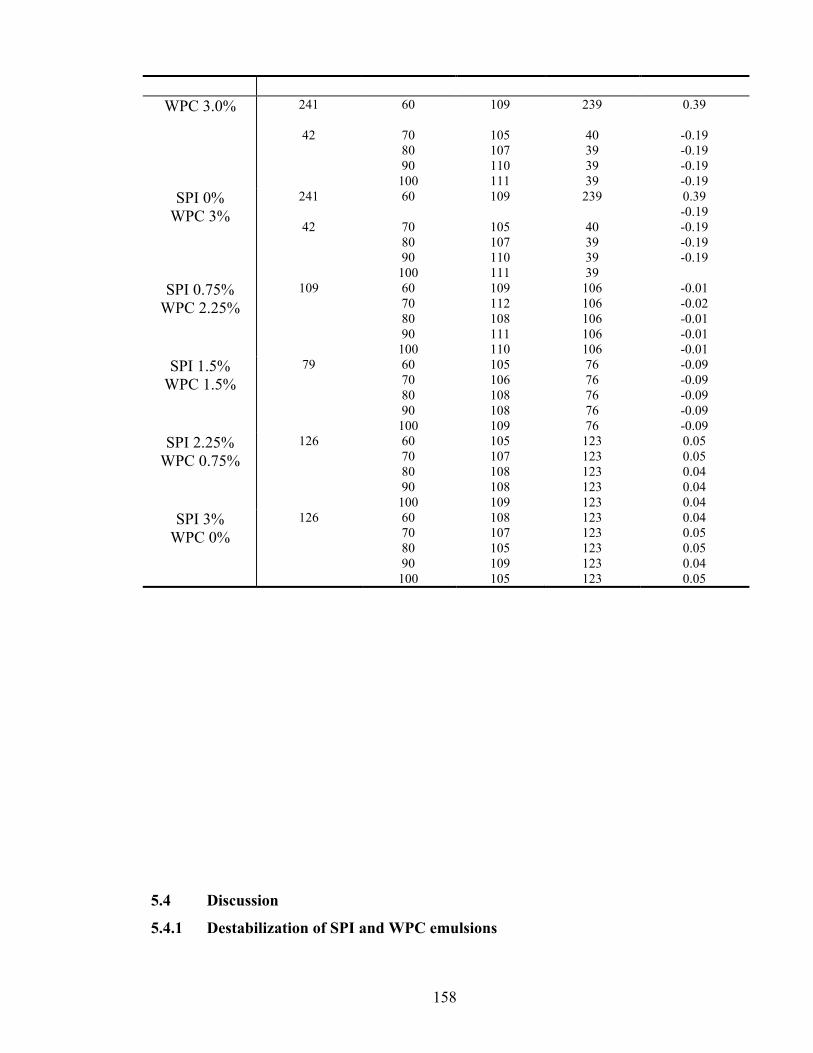
158
WPC 3.0% 241
42
60
70 80 90
100
109
105 107 110 111
239
40 39 39 39
0.39
-0.19 -0.19 -0.19 -0.19
SPI 0% WPC 3%
241
42
60
70 80 90
100
109
105 107 110 111
239
40 39 39 39
0.39 -0.19 -0.19 -0.19 -0.19
SPI 0.75% WPC 2.25%
109 60 70 80 90
100
109 112 108 111 110
106 106 106 106 106
-0.01 -0.02 -0.01 -0.01 -0.01
SPI 1.5% WPC 1.5%
79 60 70 80 90
100
105 106 108 108 109
76 76 76 76 76
-0.09 -0.09 -0.09 -0.09 -0.09
SPI 2.25% WPC 0.75%
126 60 70 80 90
100
105 107 108 108 109
123 123 123 123 123
0.05 0.05 0.04 0.04 0.04
SPI 3% WPC 0%
126 60 70 80 90
100
108 107 105 109 105
123 123 123 123 123
0.04 0.05 0.05 0.04 0.05
5.4 Discussion
5.4.1 Destabilization of SPI and WPC emulsions

159
Studies (Lakemond et al., 2000b; Chove et al., 2007; Pizones Ru´ız-Henestrosa et
al, 2007) have demonstrated that the solubility of soy protein isolate and individual 7S and
11S globulins show a rapid decrease in solubility around the iso-electric point of pH 4.5.
The solubility curves for soy protein reported by these authors mirrored very closely the
behaviour I have observed for emulsion heat stability in that high solubility corresponded to
high heat stability and vice versa. The high heat stability at neutral pH for soy proteins as
compared to other globular proteins was attributed to their ability to denature and form
soluble complexes (German et al., 1982; Sorgentini et al., 1995). Renkema et al., (2000),
showed that both β-conglycinin and glycinin were denatured on heating SPI to 95 °C at
neutral pH and that disulphide interchange reactions occurred between acidic and basic
polypeptides of glycinin. This led to the formation of soluble complexes between basic
polypeptides of glycinin and β-subunits of β-conglycinin. In contrast, when SPI was heated
at acidic pH (3.8–4.5) most of the protein became insoluble, with no evidence of formation
of soluble protein complexes (Renkema et al., 2000; Renkema et al., 2002). Obviously,
when emulsions pH were adjusted after homogenization, those that were adjusted to a pH
close to the pI would tend to aggregate. In their aggregated form, these emulsions were
more susceptible to heat-induced destabilization. The results for the rate constant k1.5 with
those of Anema & McKenna (1996) can be compared. Who have studied whey protein
denaturation in reconstituted whole milk. A direct comparison of rate constants was not
appropriate, as this study has used used relative initial droplet number to calculate k1.5 in
equation (2.3) whilst Anema & McKenna, (1996) used the relative protein concentration,
but a comparison of trends in the results is valid. Anema & McKenna (1996) found that the
rate denaturation of β-lactoglobulin, the major protein component of whey, was relatively
unaffected by protein concentration. The same was true for both SPI and WPC emulsions in
this study over much of the concentration range studied (Figures 5.3 and 5.4). In Figure 5.4,
WPC emulsion stability did appear to be dependent on concentration, but the actual
changes in k1.5 were relatively small and only appeared large due to the scale used.
Of course, the presence of oil droplets in this study will complicate the mechanism of heat-
induced destabilization. The net effect of these is to act as filler particles that occupy a
volume of the system that the protein will be excluded from. The protein covered oil
droplets act as if they were large protein particles, and increase the effective concentration
of the proteins. A comparison this results for WPC stabilized emulsions with those of
Anema and McKenna (1996) is therefore complicated by the apparent differences in the

160
whey protein concentrations, and also the differences in the aqueous phase used (imidazole
buffer, pH 4.5 in case of this study and milk serum at its natural pH of close to 7 for Anema
& McKenna, (1996). The protein content of milk varies between 2.2%-4.4% (Euston, 2008)
of which about 20% is whey protein (Smithers, 2008). Therefore, one might expect the
milks made by Anema & McKenna (1996) to have whey protein content somewhere in the
range 0.45-0.88%, i.e. lower than the range of protein contents used in this study. One must
absorved that much of the protein in emulsions used in this study were adsorbed to the oil
droplet surface, and this increased the apparent protein concentration, possibly to as high as
20%. One might therefore expect different concentration dependence for results of this
study compared to those of Anema & McKenna (1996).
A comparison of SPI emulsion heat stability with the denaturation of soy proteins in
solution is hindered by their being a lack of studies comparable in thoroughness to those of
Anema & McKenna (1996). For whey proteins, Ahmed et al. (2006) reported a significant
change in the rate of gelation of SPI when the concentration was raised from 10% to 15%.
Again, direct comparison with results of this study is difficult due to the complicating effect
of the oil droplets and differences in the methodology used to determine k.
The Arrhenius plots for SPI and WPC emulsions revealed some interesting differences. The
most noticeable difference was that k1.5 for SPI emulsions falls close to a straight line over
the full temperature range from 60 – 100 oC, whilst the results for WPC emulsions were
better fitted to a bilinear plot with k1.5 for 60 oC falling considerably below the
extrapolation of the straight line fit for the other temperatures. To explain these differences
between SPI and WPC we should consider the composition of the two protein powders.
WPC is composed predominantly of β-lactoglobulin (β-lac) (50%), α-lactoalbumin (α-lac)
(20%) with the remainder made up of immunoglobulins, lactoferrin, lactoperoxidase, serum
albumin lysozyme, and other minor peptides (Smithers, 2008). In WPC made from cheese
only, 15% of the total whey is made up of glycomacropeptide (Smithers, 2008), the peptide
derived from κ-casein which is non-globular and therefore heat stable. When heated both β-
lac and α-lac denature, but unlike β-lac, α-lac does not rapidly aggregate due to a lack of
free thiol groups (Dalgleish et al., 1997). Thus, one might expect the heat stability of
emulsions in this study to be dominated by the β-lac component of the WPC. This is
consistent with the bilinear Arrhenius plots in Figure 5.7. The change in slope of the
Arrhenius plots for pure whey proteins occurs at the denaturation temperature of the
161
protein, which for β-lac occurs between 80-85 oC (Anema & McKenna, 1996).
Interestingly, for emulsions in this study this break occured at a lower temperature around
70 oC. One should remember that in an emulsion much of the protein would be adsorbed to
the oil-water interface and will therefore be in a partially surface denatured state before
heating. The results suggested that surface denaturation made the protein more susceptible
to heat-induced instability, and lowered the temperature required to initiate significant heat-
induced breakdown to 70 oC rather than the 80-85 oC required for pure β-lac solutions.
Soy protein isolate is more heterogeneous in its composition than is WPC. SPI is comprised
of two major fractions, β-conglycinin or 7S globulin (30%) and glycinin or 11S globulin
(35%). Both of these of these denatures, albeit at a different temperature, and contribute to
the heat-induced aggregation of SPI. The denaturation temperature for 11S globulin is
above 90 oC at pH 4.5, whilst that of 7S globulin is around 72 oC. Therefore, when SPI is
heated the denaturation and aggregation behaviour will be a composite of the behaviour of
the major protein components. For SPI emulsions in this study, this led to a linear
Arrhenius plot since the denaturation temperatures for the different soy protein components
were sufficiently far apart that they contributed to heat destabilization in different regions
of the temperature range studied. When WPC and SPI mixed in emulsions, the Arrhenius
plots also showed linear rather than bilinear behaviour. This is because addition protein
added to the mixture, making it more heterogeneous. β-lactogobulin has a denaturation
temperature of 85 oC, mid way between that of 7S and 11S globulins.
One can compare the activation energies calculated from the Arrhenius plots of Figure 5.6
for WPC emulsions with the results of Anema & McKenna (1996) for β-lac. The values of
Ea fell in the range 155-241 kJ mol-1 for the low temperature range, and 21-57 kJ mol-1 for
the high temperature range. Anema & McKenna, (1996) found an Ea of between 263-296
kJ mol-1 and 33-51 kJ mol-1 for the low and high temperature ranges respectively depending
on the genetic variant of β-lactogobulin (A or B variant). Their values were comparable to
those found by Dannenberg & Kessler (1988a and 1988b) reported in an earlier study.
Values of this study were broadly comparable to those of Anema & McKenna, (1996)
suggesting that the reactions leading to heat-induced aggregation of the emulsion droplets
were the same. However, the fact those activation energies were slightly lower than those
of Anema & McKenna (1996) may be a consequence of the partial denaturation of the
adsorbed protein.

162
There are few results for the Ea of soy protein solutions with which to compare results in
this study. However, those those are available revealed large differences between the Ea for
SPI emulsions and solutions. Añón and coworkers (Petruccelli & Añón, 1996; Scilingo &
Añón, 1996) reported Ea values of around 160-200 kJ mol-1 for 7S globulin and between
270-440 kJ mol-1 for 11S globulin, with these values being strongly pH dependent for 11S
globulin. These values were considerably higher than the values found for emulsions
prepared in this study, which were in the range 61-126 kJ mol-1. This values were much
closer to those determined by Ahmed et al., (2006) where Ea was found to vary between
129.8 and 35.5 kJ mol-1 for a 10% and 15% (w/w) solution of SPI respectively, and the
results of Yoshi et al., (1990) where Ea was found to be in the approximate range 40-105 kJ
mol-1 for a range of powders with moisture contents between 0% and 30%. The different
values of Ea obtained in these studies could be partly due to the different methodologies
used to determine them. Alternatively, it may point to the soy proteins in emulsions
prepared in this study have already significantly been denatured when they were adsorbed
at the oil-droplet surface. In addition, the Ea obtained for soy protein denaturation appeared
to be highly dependent on both pH and protein concentration which complicated
comparison of results in this study with other solution studies which tend to be carried out
at or close to neutral pH and at high protein concentrations (typically 10 wt% and above).
For the other parameters determined using equations (2.6)-(2.8) a similar comparison can
be made with results in the literature. The ΔG values for samples in this study were all in
the range 104-115 kJ mol-1 for both WPC and SPI emulsions. This was consistent with
Anema & McKenna’s (1996) results for whey protein. In fact, it is believed that the value
of ΔG may be relatively constant at around 100 kJ mol-1 based on the study by Labuza
(1980) who reported this value for 18 different proteins.
The enthalpy of activation (ΔH) is a measure of the energy enthalpy barrier for the reaction.
It was similar to the activation energy (Table 5.1); I can see that the values of Ea and ΔH
are almost the same. For WPC emulsions prepared in this study, ΔH (153-239 kJ mol) was
slightly lower than that found by Anema & McKenna (1996) (260-290 kJ mol-1) for
temperatures below the change in slope of the Arrhenius plot, and comparable for
temperatures above the change in slope (18-55 kJ mol-1 for emulsions and 30-55 for β-lac
in solution). No data for SPI solutions could be found for comparison. It seems from these
results that when the whey proteins were adsorbed to the oil droplets surface the enthalpy

163
of activation for heat-induced aggregation was reduced, probably because the proteins were
already partially denatured before heating commenced.
Inspection of the relative values for Ea, ΔH and ΔS can tell one something about the
mechanism of the heat destabilization reaction for protein stabilized emulsions. The
mechanisms of protein denaturation and aggregation is believed to occur in two stages
where in the first stage the protein initially denatures, and then in the second stage the
proteins aggregate to form a precipitate or a gel if the concentration is high enough. A
similar mechanism is likely to underpin the heat instability in globular protein stabilized
emulsions. One or other of these reactions will determine the overall rate of the reaction. If
the denaturation step is rate limiting, it is expected that Ea and ΔH will be high and ΔS
positive. The high values of Ea and ΔH are a consequence of the energy that must be put
into the system to overcome the interaction forces holding the protein tertiary structure
together. A positive ΔS indicates that on denaturation the structure of the protein becomes
more disordered. The opposite is true if the aggregation step in the reaction is rate limiting,
i.e. Ea and ΔH will be lower since aggregation occurs, due to the formation of bonds
between the proteins, and the conformational restriction on the protein that occurs when it
is aggregated means it occupies a smaller number of conformations, is more ordered and
gives a negative ΔS. One can see that for WPC emulsions Ea and ΔH were high and ΔS
wass positive at 60 oC (Table 5.1), indicating that denaturation was slow and limits the
heat-induced destabilization of the emulsions. At 70 oC and above, Ea and ΔH were low and
ΔS was negative, which suggested that the denaturation of the protein was fast and the
aggregation step was rate limiting. These results are consistent with those of Anema &
McKenna (1996) who also found that for whey protein heat instability, the denaturation
step is limited at temperatures below the denaturation temperatures of the proteins, and the
aggregation step limiting at temperatures above this.
This result of SPI emulsions showed a behaviour that was characteristic of an aggregation
limited reaction under most of the conditions studied, i.e. a low Ea and ΔH and negative ΔS.
It was only when the SPI concentration reached 3% that one could see an increase in Ea, ΔH
and positive ΔS, suggesting a denaturation limited reaction. These results were unusual,
and suggested that the heterogeneity of protein composition of SPI led to a very complex
thermal behaviour.
164
The mixed SPI/PC emulsions showed an even more complex dependence of
thermodynamic parameters on emulsion composition. As a forementional, 3% WPC
emulsion showed a change denaturation to aggregation when the temperature increased to
70 oC. Low additions of SPI to the emulsions led to a combination of thermodynamic
parameters characteristic of an aggregation limited reaction at all temperatures. However,
as the proportion of SPI:WPC was raised to 3:1 and pure 3% SPI the heat-induced
destabilization became denaturation limited at all temperatures.
5.4.2 The effect of polysaccharides on SPI emulsion heat stability
The effect of polysaccharide on the stability of protein stabilised emulsions is
complex. Many food products contain both polysaccharides and proteins. In particular,
mixtures of proteins and polysaccharides can be found among the ingredients of a wide
range of colloidal food systems such yogurts, mayonnaise and ice cream (Neirynck et al.,
2007b). The effect of polysaccharides on emulsion stability is complex (Dickinson &
Pawlowsky, 1997). Under some circumstances, polysaccharides will increase the stability
of emulsions. This can occur through a simple increase in viscosity, or through specific
interactions between adsorbed proteins and polysaccharide molecules. Under other
conditions, polysaccharides destabilize emulsions by inducing flocculation. This is called
depletion flocculation and is caused by localized imbalances in osmotic pressure in mixed
emulsions/polysaccharides system. As a result, there is an osmotic flow of water from the
region between two droplets out into the bulk aqueous phase. The net result is a shrinking
of aqueous phase volume between the droplets and a net force pulling the droplets together.
If the droplets are closer together at the time of heating, this in itself should be enough to
increase the likelihood of aggregation (Euston et al., 2000). According to Reiffers-Magnani
et al., (2000); Euston et al., (2002) the proteins that were adsorbed at surface of fat globules
were “colloidal proteins” and could be thermodynamically incompatible with
polysaccharides as it was for free proteins.
The results of this part of the study showed that polysaccharides increased stability of SPI
emulsions under most conditions of temperature and protein concentration (Figure 5.9).
This is an unexpected result. Destabilization of SPI emulsions appears to occur mainly via a
coalescence mechanism and addition of polysaccharides to emulsions enhanced the
coalescence of the emulsion droplets, probably by causing depletion flocculation
(Dickinson, 1992; Ye and Singh, 2006). Creaming of SPI emulsions in the presence of

165
polysaccharide, which suggested they were flocculated. For some reason, however, this did
not lead to an increase in the heat instability of the SPI emulsions, as one would expect.
Emulsion in this study, pectin appeared to have a protective effect (Figure 5.9a). Bonnet et
al., (2005), have observed that pectin was able to stabilise casein emulsions against acid
gelation in the presence of glucono-δ-lactone. It is likely that a similar effect occurred in
SPI emulsions in this study and this led to the increase in heat stability. For xanthan gum
(Fig. 5.9b), an initial decrease in k1.5 at low xanthan concentration and then an increase in
k1.5 back up to the value when no xanthan was present (Figure 5.9b), was seen as
polysaccharides concentration was increased to 0.1%. This behaviour was different to what
has been observed in study of Euston et al., (2002), with WPC emulsions, where the
apparent rate constant increased as the concentration of xanthan is increased. This was
attributed to depletion flocculation, a similar behaviour with carrageenan was absorved
(Fig. 9c). This too differed from previous results with WPC stabilised emulsions and
carrageenan where depletion flocculation led to an increasing k as the polysaccharide
concentration was increased (Euston et al., 2002). Carp et al., (1999), have found that
xanthan was capable of altering the composition of the soy protein adsorbed layer in foams
containing SPI and xanthan. More specifically, xanthan appeared to promote the
aggregation of soy protein at the interface, and increased the surface viscosity. It is possible
that a similar effect occurred in SPI emulsions in this study, and it is likely that any
alteration of the composition and stability of the adsorbed protein layer will lead to changes
in the susceptibility to heat instability. In this case, if the adsorbed layer contained more
protein in an aggregated state, which gave a higher surface viscosity this led to increased
resistance to heat induced denaturation and aggregation (Figure 5.9b).
With SPI emulsions it has been found by Molina Ortiza et al., (2004) that in the protein-
polysaccharide complexes were formed in the presence of carrageenan. This had the effect
of causing the proteins to denature at higher temperatures, as evidenced by DSC
thermograms. This might be sufficient to make SPI emulsion more stable to heating when
carrageenan is present.
It appeared that soy proteins behave differently in the presence of polysaccharides than do
whey proteins. These differences in the interactions between polysaccharides and the two
types of proteins led to different susceptibility to heat-induced destabilization.
5.5 Conclusions

166
The taskes of this study study showed in
Task 1 (SPI and WPC emulsions)
(I) study showed that emulsion heat instability was weakly dependent on protein
concentration at temperatures below 100 oC.
(II) Instability increased with increasing temperature.
(IIΙ) The kinetics of the destabilization of SPI emulsions is complex, and shows a linear
Arrhenius plot, unlike the bilinear plots of WPC.
(IV) Addition WPC to SPI emulsions increases their heat stability.
(V) The mixed WPC and SPI emulsions again show a complex behaviour, with linear
Arrhenius behaviour similar to that of SPI emulsions
Task 2 (SPI- polysaccharide emulsions)
The results of this part of the study show that polysaccharides increased stability of
SPI emulsions at low concentrations, with higher additions having less of an effect on heat
stability, but still not decreasing the heat stability. This in contrast to the findings in the
literature for WPC emulsions where polysaccharides decreased heat stability at all levels of
addition. This is explained in terms of the known interactions of various polysaccharides
with soy proteins, and the effect this has on emulsion stability or soy protein denaturation.
167
Chapter six
General Conclusion
6.1 Summary of tasks

168
`The fundamental aim of this study was to evaluate the effect of heat treatment
combined with glycation on functional properties of soy protein.
The underlying approach for improvement of protein functional properties was by heat-
induced, non-enzymatic interaction with various sugars and polysaccharides. To support
this, the effects of parameters such as heating temperature, protein concentration and
various sugars and polysaccharides were investigated. I have tried to improve the functional
properties of two commercial types of soy proteins (1) Soycomil K obtained from ADM,
which is an insoluble kind of soy protein concentrate sold as animal feed, and (2) soy
protein isolate obtained from ADM. I have prepared native SPC and SPI on laboratory
scale to compare the structural modifications of commercial soy proteins. The main
functional properties of proteins tested were solubility, emulsifying ability (oil droplet
size), water holding ability, gelling ability in yoghurt system and heat stability in an acidic
emulsion. In addition, the effect of SPI on the heat stability of whey protein in acidic
emulsions was investigated, the reason being that whey protein is a common ingredient of
acidified dairy emulsions such as yoghurts, where problems due to instability during
pasteurisation are often encountered. This study was conducted by completing three tasks:
6.2 Summary of results
6.2.1 Functional properties of SoyComil K
Physicochemical studies of SoyComil K showed that it had a denaturation degree of
28% and that hydrophobic and disulfide bonds were the main bonds maintaining its
structure. Its low solubility compared to other commercial soy protein concentrate (Arcon
® SJ, manufactured in the USA), and soy isolates appeared to be due to significantly higher
disulfide bond content as shown by SDS-PAGE. It is assumed that this was due to the use
of alcohol (ethanol) in the extraction process during manufacturing (chapter 1 section
1.5.2). Many treatments were applied to SoyComil K to increase its solubility (heat
treatment, change in pH and protein concentration, treatment with enzymes, and addition of
sugars). The study shows:
6.2.1.1 Heat treatment in the absence of sugars

169
The highest increase in solubility was obtained by heat treatment of 6%
SoyComil K, pH9 at 100 °C for 10 min, the solubility increased from 8.42% to 30%, while
at 80°C for 10 min was obtained with 0.1M NaCl (6% SoyComil K) at pH 9, the solubility
increased from 8.42% to 9.6%.
6.2.1.2 Heat treatment in the presence of sugars
The highest increase in solubility was obtained with heat treatment of 6%
protein pH 6.5 with sucrose (1%), at 70°C for30 min. The solubility increased from 2.44%
to 7%. The highest degree of glycation was obtained with glucose and lowest was with
sucrose. Under these heating conditions (70°C for30min) glycation increased the solubility
of Soycomil (chapter 3 sections 3.3.2.4 and 3.3.2.4.1). At high heating temperature (100°C), glycation caused a decrease in solubility probably
due to increased covalent protein cross-linking via Maillaird reaction.
6.2.1.3 Enzymes treatment
The highest increase in solubility (12.82%) was obtained with α-amylase after
heat treatment (6% soyComil K pH 9) at 80°C for 10 min, this could have been due to
removal of a protective layer of insoluble soy polysaccharides which co-purified with the
protein during the manufacturing process (chapter 1 section 1.5.2) rendering it more
susceptible to heat treatment. However mixing with α-amylase for 24 hours followed by
heat treatment at 100°C decreased the solubility (from 30% to 24 % compared to control),
due to increased hydrophobic interactions. Treatment by proteinase K increased solubility
(20.8%) of SoyComil K (6% at pH9) at 80 °C for 1hour. This could be due to the
enzymatic release of smaller polypeptide units. However, treatment by proteinase K
followed by heat treatment at 100°C decreased the solubility (from 30% to 20.4%
compared to control), due to increased hydrophobic interactions.
6.2.1.4 SoyComil K emulsions
SoyComil K treated with glucose resulted in emulsions with the smallest
average droplet size (section 3.3.3), indicating improved emulsifying ability. Since
Soycomil treated with glucose had the highest glycation degree, it can be concluded that
170
increased glycation with glucose correlated with increased emulsifying ability and water
holding capacity.
6.2.1.5 Rheological measurements (emulsion viscosity)
Emulsions of heated SoyComil K solution (SoyComil K emulsions as prepared
in section 2.2.3.1) had under all circumstances a higher viscosity than non-heated
emulsions.
6.3 Soy protein isolate and polysaccharides in model yogurt
An optimal process was developed for the preparation of yoghurt prepared with
SPI with smooth texture and no water separation, comparable to a commercially available
yoghurt prepared with soy milk.
• Soy protein isolates (SPI) used in this study had a denaturation degree 25%.
• Intermolecular bonds of non-heated SPI molecules were mainly electrostatic, whilst in
heat treated SPI, they were mainly hydrophobic bonds and disulfide bonds
• Pectin and amylopectin resulted in the highest degree of glycation of SPI (available
amino group 1.62 µg/ µl and 1.63 µg/ µl respectively), whereas the lowest glycation degree
was obtained with starch (available amino group 1.7 µg/ µl). Were the values of available
amino group for pectin and amylopectin significantly less than starch at Confidence levels
were set at 95% ( n=3, p<0.05). No development of yellow or brown colour was visually
noticeable in any of the samples, therefore it is concluded that these results reflect glycation
in the early stage of Maillard reaction.
• The degree of glycation of SPI was not related to oil droplet size of the emulsions.
The .The largest droplet size was obtained with SPI heated in the presence of locust bean
gum, which had 1.65 µg/ µl available amino groups, while highest glycation was obtained
with starch (available amino group 1.7 µg/ µl), but has droplets size smaller than emulsion
from SPI and locustbean. Were the values of available amino group for locustbean
significantly less than starch at Confidence levels were set at 95% ( n=3, p<0.05).
• Heat treatment of SPI before emulsification, decreased the average droplet size of the
emulsions.
• High-pressure homogenization reduced droplet size of all emulsions.

171
• The presence of glucose/polysaccharides and heat treatment increased droplets of all
emulsion produced from homogenized or non-homogenized SPI dispersions.
• Yogurts produced from SPI and sugars (polysaccharides and glucose) showed that
the microstructures (droplet size) are fairly homogeneous and more condensed compared to
control (yogurt from SPI only).
• Hardness of yoghurts correlated with the glycation degree, where highest hardness
was obtained with pectin.
• Homogenization increased hardness of yogurts.
• The yoghurt with the highest WHC was obtained from homogenized and heated soy
protein isolate combined with glucose and pectin, which was creamy without water
separation. Carrageenan resulted in the lowest water holding capacity, probably due to
enhanced gelation caused by electrolytic interaction with sulphate groups. pectin
significantly has water holding capacity more than carrageenan at Confidence levels were
set at 95% ( n=3, p<0.05)
• In general, glycated SPI gels resulted in higher WHC than non-glycated gels, which
could be due to a higher concentration of high molecular weight polymers taking part in the
gel net work and resulting in better entrapment of water in the glycated SPI gels.
• Because the difference in glycation degree between SPI/pectin and SPI/carrageenan
was relatively small (but statistically significant), it is concluded that complex coaservation
of pectin and SPI contributed to enhanced WHC, whereas thermodynamic incompatibility
of carrageenan and SPI resulted in phase separation, hence reduced WHC.
• The present study show the primary bonds maintaining the gel network yogurt is
hydrophobic bonds, while electrostatic and disulfide bonds were low in maintaining the
yogurt structure. The reason could be that at pH4.5 and in the presence of polysaccharides,
sulfhydryl oxidation is rather limited.
6.4 Destabilization of SPI and WPC emulsions
To increase the shelf life of foods, products can be preserved with heat treatments to
inactivate the spoilage micro-organisms present. When however protein-stabilized
emulsions are subjected to heat treatment, for pasteurization and sterilization purpose, the
proteins tend to aggregate due to protein denaturation. It was shown in the previous section
that the presence of glucose/polysaccharides of heat treated SPI also resulted in increased

172
droplet size of emulsions. In this section I have studied three cases with the aim to
understand the mechanisms of destabilization of SPI emulsions.
6.4.1 Destabilization of SPI and WPC emulsions
The results show:
• Emulsion heat instability was weakly dependent on protein concentration at
temperatures below 100 oC.
• Instability increased with increasing temperature.
• The kinetics of the destabilization of SPI emulsions is complex, and shows a linear
Arrhenius plot, unlike the bilinear plots of WPC.
• Addition WPC to SPI emulsions increases their heat stability.
• The mixed WPC and SPI emulsions again show a complex behaviour, with linear
Arrhenius behaviour similar to that of SPI emulsions
6.4.2 The effect of polysaccharides (pectin, carrageenan and xanthan) on SPI
emulsion heat stability at different temperatures at pH4.5.
The results of this part of the study show that polysaccharides increased stability of
SPI emulsions at low concentrations, with higher additions having less of an effect on heat
stability, but still not decreasing the heat stability. This in contrast to the findings in the
literature for WPC emulsions where polysaccharides decreased heat stability at all levels of
addition. This is explained in terms of the known interactions of various polysaccharides
with soy proteins, and the effect this has on emulsion stability or soy protein denaturation.
6.5 Novel findings

173
In the present study, the following novel findings were made, which have not been
previously reported in the literature:
1) The insolubility of Soycomil was shown to be due to increased disulfide bond content
2) The solubility of Soycomil K was increased by heat treatment at certain protein
concentration and pH and by amylase digestion
3) Emulsifying ability of SoyComil K was improved as shown by increased viscosity and
water binding of emulsions
3) Soy protein, heat treated and glycated in solution with pectin or amylopectin, resulted in
increased hardness and WHC in yoghurts. Most examples in scientific literature relate to
increased functionality of food proteins glycated in the powdered state (at low water
content), which indicates glycation of non-denatured proteins. The results in the presents
study show improved functionality for soy protein, denatured and glycated simultaneously
in solution.
4) A novel non-dairy yoghurt was developed containing SPI, glucose and pectin, matching
the texture of commercially available yoghurt made with soy milk.
5) We have studied for the first time the thermodynamics of heated emulsions Arrhenius
plots for WPC emulsion show atypical bilinear behaviour, whilst for SPI they are linear.
We believe this is due to the cooperative effect of more than one denaturing protein in SPI
emulsions, whilst for WPC emulsions denaturation and aggregation behaviour is dominated
by β-Lactoglobulins. We have shown that the activation energy for heated WPC and SPI
emulsions is lower than for WPC and SPI solutions. This suggests some pre-denaturation of
the protein at the oil-water interface.
6.6 Future work

174
The following studies need to be carried out in the futher:
1. Modification of extraction process of SoyComil K production to give denatured
soluble protein.
2. Investigate heat stability of more complex food emulsions containing more than two
ingredients (protein, polysaccharide and low molecular emulsifier).
3. Use mixed polysaccharides to improve functionality of soy protein isolate in model
yogurt.
References

175
Abd Karim, A., Sulebele, G. A., Azhar, M. E., & Ping, C. Y. (1999). Effect of carrageenan
on yield and properties of tofu. Food Chemistry, 66, 159-165.
Abdel-Aziz, S. A., Esmail, S. A., Hussein, L., & Janssen, F. (1997). Chemical composition
and levels of non-meat proteins in meat brands extended with soy protein concentrate. Food
Chemistry, 60, 389-395.
Abtahi, S., & Aminlari, M. (1997). Effect of sodium sulfite, sodium bisulfite, cysteine, and
pH on protein solubility and sodium dodecyl sulfate-polyacrylamide gel electrophoresis of
soybean milk Base. J. Agricultural and Food Chemistry, 45, 4768-4772.
Achouri, A., Boye, J. I., Yaylayan, V. A., & Yeboah, F. K. (2005). Functional properties of
glycated soy 11S glycinin. Journal of Food Science, 70, C269-C274.
Adachi, M. (2003). Crystal structure of soybean 11 S globulin: Glycinin A 3 B 4
homohexamer. Proceedings of the National Academy of Sciences, 100, 7395-7400.
Adler-Nissen, J. (1976). Enzymic hydrolysis of proteins for increased solubility. Journal of
Agricultural and Food Chemistry, 24, 1090-1093.
Ahmed, J., Ramaswamy, H. S., & Alli, I. (2006). Thermorheological Characteristics of
Soybean Protein Isolate. Journal of Food Science, 71, 158-163.
Al-Hakkak, J., & Kavale, S. (2002). Improvement of emulsification properties of sodium
caseinate by conjugating to pectin through the Maillard reaction. International Congress
Series, 1245, 491-499.
Al-Malah, K. I., Azzam, M. O. J., & Omari, R. M. (2000). Emulsifying properties of BSA
in different vegetable oil emulsions using conductivity technique. Food Hydrocolloids, 14,
485-490.

176
Alibhai, Z., Mondor, M., Moresoli, C., Ippersiel, D., & Lamarche, F. (2006). Production of
soy protein concentrates/isolates: traditional and membrane technologies. Desalination,
191, 351-358.
Alting, A. C. (2003). Gold gelation of globular proteins. vol. PhD (p. 128). Wageningen
universiteit. PhD. Netherlands.
Alting, A. C., de Jongh, H. H. J., Visschers, R. W., & Simons, J. W. F. A. (2002). Physical
and chemical interactions in cold gelation of food proteins. J. Agricultural and Food
Chemistry, 50, 4682-4689.
Aluko, R. E., & Yada, R. Y. (1995). Structure-function relationships of cowpea (Vigna
unguiculata) globulin isolate: influence of pH and NaCl on physicochemical and functional
properties. Food Chemistry, 53, 259-265.
Anema, S. G., & McKenna, A. B. (1996). Reaction kinetics of thermal denaturation of
whey proteins in heated reconstituted whole milk. Journal of Agricultural and Food
Chemistry, 44, 422-428.
Annan, W. S., Fairhead, M., Pereira, P., & Walle, C. F. (2006). Emulsifying performance
of modular {beta}-sandwich proteins: the hydrophobic moment and conformational
stability. Protein Engineering Design and Selection, 1-9.
Añón, M. C., Sorgentini, D. A., & Wagner, J. R. (2001). Relationships between different
hydration properties of commercial and laboratory soybean isolates. J. Agricultural and
Food Chemistry, 49, 4852-4858.
Antipova, A. S., & Semenova, M. G. (1995). Effect of sucrose on the thermodynamic
incompatibility of different biopolymers. Carbohydrate Polymers, 28, 359-365.
AOAC (1985). "Official Methods of analysis" In: 13Edition: Association of Official
Analytical Chemists, Washington, D.C.USA.

177
Arakawa, T., & Timasheff, S. N. (1984). Mechanism of protein salting in and salting out by
divalent cation salts: balance between hydration and salt binding. Biochemistry, 23, 5912-
5923.
Atapattu, C. (1997). Milk protein functionality in caramel processing. PhD
(p.213).University of Guelph. Canada.
Aydinli, M., & Tutas, M. (2000). Water sorption and water vapour permeability properties
of polysaccharide (locustbean gum) based edible films. LWT-Food Science and
Technology, 33, 63-67.
Baeza, R. I., Carp, D. J., Pérez, O. E., & Pilosof, A. M. R. (2002). K-Carrageenan—protein
interactions: effect of proteins on polysaccharide gelling and textural properties. LWT-
Food Science and Technology, 35, 741-747.
Baier, S. K., & McClements, D. J. (2005). Influence of cosolvent systems on the gelation
mechanism of globular protein: thermodynamic, kinetic, and structural aspects of globular
protein gelation. Comprehensive Reviews in Food Science and Food Safety, 4, 43-54.
Barac, M. B., Stanojevic, S. P., Jovanovic, S. T., & Pešic, M. B. (2004). soy protein
modification-areview. Apteff, 35, 3-16.
Berg, J., Tymoczko, J., and Stryer, L (2007). Biochemistry. New York: W.H Freeman and
Company.
Berk, Z. (1992). Technology of production of edible flours and protein products from
soybeans. FAO Agricultural Services Bulletin 97.
Berklemn, T., Brubacher, M., and Chang, H (2004). Important factors influencing protein
solubility for 2-D electrophoresis Bio-Rad Laboratories, inc, Hercules.

178
Bernardi Don, L., Pilosof, A., & Bartholomai, G. (1991). Enzymatic modification of soy
protein concentrates by fungal and bacterial proteases. Journal of the American Oil
Chemists Society, 68, 102-105.
Blaney, S., Zee, J. A., Mongeau, R., & Marin, J. (1996). Combined effects of various types
of dietary fiber and protein on in vitro calcium availability. Journal of Agricultural and
Food Chemistry, 44, 3587-3590.
Bonnet, C., Corredig, M., & Alexander, M. (2005). Stabilization of caseinate-covered oil
droplets during acidification with high methoxyl pectin. Journal of Agricultural and Food
Chemistry, 53(22), 8600-8606.
Boonaert, C. J. P., & Rouxhet, P. G. (2000). Surface of lactic acid bacteria: relationships
between chemical composition and physicochemical properties. Applied and
Environmental Microbiology, 66, 2548.
Boonyaratanakornkit, B. B., Park, C. B., & Clark, D. S. (2002). Pressure effects on intra-
and intermolecular interactions within proteins. Biochimica et Biophysica Acta (BBA) -
Protein Structure and Molecular Enzymology, 1595, 235-249.
Boutin, C., Giroux, H. J., Paquin, P., & Britten, M. (2007). Characterization and acid-
induced gelation of butter oil emulsions produced from heated whey protein dispersions.
International Dairy Journal, 17, 696-703.
Bradford, M. M. (1976). A rapid and sensitive method for the quantitation of microgram
quantities of protein utilizing the principle of protein-dye binding. Anal Biochem, 72, 248-
254.
Braga, A. L. M., Azevedo, A., Julia Marques, M., Menossi, M., & Cunha, R. L. (2006).
Interactions between soy protein isolate and xanthan in heat-induced gels: The effect of salt
addition. Food Hydrocolloids, 20, 1178-1189.

179
Campbell, L., Raikos, V., & Euston, S. R. (2003). Modification of functional properties of
egg-white proteins. Nahrung, 47, 369-376.
Campbell, L., Raikos, V., & Euston, S. R. (2005). Heat stability and emulsifying ability of
whole egg and egg yolk as related to heat treatment. Food Hydrocolloids, 19, 533-539.
Campbell, L. J., Gu, X., Dewar, S. J., & Euston, S. R. (2008). Effects of heat treatment and
glucono-[delta]-lactone-induced acidification on characteristics of soy protein isolate. Food
Hydrocolloids. Doi:10.1016/j.foodhydro.2008.03.004.
Carp, D. J., Bartholomai, G. B., & Pilosof, A. M. R. (1999). Electrophoretic studies for
determining soy proteins–xanthan gum interactions in foams. Colloids and Surfaces B:
Biointerfaces, 12(3-6), 309-316.
Chanasattru, W., Decker, E. A., & Julian McClements, D. (2007). Inhibition of droplet
flocculation in globular-protein stabilized oil-in-water emulsions by polyols. Food
Research International, 40, 1161-1169.
Chanasattru, W., Decker, E. A., & McClements, D. J. (2008). Influence of glycerol and
sorbitol on thermally induced droplet aggregation in oil-in-water emulsions stabilized by
[beta]-lactoglobulin. Food Hydrocolloids. Doi:10.1016/j.foodhy.2008.02.004.
Chevalier, F., Chobert, J.-M., Popineau, Y., Nicolas, M. G., & Haertle, T. (2001).
Improvement of functional properties of [beta]-lactoglobulin glycated through the Maillard
reaction is related to the nature of the sugar. International Dairy Journal, 11, 145-152.
Chove, E., Grandison, B., & Lewis, M. J. (2007). Some functional properties of
fractionated soy protein isolates obtained by microfiltration. Food Hydrocolloids, 21(8),
1379-1388.
Christ, D., Takeuchi, K. P., & Cunha, R. L. (2005). Effect of sucrose addition and heat
treatment on egg albumen protein gelation. Journal of Food Science, 70, 230-238.

180
Comas, D. I., Wagner, J. R., & Tomás, M. C. (2006). Creaming stability of oil in water
(O/W) emulsions: Influence of pH on soybean protein–lecithin interaction. Food
Hydrocolloids, 20, 990-996.
Cramp, G. (2007). Modification and molecular interactions of soy protein isolate. Food
Science, vol. Master of Science (p. 23). North Carolina: North Carolina State University.
USA.
Cruz, N., Capellas, M., Hernández, M., Trujillo, A. J., Guamis, B., & Ferragut, V. (2007).
Ultra high pressure homogenization of soymilk: Microbiological, physicochemical and
microstructural characteristics. Food Research International, 40, 725-732.
Cui, S. W. (2005). Food Carbohydrates: Chemistry, Physical Properties, and Applications.
CRC Press. London, NewYork. 418.
Cui, S. W., Eskin, M. A. N., Wu, Y., & Ding, S. (2006). Synergisms between yellow
mustard mucilage and galactomannans and applications in food products—A mini review.
Advances in Colloid and Interface Science, 128, 249-256.
Curtis, R. A., Montaser, A., Prausnitz, J. M., & Blanch, H. W. (1998). Protein-protein and
protein-salt interactions in aqueous protein solutions containing concentrated electrolytes.
Biotechnology and Bioengineering, 58, 451-451.
Dalgleish, D. G., Senaratne, V., & Francois, S. (1997). Interactions between α-lactalbumin
and β-lactoglobulin in the early stages of heat denaturation. Journal of Agricultural and
Food Chemistry, 45, 3459-3464.
Damianou, K., & Kiosseoglou, V. (2006). Stability of emulsions containing a whey protein
concentrate obtained from milk serum through carboxymethylcellulose complexation. Food
Hydrocolloids, 20, 793-799.
Damodaran, S., & Kinsella, J. E. (1982). Effect of conglycinin on the thermal aggregation
of glycinin. Journal of Agricultural and Food Chemistry, 30, 812-817.
181
Dannenberg, F., & Kessler, H. G. (1988a). Reaction kinetics of the denaturation of whey
proteins in milk. Journal of Food Science, 53, 258-263.
Dannenberg, F., & Kessler, H. G. (1988b). Thermodynamic approach to kinetics of
lactoglobulin denaturation in heated skim milk and sweet. Milchwissenschaft, 43, 139-142.
Davies, C. G. A., Netto, F. M., Glassenap, N., Gallaher, C. M., Labuza, T. P., & Gallaher,
D. D. (1998). Indication of the Maillard reaction during storage of protein isolates. J.
Agricultural and Food Chemistry, 46, 2485-2489.
Denkov, N. D., Tcholakova, S., & Ivanov, I. B. (2006). Globular proteins as emulsion
stabilizers-similarities and differences with surfactants and solid particles. In: 4th World
Congress on Emulsions Lyon, Frence.
Dickinson, E. (1992). Faraday research article. Structure and composition of adsorbed
protein layers and the relationship to emulsion stability. Journal of the Chemical Society,
Faraday Transactions, 88, 2973-2983.
Dickinson, E., & Hong, S. T. (1995). Influence of water-soluble nonionic emulsifier on the
rheology of heat-set protein-stabilized emulsion gels. Journal of Agricultural and Food
Chemistry, 43, 2560-2566.
Dickinson, E., & Matia Merino, L. (2002). Effect of sugars on the rheological properties of
acid caseinate-stabilized emulsion gels. Food Hydrocolloids, 16, 321-331.
Dickinson, E., & Pawlowsky, K. (1997). Effect of i-carrageenan on flocculation, creaming,
and rheology of a protein-stabilized emulsion. J. Agricultural and Food Chemistry, 45,
3799-3806.
Diftis, N., & Kiosseoglou, V. (2006a). Physicochemical properties of dry-heated soy
protein isolate-dextran mixtures. Food Chemistry, 96, 228-233.

182
Diftis, N., & Kiosseoglou, V. (2006b). Stability against heat-induced aggregation of
emulsions prepared with a dry-heated soy protein isolate-dextran mixture. Food
Hydrocolloids, 20, 787-792.
Dill, K. A. (1990). Dominant forces in protein folding. Biochemistry, 29, 7133-7155.
Downs, W., & Sarv, H. (2003). System for simultaneous removal and sequestation of CO2
in a highly energy efficient manner. Patent wo/2003/008087.
Early, R. (1998). The Technology of Dairy Products. Blackie academic and Professional.
London, NewYork and Tokyo. p430.
Elizalde, B. E., Bartholomai, G. B., & Pilosof, A. M. R. (1996). The Effect of pH on the
relationship between hydrophilic/lipophilic characteristics and emulsification properties of
soy proteins. LWT-Food Science and Technology, 29, 334-339.
Ellman, G. L. (1959). Tissue sulfhydryl groups. Arch Biochem Biophys, 82, 70-77.
Endres, J. G. (2001). Soy Protein Products: Characteristics, Nutritional Aspects, and
Utilization. AOCS Press. USA.
Ercelebi, E. A., & Ibanoglu, E. (2007). Influence of hydrocolloids on phase separation and
emulsion properties of whey protein isolate. Journal of Food Engineering, 80, 454-459.
Erdman Jr, J. W., & Fordyce, E. J. (1989). Soy products and the human diet. American
Journal of Clinical Nutrition, 49, 725-737.
Euston, S. R. (2008). Emulsifiers in dairy products and dairy substitutes, in food
emulsifiers and their applications. G.L. Hasenhuettl and R.W. Hartel. NewYork.
Doi:10.1007/978-0-387-75284-6_7I
Euston, S. R., Finnigan, S. R., & Hirst, R. L. (2000). Aggregation kinetics of heated whey
protein-stabilized emulsions. Food Hydrocolloids, 14, 155-161.

183
Euston, S. R., Finnigan, S. R., & Hirst, R. L. (2001). Aggregation kinetics of heated whey
protein-stabilised emulsions: effect of low-molecular weight emulsifiers. Food
Hydrocolloids, 15, 253-262.
Euston, S. R., Finnigan, S. R., & Hirst, R. L. (2002). Kinetics of droplet aggregation in
heated whey protein-stabilized emulsions: effect of polysaccharides. Food Hydrocolloids,
16, 499-505.
Euston, S. R., & Hirst, R. L. (1999). Comparison of the concentration-dependent
emulsifying properties of protein products containing aggregated and non-aggregated milk
protein. International Dairy Journal, 9, 693-701.
Fabian, C. P., Ridd, M. J., & Sheehan, M. E. (2007). Assessment of activated
polyacrylamide and guar as organic additives in copper electrodeposition.
Hydrometallurgy, 86, 44-55.
Ferreira Machado, F., Coimbra, J. S. R., Garcia Rojas, E. E., Minim, L. A., Oliveira, F. C.,
& Sousa, R. d. C. S. (2007). Solubility and density of egg white proteins: Effect of pH and
saline concentration. LWT - Food Science and Technology, 40, 1304-1307.
Floury, J., Desrumaux, A., & Lardières, J. (2000). Effect of high-pressure homogenization
on droplet size distributions and rheological properties of model oil-in-water emulsions.
Innovative Food Science and Emerging Technologies, 1, 127-134.
French, D. (1973). Chemical and physical properties of starch. Journal of Animal Science,
37, 1048-1061.
Frey, H. (2008). Handbook of industrial water soluble polymers.Wiley-Blackwell. Dublin.
Ireland. 344.
Friedman, M. (1996). Food browning and its prevention: an overview. J. Agricultural and
Food Chemistry, 44, 631-653.

184
Ganesh, S. (2006). A novel yogurt product with lactobacillus acidophilus. Animal, Dairy
Poultry Science, vol. Master. (p.50). Louisiana State: Louisiana State University. USA
German, B., Damodaran, S., & Kinsella, J. E. (1982). Thermal dissociation and association
behavior of soy proteins. Journal of Agricultural and Food Chemistry, 30, 807-811.
Gerung, A. (2005). Physical properties of emulsion stabilized by K-casein before and after
treatment with chymosin. Food Science and Technology, vol. Master (p. 116): Texas A and
M University. USA.
Golovanov, A. P., Hautbergue, G. M., Wilson, S. A., & Lian, L. Y. (2004). A simple
method for improving protein solubility and long-term stability. Journal of the American
Oil Chemists Society , 126, 8933-8939.
Gossett, P. W., Rizvi, S. S. H., & Baker, R. C. (1984). Quantitative analysis of gelation in
egg protein systems. Food Technology, 38, 67-96.
Gu, X., Campbell, L. J., & Euston, S. R. (2008). Influence of sugars on the characteristics
of glucono-[delta]-lactone-induced soy protein isolate gels. Food Hydrocolloids.
Doi:10.1016/j.foodhyd.2008.01.005.
Gu, Y. S., Decker, E. A., & McClements, D. J. (2004). Influence of -carrageenan on
droplet flocculation of β-lactoglobulin-stabilized oil-in-water emulsions during thermal
processing. Langmuir, 20, 9565-9570.
Guggisberg, D., Eberhard, P., & Albrecht, B. (2007). Rheological characterization of set
yoghurt produced with additives of native whey proteins. International Dairy Journal, 17,
1353-1359.
Hall, G. M. (1996). Methods of testing protein functionality. Blackie Academic &
Professional. London, NewYork and Tokyo. 265p.

185
Han, J., and Khan, K. (1990). Functional properties of pin-milled and air-classified dry
edible bean fractions. Cereal Chemistry, 67, 390-394.
Handa, A., Takahashi, K., Kuroda, N., & Froning, G. W. (1998). Heat-induced egg white
gels as affected by pH. Journal of Food Science, 63, 403-407.
He, J., Azuma, N., Hagiwara, T., and Kanno, C. (2006). Effect of sugars on the cross-
linking formation and phase separation of hight-pressure induced gel of whey protein from
bovine milk. Bioscience Biotechnology Biochemistry, 70, 615-625.
Hermansson, A. M. (1986). Soy protein gelation. Journal of the American Oil Chemists'
Society, 63, 658-666.
Herrera, M. G., Berli, C. L. A., & Martínez-Padilla, L. P. (2008). Physicochemical and
rheological properties of oil-in-water emulsions prepared with sodium caseinate/gellan gum
mixtures. Food Hydrocolloids, 22, 934-942.
Hua, Y., Cui, S. W., & Wang, Q. (2003). Gelling property of soy protein-gum mixtures.
Food Hydrocolloids, 17, 889-894.
Hua, Y., Cui, S. W., Wang, Q., Mine, Y., & Poysa, V. (2005). Heat induced gelling
properties of soy protein isolates prepared from different defatted soybean flours. Food
Research International, 38, 377-385.
Hua, Y. F., De Ni, P., Gu, W. Y., & Shen, B. Y. (1996). Mechanism of physical
modification of insoluble soy protein concentrate. Journal of the American Oil Chemists'
Society, 73, 1067-1070.
Huang, Y. T., & Kinsella, J. E. (1986). Functional properties of phosphorylated yeast
protein: solubility, water-holding capacity, and viscosity. Journal of Agricultural and Food
Chemistry, 34, 670-674.

186
AFM studies on gelation mechanism of xanthan gum hydrogels. Carbohydrate Polymers,
68, 701-707.
Ikeda, S., & Morris, V. J. (2002). Fine-stranded and particulate aggregates of heat-
denatured whey proteins visualized by atomic force microscopy. Biomacromolecules-
Washington, 3, 382-389.
Jackson, A., & White, J. (2006). Small angle scattering from protein/sugar conjugates.
Physica B: Physics of Condensed Matter, 385, 818-820.
Jenkins, W. T. (1998). Three solutions of the protein solubility problem. Protein Science: A
Publication of the Protein Society, 7, 376.
Jiménez-Castano, L., Villamiel, M., & López-Fandino, R. (2007). Glycosylation of
individual whey proteins by Maillard reaction using dextran of different molecular mass.
Food Hydrocolloids, 21, 433-443.
Jiménez-Castaño, L., Villamiel, M., Martín-Álvarez, P. J., Olano, A., & López-Fandiño, R.
(2005). Effect of the dry-heating conditions on the glycosylation of [beta]-lactoglobulin
with dextran through the Maillard reaction. Food Hydrocolloids, 19, 831-837.
Ju, Z. Y., & Kilara, A. (1998). Textural properties of cold-set gels induced from heat-
denatured whey protein isolates. Journal of Food Science, 63, 288-292.
Julian McClements, D., & Dungan, S. R. (1995). Light scattering study of solubilization of
emulsion droplets by non-ionic surfactant solutions. Colloids and Surfaces A:
Physicochemical and Engineering Aspects, 104(2-3), 127-135.
Jung, S., Murphy, P. A., & Johnson, L. A. (2005). Physicochemical and functional
properties of soy protein substrates modified by low levels of protease hydrolysis. Journal
of Food Science, 70, C180-C187.

187
Kadokura, H., Katzen, F., & Beckwith, J. (2003). Protein disulfide bond formation in
prokaryotes. Annual Reviews in Biochemistry, 72, 111-135.
Kaliszan, R. (1998). Effect of separation conditions on chromatographic determination of
hydrophobicity of acidic xenobiotics. Journal of Chromatography B: Biomedical Sciences
and Applications, 717, 125-134.
Kang, I. J., Matsumura, Y., & Mori, T. (1991). Characterization of texture and mechanical
properties of heat-induced soy protein gels. Journal of the American Oil Chemists' Society,
68, 339-345.
Kashyap, D. R., Vohra, P. K., Chopra, S., & Tewari, R. (2001). Applications of pectinases
in the commercial sector: a review. Bioresource Technology, 77, 215-227.
Kato, A. (2002). Industrial applications of Maillard-type protein-polysaccharide conjugates.
Food Science and Technology Research, 8, 193-199.
Kato, A., & Nakai, S. (1980). Hydrophobicity determined by a fluorescence probe method
and its correlation with surface properties of proteins. Biochim Biophys Acta, 624, 13-20.
Kaya, F., Heitmann, J. A., & Joyce, T. W. (1996). Effect of shear fields on hemicellulase
binding to pulp fibers. Journal of Biotechnology, 45, 23-31.
Ker, Y. C., & Chen, R. H. (1998). Shear-induced conformational changes and gelation of
soy protein isolate suspensions. LWT-Food Science and Technology, 31, 107-113.
Khatib, K. A., Herald, T. J., Aramouni, F. M., MacRitchie, F., & Schapaugh, W. T. (2002).
Characterization and functional properties of soy ß-conglycinin and glycinin of selected
genotypes. Journal of Food Science, 67, 2923-2929.
Kildahl, N. (2008). Intramolecular and intermolecular forces and molecular energy In:
CH1040: The worcester Polytechnic Institute.

188
Kinsella, J. E. (1979). Functional properties of soy proteins. Journal of the American Oil
Chemists' Society, 56, 242-258.
Kiokias, S., Dimakou, C., & Oreopoulou, V. (2007). Effect of heat treatment and droplet
size on the oxidative stability of whey protein emulsions. Food Chemistry, 105, 94-100.
Kneifel, W., Abert, P., and Richard, J (1991). Water-holding capacity of proteins with
special regards to milk proteins and methodological aspect- a review. J. Dairy Science, 74,
2027-2041.
Koksel, H., Masatcioglu, T., Kahraman, K., Ozturk, S., & Basman, A. (2008). Improving
effect of lyophilization on functional properties of resistant starch preparations formed by
acid hydrolysis and heat treatment. Journal of Cereal Science, 47, 275-282.
Kolar, C. W., Cho, I. C., & Watrous, W. L. (1979). Vegetable protein application in yogurt,
coffee creamers and whip toppings. Journal of the American Oil Chemists' Society, 56,
389-391.
Kong, X., Li, X., Wang, H., Hua, Y., & Huang, Y. (2008). Effect of lipoxygenase activity
in defatted soybean flour on the gelling properties of soybean protein isolate. Food
Chemistry, 106, 1093-1099.
Kuen , S. (2004). Effect of temperature and pH on the solubility of soy protein. Chemical
Engineering vol. undergraduate (p. 74). The University of Queensland. Australia
L’hocine, B., Arcand (2006) L. L’hocine, J. Boye and Y. Arcand, Composition and
functional properties of soy protein isolates prepared using alternative defatting and
extraction procedures. Journal of Food Science, 71, 137–145.
Labuza, T. P. (1980). Enthalpy/entropy compensation in food reactions. Food Technology,
34, 67-77.

189
Laemmli, U. K. (1970). Cleavage of structural proteins during the assembly of the head of
bacteriophage T4. Nature, 227, 680-685.
Lakemond, C. M. M., de Jongh, H. H. J., Gruppen, H., & Voragen, A. G. J. (2002).
Differences in denaturation of genetic variants of soy glycinin. J. Agricultural and Food
Chemistry, 50, 4275-4281.
Lakemond, C. M. M., de Jongh, H. H. J., Hessing, M., Gruppen, H., & Voragen, A. G. J.
(2000a). Heat denaturation of soy glycinin: influence of pH and ionic strength on molecular
structure. J. Agricultural and Food Chemistry, 48, 1991-1995.
Lakemond, C. M. M., de Jongh, H. H. J., Hessing, M., Gruppen, H., & Voragen, A. G. J.
(2000b). Soy Glycinin: influence of pH and ionic strength on solubility and molecular
structure at ambient temperatures. J. Agricultural and Food Chemistry, 48, 1985-1990.
Lamprecht, A., Schäfer, U., & Lehr, C. M. (2000a). Structural analysis of microparticles by
confocal laser scanning microscopy. AAPS PharmSciTech, 1(3), 17.
Lamsal, B. P., Jung, S., & Johnson, L. A. (2007). Rheological properties of soy protein
hydrolysates obtained from limited enzymatic hydrolysis. LWT-Food Science and
Technology, 40, 1215-1223.
Leal-Calderon, F., Thivilliers, F., & Schmitt, V. (2007). Structured emulsions. Current
Opinion in Colloid & Interface Science, 12, 206-212.
Lee, K. H., Ryu, H. S., & Rhee, K. C. (2003). Protein solubility characteristics of
commercial soy protein products. Journal of the American Oil Chemists' Society, 80, 85-
90.
Li, J. L., Car, R., Tang, C., & Wingreen, N. S. (2007). From the Cover: Hydrophobic
interaction and hydrogen-bond network for a methane pair in liquid water. Proceedings of
the National Academy of Sciences, 104(8), 2626.
190
Lindhorst, T. (2000). Essentials of carbohydrate chemistry and biochemistry. Wiley-Vch.
New York, Toronto and Singapore. 290p.
Lins, L., & Brasseur, R. (1995). The hydrophobic effect in protein folding. The FASEB
Journal, 9, 535-540.
Liu, C., Wang, H., Cui, Z., He, X., Wang, X., Zeng, X., & Ma, H. (2007). Optimization of
extraction and isolation for 11S and 7S globulins of soybean seed storage protein. Food
Chemistry, 102, 1310-1316.
Liu, H. (2000). Science and engineering of droplets: fundamentals and applications. Noyes
Publications.
Liu, K. (2004). Composition of identity-preserved soybeans. vol. PhD (p. 11). Missouri:
University of Missouri. USA
Loewenstein, M., Speck, S. J., Barnhart, H. M., & Frank, J. F. (1980). Research on goat
milk products: a review. Journal of Dairy Science, 63, 1631.
Lu, Y., & Freeland, S. J. (2008). A quantitative investigation of the chemical space
surrounding amino acid alphabet formation. Journal of Theoretical Biology, 250, 349-361.
Lucey, J. A., Johnson, M. E., & Horne, D. S. (2003). Invited review: perspectives on the
basis of the rheology and texture properties of cheese. Journal of Dairy Science, 86, 2725-
2743.
Malhotra, A., & Coupland, J. N. (2004). The effect of surfactants on the solubility, zeta
potential, and viscosity of soy protein isolates. Food Hydrocolloids, 18, 101-108.
Maltais, A., Remondetto, G. E., Gonzalez, R., & Subirade, M. (2005). Formation of soy
protein isolate cold-set gels: protein and salt effects. Journal of Food Science, 70, 67-73.
Mangino, M. E. (1984). Physicochemical aspects of whey protein functionality. Journal of
Dairy Science, 67, 2711.

191
Marcelo, G., Saiz, E., & Tarazona, M. P. (2005). Unperturbed dimensions of carrageenans
in different salt solutions. Biophysical Chemistry, 113, 201-208.
Martin, A. H., Bos, M. A., & van Vliet, T. (2002). Interfacial rheological properties and
conformational aspects of soy glycinin at the air/water interface. Food Hydrocolloids, 16,
63-71.
Martins, V. B., & Netto, F. M. (2006). Physicochemical and functional properties of soy
protein isolate as a function of water activity and storage. Food Research International, 39,
145-153.
Maruyama, N., Katsube, T., Wada, Y., Oh, M. H., Barba De La Rosa, A. P., Okuda, E.,
Nakagawa, S., & Utsumi, S. (1998). The roles of the N-linked glycans and extension
regions of soybean beta-conglycinin in folding, assembly and structural features. FEBS
Journal, 258, 854-862.
Maruyama, N., Mohamed Salleh, M. R., Takahashi, K., Yagasaki, K., Goto, H., Hontani,
N., Nakagawa, S., & Utsumi, S. (2002). Structure-physicochemical function relationships
of soybean β-conglycinin heterotrimers. J. Agricultural and Food Chemistry, 50, 4323-
4326.
Maruyama, N., Sato, R., Wada, Y., Matsumura, Y., Goto, H., Okuda, E., Nakagawa, S., &
Utsumi, S. (1999). Structure-physicochemical function relationships of soybean Β-
conglycinin constituent subunits. J. Agricultural and Food Chemistry, 47, 5278-5284.
McClements, D. J. (2004). Protein-stabilized emulsions. Current Opinion in Colloid &
Interface Science, 9, 305-313.
McCurdy, S. M. (1990). Effects of processing on the functional properties of
canola/rapeseed protein. Journal of the American Oil Chemists' Society, 67, 281-284.
McKlem, L. K. (2002). Investigation of molecular forces involved in gelation of
commercially prepared soy protein isolates. Food Science, vol. Master (p. 83). North
Carolina State University. North Carolina USA.

192
Mioche, L., & Peyron, M. A. (1995). Bite force displayed during assessment of hardness in
various texture contexts. Arch Oral Biology, 40, 415-423.
Mirsky, A. E., & Pauling, L. (1936). On the Structure of Native, Denatured, and
Coagulated Proteins. Proceedings of the National Academy of Sciences, 22, 439-447.
Mo, X., Zhong, Z., Wang, D., & Sun, X. (2006). Soybean glycinin subunits:
characterization of physicochemical and adhesion properties. J. Agricultural and Food
Chemistry, 54, 7589-7593.
Mohamad Ramlan, B. M. S., Maruyama, N., Takahashi, K., Yagasaki, K., Higasa, T.,
Matsumura, Y., & Utsumi, S. (2004). Gelling properties of soybean ß-conglycinin having
different subunit compositions. Bioscience, Biotechnology, and Biochemistry, 68, 1091-
1096.
Molina, E., Defaye, A. B., & Ledward, D. A. (2002). Soy protein pressure-induced gels.
Food Hydrocolloids, 16, 625-632.
Molina, E., Papadopoulou, A., & Ledward, D. A. (2001). Emulsifying properties of high
pressure treated soy protein isolate and 7S and 11S globulins. Food Hydrocolloids, 15, 263-
269.
Molina Ortiz, S. E., Puppo, M. C., & Wagner, J. R. (2004). Relationship between structural
changes and functional properties of soy protein isolates-carrageenan systems. Food
Hydrocolloids, 18, 1045-1053.
Monahan, F. J., German, J. B., & Kinsella, J. E. (1995). Effect of pH and temperature on
protein unfolding and thiol/disulfide interchange reactions during heat-induced gelation of
whey proteins. Journal of Agricultural and Food Chemistry, 43, 46-52.
Morales, F. J., & van Boekel, M. (1998). A Study on advanced Maillard reaction in heated
casein/sugar solutions: colour formation. International Dairy Journal, 8, 907-915.

193
Morita, T., Oh-hashi, A., Takei, K., Ikai, M., Kasaoka, S., & Kiriyama, S. (1997).
Cholesterol-lowering effects of soybean, potato and rice proteins depend on their low
methionine contents in rats fed a cholesterol-free purified diet. Journal of Nutrition, 127,
470-477.
Mu, M., Pan, X., Yao, P., & Jiang, M. (2006). Acidic solution properties of ß-casein-graft-
dextran copolymer prepared through Maillard reaction. Journal of Colloid and Interface
Science, 301, 98-106.
Mussatto, S. I., Fernandes, M., Milagres, A. M. F., & Roberto, I. C. (2008). Effect of
hemicellulose and lignin on enzymatic hydrolysis of cellulose from brewer's spent grain.
Enzyme and Microbial Technology, 43, 124-129.
Neirynck, N., Lukaszewicz-Lausecker, M., Cocquyt, J., Verbeken, D and Dewettinck, K.
(2007a). Influence of pH and biopolymer ratio on whey protein–pectin interactions in
aqueous solutions and in O/W emulsions. Colloids and Surfaces A. Physicochemical and
Engineering Aspects, 298, 299-107.
Nakai, S. (1983). Structure-function relationships of food proteins: with an emphasis on the
importance of protein hydrophobicity. Journal of Agricultural and Food Chemistry, 31,
676-683.
Nakamura, A., Furuta, H., Maeda, H., Nagamatsu, Y., & Yoshimoto, A. (2001). Analysis
of structural components and molecular construction of soybean soluble polysaccharides by
stepwise enzymatic degradation. Bioscience, Biotechnology, and Biochemistry, 65, 2249-
2258.
Nakamura, A., Yoshida, R., Maeda, H., & Corredig, M. (2006). Soy soluble polysaccharide
stabilization at oil-water interfaces. Food Hydrocolloids, 20, 277-283.

194
Neirynck, N., Van der Meeren, P., Lukaszewicz-Lausecker, M., Cocquyt, J., Verbeken, D.,
& Dewettinck, K. (2007b). Influence of pH and biopolymer ratio on whey protein–pectin
interactions in aqueous solutions and in O/W emulsions. Colloids and Surfaces A:
Physicochemical and Engineering Aspects, 298, 99-107.
Nelson, D. (2008). Lehninger principle of biochemistry. Freeman England. 1104p.
Nielsen, N. C. (1985). The structure and complexity of the 11S polypeptides in soybeans.
Journal of the American Oil Chemists' Society, 62, 1680-1686.
Nunes, M. C., Batista, P., Raymundo, A., Alves, M. M., & Sousa, I. (2003). Vegetable
proteins and milk puddings. Colloids and Surfaces Biointerfaces, 31, 21-29.
Oakenfull, D., Pearce, J., & Burley, R. W. (1997). Protein gelation. Food Proteins and
Their Applications, p111–142.
Olaoye, O. A., Onilude, A. A., & Idowu, O. A. (2006). Quality characteristics of bread
produced from composite flours of wheat, plantain and soybeans. African Journal of
Biotechnology, 5, 1102-1106.
Ollar, R. A. (1999). Method for determining a presence or absence of a nonparaffinophilic
hydrophobic microorganism in a body specimen by using a DNA extraction procedure and
a novel DNA extraction procedure. US Patent 5,981,210.
Opstvedt, J., Miller, R., Hardy, R. W., & Spinelli, J. (1984). Heat-induced changes in
sulfhydryl groups and disulfide bonds in fish protein and their effect on protein and amino
acid digestibility in rainbow trout (Salmo gairdneri). Journal of Agricultural and Food
Chemistry, 32, 929-935.
Oste, R. E., Brandon, D. L., Bates, A. H., & Friedman, M. (1990). Effect of Maillard
browning reactions of the Kunitz soybean trypsin inhibitor on its interaction with
monoclonal antibodies. Journal of Agricultural and Food Chemistry, 38, 258-261.

195
Ou, S., Kwok, K. C., Wang, Y., & Bao, H. (2004). An improved method to determine SH
and -S-S- group content in soymilk protein. Food Chemistry, 88, 317-320.
Pace, C. N., Treviño, S., Prabhakaran, E., & Scholtz, J. M. (2004). Protein structure,
stability and solubility in water and other solvents. Philosophical Transactions: Biological
Sciences, 359, 1225-1235.
Pacek, A. W., Man, C. C., & Nienow, A. W. (1998). On the sauter mean diameter and size
distributions in turbulent liquid/liquid dispersions in a stirred vessel. Chemical Engineering
Science, 53, 2005-2011.
Peamprasart, T., & Chiewchan, N. (2006). Effect of fat content and preheat treatment on
the apparent viscosity of coconut milk after homogenization. Journal of Food Engineering,
77, 653-658.
Peisker, M. (2001). Manufacturing of soy protein concentrate for animal nutrition. Cahiers
Otions mediterraneennes, 54, 103-107.
Pelegrine, D. H. G., & Gasparetto, C. A. (2005). Whey proteins solubility as function of
temperature and pH. LWT-Food Science and Technology, 38(1), 77-80.
Peng, L., Ismail, N., & Easa, A. (2000). Effects of reducing sugars on texture of thermally
processed soy protein isolate-glucono-δ-lactone gels. Journal of Food Science and
Technology(Mysore), 37, 188-190.
Perez-Mateos, M., Solas, T., & Montero, P. (2002). Carrageenans and alginate effects on
properties of combined pressure and temperature in fish mince gels. Food Hydrocolloids,
16, 225-233.
Petruccelli, S., & Añón, M. (1994). Relationship between the method of obtention and the
structural and functional properties of soy protein isolates. 2. Surface properties. Journal of
Agricultural and Food Chemistry, 42, 2170-2176.

196
Petruccelli, S., & Añón, M. (1996). pH-induced modifications in the thermal stability of
soybean protein isolates. Journal of Agricultural and Food Chemistry, 44, 3005-3009.
Pizones Ruız-Henestrosa, V., Carrera Sanchez, C., del Mar Yust Escobar, M., Pedroche
Jimenez, J.J., Millan Rodrıguez, F., Rodrıguez Patino, J. M. (2007). Interfacial and foaming
characteristics of soy globulins as a function of pH and ionic strength. Colloids and
Surfaces A, 309, 202–215
Potter, S. M. (1995). Overview of proposed mechanisms for the hypocholesterolemic effect
of soy. Journal of Nutrition, 125, 606S-611S.
Puppo, M. C., & Anon, M. C. (1998). Structural properties of heat-induced soy protein gels
as affected by ionic strength and pH. J. Agricultural and Food Chemistry, 46, 3583-3089.
Puppo, M. C., Lupano, C. E., & Anon, M. C. (1995). Gelation of soybean protein isolates
in acidic conditions. effect of pH and protein concentration. Journal of Agricultural and
Food Chemistry, 43, 2356-2361.
Puppo, M. C., Sorgentini, D. A., & Añón, M. C. (2003). Rheological properties of
emulsions containing modified soy protein isolates. Journal of the American Oil Chemists'
Society, 80, 605-611.
Raikos, V. (2006). Characterisation of the functional properties of heated egg proteins.
Biology vol. PhD (p. 189). Heriot- Watt University. Edinburgh UK.
Ranadheera, T. (2000). Enhanced gelation of field pea proteins through formation of
multicomponent systems using various polysaccharides. Food Science, vol. Master of
Science (p. 174). University of Manitoba. Manitoba/Canada.
Rangavajhyala, N., Ghorpade, V., & Hanna, M. (1997). Solubility and molecular properties
of heat-cured soy protein films. J. Agricultural and Food Chemistry, 45, 4204-4208.

197
Reiffers-Magnani, C. K., Cuq, J. L., & Watzke, H. J. (2000). Depletion flocculation and
thermodynamic incompatibility in whey protein stabilised O/W emulsions. Food
Hydrocolloids, 14, 521-530.
Renkema, J. M. S. (2001). Formation, structure and rheological properties of soy protein
gels. Ph. D. (p. 137). thesis, Wageningen University, The Netherlands.
Renkema, J. M. S., Gruppen, H., & van Vliet, T. (2002). Influence of pH and ionic strength
on heat-induced formation and rheological properties of soy protein gels in relation to
denaturation and their protein compositions. J. Agricultural and Food Chemistry, 50, 6064-
6071.
Renkema, J. M. S., Knabben, J. H. M., & van Vliet, T. (2001). Gel formation by ß-
conglycinin and glycinin and their mixtures. Food Hydrocolloids, 15, 407-414.
Renkema, J. M. S., Lakemond, C. M. M., de Jongh, H. H. J., Gruppen, H., & van Vliet, T.
(2000). The effect of pH on heat denaturation and gel forming properties of soy proteins.
Journal of Biotechnology, 79, 223-230.
Renkema, J. M. S., & van Vliet, T. (2002). Heat-induced gel formation by soy proteins at
neutral pH. J. Agricultural and Food Chemistry, 50, 1569-1573.
Rich, L. M., & Foegeding, E. A. (2000). Effects of sugars on whey protein isolate gelation.
Journal of Agricultural and Food Chemistry, 48, 5046-5052.
Rickert, D. A., Johnson, L. A., & Murphy, P. A. (2004). Functional properties of improved
glycinin and-conglycinin fractions. J. Food Science, 69, 303-311.
Roesch, R., & Corredig, M. (2003). Texture and microstructure of emulsions prepared with
soy protein concentrate by high-pressure homogenization [J]. Lebensm. Wiss. U.-Technol,
36, 113-124.

198
Roesch, R., & Corredig, M. (2005). Heat-induced soy-whey proteins interactions:
formation of soluble and insoluble protein complexes. J. Agricultural and Food Chemistry,
53, 3476-3482.
Romagnolo, D., Polan, C. E., & Barbeau, W. E. (1990). Degradability of soybean meal
protein fractions as determined by sodium dodecyl sulfate-polyacrylamide gel
electrophoresis. Journal of Dairy Science, 73, 2379-2385.
Roudsari, M., Nakamura, A., Smith, A., & Corredig, M. (2006). Stabilizing behavior of soy
soluble polysaccharide or high methoxyl pectin in soy protein isolate emulsions at low pH.
J. Agricultural and Food Chemistry, 54, 1434-1441.
Rousseau, D. (2000). Fat crystals and emulsion stability―a review. Food Research
International, 33, 3-14.
Roy, A., & Taraphder, S. (2007). Effect of electrostatic interactions on the formation of
proton transfer pathways in human carbonic anhydrase II. Journal of Chemical Sciences,
119, 545-552.
Ruíz-Henestrosa, V. P., Sánchez, C. C., Escobar, M. M. Y., Jiménez, J. J. P., Rodríguez, F.
M., & Patino, J. M. R. (2007). Interfacial and foaming characteristics of soy globulins as a
function of pH and ionic strength. Colloids and Surfaces A: Physicochemical and
Engineering Aspects, 309, 202-215.
Russell, T. A. (2004). Comparison of sensory properties of whey and soy protein
concentrates and isolates. Food Science, vol. Master of Science (p. 132). North Carolina
state University. North Carolina State USA.
Ryan, K. J., & Brewer, M. S. (2005). Purification and identification of interacting
components in a wheat starch–soy protein system. Food Chemistry, 89, 109-124.
199
Sabadini, E., Hubinger, M. D., & Cunha, R. L. (2006). The effects of sucrose on the
mechanical properties of acid milk proteins-kappa-carrageenan gels. Brazilian Journal of
Chemical Engineering, 23, 55-65.
Saeki, H. (1997). Preparation of neoglycoprotein from carp myofibrillar protein by Maillard
reaction with glucose: biochemical properties and emulsifying properties. J. Agricultural
and Food Chemistry, 45, 680-684.
Sajjadi, S. (2006). Effect of mixing protocol on formation of fine emulsions. Chemical
Engineering Science, 61, 3009-3017.
Schubert, H., Engel, R., & Kempa, L. (2006). Principles of structured food emulsions.
IUFost. Doi10.1051/Iufost:20061343.
Scilingo, A. A., & Añón, M. C. (1996). Calorimetric study of soybean protein isolates:
effect of calcium and thermal treatments. Journal of Agricultural and Food Chemistry, 44,
3751-3756.
Segall, K. I., & Goff, H. D. (1999). Influence of adsorbed milk protein type and surface
concentration on the quiescent and shear stability of butteroil emulsions. International
Dairy Journal, 9, 683-691.
Segall, K. I., & Goff, H. D. (2002). Secondary adsorption of milk proteins from the
continuous phase to the oil–water interface in dairy emulsions. International Dairy Journal,
12, 889-897.
Semenova, M. G., Antipova, A. S., & Belyakova, L. E. (2002). Food protein interactions in
sugar solutions. Current Opinion in Colloid & Interface Science, 7, 438-444.
Serguschenko, I., Kolenchenko, E., & Khotimchenko, M. (2007). Low esterified pectin
accelerates removal of lead ions in rats. Nutrition Research, 27, 633-639.
Shi, L., Miller, C., Caldwell, K. D., & Valint, P. (1999). Effects of mucin addition on the
stability of oil–water emulsions. Colloids and Surfaces B: Biointerfaces, 15, 303-312.

200
Shimada, K., and Cheftel (1988). Determination of sulfhydryl groups and disulfide bond in
heat- induced gels of soy protein isolate J. Agricultural and Food Chemistry, 36, 147-153.
Smithers, G. W. (2008). Whey and whey proteins—from ‘gutter-to-gold’. International
Dairy Journal, 18, 695-704.
Song, Y., Babiker, E. E., Usui, M., Saito, A., & Kato, A. (2002). Emulsifying properties
and bactericidal action of chitosan–lysozyme conjugates. Food Research International, 35,
459-466.
Sorgentini, D. A., Wagner, J. R., & Anon, M. C. (1995). Effects of thermal treatment of soy
protein isolate on the characteristics and structure-function relationship of soluble and
insoluble fractions. Journal of Agricultural and Food Chemistry, 43(9), 2471-2479.
Sripad, G., & Rao, M. S. N. (1987). Effect of alkaline PH on sunflower 11S Protein.
Journal of Biosciences, 11, 351-360.
Stauffer, C. E. (2002). Soy protein in baking. Agro Food Ind. Hi-Tech, 13, 30-33.
Suliman, M., Tinay, A., Elkhalifa, A., Babiker, E., and Elkhalil, E. (2006). Solubility as
influenced by pH and NaCl concentration and functional properties of lentil proteins
isolate. Pakistan Journal of Nutrition, 5, 589-593.
Sun, Y., Hayakawa, S., Jiang, H., Ogawa, M., & Izumori, K. (2006). Rheological
characteristics of heat-induced custard pudding gels with high antioxidative activity.
Bioscience, Biotechnology, and Biochemistry, 70, 2859-2867.
Sünder, A., Scherze, I., & Muschiolik, G. (2001). Physico-chemical characteristics of oil-
in-water emulsions based on whey protein–phospholipid mixtures. Colloids and Surfaces
B: Biointerfaces, 21, 75-85.

201
Surh, J., Decker, E. A., & McClements, D. J. (2006). Influence of pH and pectin type on
properties and stability of sodium-caseinate stabilized oil-in-water emulsions. Food
Hydrocolloids, 20, 607-618.
Tamime, A. Y., & Robinson, R. K. (1999). Yoghurt: science and technology. CRC Press.
USA. 600p.
Tanabe, M., & Saeki, H. (2001). Effect of Maillard reaction with glucose and ribose on
solubility at low ionic strength and filament-forming ability of fish myosin. J. Agricultural
and Food Chemistry, 49, 3403-3407.
Tang, C.-H., Chen, Z., Li, L., & Yang, X.-Q. (2006a). Effects of transglutaminase treatment
on the thermal properties of soy protein isolates. Food Research International, 39, 704-711.
Tang, C. H., Wu, H., Chen, Z., & Yang, X. Q. (2006). Formation and properties of
glycinin-rich and ß-conglycinin-rich soy protein isolate gels induced by microbial
transglutaminase. Food Research International, 39, 87-97.
Tay, S. L., Kasapis, S., Perera, C. O., & Barlow, P. J. (2006). Functional and structural
properties of 2S soy protein in relation to other molecular protein fractions. J. Agricultural
and Food Chemistry, 54, 6046-6053.
Tay, S. L., Xu, G. Q., & Perera, C. O. (2005). Aggregation profile of 11S, 7S and 2S
coagulated with GDL. Food Chemistry, 91, 457-462.
Tester, R. F., Karkalas, J., & Qi, X. (2004). Starch—composition, fine structure and
architecture. Journal of Cereal Science, 39, 151-165.
Tester, R. F., & Sommerville, M. D. (2001). Swelling and enzymatic hydrolysis of starch in
low water systems. Journal of Cereal Science, 33, 193-203.
Tsumura, K., Saito, T., Tsuge, K., Ashida, H., Kugimiya, W., & Inouye, K. (2005).
Functional properties of soy protein hydrolysates obtained by selective proteolysis. LWT-
Food Science and Technology, 38, 255-261.

202
Tunick, M. H. (2000). Rheology of dairy foods that gel, stretch, and fracture. Journal of
Dairy Science, 83, 1892-1898.
Unal, B., Metin, S., & Isikli, N. D. (2003). Use of response surface methodology to
describe the combined effect of storage time, locust bean gum and dry matter of milk on the
physical properties of low-fat set yoghurt. International Dairy Journal, 13, 909-916.
Uresti, R. M., López-Arias, N., González-Cabriales, J. J., Ramírez, J. A., & Vázquez, M.
(2003). Use of amidated low methoxyl pectin to produce fish restructured products. Food
Hydrocolloids, 17, 171-176.
Utsumi, S., Damodaran, S., & Kinsella, J. E. (1984). Heat-induced interactions between
soybean proteins: preferential association of 11S basic subunits and. beta. subunits of 7S.
Journal of Agricultural and Food Chemistry, 32, 1406-1412.
Utsumi, S., & Kinsella, J. E. (1985). Structure-function relationships in food proteins:
subunit interactions in heat-induced gelation of 7S, 11S, and soy isolate proteins. Journal of
Agricultural and Food Chemistry, 33, 297-303.
Utsumi, S., Kohno, M., Mori, T., & Kito, M. (1987). An alternate cDNA encoding glycinin
A1aBx subunit. Journal of Agricultural and Food Chemistry, 35, 210-214.
Van de Ven, C., Courvoisier, C., & Matser, A. (2007). High pressure versus heat treatments
for pasteurisation and sterilisation of model emulsions. Innovative Food Science &
Emerging Technologies, 8, 230-236.
Van den Einde, R. M., Bolsius, A., van Soest, J. J. G., Janssen, L. P. B. M., van der Goot,
A. J., & Boom, R. M. (2004). The effect of thermomechanical treatment on starch
breakdown and the consequences for process design. Carbohydrate Polymers, 55, 57-63.
Van der Aar, P. J., Berger, L. L., & Fahey Jr, G. C. (1982). The effect of alcohol treatments
on solubility and in vitro and in situ digestibilities of soybean meal protein. Journal of
Animal Science, 55, 1179-1189.

203
Wagner, J. R., & Gueguen, J. (1999). Surface functional properties of native, acid-treated
and reduced soy glycinin. 2. emulsifying properties. J. Agricultural and Food Chemistry,
47, 2181-2187.
Wagner, J. R., Sorgentini, D. A., & Anon, M. C. (2000). Relation between solubility and
surface hydrophobicity as an indicator of modifications during preparation processes of
commercial and laboratory-prepared soy protein isolates. J. Agricultural and Food
Chemistry, 48, 3159-3165.
Wang, C., & Johnson, L. A. (2001). Functional properties of hydrothermally cooked soy
protein products. Journal of the American Oil Chemists' Society, 78, 189-195.
Wang, H., Johnson, L. A., & Wang, T. (2004). Preparation of soy protein concentrate and
isolate from extruded-expelled soybean meals. Journal of the American Oil Chemists'
Society, 81, 713-717.
Wang, X.-S., Tang, C.-H., Li, B.-S., Yang, X.-Q., Li, L., & Ma, C.-Y. (2008). Effects of
high-pressure treatment on some physicochemical and functional properties of soy protein
isolates. Food Hydrocolloids, 22, 560-567.
Wilcke, H. L., Waggle, D. H., & Kolar, C. K. (1979). Textural contribution of vegetable
protein products. Journal of the American Oil Chemists' Society, 56, 259-261.
Wolf, W. J. (1970). Soybean proteins. Their functional, chemical, and physical properties.
Journal of Agricultural and Food Chemistry, 18, 969-976.
Wolf, W. J., & Nelsen, T. C. (1996). Partial purification and characterization of the 15 S
globulin of soybeans, a dimer of glycinin. J. Agricultural and Food Chemistry, 44, 785-791.
Wong, P. Y. Y., & Kitts, D. D. (2003). A comparison of the buttermilk solids functional
properties to non-fat dried milk, soy protein isolate, dried egg white, and egg yolk powders.
Journal of Dairy Science, 86, 746-754.

204
Wooster, T. J., & Augustin, M. A. (2007). Rheology of whey protein–dextran conjugate
films at the air/water interface. Food Hydrocolloids, 21, 1072-1080.
Xie, Y. R., & Hettiarachchy, N. S. (1997). Xanthan gum effects on solubility and
emulsification properties of soy protein isolate. Journal of Food Science, 62, 1101-1104.
Yamagishi, T., Miyakawa, A., Noda, N., & Yamauchi, F. (1983). Isolation and
electrophoretic analysis of heat-induced products of mixed soybean 7S and 11S globulins.
Agricultural and Biological Chemistry, 47, 1229-1237.
Yamamoto, F., & Cunha, R. L. (2007). Acid gelation of gellan: effect of final pH and heat
treatment conditions. Carbohydrate Polymers, 68, 517-527.
Yazici, F., & Akgun, A. (2004). Effect of some protein based fat replacers on physical,
chemical, textural, and sensory properties of strained yoghurt. Journal of Food Engineering,
62, 245-254.
Ye, A., & Singh, H. (2006). Heat stability of oil-in-water emulsions formed with intact or
hydrolysed whey proteins: influence of polysaccharides. Food Hydrocolloids, 20, 269-276.
Yoshi, H., Furuta, T., Noma, S., & Noda, T. (1990). Kinetic analysis of soy-protein
denaturation by a temperature-programmed heat-denaturation technique. Agricultural and
Biological Chemistry, 54, 863-869.
Zayas, J. F., & Lin, C. S. (1989). Emulsifying properties of corn germ proteins. Cereal
Chemistry, 66, 263-267.
Zheng, H.-G., Yang, X.-Q., Tang, C.-H., Li, L., & Ahmad, I. (2008). Preparation of soluble
soybean protein aggregates (SSPA) from insoluble soybean protein concentrates (SPC) and
its functional properties. Food Research International, 41, 154-164.
Zhong, F., Yang, X., Li, Y., & Shoemaker, C. F. (2006). Papain-induced Gelation of Soy
Glycinin (11S). Journal of Food Science, 71, E232-E237.

205
Zhu, H., & Damodaran, S. (1994). Heat-induced conformational changes in whey protein
isolate and its relation to foaming properties. Journal of Agricultural and Food Chemistry,
42, 846-855.
Zou, Q. I. N., Habermann-Rottinghaus, S. M., & Murphy, K. P. (1998). Urea effects on
protein stability: hydrogen bonding and the hydrophobic effect. Proteins, 31, 107-115.